Article

Black Carbon Evolution at WMO/GAW Station Mt. Waliguan China and Contribution Area from 1994 to 2017

1
Key Laboratory of China Meteorological Administration Atmospheric Sounding, School of Electrical Engineering, Chengdu University of Information Technology, Chengdu 610225, China
2
School of Chemistry and Chemical Engineering, Qinghai Normal University, Xining 810001, China
3
Meteorological Department, Gansu Sub-Bureau of Northwest Air Traffic Mnagement of CAAC, Lanzhou 730030, China
*
Author to whom correspondence should be addressed.
Atmosphere 2022, 13(4), 534; https://doi.org/10.3390/atmos13040534
Submission received: 10 February 2022 / Revised: 14 March 2022 / Accepted: 16 March 2022 / Published: 28 March 2022
(This article belongs to the Special Issue Identification and Optimization of Retrieval Model in Atmosphere)

Abstract

:
Black carbon (BC) aerosol measured at the WMO/GAW Station Mt. Waliguan from 1994 to 2017 has been analyzed. The 24 years long-term results showed that the average annual concentration ranges from 1.9 × 10² ng m−3 to 5.1 × 10² ng m−3 from 2001 to 2012, with a growth rate of 29%. However, the concentration of black carbon decreased from 2012 to 2016, with a decline rate of 64%. The monthly average concentration over the 24 years ranged from 90 ng m−3 to 7.0 × 10² ng m3, with the peak value occurring in April and the lowest value occurring in November. The diurnal variation presented two peak types in different seasons, the first occurred at 20:00 a.m.~23:00 a.m. in the evening, and another around 06:00 a.m.~08:00 a.m. In addition, we found that the transport of black carbon aerosol is closely related to wind transport. The annual maximum black carbon concentration occurred in the east-northeast (ENE) wind direction, with a value of 4.6 × 10² ng m−3, and the second peak value occurred in the E wind direction, with a value of 3.9 × 10² ng m−3. The black carbon concentration of Waliguan was relatively high under the three wind directions of Northeast (NE), ENE, and east (E), which represented the influence of black carbon aerosol generated by human activities located on the east of the station. The 96-h backward trajectory analysis indicated that the sources in the southwest direction made a greater contribution to the black carbon concentration. the pollutants mainly came from the northwest and west sides according to the analysis of potential sources using the CWT approach. The study of black carbon evolution and contribution area is of great significance to further improve the capacity and level of global climate change research and prediction.

1. Introduction

Black carbon is an important component of atmospheric aerosol, which is mainly the amorphous carbon produced by incomplete combustion of carbonaceous materials and nature sources [1,2]. Black carbon has strong absorption of solar radiation in the visible to infrared bands, and it is traditionally referred to as black carbon aerosol. The black carbon aerosol not only has strong absorption of light but also has the potential as a climatic forcing, so it has become an important part of the study on aerosol climatic effects. Black carbon aerosol can lead to positive radiative forcing, and it also change aerosol compounds when coating with other aerosols (e.g., sulfates). Particularly, this effect would be more significant in the Northern Hemisphere region with relatively large surface reflectivity [3]. Zhou et al, found a correlation between black carbon concentration and PM2.5 that the average concentration of BC was 2.4 (±1.8) and 5.5 (±4.0) mg m−3 and occupied 3.1% and 7.8% of the PM2.5 mass in Beijing and Shanghai [4], respectively in 2009. The average hourly mass concentration of BC during winter 2015 was 5.3 ± 6.3 mg m3, observed by a multi-wavelength Aethalometer (AE33), and BC was highly correlated with PM2.5 (R2 = 0.80), with a concentration ranging from 0.2 mg m−3 in the cleaning days to 35 mg m−3 in the misty days. Liu et al., used equivalent black carbon (eBC) instead of BC for data derived from Aethalometer-31 measurement, finding that the average ratio for equivalent BC/PM2.5 ratio is 4.6% [5]. Moreover, Gao et al., used WRF-chem to evaluate the BL suppression leading to more ozone precursors reduction, finding that there is a clear interaction between BC concentration and BC–boundary layer (BL), which could impact surface ozone formation [6]. Ding found that the BC on the top of PBL has significant influence in the vertical mixing, and heating the upper air makes this layer warmer and easy to induce inversions [7]. We have compared more observations at the Qinghai–Tibetan Plateau and the eastern Himalaya [8,9], found the BC is much less in this region.
At present, black carbon concentration observation experiments in multiple regions are being conducted in China, such as the continuous observation of global background stations at city located in Yangtze River Delta (YRD) annual mean BC concentration in Nanjing was found to be 4200 ± 2600 ng m−3, which is a typical proxy of Chinese megacities [10]. Wang et al., used a single particle soot photometer (SP2) and a photoacoustic extinction meter (PAX) and found that the refractory BC average concentration is 160 ± 190 ng m−3, and the number fraction of coated BC was larger amounts than at Qinghai lake [8]. The observation of Xi ‘an [11,12,13,14], Beijing [15], Hebei Xianghe [16] in China, observation and research on the black carbon content of aerosols at different scales in Beijing [17,18], observation and research on black carbon in Wenjiang (Sichuan in China), Xi‘an, Pudong (Shanghai), Pearl River, and Xining, respectively [14,19,20,21,22,23], and relevant research on the transportation of black carbon over the Qinghai–Tibet Plateau and the climatic effect of black carbon [24,25,26]. However, due to the limitation of available measurement equipment, only a few baseline stations in China such as Waliguan Station, Lin‘an Regional Background Station, Shangdianzi, Longfengshan carry out the measurement of black carbon concentration [27]. At the same time, the Qinghai Plateau is more sensitive to the climate effect caused by black carbon due to the characteristics of low vegetation coverage, less precipitation, uneven spatial, and temporal distribution and fragile ecological environment. Waliguan is situated station located on the northeast edge of the Qinghai–Tibetan plateau. Therefore, the analysis and research on black carbon data from the Waliguan global atmospheric baseline watch station has great significance represent the global average concentration.
In terms of the source contribution of black carbon, Dai et al., draw their conclusion through the trajectory analysis. The high potential BC source regions were distributed in Lanzhou, Chengdu, and Xi’an urban agglomerations as well as in northern India. They also used Community Atmosphere Model 5 (CAM5) simulations with a BC-tagging technique, to deduce that central and northern China, northwest China, and the Indian Peninsula are the main BC sources of Waliguan, accounting for 56%, 18%, and 12% of total BC, respectively [28]. Yang et al., used the Community Earth System Model (CESM) with a source-tagging technique, concluding that the concentration of BC in winter in South China is 35% from North China and 19% from overseas. In other parts of China, BC mainly came from the consumption-based black carbon [29]. Meng et al., found that in 2012, about 44% of BC emissions in Chongqing were related to the consumption of goods, while more than 60% of emissions occurred outside the city boundaries in Beijing, Shanghai, and Tianjin. Based on the studies listed above, we conducted a longer, more representative, and more comprehensive study at Mt. Waliguan station.
In this paper, Section 2 discusses the characteristics of black carbon concentration in the Waliguan area. We are studied on the continuous observation data of nearly 24 years at Waliguan global atmospheric baseline watch station. Section 3 analyzes the diurnal, seasonal and annual variation of black carbon concentration in the area. Section 4 shows that the effects of meteorological factors on the distribution of black carbon concentration, and the transport characteristics of black carbon at Waliguan station are discussed.

2. Data Description

2.1. Site Introduction

The Mt. Waliguan Station is located in Qinghai Province, China (36°17′ N, 100°54′ E, 3816 m above sea level.). It is one of the global baseline stations of the WMO/GAW network and the only one in the inland of the Eurasian hinterland [28]. The results of its observation represents the average atmospheric composition background over the Northern Hemisphere at mid-latitude. At present, there are 31 observation projects that including greenhouse gases such as carbon dioxide, ozone, and methane. Moreover, it also includes aerosols, solar radiation, precipitation chemical/acid rain, meteorological gradient observation, and conventional meteorological observation, with more than 60 elements. WLG is represent station at the northeast edge of the Qinghai–Tibetan plateau and is surrounded by highland steppes, tundra, deserts, salt lakes, and the underlying surface is plateau meadow and sandbar. The neighborhood is sparsely populated, so there is less human influence. In conclusion, the Mt. Waliguan Station is an ideal observatory to study the land–air compositional exchange and its environmental and climatic effects in the Northern Hemisphere.

2.2. Data Sources

2.2.1. Ground Observation BC Concentration Data

The ground observations BC data were obtained from January 1994 to December 2017 by instruments at the WMO/GAW Station in the Mt. Waliguan site. The instrument used is Aethalometer AE-10/31/33, which is developed and produced by MAGEE Technology Company in the United States. It is the most widely used online observation instrument for analyzing BC concentration in the atmosphere, it is also a recommended method by WMO, and staffs working at station has been following the GAW standard calibration and maintenance procedures.
The Aethalometer (AE31) has seven monochromatic visible light sources, which irradiate the atmospheric particulate samples collected in the quartz filter band and measure the attenuation of the sample to the light. Then, it calculates the average optical absorption coefficient of aerosol in this period from the increment of optical attenuation per unit time interval. In turn, the BC concentration can be observed.
BC raw data were collected per 5 min and was stored in monthly files. The 880 nm band was used to retrieve the BC concentration due to its strong absorption by BC particles [30]. The original data contained a large amount of suspicious data and discrete point data because BC was sampled in such a pristine environment. The identifying and marking of the suspicious data is the first step of quality control. Then, eliminating the impact of traffic, religious activities and other effects of suspicious data, according to the actual value of the data and the observation of the actual environmental conditions at that time for review, becomes the second step of quality control. Moreover, the zero-check has been launched to make the offset according to the instrument performance. It is important to check the data detected at the zero point of the instrument regularly (once a month) and check whether the value of “zero air” shows obvious errors. Finally, handle the abnormal data and negative values. A relatively complete black carbon aerosol data sequence was obtained through the above five steps of processing.

2.2.2. NCEP/NCAR Reanalysis Global Reanalysis Meteorological Data

The NCEP/NCAR (National Centers for Environmental Prediction/National Center for Atmospheric Research) global reanalysis meteorological data is from the NOAA Physical Sciences Laboratory (PSL). It covers 4 times a day values from 1 January 1948 to the present. This paper used the weekly data from December 1993 to November 2017, which were imported into the HYSPLIT model to acquire the backward trajectories started from Waliguan.

3. Results and Discussion

3.1. The Temporal Variations of Black Carbon Aerosol

3.1.1. The Annual Variation of Black Carbon Aerosol Concentration

The trends of annual average black carbon aerosol concentrations in Mt. Waliguan from 1994 to 2017 are shown in Figure 1 and Figure 2. The average annual concentration of black carbon is 2.9 × 10² ng m−3 in the past 24 years from 1994 to 2017. The overall trend increases from 2001 to 2012 and decreased from 2013 to 2017. Furthermore, the overall trend is inconspicuous from 1994 to 2000 because of some objective factors such as instrument maintenance and site structure maintained. The standard deviation is 4.5 × 10² ng m−3, indicating that the concentration changes in the past 24 years are unstable. In the annual average variation from 2001 to 2012, the concentration of black carbon showed an increasing trend for 12 years, with a growth rate of about 26%. However, from 2012 to 2016, the concentration of black carbon decreased with a decline rate of about 64%, which is closely related to the implementation of China’s emission reduction policy, especially in western China [28]. Among them, the data for 2000, 2010, and 2013 have large deviations due to instrument maintenance and site rebuilding. Few data that could be used in 1999, 2009, and 2015 due to the absence of observation data from the quality control and the problems of observation instruments, respectively.

3.1.2. The Monthly Variation of Black Carbon Aerosol Concentration

As shown in Figure 3, the monthly variation of black carbon concentration in the past 24 years. The black carbon concentration starts to rise in winter (December–February) and reaches its peak (3.5 × 10² ng m−3) in April. The northern area’s coal heating and fossil consumption generated emission causes the rapid increase in black carbon concentration in winter. In spring, the Southern Branch circulation controls the Tibetan plateau and the descending airflow in front of the trough is not conducive to the diffusion of pollutants, resulting in a high concentration of BC [31]. From the middle of spring (April) every year, the concentration of black carbon decreases sharply and continues to decline at a slower rate in summer. In autumn, it declines gradually and reaches the lowest value (1.9 × 10² ng m−3) in November. The decrease in black carbon concentration from April to July is due to the end of the heating season and the diffusion of pollutants caused by wet precipitation and thermal circulation in the summer season [28].

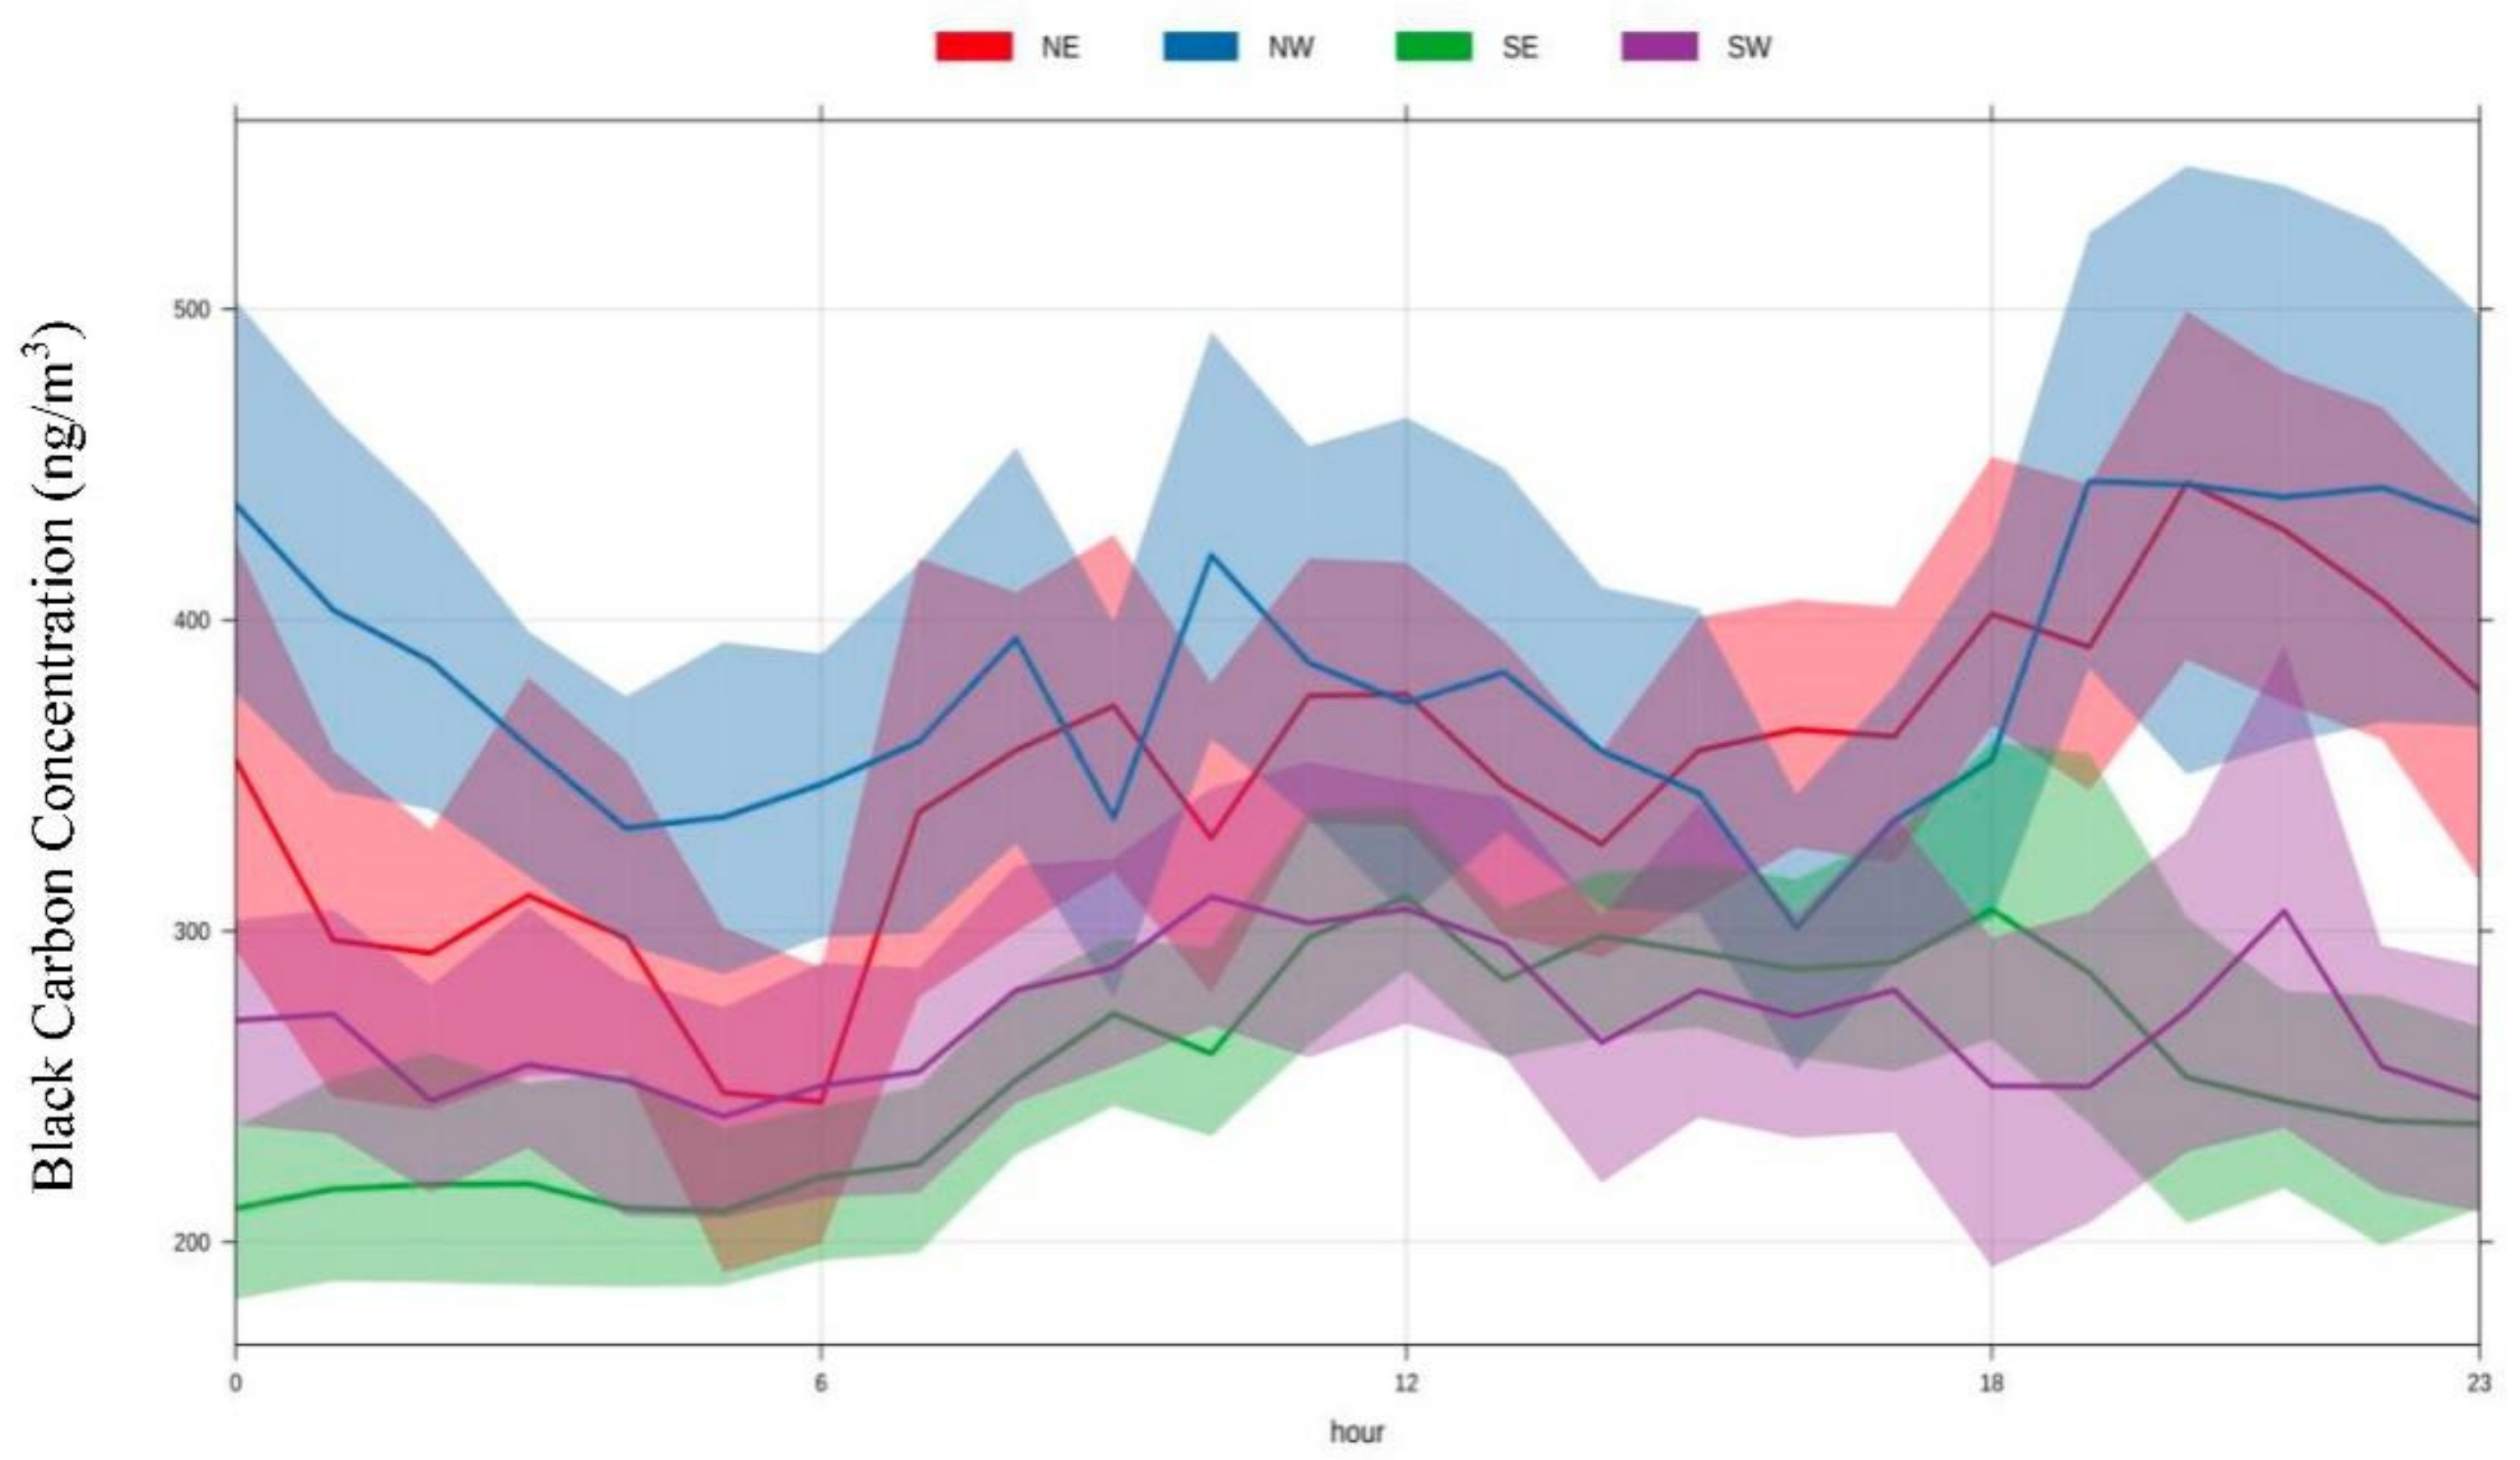
3.1.3. Diurnal Variation of Black Carbon Aerosol Concentration

As shown in Figure 4, it can be observed clearly about the diurnal variations of the average black carbon concentration in the different seasonal variation characteristics. The highest concentration of black carbon is about 3.3 × 10² ng m−3 in spring of every year, with small fluctuation, which is mainly related to the heating activities in winter. In summer and autumn, the diurnal variation characteristics of black carbon concentration were insignificant. The black carbon concentration reached the lowest value around 6:00 every day, and then gradually increased, reaching its peak around 15:00. The possabile explanation for this cycle is the mountain-valley breeze. The radiation is low at night then the mountain wind keeps pollutants spreading, thus reducing the black carbon concentration that reached its lowest value before sunrise. The radiation increased after sunrise, then the valley wind suppressed pollutants spreading and increased the black carbon concentration, which approached the peak in the afternoon.
There are two peaks in terms of the variations in spring and winter, the first peak occurring after sunrise (from 8:00 a.m. to 10:00 a.m. local time) and the second peak occurring before midnight (from 22:00 a.m. to 23:00 a.m. local time). Additionally, the BC concentration reached the lowest value in winter. One possible reason for this minimum is the effect of the cold air from Siberia. In summer and autumn, nevertheless, the BC usually approaches the minimum before sunrise (from 6:00 a.m. to 8:00 a.m. local time), and the second-lowest value appears from 14:00 a.m. to 16:00 a.m. However, the changes varied with each season. The daily variation is slight in winter, with the peak value occurring around 12:00 a.m. to 14:00 a.m., and the lowest value occurring around 0:00 a.m. to 1:00 a.m. When it comes to summer, the daily variation becomes relatively large. The peak value can be seen at about 20:00 a.m., and the lowest one at about 14:00 a.m. The peak value in spring appears at around 22:00 a.m., and the lowest value appears at around 16:00 a.m. The peak value in autumn appears at around 20:00 a.m., and the lowest value appears at around 16:00 a.m.

3.2. Black Carbon Aerosol Transport Characteristics

3.2.1. Relationship between the Black Carbon Concentration and Wind Direction

The relationship between black carbon concentration and wind direction was pronounced. The BC concentration of Waliguan station was relatively high under the three wind directions of NE, ENE, and E, which represented the influence of black carbon aerosol generated by human activities located on the east of the station. The average black carbon concentration from other directions was relatively low, reflecting that other site directions were relatively clean and have few influences on human activities.
The way the black carbon that enters the atmosphere is the emission transport from the ground, we use the horizontal wind evolution of 10 m and the black carbon concentration value of the corresponding time to analyze, obtaining the average value of the black carbon concentration in each wind direction. As shown in Figure 5, a rose diagram of the average black carbon concentration in the Waliguan area is given for winter, spring, summer, autumn, and the year.
In winter, the peak average of black carbon concentration occurred in the ENE wind direction, with a value of 7.1 × 10² ng m−3, and the next peak value occurred in the E wind direction, with a value of 6.6 × 10² ng m−3. In spring, the peak average of black carbon concentration occurred in the ENE wind direction, with a value of 5.2 × 10² ng m−3, and the next peak value occurred in the NE wind direction, with a value of 5.2 × 10² ng m−3. In summer, the peak average of black carbon concentration occurred in the ENE wind direction, with a value of 4.0 × 10² ng m−3, and the next peak value occurred in the wind directions of E and NE, and the values are 3.5 × 10² ng m−3 and 3.5 × 10² ng m−3, respectively. In autumn, the peak average of black carbon concentration occurred in the ENE wind direction, with a value of 3.6 × 10² ng m−3, and the next peak value occurred in the E wind direction, with a value of 3.2 × 10² ng m−3. In winter, the peak annual average of black carbon concentration occurred in the ENE wind direction, with a value of 4.6 × 10² ng m−3, and the next peak value occurred in the E wind direction, with a value of 3.9 × 10² ng m−3.

3.2.2. Relationship between the Black Carbon Concentration and Wind Speed

Figure 6 shows the characteristics of the black carbon concentration average in each wind speed segment under different wind directions of Waliguan. Under the easterly wind dominated by NE, ENE, and E, the high concentration of black carbon aerosols reflected the high level of emissions of human activities in the eastern region of Waliguan Station, which formed a strong transport of black carbon aerosols and increased the wind speed. Under the direction of SW and NNW, the peak value occurred in the wind speed segment of less than 1 m/s and 1–2 m/s, mainly under the influence of emission sources from nearby areas. Under low wind speed, the peak value appeared, and the wind speed increased then decreased. In the other W wind direction, high concentration also appeared with small wind speed, and it was negatively correlated with wind speed, but its value was relatively small.
As shown in Table 1, there is a positive correlation between black carbon concentration and wind speed in the direction of NE, ENE, E, ESE, and SE. In these five directions, the wind speed that corresponds to the peak value of black carbon concentration is larger than any other direction. It was possible that more black carbon came from people living area in the eastern city. The emergence of the E wind component has led to a change in the overall trend, with an increase in the average value and also an increase in the peak and second-peak values. NNE direction is a transitional direction from decrease to increase in black carbon concentration, which indicates that the trend of black carbon concentration has increased significantly. Black carbon aerosol concentration would decrease with the wind speed when speeds were less than 10 m/s. The wind speed is more than 10 m/s when the peak value is 3.4 × 10² ng m−3, and the next peak value occurred in less than 1 m/s wind speed segment, with a value of 3.0 × 10² ng m−3. Black carbon concentration would decrease with the increase in wind speed in the direction of SSE, S, SSW, SW, WSW, W, WNW, NW, NNW, N, and NNE. In these directions, the average concentration value of black carbon is lower than others.

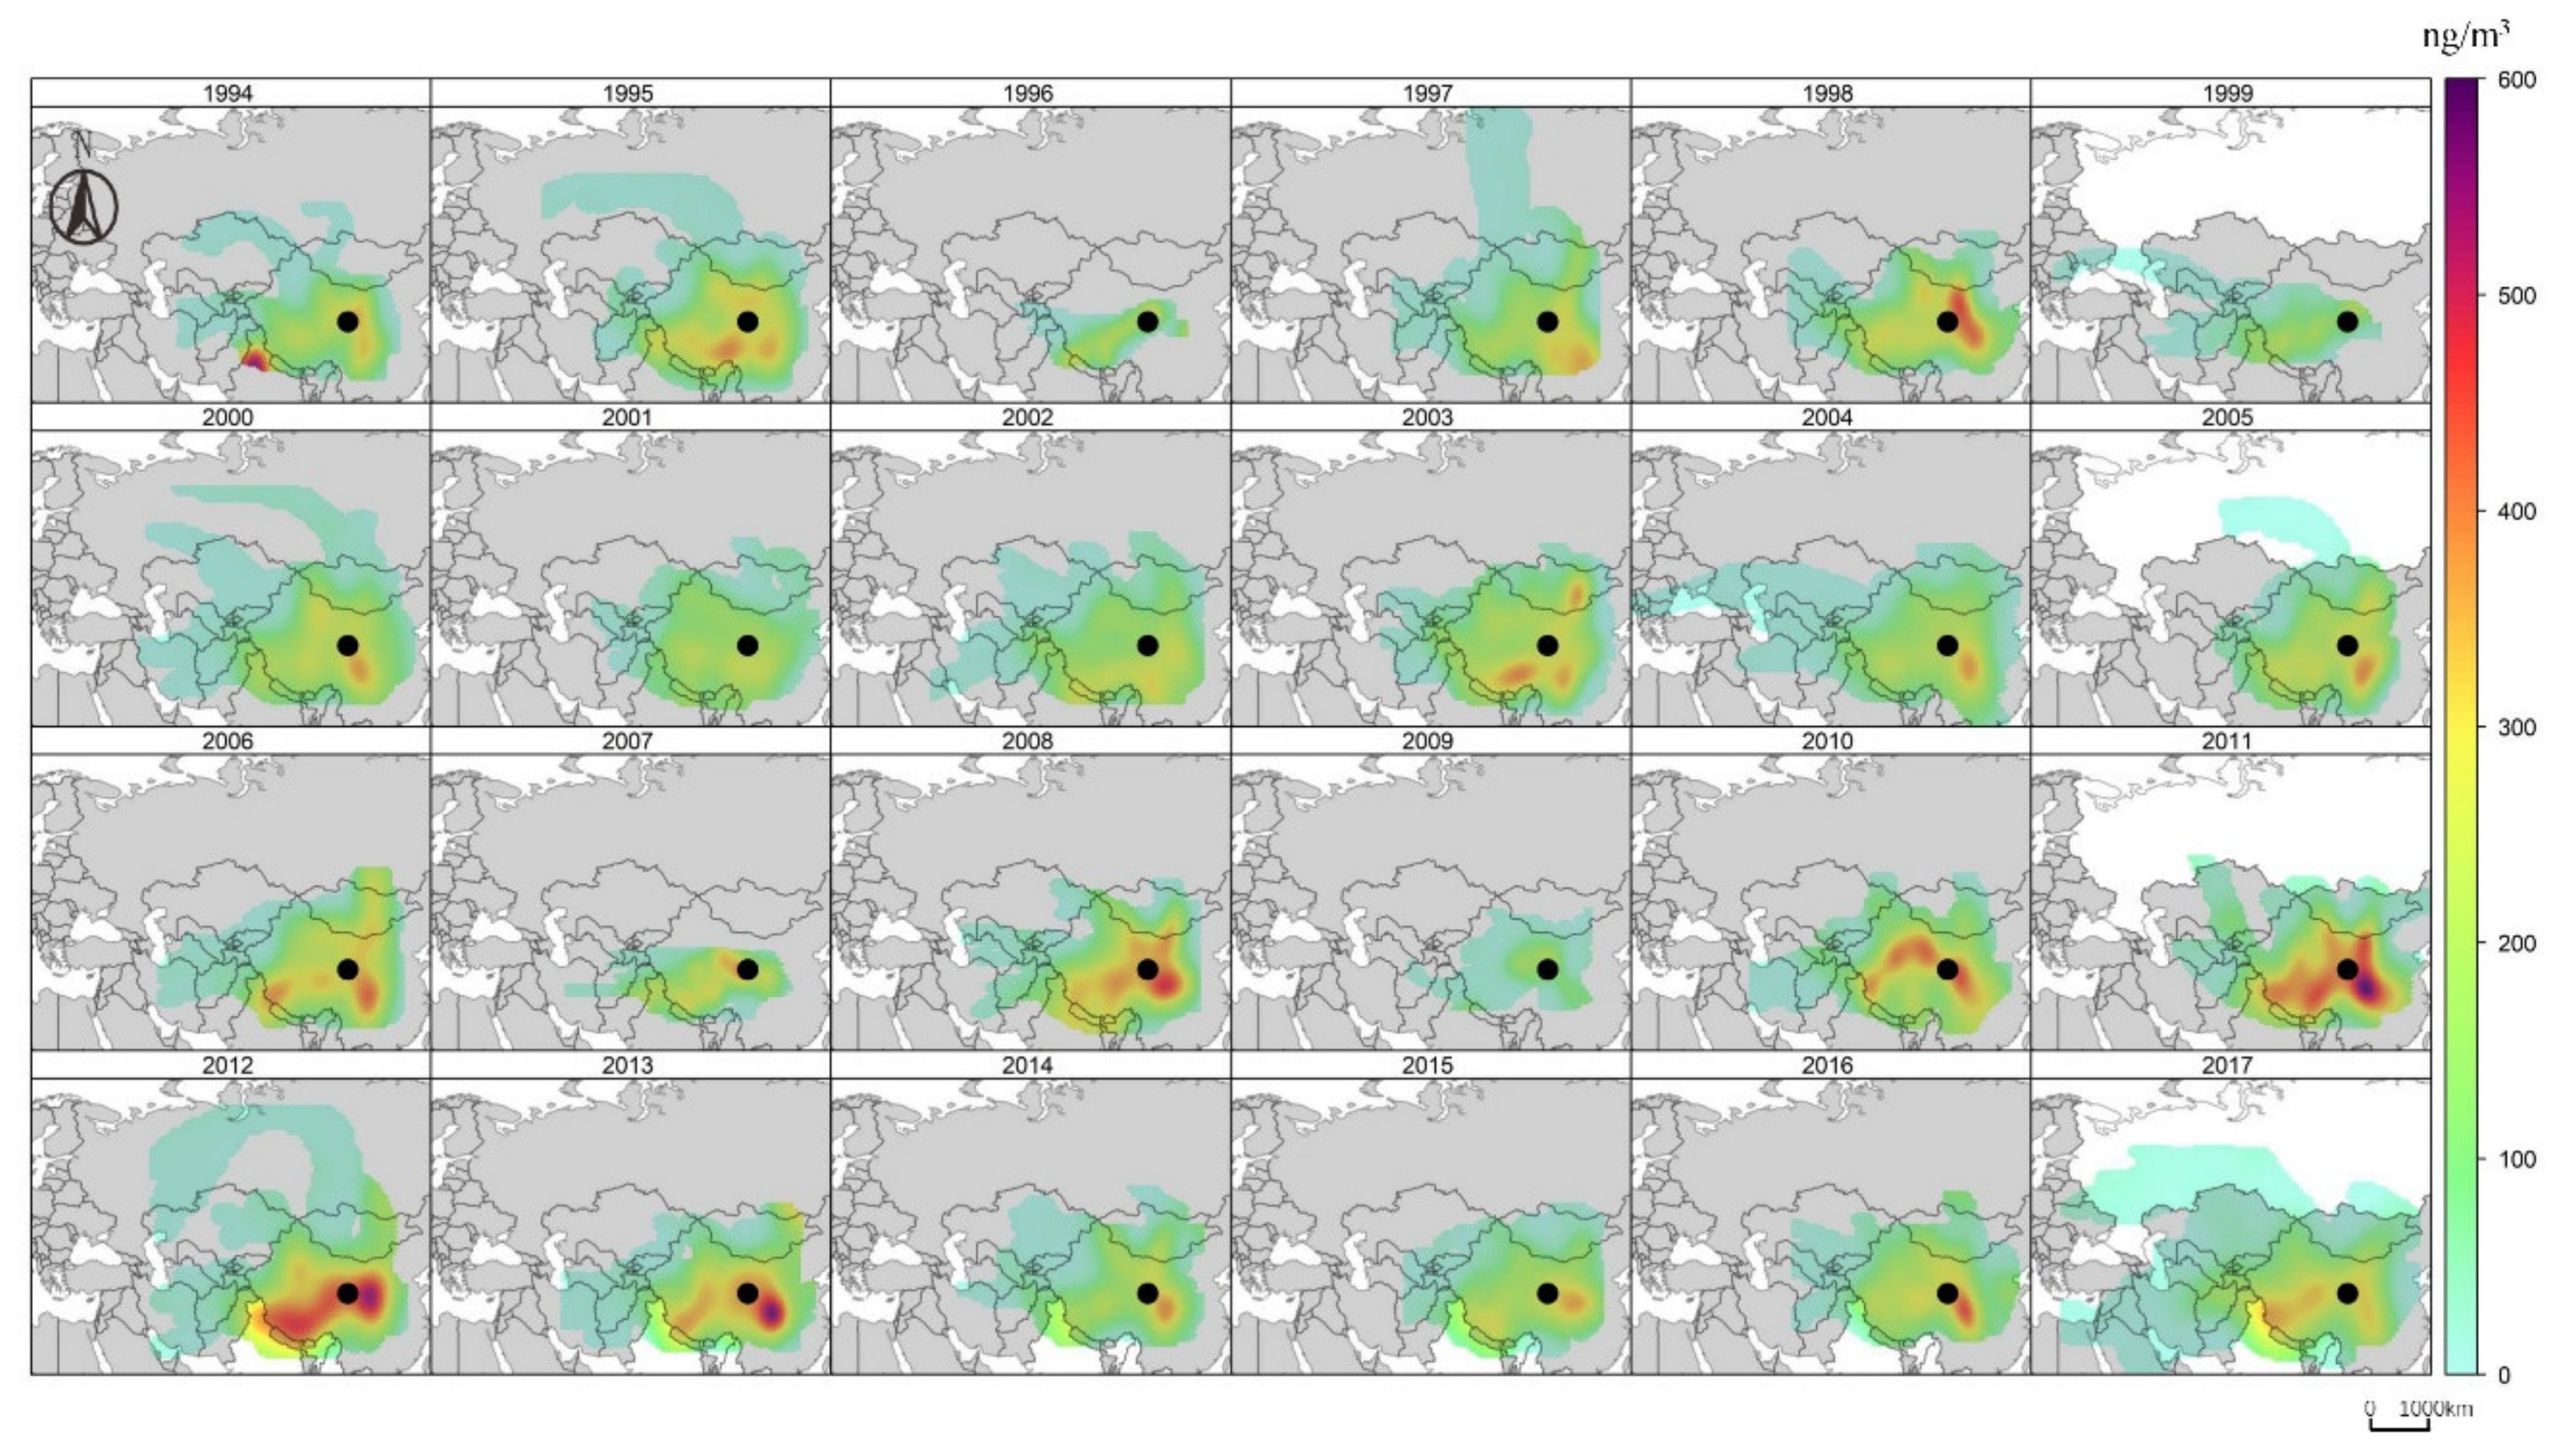
3.3. Backward Trajectory Analysis of the Black Carbon Concentration

We launched 96-h backward trajectory for each year and cluster into 6 clusters from 1994–2017, the western path always occupied a relatively stable proportion among the black carbon source paths in the past 24 years. The western path of black carbon source in these years was about 28–40% except for 1996, 1999, 2004, 2013, and 2014. At the same time, in individual years of 2012–2016, the black carbon sources had changed from west to east suddenly. In addition, from 2003 to 2007 and from 2011 to 2013, the black carbon source paths in the southwest direction accounted for a higher proportion than the other directions. According to the comparison with Figure 7, the observed black carbon concentration in the years with a high proportion of southwest sources was higher than that in previous years, so it was inferred that the sources in the southwest direction made a greater contribution to the black carbon concentration.
According to the analysis of the potential sources from Figure 8, pollutants mainly came from the northwest and west sides. The concentration of pollutants gradually increased from 2003 to 2012, and the scope of pollution expanded from northwest China to western China and North China. The concentration of pollutants gradually decreased from 2012 to 2017, during which severe polluted events only occur in the northwest and in North China. It is mainly related to China’s emission reduction policy. In addition, from 2003 to 2007 and 2010 to 2013, the southwest pollution contributed significantly, which verified the conclusion obtained in Figure 7. In addition, from 1998 to 2012 to 2016, the east contributed more, corresponding to the figure above. The peak annual average black carbon concentration appeared in the ENE wind direction, with the value of 4.6 × 10² ng m−3, and the second peak value appeared in the E wind direction, with the value of 3.9 × 10² ng m−3. The concentrations in NE, ENE, and E wind directions are high, reflecting the effect of black carbon aerosol generated by human activities in the east of the station on the observed values.

4. Summary and Discussion

Long-term black carbon aerosol at WMO/GAW Station Mt. Waliguan from 1994 to 2017 has been investigated. The overall level of black carbon aerosol concentration in Waliguan is 3.5 × 10² ng m−3. The annual average concentration ranged from 1.9 × 10² ng m−3 to 5.1 × 10² ng m−3, showing an increasing trend since 2001. The monthly average concentration ranged from 90 ng m−3 to 7.0 × 10² ng m−3, with the peak value occurring in the winter and spring (from January to April) of each year, and the lowest value in September to October in autumn. The diurnal variation showing the pattern of BC concentration has strong relation with mountain-valley breeze. The transport of black carbon aerosol is closely related to the wind transport evolution. The analysis of 96-h backward trajectory analysis indicates that the western path always occupied a relatively stable proportion over the past 24 years, which was about 28–40% except for 1996, 1999, 2004, 2013–14, and the sources in the southwest direction made a greater contribution to the black carbon concentration. It can be seen that the pollutants mainly derive from the northwest and west sides according to the analysis of potential sources using the CWT approach. The proportion of pollutant sources in different years varies with human activities and national policies.

Author Contributions

H.W. conducted the bulk of the investigation; D.P. drafted the original manuscript; R.M. operated and maintained the instruments used, carried out formal analysis and carried out project administration; F.Z. finished the software and writing—review and editing in the study. All authors have read and agreed to the published version of the manuscript.

Funding

This research was funded by Natural Science Foundation of China (NSFC) research project (Grant No. 42105073), Heavy Rain and Drought-Flood Disasters in Plateau and Basin Key Laboratory of Sichuan Province (Grant No. SZKT202102).

Institutional Review Board Statement

The authors declare that they have no known competing financial interests or personal relationships that could have appeared to influence the work reported in this paper.

Informed Consent Statement

Informed consent was obtained from all subjects involved in the study.

Data Availability Statement

The NCEP/NCAR reanalysis is available from the https://psl.noaa.gov/data/gridded/data.ncep.reanalysis.html (accessed on 9 February 2022). The HYSPLIT model acquired from http://www.arl.noaa.gov/HYSPLIT_info.php (accessed on 9 February 2022).

Conflicts of Interest

The authors declare no conflict of interest.

References

  1. Klimont, Z.; Kupiainen, K.; Heyes, C.; Purohit, P.; Cofala, J.; Rafaj, P.; Borken-Kleefeld, J.; Schöpp, W. Global anthropogenic emissions of particulate matter including black carbon. Atmos. Chem. Phys. 2017, 17, 8681–8723. [Google Scholar] [CrossRef] [Green Version]
  2. Yang, Y.; Wang, H.; Smith, S.J.; Ma, P.-L.; Rasch, P.J. Source attribution of black carbon and its direct radiative forcing in China. Atmos. Chem. Phys. 2017, 17, 4319–4336. [Google Scholar] [CrossRef] [Green Version]
  3. IPCC. Chapter 6: Radiative Forcing of Climate Change. In Climate Change 2001: The Scientific Basis; IPCC: Geneva, Switzerland, 2001; pp. 351–416. [Google Scholar]
  4. Zhou, X.; Gao, J.; Wang, T.; Wu, W.; Wang, W. Measurement of black carbon aerosols near two Chinese megacities and the implications for improving emission inventories. Atmos. Environ. 2009, 43, 3918–3924. [Google Scholar] [CrossRef]
  5. Liu, Q.; Ma, T.; Olson, M.R.; Liu, Y.; Zhang, T.; Wu, Y.; Schauer, J.J. Temporal variations of black carbon during haze and non-haze days in Beijing. Sci. Rep. 2016, 6, 33331. [Google Scholar] [CrossRef] [PubMed]
  6. Gao, J.; Zhu, B.; Xiao, H.; Kang, H.; Pan, C.; Wang, D.; Wang, H. Effects of black carbon and boundary layer interaction on surface ozone in Nanjing, China. Atmos. Chem. Phys. 2018, 18, 7081–7094. [Google Scholar] [CrossRef] [Green Version]
  7. Ding, A.J.; Huang, X.; Nie, W.; Sun, J.N.; Kerminen, V.-M.; Petäjä, T.; Su, H.; Cheng, Y.F.; Yang, X.-Q.; Wang, M.H.; et al. Enhanced haze pollution by black carbon in megacities in China. Geophys. Res. Lett. 2016, 43, 2873–2879. [Google Scholar] [CrossRef]
  8. Wang, Q.Y.; Huang, R.J.; Cao, J.J.; Tie, X.X.; Ni, H.Y.; Zhou, Y.Q.; Han, Y.M.; Hu, T.F.; Zhu, C.S.; Feng, T.; et al. Black carbon aerosol in winter northeastern Qinghai–Tibetan Plateau, China: The source, mixing state and optical property. Atmos. Chem. Phys. 2015, 15, 13059–13069. [Google Scholar] [CrossRef] [Green Version]
  9. Sarkar, C.; Roy, A.; Chatterjee, A.; Ghosh, S.K.; Raha, S. Factors controlling the long-term (2009–2015) trend of PM2.5 and black carbon aerosols at eastern Himalaya, India. Sci. Total Environ. 2019, 656, 280–296. [Google Scholar] [CrossRef]
  10. Zhuang, B.; Wang, T.; Liu, J.; Li, S.; Xie, M.; Yang, X.; Fu, C.; Sun, J.; Yin, C.; Liao, J.; et al. Continuous measurement of black carbon aerosol in urban Nanjing of Yangtze River Delta, China. Atmos. Environ. 2014, 89, 415–424. [Google Scholar] [CrossRef]
  11. Dongjun, Y.; Xiaolan, Y.; Xingsheng, L. Analysis of aerosol characteristics of Linan Air Pollution Base Station. Atmos. Sci. 1995, 19, 119–227. [Google Scholar]
  12. Guo, J.; Chen, X.; Su, T.; Liu, L.; Zheng, Y.; Chen, D.; Li, J.; Xu, H.; Lv, Y.; Zhai, P.; et al. The climatology of lower tropospheric temperature inversions in China from radiosonde measurements: Roles of black carbon, local meteorology, and large-scale subsidence. J. Clim. 2020, 33, 9327–9350. [Google Scholar] [CrossRef]
  13. Yupu, W.; Xiaobin, X.; Jie, T. Characteristics of atmospheric aerosol element enrichment and its source in Valiguan, Qinghai Province. J. Appl. Meteorol. 2001, 12, 400–408. (In Chinese) [Google Scholar]
  14. Lizhong, L.; Yuxiang, W.; Yuan, Y. Characteristics of black carbon aerosol concentration and correlation with meteorological factors and conventional pollutants. Environ. Monit. Environ. Sci. Resour. Util. China 2016, 32, 45–50. (In Chinese) [Google Scholar]
  15. Wang, J.; Liu, D.; Ge, X.; Wu, Y.; Shen, F.; Chen, M.; Zhao, J.; Xie, C.; Wang, Q.; Xu, W.; et al. Characterization of black carbon-containing fine particles in Beijing during wintertime. Atmos. Chem. Phys. 2019, 19, 447–458. [Google Scholar] [CrossRef] [Green Version]
  16. Li, X.; Huaqiang, W.; Zhenlin, C. Black carbon aerosol studies advances in I: Emissions, clearance and concentration. Prog. Earth Sci. 2006, 21, 352–360. (In Chinese) [Google Scholar]
  17. Shujuan, L.; Jietai, M.; Meihua, W. Black carbon content of aerosols in Beijing. Environ. Sci. J. 2005, 25, 17–22. [Google Scholar]
  18. Gengchen, W.; Qinxin, K.; Lixin, R. Black carbon aerosols in the Beijing regional atmosphere and their changing characteristics. J. Process Eng. 2002, 2, 2840–2880. (In Chinese) [Google Scholar]
  19. Shiguang, Q.; Jie, T.; Guangyu, S. Observation of black carbon aerosol concentration in Wenjiang, Sichuan Province. J. Environ. Sci. 2007, 27, 1370–1376. (In Chinese) [Google Scholar]
  20. Yang, L.; Jun, C.; Xiao, Z.; Hui, C. The Variability and Source Apportionment of Black Carbon Aerosol in Xi’an Atmosphere During the Autumn of 2003. Clim. Environ. Res. 2005, 10, 9. (In Chinese) [Google Scholar]
  21. Yang, S.; Wu, Z.; Jingjing, H. Black carbon aerosol characteristics in autumn and winter of Shanghai Pudong New Area. J. Lanzhou Univ. 2008, 44, 66–70. (In Chinese) [Google Scholar]
  22. Wu, D.; Mao, J.; Deng, X.; Tie, X.; Zhang, Y.; Zeng, L.; Deng, T. Black carbon aerosols and their radiative properties in the Pearl River Delta region. Sci. China Ser. D—Earth Sci. 2009, 52, 1152–1163. (In Chinese) [Google Scholar] [CrossRef]
  23. Yucheng, Z.; Deliger; Yongxiang, C. The observation and study of atmospheric black carbon aerosol concentration in Xining area, glacial permafrost. In Proceedings of the 26th Annual Meeting of China Meteorological Society Atmospheric Composition, Weather and Climate, Collection of Field Theory of Environmental Change Branch, Hangzhou, China, 14 October 2009; Volume 30, pp. 789–793. (In Chinese). [Google Scholar]
  24. Zhenming, J. Research progress and prospect of black carbon aerosol exogenous transmission and climate effect simulation on the Qinghai-Tibet Plateau. Environ. Sci. Resour. Util. Prog. Geogr. Sci. 2018, 37, 465–475. (In Chinese) [Google Scholar]
  25. Yue, W.; Jingxian, L.; Bingliang, Z. The spatial and temporal distribution and transmission impact of black carbon in the Qinghai-Tibet Plateau. In Proceedings of the 34th Annual Meeting of China Meteorological Society, 39 Proceedings of Atmospheric Composition and Weather, Climate Change and Environmental Impact, Zhengzhou, China, 27 September 2017. [Google Scholar]
  26. Hua, Z.; Zhili, W. Progress on the climate effect of black carbon aerosol and climate change. Environ. Sci. Resour. Util. J. Clim. Chang. Res. Prog. 2009, 5, 311–317. (In Chinese) [Google Scholar]
  27. Zhang, Y.; Li, Y.; Guo, J.; Wang, Y.; Chen, D.; Chen, H. The climatology and trend of black carbon in China from 12-year ground observations. Clim. Dyn. 2019, 53, 5881–5892. [Google Scholar] [CrossRef]
  28. Dai, M.; Zhu, B.; Fang, C.; Zhou, S.; Lu, W.; Zhao, D.; Ding, D.; Pan, C.; Liao, H. Long-Term Variation and Source Apportionment of Black Carbon at Mt. Waliguan, China. J. Geophys. Res. Atmos. 2021, 126, e2021JD035273. [Google Scholar] [CrossRef]
  29. Meng, J.; Mi, Z.; Yang, H.; Shan, Y.; Guan, D.; Liu, J. The consumption-based black carbon emissions of China’s megacities. J. Clean Prod. 2017, 161, 1275–1282. [Google Scholar] [CrossRef] [Green Version]
  30. Byčenkienė, S.; Ulevicius, V.; Dudoitis, V.; Andriejauskienė, J. Identification and characterization of black carbon aerosol sources in Lithuania. In Proceedings of the 2013 European Aerosol Conference, Prague, Czech Republic, 1–6 September 2013. [Google Scholar]
  31. Wu, H.; Liu, P.; Wang, J.; Wang, N.; Li, B. Observational study of aerosol optical thickness over Waliguan. J. Qinghai Environ. 2017, 27, 39–44. [Google Scholar]
Figure 1. Site location of Mt. Waliguan. located in Waliguan Mountain in Gonghe County, Hainan Tibetan Autonomous Prefecture of Qinghai Province, China.
Atmosphere 13 00534 g001
Figure 2. The annual concentration of black carbon aerosol in Mt. Waliguan from 1994 to 2017.
Atmosphere 13 00534 g002
Figure 3. The 24-year monthly average concentration of black carbon aerosol at Mt. Waliguan.
Atmosphere 13 00534 g003
Figure 4. The daily variation of the average black carbon concentration in Mt. Waliguan over the four seasons.
Atmosphere 13 00534 g004
Figure 5. Wind rose of black carbon concentration for the four seasons and the whole year over 24 years.
Atmosphere 13 00534 g005
Figure 6. Average black carbon concentration relationship with four main wind directions.
Atmosphere 13 00534 g006
Figure 7. The 96-h backward trajectory cluster in 6 from 1994–2017.
Atmosphere 13 00534 g007
Figure 8. The analysis of potential sources using the CWT approach of BC in 1994–2017.
Atmosphere 13 00534 g008
Table 1. The data comparison between wind speed/direction and black carbon concentration.
Wind DirectionContribution of Wind Speed on BC ConcentrationThe Peak Value (× 102 Ng·M−3)The Average Value (× 102 ng·m−3)
The First PeakThe Second Peak
BC ConcentrationThe Wind SpeedBC ConcentrationThe Wind Speed
N2.3<1 m/s1.91–2 m/s1.5
NNE3.4>10 m/s3.0<1 m/s3.2
NE4.78–9 m/s4.7>10 m/s3.7
ENE7.7>10 m/s6.89–10 m/s4.9
E4.65–6 m/s4.5>10 m/s3.7
ESE5.6>10 m/s4.19–10 m/s3.6
SE3.9>10 m/s3.49–10 m/s2.9
SSE3.1<1 m/s2.91–2 m/s2.4
S2.71–2 m/s2.43–4 m/s1.9
SSW2.91–2 m/s2.9<1 m/s1.8
SW3.4<1 m/s2.59–10 m/s1.8
WSW2.31–2 m/s2.0<1 m/s1.5
W2.71–2 m/s2.2<1 m/s1.6
WNW2.5<1 m/s2.21–2 m/s1.4
NW3.0<1 m/s2.61–2 m/s1.8
NNW4.3<1 m/s2.11–2 m/s1.8
Publisher’s Note: MDPI stays neutral with regard to jurisdictional claims in published maps and institutional affiliations.

