Article

Study on the Associations between Meteorological Factors and the Incidence of Pulmonary Tuberculosis in Xinjiang, China

1
College of Public Health, Xinjiang Medical University, Urumqi 830017, China
2
State Key Laboratory of Desert and Oasis Ecology, Xinjiang Institute of Ecology and Geography, Chinese Academy of Sciences, Urumqi 830011, China
3
Shenzhen Institutes of Advanced Technology, Chinese Academy of Sciences, Shenzhen 518000, China
4
Department of Medical Engineering and Technology, Xinjiang Medical University, Urumqi 830017, China
*
Author to whom correspondence should be addressed.
These authors contributed equally to this work.
Atmosphere 2022, 13(4), 533; https://doi.org/10.3390/atmos13040533
Submission received: 24 February 2022 / Revised: 22 March 2022 / Accepted: 24 March 2022 / Published: 28 March 2022
(This article belongs to the Special Issue Advanced Climate Simulation and Observation)

Abstract

:
Pulmonary tuberculosis (PTB) has been a major threat to global public health. The association between meteorological factors and the incidence of PTB has been widely investigated by the generalized additive model, auto-regressive integrated moving average model and the distributed lag model, etc. However, these models could not address a non-linear or lag correlation between them. In this paper, a penalized distributed lag non-linear model, as a generalized and improved one, was applied to explore the influence of meteorological factors (such as air temperature, relative humidity and wind speed) on the PTB incidence in Xinjiang from 2004 to 2019. Moreover, we firstly use a comprehensive index (apparent temperature, AT) to access the impact of multiple meteorological factors on the incidence of PTB. It was found that the relationships between air temperature, relative humidity, wind speed, AT and PTB incidence were nonlinear (showed “wave-type “, “invested U-type”, “U-type” and “wave-type”, respectively). When air temperature at the lowest value (−16.1 °C) could increase the risk of PTB incidence with the highest relative risk (RR = 1.63, 95% CI: 1.21–2.20). An assessment of relative humidity demonstrated an increased risk of PTB incidence between 44.5% and 71.8% with the largest relative risk (RR = 1.49, 95% CI: 1.32–1.67) occurring at 59.2%. Both high and low wind speeds increased the risk of PTB incidence, especially at the lowest wind speed 1.4 m/s (RR = 2.20, 95% CI: 1.95–2.51). In particular, the lag effects of low and high AT on PTB incidence were nonlinear. The lag effects of extreme cold AT (−18.5 °C, 1st percentile) on PTB incidence reached a relative risk peak (RR = 2.18, 95% CI: 2.06–2.31) at lag 1 month. Overall, it was indicated that the environment with low air temperature, suitable relative humidity and wind speed is more conducive to the transmission of PTB, and low AT is associated significantly with increased risk of PTB in Xinjiang.

1. Introduction

As one of the widely distributing and potentially fatal infectious diseases, tuberculosis remains one of the top ten causes of mortality worldwide. According to the Global Tuberculosis Report of the World Health Organization in 2020 [1], there were approximately 9.96 million cases and 1.42 million tuberculosis-related deaths worldwide in 2019, of which about 5.94 million were new PTB cases. China accounted for 8.6% of the world’s new tuberculosis cases in 2019, ranking third among 30 countries with a high burden of tuberculosis. The incidence of PTB in Xinjiang is relatively serious, which has always been one of the highest in China, and the reported incidence of PTB in 2019 is about three times the national level.
PTB is a chronic respiratory disease caused by Mycobacterium tuberculosis (M. tuberculosis). A large number of lipids in M.tb resist the multiplication of lysozymes and damage macrophages. Hence, it can inhibit the intracellular bactericidal mechanism and cause an inflammatory response in the lungs [2]. Susceptible people can be infected through breathing in dust with M.tb and inhaling the droplet nucleus released into the air by actively infectious PTB coughing or sneezing [3]. It is revealed that meteorological factors (such as air temperature, relative humidity and wind speed) may indirectly affect M.tb transmission in the environment [4,5,6,7]. For instance, within a certain range of air temperature and relative humidity, droplets containing M.tb are more likely to be evaporated in the air to form into certain diameters that can be suspended in the air for a longer time (especially, droplets containing M.tb can grow and reproduce at 35~37 °C, and it can survive for 4~5 years in −8~−6 °C), to be easily inhaled into the body by susceptible persons [5]. Moreover, changes in air temperature can also affect the human body’s physiological response to toxic agents and retard the clearance rate of M.tb [6], and activate or inhibit the development of PTB by influencing blood pressure [7]. Suitable humidity can promote the growth and reproduction of M.tb and increase the time for M.tb to float in the air [8]. When M.tb adheres to dust, it is easily affected by the wind speed, i.e., the higher the speed of the wind, the wider spread of M.tb [9].
The annual PTB incidence in Xinjiang is still higher, which may be closely related to its unique geographical location and climatic conditions [10]. Xinjiang, located at the northwest border of China, has a temperate continental climate, with long winters, sparse precipitation, dry climate, frequent wind and sand activities, and frequent snowfall [11]. With an annual average temperature of 11 °C, Xinjiang is one of the regions with a lower annual average temperature in China. The heating period in Xinjiang is from October to March of the next year, and the air pollution is serious in this period. M.tb is so small that normal air currents can keep the pollution particulates containing M.tb airborne and transport them through rooms or some buildings, which may increase the risk of PTB development [3,5,12]. In addition, the snowfall in winter increases the humidity and makes the droplet nucleus ejected by actively infectious PTB stay in the air longer [13], which may create favorable conditions for the transmission of PTB. Therefore, it is of great significance to study the relationship between meteorological factors and the PTB incidence in Xinjiang.
There have been various statistical models to characterize the relationship between meteorological factors and PTB incidence. For instance, a generalized additive model [14] was used to quantitatively evaluate the effects of meteorological factors on the risk of pulmonary tuberculosis in Jiangsu Province. The results illustrated that an environment with low temperature, relatively high wind speed, and low relative humidity is conducive to the transmission of PTB. Li et al. [15] employed an auto-regressive integrated moving average model to exhibit the best predicting performance of PTB incidence by incorporating meteorological factors. However, some results [8,9,15,16] demonstrated there is a non-linear and lag correlation between meteorological factors and the incidence of PTB. The generalized additive model somewhat ignores the collinearity among different lag days [4,17], and the auto-regressive integrated moving average model fails to solve the collinearity problem and ignores the lag effects [12,18]. Fortunately, the distributed lag non-linear model (DLNM) proposed by Armstrong [19] can effectively evaluate the nonlinear and lag relationship between them. For example, Wu et al. [20] investigated the cold and hot effects on mortality at different lags in four subtropical cities. Yang et al. [21] evaluated the association between meteorological factors and the mumps incidence in Guangzhou. Subsequently, a penalized framework DLNM (P-DLNM) was put forward in [22], which introduces a penalized framework to the exposure and lag dimensions in the DLNM, to overcome the complex fitting and the lack of general standards in the selection of basic functions, the number of nodes, the maximum number of lag days and the optimal model in the DLNM. It can control the smoothness of the basis function, and effectively reduce the total number of degrees of freedom to make itself more robust.
Another concerning issue is how the combination of some meteorological factors influenced the incidence of PTB. AT, firstly proposed by Stead-man [23], is a comprehensive index to measure the interaction of air temperature, wind speed and relative humidity, which more objectively represents the actual perception of air temperature. Many research works [15,16,24] evaluated the relationship between meteorological factors and human health by applying AT, such as acute coronary syndromes [15], stroke [16] and acute excessive drinking [24]. However, there are few studies that quantified the impact of meteorological factors and AT on PTB incidence in Xinjiang. Therefore, in this paper, a penalized framework DLNM model is used to analyze the impact of meteorological factors (such as air temperature, wind speed, and relative humidity) on PTB incidence, and AT, is applied to quantify the comprehensive impact of multiple meteorological factors on PTB incidence in Xinjiang from 2004 to 2019, which provides a theoretical basis for the prevention and control of PTB in Xinjiang.

2. Materials and Methods

2.1. Study Area

Xinjiang, located in Northwest China (73°40′–96°18′ E, 34°25′–48°10′ N), has a special topography named as two basins lie in between three mountains, with an average altitude of about 1000 km. From 2004 to 2019, the average annual temperature in Xinjiang was 10.1 °C, the average annual precipitation was 110.0 mm [11], the average annual wind speed was 2.3 m/s, the average annual air pressure was 898 hPa and the average annual relative humidity was 48.3% [25].

2.2. Meteorological and PTB Data

The monthly PTB cases in Xinjiang from 2004 to 2019 were obtained from Public Health Scientific Data Sharing Center (http://www.phsciencedata.cn/, accessed 30 December 2021)and Health Commission of Xinjiang Uygur Autonomous Region (http://wjw.xinjiang.gov.cn/, accessed 8 January 2022).
The monthly average values of meteorological indicators from 2004 to 2019 were derived from 54 stations in Xinjiang (Supplementary Figure S1) from the China Meteorological Data Sharing Center (http://data.cma.cn, accessed 21 November 2021), including average air temperature (°C), average precipitation (mm), average wind speed (m/s), average air pressure (hPa), average relative humidity (%), average sunshine duration (hours/month). AT, is calculated as follows [24]:
A T = T + 0.33 × e 0.70 × W 4.00 ,  
e = R H 100 × 6.105 × e x p ( 17.27 × T 237.7 + T ) ,      
where T represents air temperature (°C); e represents water vapor pressure (hPa); RH is relative humidity (%); and W represents wind speed (m/s).
In this paper, based on percentile range the AT was divided into seven categories for analysis of the associations between low AT, high AT and PTB incidence: extreme cold (≤1st percentile), cold (1st–5th percentiles), mild cold (5th–25th percentiles), comfortable (25th–75th percentiles), mild heat (75th–95th percentiles), heat (95th–99th percentiles) and extreme heat (≥99th percentile), respectively. In addition, the influences of low AT (including extreme cold, cold and mild cold) and high AT (including extreme heat, heat, and mild heat) on PTB incidence were investigated [24].

2.3. Spearman’s Rank Correlation

In order to measure the nonlinear relationship between meteorological variables and PTB incidence, Spearman’s rank correlation analysis was used [26]. The correlation coefficient r s denotes the strength of an association between two variables, which can be calculated as follows [27]:
r s = 1 6 d i 2 n ( n 2 1 )
where n is the count of variables and d is the rank difference between each pair of variables. The heatmap can be used to represent the values of the correlation coefficient between multiple variables. In the heatmap, the darker the color grid, the greater the Spearman’s rank correlation coefficient, and the blank space is usually used to represent two variables without significant correlation.

2.4. Statistical Method

DLNM, proposed by Gasparrini and Armstrong in 2010 [19], is widely used to evaluate the relationship between meteorological factors and health effects, which is a nonlinear model reflecting the exposure-lag-response relationship by selecting basis functions for exposure-response and lag-response and to form a cross-basis function [28].
Define, f ( x t ; β ) = Z t T β as the exposure-response function, where Z t is a matrix with dimensions n × ν x ( n represents the length of the time series, ν x represents the degree of freedom), and β is the shape parameter of Z t T . Define, q x , t = [ x t 0 , , x t , , x t L ] T   is   lagged   effects   of   the   exposure   x t , where 0 and L are the minimum and maximum lags, respectively, i.e., the lag structure can be formulated as [28] = [ 0 , , L ] T . The cross-basis function s ( x t , η ) is constructed by:
s ( x t , η ) = ( 1 L 0 + 1 T A x , t ) η = w x , t T η ,
where w x , t T is a cross-basis matrix transformed from A x , t (with dimensions ν x × ν ), and η is the coefficient of w x , t T . A x , t is computed by a row-wise Kronecker product between the two basis matrices R (with dimensions ( L 0 + 1 ) × ν x ) and C (with dimensions ( L 0 + 1 ) × ν ) that obtained by applying basis transformations to vectors q x , t and , thus A x , t can be expressed as:
A x , t = ( 1 ν T R x , t ) ( C 1 ν x T ) ,  
where 1 ν T is a unit vector with length ν , and denote the Kronecker and Hadamard products, respectively [29].
The distributed lag non-linear model with a penalized framework (P-DLNM) applies varying degrees of penalties in exposure and lag dimensions to smooth the surface of exposure-lag-response, the log-likelihood function l p ( η , γ , λ ) of P-DLNM is:
l p ( η , γ , λ ) = l ( η , γ ) 1 2 η T ( λ x ( S x 1 ν T ) + λ ( 1 ν T S ) ) η ,
where the penalty matrices S x and S are separately obtained by introducing the penalties term to the base matrices R and C , λ x and λ represent the penalty parameters of S x and S , respectively. η is the coefficient for the cross-basis, restricted by S x , S and the penalty parameter λ = [ λ x , λ l ] T . In this paper, the ridge penalty is used to add the penalty term for the lag dimension and control the coefficient of S to shrink towards the zero value at different lag times [29]. The penalties of lag-response dimension are based on cubic regression splines, i.e., CR smoother, which can be expressed as S = P ν , here P ν is a pre-specified diagonal matrix with the weight p .
Based on the generalized additive model and combined the cross-basis functions with penalties, meanwhile, controlled the long-term trend of time and other confounding factors, the association between meteorological factors and PTB incidence was investigated by the following model in this paper:
ln ( λ t ) = α + i = 1 4 s i ( x i , η i ) + n s ( M F , d f ) + n s ( t i m e , d f ) + γ S + ε A R + θ S F + τ P C ,
where λ t is the case number of PTB on month t t h ; α is the intercept; are the cross-basis functions with coefficients η i   ( i = 1 , , 4 ) , x i are meteorological variables (such as air temperature, wind speed, relative humidity and AT); n s ( · ) is a natural cubic spline function, which can be used to control the long-term trends (time with the degree of freedom 10, d f = 10 ) and other meteorological factors (air pressure, precipitation and sunshine duration with the degrees of freedom 3, 3 and 1, respectively). S is a categorical variable with coefficient γ to control for the seasonality (spring: Mar.-May., summer: Jun.-Aug., autumn: Sep.-Nov. and winter: Dec.-Feb.); A R is the autoregressive term with coefficient ε to correct for autocorrelation in the residuals [30]; is a binary variable with coefficient θ to control for the potential influences on delayed medical treatment of PTB patients caused by the Spring Festival [12]; P C is a binary variable with coefficient τ to avoid the impact of PTB transmission caused by immigrants entering Xinjiang to pick cotton from August to October every year.
In this paper, taking the median of air temperature, wind speed, relative humidity and AT as references, four cross-basis functions (defined by an exposure-response relationship with four equally spaced intervals knots and a lag-response relationship with four equal space log-knots) were built to more flexibly reflect the 3-D relationship between meteorological factors and the incidence of PTB in Xinjiang.

2.5. Parameter Estimation

To quantify the risk between meteorological factors and PTB incidence, the relative risks ( R R ) of specific exposure and lag time were used [22]. The values of R R and standard error ( S E ) of specific exposure level x p are as follows:
R R x p = e x p ( β ^ x p ) = e x p ( A x p η ^ )
S E x p = e x p ( V ( β ^ x p ) ) = e x p ( A x p V ( η ^ ) A x p T )
where A x p denotes the cross-basis matrix with x = x p ; V ( · ) denotes the variance of a random variable. Similarly, the lag-specific risk R R p and S E p can be estimated. In addition, the overall cumulative effect ( R R c ) of such exposure history, with associated S E c could be computed with:
R R c = e x p ( β ^ c ) = e x p ( W p η ^ ) ,
S E c = e x p ( V ( β ^ c ) ) = e x p ( W p V ( η ^ ) W p T )
where W p denotes the cross-basis matrix.

2.6. Sensitivity Analysis

To assess the robustness of the model, a sensitivity analysis was conducted to examine the influence of d f of parameters and maximum lag time on the overall cumulative effect of AT. In this paper, d f of time in the model was varied from 10, 11 to 12, respectively. The d f of air pressure and precipitation in the model were changed between 3 and 5, respectively. The d f of sunshine duration was altered between 1 and 3, respectively. The maximum lag time of AT was also set to 8, 10 and 12, respectively.
All statistical analyses were performed by carrying out R software version 4.0.5.

3. Results

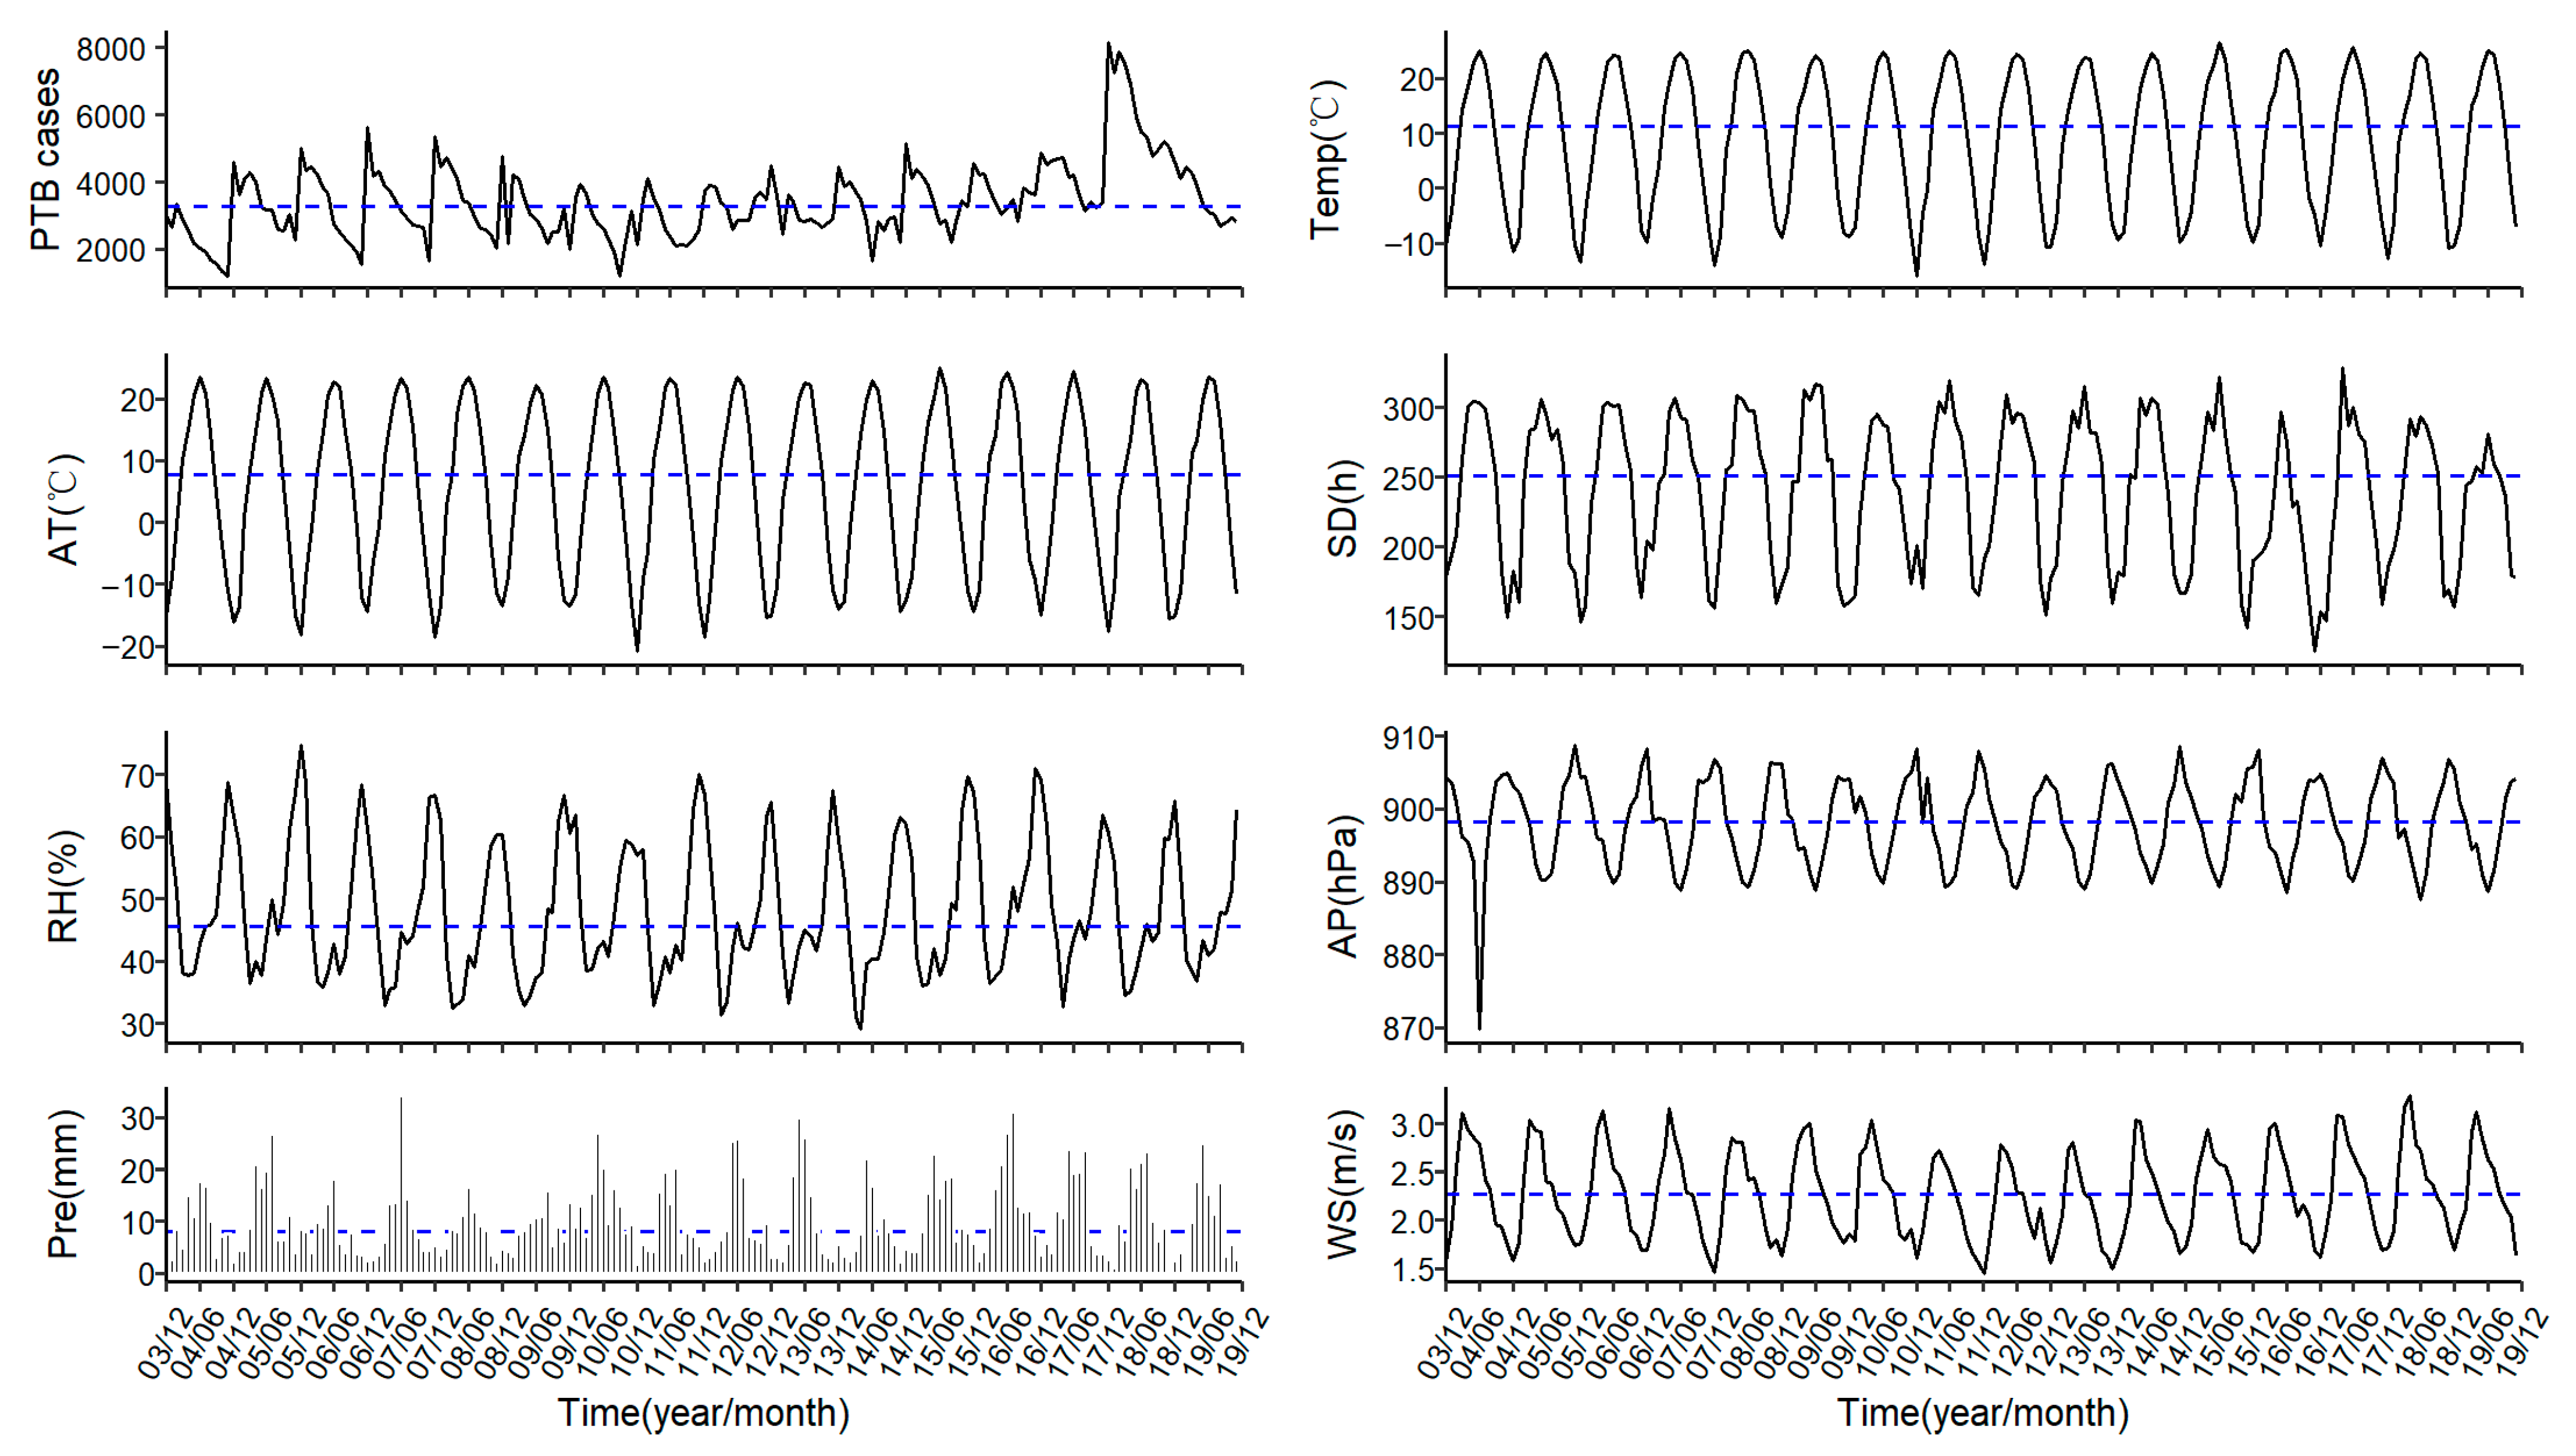
3.1. Descriptive Statistics of PTB Cases and Meteorological Factors

During the study period from 2004 to 2019 (192 months), a total of 668,753 PTB cases were included, with an average of 3427 cases per year and a maximum of 74,549 cases in 2018. The case number of PTB in Xinjiang had an obvious seasonal pattern and showed an increasing trend, with a peak from January to April (see Figure 1 and Supplementary Figure S2).
There were seasonal fluctuations and periodic trends of meteorological factors in Xinjiang, roughly showing the variation of single peak and single valley (see Figure 1 and Supplementary Figure S3). Air temperature, AT and sunshine duration had similar seasonal patterns, with higher values occurring from April to October (Seasonal index >1 indicates obvious seasonal variation). The peak of relative humidity and air pressure occurred from October to February of the next year, whereas the trough appeared from March to September. A seasonal peak of precipitation emerged from May to September and a trough occurred from October to March of the next year. Wind speed had a seasonal trend with a peak from March to August and a valley from September to February of the next year. In addition, the median of AT, air temperature, relative humidity, air pressure, precipitation, wind speed and sunshine duration were 7.8 °C, 11.3 °C, 45.6%, 898.2 hPa, 8.0 mm, 2.3 m/s and 251.0 h, respectively (see Figure 1).
The descriptive statistics of meteorological factors and the case number of PTB were shown in Table 1. The monthly average of AT was 5.7 °C, which was 3.5 °C lower than the air temperature. The distributions of AT in the1st, 5th, 25th, 75th, 95th and 99th percentiles were −18.5 °C, −15.1 °C, −6.3 °C, 7.8 °C, 18.0 °C, 23.3 °C and 24.3 °C, respectively.

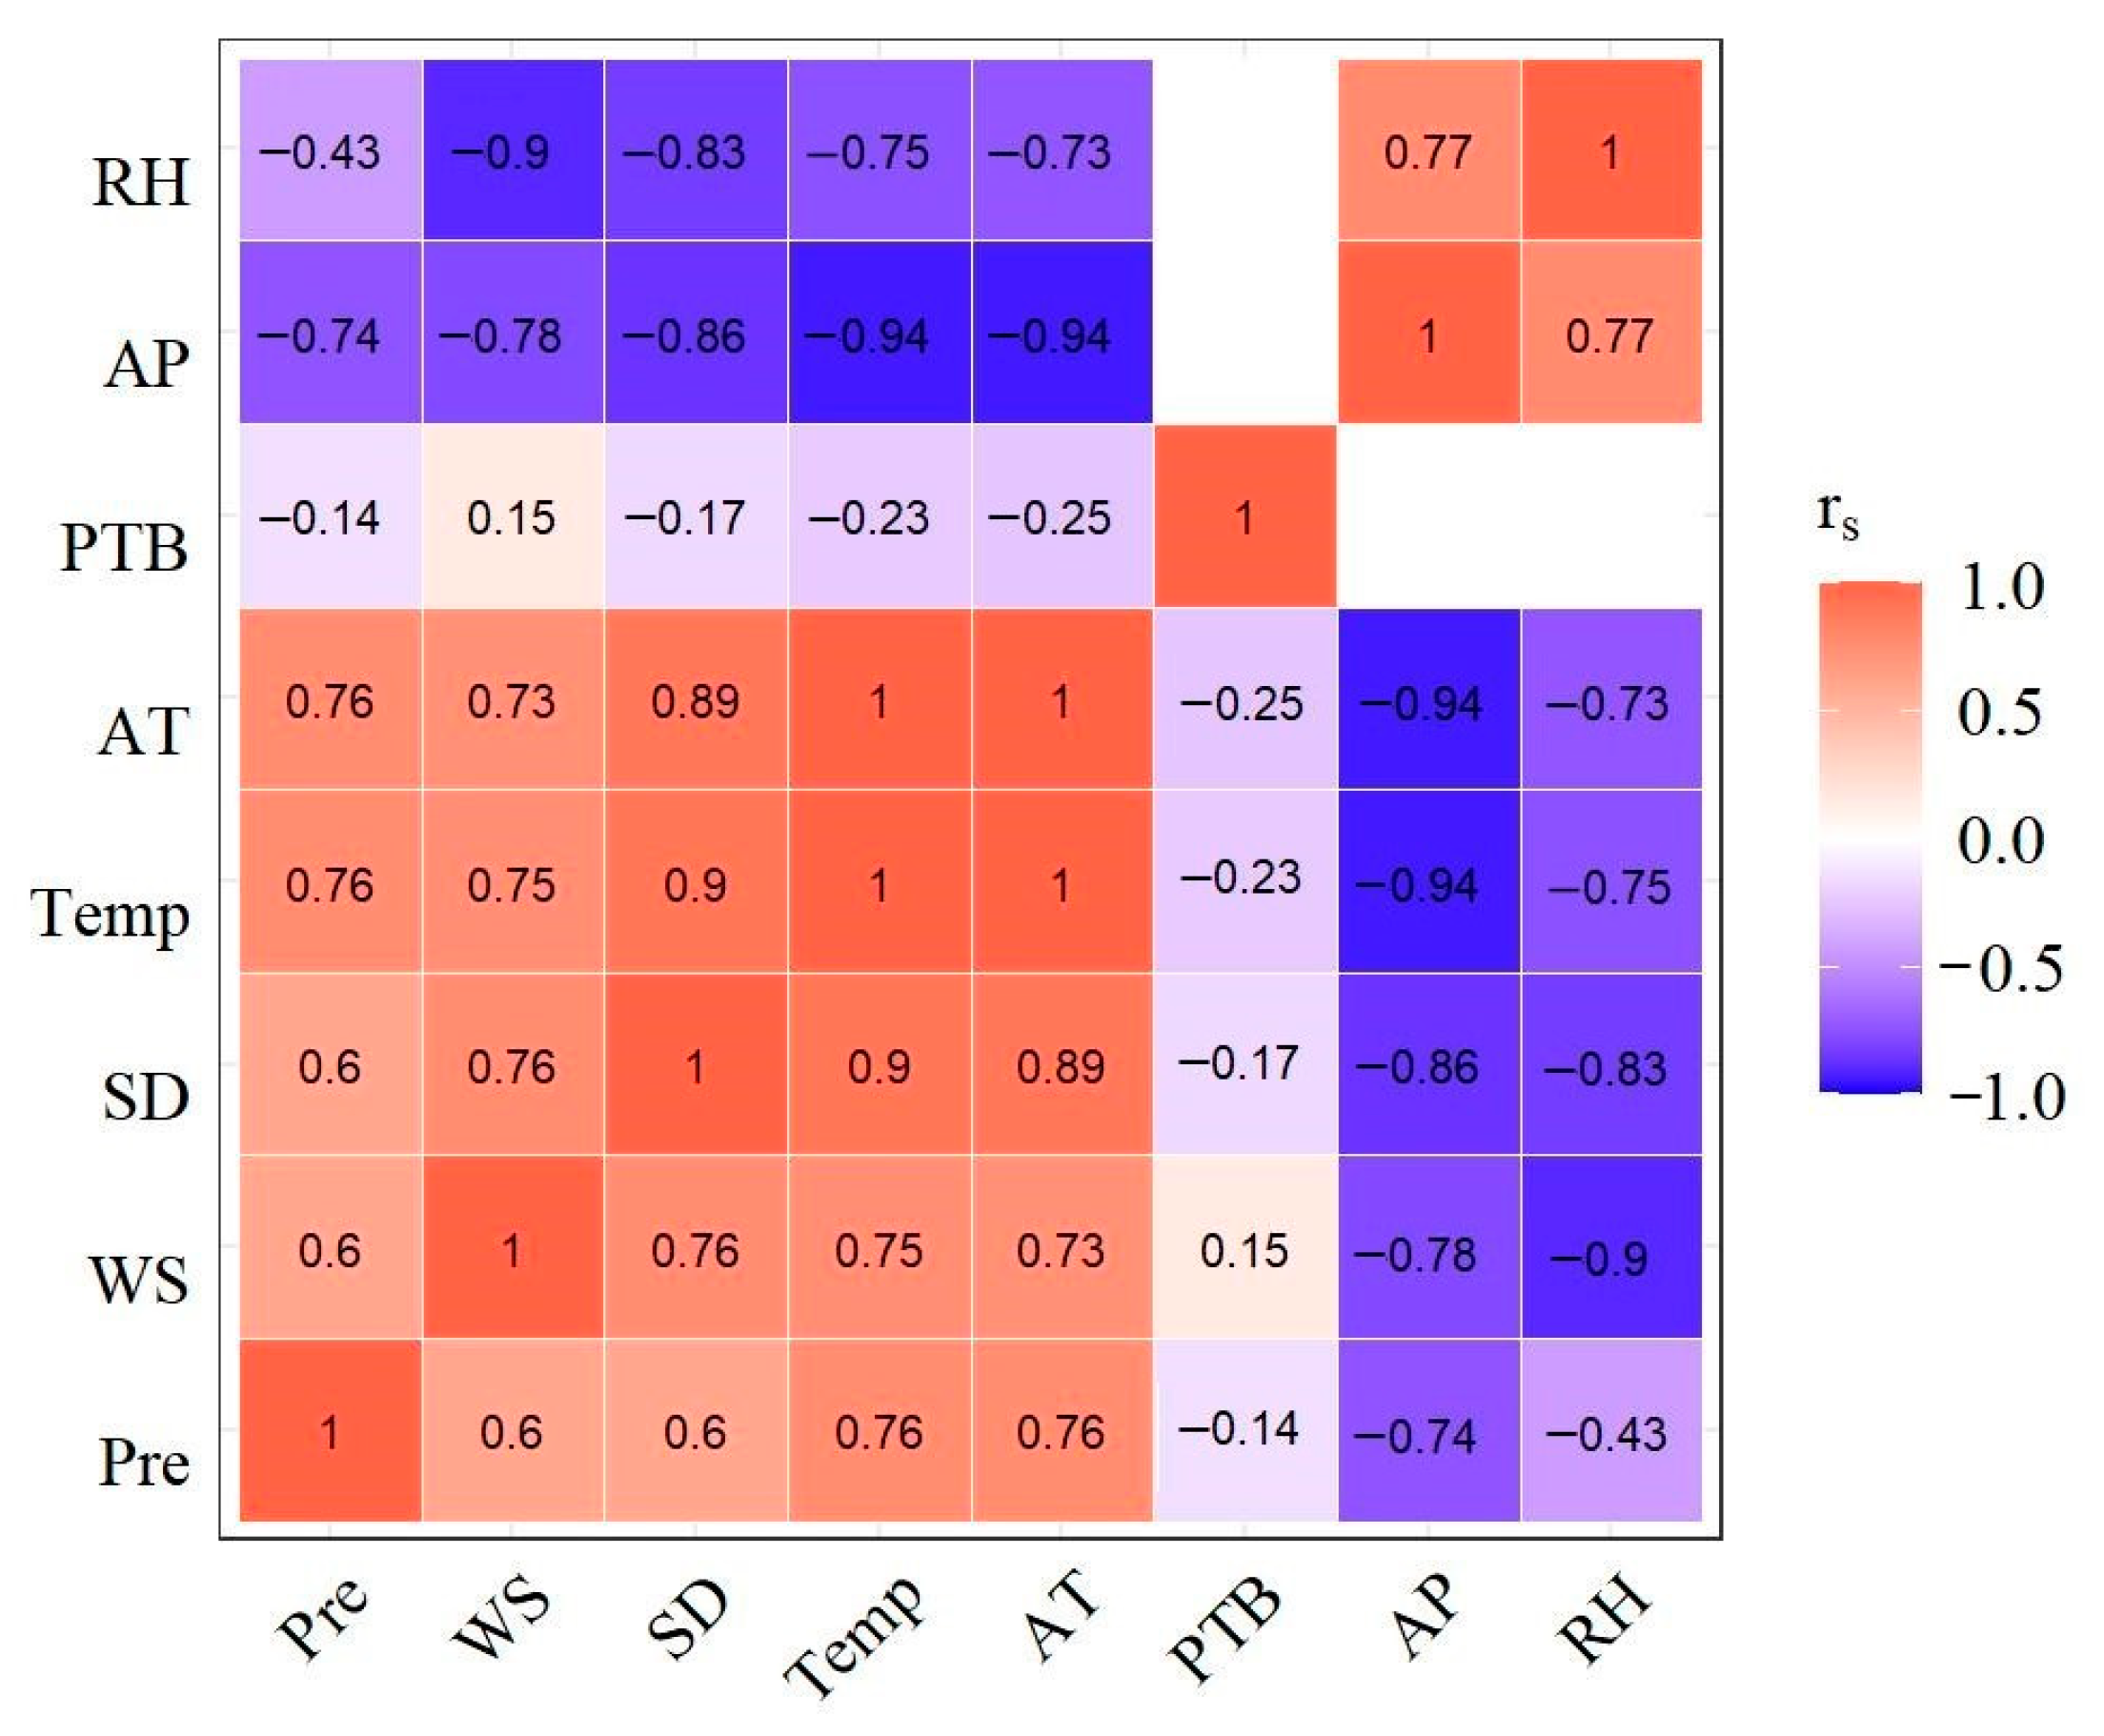
3.2. Spearman’s Rank Correlation Analysis

The Spearman’s rank correlation results between monthly PTB cases and meteorological factors in Xinjiang from 2004 to 2019 were provided in Figure 2. AT ( r s = −0.25), air temperature ( r s = −0.23), sunshine duration ( r s = −0.17) and precipitation ( r s = −0.14) were negatively correlated with the incidence of PTB, and wind speed ( r s = 0.15) is positively correlated with it. There was no significant correlation between relative humidity, air pressure and the incidence of PTB. There were high correlations among meteorological factors, especially between air pressure and AT ( r s = −0.94). The p-value < 0.05 was considered statistically significant.

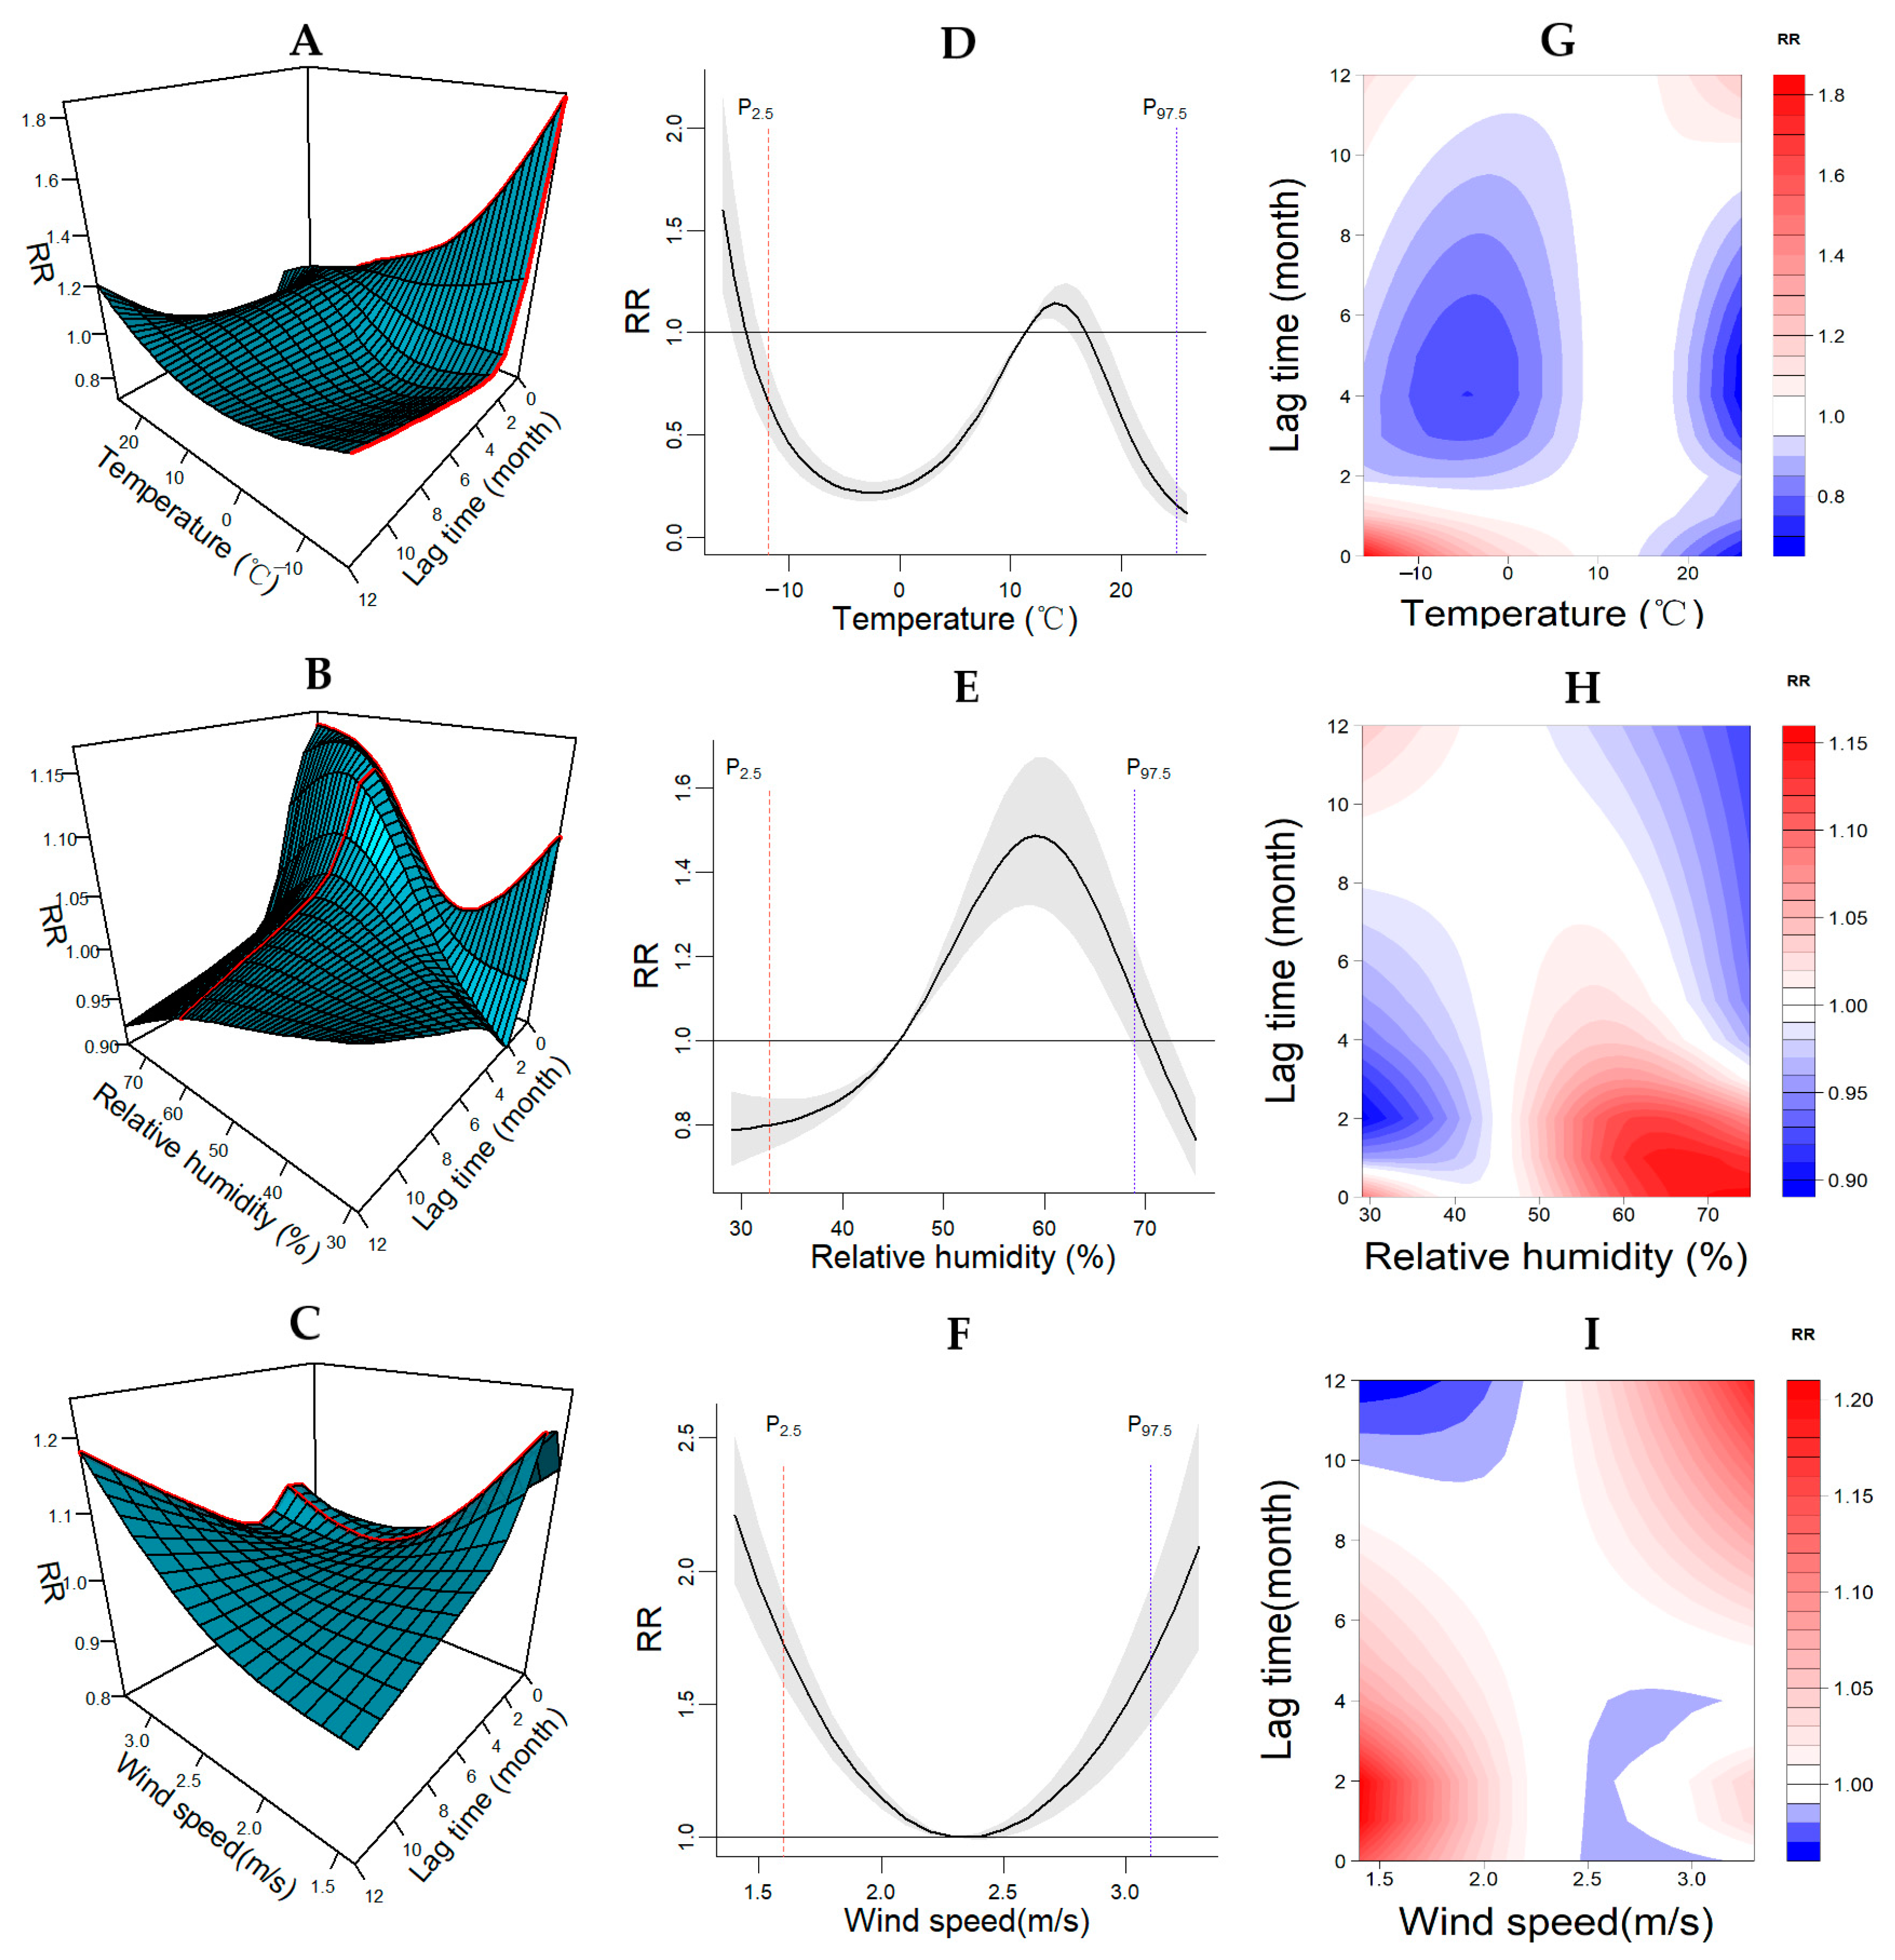
3.3. The Influences of Air Temperature on the Incidence of PTB

Taking the overall median of monthly average air temperature (11.3 °C) as a reference, it was obtained that the correlation between average air temperature and PTB incidence was nonlinear at 12 lag months for the general population, and the largest exposed and delayed cumulative effects occurred at −16.1 °C and lag 0 months, respectively (see Figure 3A). The overall exposure-response curve between air temperature and the incidence of PTB took on a U-type when the air temperature below 11.3 °C, with a maximum value, occurred at −16.1 °C (RR = 1.63, 95% CI: 1.21–2.20), whereas an inverted U-type when the air temperature was higher than 11.3 °C with a minimum value appeared at 26 °C (RR = 0.12, 95% CI: 0.06–0.20), as shown in Figure 3B. The association between extreme air temperature and the risk of PTB at specific lag months was shown in Figure 3B and Table S1. The lag 0–1 and lag 11–12 months could significantly increase the risk of PTB at extremely low air temperature −11.9 °C (2.5th percentiles), with a peak at lag 0 (RR = 1.59, 95% CI: 1.53–1.66). The cumulative risk at lag 12 months was largest (RR = 1.19, 95% CI: 1.14–1.24) at the extremely high air temperature 25 °C (97.5th percentiles). The relationship of air temperature-lag-PTB was evaluated by using the heatmap, as shown in Figure 3C.

3.4. The Influences of Relative Humidity on the Incidence of PTB

Setting the overall median of monthly average relative humidity (45.6%) as a reference, it was found that the association between relative humidity and PTB incidence was nonlinear at 12 lag months for the general population, and the largest exposed and delayed cumulative effects occurred at the relative humidity 59.2% and lag 0 months, respectively (see Figure 3D). The overall exposure-response curve between relative humidity and the PTB incidence appeared an inverted U-type, with a peak at a relative humidity of 59.2% (RR = 1.49, 95% CI: 1.32–1.67), as shown in Figure 3E. The relationship between extreme relative humidity and the risk of PTB at specific lag months was revealed in Figure 3E and Table S1. The lag 0, 10, 11 and 12 months could significantly increase the risk of PTB at the extreme low relative humidity of 32.8% (2.5th percentiles), with a top at lag 0 (RR = 1.05, 95% CI: 1.03–1.07). The lag 0–3 months could significantly increase the risk of PTB at the extreme high relative humidity 68.9% (97.5th percentiles), with a top at lag 0 (RR = 1.15, 95% CI: 1.13–1.17). The association of relative humidity-lag-PTB was estimated by using a heatmap, as shown in Figure 3F.

3.5. The Influences of Wind Speed on the Incidence of PTB

Using the overall median of monthly average wind speed of 2 min (2.3 m/s) as a reference (the wind speed corresponding to the lowest risk of PTB), it was found that the influence of wind speed on PTB incidence was nonlinear at 12 lag months for the general population, and the largest exposed and delayed cumulative effects occurred at 1.4 m/s and lag 2 months, respectively (see Figure 3G). The overall exposure-response curve between wind speed and the incidence of PTB showed a U-type with a trough that emerged at 2.3 m/s and a maximum relation arose at 1.4 m/s (RR = 2.20, 95% CI: 1.95–2.51), as shown in Figure 3H. The correlation between extreme wind speed and the risk of PTB at specific lag months was shown in Figure 3H and Table S1; the lag 0–9 months were separately significantly associated with an increased risk of PTB effect at the extreme low wind speed of 1.6 m/s (2.5th percentiles), with a maximum value at lag 2 (RR = 1.15, 95% CI: 1.13–1.16). The lag 6–12 were separately significantly related to an increased risk of PTB at the extreme high wind speed 3.1 m/s (97.5th percentiles), with a maximum value at lag0 (RR = 1.14, 95% CI: 1.12–1.15). The correlation of wind speed-lag-PTB was also assessed by using the heatmap as shown in Figure 3I.

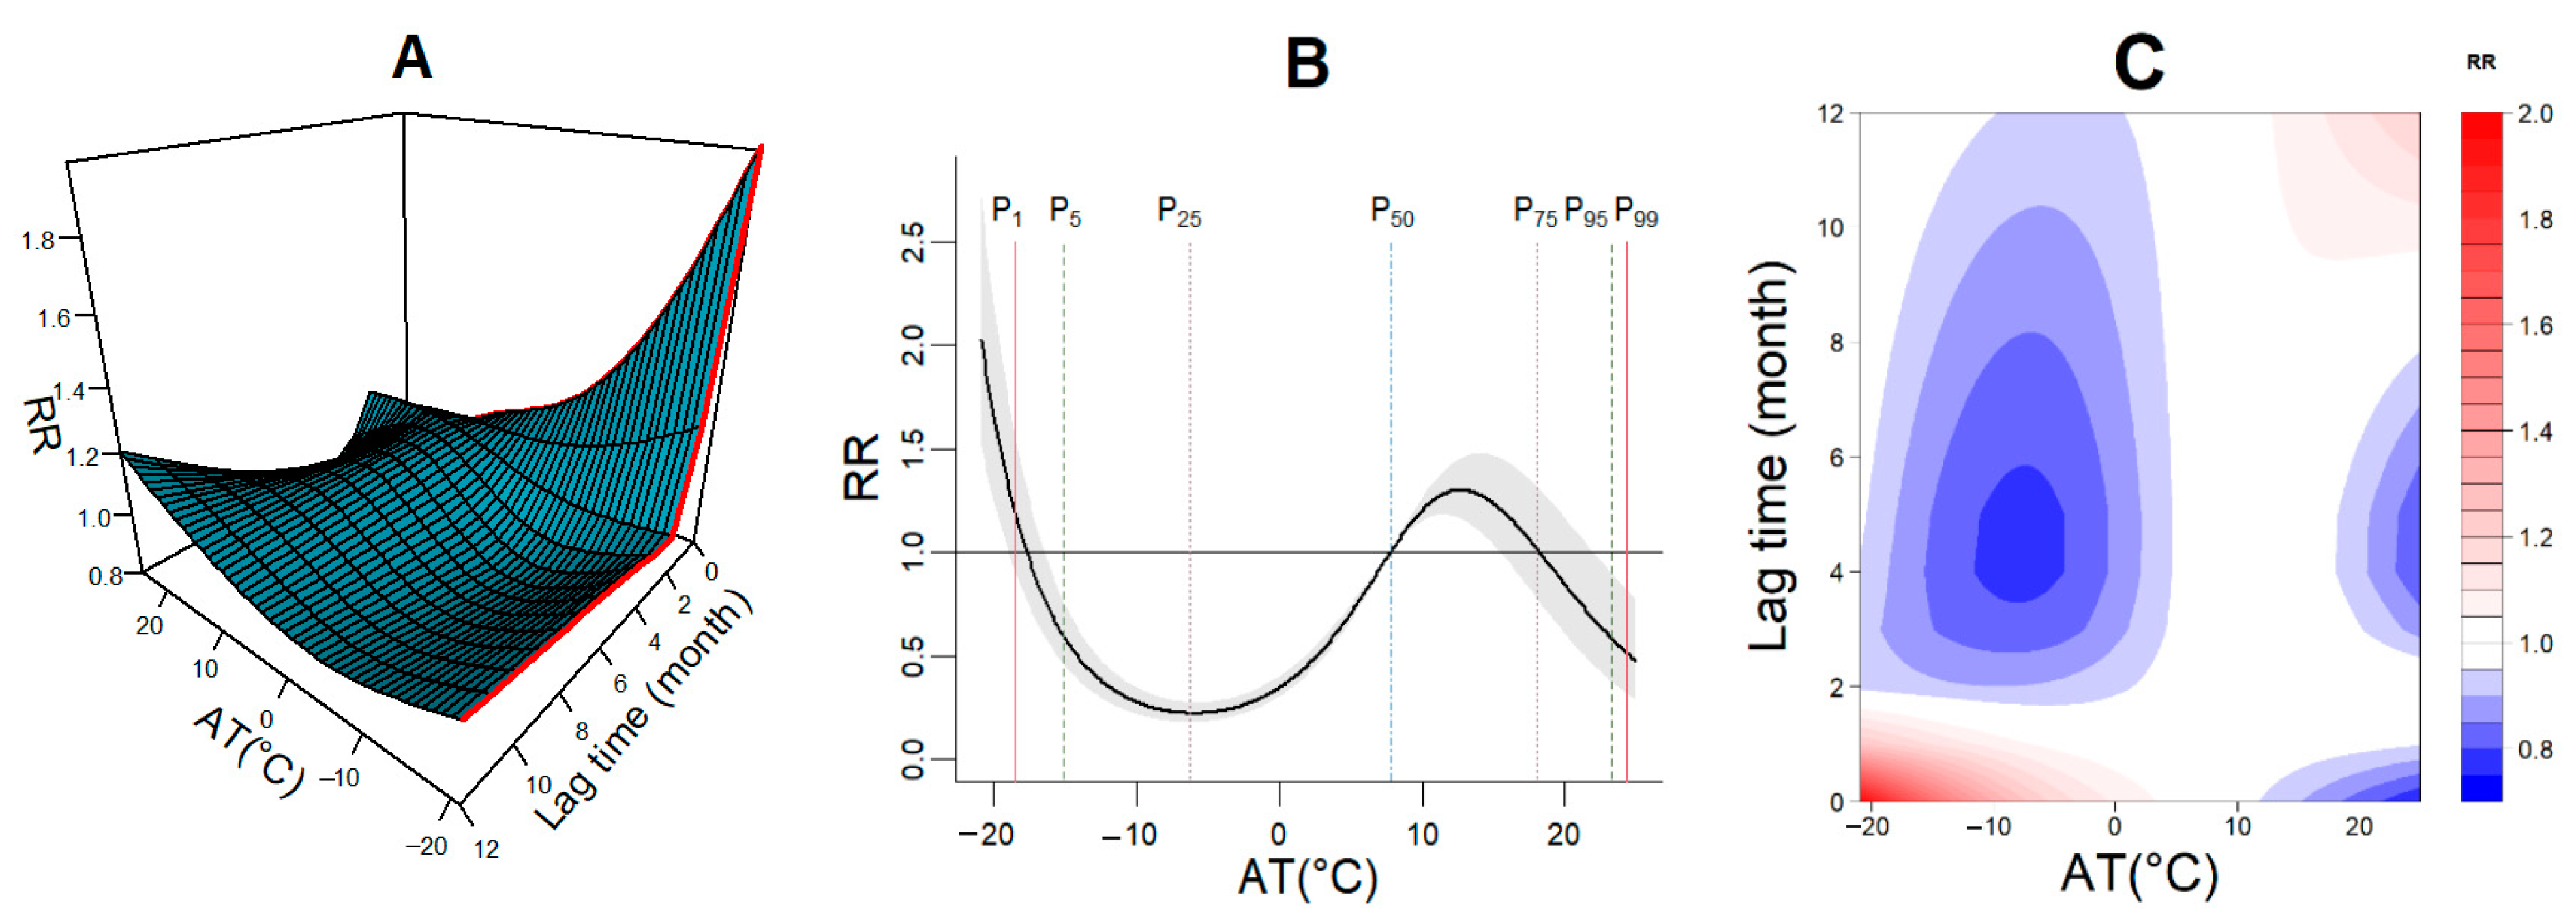
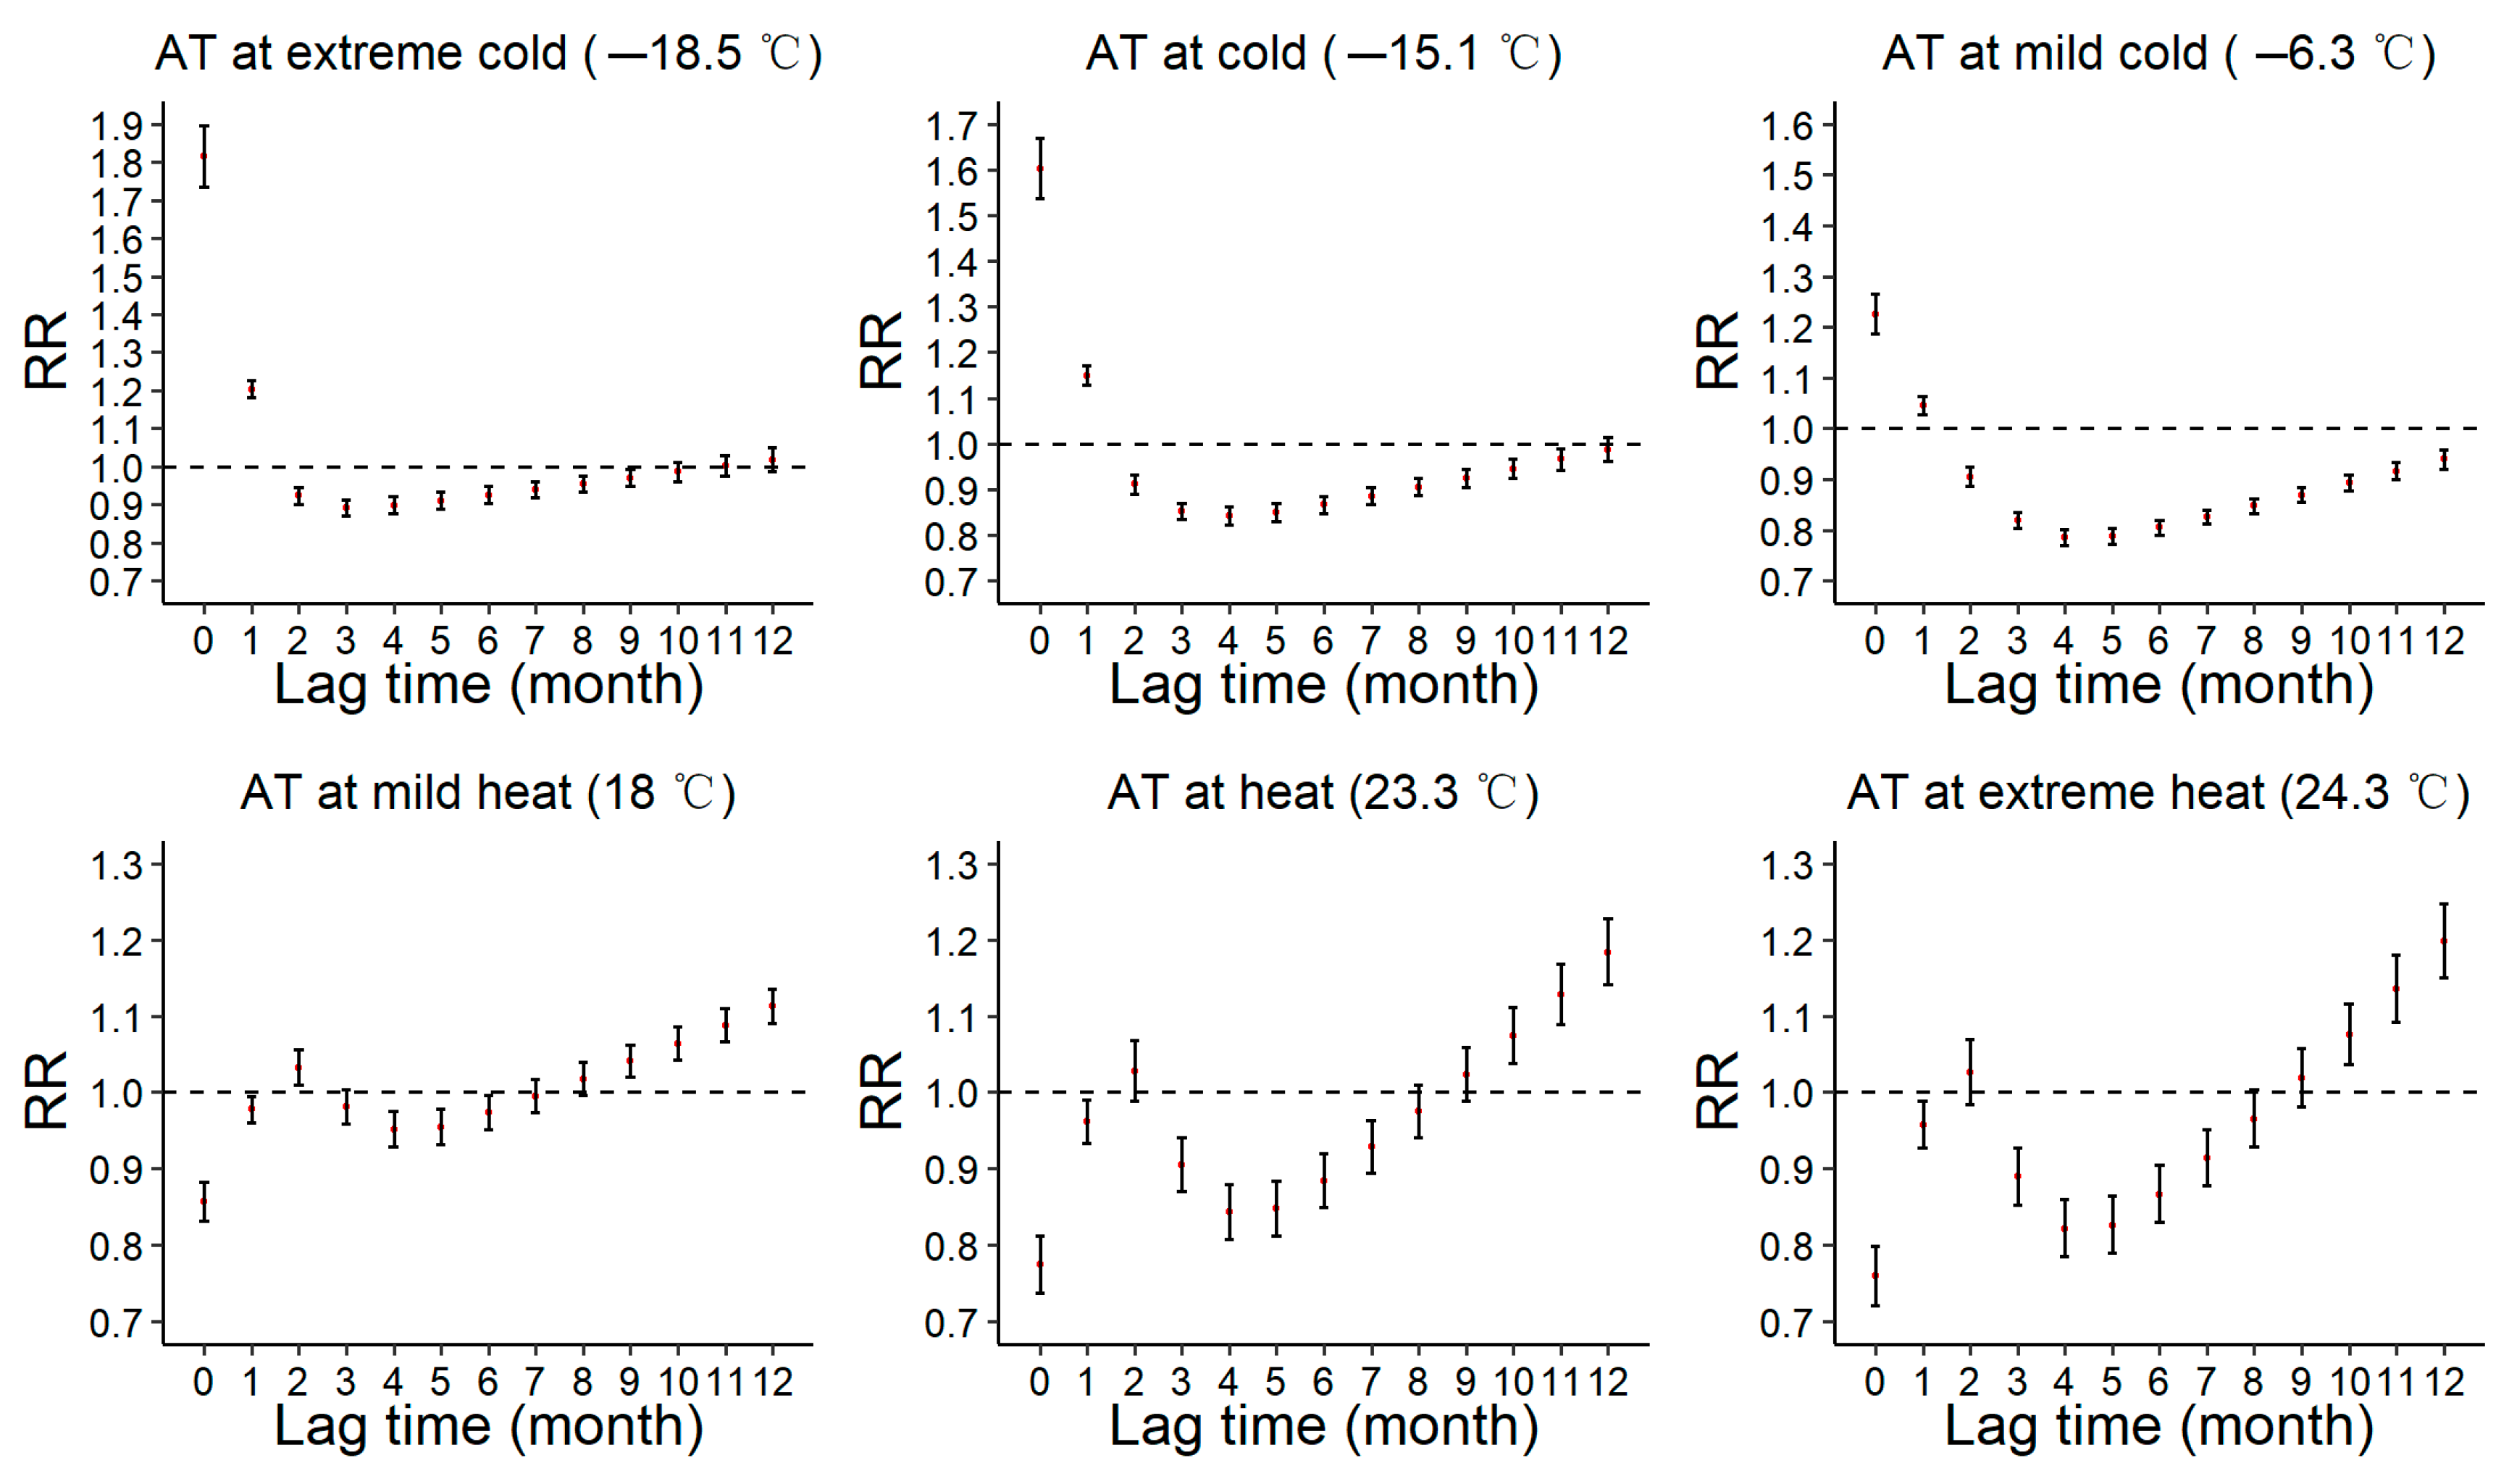
3.6. The Effect of AT on PTB Incidence

Considering the overall median of the monthly AT (7.8 °C) as a reference, it was discovered that the connection between AT and the incidence of PTB was nonlinear at 12 lag months for the total population, and the largest exposed and delayed cumulative effects occurred at −20.9 °C and lag 0 months (see Figure 4A). As shown in Figure 4B, the overall exposure-response curve between AT and the incidence of PTB presented a U-type when the AT below 7.8 °C, with a maximum value occurred at −20.9 °C (RR = 2.01, 95% CI: 1.50–2.69), whereas an inverted U-type when the AT was higher than 7.8 °C with a maximum risk appeared at 12.6 °C (RR = 1.29, 95% CI: 1.16–1.44). The extreme cold −18.5 °C and mild heat 18 °C had no significantly risky effects on PTB incidence, and the cold −15.1 °C (RR = 0.59, 95% CI: 0.46–0.76), the mild cold −6.3 °C (RR = 0.22, 95% CI: 0.18–0.27), the heat 23.3 °C (RR = 0.58, 95% CI: 0.38–0.90) and the extreme heat 24.3 °C (RR = 0.51, 95% CI: 0.32–0.82) had significantly protective effects on PTB incidence. The connection of AT-lag-PTB was also observed by using the heatmap, as shown in Figure 4C.
It is noteworthy that the lag effects of low AT presented a V-shape with the highest risk at lag 0, whereas the lag effects of high AT presented an N-shape with the highest risk at lag 12 (see Figure 5). As shown in Figure 5, lag 0 and lag 1 could significantly increase the incidence of PTB at the extreme cold, with the highest risk at lag 0 (RR = 1.81, 95% CI: 1.73–1.90). The cold had a significantly risky effect on increasing PTB incidence at lag 0–1, with the highest risk at lag 0 (RR = 1.60, 95% CI: 1.54–1.67), which was a protective factor for the risk of PTB at lag 2–11. The mild cold had a significantly risky effect on increasing the incidence of PTB at lag 0 and lag 1, with the highest risk at lag 0 (RR = 1.22, 95% CI:1.19–1.26), which was a protective factor for the risk of PTB at lag 2–12. The mild heat had a significantly risky effect on increasing the incidence of PTB at lag 2 and lag 9–12, with the highest risk at lag 12 (RR = 1.11, 95% CI: 1.09–1.14), which did not significantly influence the incidence of PTB at lag 3. The heat and extreme heat had a significantly risky effect on increasing the incidence of PTB at lag10–12, with the highest risk at lag 12 (RR = 1.18, 95% CI: 1.14–1.22 and RR = 1.20, 95% CI: 1.15–1.25), which did not significantly influence PTB incidence at lag 2 and lag 8–9.
In addition, the cumulative effects of low and high AT on PTB incidence at different lag months were compared (see Table 2). For the extreme cold of low AT, the cumulative effects were risky from lag 0 to lag 0–8, with a maximum value at lag 0–1 (RR = 2.18, 95% CI: 2.06–2.31). For the cold, the cumulative effects were risky effects from lag 0 to lag 0–4, with a maximum value at lag 0–1 (RR = 1.84, 95% CI: 1.74–1.94). For the mild cold the cumulative effects were risky from lag 0 to lag 0–2, with a maximum value at lag 0–1 (RR = 1.28, 95% CI: 1.22–1.34). For the high AT, there was no significant risk of the cumulative effects of the mild heat, heat and extreme heat, in particular, the cumulative effects of mild heat had no significant influences from lag 0–10 to lag 0–12.

3.7. Sensitivity Analysis

The result of sensitivity analysis showed the model was robust when the df were altered for the time trend (df = 10–12), air pressure (df = 3–5), precipitation (df = 3–5) and sunshine duration (df = 1–3) (see Figures S4–S6). Changing the maximum lag day into 8, 10 and 12 in the model did not show an obvious difference for fitting the overall effect curve of AT in the model (see Figure S7).

4. Discussion and Conclusions

In this paper, the effects of meteorological factors (air temperature, wind speed and relative humidity) on PTB incidence in Xinjiang were investigated by using a P-DLNM model, and the relationship between AT and PTB incidence was evaluated. It was found that the correlations between air temperature, relative humidity, wind speed, AT and PTB incidence were nonlinear and lagged.
The overall effect between air temperature and PTB incidence showed a curve fluctuation, and the low air temperature could have a significantly risky effect on PTB incidence, which was consistent with previous studies [4,31,32]. It was reasonable that Xinjiang has a longer winter and thus, people are more susceptible to being infected with M.tb because the time of outdoor activities for humans was shorted [31]. Another reason is that the air pollution is serious during the heating period in Xinjiang (from October to March of the next year), then pollution particulates may attach more pathogenic bacteria including M.tb [3,12]. Moreover, vitamin D was demonstrated as an important factor that affected people’s immune response to resist and remove M.tb when someone was during incubation, and with a long winter and low levels of vitamin D, latent infected PTB peoples are sensitive to M.tb [32]. The association between high air temperature with PTB incidence is negative, which may be the result that the recombinant strain of M.tb may stop growing or even be destroyed when the temperature exceeds 37 °C. In addition, sunshine is the main route of vitamin D synthesis. More sunbathing could help humans to enhance immunity so that the risk of transmission of PTB is relatively lower [33]. As a reference of the overall median of monthly average relative humidity (45.6%), it was obtained that the relative humidity was possible to increase the risk of PTB when it was between 44.5% and 71.8%, while it decreased the risk if it 72 % , which is consistent with the results in reference [4]. One explanatory hypothesis for the high relative humidity is a lower chance of infection with PTB because Xinjiang is an arid/semi-arid region with a dry climate, scarce precipitation and infrequent high relative humidity environment [11]. Another explanatory hypothesis is high relative humidity promotes the production of protective mucus on the surface of the respiratory tract thereby resisting the invasion of M.tb [34]. The overall effect of wind speed on the incidence of PTB was a U-shape, low and high wind speed are significantly positively correlated with the incidence of PTB, which is different from previous results that high wind speed was positively correlated with PTB [31,35]. It can be seen in the results that high wind speed may affect the transmission of M.tb, which may be because the frequent dust weather in Xinjiang makes M.tb float in the air for a longer time [9]. Moreover, the lower wind speed may also increase the chance of M.tb floating in the air in Xinjiang because the wind speed in winter is lower but the frequency is higher [36].
One of the highlights of this paper is to illustrate that there is a significant association between low AT and PTB incidence in Xinjiang. Generally, people are exposed to multiple meteorological factors in the environment, with low air temperature, wind and high relative humidity the sensations experienced by the human body are usually lower than the air temperature. AT is a comprehensive index combining ambient temperature, wind speed and humidity, which characterizes the physiological experience better than just air temperature alone, then it may be more realistic and objective. In this paper, it was shown that there was a nonlinear and lagged relationship between AT and PTB incidence in Xinjiang, and low AT can significantly increase the risk of PTB. Using the overall median of monthly AT (7.8 °C) as a reference, it was discovered that the lag effects of low AT presented a V-shape with the highest risk at lag 0, while the lag effects of high AT emerged as an N-shape with the highest risk at lag 12. Some specific biological mechanisms can account for why low AT can significantly increase the risk of PTB [37]. In a low air temperature, the human body is more sensitive to cold stimulation than heat stimulation, and the sympathetic nervous system is stimulated if the human body is invaded by cold air, which leads to the contraction of bronchial smooth muscle and excessive response, thus affecting the pulmonary ventilation and the decline of human lung function [38]. Furthermore, the human body’s perception of cold and heat is mainly controlled by the thermoregulation system, nervous system and endocrine system [39], M.tb is more likely to invade the body in extreme cold weather, thus the human body’s autonomous regulation is limited, the defense ability of the immune system is weakened. AT, as a comprehensive index combining air temperature, wind speed and relative humidity can be used to evaluate the impact of meteorological factors on PTB incidence, thus it can better reflect the relationship among human body, environment and disease.
The adjustment of energy structure has improved air quality in Xinjiang, and the incidence of PTB decreased slowly in recent years [25]. However, there is still a long way to go to mitigate the adverse effect of meteorological factors on the incidence of PTB in Xinjiang. Some measures should be implemented to improve the air quality. For example, the government should encourage the use of clean energy during the heating period. Moreover, more trees should be planted to alleviate the harm of dust storms. People should be appealed to wear masks in public places (especially in dusty weather) and enhance their immunity by getting more sunlight (at a favorable temperature) and exercising.
This paper also has some limitations. Firstly, the incidence of PTB is also affected by many variables (such as age, gender and air pollutant concentration) [40]. If these confounding variables are included in the model, the impact of meteorological factors and AT on PTB incidence can be more accurately evaluated. Secondly, other periodic dynamic models also can be applied to investigate the relationship between meteorological factors and PTB incidence.

Supplementary Materials

The following supporting information can be downloaded at: https://www.mdpi.com/article/10.3390/atmos13040533/s1, Figure S1: The study area and locations of weather stations; Figure S2. The plot of partial auto-correlation function in the distributed lag non-linear model; Figure S3. Seasonal decomposition of the time series of meteorological factors and the case in-cidence of PTB in Xinjiang from 2004 to 2019. Abbreviations: PTB, pulmonary tuberculosis; Temp, temperature; AT, apparent temperature; SD, sunshine duration; RH, relative humidity; AP, air pressure; Pre, precipitation; WS, wind speed; Figure S4. Sensitivity analysis when altering the degrees of freedom (df = 10–12) of time for con-trolling for the long-term trend in the model in Xinjiang from 2004 to 2019; Figure S5. Sensitivity analysis when altering the degrees of freedom (df = 3–5) of air pressure and precipitation for controlling for the effect of confounding factors in the model in Xinjiang from 2004 to 2019; Figure S6. Sensitivity analysis when altering the degrees of freedom (1–3) of sunshine duration for controlling for the effect of confounding factors in the model in Xinjiang from 2004 to 2019; Figure S7. Sensitivity analysis when altering the maximum lag periods for 8, 10 and 12 months in the model in Xinjiang from 2004 to 2019; Table S1. Estimated relative risks (95% CI) of pulmonary tuberculosis cases with extremely low temperature (2.5th percentile, −11.9 °C) and ex-tremely high temperature (97.5th percentile, 25 °C) and extremely low relative humidity (2.5th percentile, 32.8%) and extremely high relative humidity (97.5th percentile, −68.9%) and extremely low wind speed (2.5th percentile, 1.6 m/s) and extremely high wind speed (97.5th percentile, 3.1 m/s) at lagged months in Xinjiang from 2004 to 2019.

Author Contributions

Conceptualization, C.G. and L.W.; Data curation, H.J.; Formal analysis, L.W.; Funding acquisition, L.W.; Methodology, C.G. and Y.W.; Software, Y.W. and H.J.; Writing—original draft, C.G., Y.W. and L.W.; Writing—review & editing, C.G., Z.H. and L.W. All authors have read and agreed to the published version of the manuscript.

Funding

The work is supported by the Natural Science Foundation of Xinjiang (Grant No. 2019D01C20), the National Natural Science Foundation of China (Grant Nos. 12061079, 12026236, 12026222), the Shenzhen science and technology innovations Committee (JCYJ20210324101406019) and the Alliance of International Science Organizations (Grant No. ANSO-CR-KP-2021-02).

Institutional Review Board Statement

Not applicable.

Informed Consent Statement

Not applicable.

Data Availability Statement

The data used and/or analyzed in the current study are publicly available in [the Public Health Scientific Data Sharing Center] at [http://www.phsciencedata.cn/. Accessed 30 December 2021], [the Health Commission of Xinjiang Uygur Autonomous Region] at [http://wjw.xinjiang.gov.cn/. Accessed 8 January 2022] and [the China Meteorological Data Sharing Center] at [http://data.cma.cn. Accessed 21 November 2021].

Conflicts of Interest

The authors declare no competing interests.

References

  1. World Health Organization. Global Tuberculosis Report; World Health Organization: Switzerland, Geneva, 2020.
  2. Turner, R.D. Cough in pulmonary tuberculosis: Existing knowledge and general insights. Pulm. Pharmacol. Ther. 2019, 55, 89–94. [Google Scholar] [CrossRef] [PubMed]
  3. Cai, Y.L.; Zhao, S.; Niu, Y.; Peng, Z.; Wang, K.; He, D.H.; Wang, W.M. Modelling the effects of the contaminated en-vironments on tuberculosis in Jiangsu, China. J. Theor. Biol. 2021, 508, 110453. [Google Scholar] [CrossRef] [PubMed]
  4. Li, Z.Q.; Liu, Q.; Zhan, M.Y.; Tao, B.L.; Wang, J.M.; Lu, W. Meteorological factors contribute to the risk of pulmonary tu-berculosis: A multicenter study in eastern China. Sci. Total Environ. 2021, 793, 148621. [Google Scholar] [CrossRef]
  5. Rivas-Santiago, C.E.; Sarkar, S.; Cantarella, P., IV; Osornio-Vargas, Á.; Quintana-Belmares, R.; Meng, Q.; Kirn, T.J.; Strickland, P.O.; Chow, J.C.; Watson, J.G.; et al. Air pollution particulate matter alters antimycobacterial respiratory epithelium innate immunity. Infect. Immun. 2015, 83, 2507–2517. [Google Scholar] [CrossRef] [PubMed] [Green Version]
  6. Niu, Z.C.; Qi, Y.J.; Zhao, P.Q.; Li, Y.D.; Tao, Y.; Peng, L.; Qiao, M.L. Short-term effects of ambient air pollution and meteorological factors on tuberculosis in semi-arid area, northwest China: A case study in Lanzhou. Environ. Sci. Pollut. Res. Int. 2021, 28, 69190–69199. [Google Scholar] [CrossRef]
  7. Petersen, W.F. Tuberculosis: Weather and resistance. In Proceedings of theAnnual Meeting of the American College of Chest Physicians, Atlantic City, NJ, USA, 6 June 1942. [Google Scholar]
  8. Guo, C.; DU, Y.; Shen, S.Q.; Lao, X.Q.; Qian, J.; Ou, C.Q. Spatiotemporal analysis of tuberculosis incidence and its associated factors in mainland China. Epidemiol. Infect. 2017, 145, 2510–2519. [Google Scholar] [CrossRef] [Green Version]
  9. Zhang, C.Y.; Zhang, A. Climate and air pollution alter incidence of tuberculosis in Beijing, China. Ann. Epidemiol. 2019, 37, 71–76. [Google Scholar] [CrossRef]
  10. Yang, J.; Zhang, M.; Chen, Y.; Ma, L.; Yadikaer, R.; Lu, Y.; Lou, P.; Pu, Y.; Xiang, R.; Rui, B. A study on the relationship between air pollution and pulmonary tuberculosis based on the general additive model in Wulumuqi, China. Int. J. Infect. Dis. 2020, 96, 42–47. [Google Scholar] [CrossRef]
  11. An, Q.; He, H.; Gao, J.; Nie, Q.; Cui, Y.; Wei, C.; Xie, X. Analysis of Temporal-Spatial Variation Characteristics of Drought: A Case Study from Xinjiang, China. Water 2020, 12, 741. [Google Scholar] [CrossRef] [Green Version]
  12. Xu, M.; Li, Y.; Liu, B.; Chen, R.; Sheng, L.; Yan, S.; Chen, H.; Hou, J.; Yuan, L.; Ke, L.; et al. Temperature and humidity associated with increases in tuberculosis notifications: A time-series study in Hong Kong. Epidemiol. Infect. 2021, 149, e8. [Google Scholar] [CrossRef]
  13. Ghadimi-Moghadam, A.; Salahi, M.; Ghatee, M.A.; Kanannejad, Z.; Mosavi, A.; Ramshk, O.; Khoramrooz, S. Environmental and climatic factors influencing the occurrence and distribution of tuberculosis in southwest Iran: A GIS-based study. Acta Med. Mediterr. 2020, 36, 557–563. [Google Scholar]
  14. Li, Z.-Q.; Pan, H.-Q.; Liu, Q.; Song, H.; Wang, J.-M. Comparing the performance of time series models with or without meteorological factors in predicting incident pulmonary tuberculosis in eastern China. Infect. Dis. Poverty 2020, 9, 151. [Google Scholar] [CrossRef] [PubMed]
  15. Li, N.; Ma, J.; Liu, F.; Zhang, Y.; Ma, P.; Jin, Y.; Zheng, Z.-J. Associations of apparent temperature with acute cardiac events and subtypes of acute coronary syndromes in Beijing, China. Sci. Rep. 2021, 11, 15229. [Google Scholar] [CrossRef]
  16. Royé, D.; Zarrabeitia, M.T.; Riancho, J.; Santurtún, A. A time series analysis of the relationship between apparent temperature, air pollutants and ischemic stroke in Madrid, Spain. Environ. Res. 2019, 173, 349–358. [Google Scholar] [CrossRef] [PubMed]
  17. Yang, L.; Yang, J.; Liu, M.; Sun, X.; Li, T.; Guo, Y.; Hu, K.; Bell, M.L.; Cheng, Q.; Kan, H.; et al. Nonlinear effect of air pollution on adult pneumonia hospital visits in the coastal city of Qingdao, China: A time-series analysis. Environ. Res. 2022, 209, 112754. [Google Scholar] [CrossRef] [PubMed]
  18. Chaudhuri, S.; Dutta, D. Mann–Kendall trend of pollutants, temperature and humidity over an urban station of India with forecast verification using different ARIMA models. Environ. Monit. Assess. 2014, 186, 4719–4742. [Google Scholar] [CrossRef] [PubMed]
  19. Gasparrini, A.; Armstrong, B.; Kenward, M.G. Distributed lag non-linear models. Stat. Med. 2010, 29, 2224–2234. [Google Scholar] [CrossRef] [Green Version]
  20. Wu, W.; Xiao, Y.Z.; Li, G.C.; Zeng, W.; Lin, H.; Rutherford, S.; Xu, Y.; Luo, Y.; Xu, X.; Chu, C.; et al. Temperature-mortality relationship in four subtropical Chinese cities: A time-series study using a distributed lag non-linear model. Sci. Total Environ. 2013, 449, 355–362. [Google Scholar] [CrossRef]
  21. Yang, Q.Y.; Yang, Z.C.; Ding, H.Y.; Zhang, X.; Dong, Z.; Hu, W.; Liu, X.; Wang, M.; Hu, G.; Fu, C. The relationship between meteorological factors and mumps incidence in Guangzhou, China, 2005–2012. Hum. Vaccines Immunother. 2014, 10, 2421–2432. [Google Scholar] [CrossRef] [Green Version]
  22. Gasparrini, A.; Scheipl, F.; Armstrong, B.; Kenward, M.G. A penalized framework for distributed lag non-linear models. Bio-metrics 2017, 73, 938–948. [Google Scholar] [CrossRef]
  23. Steadman, R.G. A universal scale of apparent temperature. J. Appl. Meteorol. Climatol. 1984, 23, 1674–1687. [Google Scholar] [CrossRef]
  24. Liu, X.; Wen, Y.; Zhang, K.; Duan, Y.; Li, H.; Yan, S.; Yin, P.; Cheng, J.; Jiang, H. Examining the association between apparent temperature and incidence of acute excessive drinking in Shenzhen, China. Sci. Total Environ. 2020, 741, 140302. [Google Scholar] [CrossRef] [PubMed]
  25. Statistic Bureau of Xinjiang Uygur Autonomous Region. Available online: http://tjj.xinjiang.gov.cn/tjj/zhhvgh/list_nj1.shtml (accessed on 22 March 2022).
  26. Hauke, J.; Kossowski, T. Comparison of Values of Pearson’s and Spearman’s Correlation Coefficients on the Same Sets of Data. Quaest. Geogr. 2011, 30, 87–93. [Google Scholar] [CrossRef] [Green Version]
  27. Ha, Y.S.; Seongjin, P. An Analysis of Correlation between Personality and Visiting Place using Spearman’s Rank Correlation Coefficient. KSII Trans. Internet Inf. Syst. (TIIS) 2020, 14, 1951–1966. [Google Scholar]
  28. Gasparrini, A.; Armstrong, B. Reducing and meta-analysing estimates from distributed lag non-linear models. BMC Med. Res. Methodol. 2013, 13, 1. [Google Scholar] [CrossRef] [Green Version]
  29. Gasparrini, A. Modeling exposure-lag-response associations with distributed lag non-linear models. Stat. Med. 2014, 33, 881–899. [Google Scholar] [CrossRef] [PubMed] [Green Version]
  30. Kirolos, A.; Thindwa, D.; Khundi, M.; Burke, R.M.; Henrion, M.Y.R.; Nakamura, I.; Divala, T.H.; Nliwasa, M.; Corbett, E.L.; MacPherson, P.; et al. Tuberculosis case notifications in Malawi have strong seasonal and weather-related trends. Sci. Rep. 2021, 11, 4621. [Google Scholar] [CrossRef]
  31. Xiao, Y.; He, L.; Chen, Y.; Wang, Q.; Meng, Q.; Chang, W.; Xiong, L.; Yu, Z. The influence of meteorological factors on tuberculosis incidence in Southwest China from 2006 to 2015. Sci. Rep. 2018, 8, 10053. [Google Scholar] [CrossRef]
  32. Jaimni, V.; Shasty, B.A.; Madhyastha, S.P.; Shetty, G.V.; Acharya, R.V.; Bekur, R.; Doddamani, A. Association of Vitamin D Deficiency and Newly Diagnosed Pulmonary Tuberculosis. Pulm. Med. 2021, 2021, 5285841. [Google Scholar] [CrossRef]
  33. Pinto, C.T.; Nano, F.E. Stable, temperature-sensitive recombinant strain of Mycobacterium smegmatis generated through the substitution of a psychrophilic ligA gene. FEMS Microbiol. Lett. 2015, 362, fnv152. [Google Scholar] [CrossRef] [Green Version]
  34. Fahy, J.V.; Dickey, B.F. Airway Mucus Function and Dysfunction. N. Engl. J. Med. 2010, 363, 2233–2247. [Google Scholar] [CrossRef] [PubMed] [Green Version]
  35. Li, Q.; Liu, M.; Zhang, Y.; Wu, S.; Yang, Y.; Liu, Y.; Amsalu, E.; Tao, L.; Liu, X.; Zhang, F.; et al. The spatio-temporal analysis of the incidence of tuberculosis and the associated factors in mainland China, 2009–2015. Infect. Genet. Evol. 2019, 75, 103949. [Google Scholar] [CrossRef] [PubMed]
  36. Wang, J.; Qin, S.; Zhou, Q.; Jiang, H. Medium-term wind speeds forecasting utilizing hybrid models for three different sites in Xinjiang, China. Renew. Energy 2015, 76, 91–101. [Google Scholar] [CrossRef]
  37. Halonen, J.I.; Zanobetti, A.; Sparrow, D.; Vokonas, P.S.; Schwartz, J. Relationship between outdoor temperature and blood pressure. Occup. Environ. Med. 2010, 68, 296–301. [Google Scholar] [CrossRef] [Green Version]
  38. Khadadah, M.; Mustafa, S.; Elgazzar, A. Effect of acute cold exposure on lung perfusion and tracheal smooth muscle contraction in rabbit. Eur. J. Appl. Physiol. 2011, 111, 77–81. [Google Scholar] [CrossRef]
  39. Hensel, H.; Schafer, K. Thermoreception and Temperature Regulation in Man. Recent Adv. Med. Thermol. 1984, 38, 51–64. [Google Scholar] [CrossRef]
  40. Smith, G.S.; Schoenbach, V.J.; Richardson, D.B.; Gammon, M.D. Particulate air pollution and susceptibility to the development of pulmonary tuberculosis disease in North Carolina: An ecological study. Int. J. Environ. Health Res. 2013, 24, 103–112. [Google Scholar] [CrossRef] [Green Version]
Figure 1. Time series of monthly PTB cases and meteorological factors in Xinjiang from 2004 to 2019. Abbreviations: Temp, air temperature (°C); AT, apparent temperature (°C); SD, sunshine duration (h); RH, relative humidity (%); AP, air pressure (hPa); Pre, precipitation (mm); WS, wind speed (m/s). Note: The blue dotted line represents the median.
Atmosphere 13 00533 g001
Figure 2. Spearman’s rank correlation results between the cases number of PTB and meteorological factors in Xinjiang from 2004 to 2019. Abbreviations: Temp, air temperature (°C); AT, apparent temperature (°C); SD, sunshine duration (h); RH, relative humidity (%); AP, air pressure (hPa); Pre, precipitation (mm); WS, wind speed (m/s); r s , Spearman’s rank correlation coefficient.
Atmosphere 13 00533 g002
Figure 3. The exposure-lag-response correlations between meteorological factors and PTB incidence in Xinjiang from 2004 to 2019. (AC) represent the 3–D graphs of the relationships between air temperature, relative humidity, wind speed and PTB incidence, respectively. (DF) represent the overall cumulative relative risks of air temperature, relative humidity, wind speed on PTB incidence acrosslag 0–12 months, respectively. (GI) represent the heatmaps of air temperature, relative humidity, wind speed on PTB incidence, respectively.
Atmosphere 13 00533 g003
Figure 4. The exposure-lag-response correlations between meteorological factors and the incidence of PTB in Xinjiang from 2004 to 2019. (A) represents the 3–D graph of the relationship between AT and PTB incidence, (B) represents the overall cumulative relative risk of AT on PTB incidence across lag 0–12 months, (C) represents the heatmap of AT on PTB incidence.
Atmosphere 13 00533 g004
Figure 5. The distribution of RR at various lag months with a reference of medium value 7.8 °C in Xinjiang from 2004 to 2019.
Atmosphere 13 00533 g005
Table 1. Descriptive statistics for monthly PTB cases and meteorological factors in Xinjiang from 2004 to 2019.
GroupRange x ¯ ± s Percentiles
P1P5P25P50P75P95P99
Pre0.4~34.210.1 ± 7.01.72.54.58.014.424.430.0
AP869.8~908.8898 ± 6.0888.5889.3893.0898.2903.5906.3908.3
WS1.4~3.32.3 ± 0.51.41.61.92.32.63.03.2
Temp−16.1~26.59.2 ± 12.5−14.0−10.6−1.811.321.124.625.4
RH29.1~74.748.3 ± 10.831.433.440.245.657.967.470.1
SD124.8~328.6239.6 ± 52.7145.2157.6188.1251.0286.3306.9319.8
PTB cases1194~81513427 ± 11521346193726613271410052797555
AT−20.9~25.05.7 ± 13.5−18.5−15.1−6.37.818.023.324.3
Abbreviations: Temp, air temperature (°C); AT, apparent temperature (°C); SD, sunshine duration (h); RH, relative humidity (%); AP, air pressure (hPa); Pre, precipitation (mm); WS, wind speed (m/s).
Table 2. The cumulative effects of low and high AT on the incidence of PTB by different lag period in Xinjiang from 2004 to 2019.
LagP1P5P25P75P95P99
Lag 01.81 (1.73, 1.90)1.60 (1.54, 1.67)1.22 (1.19, 1.26)0.86 (0.83, 0.88)0.77 (0.74, 0.81)0.76 (0.72, 0.80)
Lag 0–12.18 (2.06, 2.31)1.84 (1.74, 1.94)1.28 (1.22, 1.34)0.84 (0.80, 0.87)0.74 (0.70, 0.80)0.73 (0.68, 0.78)
Lag 0–22.01 (1.89, 2.14)1.67 (1.58, 1.77)1.16 (1.09, 1.22)0.86 (0.82, 0.91)0.76 (0.70, 0.84)0.75 (0.68, 0.82)
Lag 0–31.79 (1.65, 1.94)1.42 (1.32, 1.54)0.95 (0.88, 1.02)0.85 (0.78, 0.91)0.69 (0.61, 0.78)0.66 (0.58, 0.76)
Lag 0–41.61 (1.45, 1.78)1.20 (1.09, 1.32)0.74 (0.68, 0.81)0.80 (0.73, 0.89)0.58 (0.49, 0.69)0.54 (0.46, 0.65)
Lag 0–51.46 (1.29, 1.66)1.02 (0.90, 1.14)0.58 (0.53, 0.65)0.77 (0.68, 0.87)0.49 (0.40, 0.61)0.45 (0.36, 0.56)
Lag 0–61.35 (1.17, 1.57)0.88 (0.77, 1.01)0.47 (0.42, 0.53)0.75 (0.64, 0.87)0.44 (0.34, 0.56)0.39 (0.30, 0.51)
Lag 0–71.27 (1.07, 1.51)0.78 (0.67, 0.91)0.39 (0.34, 0.45)0.74 (0.63, 0.88)0.40 (0.31, 0.54)0.36 (0.26, 0.48)
Lag 0–81.21 (1.01, 1.47)0.70 (0.59, 0.84)0.33 (0.28, 0.38)0.76 (0.63, 0.91)0.39 (0.29, 0.54)0.34 (0.24, 0.48)
Lag 0–91.18 (0.95, 1.45)0.65 (0.54, 0.79)0.29 (0.24, 0.34)0.79 (0.64, 0.97)0.40 (0.28, 0.57)0.35 (0.24, 0.51)
Lag 0–101.16 (0.92, 1.46)0.62 (0.50, 0.76)0.25 (0.21, 0.31)0.84 (0.67, 1.05)0.43 (0.30, 0.63)0.38 (0.25, 0.57)
Lag 0–111.16 (0.90, 1.49)0.59 (0.47, 0.75)0.23 (0.19, 0.28)0.91 (0.71, 1.16)0.49 (0.32, 0.73)0.43 (0.27, 0.66)
Lag 0–121.18 (0.90, 1.55)0.59 (0.46, 0.75)0.22 (0.18, 0.27)1.01 (0.78, 1.31)0.58 (0.37, 0.89)0.51 (0.32, 0.82)
Publisher’s Note: MDPI stays neutral with regard to jurisdictional claims in published maps and institutional affiliations.

