Article

Decomposition and Decoupling Analysis between HDI and Carbon Emissions

1
School of Statistics and Big Data, Henan University of Economics and Law, Zhengzhou 450046, China
2
School of Statistics, Dongbei University of Finance and Economics, Dalian 116021, China
*
Author to whom correspondence should be addressed.
Atmosphere 2022, 13(4), 584; https://doi.org/10.3390/atmos13040584
Submission received: 25 February 2022 / Revised: 31 March 2022 / Accepted: 2 April 2022 / Published: 5 April 2022
(This article belongs to the Special Issue Advanced Climate Simulation and Observation)

Abstract

:
The concept of low carbon is extended to the welfare dimension by considering the relationship between carbon emissions and the Human Development Index (HDI). This paper examines the decoupling between carbon emissions per capita and HDI and the welfare output of carbon emissions by using the data from 189 countries, from 1990 to 2019, as well as decomposes the drivers of the decoupling index and carbon emissions performance (CEP) in the example countries. The results show that most countries that achieve strong decoupling have very high human development, while the worst case is that a few countries with an extremely low human development achieved strong decoupling. Moreover, the status of strong decoupling in most countries is not stable, and there is a risk of transformation to another decoupling status. Although the CEP of most countries has gradually improved, very few countries have high CEP. Economic development effects are the primary inhibitor to achieving and maintaining strong decoupling in example countries. The main drivers of CEP improvement are the carbon productivity effects in the Czech Republic, Germany, and the United Kingdom, and the economic development effects in South Korea and Turkey. The main factors inhibiting the increase of CEP are the energy intensity effect in the Czech Republic, Germany, and the UK, and the welfare effect in South Korea and Turkey. These effects are all related to GDP. Economic activity broadly affects the decoupling index and CEP. Recommendations for maintaining HDI growth and reducing carbon emissions are made for countries with different human development.

1. Introduction

In the context of global warming, the low-carbon economy with low energy consumption, low pollution, and low emissions have become the focus of global attention. In compliance with the Kyoto Protocol and the Paris Agreement, governments have taken actions to reduce carbon emissions, improve energy efficiency, and enhance their ability to cope with climate change. Despite this, global energy demand and CO2 emissions continue to increase, except in 2020 [1]. Ideally, we would like to see economic growth that is not dependent on the increase in carbon emissions, with decoupling between economic growth and carbon emissions. Therefore, revealing the decoupling process is conducive to finding critical breakthroughs in the path of global low-carbon economic development [2].
Low-carbon development is being achieved at the economic level, but it should also be extended to the welfare dimension. Based on Sen’s capability approach, the Human Development Index (HDI) is constructed to measure the combined performance of a country in health, education, and income [3]. The increase in HDI is taken as a starting point for human welfare. To achieve higher human development is the pursuit of each country. However, realizing the right to human development requires the guarantee of energy consumption and the demand for carbon emissions [4]. The 30th anniversary Human Development Report introduced a new index―Planetary pressures-adjusted HDI (PHDI), which emphasizes how human activities significantly influence the environment and ecology and place great stress on the planet. These pressures will react to human development in the form of extreme climate or species extinction, resulting in the decline or loss of HDI [5]. Therefore, studying the relationship between CO2 emissions and human development will provide policymakers with more evidence for achieving sustainable development [6].
This paper aims to analyze the decoupling between carbon emissions and HDI and the carbon welfare output of 189 countries from 1990 to 2019 and understand the drivers. First, the overall decoupling performance of 189 countries from 1990 to 2019 is analyzed. Furthermore, the evolution of decoupling trends is shown over six periods. However, the decoupling index and decoupling status are not comprehensive enough to explain the coupling relationship between carbon emissions and HDI. Therefore, the total carbon emissions and carbon emissions per capita were combined to analyze the welfare output of carbon emissions in 189 countries, namely carbon emission performance (CEP). Finally, several countries that maintained continuous decoupling and expansive negative decoupling over six periods are identified in the decoupling analysis. And LMDI analyzed the driving factors of the decoupling index and CEP.
This paper consists of five sections and is arranged as follows. The second section reviews and summarizes the relevant literature. The appropriate methods and data are described in Section 3. Section 4 shows the results of a series of methods. Section 5 summarizes the main conclusions and makes recommendations on maintaining a stable decoupling status.

2. Literature Review

2.1. Review of Decoupling Model

The decoupling model is widely used to analyze the coupling relationship between economy and resource consumption or environmental pollution. The two main decoupling models are the OECD decoupling model and the Tapio decoupling model. OECD analyzed the decoupling status of 30 member countries and confirmed the widespread decoupling between environment and economy in OECD countries [7]. Tapio adopted the concept of elasticity to dynamically reflect the decoupling relationship between variables and determined eight reasonable decoupling statuses, overcoming the difficulties in the base period selection of the OECD decoupling model [8]. Lin et al. used the OECD and Tapio decoupling model to evaluate the decoupling status between CO2 emissions and GDP in South Africa during 1990–2012 and found that the decoupling effect was gradually increasing [9]. The results of the two decoupling models have a good correlation, but the OECD decoupling model has limitations for analyzing the decoupling of sub-periods. To compare the decoupling trend between economic growth and carbon dioxide emissions in typical developed and developing countries from 1965 to 2015, Wu et al. used three decoupling models―the OECD decoupling model, the Tapio decoupling model, and the IGTX decoupling model [10]. The research has shown that the decoupling effect is stronger in developed countries than in developing countries, and the accuracy of the Tapio decoupling model is not easily limited by the length of the research period among the three decoupling models.
In the decoupling analysis between carbon dioxide and economy, the Tapio model and LMDI decomposition method are generally combined to discuss the driving factors affecting the decoupling status. Chen et al. embedded the LMDI decomposition formula in the Tapio decoupling model to study the driving factors affecting CO2 emissions in OECD countries from 2001 to 2015 [11]. The results showed that energy intensity and GDP per capita are the main factors affecting CO2 emissions, and the impact of technological factors is greater than that of non-technological factors. Yang et al. combined the LMDI decomposition model and Tapio decoupling model to analyze the determinants of decoupling between global carbon emissions and global economic growth during 2000–2017 [2]. It is found that energy conservation, production efficiency, and energy structure optimization played a positive role in the global decoupling process, while GDP per capita and population expansion played a restraining role. In general, the application of the Tapio model and LMDI decomposition model is wide. Therefore, the Tapio model and LMDI decomposition model are used in this paper to identify each country’s decoupling status and driving factors.

2.2. Review of Carbon Emissions and HDI

Most literature focuses on the relationship between energy consumption/environmental pollution and economic growth but ignores the relationship between energy/environment and human welfare. Economic growth is only one of the goals of human development. In essence, promoting human development is the ultimate goal. In the context of limited global energy resources, ensuring the effective use of energy and promoting human development is particularly important. Martínez and Ebenhack found a significant correlation between HDI and energy consumption per capita in 120 countries [12]. For some energy-poor countries with a low HDI, a small amount of energy assistance can make great strides in human development. Akizu-Gardoki et al. conducted a decoupling analysis of 126 countries from 2000 to 2014, based on Total Primary Energy Footprint and HDI, and the results showed that human welfare could be increased by reducing energy consumption [13]. According to the analytical framework of HDI, there is also research on how to formulate and implement global emission reduction policies. Pan believes that countries with a low HDI should be given priority in international negotiations on global climate change mitigation to guarantee their rights in achieving human development [4]. Hu proposed to implement global emission reduction policies according to the HDI of countries/regions and the principle that major carbon emitters take the lead in emission reduction [14]. Costa et al. used the positive correlation between HDI and CO2 emissions per capita to evaluate the cumulative CO2 emissions required to achieve high human development in developing countries and determine their respective emission reduction according to the HDI [15].
The decoupling relationship between carbon emissions and HDI is mainly studied at the levels of nation and district. Based on the Tapio decoupling model and LMDI decomposition, Chen et al. discussed the decoupling status between carbon emissions per capita and the HDI of four provinces in southwest China from 2000 to 2015 [16]. The results showed that the overall decoupling effect of southwest China was gradually increasing. Hossain and Chen demonstrated weak and strong decoupling between HDI and CO2 emissions in Bangladesh from 1990 to 2018, with economic activity being the primary driver of CO2 emissions, compared to other influencing factors [6]. Therefore, this paper expands the research perspective to the global dimension instead of studying a specific country or region. The decoupling relationship between carbon emissions and HDI can be studied from the perspective of multiple countries, and comparative analysis can be conducted among countries with the same data source.

2.3. Review of Carbon Emission Performance

Carbon productivity originated from the resource productivity in ecological economics and was later measured by consultants McKinsey & Company, in terms of GDP output per unit of CO2 emissions [17]. According to the definition of carbon productivity, carbon emission performance (CEP) measures the economic and social welfare output per unit of carbon emission [18,19]. Therefore, the welfare output of carbon emissions should be considered from the perspective of human well-being to broaden the research horizon of low-carbon development. Zhu and Liu measured the CEP of G20 countries, expressed by the ratio of HDI to carbon emission index—the average of the proportion of total carbon emission and carbon emission per capita after standardization [18]. Liu and Zhu and Hu et al., respectively, measured the carbon emission performance of G20 countries and 30 Provinces in China, but the carbon emission index only included carbon emissions per capita, without the important information of total carbon emissions [19,20]. The PHDI in the Human Development Report 2020 adjusts HDI through carbon emissions per capita and material footprint per capita to explain the pressure on the earth caused by human activities [5]. In this paper, the calculation method of Zhu and Liu and PHDI was used to construct the carbon emission performance index.

3. Methods and Data

3.1. Analysis of Decoupling

In economics, the decoupling model is usually used to study the coupling relationship between economic growth and resource consumption or environmental pollution, reflecting the sensitivity of resources and environmental pressure changes to economic changes [21]. This paper uses the Tapio decoupling model to analyze the decoupling relationship between carbon emissions per capita and HDI. Since HDI is a per capita indicator, carbon emissions per capita are selected instead of total carbon emissions. The equation is expressed as follows.
D P C , H D I = % Δ P C % Δ H D I = Δ P C / P C 0 Δ H D I / H D I 0
In Equation (1), D P C , H D I represents the decoupling index between carbon emissions per capita   P C and the Human Development Index ( H D I ), and % Δ P C and % Δ H D I represent the growth rate of carbon emissions per capita and HDI, respectively. Both Δ P C and Δ H D I represent the change of carbon emissions per capita and HDI from the base period to the end period respectively. Lastly, P C 0   and H D I 0 represent carbon emissions per capita and HDI at the base period, respectively.
According to the decoupling index, the decoupling status is divided into eight statuses: strong decoupling, weak decoupling, expansive coupling, expansive negative decoupling, weak negative decoupling, strong negative decoupling, recessive coupling, and recessive decoupling. The meanings of the eight decoupling statuses are detailed in the other literature [22].

3.2. Construction of Carbon Emission Performance (CEP)

According to the definition of CEP, HDI is used to represent welfare. The HDI data provided by the Human Development Data Center is non-continuous, and direct use may cause errors. According to the calculation method, the HDI of 189 countries from 1990 to 2019 was recalculated, but the calculation steps were omitted. Carbon emissions are expressed by Carbon Emission Index (CEI). CEI needs to consider two factors: total carbon emissions and carbon emissions per capita. Zhu and Liu standardized the ratio of total carbon emissions to the total global emissions as the total Carbon Emission Index [18]. However, the total global emissions are determined by the total carbon emissions of the sample countries, and the proportion of total carbon emissions is not stable. In this paper, the total carbon emissions and carbon emissions per capita are directly standardized. Construction of carbon emission performance is shown in Equation (2):
C E P = H D I C E I
C E I = 1 2 L n C L n 0 L n 10 , 490 , 000 L n 0 + L n P C L n 0 L n 68 , 720 L n 0
In Equation (3), C is carbon emission and P C is carbon emission per capita. The standardized method for calculating PHDI is used [5]. Zero is set as the minimum value. The maximum value is the highest value in all countries from 1990 to 2019. Therefore, the minimum value of total carbon emission and carbon emission per capita is 0. The maximum value of total carbon emission is 10.49 billion tons, observed in China in 2019, and the maximum value of carbon emission per capita is 68.72 tons, observed in Qatar in 1997. It should be noted that logarithmic standardization is meaningful only if the value of total carbon emission and carbon emission per capita is greater than 1. Therefore, the total carbon emission is expressed in 10,000 tons, and the carbon emission per capita is expressed in kilograms.

3.3. Analysis of Decomposition

Logarithmic Mean Divisia Index (LMDI) decomposes the variables into several effects and analyzes the contribution of each effect to the change in the variable [23]. This method can show the decomposition results as additivity, complete decomposition, and no residual error. The LMDI method has been widely used to decompose drivers of carbon emission due to its variety of forms and simplicity of calculation [24,25]. This paper decomposes the decoupling index and CEP by combining the Kaya Identity and the LMDI method.

3.3.1. Decomposition of Decoupling Index

Based on the idea of existing studies, the decomposition process of drivers affecting CO2 emission is determined as follows [6,16]:
P C = C F × F E × E G D P × G D P P
where, C F = C F , F E = F E , E G = E G D P , G P = G D P P
In Equation (4), C represents total carbon emissions, F represents fossil fuel consumption (oil, natural gas, and coal), E represents primary energy consumption, G D P represents total economic output, and P represents the size of the population. C F represents the carbon emission intensity of fossil fuel. F E represents the structure of energy consumption. E G represents energy intensity. G P represents GDP per capita. Equation (4) can be transformed into:
P C = C F × F E × E G × G P
According to the LMDI model, the change of carbon emissions per capita from the base period (0 period) to the reporting period (T period) is shown in Equation (6).
Δ P C = P C t P C 0 = C F t × F E t × E G t × G P t C F 0 × F E 0 × E G 0 × G P 0 = Δ C F + Δ F E + Δ E G + Δ G P
Δ C F = L n C F t C F o × P C t P C 0 L n P C t l n P C 0
Δ F E = L n F E t F E 0 × P C t P C 0 L n P C t l n P C 0
Δ E G = L n E G t E G 0 × P C t P C 0 L n P C t l n P C 0
Δ G P = L n G P t G P 0 × P C t P C 0 L n P C t l n P C 0
In Equation (6), Δ C F represents the carbon intensity of fossil fuel effect, Δ F E represents the energy structure effect, Δ E G represents energy intensity of fossil fuel effect, and Δ G P represents economic development effect. The four effects from the base period to T period are calculated based in Equations (7)–(10).
By combining the Tapio decoupling model with the LMDI method, the decoupling index from the base period (0 period) to the reporting period (T period) can be expressed by Equation (11).
D P C , H D I = % Δ P C % Δ H D I = Δ P C / P C 0 Δ H D I / H D I 0 = Δ P C × H D I 0 Δ H D I × P C 0
= Δ C F + Δ F E + Δ E G + Δ G P × H D I 0 Δ H D I × P C 0
= Δ C F × H D I 0 Δ H D I × P C 0 + Δ F E × H D I 0 Δ H D I × P C 0 + Δ E G × H D I 0 Δ H D I × P C 0 + Δ G P × H D I 0 Δ H D I × P C 0  
= D C F + D F E + D E G + D G P  
In Equation (11), the decoupling index of carbon emissions per capita and HDI is divided into four components. D C F , D F E , D E G , and D G P represent the decoupling index of Δ C F , Δ F E , Δ E G , and Δ G P , respectively.

3.3.2. Decomposition of CEP

Similarly, the Kaya Identity and the LMDI method are used to decompose the driving factors of CEP. The decomposition form is shown in Equation (12).
C E P = C E P G D P × G D P C × C F × F E × E G D P × G D P P × P
where, C G = C E P G D P , G C = G D P C ,   C F = C F ,   F E = F E , E G = E G D P , G P = G D P P , P = P O P .
In Equation (12), C G represents the contribution to CEP per unit of economic growth. G C represents the economic output per unit of carbon emissions, i.e., carbon productivity. C F , F E , E G , and G P are the same as in Equation (4), respectively. P denotes the size of the population. Equation (12) is simplified into the following form:
C E P = C G × G C × C F × F E × E G × G P × P
The change of CEP from 0 period to T period is expressed as Equation (14).
                                    Δ C E P = C E P t C E P 0 = Δ C G + Δ G C + Δ C F + Δ F E + Δ E G + Δ G P + Δ P
Δ C G = L n C G t C G o × C E P t C E P 0 L n C E P t l n C E P 0
Δ G C = L n G C t G C 0 × C E P t C E P 0 L n C E P t l n C E P 0
Δ C F = L n C F t C F 0 × C E P t C E P 0 L n C E P t l n C E P 0
Δ F E = L n F E t F E o × C E P t C E P 0 L n C E P t l n C E P 0
Δ E G = L n E G t E G 0 × C E P t C E P 0 L n C E P t l n C E P 0
Δ G P = L n G P t G P 0 × C E P t C E P 0 L n C E P t l n C E P 0
Δ P = L n P t P 0 × C E P t C E P 0 L n C E P t l n C E P 0
In Equation (14), Δ C G represents the welfare effect, Δ G C represents the carbon productivity effect, and Δ P represents the population effect. The terms Δ C F , Δ F E , Δ E G , and Δ G P are the same as in Equation (6), respectively. The seven effects from the base period to T period are calculated based on Equations (15)–(21).

3.4. Data

Frequently used data on carbon emissions are taken from BP statistics. But data for just over 70 countries is not enough to give a complete picture of global carbon emissions. The carbon emissions data used in this paper are from the Global Carbon Project, which mainly refers to the carbon emissions generated by burning fossil fuels within the national territory [26]. UNDP also uses carbon emissions data from the Global Carbon Project to calculate PHDI [5]. BP Statistical Review of World Energy 2021 provides a long period of energy consumption data for the decomposition analysis of countries with certain characteristics [1]. The GDP data derived from World Development Indicators is updated in March 2021 [27]. Population data were derived from the World Population Prospects: The 2019 Revision [28]. Raw data on health, education, and income were obtained from the Human Development Data Centre to recalculate the HDI [29]. The variable definitions and sources are shown in Table 1.

4. Result

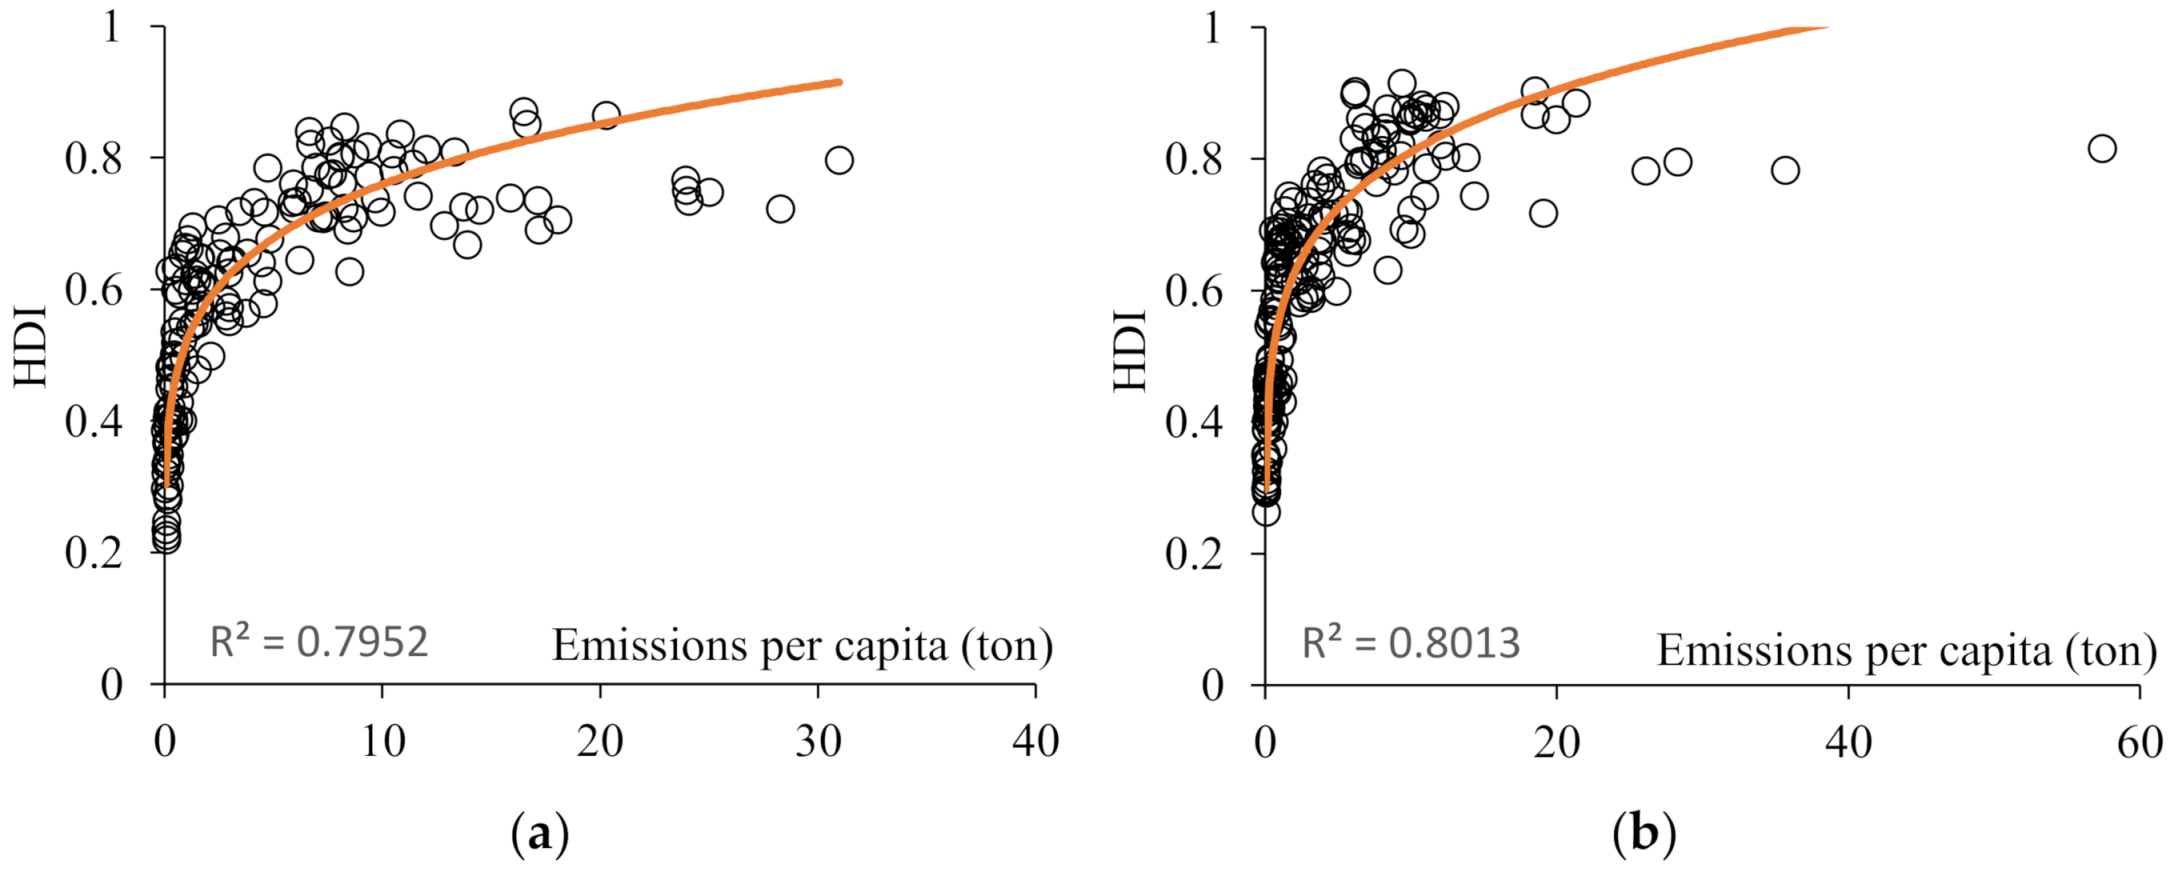
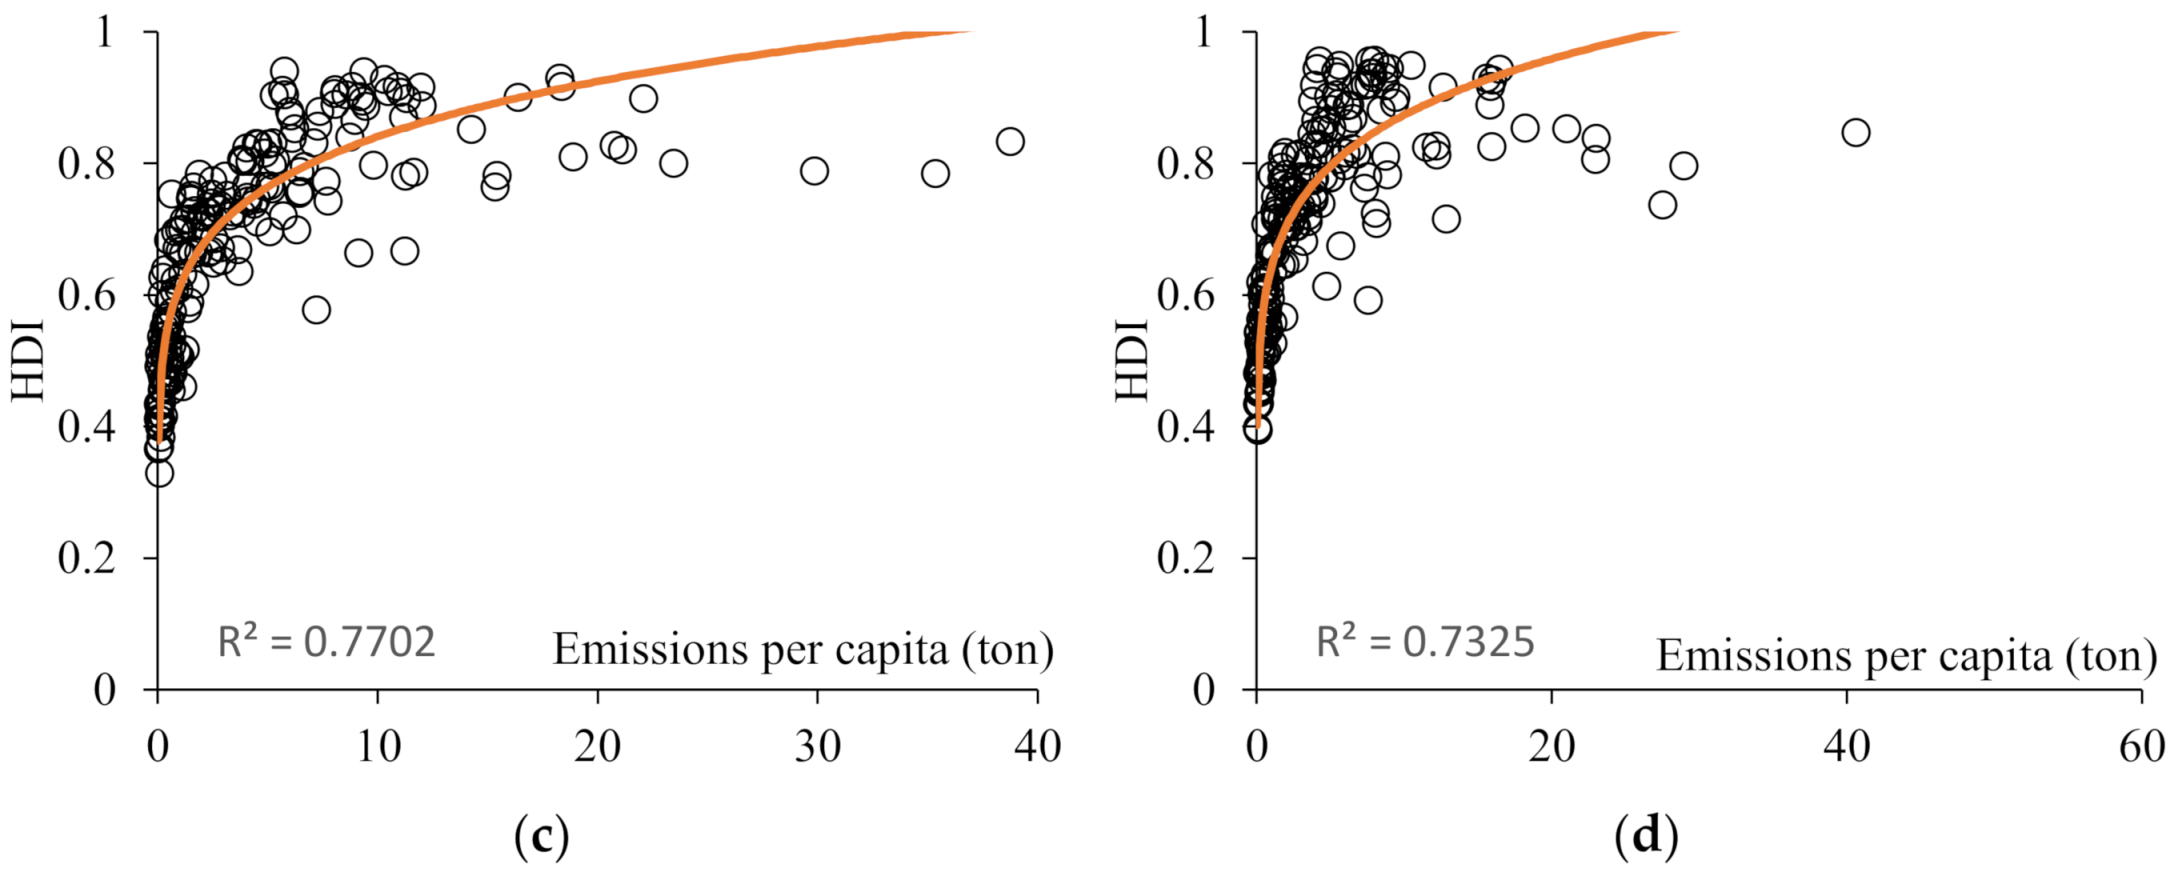
4.1. Relationship between Carbon Emissions Per Capita and HDI

Figure 1 depicts the corresponding relationship between CO2 emissions per capita and the HDI for four years. There is a strong correlation between CO2 emissions per capita and the HDI. The figures show a power–exponential relationship, that is, with the increase of HDI, the increase of carbon emissions per capita is gradually accelerating. Carbon emissions per capita of countries with extremely low HDI are minor, and the growth is flat. When countries achieve medium, high, and very high human development, the growth rate of carbon emissions per capita begins to accelerate. This indicates that the demand for carbon emissions and the carbon emissions per capita will gradually increase for the country to achieve a higher level of human development. The non-linear relationship between CO2 emissions per capita and HDI is consistent with Costa et al., who found an exponential relationship between CO2 emissions from fossil fuels and HDI [15].
It can also be seen from Figure 1 that the CO2 emissions per capita of countries with extremely low HDI are relatively close, with little difference between countries. As the HDI of countries gradually increases, differences in carbon emissions per capita become apparent. The differences in emissions per capita among countries are most remarkable at very high human development. Since 1990, emissions per capita by the poorest half of the world’s population have only slightly increased, from 1.2 tons to 1.6 tons [30]. For countries with high levels of human development, their carbon emissions per capita are different, and they follow different development paths. Some countries will achieve high human development at the cost of large carbon emissions. Some countries will aim at low-carbon development, improving emission-reduction technologies, and developing new energy sources to achieve high human development.

4.2. Analysis of Decoupling between Carbon Emissions Per Capita and HDI

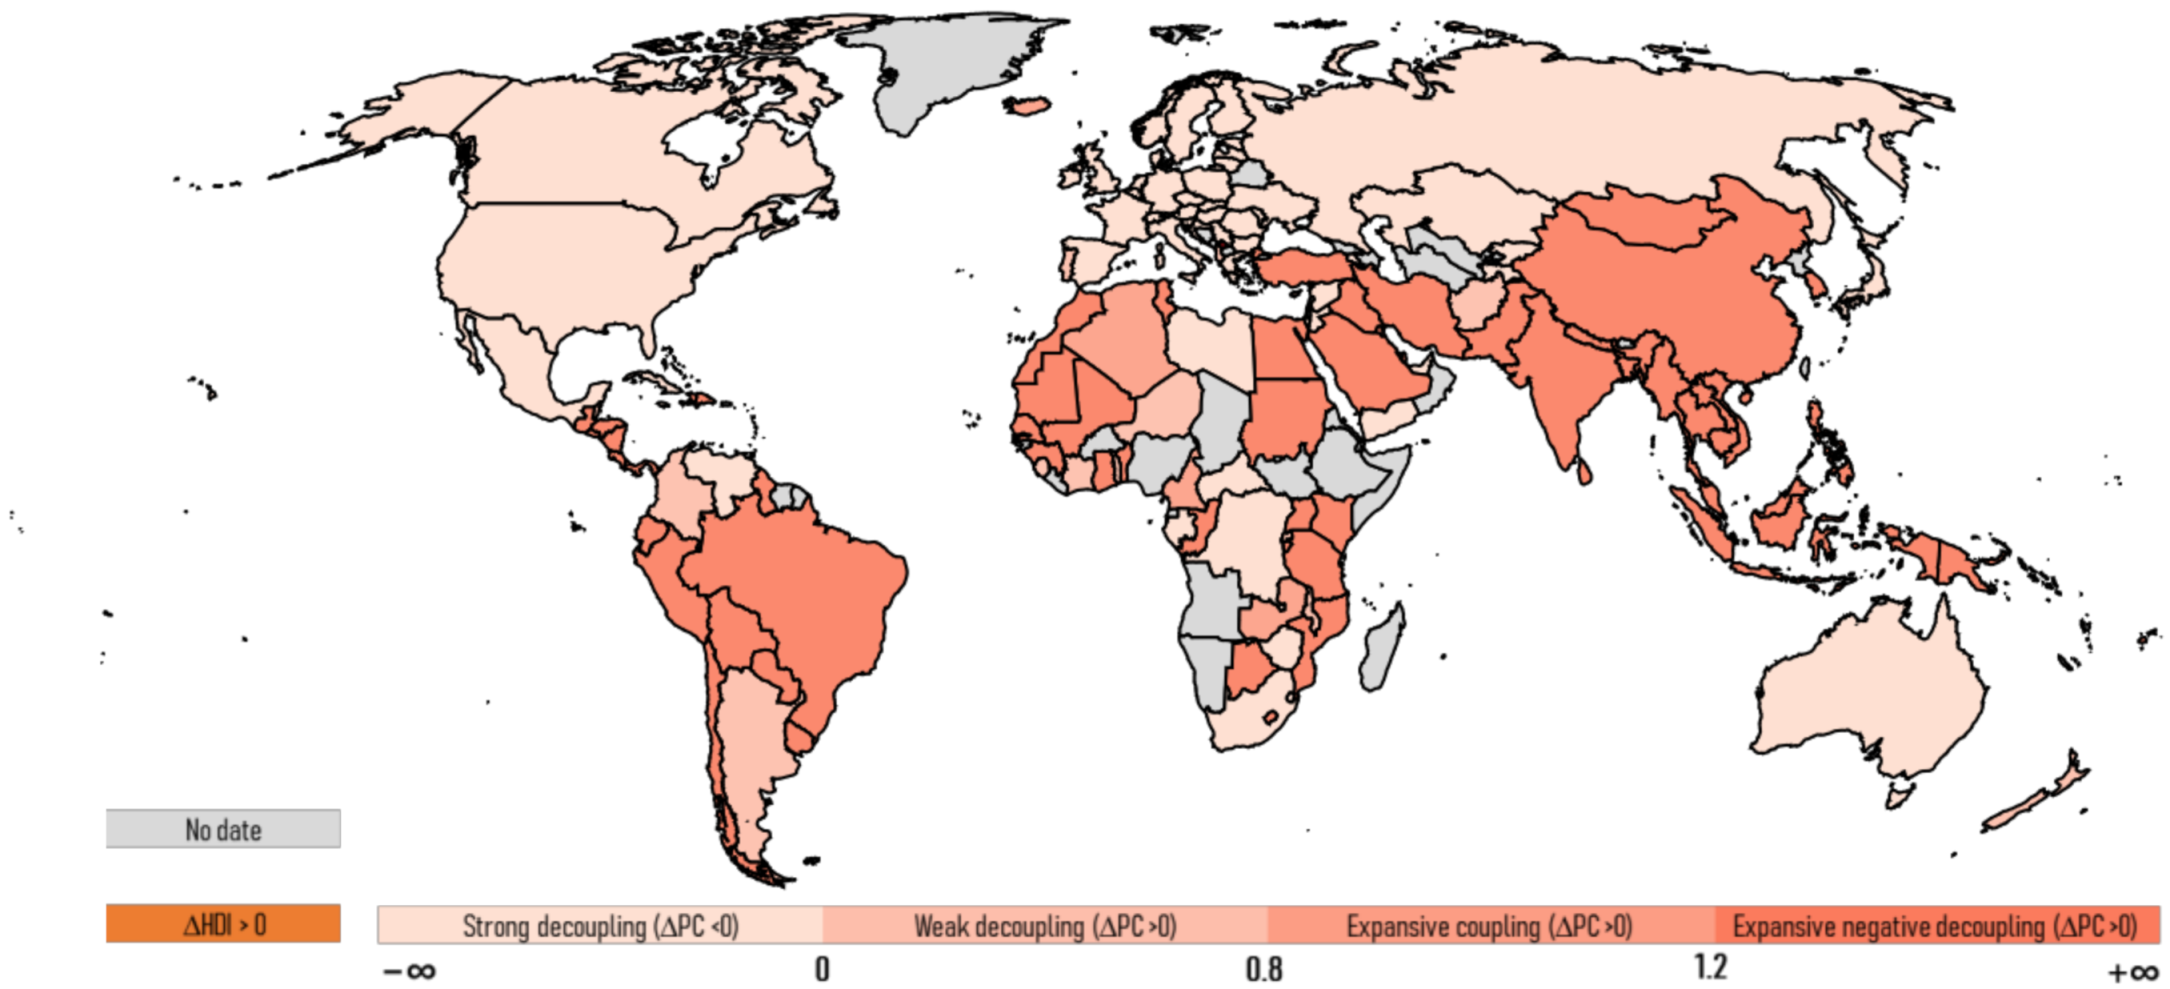
4.2.1. Decoupling between Carbon Emissions Per Capita and HDI, 1990–2019

It is the right of every country to achieve high human development. Carbon emissions should be targeted to increase the HDI. If carbon emissions per capita increase without increasing the HDI, this may indicate that no effort has been made to reduce carbon emissions. Countries with strong decoupling and very high human development are considered to have achieved positive decoupling. However, countries that do not achieve very high HDI and strong decoupling are referred to as negative decoupling.
As shown in Figure 2, no country experienced negative growth HDI from 1990 to 2019. HDI data for 1990 are missing for 46 countries, and 59 countries out of the 143 are strongly decoupling. In addition, 40 countries are positively decoupling whereas 19 countries are negative decoupling. Negative decoupling is not a good thing for countries with extremely low HDI. These countries are the Central African Republic, the Democratic Republic of Congo, and Yemen. Their HDI is still at low human development after 29 years, due to constant war and political unrest. Because of their weak industrial base and poor infrastructure, they are strongly decoupling with low carbon emissions and low energy consumption. Much investment is needed to develop in the future due to the low starting point.
In total, 63 countries are expansive negative decoupling, meaning carbon emissions per capita are growing much faster than HDI. Most of the 63 countries are at high or medium human development, and 11 countries with very high HDI are expansive negative decoupling, such as South Korea, Kuwait, and Qatar. Achieving high HDI growth comes at the cost of high carbon emissions per capita.

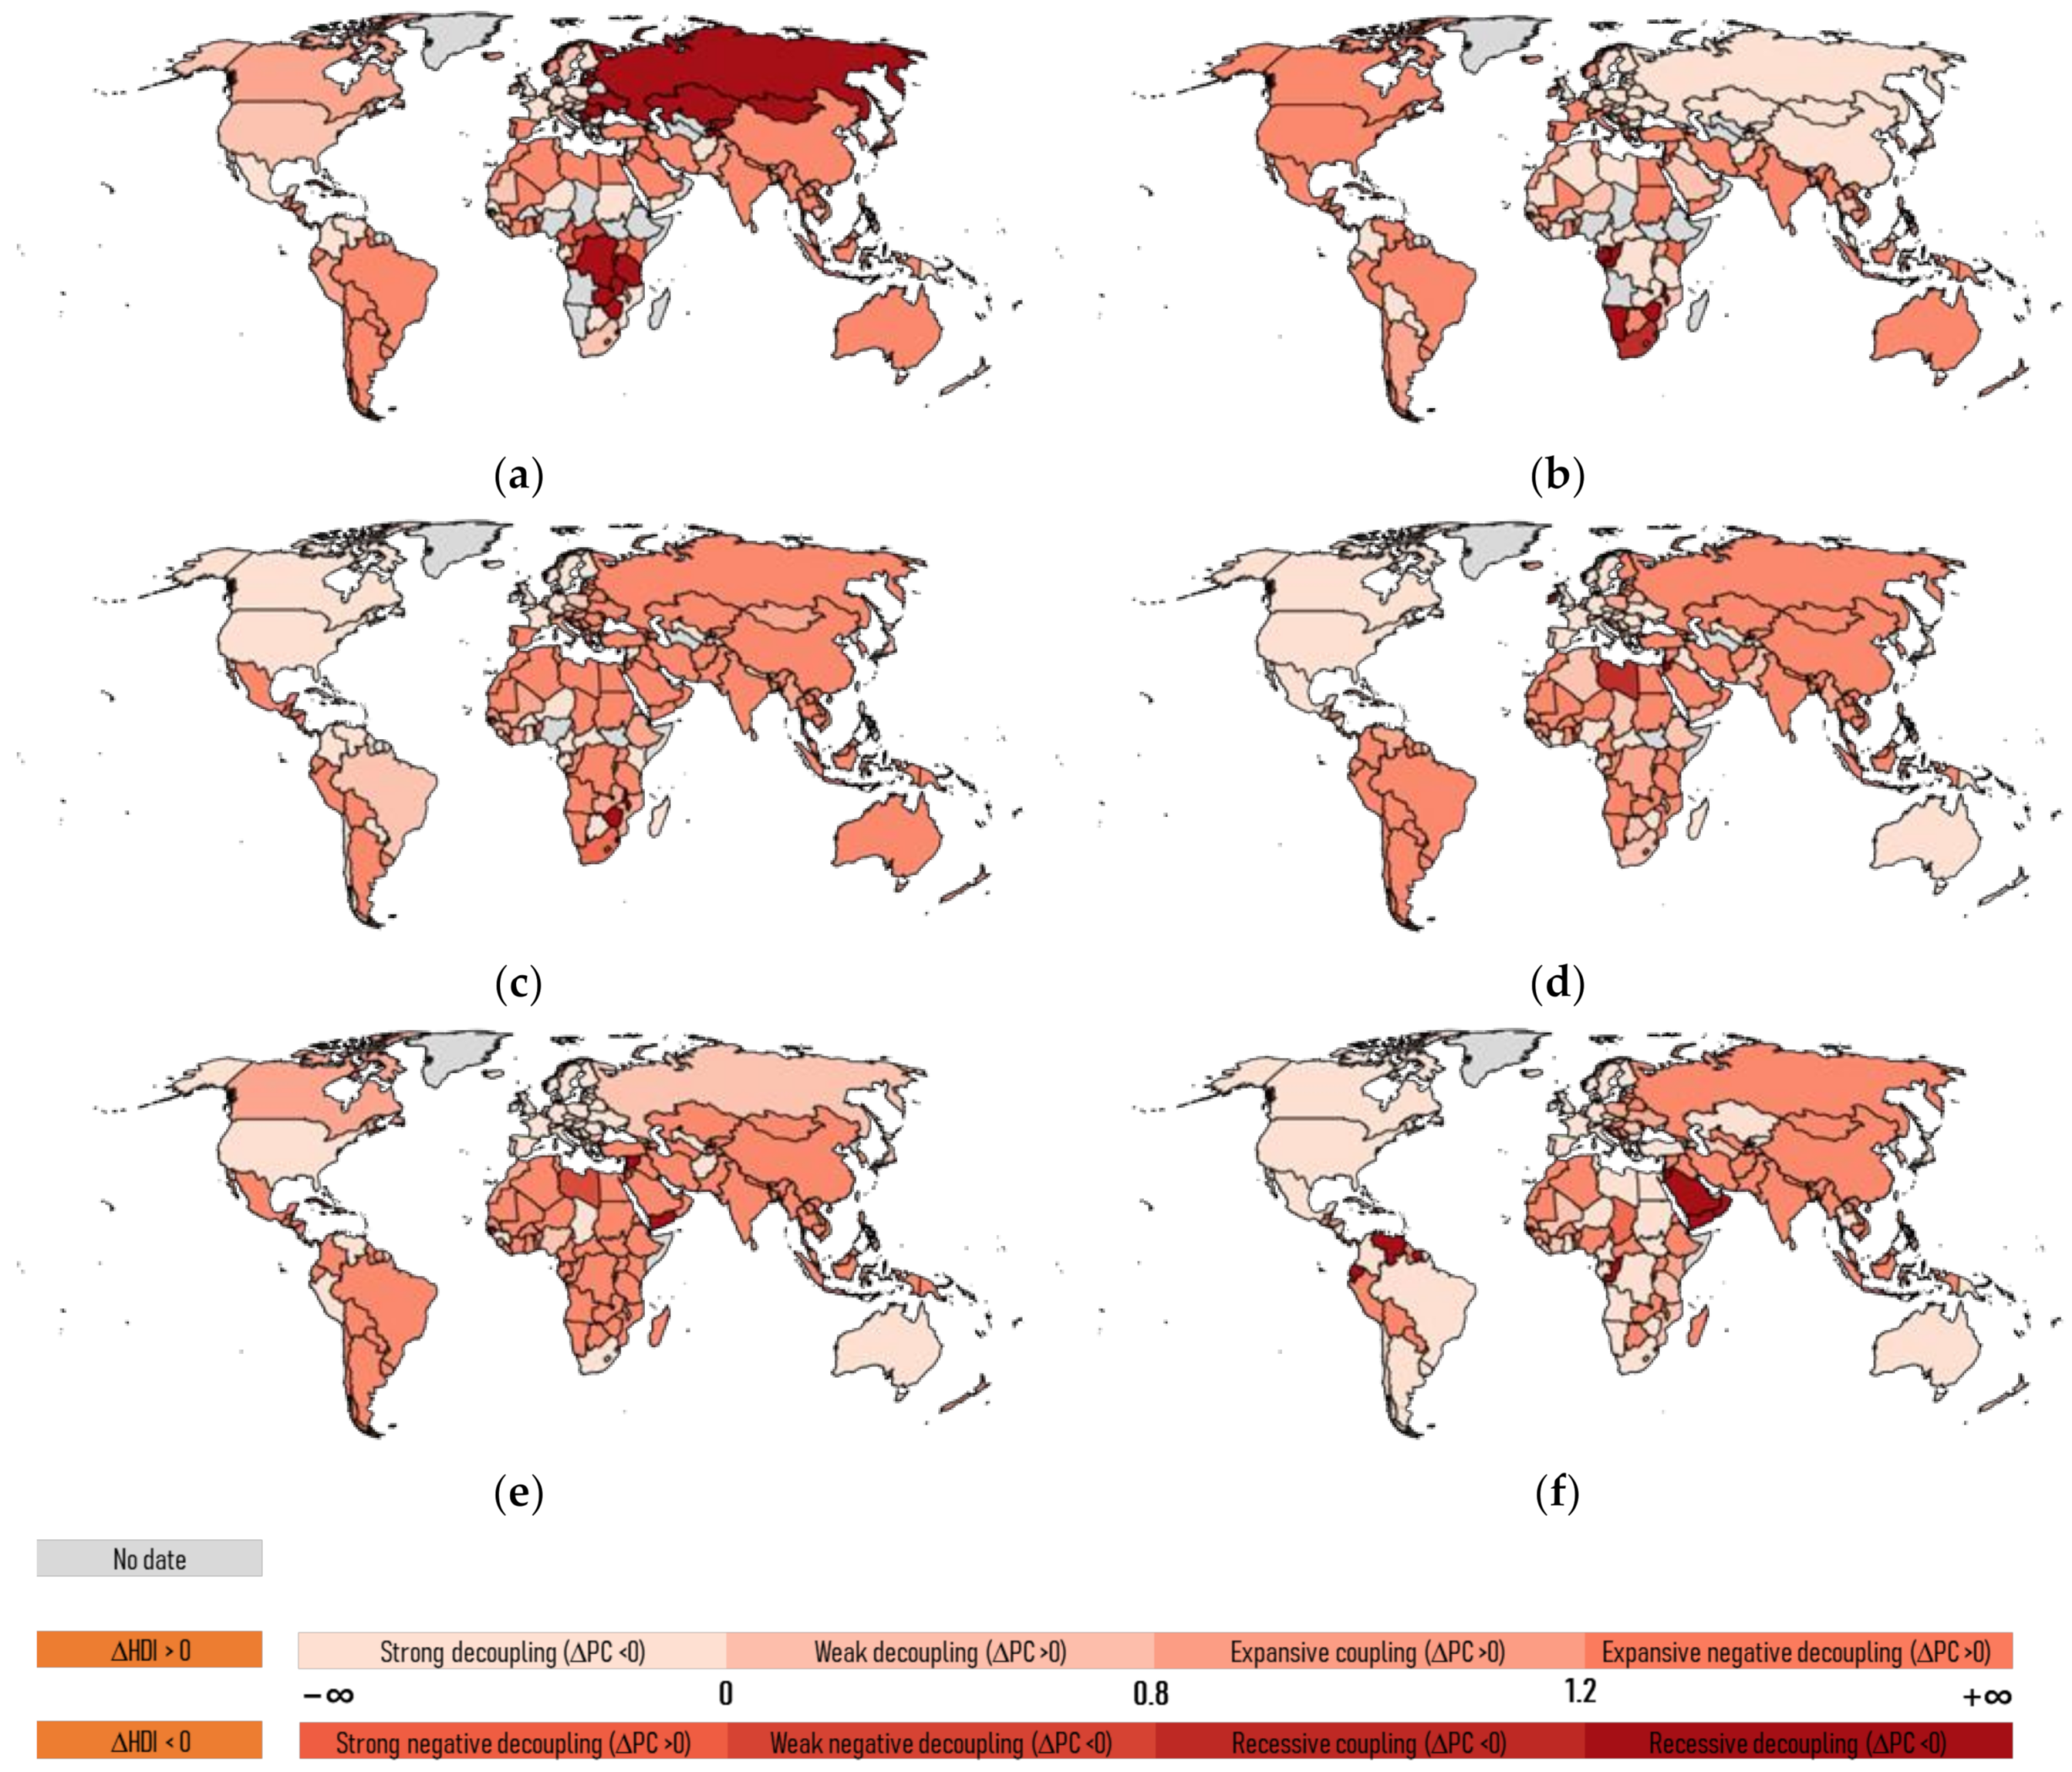
4.2.2. Evolution of the Decoupling between Carbon Emissions Per Capita and HDI

The whole observation period from 1990 to 2019 is divided into six sub-periods. The decoupling index between carbon emissions per capita and HDI is calculated to analyze the change in the decoupling status in each period. As shown in Figure 3, the decoupling status of countries changed significantly over the six periods. Most countries have maintained positive HDI growth. In general, the main decoupling statuses are strong decoupling, weak decoupling, expansive coupling, and expansive negative decoupling. The proportion of countries with these four decoupling statuses is between 80% and 97%.
Four undesirable decoupling status will emerge if some countries experience negative HDI growth. The worst status is recession decoupling. A significant decline in HDI has accompanied the reduction in carbon emissions per capita. There were more countries with recessive decoupling in the first period. The main countries are the Russian Federation, Cuba, and Mongolia, which were more affected by the collapse of the Soviet Union. Other countries are in Sub-Saharan Africa. In the later periods, the countries with recessive decoupling were mainly in Sub-Saharan Africa, the Middle East, and Latin America. Based on the experience of most countries, the decoupling status between carbon emissions per capita and HDI experienced an evolutionary trend: expansive negative decoupling, expansive coupling, weak decoupling, and strong decoupling. Strong decoupling in the early period is unsuitable for countries with extremely low HDI, which requires vast investments later. However, there has been a shift from recessive decoupling to expansive coupling and expansive negative decoupling for some countries with extremely low HDI (Rwanda, Tanzania, and Zambia).
Overall, the proportion of countries with strong decoupling and weak decoupling continues to rise, while the proportion of expansive coupling and expansive negative decoupling is declining. Although the relationship between HDI and energy consumption has entered a new phase in most countries, the status of strong and weak decoupling is unstable. Strong decoupling and weak decoupling carry the risk of shifting to other status of decoupling. In addition, economic, social, political, and resource factors vary among countries, and the unbalanced trend of economic growth and carbon emissions will continue in the future. Solving these problems requires the concerted efforts of the whole world.
Only three countries (the Czech Republic, Germany, and the United Kingdom) have sustained positive decoupling over the six periods. They reduce carbon emissions while maintaining relatively high HDI. Five countries (Mauritius, Panama, South Korea, Turkey, and Uruguay) with high HDI are expansive negative decoupling over at least five periods. Their growth rate of carbon emissions per capita is larger than their HDI. These countries emit more carbon dioxide without a corresponding increase in the HDI.

4.3. Evolution and Two-Dimensional Analysis of Carbon Emission Performance

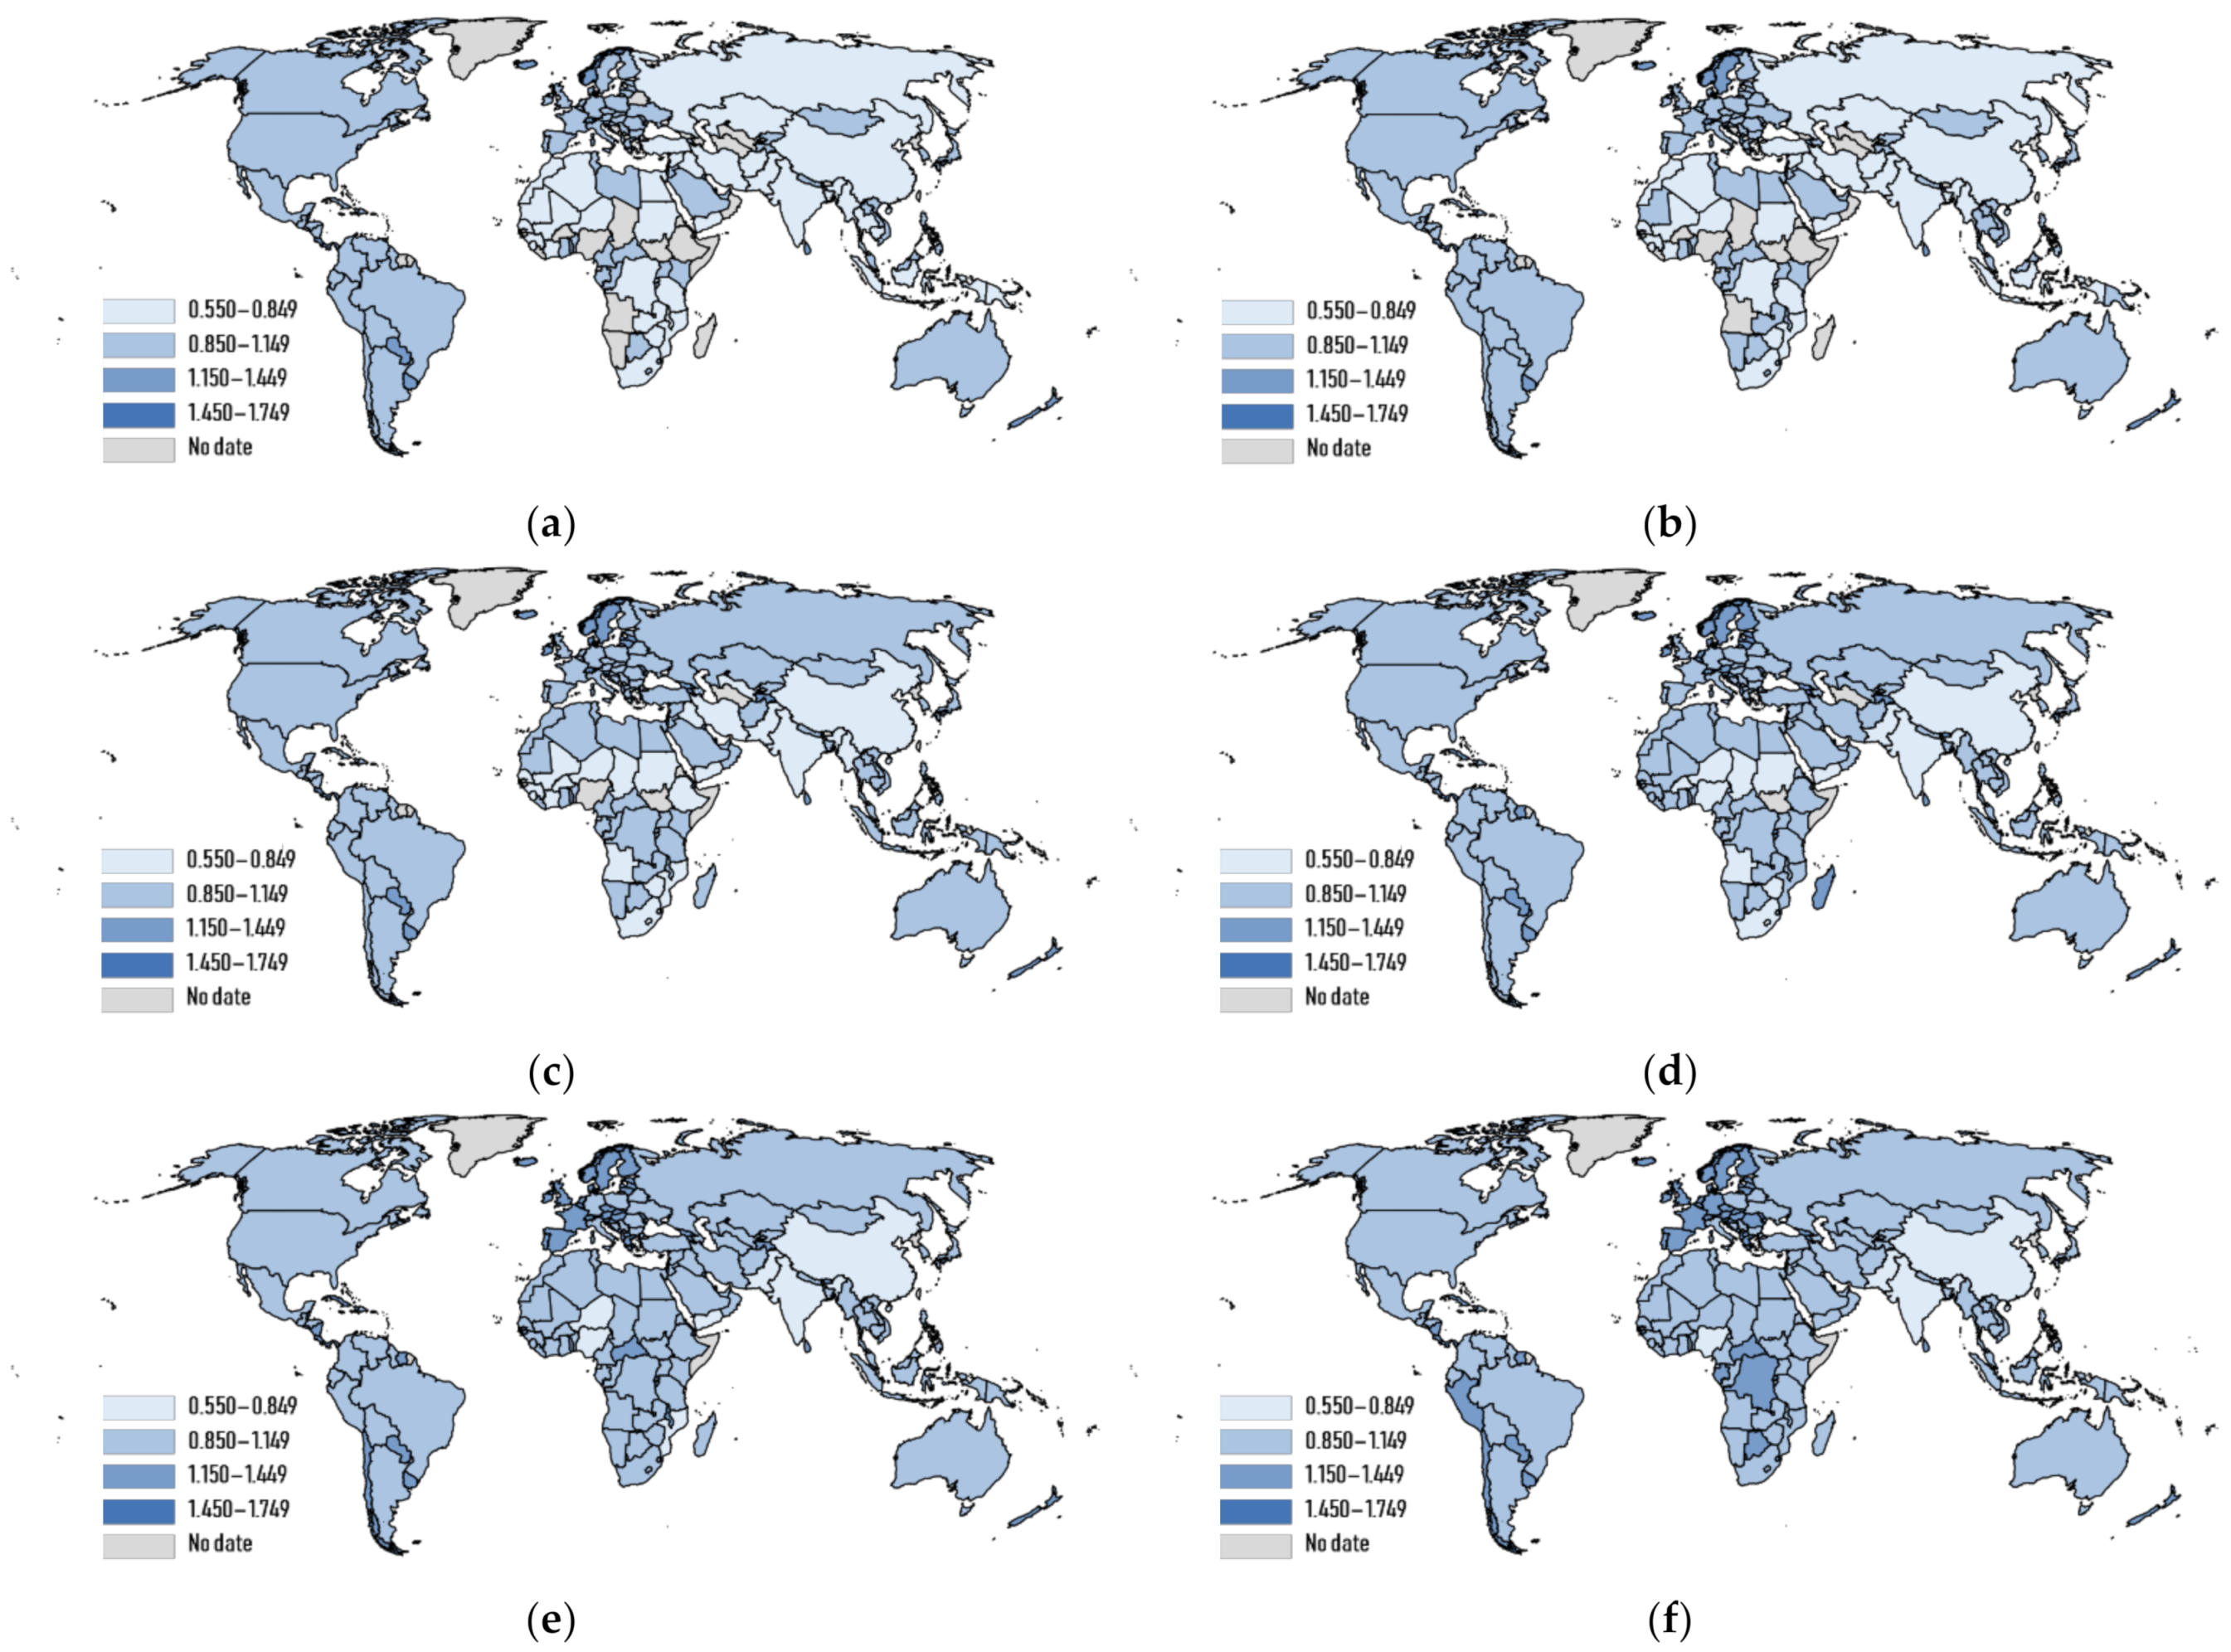
4.3.1. Results of Carbon Emission Performance Measurement from 1990–2019

Figure 4 shows the evolution of countries’ carbon emission performance in 1990, 1996, 2002, 2008, 2014, and 2019. As shown in Figure 4, there are more and more countries with dark colors. The carbon emission performance of countries is gradually increasing.
Countries showing significant increases in carbon emissions performance (50% above from 1990 to 2019) include the Democratic Republic of Congo, Mozambique, Niger, Rwanda, and Sierra Leone, all in sub-Saharan Africa. The most considerable increase was in Rwanda, where CEP increased by 99.89%. In 1990, the total and carbon emissions per capita in Rwanda were 0.52 million tons and 0.0719 tons, respectively. The total and per capita emissions in 2019 were 1.19 million tons and 0.094 tons in Rwanda, respectively. The carbon emission index increased by only 9.69%, whereas the HDI doubled by 119.26%. This result is consistent with the transition of Rwanda’s decoupling status. Rwanda started with a deficient level of economic and human development. In the long term, economic growth has accelerated, life expectancy has improved significantly, and primary education has developed significantly in Rwanda. Thus, the increase in HDI results from the overall improvement in all aspects.
Carbon emissions performance declined in 14 countries. The most significant decrease in CEP was recorded in Laos. Total carbon emissions were 0.51 million tons, and carbon emissions per capita were 0.1205 tons in 1990. Total and carbon emissions per capita were 33.93 million tons and 4.7328 tons in 2019, respectively. The carbon emission index of Laos increased by 72.15%, and the human development index increased by 51.35%. The growth of HDI is less than that of carbon emissions. Laos achieved an increase in HDI at the cost of environmental pollution.
The carbon emission performance for the six years was a normal distribution. The majority of countries (73–96%) are at the middle intervals (0.85–1.449). Only a tiny proportion of countries (4–27%) are at the two ends of the interval. The number of countries with CEP at 0.85–1.149 is the greatest, but the proportion has gradually decreased, from 63.64% in 1990 to 53.44% in 2019. The proportion of countries with CEP at 1.15–1.449 gradually increased, rising from 9.79% in 1990 to 42.33% in 2019. The proportion of countries with CEP at 0.55–0.849, mainly in South Asia and Sub-Saharan Africa, fell from 25.17% in 1990 to 2.12% in 2019. Carbon emission performance has been significantly improved, and there are fewer and fewer countries with low carbon emission performance. Although the proportion of countries with CEP at 1.45–1.749 increased to 2.12% in 2019, the number of countries with high CEP is still minimal. There are only four countries (Kiribati, Liechtenstein, Micronesia, and Tonga) with CEP at 1.45–1.79, and their CEP is relatively stable.

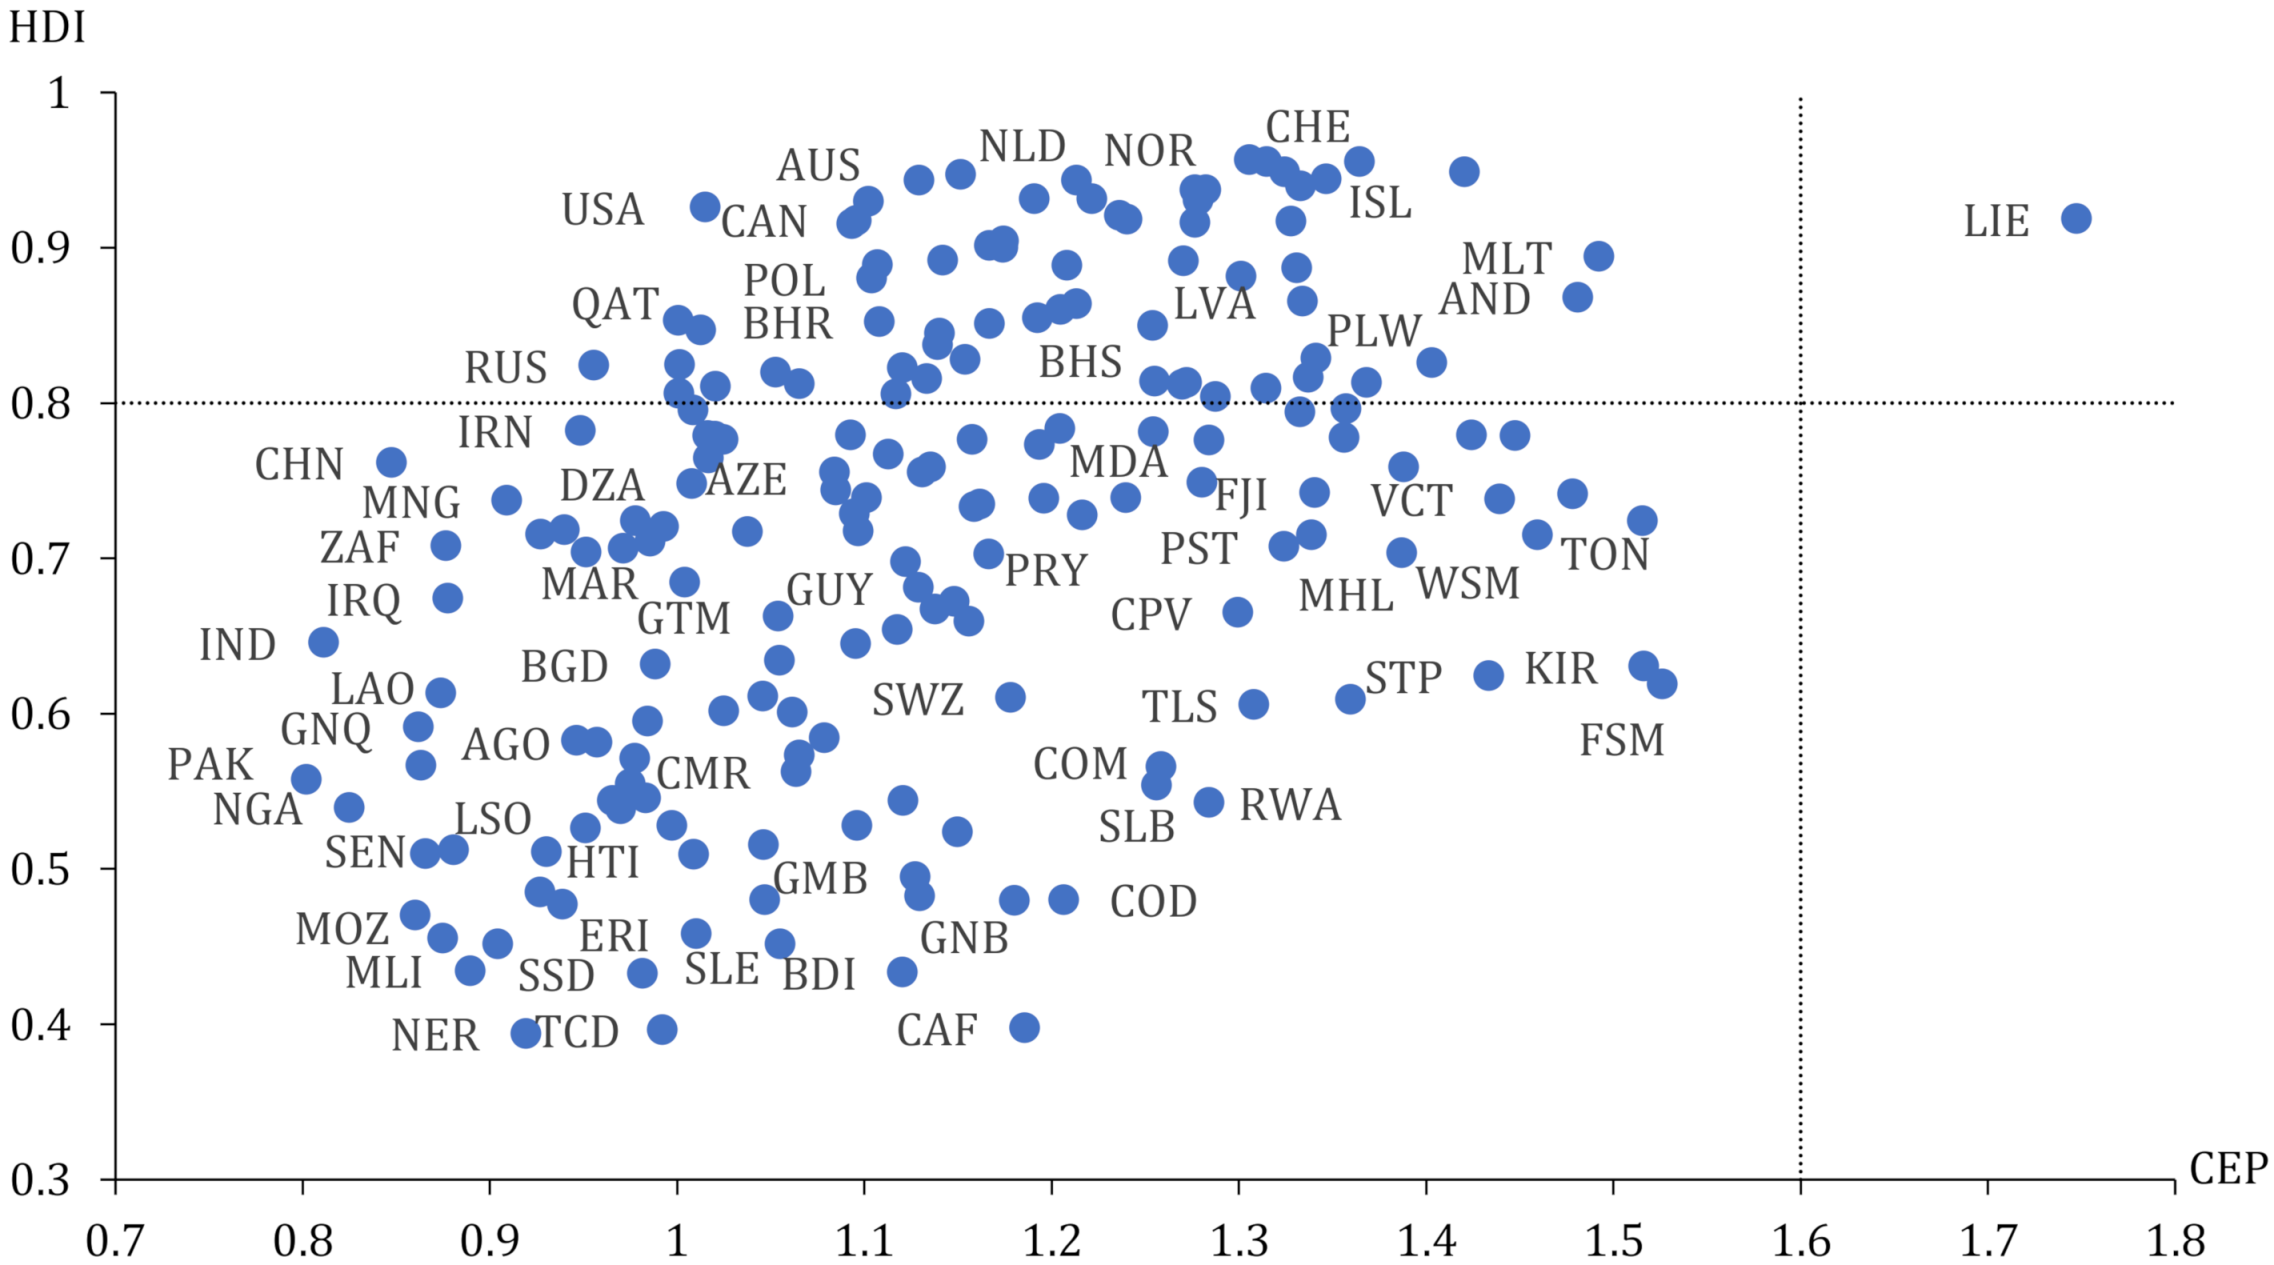
4.3.2. Two-Dimensional Analysis Based on HDI and Carbon Emission Performance

The HDI ranges from 0 to 1. The UNDP considers countries with HDI above 0.8 to be very high in human development. The country with the highest CEP is Liechtenstein, with CEP at 1.7471 in 2019. Referring to the analysis method of Zhu and Liu, the upper limit of CEP is set as 2 [18]. According to the classification of HDI, countries with CEP at the top 20% (above 1.6) are regarded as countries with high CEP. The two-dimensional analysis of HDI and CEP in 2019 was performed. Countries can be divided into four types based on the set thresholds: (a) high HDI and high CEP; (b) high HDI and low CEP; (c) low HDI and low CEP; (d) low HDI and high CEP.
As shown in Figure 5, only Liechtenstein has a high HDI and high CEP, which is an ideal state. There are 65 countries with high HDI and low CEP, such as the United States, Norway, Canada, and other developed countries, mainly centered in Europe, Central Asia, and North America. These countries with a very high HDI enjoy better economic and social development. Development should focus on maintaining economic growth while reducing environmental pollution. These countries need to improve emission reduction technologies, develop new renewable energy sources, and optimize industrial structures to achieve energy conservation and emission reduction. The number of countries with low HDI and low CEP is the largest, over 65%, and includes developing countries such as China and India, and least-developed countries, such as Lesotho and Yemen. These countries are in the stage of comprehensive development. They not only need to meet the energy needs to promote the economy and society, but also need to control carbon emissions, and face the dual challenges of economic and social development and environmental sustainability. There are currently no countries with low HDI and high CEP. The fourth type will not appear based on the exponential relationship between carbon emissions per capita and HDI.

4.4. Decomposition of Drivers

As known from Section 4.2, only the Czech Republic, Germany, and the United Kingdom have maintained continuous strong decoupling over the six periods. The status of decoupling is unstable for most countries, and it is a challenge to sustain strong decoupling for a long time. Therefore, it is necessary to understand the drivers of the decoupling index and CEP of exemplary countries. In addition to the three countries with continuous positive decoupling, the carbon emission paths of five countries with expansive negative decoupling were studied. However, the data for Mauritius, Panama, and Uruguay were not available, and so the decomposition analysis is only for South Korea and Turkey, to explore why they have not yet achieved strong decoupling.

4.4.1. Decomposition of the Decoupling Index

Combining the Tapio decoupling model with the LMDI decomposition model, the decoupling index between carbon emissions per capita and HDI can be understood from the carbon intensity of fossil energy effect, energy structure effect, energy intensity effect, and economic development effect. The smaller decoupling index indicates the lower dependence of HDI growth on energy consumption for strong decoupling status. The strong decoupling index gets smaller and smaller only when the four effects are negative. That is, the contribution rate of the four effects is positive. As shown in Table 2, the decoupling index is becoming smaller, and the strong decoupling effect is increasing in the Czech Republic, Germany, and the UK. The main factors influencing the decoupling index are the same for all three countries. The main contributing factor is the energy intensity effect, indicating high energy use efficiency. On the other hand, the economic development effect is the main inhibiting factor, indicating an increase in carbon emissions in daily life with the popularization of energy-consuming consumer goods. But the contribution of the economic development effect tends to decrease.
In order to transform from expansive negative decoupling to strong decoupling, South Korea and Turkey need to make the decoupling index as small as possible under the premise of positive HDI growth. In other words, all four driving factors are guaranteed to be negative, i.e., the contribution rate is positive. As seen in Table 1, the decoupling index for Korea has decreased in a fluctuating way but has not yet reached weak and strong decoupling. For Korea, the carbon intensity of fossil energy was the main factor contributing to the decline in the decoupling index during the 1990–1995 and 1995–2000 periods. The main factors in the last four periods are transformed into energy intensity. Economic development effects have been the primary inhibitor to transition to weak and strong decoupling for South Korea. Similarly, Turkey’s decoupling index has declined, even to the threshold of strong decoupling in the 2015–2019 period. However, the main factors affecting the decline in the decoupling index are different in each period, indicating that some efforts have been made to optimize energy consumption structure and improve energy efficiency. The factor inhibiting the decrease of the decoupling index is always the effect of economic development.

4.4.2. Decomposition of the CEP

As shown in Table 3, the carbon productivity effect, economic development effect, and population effect are positive in most periods for these five countries, indicating that the three effects positively impact the improvement of CEP. But the role of the population effect is relatively small. In most periods, the welfare effect, the carbon intensity of fossil fuels effect, the energy structure effect, and the energy intensity effect are negative. The welfare effect is negative, which means the low CEP is generated by unit economic output growth. The latter three effects are related to the energy utilization, energy structure, and efficiency of fossil fuels, and the negative effects indicate the need to adjust the energy structure further and reduce energy consumption. However, the main influencing factors are different for different countries.
The CEP of the Czech Republic, Germany, and the United Kingdom are primarily similar and gradually increased from around 0.95 in 1990 to 1.2 in 2019, with a growth rate of around 25%. The main influencing factors for the three countries are also the same. The carbon productivity effect is the primary driver of the improvement in CEP. The higher the carbon productivity, the greater the economic output per unit of carbon emissions, representing the progress of emission-reduction technologies in economic development. The main driving factor that inhibits CEP is the energy intensity effect, which indicates that economic growth is highly dependent on primary energy, and new energy needs to be developed to improve energy efficiency.
The CEP of South Korea was 0.95 in 1990. It was 1.09 in 2019, an increase of only 14.74%. The CEP of Turkey was 0.8 in 1990, a low starting point, and then increased significantly to 1.05, at an increase of 31.25%. The main drivers in the two countries are slightly different. In South Korea, it is clear that the most significant positive effect of increasing CEP is the economic development effect, and the most significant negative effect is the welfare effect. Other effects are not significant. The economic development and the living standard in South Korea have greatly improved, which has played a leading role in the improvement of CEP. However, South Korea’s economic growth has not promoted the overall welfare improvement very well, resulting in a potent inhibitory effect on the welfare effect. Although the main positive and negative effects in Turkey are also economic development effects and welfare effects, respectively, the contribution rate is not significantly prominent. The facilitation of carbon productivity effects and the inhibition of energy intensity effects also play a role. As a result, CEP in Turkey has been greatly improved. Overall, South Korea and Turkey should focus on energy efficiency and improve the development of emission-reduction technologies.

5. Conclusions and Recommendations

5.1. Conclusions

This paper examines the decoupling between carbon emissions and HDI and the CEP. Combining the Tapio decoupling model and the LMDI decomposition model, it is found that the decoupling status and CEP of various human development countries are different. Due to data availability, only the drivers of the decoupling index and CEP for the example countries are decomposed. The main findings of the study are as follows:
  • There are noticeable differences in the decoupling status of countries with different human development. The countries that achieve strong decoupling mostly have very high human development. A few countries with extremely low human development have achieved strong decoupling, which is not an ideal decoupling status. Only three countries are sustaining strong decoupling. The strong decoupling status in most countries is unstable, and there is a risk of transition to another decoupling status.
  • Overall, the CEP of most countries shows a gradual upward trend. Countries with high human development and low CEP are mainly in Europe, Central Asia, and North America. Most countries with low human development and low CEP face the dual challenges of welfare growth and environmental sustainability.
  • The main contributing factor of strong decoupling in the Czech Republic, Germany, and the United Kingdom is the energy intensity effect, while the main inhibitory factor is the economic development effect. The economic development effect is the main inhibiting factor for South Korea and Turkey, which causes South Korea and Turkey to be unable to shift from expansive negative decoupling to strong decoupling. For the Czech Republic, Germany, and the United Kingdom, the main driving force of improvement in CEP is the carbon productivity effect, and the main inhibitory effect is the energy intensity effect. The main positive effect of promotion in South Korea and Turkey is the economic development effect, and the main inhibitory factor is the welfare effect.

5.2. Recommendations

Some targeted recommendations need to be put forward to achieve decoupling between carbon emissions and HDI and improving CEP.
  • For countries with a very high HDI, reduce carbon emissions while maintaining the growth of their HDI. Following the commitments of the Paris Agreement, developed countries continue to take the lead in emission-reduction actions, improve the emission-reduction technologies, and provide developing countries with technical and financial support for emission reduction. In daily life, developed countries continue to implement the concept of environmental protection and achieve low-carbon life.
  • Most countries with high and medium human development are the major carbon emitters. A synchronized increase in carbon emissions has accompanied their HDI growth. The first thing to do is increase their HDI to very high human development. Economic growth has made remarkable achievements, and more attention needs to be paid to developing health and education, especially the improvement of quality healthcare and higher education (UNDP, 2019). The improvement of population quality will be conducive to the transmission of low-carbon concepts, as carbon emissions from living are gradually increasing. It is also necessary to reduce carbon emissions, learn advanced emission-reduction technologies, improve energy efficiency, and adjust the energy structure. If new energy sources are developed and new energy industries are encouraged, it is possible to surpass developed countries, such as China’s electric vehicle industry.
  • Low human development countries have the worst decoupling status. The most urgent thing for these countries is to maintain a stable political environment. Then there is the construction of infrastructure, including medical, educational, and industrial, to improve the HDI.

Author Contributions

D.L. conceptualized and designed the research. T.S. drafted the paper and conducted the data interpretation. X.W. and J.L. collected data and obtained preliminary data results. All authors have read and agreed to the published version of the manuscript.

Funding

This paper is supported by the Key Program of the National Philosophy and Social Science Foundation of China (Grant No. 21ATJ003), Innovation Team of Philosophy and Social Sciences in Henan Colleges and Universities (2017–CXTD-07), Major Projects in Basic Research of Philosophy and Social Sciences in Henan Colleges and Universities (2019-JCZD-002), and Humanities and Social Sciences Project of Henan Educational Administration (2022-ZZJH-416).

Institutional Review Board Statement

Not applicable.

Informed Consent Statement

Not applicable.

Data Availability Statement

The raw data presented in this study are openly available on some platforms of international organizations, reference numbers 1, 26, 27, 28 and 29.

Conflicts of Interest

The authors declare no conflict of interest.

References

  1. BP. BP Statistical Review of World Energy 2021. 2021. Available online: http://www.bp.com/Statisticalreview (accessed on 9 November 2021).
  2. Yang, J.; Hao, Y.; Feng, C. A race between economic growth and carbon emissions: What play important roles towards global low-carbon development? Energy Econ. 2021, 100, 105327. [Google Scholar] [CrossRef]
  3. United Nation Development Program (UNDP). Human Development Report 1990: Concept and Measurement of Human Development; UNDP: New York, NY, USA, 1990. [Google Scholar]
  4. Pan, J. A Conceptual Framework for Understanding Human Development Potential—With Empirical Analysis of Global Demand for Carbon Emissions. Soc. Sci. China 2002, 6, 15–25. [Google Scholar]
  5. United Nation Development Program (UNDP). Human Development Report 2020 the Next Frontier Human Development and the Anthropocene; UNDP: New York, NY, USA, 2020. [Google Scholar]
  6. Hossain, M.A.; Chen, S. Nexus between Human Development Index (HDI) and CO2 emissions in a developing country: Decoupling study evidence from Bangladesh. Environ. Sci. Pollut. Res. 2021, 28, 58742–58754. [Google Scholar] [CrossRef] [PubMed]
  7. OECD. Indicators to Measure Decoupling of Environmental Pressure from Economic Growth; OECD: Paris, France, 2002. [Google Scholar]
  8. Tapio, P. Towards a theory of decoupling: Degrees of decoupling in the EU and the case of road traffic in Finland between 1970 and 2001. Transp. Policy 2005, 12, 137–151. [Google Scholar] [CrossRef] [Green Version]
  9. Lin, S.J.; Beidari, M.; Lewis, C. Energy consumption trends and decoupling effects between carbon dioxide and gross domestic product in South Africa. Aerosol Air Qual. Res. 2015, 15, 2676–2687. [Google Scholar] [CrossRef] [Green Version]
  10. Wu, Y.; Zhu, Q.; Zhu, B. Decoupling analysis of world economic growth and CO2 emissions: A study comparing developed and developing countries. J. Clean. Prod. 2018, 190, 94–103. [Google Scholar] [CrossRef]
  11. Chen, J.; Wang, P.; Cui, L.; Huang, S.; Song, M. Decomposition and decoupling analysis of CO2 emissions in OECD. Appl. Energy 2018, 231, 937–950. [Google Scholar] [CrossRef]
  12. Martínez, D.M.; Ebenhack, B.W. Understanding the role of energy consumption in human development through the use of saturation phenomena. Energy Policy 2008, 36, 1430–1435. [Google Scholar] [CrossRef]
  13. Akizu-Gardoki, O.; Bueno, G.; Wiedmann, T.; Lopez-Guede, J.M.; Arto, I.; Hernandez, P.; Moran, D. Decoupling between human development and energy consumption within footprint accounts. J. Clean. Prod. 2018, 202, 1145–1157. [Google Scholar] [CrossRef]
  14. Hu, A. A Global Roadmap for Emission Reductions on the Road to Copenhagen. J. Contemp. Asia-Pac. Stud. 2008, 162, 22–38. [Google Scholar]
  15. Costa, L.; Rybski, D.; Kropp, J.P. A Human Development Framework for CO2 Reductions. PLoS ONE 2011, 6, e29262. [Google Scholar] [CrossRef] [Green Version]
  16. Chen, L.; Cai, W.; Ma, M. Decoupling or delusion? Mapping carbon emission per capita based on the human development index in Southwest China. Sci. Total Environ. 2020, 741, 138722. [Google Scholar] [CrossRef]
  17. Beinhocker, E.; Oppenheim, J.; Irons, B.; Lahti, M. The Carbon Productivity Challenge: Curbing Climate Change and Sustaining Economic Growth; McKinsey & Company: New York, NY, USA, 2008. [Google Scholar]
  18. Zhu, D.; Liu, G. Human Development Performance Index and Empirical Analysis of Carbon Emission. China Popul. Resour. Environ. 2010, 21, 73–79. [Google Scholar]
  19. Liu, G.; Zhu, Y. Research on well-being performance of carbon emissions: Based on the data of G20. Stud. Sci. Sci. 2011, 29, 1504–1510. [Google Scholar]
  20. Hu, J.; Gao, P.; Zuo, P. Study on the Regional Differences and Contribution Rate of China’s Carbon Emissions Welfare Performance. Econ. Probl. 2018, 11, 54–60. [Google Scholar]
  21. Pan, J.; Zhang, Y. Spatiotemporal patterns of energy carbon footprint and decoupling effect in China. Acta Geogr. Sin. 2021, 76, 206–222. [Google Scholar]
  22. Wang, H.; Hu, Z. The measurement research on the decoupling relationship between manufacturing sector economic growth and carbon dioxide in China. Stud. Sci. Sci. 2012, 30, 1671–1675. [Google Scholar]
  23. Ang, B.W. Decomposition analysis for policymaking in energy: Which is the preferred method? Energy Policy 2004, 32, 1131–1139. [Google Scholar] [CrossRef]
  24. Wang, C.; Chen, J.; Zou, J. Decomposition of energy-related CO2 emission in China: 1957–2000. Energy 2005, 30, 73–83. [Google Scholar] [CrossRef]
  25. Liu, Y.; Jin, S. Temporal and Spatial Evolution Characteristics and Influencing Factors of Energy Consumption Carbon Emissions in Six Provinces of Central China. Econ. Geogr. 2019, 39, 182–191. [Google Scholar]
  26. Global Carbon Project. Supplemental Data of Global Carbon Budget 2021 (Version 1.0) [Data Set]. 2021. Available online: https://www.icos-cp.eu/science-and-impact/global-carbon-budget/2021 (accessed on 9 November 2021).
  27. World Bank. The World Development Indicators [Data Set]. 2021. Available online: https://datacatalog.worldbank.org/home (accessed on 15 April 2021).
  28. United Nations, Department of economic and social affairs (UNDESA). World Population Prospects: The 2019 Revision. Rev 1. 2020. Available online: https://population.un.org/wpp/ (accessed on 10 November 2021).
  29. United Nation Development Program (UNDP). Human Development Data Center [Data Set]. 2021. Available online: https://hdr.undp.org/ (accessed on 10 November 2021).
  30. Lucas Chancel. Climate Change & the Global Inequality of Carbon Emissions, 1990–2020; World Inequality Lab: Paris, France, 2021. [Google Scholar]
Figure 1. Relationship between HDI and CO2 per capita emissions. Source: Authors’ own construction. Note: The p-values for the four exponential functions are all less than 0.01 and pass the significance test. (a) 1990; (b) 2000; (c) 2010; (d) 2019.
Atmosphere 13 00584 g001aAtmosphere 13 00584 g001b
Figure 2. Decoupling between carbon emissions per capita and HDI, 1990–2019. Source: Authors’ own construction using Excel.
Atmosphere 13 00584 g002
Figure 3. Spatial distribution of the decoupling index over six periods. Source: Authors’ own construction using Excel. (a) 1990–1995; (b) 1995–2000; (c) 2000–2005; (d) 2005–2010; (e) 2010–2015; (f) 2015–2019.
Atmosphere 13 00584 g003
Figure 4. Evolution of carbon emission performance, 1990–2019. Source: Authors’ own construction using Excel. (a) 1990; (b) 1996; (c) 2002; (d) 2008; (e) 2014; (f) 2019.
Atmosphere 13 00584 g004
Figure 5. Two-dimensional analysis based on HDI and CEP in 2019. Source: Authors’ own construction using Excel.
Atmosphere 13 00584 g005
Table 1. Variable definition and source.
VariableDefinitionSource
CTotal carbon emissions (million tons)Global Carbon Project
FFossil fuel consumption (Twh)BP Statistical Review of World Energy
Eprimary energy consumption (Twh)BP Statistical Review of World Energy
GDPTotal GDP (constant 2017 PPP $)World Development Indicators
PTotal population (thousand)World Population Prospects
HDIThe geometric average of health, education, and income indexHuman Development Data Center
Table 2. Decomposition of the decoupling index for the example countries.
CountryPhase D P C , H D I D C F / % D F E / % D E G / % D G P / %
CZE1990–1995−6.4939.346.0937.5617.01
1995–2000−0.5−5.435.33401.95−331.88
2000–2005−0.17519.75687.841204.19−2311.78
2005–2010−2.7813.132.73156.96−102.79
2010–2015−4.61−7.9617.4154.99−64.43
2015–2019−4.771.0738.41245.67−255.15
DEU1990–1995−3.2233.339.43108.6−51.36
1995–2000−1.1147.9149.97198.52−196.4
2000–2005−1.0931.527.25101.63−60.38
2005–2010−1.33−47.1641.75331.54−226.13
2010–2015−4.94−7.4836.5195.64−124.66
2015–2019−12.6738.5926.0569.22−33.86
GBR1990–1995−0.8365.5937.4589.43−92.47
1995–2000−0.45313.71−47.44814.77−981.04
2000–2005−0.780.7−22.53664.23−622.4
2005–2010−8.9611.57−1.3373.0116.75
2010–2015−17.930.4835.191.95−27.53
2015–2019−15.3429.3923.2872.66−25.33
KOR1990–19956.55−32.1312.2824.4395.42
1995–20001.92−60.44−38.77−51.55250.76
2000–20052.18−16.17−17.38−88.48222.03
2005–20105.561.8515.33−39.42122.24
2010–20151.92−26.98−10.22−183.35320.55
2015–20191.15−288.26117.59−566.1836.77
TUR1990–19952.02−27.03−30.2477.3279.95
1995–20002.21−3.7328.58−1.6676.81
2000–20051.288.71−12.29−141.63245.21
2005–20101.95−45.58−7.3569.1183.82
2010–20151.39−24.29−14.67−95.17234.13
2015–2019−0.58173.68357.1145.12−575.9
Source: Authors’ own calculation.
Table 3. Decomposition of CEP for the example countries.
CountryPhase Δ C G / % Δ G C / % Δ C F / % Δ F E / % Δ E G / % Δ G P / % Δ P / %
CZE1990–1995170.42359.34−170.32−26.37−162.64−73.683.25
1995–2000−51.04211.792.65−17.33−197.11162.75−11.71
2000–2005−292.69416.17−89.69−118.69−207.79398.91−6.22
2005–2010−210.7479.05−30.96−77.31−370.79242.8367.88
2010–2015−133.4552.126.72−58.41−520.4216.3317.06
2015–2019−813.481190.71−238.29−128.76−823.66855.4458.04
DEU1990–1995−90.67412.67−90.88−25.71−296.09140.0450.64
1995–2000−113.46310.98−50.26−52.43−208.28206.067.39
2000–200531.65164.67−32.35−27.98−104.35626.36
2005–2010−132.59390.0556.4−49.93−396.52270.46−37.87
2010–2015−420.54805.7526.81−130.88−701.68447.0973.45
2015–2019−211.56840.44−242.27−163.58−434.59212.5998.97
GBR1990–19956.57160.86−54.82−31.29−74.7577.2816.15
1995–2000−389.36484.07−140.4721.24−364.84439.2950.07
2000–2005−414.51499.08−55.7515.56−458.8943084.51
2005–201015.64454.58−63.157.25−398.68−91.46175.82
2010–2015−217.43925.28−3.48−254.7−667.1199.76117.67
2015–2019−173.28835.77−195.96−155.27−484.55168.94104.35
KOR1990–1995−1323.83−59.34−416.45159.15316.631236.61187.23
1995–2000−612.13358.88−143.88−92.29−122.71596.94115.19
2000–2005−580.58332.14−44−47.31−240.83604.3476.24
2005–2010−1281.23230.8319.24159.04−409.111268.73112.5
2010–2015−838.08536.13−65.57−24.84−445.71779.21158.86
2015–2019−1096.92977.66−382.51156.03−751.191110.3686.57
TUR1990–1995−347.94−54.58−73.58−82.32210.48217.65230.29
1995–2000−258.08−66.25−10.6781.65−4.73219.46138.62
2000–2005−441.04224.9613.49−19.04−219.41379.88161.16
2005–2010−248.82−40.09−112.93−18.2171.21207.68141.15
2010–2015−412.24222.78−40.34−24.36−158.08388.89123.35
2015–2019−513.97416.24−106.95−219.91−89.37354.65259.31
Source: Authors’ own calculation.
Publisher’s Note: MDPI stays neutral with regard to jurisdictional claims in published maps and institutional affiliations.

