
Research on Prospecting Prediction Based on Evidence Weight


School of Earth Sciences and Resources, China University of Geosciences (Beijing), 29 Xueyuan Road, Beijing 100083, China
*
Author to whom correspondence should be addressed.
Atmosphere 2022, 13(12), 2125; https://doi.org/10.3390/atmos13122125
Submission received: 14 November 2022
/
Revised: 14 December 2022
/
Accepted: 15 December 2022
/
Published: 17 December 2022
(This article belongs to the Special Issue Anthropogenic Pollutants in Environmental Geochemistry)
Abstract
:There are many small and medium-sized orogenic copper deposits in the Jinman–Lanping area of Yunnan. In order to standardize mining, long-term planning, and unified management, it is necessary to further delineate prospecting areas. In order to improve the efficiency of prospecting, a data-driven approach is established. This paper uses the weight of evidence model to make prospecting predictions, and it then delineates the prospective prospecting area. The relevant evidence layers in the weight of evidence model are geochemical anomalies and remote sensing iron staining anomalies. Among them, the geochemical anomaly layer mainly uses the concentration-area (C-A) fractal model to separate the geochemical background and anomaly acquisition. The remote sensing iron-stained anomaly layer mainly uses bands (1, 4, 5, 7), and bands (1, 3, 4, 5) were combined for principal component analysis to extract abnormal iron staining. Finally, using the weight of evidence model, the spatial element layers (evidence layers) from different sources were combined, and the interaction between them was analyzed. It is pointed out that the area has good prospects for prospecting, and the prospective prospecting area was thus delineated.
1. Introduction
Metallogenic prediction is the application of geological theory and related technical methods that synthesizes basic data (such as geology, remote sensing geology, geophysics, geochemistry, etc.) using GIS technology and information integration technology to establish a regional comprehensive information mineral prediction model [1,2] for quantitative evaluation of mineral resources, and it is an important means of information finding in the field of mineral resources exploration at present [3]. At the same time, under the guidance of the generalized ore deposit geological model, reasonable metallogenic prediction theory, and appropriate mathematical geological methods, geographic information system (GIS) technology is used to carry out integrated management of multi-source geological information through its powerful spatial information processing. The analysis function can carry out fast and effective comprehensive analysis [4,5], and it is also a widely recognized quantitative evaluation technology system for mineral resources at home and abroad [6,7]. With the development of science and technology, metallogenic prediction and evaluation has developed from a qualitative to quantitative and from a two-dimensional to three-dimensional approach. Since the 1980s, geographic information system (GIS) technology has been successfully introduced into metallogenic prediction. This technology improves the efficiency of mineral resource prediction and shortens the resource evaluation period, and it can also quantitatively delineate favorable metallogenic sections at all levels. Among the available models, the weight of evidence model is a mathematical prediction and evaluation model that is based on the spatial position relationship of data and combines GIS technology to effectively synthesize various favorable metallogenic factors (evidence layers). At present, different domestic experts and scholars have carried out mineral resource prediction work based on the right of evidence method for some major metallogenic zones and deposits, and they have achieved good prospecting results [8,9,10,11,12,13].
At present, fractal and multifractal analysis methods based on the principle of self-similarity have been widely used to identify geochemical anomalies. In the extraction of geochemical anomalies, the fractal method is also used to extract information about geochemical anomalies. In the remoting sensing aspect of geological interpretation, the extraction of characteristic minerals is realized by multivariate statistical methods, mainly through the use of principal component analysis to extract iron staining anomalies which thus provides information about characteristic mineral extraction.
The research area of this paper is located in the Jinman area in Lanping County, Yunnan Province. It is located on both sides of the Lancang River Gorge. There are many small and medium-sized orogenic copper deposits (points) in the area. According to incomplete statistics, there are hundreds of copper deposits in the area [14]. In order to plan mining, this study uses the ArcGIS10.2 platform to explore the evidence maps of geochemical anomalies and remote sensing anomalies closely related to mineralization.
2. Regional Geological Overview
The Lanping-Simao Basin in Yunnan is located at the intersection of the Tethys tectonic domain and the Pacific Rim tectonic domain and is a Middle Cenozoic terrestrial rift basin developed on the basement of the Hercynian [15]. Since the late Mesozoic, the Lanping-Simao Basin has experienced three extension-rifting periods (in the Late Triassic, Jurassic-Early Cretaceous, and Paleocene) that led to the formation of the third-order graben basin [15], and multiple extensional activities have resulted in intense paleothermal activity in the basin that is favorable for the formation of copper and polymetallic deposits.
The strata of the Lanping Basin are dominated by late Paleozoic–Cenozoic basin deposits and are mainly composed of sedimentary rocks from the Carboniferous to the Miocene; generally, this demonstrates marine–continental sedimentary evolution. The Carboniferous–Triassic period led to successive marine carbonate–clastic formations and coal-bearing clastic formations. The Jurassic to Early Paleogene regions show the development of a set of red formations and coal-bearing formations, and the red gypsum-salt formation is basically continental sedimentary [14].
Affected by the evolution of the Sanjiang structure, the Lanping Basin developed volcanic rocks from the Paleozoic to the Cenozoic, and their distribution was mostly affected by the long-term activity of deep and large faults. Alkaline-rich porphyries and alkaline complexes were dominant in the early Himalayan mountains. In addition, previous studies have suggested that the Lanping Basin has deep concealed intrusions, which may have provided certain material and energy for nearby metallization [16].
The Lanping Basin is tectonically complex and has undergone multiple tectonic movements that have led to the formation of a basin-controlling fracture system, a folding and reverse-thrusting tectonic system within the Lancang River rift zone, the Jinsha River and the Lailun Mountain rift zone, and the central axis rift zone spreading in a near north–south direction.
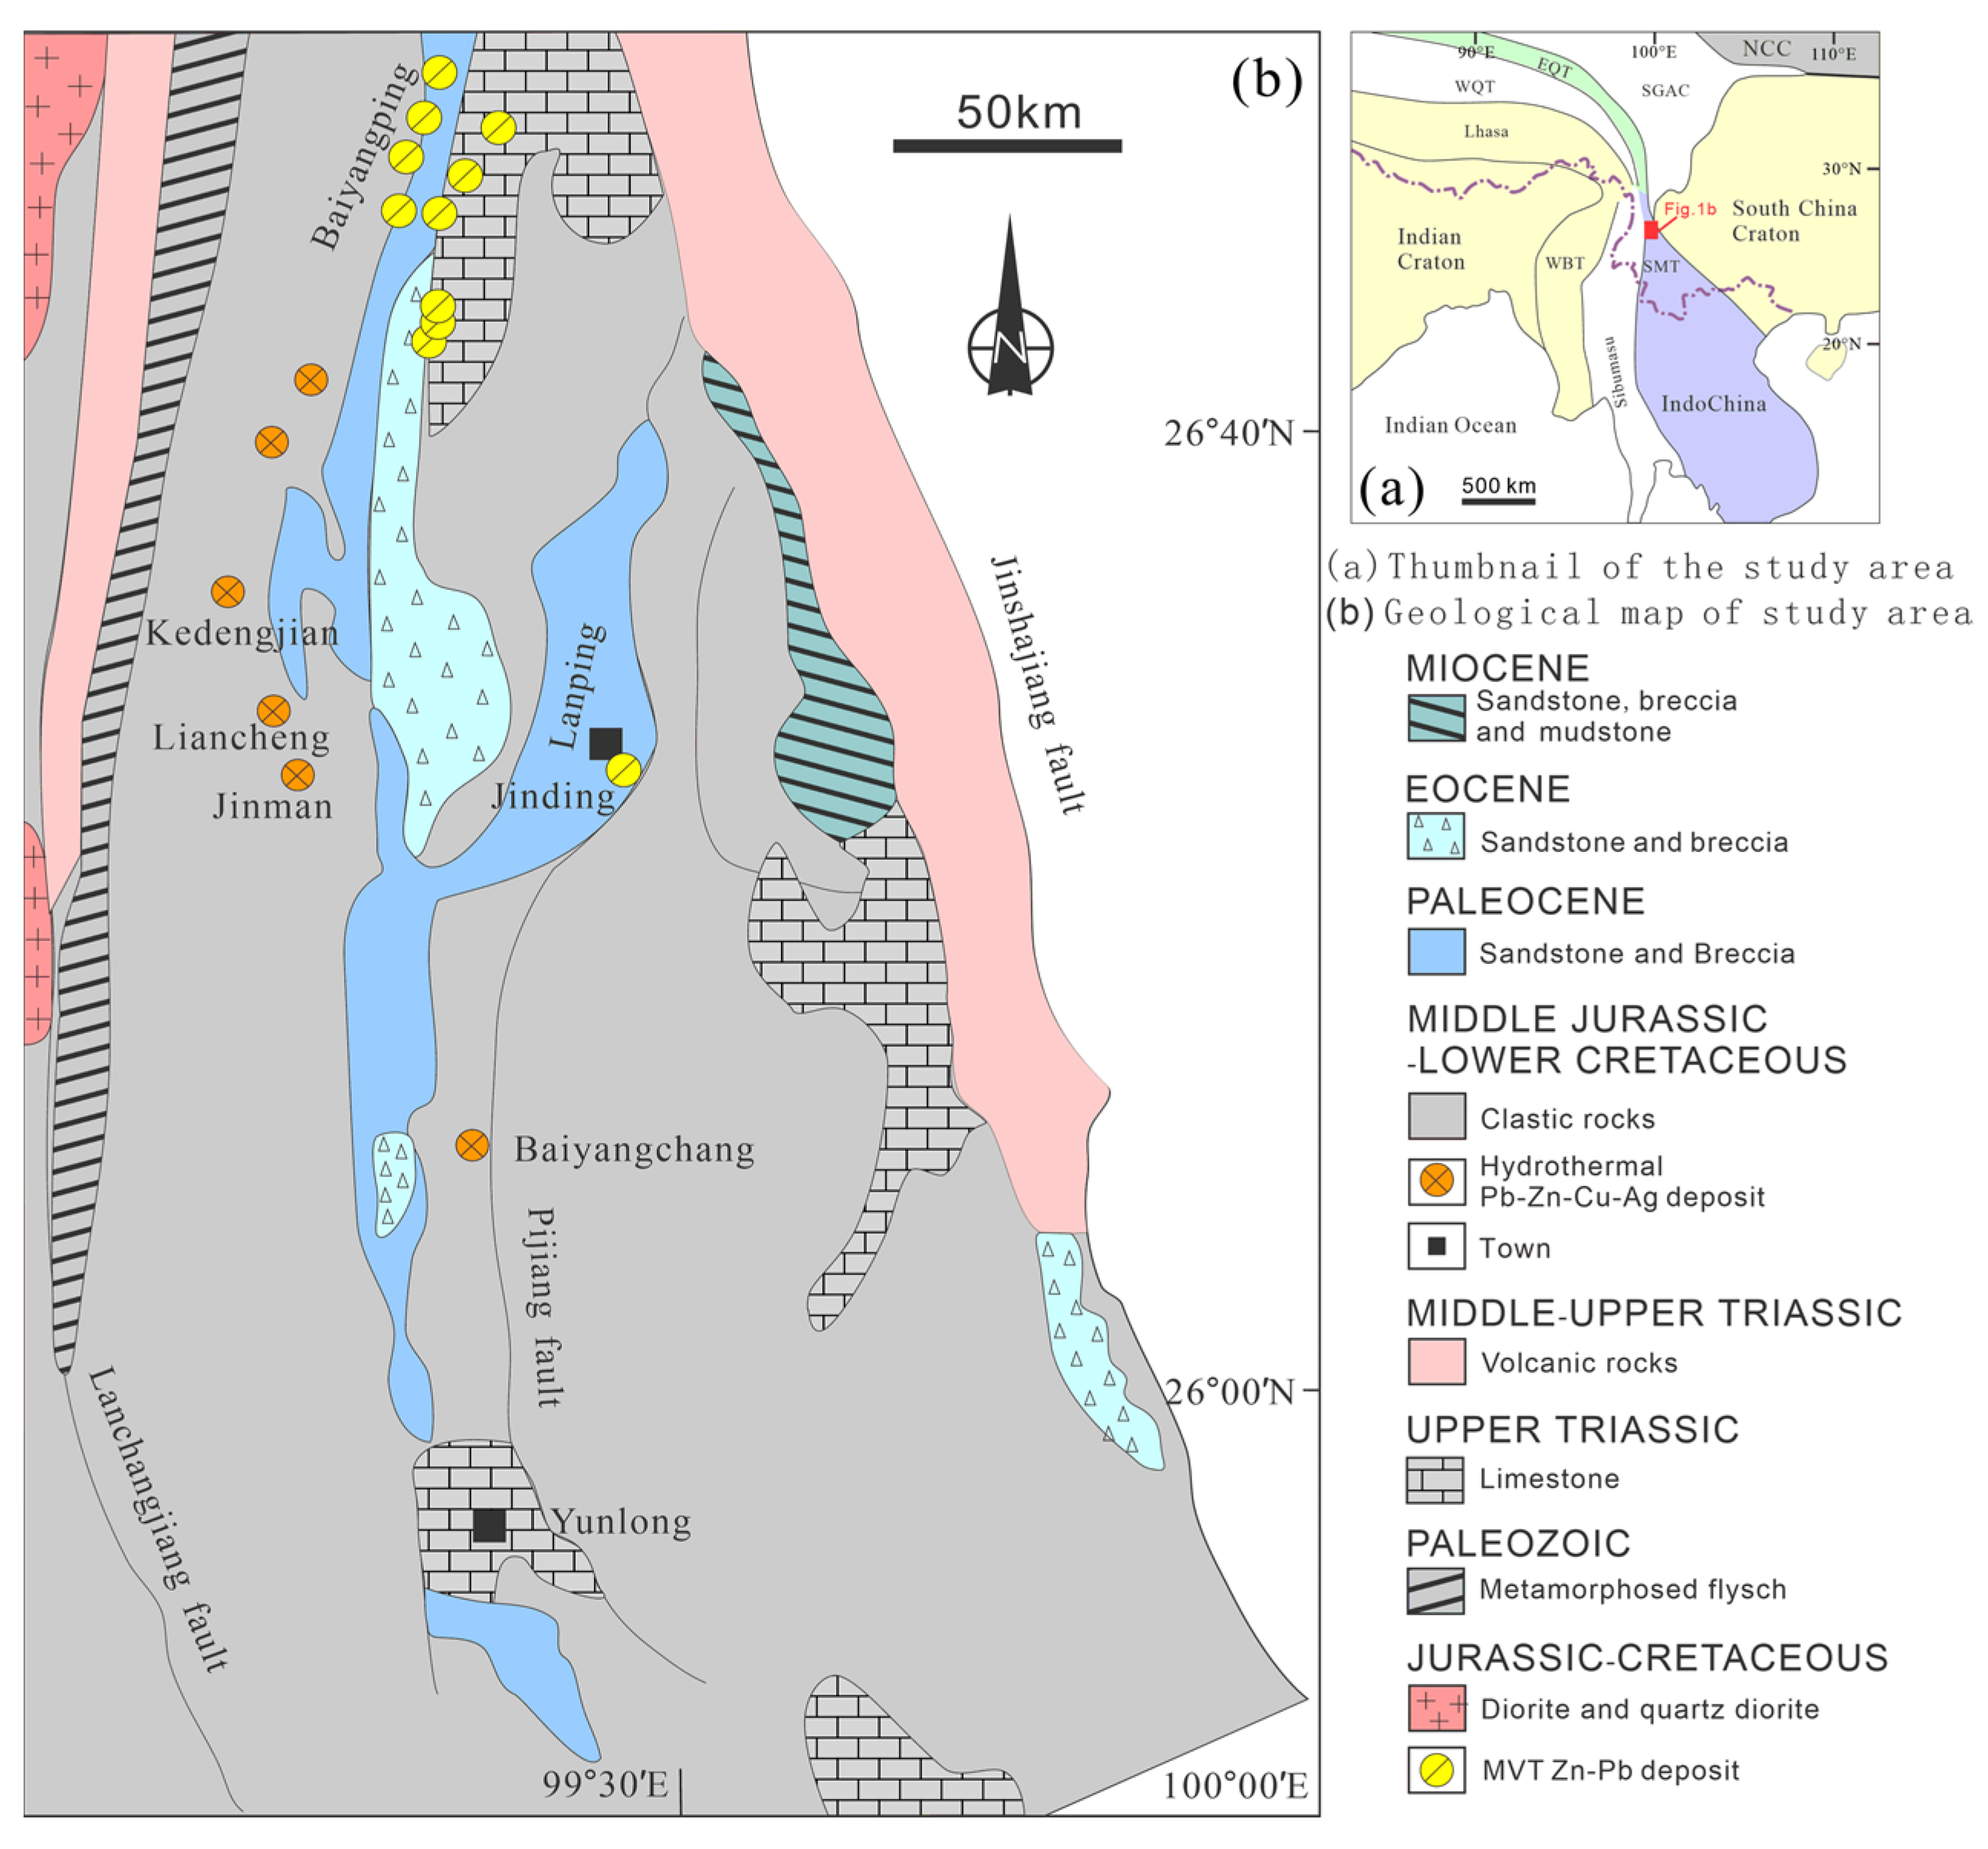
There are a large number of copper deposits (points) in the western margin of the Lanping Basin, which mainly occur in the Mesozoic and Cenozoic sedimentary strata in the basin; these are controlled by the western reverse nappe structure and its secondary structures, including the Jinman copper–silver deposit, the Liancheng copper deposit, the Liancheng copper deposit, a Molybdenum deposit, and a series of vein copper deposits [17]. However, in general, the formation of vein-like copper deposits in the western margin of the Lanping Basin is related to the basin thermal brine from which atmospheric precipitation originated [15,17,18]. The production process is bound to cause certain geochemical and alteration anomalies. The geological map of the study area is shown in Figure 1.
3. Method
3.1. Concentration-Area (C-A) Fractal Model
The concentration-area (C-A) fractal model method is a method to identify the relationship between content and area based on self-similar fractal theory. The most basic characteristic of fractal theory is to describe and study objective things from the perspective of fractional dimensions and mathematical methods, that is, to describe and study objective things with the mathematical tools of fractal dimensions. It jumps out of the traditional barriers of one-dimensional lines, two-dimensional surfaces, and three-dimensional and even four-dimensional space–time and closely describes the real properties and states of complex systems, which is more in line with the diversity and complexity of objective things. The fractal method is suitable for the extraction of geochemical anomalies. Fractal theory can be described as a curve or geometric figure, each part of which has statistical properties similar to the whole object. Therefore, the shape of local parts and the shape of the whole object show some similarity in form or function, or they look similar at different scales, i.e., they have self-similarity. In fractal theory, self-similarity is represented by the fractal dimension D. Fractal distribution requires the amount exceeding the threshold to have a power exponential relationship with object size [19], so that the following C-A fractal statistical model can be obtained.
In Formula (1), r represents element content, A (r) represents area when element content is greater than or equal to r, C > 0 represents the proportionality constant, and D > 0 represents the fractal dimension. The C-A fractal model helps to determine the fractal dimension. The specific method is to take the logarithm of both ends of Formula (1) to obtain the linear regression seen in Equation (2).
Substituting and into Equation (2), the least squares method is used to perform linear fitting and obtains slope D of the fractal line, which is the fractal dimension. In general, the variables are distributed on both ends of the line segment or on multiple line segments, so the piecewise fitting method is used. To improve the accuracy of segmentation inflection point locations and minimize human error, we can use an optimal method to determine the cutoff point, which thus minimizes the residual sum of squares, E, between the straight line and the original data. Equation (3) represents a two-stage fit.
rj is the cutoff point. D1 and D2 are the slopes and the fractal dimensions within the corresponding fitted range. The multi-segment straight line corresponds to multiple fractal dimensions, such as D1, D2, D3, and so on. After determining anomaly thresholds through dimensionality, this paper used anomalous data to map geochemical anomalies.
3.2. The Weight of Evidence Model
The weight of evidence model is a multivariate statistical method. It determines the metallogenic and ore-prospecting significance of each geological variable by studying the characteristics of the ore-controlling variables of the model unit and identifying the internal relationship between the variables [20]. The various characteristics of the predicted unit and the model unit are compared, and their similarity is used to indicate the metallogenic favorableness of the predicted unit. This delineates a favorable prediction area for metallogenesis [21].
In terms of the specific algorithm, assume that the study area covers t km2, thus each unit area is u km2 and T = t/u represents the total number of units divided into the study area. Assuming that T contains all of the units in a deposit, if u is small enough, D is equal to the number of known deposits and P (D) = D/T is the prior probability of selecting a mineral-bearing unit. Prior probability is an unconditional probability, which is a constant in the whole study area [21]. P (D) converts to prior dominance degree O (D):
For the jth binarized evidence layer, Bj is the evidence factor, and the evidence weight is defined as follows:
If there is a binary model (layers of evidence may exist anywhere in space), a positive weight of evidence is used. If the binary model does not exist, the conditional probability in this formula would be determined by superposition area.
The final calculated posterior probability is based on the superposition of many geological, geochemical, and geophysical data layers, which comprehensively reflects relevant information pertaining to the various ore-controlling factors [22].
4. Prospecting Prediction
4.1. Identification of Geochemical Fractal Anomalies
(1) Characteristic analysis of geochemical parameters
The Cu, Mo, and Sb elements present in the study area are closely related to mineralization, indicating that there is tectonic hydrothermal activity in this area [23]. Table 1 shows the element content of the surrounding rocks, tectonic rocks, and copper minerals in the Jinman deposit in the Jinman study area of Lanping [24].
(2) Analysis of geochemical anomalies
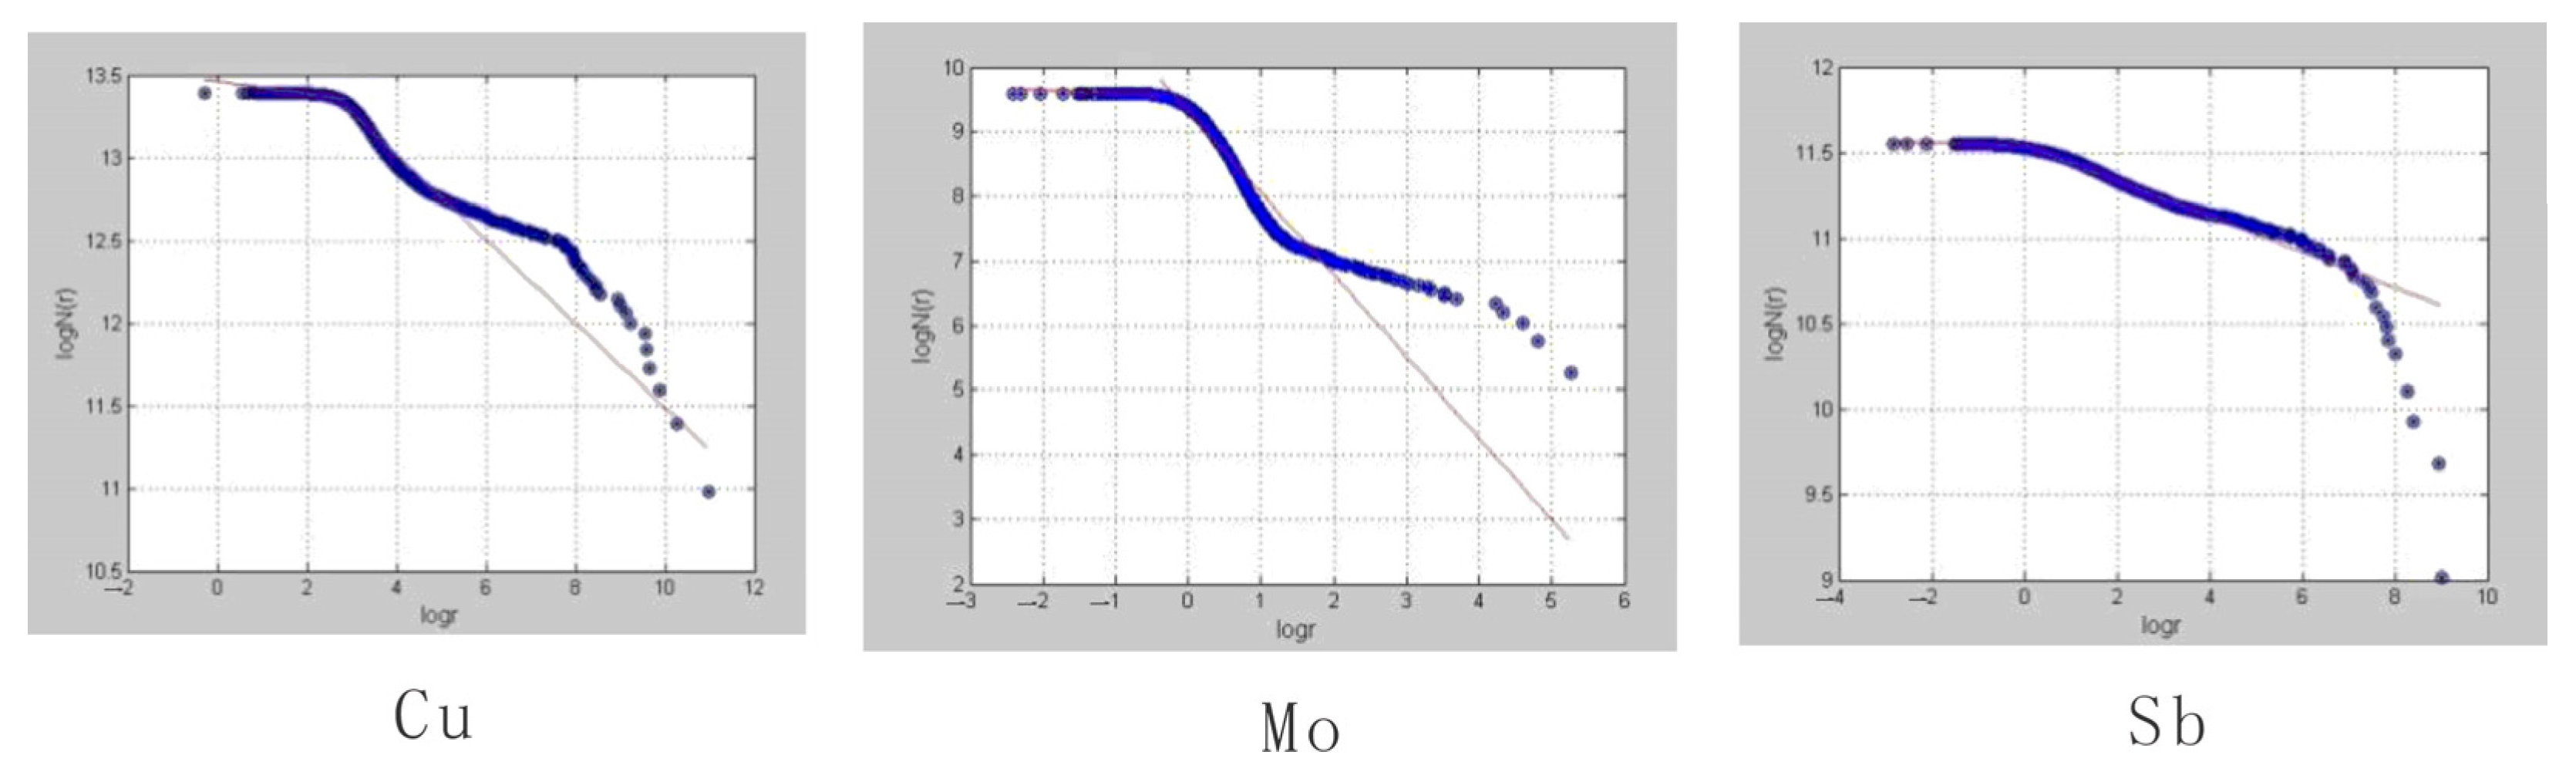
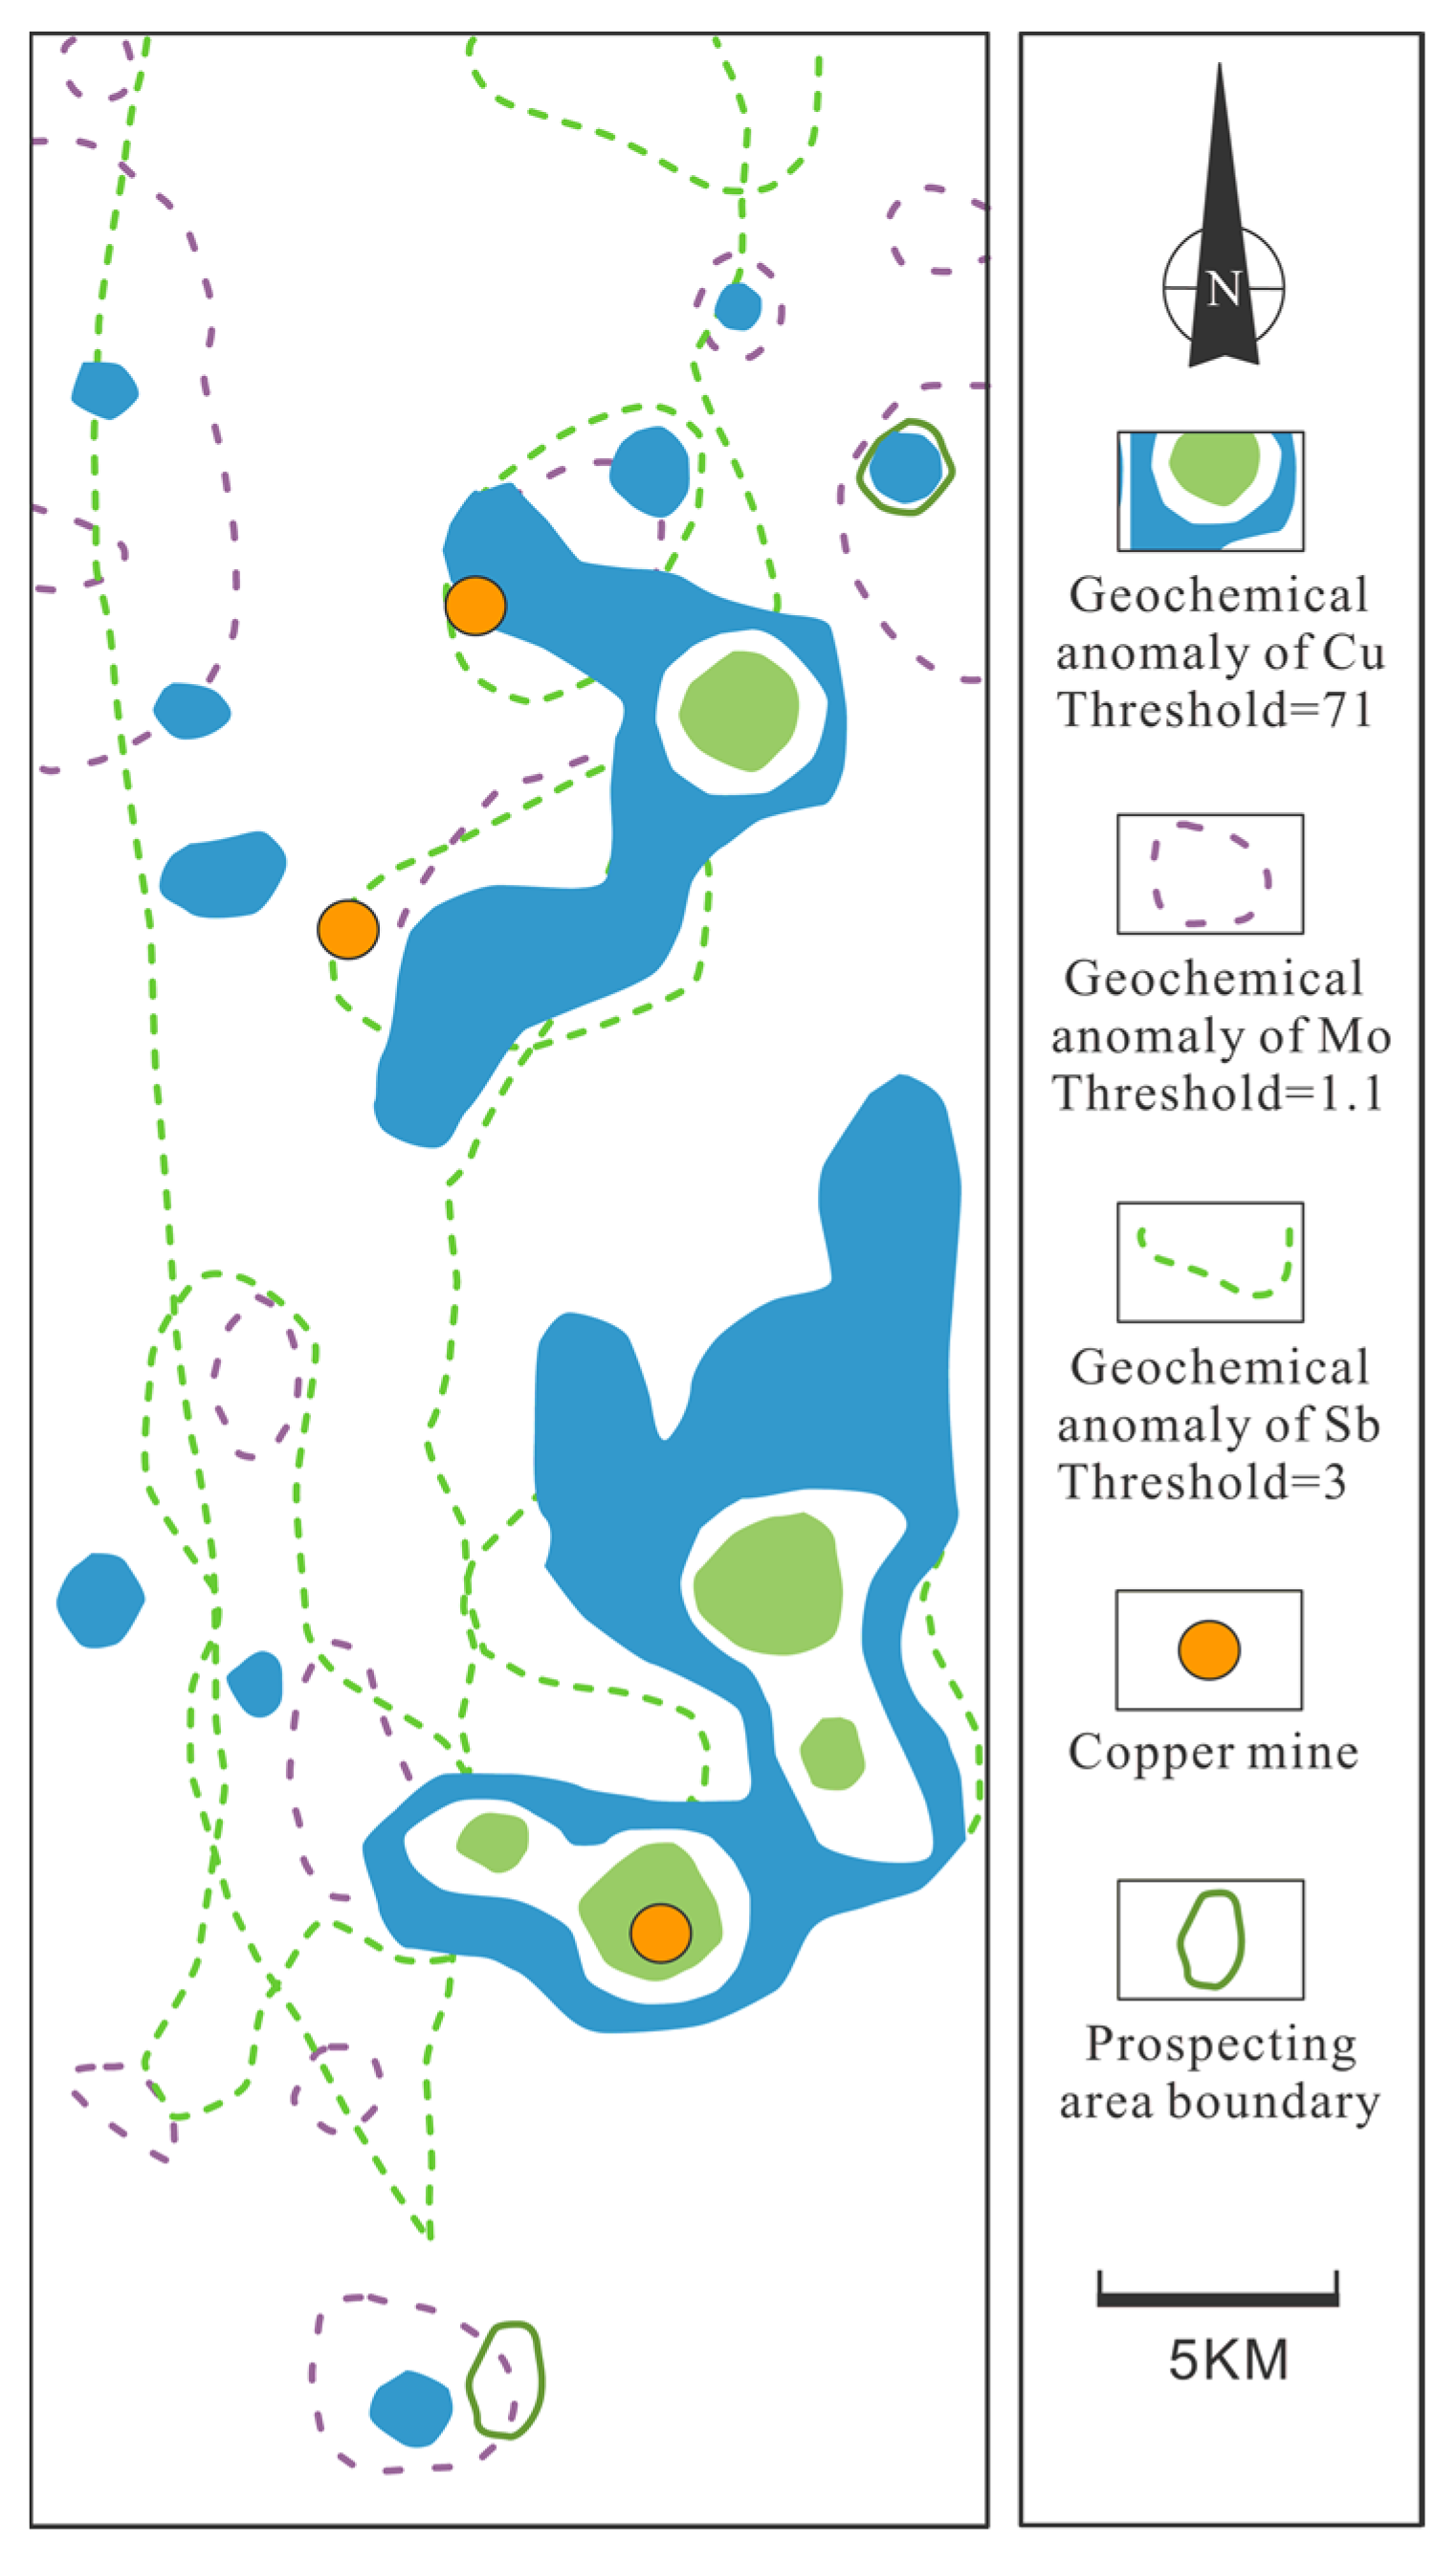
According to the geochemical exploration data, the Cu anomalies in the study area are mainly distributed in the Dagoutou–Xiaozhaju area in the southern part of the study area: Hongyou lead mine, Daguochang copper mine, etc. The Mo anomalies are also mainly distributed along the Lancangjiang fault (the Hongyou lead deposit and the Jinman copper deposit), which may reflect more stratigraphic information. The Sb anomaly is mainly distributed along the NNE trending faults and the Daguochang–Damaidi area, and it fits very well with the Daguochang copper mine, Huapinghe copper mine, Hongyou lead mine, and Jinman copper mine in this area. Among them, the Daguochang–Damaidi area has the highest anomaly intensity, the largest scale, and an obvious concentration center that coincides with the Cu anomaly. Therefore, there is great potential of finding Daguochang-type copper deposits in the Daguochang area. According to the fractal characteristics of Cu, Mo, and Sb elements, the abnormal thresholds are 71 ppm, 1.1 ppm, and 3 ppm, respectively. Fractal diagrams of Cu, Mo, and Sb elements were obtained using Geodas software and are shown below. The fractal charts of Cu, Mo, and Sb are shown in Figure 2.
Based on the above outliers, the element combination anomaly map is extracted (Figure 3). It can be observed that the geochemical anomalies in the study area are large in scale, high in intensity, and obvious in terms of concentration center, which is in good agreement with faults and known ore points and indicates that this area has good prospecting prospects.
4.2. Remote Sensing Geological Interpretation
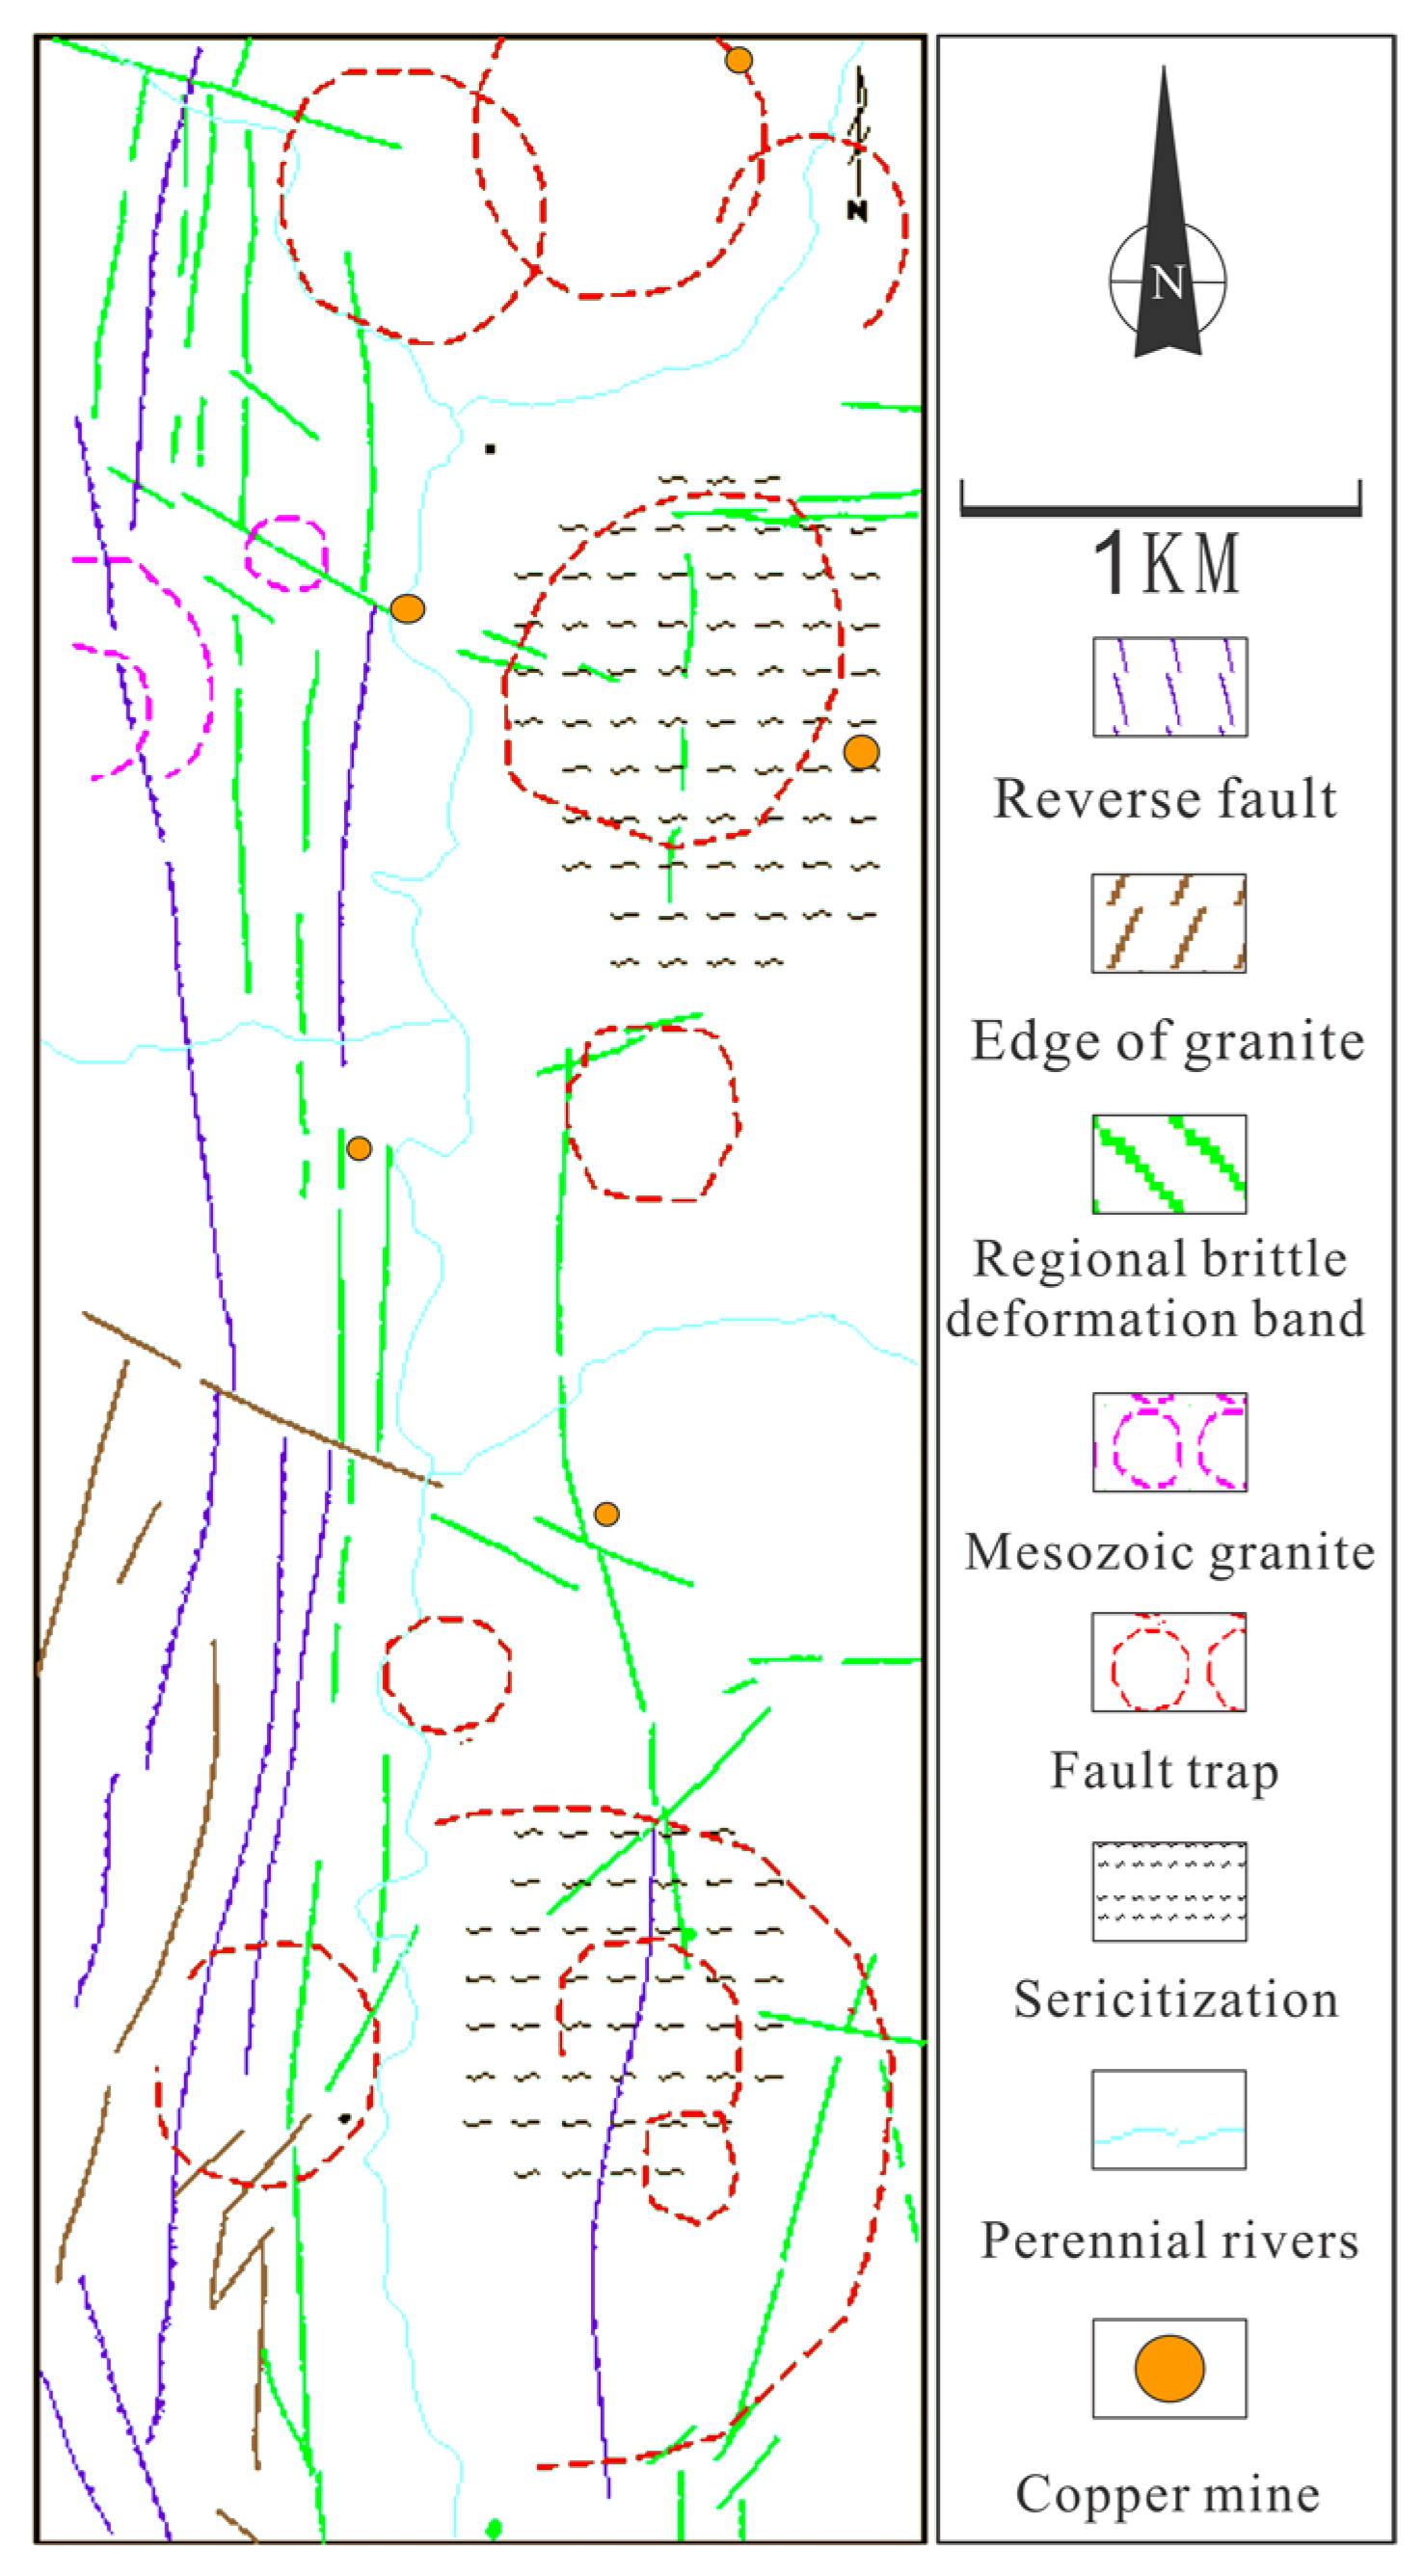
This paper uses Landsat TM image data and ETM+ image data as remote sensing data sources. The maximum spatial resolution of TM data is 30 m with a total of seven spectral bands. The maximum spatial resolution of ETM+ data is 15 m with a total of eight spectral bands. Through remote sensing interpretation, it can be seen that metal mineralization in this area is often accompanied by sericitization, potassium chloride, and kaolinization. These minerals usually contain hydroxyl functional groups (OH). Carbonate minerals such as dolomite, calcite, and rhodochrosite often contain carbonate ions (CO32−) [25]. Alteration minerals containing OH and CO32− have strong absorption in the ETM + 7 (2.08–2.35 μm) zone and the strong reflection zone of ETM + 5 (1.55–1.75 μm). For iron oxides in metal mineralization through pyritization, the spectral characteristics are in the ETM+ 3 (0.63 ~ 0.69 μm) and ETM+ 1 (0.45 ~ 0.52 μm) zones and the ETM + 2 (0.52 ~ 0.60 μm) and ETM+ 4 (0.76–0.90 μm) zones, which shows strong reflection in the spectrum. Some iron oxide anomalies can weaken the spectral anomalies between the reflection and absorption bands in ETM+ 4 and ETM+ 1 zones [26]. According to the spectral characteristics of altered minerals, principal component analysis was carried out on the B (1, 4, 5, 7) and B (1, 3, 4, 5) band combinations of the ETM+ images in the study area, and the corresponding iron staining anomalies were extracted. Information obtained by calculating standard deviation shows that the iron-stained anomalous area is basically consistent with the distribution of known mineralized points. The remote sensing interpretation results are shown in Figure 4.
4.3. Prospecting Prediction
In this study, the weight of evidence model was used to delineate the prospecting and prediction area in MRAS software based on Equations (4)–(6). The weights of the prediction factors used in descending order are as follows: remote sensing line existence mark, 0.45; copper geochemical prospecting element abnormal existence mark, 0.372. The calculation results show that the weight value of the remote sensing line’s existence sign and copper geochemical anomaly sign is relatively large [27]. This has obvious guiding significance for prospecting.
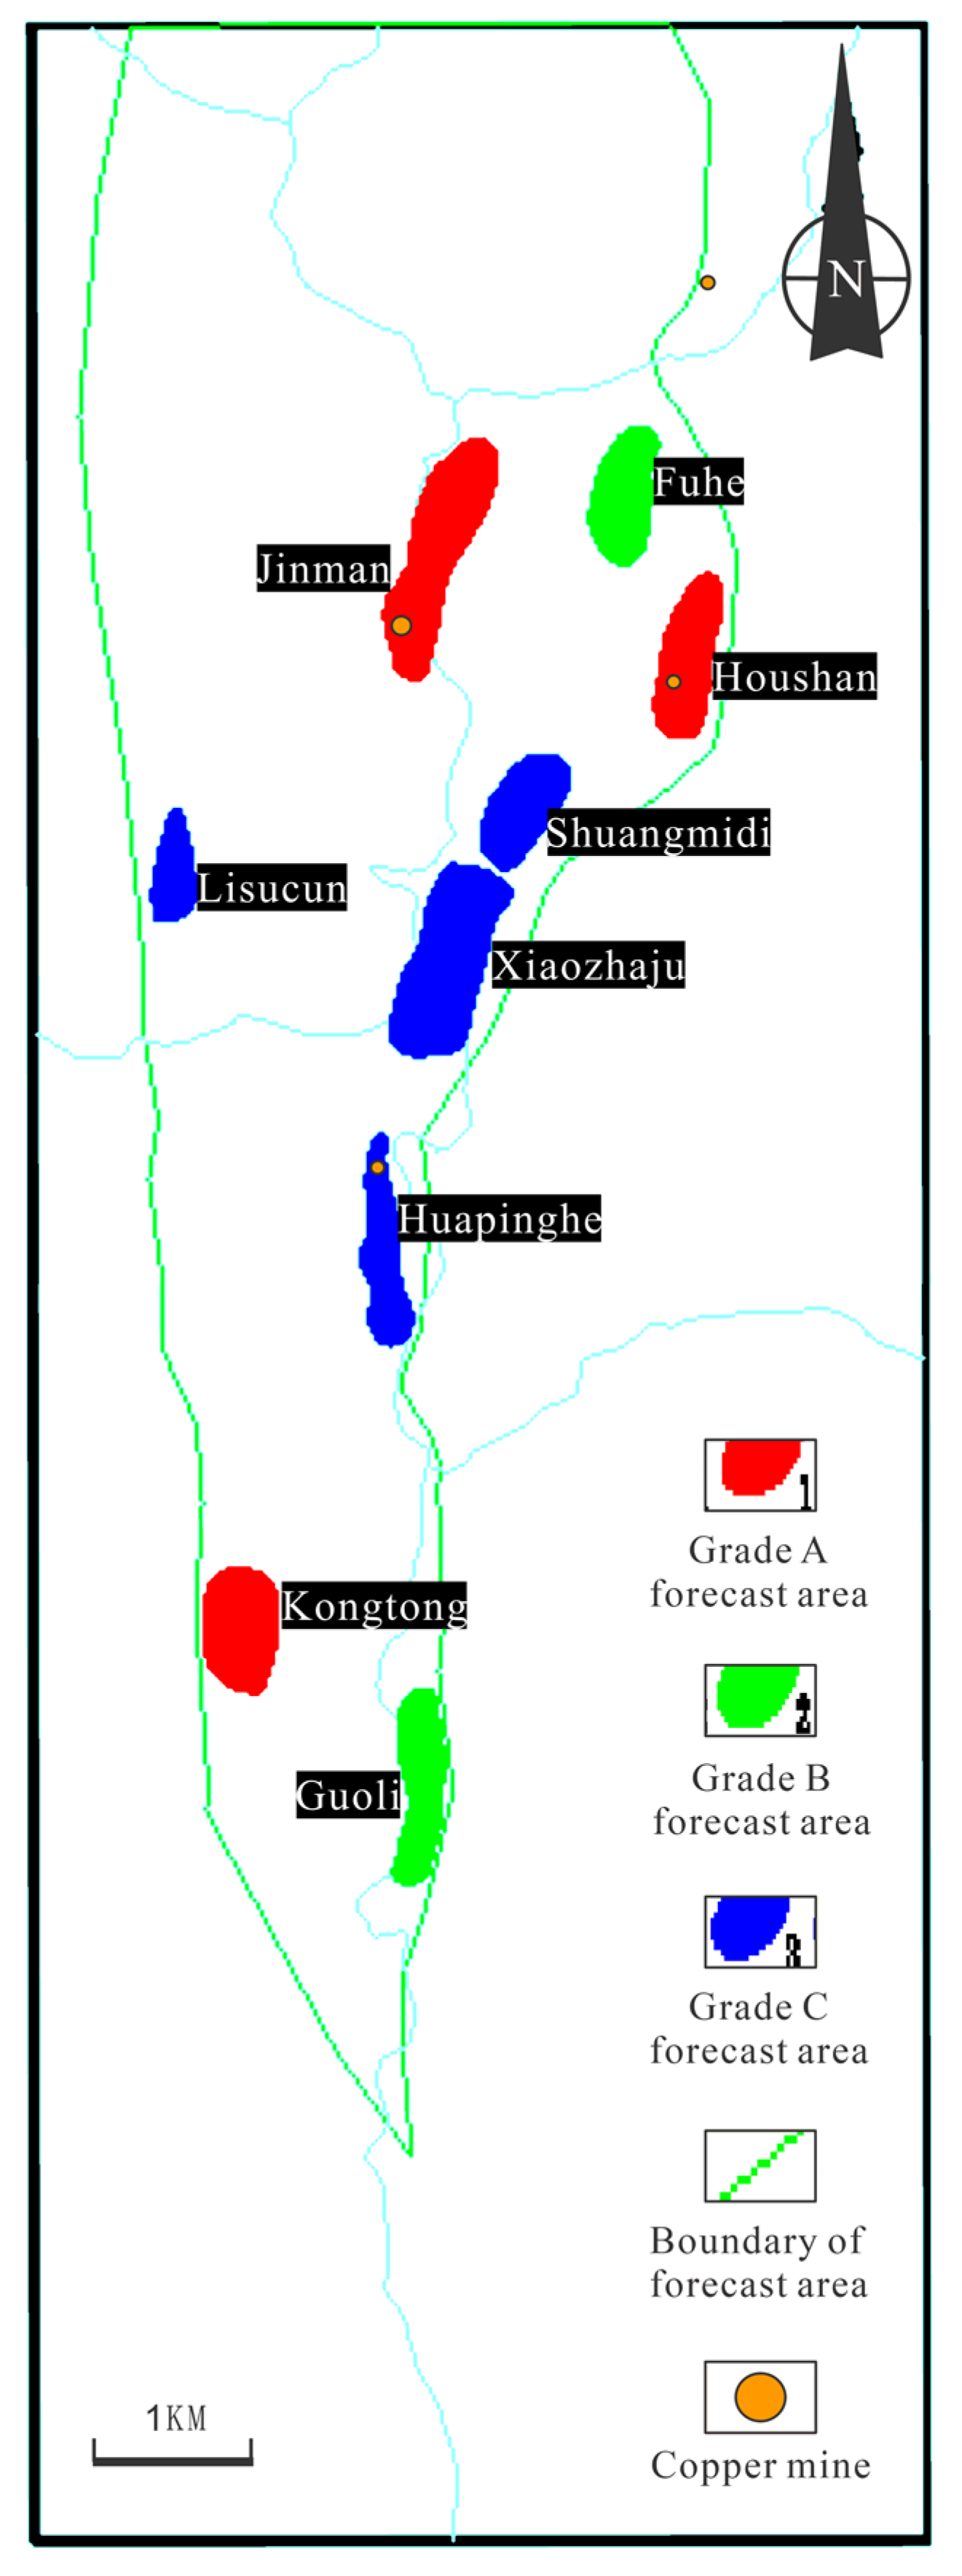
A total of nine minimum prediction units (areas) were delineated in the Jinman-type hydrothermal vein copper deposit research area using MRAS software. Among them, there are three class A prediction areas with a metallogenic probability of 0.381 to 1.00, two class B prediction areas with a metallogenic probability of 0.26 to 0.338, and four class C prediction areas with a metallogenic probability of 0.054 to 0.14. The three class A minimum prediction areas delineated are distributed in or near the strata outcropping area of the upper member (J2 h2) of the Middle Jurassic Huakaizuo Formation in the ore-bearing formation, and there are metallogenic fault structures. Among them, there are copper metal geochemical anomalies in the two minimum prediction areas of Houshan and Kongtong, which have certain prospecting significance. The Jinman minimum prediction area has proven medium-sized copper deposits. The prediction basis is full and the metallogenic matching degree is high, which shows a certain resource potential. The two class B minimum prediction areas are distributed in the northern and southern parts of the study area. There are ore-bearing formations, metallogenic fault structures, and copper metal geochemical anomalies, and the prospecting prospects are good. There are ore-bearing formations, fault structures, and geochemical anomalies in the distribution areas of the four class C minimum prediction areas. To sum up, the predicted areas delineated above have good prospecting prospects in terms of the distribution of ore deposit points, ore-bearing formations, metallogenic fault structures, and the distribution of geochemical anomalies. The prospecting prediction map is shown in Figure 5.
5. Conclusions
The geochemical data from the Jinmanian area of Lanping do not follow the normal distribution, so it is therefore not appropriate to use the traditional iterative method to calculate the lower anomaly limit of the target elements, thus the fractal method is used to calculate the lower anomaly limit of the geochemical elements. Because this method is based on the change characteristics and structure of geochemical data, the calculated results are more objective and suitable for prospect mapping in similar areas. According to the above prediction results, the following conclusions are drawn.
(1) Both geochemical fractal anomalies and remote sensing geological anomalies are closely related to mineralization. In the extraction of geochemical anomalies, the introduction of fractal methods is beneficial to the extraction of weak geochemical anomalies. Iron-stained anomalies are directly related to pyritization. Selecting these two factor layers to establish the weight of evidence model guarantees the accuracy of prospecting prediction.
(2) The weight of evidence method can link discrete events (mineral points) with related factor layers and calculate the weight of evidence according to the importance to metallization. The use of GIS overlay technology can reflect the characteristics of geological space, which is conducive to metallogenesis. The accurate interpretation of ore information and the delineation of the prospecting prediction area is more objective.
(3) The prediction results of this paper more accurately delineate the prospecting area of this area, and they lay a solid foundation for future prospecting.
Author Contributions
Conceptualization, Z.C.; Methodology, Z.C.; Formal analysis, Z.C.; Data curation, M.L. All authors have read and agreed to the published version of the manuscript.
Funding
This research received no external funding.
Institutional Review Board Statement
Not applicable.
Informed Consent Statement
Not applicable.
Data Availability Statement
Not applicable.
Conflicts of Interest
The authors declare no conflict of interest.
References
- Aliyari, F.; Yousefi, T.; Abedini, A.; Calagari, A.A. Primary geochemical haloes and alteration zoning applied for gold exploration at the Zarshuran Carlin-type deposit, northwestern Iran. J. Geochem. Explor. 2021, 231, 106864. [Google Scholar] [CrossRef]
- Khaleghi, M.; Ranjbar, H.; Abedini, A.; Calagari, A.A. Synergetic use of the Sentinel-2, ASTER, and Landsat-8 data for hydrothermal alteration and iron oxide minerals mapping. Acta Geodyn. Geomater. 2020, 17, 311–328. [Google Scholar] [CrossRef]
- Chen, J.; Chen, Y.; Wang, Q. Research on metallogenic prediction based on multivariate information of GIS. Earth Sci. Front. 2008, 15, 18–26. [Google Scholar] [CrossRef]
- Behyari, M.; Rezaei Azizi, M.; Abedini, A. The role of the structure on the fluorite mineralization: Insight to fluid inclusion and alteration map of the Lall-Kan fluorite deposit, NW Iran. Acta Geodyn. Geomater. 2020, 17, 379–390. [Google Scholar] [CrossRef]
- Yousefi, T.; Aliyari, F.; Abedini, A.; Calagari, A.A. Integrating geologic and Landsat-8 and ASTER remote sensing data for gold exploration: A case study from Zarshuran Carlin-type gold deposit, NW Iran. Arab. J. Geosci. 2018, 11, 482. [Google Scholar] [CrossRef]
- Wang, G.; Chen, J. Study on Metallogenic Regularity and Metallogenic Regularity of Xilaokou Gold Deposit, Shandong Province. Earth Sci. 2008, 15, 27–32. (In Chinese) [Google Scholar]
- Zhao, P.; Xia, Q. The Development of Mathematical Geology in China. Earth Sciences. J. China Univ. Geosci. 2009, 34, 225–230. (In Chinese) [Google Scholar]
- Su, H.; Ge, Y.; Liu, D.; Xiao, K.; Wang, S.; Ning, S.; Zhao, X. Metallogenic Prediction System (EWM) based on GIS-based evidence weight method. Geol. Explor. 1999, 35, 44–46. [Google Scholar]
- Cao, Y.; Hu, G. Spatial model of metallogenic prediction based on GIS for delineating “5P” prospecting area and its application. Earth Sci. 1999, 24, 409–412. [Google Scholar]
- Lv, P.; Zhu, P.; Bi, Z.; He, F.; Xia, Y. Prediction and Evaluation of non-ferrous metal Prospecting in Hexigten Qi Based on GIS and weight of Evidence Model. Geol. Explor. 2011, 47, 909–917. [Google Scholar]
- Chen, J.; Dong, Q.; Hao, J. Metallogenic Prediction of porphyry molybdenum and copper mineral Resources in Northern Sanjiang Section, Qinghai Province. J. Petrol. Mineral. 2011, 30, 519–529. [Google Scholar]
- Xu, S.; Chen, J.; Ye, J. Application of weight of evidence method to the Metallogenic prediction of the Northern Sanjiang Copper and Gold Deposit. Geol. Explor. 2006, 42, 54–59. [Google Scholar]
- Shen, W.; Du, H. Application of GIS-based weight of evidence method to metallogenic prediction of copper resources in western Zhejiang Province. J. Geol. 2014, 38, 245–255. [Google Scholar]
- Zhang, J.; Wen, H.; Zou, Z. Characteristics of ore-forming fluid and its Metallogenic Significance in the Gold-Manmanic vein copper deposit, Lanping Basin, Northwest Yunnan. J. Jilin Univ. (Earth Sci. Ed.) 2017, 47, 706–718. [Google Scholar]
- Wu, N.; Jiang, S.; Liao, Q.; Pan, J.; Dai, B. Lead and Sulfur Isotope Geochemistry and Source of Metallogenic Materials of vein copper deposit in Lanping-Simao Basin, Yunnan Province. Acta Petrol. Sin. 2003, 19, 799–807. [Google Scholar]
- Ge, L.; Yang, J. Existence and evidence of EW-trending concealed tectonic belt in Northwest Yunnan. Yunnan Geol. 1999, 33, 155–167. [Google Scholar]
- Hou, Z.; Song, Y.; Li, Z.; Wang, Z.; Yang, Z.; Yang, Z.; Liu, C.; Tian, S.-H.; He, L.; Chen, K. New Types of Pb-Zn-Ag-Cu deposits in the collision orogenic belt of Qinghai-Tibet Plateau: Basic Metallogenic characteristics and structural ore-controlling model. Miner. Depos. 2008, 27, 123–144. [Google Scholar]
- Liu, J.; Li, Z.; Pan, J.; Liu, X.; Zhang, G.; Liu, Y. Source of Ore-forming Materials of copper deposit in sand shale of Lanping-Simao Basin. Geol. Explor. 2000, 36, 16–19. [Google Scholar]
- Gong, P.; Ma, Z. Identification and evaluation of regional geochemical anomalies in mineral prediction. Earth Sci. J. China Univ. Geosci. 2013, 38, 113–124. [Google Scholar]
- Xu, S.; Zhao, T.; Zhu, Z. Application of ArcGIS weight of evidence model in copper prospecting prediction. Geol. Explor. 2013, 49, 981–989. [Google Scholar]
- Liu, X.; Chen, J. Application of GIS-based evidence weight method in Prospecting prediction of Alukerqinqi Area, Inner Mongolia. Geol. Bull. China 2010, 29, 571–580. [Google Scholar]
- Wang, G.; Chen, J. Prediction and evaluation of copper polymetallic prospecting in Sanjiang North Section based on GIS technology. Earth Sci. Front. 2008, 15, 27–32. [Google Scholar] [CrossRef]
- Ji, H.; Lin, R.; Zhou, Y. Discussion on some processing methods of geochemical exploration data. Geol. Explor. 2001, 37, 56–59. [Google Scholar]
- Li, F.; Pu, W.; Ran, C. Study on the source of ore-forming materials in Lanping Jinmancopper Deposit. J. Kunming Inst. Technol. 1992, 17, 8–15. [Google Scholar]
- Dai, J.; Wang, R.; Wang, R. Prospecting Prediction of Porphyry Copper Deposit in the Middle part of Bangong Hu-Nujiang Prospecting Belt, Xizang Province Based on Alteration Information Extraction. J. Earth Sci. 2012, 33, 755–762. [Google Scholar]
- Yang, J.; Xu, G.; Yang, Z. The comprehensive prospecting information and Prospecting Prediction of Gold Deposit in Shaquanzi Area of Eastern Tianshan Mountains. Geol. Explor. 2003, 39, 21–24. [Google Scholar]
- Liao, G.; Chen, J.; Liu, D. Application of comprehensive analysis of remote sensing geology and geochemical exploration in prospecting prediction of Lanping Basin. Remote Sens. Land Resour. 1999, 4, 17–22. [Google Scholar]
Figure 1.
Geological map of the Jinman–Lanping area (a,b) [10].
Figure 1.
Geological map of the Jinman–Lanping area (a,b) [10].

Figure 2.
Fractal chart of Cu, Mo, and Sb (unit: ppm).

Figure 3.
Anomaly map of Cu, Mo, and Sb element combinations (unit: ppm).

Figure 4.
Remote sensing interpretation map.

Figure 5.
Prospecting prediction map.


Table 1.
Comparison of element content in surrounding rocks, tectonic rocks, and copper minerals in the Jinman deposit (ppm).
Table 1.
Comparison of element content in surrounding rocks, tectonic rocks, and copper minerals in the Jinman deposit (ppm).
| Type of Sample | Number of Samples | Cu | Pb | Zn | As | Sb | Ag | Mo | Hg |
|---|---|---|---|---|---|---|---|---|---|
| Normal surrounding rock | 34 | 48.3 | 34.1 | 76.4 | 9.5 | 14.2 | 0.12 | 1.3 | 0.26 |
| Mylonite broken porphyry | 6 | 144.2 | 84.2 | 120.3 | 14 | 17.9 | 0.33 | 2.0 | 0.18 |
| The mean value of copper sulfide | 19 | 42,670 | 168.73 | 2384.6 | 30,730 | 158,314 | 362.1 | 13.0 | 968 |
Publisher’s Note: MDPI stays neutral with regard to jurisdictional claims in published maps and institutional affiliations. |
© 2022 by the authors. Licensee MDPI, Basel, Switzerland. This article is an open access article distributed under the terms and conditions of the Creative Commons Attribution (CC BY) license (https://creativecommons.org/licenses/by/4.0/).
Share and Cite
MDPI and ACS Style
Chen, Z.; Lang, M. Research on Prospecting Prediction Based on Evidence Weight. Atmosphere 2022, 13, 2125. https://doi.org/10.3390/atmos13122125
AMA Style
Chen Z, Lang M. Research on Prospecting Prediction Based on Evidence Weight. Atmosphere. 2022; 13(12):2125. https://doi.org/10.3390/atmos13122125
Chicago/Turabian StyleChen, Zhen, and Mingde Lang. 2022. "Research on Prospecting Prediction Based on Evidence Weight" Atmosphere 13, no. 12: 2125. https://doi.org/10.3390/atmos13122125
Note that from the first issue of 2016, this journal uses article numbers instead of page numbers. See further details here.