1. Introduction
Radon is a noble radioactive gas, and half of the effective doses from all ionising radiation comes from exposure to radon and its short-lived decay products [
1]. Radon was first recognised as a health problem among miners in the United States of America [
2] and Czechoslovakia [
3]; thus, it was identified as a human carcinogenic [
4]. Afterwards, radon in indoor environments started to be monitored more systematically through national radon programmes [
5,
6,
7]. Finally, radon is identified as one of the major causes of lung cancer, accounting for between 3% to 14% of all lung cancers [
8]; consequently, it was included in the Basic Safety Standards (BSS) for protection against ionizing radiation [
9]. BSS requires that EU member states define radon reference levels, establish a radon action plan, delineate Radon Priority Areas (RPA, i.e., areas where the annual average radon concentration is expected to be higher than the reference level in a significant number of dwellings), and inform the public about their radon levels [
9].
Being chemically inert, radon has been used in many environmental studies as well. It is used as a tracer gas for investigation of volcanic activity, earthquake prediction, and groundwater movements [
10,
11,
12,
13,
14]; to improve Atmospheric Transport Models (ATM); to investigate atmospheric mixing processes; and to estimate fluxes of greenhouse gasses (GHG) using the Radon Tracer Method [
15,
16,
17,
18,
19,
20,
21,
22,
23,
24,
25,
26,
27,
28].
To increase the accuracy of both radiation protection measurements and those used for GHG modelling, traceability to SI units is needed for radon release rates from soil, radon concentration in the atmosphere, and valid models for radon dispersal. Both radiation protection and climate research need to improve the accuracy of low-level radon concentration measurements and to ensure traceability to SI units. In this regard, the metrological project EMPIR 19ENV01 “Radon metrology for use in climate change observation and radiation protection at the environmental level” (traceRadon) [
29] aims to develop traceable methods for the measurement of outdoor low-level radon activity concentrations in the range of 1 to 100 Bqm
−3 with uncertainties of 10% (k = 1), and to improve the accuracy of radon flux measurements. Both the climate and radiation protection communities will benefit from these data [
29,
30]. Improving accuracy and providing measurements capable of resolving diurnal variations will help climate change research by providing necessary inputs for the Radon Tracer Method, which is used to better estimate greenhouse gases emission [
16,
28].
Moreover, one of the aims of the project (in work package WP4) with respect to the issue of radiation protection is to explore the use of radon flux and outdoor (atmospheric) radon data for environmental problems in order to predict RPAs based on concepts from Geogenic Radon Potential (GRP) and the Geogenic Radon Hazard Index (GRHI), described in detail in the following section. A literature review focusing on the use of outdoor radon for the prediction of RPAs has been published recently within the scope of traceRadon [
31], and this review is focused on the use of radon flux for radiation protection purposes and the prediction of RPAs.
In
Section 2, concepts and existing methods for delineating RPAs are discussed. The general use of radon flux is described in
Section 3.
Section 4 discusses factors influencing radon flux that help to understand its properties, and in
Section 5, different radon flux measurement techniques are summarised. Then,
Section 6 reports a literature overview of radon flux surveys performed worldwide and the correlations of Rn flux with other radon quantities, such as indoor radon concentrations, radon in soil gas,
226Ra content in soil, and gamma dose rate. An overview of different radon flux models developed for atmospheric transport studies is given in the
Section 7. Finally, the possibility of using radon flux measurements or models for radiation protection purposes is discussed.
2. Radon Priority Area—RPA
Maps of environmental radioactivity are important on a local, regional, national and even worldwide scale as they assist in the planning and decision making of both authorities and citizens.
The identification of RPAs is a sensitive task as it raises some obligations for the region under consideration [
9]. In such areas, radon measurements in workplaces are required, and awareness programs and a strategy for reducing radon exposure in dwellings should be established. In some countries, radon measurements in workplaces are required outside of the RPA also [
32]. A definition of RPA was not given precisely in BSS; instead, it was left to member states to provide their own definition of the RPA, which as a consequence led to different RPA maps. Therefore, many efforts have been made to discuss a concept of the RPA [
33,
34,
35,
36,
37].
According to the questionnaire on indoor radon surveys issued in European countries, 11 out of 19 countries have reported 300 Bqm
−3 as the Reference Level (RL), while some have chosen 100 or 200 Bqm
−3 as a RL [
38]. Most of the countries participating in the questionnaire have defined RPA on the basis of the percentage of dwellings having indoor radon concentration above RL, i.e., an area is defined as an RPA if the probability of the indoor radon concentration is above certain RL. This probability (threshold) ranges from 1% in the case of Malta and the United Kingdom up to 30% in the case of the Czech Republic [
38]. Norway defined all of its territory as RPA. Two other definitions of RPA were also used: an area is defined as RPA (i) if the mean indoor radon concentration of the area is above RL, or (ii) if certain conditions are fulfilled (e.g., the gamma dose rate is above a certain level) [
36].
As reported in the BSS, the identification of RPA needs a relatively simple statistical procedure that involves a few types of input data. The most common approach uses data that are expressed in the same method of measure, e.g., indoor radon concentration and the Reference Level. In that case, in order to get a reliable estimation of the RPA, it is important to carry out representative indoor radon surveys [
6,
7,
39,
40].
Other approaches involve the use of qualitative (non-measured) input data, such as the type of geology and/or lito-stratigraphic data, and quantitative data with different unit measures (e.g., geological, geochemical, morphological, and meteorological data) that in general represent proxy variables related to potential radon available at the Earth’s surface (e.g., GRP or GRHI), while indoor radon concentration is used for the determination of the RPA [
41,
42,
43,
44,
45]. The GRHI could be conceptualized in terms of a measure of the “Rn proneness” of an area due to geogenic factors, i.e., a tool to decide whether an area is as RPA as the one used for the definition of the RPA. GRHI incorporates available geological data [
44]. On the other hand, GRP is mainly defined through the “Czech method” [
41], combining the radon in soil and permeability measurements, which depends on soil properties, hydrology and geology and, therefore, is limited by the availability of the required data [
44].
The use of different available input data related to radon production and migration from the Earth’s subsurface to the shallow environment, and the ability to enter buildings (e.g., measured quantities, geological data, meteorological data, and anthropogenic factors) led to the development of different mapping methods by using spatial regression techniques (ANOVA, Geographical Weighted Regression, Empirical Bayesian Regression Kriging, Machine Learning, Forest Regression) [
43,
46,
47,
48,
49,
50,
51].
In Germany, Petermann et al. (2022) have shown that reducing high radon concentrations only in RPA will affect only a small proportion of residents as less than 1% of lung cancer fatalities are attributable to radon located in the RPA [
35]. Therefore, when the aim is to reduce collective risk rather than individual, a map of lung cancer incidences would be more suitable [
35]. A decision matrix on the choice of the appropriate radon map that would best serve its purpose is proposed in Hughes et al. in [
52].
One of the tasks within the metrological research project 16ENV10 “Metrology for radon monitoring” (MetroRADON—
http://metroradon.eu, accessed on 25 November 2020) was to evaluate different mapping methods for the delineation of the RPAs and to develop a strategy to harmonise possible inconsistences of radon levels across the border [
53]. In the framework of the MetroRADON project, an intercomparison exercise of different mapping methods was performed, and it was concluded that different methods predict similar classifications of RPAs, while problems emerge only when the thresholds for the classification of RPAs are close to mean indoor radon concentrations [
54].
Since there are different criteria for the definition and identification of RPAs, it is difficult to compare maps created by different national authorities. Bossew et al. demonstrated that the identification of RPAs across country borders is affected by the type of data aggregation (e.g., the geometry of the data support) and the scale of the used support [
36]. This problem is defined as the Modifiable Areal Unit Problem (MAUP): the higher the support used to aggregate data, the more difficult the harmonisation of the results at the boundaries [
36,
55,
56,
57].
Although in the abovementioned mapping methods, many different input data were used, it could be noticed that data on radon flux were generally missing and were not included for delineation of the RPA. Radon flux measurements take a long time and, therefore, are not cheap, while soil gas measurement is simpler and faster, even when not a dynamic measurement. Radon flux gives an idea of how much radon comes out of the ground towards the atmosphere and, therefore, represents a good predictor of the radon that could enter buildings. Radon in the soil gas only gives information on the level of radon concentration in the ground, but this radon may never escape into the atmosphere. Therefore, Rn flux measurements should be very useful to identify the RPA. Consequently, the aim of this literature review is to investigate to what extent radon flux was used, or could be used, for delineation of RPA.
3. Radon Flux Applications
Radon concentrations in soil gas, ground water, outdoor and indoor air, and radon flux are used to study many different phenomena and problems, from radiation protection to earthquake prediction to hydrocarbon contamination in the soil. Although all these quantities describe parts of the same process—radon transport from 226Ra decaying to different surrounding media—different quantities are more suitable for various phenomena, and in some cases, several of these quantities can be used together. In the following paragraphs, several examples regarding the use of radon flux are listed with a short explanation.
Radon flux is used in the radon tracer method to monitor emissions of different gasses, and it is most often used for greenhouse gases. In this method, radon flux is often considered constant over time and uniform, especially when performing large-scale studies [
16,
22,
26,
58,
59,
60,
61,
62]. More recent radon flux models revealed large spatial and temporal variability [
63,
64,
65]. More details about models will be given in
Section 7 of this review. Grossi et al. (2014) improved the radon tracer method by using the model developed at the University of Huelva to calculate time-dependent values of radon flux [
17]. In this model, it is considered that the only sink for radon is radioactive decay, and that dilution by atmospheric mixing is the same for radon and for other trace gases. Therefore, the surface emissions for any trace gas can be determined if the mixing ratios for these gases and radon are known, provided that radon flux is also known [
59,
60]. The TraceRadon project aims to build a metrological chain to ensure high-quality flux measurements that could provide increase data input for the radon flux method [
30]. Some of the gasses investigated in different studies include CO
2 [
26,
58,
66], CH
4 and N
2O [
21,
59,
67], CO
2, CH
4, N
2O, and CFCs [
22], CH
4 [
16,
17,
60], CO
2 and CH
4 [
61], N
2O [
62] and H
2 [
68].
As there is large enrichment of
222Rn concentration in groundwaters compared to surface waters,
222Rn is used as a tracer to identify areas with groundwater discharge [
69,
70]. From continuous measurements of
222Rn in water, radon fluxes can be calculated for further used to estimate water fluxes that are otherwise difficult to measure [
69,
70].
Radon flux is also used to plan, monitor, and evaluate the remediation of uranium mine and mill sites [
71]. Ota et al., have investigated the effectiveness of clay-covered soil surfaces in radon flux suppression. From 80 days of continuous radon flux measurements of clay-covered soil surface and bare soil surface, it was found that suppression of the mean radon flux was 80% [
72] In the USA, regulations require that radon flux from active uranium mill tailing should not exceed 740 mBqm
−2s
−1 [
73]; however, although remediation is designed to fulfill requirements for radon flux, monitoring is not mandatory [
74,
75]. In Argentina, radon flux measurements are performed periodically in mining and processing sites [
76]. Radon flux is also measured in India [
77]. Radon flux was measured to evaluate the effectiveness of earthen cover after 20 years of service [
75], as well as the effects of vegetation, clay cap, and environmental variables [
78]. Due to high radium content, radon flux measurement is also of interest for phosphogypsum piles and their remediation [
79].
Very high values of radon flux can be found over active faults, so radon flux measurements can be used to identify faults [
80,
81]. Various researchers have also performed measurements along and perpendicular to the fault [
82,
83]. A study by Richon et al. found that superficial soil can mask faults, causing radon fluxes to be indistinguishable from background levels [
84]. On the other hand, radon flux measurements, especially over faults, can be used to predict earthquakes [
85]. Steinitz et al. found a statistically significant relation between radon flux and weak earthquakes during a multiyear study [
86]. A study by Yakovleva and Karataev showed that using radon flux in combination with radon concentration in soil gas may improve the sensitivity of predictions, compared to using only one of these parameters [
87].
Radon concentrations in caves can be calculated based on radon flux [
88].
Radon flux can be used for radiation protection purposes, which will be further investigated in this paper. For example, Lucchetti et al. integrated gamma dose rate measurements with radon and thoron flux measurements to assess people’s exposure to natural radiation and potential indoor radon [
89]. However, radon exhalation was measured from soil samples, not in situ. Ramola et al. (2011) used radon flux to estimate indoor radon concentrations [
90]. However, radon flux was also calculated based on the radon concentration in soil gas and not measured. Stavitskaya et al. considered radon flux to carry out assessments of the radon risks of building plots [
91]. Baeza et al. measured radon flux together with other parameters and indoor radon concentrations, and showed that radon flux alone is sometimes a good predictor of indoor radon concentrations, but in other cases, the correlation is much weaker [
92]. Even negative correlations have been found in some cases [
93]. Leshukov et al. investigated correlations between coal mine locations and radon flux, as well as indoor radon concentrations, to identify areas where radon preventative measures need to be taken during construction [
94].
Another important topic related to radiation protection purposes concerns building materials (commonly referred to as exhalation rate), which are the second most important source of indoor radon after soil. Building materials rich in
226Ra, such as granites or tuffs, represent a significant source of indoor radon [
95,
96]. The contribution to the indoor radon concentration from building materials is even more pronounced in energy-efficient buildings because an increase in the airtightness of homes increases the accumulation of radon indoors [
97]. As similar methods are used for radon flux measurements from soil and building materials, some references on building materials are used in this review; however, detailed analysis of radon flux measurements from building materials is out of the scope of this review.
In the reviewed literature, the amount of radon activity that exhales each second per square meter is called “radon flux” or “radon exhalation rate”. In this manuscript, the term “radon flux” is used. Radon flux is most commonly expressed in mBqm−2s−1 or Bqm−2h−1. However, when radon flux was expressed in atoms cm−2s−1, conversion to mBqm−2s−1 was used (1 atom cm−2s−1 = 21.0 mBqm−2s−1).
4. Factors Influencing Radon Flux
Radon is formed in rocks and soil from the alpha decay of
226Ra, contained in mineral grains, with the recoil energy of 86 keV. If placed close to the surface of the grain, radon atoms could leave the grain and reach interstitial space (pore), and if they have enough energy left, they could enter surrounding soil grains and become trapped. Although radon atoms can diffuse through the grains into the pores, the diffusion coefficient of radon in solids is very small; hence, a diffusion length is very small too (10
−32–10
−13 m). This process could be neglected compared to the recoil [
98,
99,
100]. The amount of radon that escapes the rock/soil grain into the pore space with respect to the number of radon atoms that are produced in the grain is defined as the emanation factor
ε. There are numerous physical factors affecting radon emanation, such as the radium distribution in grains; the size, shape, and crystal structure of the grain; moisture content; grain (soil) temperature; atmospheric pressure; and radiation damage [
101].
4.1. Soil Moisture
Soil moisture will reduce the speed of emanated atoms due to the much greater stopping power of water, which reduces the probability that emanating radon will embed in surrounding grain. This effect increases with the water content, up to the saturation level. The saturation is achieved faster for materials with smaller grain size [
100,
102,
103,
104]. However, it was also shown that with an increase of moisture content, the radon emanation factor decreases after reaching a peak. For different types of soil, the emanation coefficient reaches maximum at different water content: for general types of soil, emanation reaches maximum for water content of 5%; for gravel at 1–2%; and for clay at 10–15% [
105].
4.2. Emanation Coefficient
Radium distribution in solid grains also influences radon emanation. In many primary minerals, radium is distributed uniformly in the grain. In this case, the emanation coefficient is inversely proportional to the grain size until it reaches a saturated value [
106]. In the case of secondary minerals, radium is often distributed mostly on the grain surface, causing an almost constant emanation coefficient with grain size [
107]. It has been observed that radionuclides with a larger radius tend to accumulate on the grain surface, unlike smaller particles, such as potassium, which tends to be in crystal lattice [
108]. The emanation coefficient increases monotonously in the range of temperatures from −20 °C to 45 °C [
109].
In addition to “objective” physical factors, there are also experimental factors that could influence the results of emanation factors, such as the sample preparation, sample instrument, environment, and methods. Emanation factors reach values up to 0.25 for minerals, 0.40 for rocks, and 0.83 for soil, with an average of 0.03, 0.13, and 0.20, respectively [
101,
110].
4.3. Diffusion-Advection
Once the radon atom emanates from the grain, it moves from soil pores toward the surface of the soil. The most dominant transport mechanism is the diffusion as there are difference of several orders of magnitudes between radon concentrations in soil gas and the outdoor air [
98,
111]. In general, diffusion can be described by the Ficks law: the diffusion coefficient in porous materials depends on the pore structure (tortuosity), pore fluids (water), adsorption properties of the solid matrix, temperature, etc. Radon diffusion will decrease with both a decrease in grain size and an increase in water content [
100,
112]. Mainly radon produced in shallow soil layers contributes to surface radioactivity due to a short diffusion length that for most soil ranges between 0.5 m and 1.5 m [
112,
113].
Radon in the soil can also be transported to the surface by advection processes due to pressure differences. The influence of meteorological conditions occurs near to the surface, while at greater depths, advection is only due to pressure changes (i.e., faults and fractures) and the presence of gas carriers, such as CO
2, CH
4, and N
2 [
7,
12,
114,
115,
116,
117,
118].
Radon transfer from the parent material to the atmosphere is influenced by several physical factors, such as porosity, temperature, pressure gradients, and moisture [
119]. A good correlation between radon flux and the porosity of the material was found [
120,
121].
Bedrocks, superficial deposits, and faults (fracturing) also affect radon flux. Faults increase radon flux, and the influence of superficial deposits depends on the physico-chemical characteristics of the deposits [
82,
122,
123]. The condition of the soil surface also significantly influences radon flux. For example, if the soil surface is frozen or covered by water, the exhalation rate will be drastically reduced. Yamazawa et al. investigated the effect of snow and frozen soil on radon diffusion from the soil to the atmosphere. They found that frozen soil reduces diffusion by a factor of 2, while a 1.2 m thick layer of snow reduces radon flux by a few dozen [
124]. Upper horizons formed by weathering crust can have similar effects [
41].
When the radium rich layer is covered by a material with low radium content, exhalation is reduced. The thickness of the soil cover and other soil properties—such as compactness, water retention, and geochemistry—will affect radon flux as well [
112,
125]. It is very important to consider the perturbed ground, which can completely change all of the parameters related to radon exhalation, especially in urban areas [
126]. More importantly, radon flux can differ drastically even among adjacent building plots, therefore causing high local spatial variations. Seismic activity [
85,
127,
128], and also traffic and other urban vibrations [
126], can cause large temporal variations in radon flux also.
4.4. Moisture and Temperature
The influence of water content is opposite for emanation and exhalation. The combined effect on radon exhalation is such that exhalation increases with the water content until “saturation” is achieved. At this point, radon emanation does not increase with water content, but the diffusion through the water is much slower than diffusion through the air, causing the exhalation to decrease with increased water content. Therefore, radon exhalation shows maximum value at some level of water content, which depends on the soil properties. For many materials, maximum exhalation is achieved for water content of several percent to 10%, and a significant drop in exhalation is observed for water content above 25% [
71,
112,
129,
130,
131,
132]. In
Figure 1, the typical dependence of radon flux as a function of soil moisture content is presented [
129].
The temperature also affects different processes occurring in the soil. Increasing soil temperature reduces adsorption and increases the emanation coefficient, thereby increasing the concentration of radon in soil gas [
111]. The diffusion coefficient also increases with the temperature; consequently, overall, radon exhalation increases with the temperature. Ambient temperature weakly affects exhalation when it is lower than the soil temperature. However, if the ambient temperature is higher than the soil temperature, it will further increase radon exhalation [
100,
111]. The variability of radon flux from the same experiment in one period mirrored the changes in the air temperature, while in another period no regular changes of radon flux in tandem with air temperature were observed, as shown in
Figure 2 [
133].
Radon exhalation is also affected by other metrological parameters. Light rainfall does not affect exhalation a lot, but heavy rainfall can saturate the soil, greatly reducing the exhalation process. Average yearly radon flux can be significantly different for rainy and dry years [
74,
100,
111,
134]. Measured radon exhalation from soil constantly decreased with the precipitation, starting from 19.6 ± 0.7 mBqm
−2s
−1 for dry soil, over 12.7 ± 0.3 mBqm
−2s
−1 after 10 mm of rain per day, 10.3 ± 0.2 mBqm
−2s
−1 (additional 14.6 mm of precipitation) to 8.7 ± 0.2 mBqm
−2s
−1 (for another 25.9 mm 3 days after) [
135].
4.5. Pressure
In general, radon flux is expected to decrease with increasing ambient pressure [
111]. The correlation is difficult to demonstrate because usually many different parameters are changing at the same time [
74]. Furthermore, the changes in pressure are cyclic; thus, long-term average fluxes are not greatly dependent on the pressure [
112]. Additionally, it was found that an increase in wind speed increases radon flux [
74,
111] and the correlation between air humidity and radon flux is weak [
136]. Daily variation of radon flux with pressure is shown in
Figure 3 (taken from [
137]).
4.6. Other
Relief and vegetation can also have influence on radon flux. Vegetation has direct influence because radon transports through plants. Plants can take up radon from the soil and release it into the atmosphere, effectively serving as radon pumps. Indirect influence is the influence on the soil water content, microclimate, and gas permeability. The influence of relief is indirect because soil development and water content depend on the topography [
126].
A survey of literature shows that although most authors find similar trends in the influence of different parameters on radon flux, there is no consensus. For example, Yang et al. found a negative correlation between soil temperature and radon exhalation [
136]. Kropat et al. found almost no correlation between secondary permeability, as well as faults and fractures, and radon exhalation. Furthermore, Zmazek et al. found a negative correlation between air pressure and radon flux at some measurement sites before earthquakes [
128,
138]. In recent research, no strong correlation between porosity and radon flux has been observed [
132]. All of these studies show that radon flux is a very complex process; moreover, it is not possible to construct models that are universally applicable, even in rough approximation.
Yang et al. have performed 2 years of continuous measurements of radon flux using numerous environmental parameters: soil water content, soil and air temperature, air humidity, precipitation, wind speed, and directions [
139]. A multiple regression analysis was performed by using air pressure, air temperature, soil temperature at 20 cm depth, and the soil water content. Obtained coefficients indicate that air pressure is not an important parameter, which is confirmed with similar long-term continuous measurements by Mazur and Kozak in [
133]. Positive and negative effects of air and soil temperature on radon flux were obtained, respectively. The negative effect contradicts other experimental studies and should be further investigated [
109]. As radon flux showed strong autocorrelations, including them in forecasting should increase performance significantly. This model can explain about 61% of the variation when autocorrelations are included, compared to only 28% when correlations are excluded [
139].
4.7. Diurnal and Seasonal Variations of Radon Flux
Daily outdoor radon variations show typical behaviour, namely, high concentration in the early morning due to an inverse atmosphere mixing. The increase of temperature during sunrise increases atmosphere mixing, causing an increase of radon in the upper atmosphere [
20,
140,
141]. As the major source of outdoor radon is the radon flux from soil, it could be expected that daily variations of radon flux follow a similar pattern as outdoor radon. However, radon flux exhibits the opposite behaviour of outdoor radon concentration. The key factor leading to diurnal variation of radon flux is soil temperature, as variation of soil temperature causes variation of absolute humidity. Thus, radon flux is highest in the afternoon when the temperature is highest and, consequently, the humidity in the soil is lowest, while during the night, radon flux is lowest due to the lowest temperature of the soil (i.e., highest soil humidity). Typical diurnal variation for different seasons is presented in
Figure 4. Daily variation of radon flux measured at the campus of Munich-Neuherberg ranged from 2.5 to 50.7 Bqm
−2 h
−1 with an average of 25.3 Bqm
−2h
−1. Regarding seasonal variations, the highest radon fluxes were in March and the lowest in October [
136].
Seasonal variations of radon flux were investigated by many researchers [
63,
64,
136,
141,
142,
143,
144,
145,
146]. In summary, all these papers agree and found high exhalation rates in seasons characterised by lower precipitation, while lower exhalation rates occurred in months with higher precipitation, higher moisture content, or for frozen soils and/or snow coverage. The summer-to-winter ratio of measured radon flux ranged from almost 1 up to 2.54.
5. Radon Flux Measurement Techniques
One of the first radon flux measurements was performed 50 years ago [
147], after which many methods were developed to either directly measure radon flux or indirectly estimate it [
148]. The latter relies on available data related to parameters that are correlated with radon flux, such as terrestrial gamma dose rate,
226Ra (or even
238U) activity concentration in soil, radon in soil gas, and other physico-chemical soil properties [
148,
149,
150].
Direct radon flux measurements are performed using the accumulation method, in which the ingrowth of radon inside a container (box) placed over the soil is measured [
151].
Ingrowth of radon inside the accumulation chamber can be expressed by the following equation [
151]:
where
CRn (
t) (Bqm
−3) is the radon concentration in time
t (s);
C0 (Bqm
−3) is the initial radon concentration;
λ (s
−1) is the effective decay constant, which includes the radon decay, leakages, and back-diffusion contributions;
E (mBqm
−2s
−1) is the radon flux;
S (m
2) is the exhaling radon surface; and
V (m
3) is the accumulation chamber volume. Typical build-up of radon in an accumulation box is presented in
Figure 5. Data are fitted according to Equation (1).
Since radon flux from the ground is affected by the changing of environmental conditions, some authors tend to perform in-laboratory measurements of radon flux, thereby reducing the uncertainty of measurements and increasing the reproducibility of the measurements [
95].
The main methods used to estimate radon flux are:
Closed chamber methods (accumulation chamber method), in which the container is tightly fixed to the ground (
Figure 6);
Open-chamber method (flow through method), in which measurements are performed in a well-ventilated accumulator using a constant flow pump with a known air exchange rate [
149].
Different measuring methods could then be applied to measure the radon concentration inside the container:
Integrating measurement of radon build-up in the container using passive devices;
Instantaneous measurement of radon concentration in the container after a certain period of time (grab sampling);
Continuous measurement of the radon build-up in the container using active devices.
5.1. Integrating Measurement
Typical passive devices used for integrating measurements are: charcoal canisters, electrets, and solid-state nuclear track detectors. All integrating devices use the inside-chamber-technique, in which the detector is placed inside the chamber.
One of the first radon flux measurements was made in the USA using activated carbon accumulators [
153]. In this procedure, a canister containing activated charcoal is placed upside down with the open side of the container facing the soil. The edges of the container should be sealed onto the ground to prevent escaping. The detection limit depends only on the efficiency of the gamma spectroscopy, since activated charcoal has an efficiency of almost 100% of adsorbing radon when the sampling time is less than 24 h [
74]. Some of the surveys performed using charcoals can be found in [
79,
154,
155,
156,
157].
Measurements of radon flux from soil were also performed using electrets EPERM (Rad Elec Inc., Frederick, MD, USA) [
158]. This consists of an H-type chamber that is a hemispherical dome of 960 mL volume with an electrically charged electret at the internal top of the H-chamber. Radon enters the H-chamber from the 15-diameter Tyvek window [
159,
160]. The use of the electret system is convenient as it is not affected by environmental conditions (temperature difference and humidity). Kitto has performed one-year continuous measurements with electrets exposed by 12 h intervals. Thus, although an integrating method, measurement with electrets allowed the measurement of daily variations as well [
145]. AN intercomparison of radon flux measurement methods conducted in Spain revealed that results obtained with electrets are comparable to ones obtained with continuous monitoring [
148].
Solid state nuclear track detectors (SSNTD), due to their low sensitivity, are usually used for long integration timescales. Nuclear track detectors are placed inside the chamber and the number of tracks corresponds to the integrated exposure of a detector to a radon flux [
93,
161,
162]. When specially designed discriminative Rn/Tn detectors are placed in the chamber, both radon and thoron fluxes can be measured [
163]. More often, nuclear track detectors are used for radon flux measurements of building materials, whose detailed analyses are out of the scope of this review [
164,
165,
166,
167].
By simulating different environmental conditions, a few integrated radon measuring devices (such as nuclear track detectors, charcoal canisters, and electrets) were exposed to different temperatures in the range from 10 to 30 °C and relative humidity from 30% to 80%. It was shown that only the response of charcoal canisters is significantly influenced by different environmental conditions [
168].
5.2. Instantaneous Measurements
After a certain period of time allowing the build-up of radon in the accumulator, air from the accumulator is grabbed and transferred into scintillation cells, usually coated with the scintillator material ZnS(Ag). Upon reaching the cell, radon takes 3 h to achieve equilibrium with short-lived progeny, after which measurement can start. In certain cases when measurement of both radon and thoron are required, measurement can take place 10 min and 30 min after the beginning. Several surveys were performed by using scintillation cells (Lucas cells) [
136,
145,
169,
170,
171,
172,
173].
Also, the radon flux from soil is measured with the Electrostatic-Radon-Sampler for the determination of the
222Rn gas concentration (ERS-2, TRACERLAB Co., Koeln, Germany,
Figure 7) [
174,
175]. The ERS-2 device was operated with an Alpha-Spectroscopy detector and multichannel analyser (MCA) with 256 channels. The ERS-2 was placed on the soil surface with sealed condition. The measurements were performed for 4–5 cycles (cycle time was 10 min), giving the radon gas concentration of each cycle in Bqm
−3. Obtained data were linear simulated to derive the flux rate in mBqm
−2s
−1 by using Tracerlab-Spectrum-Software [
174,
175].
The described principle of the radon flux measurement is used in electrostatic precipitators—devices constructed to reduce radon concentration in workplaces [
176,
177].
5.3. Continuous Measurements
Continuous measurements of radon could be performed by any active device. In the case of instruments based on alpha spectrometry, discrimination between radon and thoron is easily achieved. In cases where it is not possible to discriminate between the two isotopes, it is necessary to introduce a delay line in order to eliminate the influence of thoron due to its decay along the line. Active devices have higher sensitivity than passive devices. Their response time could be enough to continuously monitor ingrowth of radon and, thus, to investigate the influence of different parameters on radon flux. Some of the used active devices are: AlphaGUARD [
72,
133,
134,
148,
150,
178,
179] RAD7 [
89,
152], RTM2200 [
152].
Scintillation cells could also be used in the flow-through method to continuously measure radon [
180]. In certain cases when radon and thoron measurements are required, a double-cell system can be used with a delay line. In the scintillation cell close to the chamber, both radon and thoron are measured, while most of the thoron decays along the delay line, and in the second scintillation cell primarily radon is measured (
Figure 8) [
112,
181,
182].
Another specific device with scintillation cells is an automatic measuring apparatus called an exhalometer, which consists of six Lucas cells for measuring radon flux and additional sensors for monitoring environmental parameters [
136].
5.4. Difficulties and Challenges of Rn Flux Measurements
In general, measurement using an accumulation box could lead to measurement bias. Once the accumulation box is placed on the ground, it will cause a disturbance of free radon flux from the soil. Inadequate placement of the chamber could lead to improper air tightness and, therefore, to radon leakage from the chamber. In time, with the build-up of radon concentration in the exhalation container, an effect of back diffusion takes place, causing the underestimation of free surface exhalation [
151,
183]. With a proper choice of radon measurement technique these biases could be compensated. From continuous measurements of radon concentration in the accumulation container by active device, it is possible to fill the build-up curve in the container and then estimate the effective decay constant, allowing us to deduce the leakage and the back diffusion. Otherwise, using passive detectors instead will lead to an underestimation of radon flux [
184]. Another source of measurement bias could be variations in environmental conditions inside and outside the container. The measurements should be short enough to avoid potential changes inside or outside the container. In order to avoid back diffusion, different approaches could be used: charcoal detectors, flow through methods, or short accumulation times [
185,
186].
Based on the numerous measurements of radon flux using the accumulation chamber method, a standardized protocol has been created and turn into the ISO 11665-7:2012
Accumulation method for estimating surface exhalation rate [
187].
However, measurement of radon flux still remains challenging. A general problem of the usage of an accumulation chamber is the disturbance of the soil, which results in an underestimation of the radon flux inside the chamber [
186,
188]. Gutiérrez-Álvarez et al. investigated the influence of the insertion depth of the accumulation chamber on radon flux [
189]. Onischenko et al. have investigated the size of the chamber necessary to perform reliable measurement of radon flux [
190]. Since there are numerous methods used for determination of the radon flux, intercomparisons are necessary to test the responses of different measurement systems, and to identify and quantify possible inconsistencies among them, which will help in harmonising different radon flux measurements and estimations [
148,
190].
In order to fulfil the requirements of the traceRadon project, measurement systems should have fast response times in order to measure the diurnal variations of radon flux. Either the flow through method should be used, or in the case of the accumulation chamber method, there should be the ability to flush out the radon from the chamber after each accumulation period. Some of these systems were already described [
136,
181]. Intercomparison of some of these systems recently developed is described within Rabago et al. (2022) [
190].
6. Rn Flux Surveys and Correlation with Other Rn Quantities
Large scale radon flux measurements are difficult to achieve compared to indoor radon surveys. There is a certain nontrivial protocol that has to be followed when performing radon flux measurements. Special care should be paid when installing measuring device on the soil to avoid leakage, back diffusion, and disturbance of the area covered by the accumulation chamber, or some other appropriate method should be used (as discussed in the previous section). In this section, radon flux surveys performed in several countries are summarised. They are listed in the alphabetical order of the country name. For each survey, the number of measurement locations, type of survey, type of deployed detectors, measurement duration, and an average value and a range of obtained radon fluxes are given in
Table 1. It is also indicated whether the corresponding radon flux map was produced. Those maps could serve for qualitative (visual) comparisons of indoor radon or radon potential maps of the same region if such maps exist. The correlation of measured radon fluxes with other radon quantities such as the activity concentration of
226Ra in soil, indoor radon concentrations, radon in soil gas, gamma dose rate and outdoor radon concentrations are given in
Table 2. At the bottom of
Table 1 and
Table 2, data used to validate radon flux models (discussed in chapter 7) are added as well.
6.1. China
Field measurements of radon flux, radon in soil, and radionuclide content in soil were performed at 31 locations covering 4 regions in China in the period from June to August. Radon flux measurements were performed with an alpha-spectrometer Electrostatic Radon Sampler (ERS-2) of TRACERLAB (Germany) placed on the soil surface at sealed conditions. Measurements were performed in four to five 10 min cycles [
174]. Soil gas measurements were performed at 60 cm depth, while the
226Ra activity concentration was obtained by using HPGe detectors. The obtained correlation coefficients between the radon flux rate and soil radon concentrations and the radium content in the soil were 0.705 and 0.748, although the measurements were performed on different type of soils with different porosity and moisture saturation [
174].
6.2. East Asia
Radon flux and outdoor radon concentrations were continuously measured at 20 measuring sites in Eastern Asia for one year. At each location, the soil sample for determination of the
226Ra activity concentration was collected. Radon flux measurements were performed with an accumulation box with a constant flow rate of 0.25 h
−1. Passive Rn/Tn discriminative detectors [
191] were deployed seasonally (4 times 3 months). High correlations between radon flux and
226Ra activity concentration (0.8394) on one side and outdoor radon concentrations (0.7874) on the other side were obtained.
Annual average radon flux at 20 measured sites ranged from 6.9–59.6 mBqm
−2s
−1. Such a large variation could be explained by differences in
226Ra content, soil texture, and meteorological conditions among sites [
165].
6.3. Greece
Radon flux was measured in six locations of the Greek early warning system network [
177]. The set-up for radon flux measurement from the soil consisted of AlphaGUARD that was placed inside the 35 L accumulation box with one side open and faced to the ground. Accumulation of radon in the box was recorded every 10 min during 21 h of measurement. Simultaneously, in-situ gamma spectrometry measurements were performed at 1 m height. Mean radon fluxes from soil in 6 locations ranges from 19.1 ± 6 Bqm
−2h
−1 to 44.3 ± 5 Bqm
−2h
−1 A strong correlation (R
2 = 0.81) was observed between mean radon fluxes and the mean total gamma dose rate. A very strong correlation (R
2 = 0.92) between mean radon flux values and mean
226Ra concentrations in the soil was deduced from data in
Table 3 in reference [
179]. At one location, radon flux was measured 113 times in a period of 6 years. An average value of 21.1 ± 3 Bqm
−2h
−1 was obtained. In the same location, 6 times radon profiles from 0 cm to 100 cm at the 10 cm steps were measured using 2 electrets per layer. From the determined radon concentrations at different profiles and from properties of the soil, radon flux was determined by using a general transport model that includes diffusion and advection. The obtained mean value was 26.7 ± 4.5 Bqm
−2h
−1. Good agreement between the measured and derived radon flux indicate that the diffusion-advection model is adequate for prediction of radon flux from soil.
6.4. India
Gusain et al. have investigated the radon risk in selected dwellings of Garhwal Himalayas. Indoor radon concentrations were measured using SSNTD for a period of 90 days [
192]. From the same locations, 20 soil samples were collected and radon flux and
226Ra content in soil were measured in the laboratory afterwards. Radon flux measurements were performed using the accumulation chamber method with SSNTD being exposed for three months. Obtained indoor radon concentrations ranged from 13 ± 2 Bqm
−3 to 178 ± 8 Bqm
−3 with an average of 61 ± 5 Bqm
−3. The concentration of the radium ranged from 24.2 ± 4.9 Bqkg
−1 to 146.0 ± 12.0 Bqkg
−1, while the radon flux per mass was between (0.43 ± 0.05) 10
−5 Bqkg
−1 h
−1 and (20.10 ± 0.11) 10
−5 Bqkg
−1h
−1 with an average of (1.95 ± 0.10) 10
−5 Bqkg
−1h
−1. A strong correlation coefficient of 0.7 was found between radon mass flux and radium activity, while the correlation factor of 0.5 was observed between radon mass flux and indoor radon concentrations [
192].
A correlation between radon flux measured in situ and radon mass flux investigated in the laboratory from 25 samples from region of Garhwal Himalaya was 0.54, indicating that two variables are dependent [
193].
6.5. Italy
Voltaggio et al. have developed a methodology to estimate the potential maximum of radon flux from soil by in-situ measurements of Ra, Th, K concentrations and laboratory measurements of relevant geophysical parameters of soil [
194]. The
226Ra activity was measured at 46 sites, while radon flux was measured and soil samples were collected at 18 geologically representative locations for laboratory analyses in a test area of about 185 km
2 in Latium, Italy, where volcanic and sedimentary rocks crop out [
194]. Radon flux was determined in situ by measuring the growth of radon in the accumulation chamber by RAD7 device. The method derived enables both radon and thoron flux measurements [
195]. Based on the Ficks law, considering the measured emanation coefficient, water content, porosity, soil density, and Roger and Nielson’s expression for diffusion coefficient [
196], values of radon fluxes were estimated. The difference between the measured and estimated fluxes can be explained by assuming average water content of 20%. Measured radon fluxes that were higher than the maximal estimated radon fluxes indicate the additional advective component of radon flux. The maximum estimated radon flux is useful to identify radon priority areas. The corresponding radon flux map averaged per municipalities in northern Latium is shown in [
194]. On the other hand, the geogenic radon potential map of Latium created using geographically weighted regression based on the comparison of more than 7500 measurements of radon in soil gas with geological and geochemical data is shown in [
12]. Although the two maps are of different scale and density of measurements, they could be used to compare the radon flux from soil with geogenic radon potential of the same region.
In order to assess the geogenic radon and the exposure to natural radioactivity in Roma, Italy, the total gamma radiation, as well as radon and thoron fluxes, were investigated in the Caffarella valley, a green area located in the centre of Roma, where ignimbrites from the Colli Albani volcano and alluvial sediments largely crop out [
89]. Gamma radiation was measured at 128 measuring points covering an area of about 2625 m
2, while radon fluxes were measured from 12 different soil samples. Since radon flux measurements in situ are long and affected by large uncertainties due to changes in physical conditions, measurements were performed in an accumulation chamber using a RAD 7 radon monitor (Durridge Company Inc., Billerica, MA, USA) using the method described in [
95,
194]. Radon flux from soil ranged from 0.362 Bqm
−2h
−1 for alluvial sediment, to 3.829 Bqm
−2h
−1 for “Pozzolane Rosse” ignimbrite. Correlation coefficients between the radon and thoron fluxes and gamma dose rates were 0.58 and 0.71, respectively. Variable activity concentration of
40K that does not contribute to the radon fluxes reduces the correlation coefficient. Soil gas permeability is shown to be a key parameter to identify areas that could potentially lead to high indoor radon concentrations [
47,
95] and thus laboratory measurements of radon fluxes have their advantages [
89].
6.6. Japan
In order to set an action level in Japan, a 7-years long measurement campaign of radon and thoron fluxes was conducted. Radon flux measurements were performed at 111 locations covering 40 sites of 14 prefectures and classified according to the geology. Measurements were performed with the accumulation method and ZnS(Ag) as a detector [
169]. Average radon flux for different geology ranges from 1.4 ± 0.6 mBqm
−2s
−1 for kanto loam, to 10.2 ± 3.1 mBqm
−2s
−1 for acidic rock, with an average of 8.6 mBqm
−2s
−1. A correlation factor between measured and calculated radon flux was 0.487 [
172].
Radon and thoron fluxes were measured in areas with the same geology (granite and rhyolite) but different climates [
197]. Results were compared with values estimated by an UNSCEAR formula that includes: emanation coefficient, porosity,
226Ra concentration in soil, soil density, and effective diffusion coefficient [
5]. In two out of seven locations, there was good agreement between the radon measured and calculated radon fluxes. The measured values were on average by a factor of 0.65 lower than the calculated one. This discrepancy was explained by the existence of underground structures that could influence the radon transport [
197].
In another survey performed in Japan, Prasad et al. have investigated radon and thoron fluxes and gamma dose rates at eight locations in Hiroshima prefecture known as high natural background radiation area (six out of eight locations were granite) [
173,
198]. Radon flux measurements were performed using the accumulation chamber method, with a ZnS(Ag) scintillator used as the detector. During the half-hour period, measurements were conducted in continuous 30 s measuring intervals. At the same locations, gamma dose rates were measured and soil samples were collected to measure radionuclide content. Measured radon flux ranged from 3–37 mBqm
−2s
−1, gamma dose rate ranged from 66–92 nGyh
−1, and
226Ra concentration in the soil ranged from 32–93 Bqkg
−1. For similar
226Ra activity, higher fluxes occur in soil with lower water saturation. Based on data from
Table 1 from [
173], the correlation coefficients of 0.64 and 0.69 were found between radon flux and the gamma dose rate and radium content in the soil, respectively. A low correlation of 0.145 was determined between thoron flux and
228Ra in the soil. Radon fluxes were higher in areas covered by granite, compared to other types of soil. Higher values of indoor radon concentrations in granite areas, compared to other areas, could be caused by higher radon fluxes [
173].
6.7. Nigeria
In 3 different regions of the Lagos state in Nigeria, radon flux from 27 dry and wet soil samples was measured using the cover cup technique with CR-39 detectors. Detectors were deployed for 6 months. Simultaneously, at each of 27 locations, indoor radon concentrations were measured with CR-39 detectors for 6 months as well. Average surface radon fluxes in 3 different regions were 1.74 ± 0.68, 1.49 ± 0.09, and 1.17 ± 0.06 mBqm
−2h
−1 in wet samples, while slightly higher radon fluxes were observed for dry samples: 1.77 ± 0.41, 1.64 ± 0.38, and 1.45 ± 0.29 mBqm
−2h
−1, respectively. For radon fluxes of both dry and wet samples, weak negative correlation with indoor radon concentration was observed, with correlation coefficients of −0.32 and −0.30, respectively [
93]. These results are surprising as usually there is a positive correlation between indoor radon concentrations and radon concentrations in adjacent soil [
199].
6.8. Romania
Indoor radon concentrations and radon flux measurements were measured in 20 houses located in Cluj-Napoca, Romania. Radon flux was determined using the accumulation chamber method. Radon was collected on charcoal with a sampling time of 12 h. Indoor radon measurements were performed using scintillation cells. For relatively high indoor radon concentrations ranging from 100–400 Bqm
−3, low radon flux values ranging from 4–28 mBqm
−2s
−1 were obtained, with an average value of 20 mBqm
−2s
−1. The measurements were performed in the winter period, which can be a reason for the increased indoor radon concentrations and lower radon fluxes as well. The obtained results show a direct correlation between indoor radon concentrations and radon flux (see
Figure 4 in [
200]).
6.9. Russia
Stavitskaya et al. performed radon flux measurements in 2 regions: one covering 64 measurements for 3 different soil types, and another with 74 measurements for 5 different soil types [
91]. After 15 min of accumulation, air was transferred to the sampler with a sampling time of 5 min and then to the measuring device [
91]. In the first region, the content of radium in loess loams is 30 Bqkg
−1, while in argillaceous slate and porcelain clay it is about five to six times higher. In spite of the large variations of radium activity in the soil, the mean radon flux densities varied only slightly: loess loam (44 mBqm
−2s
−1) and porcelain clay (59 mBqm
−2s
−1), and even in the opposite direction for argillaceous slate (33 mBqm
−2s
−1). The radon flux for the three different soil types ranges from: 20–71 mBqm
−2s
−1 for loess loam; from 22–59 mBqm
−2s
−1 for Argillaceus slate; and from 20–130 mBqm
−2s
−1 for porcelain clay. In another region, on the other hand, a small variation of
226Ra from 140–180 Bqkg
−1, led to a wide range of mean values for radon flux for different types of soil: 110–810 mBqm
−2s
−1. The overall range of radon flux was from 60–1300 Bqm
−2s
−1. This leads to the conclusion that the specific activity of
226Ra should not be used as the main criterion for the generation of regional maps of potential radon hazard [
91].
Leshukov et al. have investigated the influence of underground coal mines on indoor radon concentrations of dwellings on site (case group) and outside the mining territory (control group) [
94]. Indoor and radon flux measurements were performed using detectors based on charcoal sorption. In total, 120 residential buildings were studied and 687 individual readings of radon flux were taken, out of which 375 were located in the territory of mines. Radon flux ranges from 8 to 3310 mBqm
−2s
−1, with the average value of 181.59 ± 13.32 mBqm
−2s
−1. The average and maximal values of radon flux in the control group were an order of magnitude lower than in the case group. The percentage of radon fluxes above 80 mBqm
−2s
−1, which is the limit below which it is not required to take radon protection measures, is 64.55. The correlation factor between radon flux and indoor radon concentrations was 0.79. Since there was not a statistically significant difference in indoor radon concentrations between the case and control group, compared to differences in radon flux, additional factors influencing indoor radon concentrations should be considered [
103].
6.10. Spain
In Spain, in order to identify main contributors to indoor radon concentrations in regions previously identified as areas with a high level of natural radiation, measurements of radon fluxes from building material and soil, along with the radon concentration in water, were measured [
201,
202]. From 50 samples of building materials analysed by gamma spectrometry to determine
226Ra,
232Th, and
40K, it was concluded that radon flux from the building material could not contribute more than 20% (with a few exceptions) to the indoor radon concentration. The contribution from water was in most cases not significant. Thus, the major contribution to indoor radon concentration should be soil. The
226Ra content from 200 soil samples ranges from 40–110 Bqkg
−1, with a mean value of 80 Bqkg
−1, which is two times higher than in other regions of Spain. A set of 30 radon flux measurements were performed in 2 different periods of the year. Radon flux was measured with an accumulation chamber placed on the soil, and air samples from the chamber were collected and measured using scintillation cells. The results ranged from 40–900 Bqm
−2h
−1, with a mean value of 162 Bqm
−2s
−1. In the second period, radon flux was between 40 and 60 Bqm
−2h
−1 due to the high humidity. It was reported in the paper that there is no clear correlation between radon flux and the indoor radon concentration, probably due to the large variability of soil parameters [
202].
In another survey performed in Spain in the province of Cáceras, designated as a radon priority area, indoor radon concentrations were measured in eight selected locations in three dwelling types: traditional (build before 1940), old (built between 1940–1980), and new (built after 1980) [
203]. At each location, five radon fluxes were measured and corresponding soil samples were taken for determination of the
226Ra activity concentration [
92]. The radium concentration in the soil, obtained by gamma-ray spectrometry using HPGe detector, ranged from 70–126 Bqkg
−1, with the mean value of 106 ± 21 Bqkg
−1. Radon flux was determined using the accumulation chamber method and AlphaGUARD (Saphymo GnbH) as a measuring device. Obtained radon fluxes ranged from 9–160 mBqm
−2s
−1, with a mean value of 66 ± 18 mBqm
−2s
−1. The mean value of the radon flux is consistent with other predictive maps of the radon flux [
64,
65,
204]. Results show that there is no correlation between the mean value of the
226Ra concentration in the soil and radon flux (calculated from
Table 1 in [
88]). Short-term measurements of indoor radon concentration were performed with charcoal canisters, while long-term measurements were performed with electrets. Indoor radon concentrations range from 110–730 Bqm
−3 for short-term measurements and 71–585 Bqm
−3 for long term measurements. The correlation coefficient between the mean value of the radon flux and indoor radon concentration was 0.82 for traditional dwellings, 0.34 for old dwellings, and 0.31 for new dwellings, indicating that radon flux from soil was not enough to explain indoor radon concentrations; however, the architectural style had an important influence as well, although this influence is very difficult to describe and model.
6.11. Syria
The radon concentration in soil gas and in outdoor air, radon flux from the soil, and
226Ra activity concentration in soil samples were measured at 36 locations in 4 governorates in Syria and compared with previously measured indoor radon concentrations [
171,
205]. High correlation coefficients from 0.80 to 0.98 were found between radon in soil gas and radon flux from soil in 3 regions, while a correlation coefficient of 0.79 between radon exhalation and indoor radon concentration was found in one governorate. Weak negative correlations were found between radon flux and the
226Ra activity concentration in soil samples in 3 regions, while a positive correlation coefficient of 0.36 was found in only one governorate (data were extracted from [
171]).
6.12. USA
Radon flux measurements were performed with electrets during one year in 12 h intervals at one location [
159,
160]. During the same period, the indoor radon concentration of the nearby family house was measured at 5 min intervals using Lucas Cells from Pylon Electronic Development Co. Ltd., (Ottawa, ON, Canada) with the meteorological parameters barometric pressure, wind speed, temperature, and rainfall [
145]. The measured radon flux ranged from 0 to 140 mBqm
−2s
−1, with an average of 37 ± 22 mBqm
−2s
−1. A slight seasonal pattern of radon flux was observed, with higher values during the dry summer months and lower values during the combination of wet and frozen ground in winter and spring times. A diurnal pattern was observed as well, with an average day to night flux ratio of 1.7. In comparison, indoor radon concentrations exhibited much stronger diurnal and seasonal variations, ranging from 50 to 1570 Bqm
−3 [
145].
Table 1.
Overview of radon flux surveys performed in some countries.
Table 1.
Overview of radon flux surveys performed in some countries.
| Country | No of Locations | Type of Survey | Type of Detectors | Meas.
Duration | Average
(mBqm−2s−1) | Range
(mBqm−2s−1) | Map Created |
|---|
| Australia [182] | 101 | National | Two filter system | 1 h | | <1–128 | |
| China [174] | 31 | | ERS-2 | 4–5 times 10 min | 17.4 | | No |
| East Asia [163] | 20 | Accum chamber with const flow | Passive Rn/Tn | 4 times 3 months | | 6.9–59.6 | No |
| Finland, Hungary [63,150] | | Several regions | Alpha-guard | | | 0–69 | |
| France [162] | 85 | Regional | LR-115 | 2 summer months | 99 | 9–837 | yes |
| Greece [179] | 6 meas. points) | Regional | Alpha-guard | 21 h (samp. time 10 min) | | 19.1–44.3 | |
| India [192] | 20 | Regional | LR-115 | 3 months | (1.95 ± 0.10) 10−5 Bqkg−1 h−1 | (0.43–20.1) 10−5 Bqkg−1 h−1 | |
| Italy [194] | 18 | Regional 185 km2 | Alpha spect. | 2 summer months | | 5–186 | yes |
| Italy [89] | 12 | | RAD 7 | 16–18h | | 0.1–1.1 | |
| Japan [172] | 111 | National | ZnS(Ag) | | 8.6 | 1.4–10.2 | yes |
| Japan [146] | 8 | Regional | ZnS(Ag) | 0.5 h (30 s measure. interval) | | 3–37 | |
| Nigeria [93] | 27 | Regional | Cover cup, CR-39 | 9 months | | 0.51–2.65 | |
| Romania [200] | 20 | Regional | Charcoal | 12 h | 20 | 4–28 | No |
| Russia [91] | 2 regions (64 + 74) | Regional | AlphaRad Plus | 15 min | 33–59
110–810 | 20–130
64–1300 | |
| Russia [94] | 687 meas. 10 meas. per location | Regional | Charcoal | | 181.59 ± 13.32 | 8–3310 | |
| Spain [202] | 30 | Regional | Scintillator cell | 2 periods | 45 | (i) 11–250
(ii) 11–17
| |
| Spain [92] | 8 loc.
3 dwell. per loc. | Regional | Aphaguard | | 66 ± 18 | 9–160 | no |
| Syria [171] | 36 (4 govern.) | | Lucas cell (ZnS) | 15–30 min | | 9–9000 | No |
| USA [145] | 1 | Local | Electret | 1 year, 12 h | 37 ± 22 | 0–140 | no |
Table 2.
Correlation of radon fluxes with other radon quantities.
Table 2.
Correlation of radon fluxes with other radon quantities.
| Country | No of Locations | Correlations with Radon Flux |
|---|
| 226Ra in Soil | Soil Gas | Indoor Air | Gamma Dose Rate | Outdoor Air |
|---|
| Australia [182] | 101 | 0.59 | | | 0.54 | |
| Australia [142] | | 0.58 and 0.22 (for 2 regions) | | | | |
| China [174] | 31 | 0.748 | 0.705 | | | |
| East Asia [163] | 20 | 0.839 | | | | 0.787 |
| Finland, Hungary [150] | | | | | 0.66 | |
| France, [162] | 85 | | | Good | | |
| Greece [179] | 6 locations | 0.92 | | | 0.81 | |
| India [192] | 20 | 0.7 | | 0.5 | | |
| Italy [194] | 18 | 0.5701 | | | | |
| Italy [89] | 12 | | | | 0.58 | |
| Japan [173] | 8 | 0.69 | | | 0.64 | |
| Nigeria [93] | 27 | | | −0.32 (wet)
−0.30 (dry) | | |
| Romania [200] | 20 | | | Figure 4 of [191] | | |
| Russia [94] | 12 | | | 0.79 | | |
| Spain [202] | 30 | | | No clear correlation | | |
| Spain [92] | 8 locations (3 dwell. per location | No correl. between averaged flux and 226Ra | | 0.82 (traditional)
0.34 (old)
0.31 (new) dwellings | | |
| Syria 1 [171] | 36 | −0.05 | 0.80–0.98
(3 regions) | 0.79
(1 region) | | |
| USA [145] | 1 | | | See Figure 1 and Figure 3 [139] | | |
7. Models of Radon Flux
Radon flux in the atmosphere is used as a tracer for validation of computer models for global chemistry and transport models [
16,
206,
207,
208].
While the majority of detectors used for indoor radon surveys are relatively simple and easy to use, even by untrained persons (citizens), radon flux measurements are complex due to different factors, such as requiring an experienced and/or trained person to perform measurements, requiring a dedicated measurement system (i.e., accumulation box and active detector), and exposing detectors to harsh environmental conditions. Furthermore, the traceability chain of radon flux measurements is missing, and there is still no harmonization between the existing radon flux systems and methods [
30,
190].
Due to the complexity of the measurements and their long duration, there are not many data in the literature on measurements of radon flux to produce a map with the required spatial and/or temporal distribution. Therefore, in order to build reliable maps of radon flux, it is necessary to use estimation models.
The earliest models describing the worldwide distribution of radon were oversimplified, while later models were more detailed. Global chemistry and transport models require accurate data on radon flux from the Earth’s surface, which led to the development of more realistic radon flux models.
7.1. First Simplified Radon Flux Models
In the 1970s, the first estimations of the mean value of radon flux from soil were made, ranging from 15.6 mBqm
−2s
−1 based on direct radon flux measurement to 25 mBqm
−2s
−1 based on
210Pb flux measurement and the assumption of atomic balance between radon flux from the surface and the removal of
210Pb [
145,
209]. Contributions from water surfaces were found to be two orders of magnitude smaller than over the continents, and thus could be neglected [
210,
211]. In the chemical trace model used for investigation of tropospheric problems (such as ozone or acid precipitation), a constant value of 20.8 mBqm
−2s
−1 of radon flux from soil was used in North America [
212]. The mean values of measured monthly radon flux were found in the range from 20.8 to 104 mBqm
−2s
−1, showing that using a constant value of radon flux is a simplification [
212].
Lee and Feicher concluded that radon flux over land should depend on latitude in order to obtain better predictions of the global transport of
210Pb [
213]. A Heaviside’s step function was assumed, with constant Rn flux of 20.8 mBqm
−2s
−1 up to 70° N and 0 mBqm
−2s
−1 for higher latitudes. Rasch et al. proposed the same step function, with the exception that radon flux above 70° N should be 10.4 mBqm
−2s
−1 [
214].
Conen and Robertson investigated radon flux measurements mainly from literature in the 1990s [
215]. In particular, data covering large areas revealed high variability, and the distribution of radon flux across latitudes was not clear [
182,
216,
217,
218]. They proposed a uniform radon flux of 20.8 mBqm
−2s
−1 for ice-free continental areas up to 30° N and then a linear decrease of flux up to 5 times smaller at 70° N. A similar latitudinal gradient of radon flux density was estimated for Asia in the winter [
219].
The need to improve the applicability of using radon as a tracer in atmospheric studies has triggered development of different models of radon fluxes from the soil in order to map its temporal and spatial variability.
Advection in most of the models is not considered as it is influenced by many meteorological parameters—such as pressure difference, temperature difference between soil and surface, and wind and precipitation—which are instantaneous and, therefore, difficult to model. Consequently, most of the models consider only the diffusion mechanism as a means of radon transport.
7.2. Model of Schery and Wasiolek (1998)
Schery and Wasiolek based their model on porous media transport theory calibrated with experimental radon flux density data [
220]. They consider the radon diffusion in a semi-infinite, homogenous soil in which the pores are partially filled with water.
The calibration was obtained from 101 experimental measurements of radon flux made with the fast emanometer (accumulator) system of Whittlestone and the Australian Nuclear Science and Technology Organisation [
182]. Data selected were mostly from mainland Australia, supplemented with data from Tasmania and Hawaii. Measured radon flux ranged from less than 1 to 128 Bqm
−2s
−1. Data collected for field campaigns was for variables such as soil moisture, temperature, radium content at 10 to 20 cm depth, soil classification, surface total gamma exposure rate, vegetation density under the emanometer, and rate of change of atmospheric pressure. A correlation study was done to obtain the calibration for every parameter in comparison to the radon flux measured. Main correlations were found with radium concentration (r = 0.59), gamma dose rate (r = 0.54), monthly precipitation (r = −0.32), and monthly air temperature (r = 0.30).
Considering the diffusion equation and the correlations found, the reformulated model keeps the proportionality to soil radium content. The soil temperature was estimated from the average monthly air temperature multiplied by a factor obtained from radon flux measurements. The soil moisture was interpreted as in a direct relationship with monthly precipitation. Radium concentration was not available for some countries; therefore, the authors estimated it following mainly aerial gamma radiation data, maps of exposure rate from gamma radiation, or uranium in stream sediments. In all those cases, experimental conversion factors were applied. For some countries, a single number for the average radium in the country was available. Where no approaches were possible, they assigned an average of 30 Bq/kg for radium concentration based on the world estimate of the NCRP (1976) [
221]. The soil moisture data were obtained from Willmott et al. [
222], and the average monthly air temperature from NOA-EPA [
223].
The result was a monthly-averaged estimation for the global radon flux density map on a 1° × 1° grid. The model predicts an average annual global flux density of 34 ± 9 mBqm−2s−1. The most significant and sensitive factor causing regional variation in flux density is soil radium content, followed by soil temperature, and moisture at comparable levels.
7.3. Model of Ielsch et al. (2002)
Ielsch et al. developed a vertical radon transport model, TRACHGEO, which calculates the radon flux density as a function of rock and soil physical and chemical properties, assuming radon transport only by diffusion and using the effective diffusion coefficient according to Rogers and Nielson [
162,
196]. The model was tested by comparison to calculated radon fluxes, with radon fluxes measured at 85 sites in Brittany, France. For the soil in the same places, soil moisture, porosity, soil thickness, and
226Ra content were determined as well. Indoor radon concentrations were measured with passive LR115 detectors for two months in dwellings located in the vicinity of places where radon fluxes were measured [
162].
The activity concentration of 226Ra in analysed soil varied from 19–182 Bqkg−1, while the radon flux density varied from 9–837 mBqm−2s−1, with the geometric mean of 99 mBqm−2s−1.
TRACHGEO code in general overestimates measurements by 45%. Predicted results are in good agreement with the measurements at 80% of the sites. From the radiological protection point of view, most questionable results are in cases of underestimated radon flux. A few of them had small exhalation value, so this difference is not significant. For the other measurements, the common factor is the proximity to faults along which radon can be transported by advection; however, this factor is not included in the transport model.
Results of the indoor radon concentrations show variation from 8 to 2896 Bqm−3 with a geometric mean of 165 Bqm−3.
Although the authors did not provide any statistical test showing correlations between radon flux and indoor radon concentrations, they stated that theoretical predictions of the radon flux showed good consistency with the measured indoor radon in the majority of cases. Analysis revealed that the major contributor to the indoor radon concentrations is the radon source, while house characteristics are considered secondary effects [
162].
7.4. Model of Szegvary et al. (2007)
It was shown that the step function describing radon flux as a function of latitude tends to overestimate Rn concentrations [
206]. Robertson et al. have shown that better model simulations, to some extent, are obtained when linear decrease of the radon flux rate with latitude is assumed [
224]. One of the indirect methods to estimate radon flux is via terrestrial gamma dose rate. Szegvary et al. have derived an empirical linear relationship between the terrestrial gamma dose rate and radon flux based on simultaneous measurements at 63 locations in Switzerland, Germany, Finland, and Hungary [
225]. Approximately 60% of the variability of the measured radon flux can be ascribed to the spatial variability of the terrestrial gamma dose rate [
150]. Using the obtained regression equation between radon flux and the gamma dose rate, a map of the terrestrial gamma dose rate extracted from the European Radiological Data Exchange Platform (EURDEP) [
226,
227] was used as input data for the map of radon flux for the European Continent [
63]. As gamma dose rates are continuously measured and stored in the EURDEP database, this allowed estimation of the temporal variation of radon flux in Europe, with a resolution of one week and spatial resolution of 0.5° both longitudinal and latitudinal. The map of radon flux reported in [
63] shows a decreasing trend with an increase of latitude similar to the proposed linear decreasing flux of [
215]. Temporal variations reveal pronounced seasonality in northern regions, with a radon flux 2.5 higher in summer than in winter, due to snow cover and moisture in winter and dry conditions during summer. In southern regions, these variations are less than 15%.
However, it is worth mentioning that higher dose rate does not necessarily lead to higher radon fluxes and indoor radon concentrations. For example, in Slovenia, indoor radon concentrations were not elevated in the region where topsoil is of granite, which had 2–3 times higher gamma dose rates than in the rest of the country. This was ascribed to the compact nature of granite, which has low permeability [
228].
7.5. Model of Sun et al. (2004)
In China, Sun et al. used a simplified one-dimensional equation of continuity, assuming only the diffusion process for radon transport [
174]. For the effective diffusion coefficient, an experimentally derived expression that considers soil porosity and volume fraction of water saturation was used [
196]. The production rate of radon in the pore space is calculated from the dry bulk density of soil, emanation factor,
226Ra activity in soil gas, and
222Rn decay constant. As an input to the model, the following data were used: (i) the
226Ra content in soil was taken from a national survey that included 7777 soil samples in 25 × 25 km
2 grid size; (ii) soil moisture distribution was derived from the mathematical model and corresponding data from 656 weather stations in China; (iii) the soil density and porosity were estimated from the nationwide survey on soil properties; and (iv) the emanation for different types of soil was taken from literature [
229].
The annual average radon flux was estimated to be 16.7 mBqm
−2s
−1 for the region of Beijing, which is in fair agreement with the measured average radon flux of 24.9 mBqm
−2s
−1 [
230,
231]. In order to test the model, radon flux was measured at 47 measuring locations using an Electrostatic-Radon Sampler ERS-2 based on alpha spectrometry. Measurement at each point lasted 4–5 cycles with duration of 10 min per cycle [
175]. Relative uncertainty between measured and modelled flux was less than 0.25 in approximately 30% of measured samples. For dry samples, with soil water content < 10%, the arithmetic mean of the measured flux was 59% of the calculated one. A model was improved by deriving linear functions between the ratio of measured and calculated radon fluxes and water content [
175].
7.6. Model of Zhuo et al. (2008)
Further improvement of the method derived by Sun et al. was done by Zhuo et al. [
103,
232]. They reformulated the porous media transport model to predict radon flux density [
196,
220,
231]. In the model, emanation power, fitted as a factor of water saturation, and the empirical formula for estimating seasonally volumetric water content were combined, with an effective radon diffusion coefficient derived by Rogers et al. and Schery et al. to derive radon flux density [
196,
220]. Radon fluxes were measured at 10 locations in Japan and Korea. Best agreement between seasonally averaged radon fluxes from the measured sites and combined model was achieved [
103].
Combining the database of
226Ra in soil in China containing 1099 measured data at 100 × 100 km
2 grid [
232], the global ecosystem database (which includes bulk density, porosity and texture component of sand, silt and clay, measured precipitation, surface temperature, and land cover classifications) [
143,
233], and the potential evapotranspiration [
234] with the derived model [
103,
163], annual and seasonal radon flux densities from the soil surface of China were created on a grid scale of 25 km × 25 km. Obtained annual average radon flux density was 29.7 ± 9.4 mBqm
−2s
−1, with a minimum of 9 mBqm
−2s
−1 and a maximum of 82 mBqm
−2s
−1 [
143]. The data agree with a global average radon flux density of 33 mBqm
−2s
−1 [
5]. The obtained radon flux density was generally higher in the southeast region, where higher activity concentrations of
226Ra in soil were measured, while lower fluxes were measured in the northeast region, where lower
226Ra occurs. The average radon flux densities in winter were much smaller compared to the other seasons, with the maximum ratio of radon flux in summer and winter being 1.76 [
143]. Validation of the model was performed by comparing the experimental data from 20 sites in China, Japan, and Korea continuously measured for one year with the model prediction [
163]. The measured annual average of 24.1 mBqm
−2s
−1 agrees well with the predicted annual average of 21.7 mBqm
−2s
−1.
7.7. Model of Griffiths et al. (2010)
In Australia, a time-dependent radon flux map was produced with spatial resolution of 0.05° and temporal resolution of one month. Radon flux was estimated using the simple diffusion model assuming two layers for the simulation of soil moisture. The following datasets were used as input: (i) radium activity taken from gamma-ray aerial survey [
235], (ii) soil properties, including bulk density, porosity, and soil texture obtained from the Atlas of Australian Soils [
236,
237], and (iii) soil temperature for which air temperature was used as a proxy from the meteorological set of data [
238].
The model was calibrated with a set of more than 210 measured radon fluxes [
142]. A correlation coefficient of 0.48 was found between measured and modelled radon flux from the soil. Temperature and moisture variations were taken monthly, and seasonal changes in soil moisture led to seasonal variations of radon flux. Based on the radon fluxes measured at 9 sites, the winter to summer ratio was found to be 1.6 [
216]. In the Cowra region, the summer to winter ratio was 0.88, while the model ratio was 1.8. In contrast, in Goulburn, the summer to winter ratio was 2.54, compared to the model-predicted value of 1.1. While in the general case, the diffusion coefficient monotonically decreases with the increase of soil moisture, there are soils that have a factor of 0.2 higher diffusion coefficients for soil moisture in comparison to dry soil [
239]. A further improvement could possibly include observed day-by-day variations [
240].
7.8. Model of Hirao et al. (2010)
Hirao et al. estimated the global distribution of radon flux with 1° resolution in latitude and longitude for each month in the period from 1979 to 2007 [
146]. Radon transport was modelled by diffusion theory in a porous media by considering the
226Ra content in the soil obtained from data available in the literature [
5], soil bulk density, the effective diffusion coefficient that depends on soil water saturation, and the soil temperature and emanation coefficient as a function of water saturation and soil temperature [
103,
111]. The physical properties of the soil were provided by the Japanese Meteorological Agency, Climate Data Assimilation System. The thickness of the snow layer was also used in the model, as well as topographical ruggedness [
124].
The 29-year world average flux density was estimated to be 21.3 mBqm
−2s
−1, with a large seasonal variation ranging from 18.8 mBqm
−2s
−1 in March to 23.6 mBqm
−2s
−1 in September, and regional variations of 8.3 mBqm
−2s
−1 for the northern part of North America up to 33.5 mBqm
−2s
−1for Australia [
144]. The latitudinal distribution in the Northern hemisphere roughly follows the simplified model of Conen and Robertson, which assumes the linear decrease of radon flux as a function of latitude [
215]. At a global level, the topographical ruggedness increased radon flux by 2%, while on mountainous regions the increase was more than 10% [
144].
7.9. Model of López-Coto et al. (2013)
López-Coto et al. have calculated a 40-year retrospective European radon flux inventory. They estimated average values of radon flux, seasonal variation, and probability distribution [
64].
Modelling of radon transport in three phases (gaseous, water, and soil) was simplified by using the “effective” diffusion coefficient [
196]. Adsorption of radon onto the soil surface and radon solubility were considered. Diffusion of radon through different rocks and soil was estimated by considering a diffusion coefficient gradient. As there are no analytical solutions, the forward finite difference technique was used [
64,
241,
242].
For modeling, the U concentration database was used for the estimation of
226Ra in the soil [
243], and the Harmonized World Soil Database of FAO [
244] was used to extract soil characteristics and properties with a constant emanation factor of 0.2, as justified by [
245,
246] and the ERA-40 database of weather variables [
247].
Data compared with different experimental results showed good agreement. Monthly averaged radon exhalation for the whole of Europe was estimated for the period from 1957 to 2002. Lower radon fluxes of around 26 Bqm−2h−1 resulted during the wet months and were highest in August at about 33.6 Bqm−2h−1 during the dry period. The large standard deviation highlights a large variation in the radon flux for the whole of Europe. The seasonal deviation is approximately 25%. Larger deviations with greater seasonal fluctuations were obtained at lower latitudes. A high-resolution map, with spatial resolution of 0.5′, enables the use of the map to determine areas with high radon exposure.
7.10. Model of Manohar et al. (2013)
The terrestrial gamma dose rate (TGDR) estimated by Szegvary tends to overestimate the Rn flux at certain stations in Spain as this approach fails to quantify the effect of local influences at EURDEP stations [
150]. Since terrestrial gamma radiation mainly originates from the top 20–30 cm of soil, and the presence of moisture similarly reduces the terrestrial gamma radiation and the radon flux, it is concluded that terrestrial gamma radiation can be used as a proxy for the estimation of radon flux [
98,
248,
249]. Manohar et al. (2013) decided to estimate TGDR from the radionuclide content in soil [
204]. They extracted the activity concentration of radionuclides in soil from the Geochemical Atlas database, which includes 358 soil samples from different locations [
250]. Based on these data, TGDR was extracted using the formula available in [
5]. TGDR from radionuclides in clay, loss, and peat were 10–20% lower than TGDR from the Dutch National Radioactivity Monitoring Network, while for sand, this discrepancy was 2 times lower. Modelled Rn flux agrees within the 2σ with the radon flux measured at 2 existing measuring locations. The mean value of Rn flux in the Netherlands differs by a factor of 2 between values obtained by TGDR, radioactivity in the soil, and the Szegvary model [
63].
The model is further extended to Europe based on available soil data from 838 locations from the FOREGS (Forum of European Geological Survey) database [
251]. The model was validated with direct Rn flux measurements from Szegvary et al. and Grossi et al. [
14,
150]. For soil with moisture content between 5 and 35%, the ratio between the measured and modelled radon flux varied from 1 to 4, while for moisture content > 45%, the modelled values overestimated the measured values. In total, the discrepancy between the measured and modelled values varied from 0.2 to 12.4.
7.11. Model of Karstens et al. (2015)
Karstens et al. modelled a radon flux map of Europe based on the parameterisation of radon production in the soil and its transport [
65]. The starting point of the model was the equation of continuity in infinitely deep unsaturated homogenous soil, assuming only molecular diffusion of radon in the soil air. In case of shallow water-table depth, the model is adjusted by setting appropriate boundary conditions. The effects of snow cover and frozen soil on radon flux were not convincing; therefore, they were not introduced in the model [
252]. Although there were different models to estimate effective diffusivity, with the most popular parameterisation of Rogers and Nielson, the best agreement with diffusivity derived from the measured Rn profiles was accomplished by the model of Millington and Quirk [
196,
253]. This diffusivity parameterization considered only porosity and water-filled fraction, and temperature dependence was taken into account according to Schery and Wasiolek [
220].
Some of the major data that were used as an input follows:
Although validation of radon fluxes is based on a small number of measured radon fluxes, comparison of modelled with direct Rn flux measurements show that seasonal variations are well reproduced compared to previous models. Better agreement was obtained with GLDAS-Noah soil moisture than with ERA- I/L. Comparison with more than 400 episodic Rn flux measurements from the literature show that the overall mean of Rn flux in Europe calculated with GLDAS-Noah is almost without bias (15 mBqm−2s−1), while ERA-I/L mean Rn fluxes are underestimated by 60%.
The difference between measured and modelled radon flux from pixel to pixel is about 70–100% from the mean flux. The uncertainty of the model is estimated at 50%, while uncertainty due to a lack of representativeness and uncertainty of measurements contributes 80% to the difference. These can be reduced by performing dedicated radon flux measurements.
In
Table 3, a summary of the different described radon flux models and inventories is given. Details for each model include the type of model used, physical quantities, input data, spatial and temporal resolution of the created model, means of model verification, and model coverage (i.e., the area to which it is applicable). The models that predict radon flux as a function of latitude are not included in
Table 3.
Table 3.
An overview of Rn flux models and Rn flux inventories, References related to the databases used for input are given in the text. Explanation of used parameters: Deff—effective diffusion mechanism; p—porosity; ρ—soil bulk density; m—volume fraction of water saturation; ε—emanation coefficient; T—temperature; P—precipitation; K –permeability, d—mean grain diameter.
| Author | Transport Model | Parameters Used | Input Data | Resolution | Verification | Area |
|---|
| Schery and Wasiolek [220] | Diffusion | Deff = f(m,T) | 226Ra, precipitation, and air temperature | Spatial: 1° | 101 meas. locations | Australia |
| Ielisch et al. [162] | Diffusion | Deff = f(p, ρ, m) | rock and soil chemical and physical properties | | 85 locations | Regional: Brittany |
| Sun et al. [231] | Diffusion | Deff = f(p, ρ, m)
ε—from literature | Databases: 226Ra in soil, soil moisture, and soil properties | Spatial: 25 × 25 km2 | 47 meas. locations | China |
| Zhuo et al. [232] | Diffusion | Deff = f(p, ρ, m, T)
ε = f(T); m = f(P,p) | Databases: 226Ra in soil, soil properties: GED evapotranspiration | Spatial: 25 × 25 km2;
Seasonal | 20 sites, continuous | China |
| Griffiths et al. [142] | Diffusion; 2 layers of soil: for soil moisture; | Deff = f(p, ρ, m);
ε = f(m, T) | 226Ra: γ-ray aerial survey;
Soil properties: AWAP;
Tsoil—meteo data; | Spatial: 0.05°
Temporal: 1 month | 210 meas. fluxes | Australia |
| Hirao et al. [144] | Diffusion | Deff = f(p, ρ, m);
ε = f(m, T)
snow cover; topographical ruggedness | 226Ra—UNSCEAR, Soil properties: JCDAS | Spatial: 0.1°
Temporal: 1 month | For validation: Not flux, but outdoor radon | Japan |
| Lopez-Coto et al. [64] | Diffusion, advection, hetero-geneous media | Deff = f(p, ρ, m)
K = f(p,m,d) | | Spatial: 0.5′
(1 km)
Temporal:
1 month | Compared data from: Ireland, Iberian peninsula | Europe |
| Szegvary et al. [63] | | | Rn flux from TGDR (EURDEP) | Spatial: 0.5°
Temporal: 1 week | 63 locations | Europe |
| Manohar et al. [204] | Same approach as [149] | | Rn flux from TGDR extracted from soil | Spatial: 1 × 1 km2 (Netherlands), 5 × 5 km2 (Europe) | 63 locations [149];
2 locations [147] | Netherlands, Europe |
| Karstens et al. [65] | Diffusion | Deff = f(p, m, T) | 226Ra—Geochem Atlas; Soil database, ε from [232], soil moisture: GLDAS-Noah, ERA-I/L, water table depth | Spatial: 0.083°
Temporal: 1 month | Measurements of at least 4 months at 6 locations and >400 episodic meas. in Europe | Europe |
8. Discussion
Many parameters influence radon flux, including 226Ra activity and its distribution within the soil grain, chemical and physical properties of the soil, and various meteorological parameters. In addition to spatial variation, some of the parameters have temporal variation as well. Complex dependences among them make it difficult to quantify their contribution to radon flux values, and when measurements are done with many different methods and devices, it is difficult to compare the results. Furthermore, Rn flux measurements are challenging because there are numerous factors introducing uncertainty in measurements, such as increasing leakage and back diffusion in time. Therefore, there is a strong need to harmonize different measuring methods and devices in order to identify and resolve possible physical (and human) reasons for inconsistencies.
Although there are various radon flux measurement methods, many of them are either instantaneous or continuous with a measurement scale, representative of the soil under investigation. In that respect, measurement time is comparable to the time scale of measurement of radon in soil gas, i.e., GRP [
49,
259,
260,
261]. This makes short-term measurements suitable for incorporation with GRP mapping.
When considering long-scale radon flux measurements (including models) covering months, meteorological factors are averaged and become climatic factors [
44]. The earliest attempts to include climatic factors in machine learning to predict indoor radon concentrations were recently investigated [
262]; thus, averaged radon flux data could be included.
While national indoor radon surveys use ranges from several orders of magnitude, from 85 measurement locations in Malta to more than 500,000 locations in the UK [
6], the maximum number of measuring locations was 111 for the national radon flux survey of Japan. Radon flux maps were produced for a much smaller number of locations (compared to indoor radon surveys) over a large area, raising concern about the extent to which those maps could be considered representative and used further as an input for different models.
Only two surveys compared radon flux and radon concentration in soil gas. However, high correlations between them were observed: 0.705 based on 31 measuring locations and between 0.80 and 0.98 for 3 regions covered in total by 36 measuring locations. Both radon in soil gas and radon flux are quantities irrespective of anthropogenic contribution. The abovementioned arguments indicate that radon flux could also be used for the derivation of geogenic radon potential.
Lower correlation, extracted from five surveys, between radon concentrations in soil gas and indoor air ranging from 0.31 to 0.79 (excluding one negative correlation and correlations given with qualitative descriptions) could point to additional variability of indoor radon concentrations due to anthropogenic contribution.
Although numerous factors influence radon flux, it is surprising to some extent to find good correlation between 226Ra concentration in soil and radon flux, ranging between 0.58 and 0.95, with one lower value of 0.22 and one atypical result of slightly negative correlation. Similarly, high correlation coefficients between gamma dose rate and radon flux are obtained, ranging between 0.58 and 0.81. These results confirm that 226Ra concentration and gamma dose rate could be considered as good proxies for estimation of radon flux, and these quantities are used in some of the existing radon flux models.
Radiation protection research could benefit from environmental research as radon is used as a tracer for atmospheric processes. The need for validation of global chemistry models led to improvement of radon flux models.
The maps presented at the top of
Figure 9 are: (a) European indoor radon map [
263] (
https://remap.jrc.ec.europa.eu/Atlas.aspx#, accessed on 25 November 2022) and (b) map of Geogenic Radon Hazard Index [
44], while at the bottom are 2 modelled European radon flux maps of Karstens et al. created using 2 models of soil moisture: (c) GLDAS-Noah (d) ERA-I/L [
65].
The GRHI map (
Figure 9b) was created by machine learning (ML) using the Multivariate Adaptive Regression Spline (MARS) algorithm, which was shown to be the best approach if the goal is to optimally predict indoor radon concentration. Using the ML method resulted in r
2 = 0.52 between the predicted and observed arithmetic mean of indoor radon concentrations averaged over 10 km × 10 km cell [
44].
Current state-of-the-art radon flux models reach spatial resolution better than 0.1° and temporal resolution of 1 month [
65]. Radon maps from a radiological protection perspective are “static”, allowing averaging over the year, as well as a conservative approach that selects the highest values of radon fluxes. Currently, the state-of-the-art radon flux map of Karstens et al. uses two soil models, namely GLDAS Noah and ERA-I/L. Overall agreement between measured and modelled radon fluxes are better with GLDAS-Noah based maps [
65]. For both maps, variability between the measured and modelled radon flux values is large. There is room for further improvement of radon flux models by introducing soil moisture estimates derived from the latest ERA5 model [
28,
264]. Application of the radon flux model using the latest soil moisture reanalyses is currently being continued within the traceRadon project to update the existing radon flux maps for Europe and extend them to more recent years. Furthermore, uncertainty arising from the small number of measuring points will decrease as additional measurements of radon flux are conducted within the traceRadon project, thereby increasing the representativeness of measuring points [
29].
Most of the models use only diffusion as the dominant means of radon transport; however, the importance of including advective transport is underlined in several reviewed papers. Voltaggio et al. ascribed a difference between the measured radon flux and the maximal radon flux estimated by the diffusion model for the advective component of the radon flux [
194]. The advective component is more important in the vicinity of faults as they form pathways for radon movements; therefore, maps of faults are included in the mapping of GRP [
12,
47]. Clouvas et al. compared measured radon flux values with those derived using the general transport model that includes both diffusion and advection [
179]. Good agreement between them indicates that both means of transport should be included.
9. Conclusions
Radon maps (based on, e.g., indoor radon concentrations, radon in soil gas, GRP, GRHI) are important as they help to identify regions where actions should be prioritized to achieve goals such as radon prevention and remediation, studying the health effects of radon, and increasing public awareness. Although the creation of radon maps and delineation of RPA are done using many different approaches, as discussed in Chapter 2, none of them uses radon flux as an input variable for mapping purposes. According to the reviewed literature, for radiation protection purposes, radon flux as an indicator of radon hazard is regulated only in Russia (excluding limits set for uranium tailings), where a limit of 80 mBqm−2s−1 is set, below which additional radon protection measures are not required.
Numerous factors influence radon flux, from its origin in grain to its emanation and transport toward the topsoil layer to its exhalation from soil. Due to the complex interplay between different factors influencing radon flux, it is difficult to quantify their contribution to radon flux. As there are numerous methods, types of measurements, and measuring devices, there is a necessity to test measuring systems and identify and quantify possible inconsistencies in order to harmonise different radon flux measurements that could be further used in different applications. The traceability chain of radon flux measurements and harmonization will be addressed in the traceRadon project.
Radon flux measurements are complex as they require dedicated measurement systems and a trained technician to conduct the measurements. Thus, large scale radon flux measurements are difficult to achieve. An up-to-date national survey was conducted in only two countries, with a measurement density much smaller compared to indoor radon surveys.
Due to the positive correlations between radon flux and radon quantities such as radon in soil gas and indoor radon, radon flux could be used as an input parameter for the estimation of RPA. Furthermore, the time scale of short-term measurements of radon flux is comparable with the time scale of soil gas radon measurements, which are comparable with temporal variations in soil properties. As both quantities are irrespective of anthropogenic factors, they are suitable for estimation of GRP and, consequently, for estimation of RPA.
Furthermore, the time scale of the long-term radon flux measurements is more compatible with indoor radon measurements, whose durations are typically months to one year. Such measurement durations are larger than the time variability of processes in the soil that influence radon flux; hence, meteorological variations are smoothed over a measurement period.
Due to the need to measure or estimate radon flux with the lowest achievable uncertainty in order to gain reliable estimation of greenhouse gases, radon flux measurements and radon flux models have been significantly improved in the last two decades. They have evolved from simplified models, depending only on latitude, to more advanced models that use the 226Ra activity concentration in the soil or the terrestrial gamma dose rate, along with detailed additional databases of soil and meteorological parameters. An up-to-date modelled radon flux map of Europe has reached spatial resolution of 0.083° × 0.083° and temporal resolution of 1 month. Large variability between measured and modelled radon flux from pixel to pixel is from 70–100% of the mean radon flux value. Better agreement could be obtained by introducing the latest ERA5 soil moisture model. Furthermore, dedicated radon flux measurements could reduce large variability between measured and modelled radon flux due to a small number of measurement points within the grid cells. Such improved modelled radon flux maps could serve as an input for the estimation of GRP and, consequently, delineation of RPA.
Within the traceRadon project, radon flux and outdoor radon will be further evaluated and tested as input parameters for GRHI and for delineation of Rn areas, based on this literature study as well as specific data sets and new data still being collected during the traceRadon project. New findings will be published in a follow-up paper.
Author Contributions
Conceptualization: I.Č., G.P., I.V., M.Ž. and J.K.N.; Providing references for literature review: I.Č., G.P., I.V., M.Ž., J.K.N., G.C. (Giorgia Cinelli), V.G., S.B., G.C. (Giancarlo Ciotili), L.S.Q.P. and D.R.; Summarising papers: I.Č., G.P., I.V., M.Ž., J.K.N., L.S.Q.P. and D.R.; Writing a draft of the paper: I.Č.; Writing—review, and editing: I.Č., G.P., I.V., M.Ž., J.K.N., G.C. (Giorgia Cinelli), V.G., S.B., G.C. (Giancarlo Ciotili), L.S.Q.P. and D.R.; Reviewing the paper: I.Č., G.P., I.V., M.Ž., J.K.N., G.C. (Giorgia Cinelli), V.G., S.B., G.C. (Giancarlo Ciotili), L.S.Q.P. and D.R. Corresponding author: G.C. (Giorgia Cinelli). All authors have read and agreed to the published version of the manuscript.
Funding
This project 19ENV01 traceRadon has received funding from the EMPIR programme co-financed by the Participating States and from the European Union’s Horizon 2020 research and innovation programme. 19ENV01 traceRadon denotes the EMPIR project reference.
Institutional Review Board Statement
Not applicable.
Informed Consent Statement
Not applicable.
Data Availability Statement
This is a review article. All data were gathered from the available literature.
Acknowledgments
Authors would like to acknowledge Ute Karstens from Lund University, Sweden, for her review and suggestions regarding models of radon flux, discussion, and conclusions.
Conflicts of Interest
The authors declare no conflict of interest.
References
- UNSCEAR (United Nation Scientific Committee on the Effects of Atomic Radiation Report). Report of the United Nation Scientific Committee on the Effects of Atomic Radiation Sixty-Sixth Session; United Nations: New York, NY, USA, 2019; pp. 110–114. [Google Scholar]
- Lundin, F.E.; Wagoner, J.K.; Archer, V.E. Radon daughter exposure and respiratory cancer: Quantitive and temporal aspects. In Joint Monograph No.1. NIOSH and NIESH; U.S. Department of Health, Education and Welfare, Public Health Service: Washington DC, USA, 1971. [Google Scholar]
- Sevc, J.; Kunz, E.; Placek, V. Lung cancer in uranium miners and long-term exposure to radon daughter products. Health Phys. 1976, 30, 433–437. [Google Scholar] [CrossRef] [PubMed]
- IARC (International Agency for Research on Cancer). Monographs on the Evaluation of Carcinogenic Risks to Humans: Manmade mineral Fibres and Radon; WHO: Geneva, Switzerland, 1988. [Google Scholar]
- UNSCEAR (United Nation Scientific Committee on the Effects of Atomic Radiation Report). Sources and Effects of Ionizing Radiation; United Nations: New York, NY, USA, 2000; pp. 98–99. [Google Scholar]
- Pantelić, G.; Čeliković, I.; Živanović, M.; Vukanac, I.; Nikolić, J.K.; Cinelli, G.; Gruber, V. Qualitative Overview of Indoor Radon Surveys in Europe. J. Environ. Radioact. 2019, 204, 163–174. [Google Scholar] [CrossRef] [PubMed]
- IAEA National and Regional Surveys of Radon Concentration in Dwellings. Review of Methodology and Measurement Techniques. In Analytical Quality in Nuclear Application; IAEA: Vienna, Austria, 2013. [Google Scholar]
- WHO (World Health Organization). Handbook on Indoor Radon; WHO: Geneva, Switzerland, 2009. [Google Scholar]
- Council Directive 2013/59/Euratom of 5 December 2013 Laying Down Basic Safety Standards for Protection against the Dangers Arising from Exposure to Ionising Radiation, and repealing Directives 89/618/Euratom, 90/641/Euratom, 96/29/Euratom, 97/43/Euratom and 2003/122/Euratom. Available online: https://eur-lex.europa.eu/eli/dir/2013/59/oj (accessed on 25 November 2020).
- Igarashi, G.; Saeki, S.; Takahata, N.; Sumikawa, K.; Tasaka, S.; Sasaki, Y.; Takahashi, M.; Sano, Y. Ground-Water Radon Anomaly before the Kobe Earthquake in Japan. Science 1995, 269, 60–61. [Google Scholar] [CrossRef] [PubMed]
- Kawada, Y.; Nagahama, H.; Omori, Y.; Yasuoka, Y.; Ishikawa, T.; Tokonami, S.; Shinogi, M. Time-Scale Invariant Changes in Atmospheric Radon Concentration and Crustal Strain Prior to a Large Earthquake. Nonlinear Process. Geophys. 2007, 14, 123–130. [Google Scholar] [CrossRef]
- Ciotoli, G.; Lombardi, S.; Annunziatellis, A. Geostatistical Analysis of Soil Gas Data in a High Seismic Intermontane Basin: Fucino Plain, Central Italy. J. Geophys. Res. Solid Earth 2007, 112, 1–23. [Google Scholar] [CrossRef]
- Sainz, C.; Rábago, D.; Fuente, I.; Celaya, S.; Quindós, L.S. Description of the Behavior of an Aquifer by Using Continuous Radon Monitoring in a Thermal Spa. Sci. Total Environ. 2016, 543, 460–466. [Google Scholar] [CrossRef] [PubMed]
- Mollo, S.; Tuccimei, P.; Galli, G.; Iezzi, G.; Scarlato, P. The Imprint of Thermally Induced Devolatilization Phenomena on Radon Signal: Implications for the Geochemical Survey in Volcanic Areas. Geophys. J. Int. 2017, 211, 558–571. [Google Scholar] [CrossRef] [Green Version]
- Locatelli, R.; Bousquet, P.; Hourdin, F.; Saunois, M.; Cozic, A.; Couvreux, F.; Grandpeix, J.Y.; Lefebvre, M.P.; Rio, C.; Bergamaschi, P.; et al. Atmospheric Transport and Chemistry of Trace Gases in LMDz5B: Evaluation and Implications for Inverse Modelling. Geosci. Model Dev. 2015, 8, 129–150. [Google Scholar] [CrossRef] [Green Version]
- Grossi, C.; Vogel, F.R.; Curcoll, R.; Àgueda, A.; Vargas, A.; Rodó, X.; Morguí, J.A. Study of the Daily and Seasonal Atmospheric CH4 Mixing Ratio Variability in a Rural Spanish Region Using 222Rn Tracer. Atmos. Chem. Phys. 2018, 18, 5847–5860. [Google Scholar] [CrossRef] [Green Version]
- Grossi, C.; Vogel, F.R.; Morgui, J.A.; Curcoll, R.; Àgueda, A.; Batet, O.; Nofuentes, M.; Occhipinti, P.; Vargas, A.; Rodó, X. First Estimation of CH4 Fluxes Using the 222Rn Tracer Method over the Central Iberian Peninsula. WIT Trans. Ecol. Environ. 2014, 183, 233–244. [Google Scholar]
- Chambers, S.D.; Galeriu, D.; Williams, A.G.; Melintescu, A.; Griffiths, A.D.; Crawford, J.; Dyer, L.; Duma, M.; Zorila, B. Atmospheric Stability Effects on Potential Radiological Releases at a Nuclear Research Facility in Romania: Characterising the Atmospheric Mixing State. J. Environ. Radioact. 2016, 154, 68–82. [Google Scholar] [CrossRef] [PubMed]
- Chambers, S.D.; Wang, F.; Williams, A.G.; Xiaodong, D.; Zhang, H.; Lonati, G.; Crawford, J.; Griffiths, A.D.; Ianniello, A.; Allegrini, I. Quantifying the Influences of Atmospheric Stability on Air Pollution in Lanzhou, China, Using a Radon-Based Stability Monitor. Atmos. Environ. 2015, 107, 233–243. [Google Scholar] [CrossRef]
- Chambers, S.D.; Williams, A.G.; Crawford, J.; Griffiths, A.D. On the Use of Radon for Quantifying the Effects of Atmospheric Stability on Urban Emissions. Atmos. Chem. Phys. 2015, 15, 1175–1190. [Google Scholar] [CrossRef] [Green Version]
- Vinod Kumar, A.; Sitaraman, V.; Oza, R.B.; Krishnamoorthy, T.M. Application of a Numerical Model for the Planetary Boundary Layer to the Vertical Distribution of Radon and Its Daughter Products. Atmos. Environ. 1999, 33, 4717–4726. [Google Scholar] [CrossRef]
- Biraud, S.; Ciais, P.; Ramonet, M.; Simmonds, P.; Kazan, V.; Monfray, P.; O’Doherty, S.; Spain, T.; Jennings, S. European Greenhouse Gas Emissions Estimated from Continuous Atmospheric Measurements and Radon 222 at Mace Head, Ireland. J. Geophys. Res. 2000, 105, 1351–1366. [Google Scholar] [CrossRef]
- Vogel, F.R.; Ishizawa, M.; Chan, E.; Chan, D.; Hammer, S.; Levin, I.; Worthy, D.E.J. Regional non-CO2 greenhouse gas fluxes inferred from atmospheric measurements in Ontario, Canada. J. Integr. Environ. Sci. 2012, 9, 41–55. [Google Scholar] [CrossRef]
- Kikaj, D.; Chambers, S.D.; Kobal, M.; Crawford, J.; Vaupotič, J. Characterizing Atmospheric Controls on Winter Urban Pollution in a Topographic Basin Setting Using Radon-222. Atmos. Res. 2020, 237, 104838. [Google Scholar] [CrossRef]
- Vargas, A.; Arnold, D.; Adame, J.A.; Grossi, C.; Hernández-Ceballos, M.A.; Bolivar, J.P. Analysis of the Vertical Radon Structure at the Spanish “El Arenosillo” Tower Station. J. Environ. Radioact. 2015, 139, 1–17. [Google Scholar] [CrossRef]
- Van Der Laan, S.; Karstens, U.; Neubert, R.E.M.; Van Der Laan-Luijkx, I.; Meijer, H.A.J. Observation-based estimates of fossil fuel-derived CO2 emissions in the Netherlands using 14C, CO and 222Radon. Tellus B 2010, 62, 389–402. [Google Scholar] [CrossRef] [Green Version]
- Levin, I.; Hammer, S.; Eichelmann, E.; Vogel, F.R. Verification of greenhouse gas emission reductions: The prospect of atmospheric monitoring in the polluted areas. Philos. T. R. Soc. A 2011, 369, 1906–1924. [Google Scholar] [CrossRef]
- Levin, I.; Karstens, U.; Hammer, S.; DellaColetta, J.; Maier, F.; Gachkivskyi, M. Limitations of the radon tracer method (RTM) to estimate regional greenhouse gas (GHG) emissions—A case study for methane in Heidelberg. Atmos. Chem. Phys. 2021, 21, 17907–17926. [Google Scholar] [CrossRef]
- Röttger, A.; Röttger, S.; Grossi, C.; Vargas, A.; Curcoll, R.; Otáhal, P.; Hernández-Ceballos, M.Á.; Cinelli, G.; Chambers, S.; Barbosa, S.A.; et al. New metrology for radon at the environmental level. Meas Sci. Technol. 2021, 32, 124008. [Google Scholar] [CrossRef]
- Röttger, S.; Röttger, A.; Grossi, C.; Vargas, A.; Karstens, U.; Cinelli, G.; Chung, E.; Kikaj, D.; Rennick, C.; Mertes, F.; et al. Radon metrology for use in climate change observation and radiation protection at the environmental level. Adv. Geosci. 2022, 57, 37–47. [Google Scholar] [CrossRef]
- Čeliković, I.; Pantelić, G.; Vukanac, I.; Krneta Nikolić, J.; Živanović, M.; Cinelli, G.; Gruber, V.; Baumann, S.; Quindos Poncela, L.S.; Rabago, D. Outdoor Radon as a Tool to Estimate Radon Priority Areas—A Literature Overview. Int. J. Environ. Res. Public Health 2022, 19, 662. [Google Scholar] [CrossRef]
- NSC Nuclear Safety Council Instrucción. IS-33, de 21 de Diciembre de 2011, del Consejo de Seguridad Nuclear, Sobre Criterios Radiológicos Para la Protección Frente a la Exposición a la Radiación Natural. 2012. Available online: https://www.boe.es/buscar/doc.php?id=BOE-A-2012-1238 (accessed on 19 October 2022).
- Bochicchio, F.; Venoso, G.; Antignani, S.; Carpentieri, C. Radon Reference Levels and Priority Areas Considering Optimisation and Avertable Lung Cancers. Radiat. Prot. Dosim. 2017, 177, 87–90. [Google Scholar] [CrossRef]
- Bossew, P. Radon Priority Areas—Definition, Estimation and Uncertainty. Nucl. Technol. Radiat. Prot. 2018, 33, 286–292. [Google Scholar] [CrossRef] [Green Version]
- Petermann, E.; Bossew, P.; Hoffmann, B. Radon hazard vs. radon risk—On the effectiveness of radon priority areas. J. Environ. Radioact. 2022, 244–245, 106833. [Google Scholar] [CrossRef]
- Bossew, P.; Čeliković, I.; Cinelli, G.; Ciotoli, G.; Domingos, F.; Gruber, V.; Leonardi, F.; Nikolov, J.; Pantelić, G.; Pereira, A.; et al. On harmonization of radon maps. J. Eur. Radon Assoc. 2022, 3, 1–10. [Google Scholar] [CrossRef]
- Giustini, F.; Ruggiero, L.; Sciarra, A.; Beaubien, S.E.; Graziani, S.; Galli, G.; Pizzino, L.; Tartarello, M.C.; Lucchetti, C.; Sirianni, P.; et al. Radon Hazard in Central Italy: Comparison among Areas with Different Geogenic Radon Potential. Int. J. Environ. Res. Public Health 2022, 19, 666. [Google Scholar] [CrossRef]
- Cinelli, G.; Bochicchio, F.; Bossew, P.; Carpentieri, C.; De Cort, M.; Gruber, V.; Leonardi, F.; Tollefsen, T.; Trevisi, R. Similarities and differences between radon surveys across Europe: Results from MetroRADON questionnaire. J. Eur. Radon Assoc. 2022, 3, 1–9. [Google Scholar] [CrossRef]
- Bochicchio, F.; Campos-Venuti, G.; Piermattei, S.; Nuccetelli, C.; Risica, S.; Tommasino, L.; Torri, G.; Magnoni, M.; Agnesod, G.; Sgorbati, G.; et al. Annual average and seasonal variations of residential radon concentration for all the Italian Regions. Radiat. Meas. 2005, 40, 686–694. [Google Scholar] [CrossRef]
- Antignani, S.; Carelli, V.; Cordedda, C.; Zonno, F.; Ampollini, M.; Carpentieri, C.; Venoso, G.; Bochicchio, F. An affordable proxy of representative national survey on radon concentration in dwellings: Design, organisation and preliminary evaluation of representativeness. Radiat. Meas. 2013, 50, 136–140. [Google Scholar] [CrossRef]
- Neznal, M.; Neznal, M.; Matolín, M.; Barnet, I.; Miksova, J. The New Method for Assessing the Radon Risk of Building Sites. 2004. Available online: https://www.radon-vos.cz/pdf/metodika.pdf (accessed on 2 March 2022).
- Kemski, J.; Siehl, A.; Stegemann, R.; Valdivia-Manchego, M. Mapping the geogenic radon potential in Germany. Sci. Total Environ. 2001, 272, 217–230. [Google Scholar] [CrossRef] [PubMed]
- Bossew, P. Mapping the geogenic radon potential and estimation of radon prone areas in Germany. Radiat. Emerg. Med. 2015, 4, 13–20. [Google Scholar]
- Bossew, P.; Cinelli, G.; Ciotoli, G.; Crowley, Q.G.; De Cort, M.; Elío Medina, J.; Gruber, V.; Petermann, E.; Tollefsen, T. Development of a Geogenic Radon Hazard Index—Concept, History, Experiences. Int. J. Environ. Res. Public Health 2020, 17, 4134. [Google Scholar] [CrossRef]
- Quindos, L.S.; Fernández, P.L.; Ródenas, C.; Gómez-Arozamena, J.; Arteche, J. Conversion factors for external gamma dose derived from natural radionuclides in soils. J. Environ. Radioact. 2004, 71, 139–145. [Google Scholar] [CrossRef]
- Cinelli, G.; Tondeur, F.; Dehandschutter, B. Development of an indoor radon risk map of the Walloon region of Belgium, integrating geological information. Environ. Earth Sci. 2011, 62, 809–819. [Google Scholar] [CrossRef]
- Ciotoli, G.; Voltaggio, M.; Tuccimei, P.; Soligo, M.; Pasculli, A.; Beaubien, S.E. Geographically weighted regression and geostatistical techniques to construct the geogenic radon potential map of the Lazio region: A methodological proposal for the European Atlas of Natural Radiation. J. Environ. Radioact. 2017, 166, 355–375. [Google Scholar] [CrossRef]
- Elío, J.; Cinelli, G.; Bossew, P.; Gutiérrez-Villanueva, J.L.; Tollefsen, T.; De Cort, M.; Nogarotto, A.; Braga, R. The first version of the Pan-European Indoor Radon Map. Nat. Hazards Earth Syst. Sci. 2019, 19, 2451–2464. [Google Scholar] [CrossRef] [Green Version]
- Giustini, F.; Ciotoli, G.; Rinaldini, A.; Ruggiero, L.; Voltaggio, M. Mapping the geogenic radon potential and radon risk by using Empirical Bayesian Kriging regression: A case study from a volcanic area of central Italy. Sci. Total Environ. 2019, 661, 449–464. [Google Scholar] [CrossRef]
- Petermann, E.; Meyer, H.; Nussbaum, M.; Bossew, P. Mapping the geogenic radon potential in Germany using machine learning. Sci. Total Environ. 2021, 754, 142291. [Google Scholar] [CrossRef]
- Fernández, A.; Sainz, C.; Celaya, S.; Quindós, L.; Rábago, D.; Fuente, I. A new methodology for defining radon priority areas in Spain. Int. J. Environ. Res. Public Health 2021, 18, 1352. [Google Scholar] [CrossRef]
- Hughes, M.B.; Elío, J.; Crowley, Q.G. A user’s guide to radon priority areas, examples from Ireland. J. Eur. Radon Assoc. 2022, 3, 1–12. [Google Scholar] [CrossRef]
- Maringer, F.J.; Wiedner, H.; Stietka, M. EMPIR 16ENV10 Project MetroRADON Final Publishable Report. 2021. Available online: http://metroradon.eu/index.php/documents/ (accessed on 21 October 2022).
- Gruber, V.; Baumann, S.; Alber, O.; Laubbichler, C.; Bossew, P.; Petermann, E.; Ciotoli, G.; Pereira, A.; Domingos, F.; Tondeur, F.; et al. Comparison of radon mapping methods for the delineation of radon priority areas—An exercise. J. Eur. Radon Assoc. 2021, 2, 1–14. [Google Scholar] [CrossRef]
- Jelinski, D.E.; Wu, J. The modifiable areal unit problem and implications for landscape ecology. Landscape Ecol. 1996, 11, 129–140. [Google Scholar] [CrossRef]
- Mathews, A.J.; Ellis, E.A. An evaluation of tornado siren coverage in Stillwater, Oklahoma: Optimal GIS methods for a spatially explicit interpretation. Appl. Geogr. 2016, 68, 28–36. [Google Scholar] [CrossRef]
- Swift, A.; Liu, L.; Uber, J. Reducing MAUP bias of correlation statistics between water quality and GI illness. Comput. Environ. Urban Syst. 2008, 32, 134–148. [Google Scholar] [CrossRef]
- Hirsch, A.L. On using 222Rn and CO2 to calculate regional-scale CO2 fluxes. Atmos. Chem. Phys. 2007, 7, 3737–3747. [Google Scholar] [CrossRef] [Green Version]
- Van der Laan, S.; Neubert, R.E.M.; Meijer, H.A.J. Methane and nitrous oxide, emissions in the Netherlands: Ambient measurements support the national inventories. Atmos. Chem. Phys. 2009, 9, 9369–9379. [Google Scholar] [CrossRef] [Green Version]
- Thom, M.; Bösinger, R.; Schmidt, M.; Levin, I. The Regional Budget of Atmospheric Methane of a Highly Populated Area. Chemosphere 1993, 26, 143–160. [Google Scholar] [CrossRef]
- Schmidt, M.; Graul, R.; Sartorius, H.; Levin, I. Carbon dioxide and methane in continental Europe: A climatology, and 222Radonbased emission estimates. Tellus B 1996, 48, 457–473. [Google Scholar] [CrossRef] [Green Version]
- Schmidt, M.; Glatzel-Mattheier, H.; Sartorius, H.; Worthy, D.E.; Levin, I. Western European N2O emissions: A top-down approach based on atmospheric observations. J. Geophys. Res. 2001, 106, 5507–5516. [Google Scholar] [CrossRef]
- Szegvary, T.; Conen, F.; Ciais, P. European 222Rn inventory for applied atmospheric studies. Atmos. Environ. 2009, 43, 1536–1539. [Google Scholar] [CrossRef]
- López-Coto, J.; Mas, J.L.; Bolivar, J.P. A 40-year retrospective European radon flux inventory including climatological variability. Atmos. Environ. 2013, 73, 22–33. [Google Scholar] [CrossRef]
- Karstens, U.; Schwingshackl, C.; Schmithüsen, D.; Levin, I. A process-based 222radon flux map for Europe and its comparison to long-term observations. Atmos. Chem. Phys. 2015, 15, 12845–12865. [Google Scholar] [CrossRef] [Green Version]
- Gaudry, A.; Polian, G.; Ardouin, B.; Lambert, G. Radon calibrated emissions of CO2 from South Africa. Tellus B 1990, 42B, 9–19. [Google Scholar] [CrossRef] [Green Version]
- Wilson, S.R.; Dick, A.L.; Fraser, P.J.; Whittlestone, S. Nitrous oxide flux estimates for south-eastern Australia. J. Atmos. Chem. 1997, 26, 169–188. [Google Scholar] [CrossRef]
- Hammer, S.; Levin, I. Seasonal variation of the molecular hydrogen uptake by soils inferred from continuous atmospheric observations in Heidelberg, southwest Germany. Tellus B 2009, 61, 556–565. [Google Scholar] [CrossRef]
- Burnett, W.C.; Dulaiova, H. Estimating the dynamics of groundwater input into the coastal zone via continuous radon-222 measurements. J. Environ. Radioact. 2003, 69, 21–35. [Google Scholar] [CrossRef]
- Su, X.; Lu, C.; Li, M.; Wang, Y.; Wang, N. Using 222Rn temporal and spatial distributions to estimate the groundwater discharge rate and associated nutrient fluxes into high salinity lakes in Badain Jaran Desert, Northwest China. Sci. Total Environ. 2023, 857, 159359. [Google Scholar] [CrossRef]
- Lawrence, C.E.; Akber, R.A.; Bollhöfer, A.; Martin, P. Radon-222 exhalation from open ground on and around a uranium mine in the wet-dry tropics. J. Environ. Radioact. 2009, 100, 1–8. [Google Scholar] [CrossRef]
- Ota, M.; Iida, T.; Yamazawa, H.; Nagara, S.; Ishimori, Y.; Sato, K.; Tokizawa, T. Suppression of Radon Exhalation from Soil by Covering with Clay-mixed Soil. J. Nucl. Sci. Technol. 2007, 44, 791–800. [Google Scholar] [CrossRef]
- EPA (Environmental Protection Agency). Health and Environmental Protection Standards for Uranium and Thorium Mill Tailings. 1954. Available online: https://www.ecfr.gov/current/title-40/chapter-I/subchapter-F/part-192 (accessed on 25 November 2022).
- Altic, N. Final-Technical Bases and Guidance for Radon Flux Monitoring at Uranium Mill Tailing Sites, Report: (RFTA 11-010) DCN-TR-01-0. 2011. Available online: https://www.nrc.gov/docs/ML1118/ML11186A899.pdf (accessed on 25 November 2022).
- Fuhrmann, M.; Benson, C.; Likos, W.; Stefani, N.; Michaud, A.; Waugh, J.; Williams, M. Radon fluxes at four uranium mill tailings disposal sites after about 20 years of service. J. Environ. Radioact. 2021, 237, 106719. [Google Scholar] [CrossRef]
- Gnoni, G.; Palacios, M. Measurements of Radon Exhalation Flux and Atmospheric Radon in Uranium Minning and Progressing Sites. In Sources and Measurements of Radon and Radon Progeny Applied to Climate and Air Quality Studies, Proceedings of the Technical Meeting Held in Vienna/Organized by the International Atomic Energy and Co-Sponsored by the World Meteorological Organization, Vienna, Austria, 14–18 November 2011; IAEA: Vienna, Austria, 2011; pp. 29–38. [Google Scholar]
- Sahoo, B.K.; Mayya, Y.S.; Sapra, B.K.; Gaware, J.J.; Banerjee, K.S.; Kushwaha, H.S. Radon exhalation studies in an Indian uranium tailings pile. Radiat. Meas. 2010, 45, 237–241. [Google Scholar] [CrossRef]
- Morris, R.C.; Fraley, L. Effects of vegetation, A clay cap, and environmental variables on Rn-222 fluence rate from reclaimed U mill tailings. Health Phys. 1989, 56, 431–440. [Google Scholar] [CrossRef]
- Dueñas, C.; Liger, E.; Cañete, S.; Pérez, M.; Bolívar, J.P. Exhalation of 222Rn from phosphogypsum piles located at the Southwest of Spain. J. Environ. Radioact. 2007, 95, 63–74. [Google Scholar] [CrossRef]
- Miklyaev, P.S.; Petrova, T.B.; Marennyy, A.M.; Shchitov, D.V.; Sidyakin, P.A.; Murzabekov, M.A.; Lopatin, M.N. High seasonal variations of the radon exhalation from soil surface in the fault zones (Baikal and North Caucasus regions). J. Environ. Radioact. 2020, 219, 106271. [Google Scholar] [CrossRef]
- Miklyaev, P.S.; Petrova, T.B.; Shchitov, D.V.; Sidyakin, P.A.; Murzabekov, M.A.; Marennyy, A.M.; Nefedov, N.A.; Sapozhnikov, Y.A. The results of long-term simultaneous measurements of radon exhalation rate, radon concentrations in soil gas and groundwater in the fault zone. Appl. Radiat. Isot. 2021, 167, 109460. [Google Scholar] [CrossRef]
- Vaupotič, J.; Gregorič, A.; Kobal, I.; Žvab, P.; Kozak, K.; Mazur, J.; Kochowska, E.; Grządziel, D. Radon concentration in soil gas and radon exhalation rate at the Ravne Fault in NW Slovenia. Nat. Hazards Earth Syst. Sci. 2010, 10, 895–899. [Google Scholar] [CrossRef]
- He, H.; Chen, Z.; Liu, Z.; Gao, Z.; Hu, L.; Lu, C.; Shao, J.; Li, Y. Fluid geochemistry in Xiaojiang fault zone, southeastern Tibetan plateau: Implications for fault activity. Appl. Geochem. 2022, 105507. [Google Scholar] [CrossRef]
- Richon, P.; Klinger, Y.; Tapponnier, P.; Li, C.X.; Van Der Woerd, J.; Perrier, F. Measuring radon flux across active faults: Relevance of excavating and possibility of satellite discharges. Radiat. Meas. 2010, 45, 211–218. [Google Scholar] [CrossRef]
- Papastefanou, C. Variation of radon flux along active fault zones in association with earthquake occurrence. Radiat. Meas. 2010, 45, 943–951. [Google Scholar] [CrossRef]
- Steinitz, G.; Begin, Z.B.; Gazit-Yaari, N.A. Statistically Significant Relation between Rn Flux and Weak Earthquakes in the Dead Sea Rift Valley. Geology 2003, 31, 505–508. [Google Scholar] [CrossRef]
- Yakovleva, V.S.; Karataev, V.D. Radon Flux Density at the Earth’s Surface as a Possible Indicator of the Stress and Strain State of the Geological Environment. J. Seismol. 2007, 1, 67–70. [Google Scholar] [CrossRef]
- Rowberry, M.D.; Martí, X.; Frontera, C.; Van De Wiel, M.J.; Briestenský, M. Calculating flux to predict future cave radon concentrations. J. Environ. Radioact. 2016, 157, 16–26. [Google Scholar] [CrossRef] [PubMed] [Green Version]
- Lucchetti, C.; Briganti, A.; Castelluccio, M.; Galli, G.; Santilli, S.; Soligo, M.; Tuccimei, P. Integrating radon and thoron flux data with gamma radiation mapping in radon-prone areas. The case of volcanic outcrops in a highly-urbanized city (Roma, Italy). J. Environ. Radioact. 2019, 202, 41–50. [Google Scholar] [CrossRef]
- Ramola, R.C.; Prasad, G.; Gusain, G.S. Estimation of indoor radon concentration based on radon flux from soil and groundwater. Appl. Radiat. Isot. 2011, 69, 1318–1321. [Google Scholar] [CrossRef]
- Stavitskaya, K.; Ryzhakova, N.; Udalov, A.; Almyakov, P. Comparative analysis of the measuring results of the radon flux density and Ra-226 specific activity for different soils types. AIP Conf. Proc. 2019, 2101, 020013. [Google Scholar]
- Baeza, A.; García-Paniagua, J.; Guillén, J.; Montalbán, B. Influence of architectural style on indoor radon concentration in a radon prone area: A case study. Sci. Total Environ. 2018, 610–611, 258–266. [Google Scholar] [CrossRef]
- Abodunrin, O.P.; Akinloye, M.K. Determination of radon exhalation rates from soil around buildings in Lagos environments using passive measurement technique. J. Environ. Health Sci. 2020, 18, 129–135. [Google Scholar] [CrossRef]
- Leshukov, T.; Larionov, A.; Legoshchin, K.; Lesin, Y.; Yakovleva, S. The Assessment of Radon Emissions as Results of the Soil Technogenic Disturbance. Int. J. Environ. Res. Public Health 2020, 17, 9268. [Google Scholar] [CrossRef]
- Tuccimei, P.; Moroni, M.; Norcia, D. Simultaneous determination of 222Rn and 220Rn exhalation rates from building materials used in Central Italy with accumulation chambers and a continuous solid-state alpha detector: Influence of particle size, humidity and precursors concentration. Appl. Radiat. Isot. 2006, 64, 254–263. [Google Scholar] [CrossRef]
- Kuzmanović, P.; Todorović, N.; Nikolov, J.; Hansman, J.; Vraničar, A.; Knežević, J. Assessment of radiation risk and radon exhalation rate for granite used in the construction industry. J. Radioanal. Nucl. Chem. 2019, 321, 565–577. [Google Scholar] [CrossRef]
- Yarmoshenko, I.V.; Vasilyev, A.V.; Onishchenko, A.D.; Kiselev, S.M.; Zhukovsky, M.V. Indoor radon problem in energy efficient multi-storey buildings. Radiat. Prot. Dosim. 2014, 160, 53–56. [Google Scholar] [CrossRef]
- Nazaroff, W. Radon transport from soil to air. Rev. Geophys. 1992, 30, 137–160. [Google Scholar] [CrossRef]
- Nazaroff, W.W.; Moed, B.A.; Sextro, R.G. Soil as a source of indoor radon: Generation, migration, and entry. In Radon and Its Decay Products in Indoor Air; Nazaroff, W.W., Nero, A.V., Eds.; JohnWiley & Sons: New York, NY, USA, 1988; pp. 57–112. [Google Scholar]
- Hassan, N.M.; Hosoda, M.; Ishikawa, T.; Sorimachi, A.; Sahoo, S.K.; Tokonami, S.; Fukushi, M. Radon Migration Process and Its Influence Factors; Review. JPN J. Health Phys 2009, 44, 218–231. [Google Scholar] [CrossRef] [Green Version]
- Sakoda, A.; Ishimori, Y.; Yamaoka, K. A comprehensive review of radon emanation measurements for mineral, rock, soil, mill tailing and fly ash. Appl. Radiat. Isot. 2011, 69, 1422–1435. [Google Scholar] [CrossRef]
- Bossew, P. The radon emanation power of building materials, soils and rocks. Appl. Radiat. Isot. 2003, 59, 389–392. [Google Scholar] [CrossRef]
- Zhuo, W.; Iida, T.; Furukawa, M. Modelling Radon Flux Density from the Earth’s Surface. J. Nucl. Sci. Technol. 2006, 43, 479–482. [Google Scholar] [CrossRef]
- Sakoda, A.; Ishimori, Y.; Hanamoto, K.; Kataoka, T.; Kawabe, A.; Yamaoka, K. Experimental and modelling studies of grain size and moisture content effects on radon emanation. Radiat. Meas. 2010, 45, 204–210. [Google Scholar] [CrossRef]
- Markkanen, M.; Arvela, H. Radon emanation from soils. Health Phys. 1992, 45, 269–272. [Google Scholar] [CrossRef]
- Barillon, R.; Özgümüs, A.; Chambaudet, A. Direct recoil radon emanation from crystalline phase. Influence of moisture content. Geochim. Cosmochim. Acta 2005, 69, 2735–2744. [Google Scholar] [CrossRef]
- Morawska, L.; Phillips, C.R. Dependence of the radon emanation coefficient on radium distribution and internal structure of the material. Geochim. Cosmochim. Acta 1993, 57, 1783–1797. [Google Scholar] [CrossRef]
- Baeza, A.; Del Rio, M.; Jimenez, A.; Miro, C.; Paniagua, J. Influence of geology and soil particle size on the surface area/volume activity ratio for natural radionuclides. J. Radioanal. Nucl. Chem. 1995, 189, 289–299. [Google Scholar] [CrossRef]
- Iskandar, D.; Yamazawa, H.; Iida, T. Quantification of the dependency of radon emanation power on soil temperature. Appl. Radiat. Isot. 2004, 60, 971–973. [Google Scholar] [CrossRef]
- Quindos, L.S.; Fernandez, P.L.; Soto, J. A method for the measurement of the emanation factor for 222Rn. in small samples of porous materials. Radiat. Prot. Dosim. 1994, 56, 171–173. [Google Scholar] [CrossRef]
- Porstendörfer, J. Properties and Behaviour of Radon and Thoron and Their Decay Products in the Air. J. Aerosol. Sci. 1994, 25, 219–263. [Google Scholar] [CrossRef]
- IAEA (International Atomic Energy Agency). Measurement and Calculation of Radon Releases from NORM Residues: Technical Reports Series No. 474. Available online: https://www-pub.iaea.org/MTCD/Publications/PDF/trs474_webfile.pdf (accessed on 25 November 2020).
- Keller, G.; Hoffmann, B. The Radon Diffusion Length as a Criterion for the Radon Tightness, IRPA-10: 10. In Proceedings of the International Congress of the International Radiation Protection Association, Hiroshima, Japan, 14–19 May 2000. [Google Scholar]
- Etiope, G.; Lombardi, S. Evidence for radon transport by carrier gas through faulted clays in Italy. J. Radioanal. Nucl. Chem. 1995, 193, 291–300. [Google Scholar] [CrossRef]
- Ielsch, G.; Cushing, M.E.; Combes, P.; Cuney, M. Mapping of the geogenic radon potential in France to improve radon risk management: Methodology and first application to region Bourgogne. J. Environ. Radioact. 2010, 101, 813–820. [Google Scholar] [CrossRef]
- Ciotoli, G.; Ascione, A.; Bigi, S.; Lombardi, S.; Mazzoli, S. Soil gas distribution in the main coseismic surface rupture zone of the 1980, Ms=6.9, irpinia earthquake (Southern Italy). J. Geophys. Res. Solid Earth 2014, 119, 2440–2461. [Google Scholar] [CrossRef]
- Ciotoli, G.; Etiope, G.; Guerra, M.; Lombardi, S.; Duddridge, G.A.; Grainger, P. Migration of gas injected into a fault in low-permeability ground. Q. J. Eng. Geol. Hydrogeol. 2005, 38, 305–320. [Google Scholar] [CrossRef]
- Maffucci, R.; Ciotoli, G.; Pietrosante, A.; Cavinato, G.P.; Millia, S.; Ruggiero, L.; Sciarra, A.; Bigi, S. Geological hazard assessment of the coastal area of Rome (Central Italy) from multi-source data integration. Eng. Geol. 2022, 297, 106527. [Google Scholar] [CrossRef]
- Cinelli, G.; Tositti, L.; Capaccioni, B.; Brattich, E.; Mostacci, D. Soil gas radon assessment and development of a radon risk map in Bolsena, Central Italy. Environ. Geochem. Health 2015, 37, 305–319. [Google Scholar] [CrossRef]
- Lee, S.C.; Kim, C.K.; Lee, C.K.; Kang, H.D. Natural radionuclides contents and radon exhalation rates in building materials used in South Korea. Radiat. Prot. Dosim. 2001, 94, 269–274. [Google Scholar] [CrossRef]
- Lucchetti, C.; Castelluccio, M.; Altamore, M.; Briganti, A.; Galli, G.; Soligo, M.; Tuccimei, P.; Voltaggio, M. Using a scale model room to assess the contribution of building material of volcanic origin to indoor radon. Nukleonik 2020, 65, 71–76. [Google Scholar] [CrossRef]
- Yarmoshenko, I.; Malinovsky, G.; Vasilyev, A.; Onischenko, A.; Seleznev, A. Geogenic and anthropogenic impacts on indoor radon in the Techa River region. Sci. Tot. Environ. 2016, 571, 1298–1303. [Google Scholar] [CrossRef]
- Yakut, H.; Tabar, E.; Yıldırım, E.; Zenginerler, Z.; Ertugral, F.; Demirci, N. Soil Gas Radon Measurement Around Fault Lines on The Western Section of the North Anatolian Fault Zone in Turkey. Radiat. Prot. Dosim. 2017, 173, 405–413. [Google Scholar] [CrossRef]
- Yamazawa, H.; Miyazaki, T.; Moriizumi, J.; Iida, T.; Takeda, S.; Nagara, S.; Sato, K.; Tokizawa, T. Radon exhalation from a ground surface during a cold snow season. Int. Congr. Ser. 2005, 1276, 221–222. [Google Scholar] [CrossRef]
- Ferreira, A.; Daraktchieva, Z.; Beamish, D.; Kirkwood, C.; Lister, T.R.; Cave, M.; Wragg, J.; Lee, K. Indoor radon measurements in south west England explained by topsoil and stream sediment geochemistry, airborne gamma-ray spectroscopy and geology. J. Environ. Radioact. 2018, 181, 152–171. [Google Scholar] [CrossRef] [Green Version]
- Wiegand, J. A guideline for the evaluation of the soil radon potential based on geogenic and anthropogenic parameters. Environ. Geol. 2001, 40, 949–963. [Google Scholar] [CrossRef]
- Zmazek, B.; Živčić, M.; Vaupotič, J.; Bidovec, M.; Poljak, M.; Kobal, I. Soil radon monitoring in the Krško Basin, Slovenia. Appl. Radiat. Isot. 2002, 56, 649–657. [Google Scholar] [CrossRef] [PubMed]
- D’Incecco, S.; Petraki, E.; Priniotakis, G.; Papoutsidakis, M.; Yannakopoulos, P.; Nikolopoulos, D. CO2 and Radon Emissions as Precursors of Seismic Activity. Earth Syst. Environ. 2021, 5, 655–666. [Google Scholar] [CrossRef]
- Hosoda, M.; Shimo, M.; Sugino, M.; Furukawa, M.; Fukushi, M. Effect of soil moisture content on radon and thoron exhalation. J. Nucl. Sci. Technol. 2007, 44, 664–672. [Google Scholar] [CrossRef]
- Avramović, D.; Čeliković, I.; Ujić, P.; Vukanac, I.; Kandić, A.; Jevremović, A.; Antonijević, D.; Lončar, B. Radon exhalation rate of some building materials common in Serbia. RAD Conf. Proc. 2019, 3, 119–122. [Google Scholar] [CrossRef]
- Pyngrope, A.; Saxena, A.; Khardewsaw, A.; Sharma, Y.; Sahoo, B.K. Effect of soil’s porosity and moisture content on radon and thoron exhalation rates. J. Radioanal. Nucl. Chem. 2022, 331, 1975–1984. [Google Scholar] [CrossRef]
- Janik, M.; Omori, Y.; Yonehara, H. Influence of humidity on radon and thoron exhalation rates from building materials. Appl. Radiat. Isot. 2015, 95, 102–107. [Google Scholar] [CrossRef] [PubMed]
- Mazur, J.; Kozak, K. Complementary system for long term measurements of radon exhalation rate from soil. Rev. Sci. Instrum. 2014, 85, 022104. [Google Scholar] [CrossRef]
- Ferry, C.; Beneito, A.; Richon, P.; Robe, M.-C. An Automatic Device for Measuring the Effect of Meteorological Factors on Radon-222 Flux from Soils on the Long Term. Radiat. Prot. Dosim. 2021, 93, 271–274. [Google Scholar] [CrossRef] [PubMed]
- Müllerová, M.; Holý, K.; Blahušiak, P.; Bulko, M. Study of radon exhalation from the soil. J. Radioanal. Nucl. Chem. 2018, 315, 237–241. [Google Scholar] [CrossRef]
- Yang, J.; Buchsteiner, M.; Salvamoser, J.; Irlinger, J.; Guo, Q.; Tschiersch, J. Radon Exhalation from Soil and Its Dependence From Environmental Parameters. Radiat. Prot. Dosim. 2017, 177, 21–25. [Google Scholar] [CrossRef]
- Cosma, C.; Ristoiu, D.; Poffijn, A. Radon Mapping in Cluj-Napoca City—A Radon Prone Area From Romania. In Proceedings of the Radon in the Living Environment, Athens, Greece, 19–23 April 1999; pp. 707–722. [Google Scholar]
- Kropat, G.; Bochud, F.; Murith, C.; Palacios, M.; Baechler, S. Modeling of geogenic radon in Switzerland based on ordered logistic regression. J. Environ. Radioact. 2017, 166, 376–381. [Google Scholar] [CrossRef] [PubMed] [Green Version]
- Yang, J.; Busen, H.; Scherb, H.; Hürkamp, K.; Guo, Q.; Tschiersch, J. Modeling of radon exhalation from soil influenced by environmental parameters. Sci. Total Environ. 2019, 656, 1304–1311. [Google Scholar] [CrossRef] [PubMed]
- Porstendörfer, J.; Butterweck, G.; Reineking, A. Diurnal Variation of the Concentrations of Radon and Its Short-Lived Daughters in the Atmosphere near the Ground. Atmos. Environ. 1991, 25A, 709–713. [Google Scholar] [CrossRef]
- Sesana, L.; Caprioli, E.; Marcazzan, G.M. Long Period Study of Outdoor Radon Concentration in Milan and Correlation between Its Temporal Variations and Dispersion Properties of Atmosphere. J. Environ. Radioact. 2003, 65, 147–160. [Google Scholar] [CrossRef] [PubMed]
- Griffiths, A.D.; Zahorowski, W.; Element, A.; Werczynski, S. A map of radon flux at the Australian land surface. Atmos. Chem. Phys. 2010, 10, 8969–8982. [Google Scholar] [CrossRef] [Green Version]
- Zhuo, W.; Chen, B.; Li, D.; Liu, H. Reconstruction of Database on Natural Radionuclide Contents in Soil in China. J. Nucl. Sci. Technol. 2008, 45, 180–184. [Google Scholar] [CrossRef] [Green Version]
- Hirao, S.; Yamazawa, H.; Moriizumi, J. Estimation of the Global 222Rn Flux Density from the Earth’s Surface. Japanese. J. Health Phys. 2010, 45, 161–171. [Google Scholar] [CrossRef] [Green Version]
- Kitto, M. Interrelationship of indoor radon concentrations, soil-gas flux, and meteorological parameters. J. Radioanal. Nucl. Chem. 2005, 264, 381–385. [Google Scholar] [CrossRef]
- Prasad, G.; Ishikawa, T.; Hosoda, M.; Sorimachi, A.; Sahoo, S.K.; Kavasi, N.; Tokonami, S.; Sugino, M.; Uchida, S. Seasonal and diurnal variations of radon/thoron exhalation rate in Kanto-loam area in Japan. J. Radioanal. Nucl. Chem. 2012, 292, 1385–1390. [Google Scholar] [CrossRef]
- Wilkening, M.H.; Clements, W.E.; Stanley, D. Radon 222 flux measurements in widely separated regions. In The Natural Radiation Environment II; Adams, J.A.S., Lowder, W.M., Gesell, T.F., Eds.; USERDA CONF-720805; Rice University: Houston, TX, USA, 1972; pp. 717–730. [Google Scholar]
- Grossi, C.; Vargas, A.; Camacho, A.; López-Coto, I.; Bolívar, J.P.; Xia, Y.; Conen, F. Inter-comparison of different direct and indirect methods to determine radon flux from soil. Radiat. Meas. 2011, 46, 112–118. [Google Scholar] [CrossRef]
- Petropoulos, N.P.; Anagnostakis, M.J.; Simopoulos, S.E. Building materials radon exhalation rate: ERRICCA intercomparison exercise results. Sci. Total Environ. 2001, 272, 109–118. [Google Scholar] [CrossRef] [PubMed]
- Szegvary, T.; Conen, F.; Stöhlker, U.; Dubois, G.; Bossew, P.; de Vries, G. Mapping terrestrial γ-dose rate in Europe based on routine monitoring data. Radiat. Meas. 2007, 42, 1561–1572. [Google Scholar] [CrossRef]
- Jonassen, N. The determination of radon exhalation rates. Health Phys. 1983, 45, 369–376. [Google Scholar] [CrossRef] [PubMed]
- Chen, Z.; Li, Y.; Liu, Z.; Wang, J.; Zhou, X.; Du, J. Radon emission from soil gases in the active fault zones in the Capital of China and its environmental effects. Sci. Rep. 2018, 8, 16772. [Google Scholar] [CrossRef] [Green Version]
- Countess, R.J. Radon flux measurements with a charcoal canister. Health Phys. 1976, 31, 455–456. [Google Scholar] [PubMed]
- Wang, N.; Xiao, L.; Li, C.; Mei, W.; Hang, Y.; Liu, D. Level of Radon Exhalation Rate from Soil in Some Sedimentary and Granite Areas in China. J. Nucl. Sci. Technol. 2009, 46, 303–309. [Google Scholar] [CrossRef]
- Fremman, H.D.; Hartley, J.N. Measurement Technology for Radon in the Soil. Indoor Radon 1986, SP-54, 167–181. [Google Scholar]
- Tsapalov, A.; Kovler, K.; Miklyaev, P. Open charcoal chamber method for mass measurements of radon exhalation rate from soil surface. J. Environ. Radioact. 2016, 160, 28–35. [Google Scholar] [CrossRef] [PubMed]
- Iimoto, T.; Akasaka, Y.; Koike, Y.; Kosako, T. Development of a technique for the measurement of the radon exhalation rate using an activated charcoal collector. J. Environ. Radioact. 2008, 99, 587–595. [Google Scholar] [CrossRef] [PubMed]
- Stieff, L.; Kotrappa, P.; Bigu, J. Passive E-Perm Radon Flux Monitors for Measuring Undisturbed Radon Flux from the Ground. In Proceedings International Radon Symposium; American Association of Radon Scientists and Technologists: Haines City, FL, USA, 1996. [Google Scholar]
- Kotrappa, P.; Dempsey, J.C.; Stieff, L.R. Recent advances in electret ion chamber technology for radiation measurements. Radiat. Prot. Dosim. 1993, 47, 461–464. [Google Scholar] [CrossRef]
- Kotrappa, P.; Stieff, L.R.; Volkovitsky, P. Radon monitor calibration using nist radon emanation standards: Steady flow method. Radiat. Prot. Dosim. 2004, 113, 70–74. [Google Scholar] [CrossRef] [PubMed] [Green Version]
- Thabayneh, K.M. Determination of radon exhalation rates in soil samples using sealed can technique and CR-39 detectors. J Environ. Health Sci Eng. 2018, 16, 121–128. [Google Scholar] [CrossRef] [PubMed]
- Ielsch, G.; Ferry, C.; Tymen, G.; Robé, M.C. Study of a predictive methodology for quantification and mapping of the radon-222 exhalation rate. J. Environ. Radioact. 2002, 63, 15–33. [Google Scholar] [CrossRef] [PubMed]
- Zhuo, W.; Furukawa, M.; Guo, Q.; Kim, Y.S. Soil Radon Flux and Outdoor Radon Concentrations in East Asia. Int. Congr. Ser. 2005, 1276, 285–286. [Google Scholar] [CrossRef]
- Abu-Jarad, F. Application of nuclear track detectors for radon related measurements. Int. J. Radiat. Appl. Instrum. Part D Nucl. Tracks Radiat. Meas. 1988, 15, 525–534. [Google Scholar] [CrossRef]
- Menon, S.R.; Sahoo, B.K.; Balasundar, S.; Gaware, J.J.; Jose, M.T.; Venkatraman, B.; Mayya, Y.S. A comparative study between the dynamic method and passive can technique of radon exhalation measurements from samples. Appl. Radiat. Isot. 2015, 99, 172–178. [Google Scholar] [CrossRef]
- Faheem, M. Radon exhalation and its dependence on moisture content from samples of soil and building materials. Radiat. Meas. 2008, 43, 1458–1462. [Google Scholar] [CrossRef]
- Ujić, P.; Čeliković, I.; Kandić, A.; Vukanac, I.; Đurašević, M.; Dragosavac, D.; Žunić, Z. Internal exposure from building materials exhaling 222Rn and 220Rn as compared to external exposure due to their natural radioactivity content. Appl. Radiat. Isot. 2010, 68, 201–206. [Google Scholar] [CrossRef]
- Vargas, A.; Ortega, X. Influence of environmental changes on integrating radon detectors: Results of an intercomparison exercise. Radiat. Prot. Dosim. 2007, 123, 529–536. [Google Scholar] [CrossRef] [Green Version]
- Saegusa, J.; Yamasaki, K.; Tsujimoto, T.; Yamauchi, T.; Shimo, M. Development of an apparatus for measuring ground exhalation rates of 222Rn and 220Rn. Environ. Int. 1996, 22, S483–S490. [Google Scholar] [CrossRef]
- Dueñas, C.; Fernández, M.C.; Carretero, J.; Liger, E.; Pérez, M. Release of 222Rn from some soils. Ann. Geophys. Eur. Geosci. Union 1997, 15, 124–133. [Google Scholar]
- Shweikani, R.; Hushari, M. The Correlations between Radon in Soil Gas and Its Exhalation and Concentration in Air in the Southern Part of Syria. Radiat. Meas. 2005, 40, 699–703. [Google Scholar] [CrossRef]
- Hosoda, M.; Shimo, M.; Sugino, M.; Furukawa, M.; Fukushi, M.; Minami, K.; Ejiri, K. Radon and thoron exhalation rate map in Japan. In The Natural Radiation Environment-8th International Symposium; Paschoa, A.S., Steinhäusler, F., Eds.; American Institute of Physics: New York, NY, USA, 2008; pp. 177–180. [Google Scholar]
- Prasad, G.; Ishikawa, T.; Hosoda, M.; Sahoo, S.K.; Kavasi, N.; Sorimachi, A.; Tokonami, S.; Uchida, S. Measurement of radon/thoron exhalation rates and gamma-ray dose rate in granite areas in Japan. Radiat. Prot. Dosim. 2012, 152, 130–134. [Google Scholar] [CrossRef]
- Sun, K.; Guo, Q.; Cheng, J. The Effect of Some Soil Characteristics on Soil Radon Concentration and Radon Exhalation from Soil Surface. J. Nucl. Sci. Technol. 2004, 41, 1113–1117. [Google Scholar] [CrossRef]
- Guo, Q.; Sun, K.; Cheng, J. Methodology study on evaluation of radon flux from soil in China. Radiat. Prot. Dosim. 2004, 112, 291–296. [Google Scholar] [CrossRef]
- Colenghi, V.; Lepore, L.; Di Carlo, C.; Bochicchio, F.; Remetti, R. Development of an electrostatic precipitator prototype to reduce exposure to radon progeny in poorly ventilated workplaces. J. Radiat. Res. Appl. Sci. 2020, 13, 747–757. [Google Scholar] [CrossRef]
- Yuan, L.; Geng, S.; Luo, B.; Wu, J.; Wang, J. Research on Electrostatic-filtration Radon Elimination Techniques in Underground Space. In Proceedings of the 2016 International Forum on Energy, Environment and Sustainable Development (IFEESD 2016), Shenzhen, China, 16–17 April 2016; pp. 24–30. [Google Scholar] [CrossRef] [Green Version]
- Koarashi, J.; Amano, H.; Andoh, M.; Iida, T. Estimation of 222Rn flux from ground surface based on the variation analysis of 222Rn concentration in a closed chamber. Radiat. Prot. Dosim. 2000, 87, 121–131. [Google Scholar] [CrossRef]
- Clouvas, A.; Leontaris, F.; Xanthos, S.; Alifragis, D. Radon Migration in Soil and Its Relation to Terrestrial Gamma Radiation in Different Locations of the Greek Early Warning System Network. Radiat. Prot. Dosim. 2017, 175, 124–133. [Google Scholar] [CrossRef]
- Hosoda, M.; Ishikawa, T.; Sorimachi, A.; Tokonami, S.; Uchida, S. Development and application of a continuous measurement system for radon exhalation rate. Rev. Sci. Instrum. 2011, 82, 015101. [Google Scholar] [CrossRef]
- Zahorowski, W.; Whittlestone, S. A fast portable emanometer for field measurement of radon and thoron flux. Radiat. Prot. Dosim. 1996, 67, 109–120. [Google Scholar] [CrossRef]
- Schery, S.D.; Whittlestone, S.; Hart, K.P.; Hill, S.E. The flux of radon and thoron from Australian soils. J. Geophys. Res. 1989, 94, 8567–8576. [Google Scholar] [CrossRef]
- Chao, C.Y.H.; Tung, T.C.W.; Chan, D.W.T.; Burnett, J. Determination of radon emanation and back diffusion characteristics of building materials in small chamber tests. Build Environ. 1997, 32, 355–362. [Google Scholar] [CrossRef]
- Awhida, A.; Ujić, P.; Kolarž, P.; Čeliković, I.; Milinčić, M.; Lončar, A.; Lončar, B. Merits and Demerits of Different Methods for Radon Exhalation Measurements for Building Materials. J. Environ. Radioact. 2016, 164, 337–343. [Google Scholar] [CrossRef] [PubMed]
- Morawska, L. Two ways of 222Rn determining the emanation coefficient. Health Phys. 1989, 57, 481–483. [Google Scholar] [PubMed]
- Mayya, Y. Theory of radon exhalation into accumulators placed at the soil-atmosphere interface. Radiat. Prot. Dosim. 2004, 111, 305–318. [Google Scholar] [CrossRef]
- ISO 11665-7:2012; Measurement of Radioactivity in the Environment—Air: Radon-222—Part 7: Accumulation Method for Estimating Surface Exhalation Rate. ISO: Geneva, Switzerland, 2012.
- Alharbi, S.H.; Akber, R.A. Radon-222 activity flux measurement using activated charcoal canisters: Revisiting the methodology. J. Environ. Radioact. 2014, 129, 94–99. [Google Scholar] [CrossRef]
- Gutiérrez-Álvarez, I.; Guerrero, J.; Martín, J.; Adame, J.; Bolívar, J. Influence of the accumulation chamber insertion depth to measure surface radon exhalation rates. J. Hazard. Mater. 2020, 393, 122344. [Google Scholar] [CrossRef]
- Onischenko, A.; Zhukovsky, M.; Bastrikov, V. Calibration system for measuring he radon flux density. Radiat. Prot. Dosim. 2015, 164, 582–586. [Google Scholar] [CrossRef]
- Zhuo, W.; Tokonami, S.; Yonehara, H.; Yamada, Y. A simple passive monitor for integrating measurements of indoor thoron concentrations. Rev. Sci. Instrum. 2002, 73, 2877–2881. [Google Scholar] [CrossRef]
- Gusain, G.S.; Prasad, G.; Prasad, Y.; Ramola, R.C. Comparison of indoor radon level with radon exhalation rate from soil in Garhwal Himalaya. Radiat. Meas. 2009, 44, 1032–1035. [Google Scholar] [CrossRef]
- Bourai, A.; Aswal, S.; Kandari, T.; Kumar, S.; Joshi, V.; Sahoo, B.; Ramola, R. Study of radon flux from soil in Budhakedar region using SRM. Radiat. Prot. Dosim. 2016, 171, 267–270. [Google Scholar] [CrossRef]
- Voltaggio, M.; Masi, U.; Spadoni, M.; Zampetti, G. A methodology for assessing the maximum expected radon flux from soils in northern Latium (central Italy). Environ. Geochem. Health 2006, 28, 541–551. [Google Scholar] [CrossRef]
- Lehmann, B.E.; Ihly, B.; Salzmann, S.; Conen, F.; Simon, E. An automatic static chamber for continuous 220Rn and 222Rn flux measurements from soil. Radiat. Meas. 2004, 38, 43–50. [Google Scholar] [CrossRef]
- Rogers, V.C.; Nielson, K.K. Multiphase radon generation and transport in porous materials. Health Phys. 1991, 60, 807. [Google Scholar] [CrossRef]
- Hosoda, M.; Sorimachi, A.; Yasuoka, Y.; Ishikawa, T.; Sahoo, S.K.; Furukawa, M.; Hassan, N.M.; Tokonami, S.; Uchida, S. Simultaneous measurements of radon and thoron exhalation rates and comparison with values calculated by UNSCEAR equation. J. Radiat. Res. 2009, 50, 333–343. [Google Scholar] [CrossRef] [Green Version]
- Abe, S.; Fujitaka, K.; Abe, M.; Fujimoto, K. Extensive field survey of natural radiation in Japan. J. Nucl. Sci. Technol. 1981, 18, 21–45. [Google Scholar] [CrossRef]
- Chen, J.; Ford, K.L. A study on the correlation between soil radon potential and average indoor radon potential in Canadian cities. J. Environ. Radiaoct. 2017, 166, 152–156. [Google Scholar] [CrossRef]
- Cosma, C.; Ristoiu, D.; Cozar, O.; Znamirovschi, V.; Daraban, L.; Ramboiu, S.; Chereji, I. Studies on the occurrence of radon in selected sites of Romania. Environ. Int. 1996, 22, 61–65. [Google Scholar] [CrossRef]
- Quindos, L.S.; Fernandez, P.L.; Soto, J. National Survey on indoor radon in Spain. Environ. Int. 1991, 17, 449–453. [Google Scholar] [CrossRef]
- Quindos, L.S.; Fernandez, P.L.; Soto, J. Study of areas of Spain with high indoor radon. Radiat. Meas. 1995, 24, 207–210. [Google Scholar] [CrossRef]
- García-Talavera, M.; García-Pérez, A.; Rey, C.; Ramos, L. Mapping radon-prone areas using γ-radiation dose rate and geological information. J. Radiol. Prot. 2013, 33, 605–620. [Google Scholar] [CrossRef] [PubMed] [Green Version]
- Manohar, S.N.; Meijer, H.A.J.; Herber, M.A. Radon flux maps for the Netherlands and Europe using terrestrial gamma radiation derived from soil radionuclides. Atmos Environ. 2013, 81, 399–412. [Google Scholar] [CrossRef]
- Othman, I.; Hushai, M.; Raja, G.; Alsawaf, A. Radon in Syrian houses. J. Radiat. Prot. 1996, 16, 45–50. [Google Scholar] [CrossRef]
- Gupta, M.L.; Douglass, A.R.; Kawa, R.; Pawson, S. Use of radon for evaluation of atmospheric transport models: Sensitivity to emissions. Tellus B 2004, 56, 404–412. [Google Scholar] [CrossRef]
- Zahorowski, W.; Chambers, S.D.; Henderson-Sellers, A. Ground based radon-222 observations and their application to atmospheric studies. J. Environ. Radioact. 2004, 76, 3–33. [Google Scholar] [CrossRef]
- Arnold, D.; Vargas, A.; Vermeulen, A.T.; Verheggen, B.; Seibert, P. Analysis of radon origin by backward atmospheric transport modelling. Atmos. Environ. 2010, 44, 494–502. [Google Scholar] [CrossRef]
- Turekian, K.K.; Nozaki, Y.; Benninger, L.K. Geochemistry of atmospheric radon and radon products. Annu. Rev. Earth Planet. Sci. 1977, 5, 227–255. [Google Scholar] [CrossRef]
- Wilkening, M.H.; Clements, W.E. Radon 222 from ocean surface. J. Geophys. Res. 1975, 80, 3828–3830. [Google Scholar] [CrossRef]
- Schery, S.D.; Huang, S. An estimate of the global distribution of radon emissions from the ocean. Geophys. Res. Lett. 2004, 31, L19104. [Google Scholar] [CrossRef] [Green Version]
- Jacob, D.J.; Prather, M.J. Radon-222 as a test of convective transport in a general circulation model. Tellus B 1990, 42B, 118–134. [Google Scholar] [CrossRef] [Green Version]
- Lee, H.N.; Feichter, J. An intercomparison of wet precipitation scavenging schemes and the emission rates of 222Rn for the simulation of global transport and deposition of 210Pb. J. Geophys. Res. 1995, 100, 23253–23270. [Google Scholar] [CrossRef]
- Rasch, P.; Feichter, J.; Law, K.; Mahowald, N.; Penner, J.; Benkovitz, C.; Genthon, C.; Giannakopoulos, C.; Kasibhatla, P.; Koch, D.; et al. A comparison of scavenging and deposition processes in global models: Results from the WCRP Cambridge Workshop. Tellus B 2000, 52, 1025–1056. [Google Scholar] [CrossRef] [Green Version]
- Conen, F.; Robertson, L. Latitudinal distribution of radon-222 flux from continents. Tellus B 2002, 54B, 127–133. [Google Scholar] [CrossRef]
- Whittlestone, S.; Zahorowski, W.; Schery, S.D. Radon flux variability with season and location in Tasmania, Australia. J. Radioanal. Nucl. Chem. 1998, 236, 213–217. [Google Scholar] [CrossRef]
- Nielson, K.K.; Rogers, V.C.; Holt, R.B. Measurements and calculations of soil radon flux at 325 sites throughout Florida. Environ. Int. 1996, 22 (Suppl. 1), S471–S476. [Google Scholar] [CrossRef]
- Kuhlmann, A.J.; Worthy, D.E.J.; Trivett, N.B.A.; Levin, I. Methane emissions from a wetland region within Hudson Bay Lowland: An atmospheric approach. J. Geophys. Res. 1998, 103, 16009–16016. [Google Scholar] [CrossRef]
- Williams, A.; Chambers, S.; Zahorowski, W.; Crawford, J.; Matsumoto, K.; Uematsu, M. Estimating the Asian radon flux density and its latitudinal gradient in winter using ground-based radon observations at Sado Island. Tellus B 2009, 61, 732–746. [Google Scholar] [CrossRef]
- Schery, S.D.; Wasiolek, M.A. Radon and Thoron in the Human Environment, Chap. Modeling Radon Flux from the Earth’s Surface; World Scientific Publishing: Singapore, 1998; pp. 207–217. [Google Scholar]
- NCRP (National Council on Radiation Protection and Measurements). Report No. 050—Environmental Radiat Meas; NCRP: Washington, DC, USA, 1976. [Google Scholar]
- Willmott, C.J.; Rowe, C.M.; Mintz, Y. Climatology of the terrestrial seasonal water cycle. J. Climatol. 1985, 5, 589–606. [Google Scholar] [CrossRef]
- NOAA-EPA Global Ecosystems Database, Version 1.0: EPA Global Climate Research Program, NOAA/NGDC Global Change Database Program: Documentation Manual. Reprints, and Digital Data on CD-ROM; US DOC/NOAA National Geophysical Data Center: Boulder, CO, USA, 1992. Available online: https://repository.library.noaa.gov/view/noaa/13439 (accessed on 25 November 2022).
- Robertson, L.B.; Stevenson, D.S.; Conen, F. Test of a northwards-decreasing Rn-222 source term by comparison of modelled and observed atmospheric Rn-222 concentrations. Tellus B 2005, 57, 116–123. [Google Scholar] [CrossRef]
- Szegvary, T.; Leuenberger, M.C.; Conen, F. Predicting terrestrial 222Rn flux using gamma dose rate as a proxy. Atmos. Chem. Phys. 2007, 7, 2789–2795. [Google Scholar] [CrossRef] [Green Version]
- De Cort, M.; De Vries, G.; Galmarini, S.; Tanner, V. International data and information exchange in Europe—systems to assist the EU Member States in radiological and nuclear emergency situations. Radioprotection 2011, 46, S751–S757. [Google Scholar] [CrossRef] [Green Version]
- Sangiorgi, M.; Hernández-Ceballos, M.A.; Jackson, K.; Cinelli, G.; Bogucarskis, K.; De Felice, L.; Patrascu, A.; De Cort, M. The European Radiological Data Exchange Platform (EURDEP): 25 years of monitoring data exchange. Earth Syst. Sci. Data 2020, 12, 109–118. [Google Scholar] [CrossRef] [Green Version]
- Vaupotič, J.; Kobal, I.; Križman, M.J. Background outdoor radon levels in Slovenia. Nukleonika 2010, 55, 579–582. [Google Scholar]
- Nazaroff, W.W.; Nero, A.V., Jr. (Eds.) Radon and Its Decay Products in Indoor Air; Wiley: New York, NY, USA, 1988; pp. 65–69. [Google Scholar]
- Tang, L.; Zhu, L.; Hu, S.; Liu, Q. Study on radon geological potential rules. Rock Miner. Anal. 1999, 18, 1. (In Chinese) [Google Scholar]
- Sun, K.; Guo, Q.; Zhuo, W. Feasibility for Mapping Radon Exhalation Rate from Soil in China. J. Nucl. Sci. Technol. 2004, 41, 86–90. [Google Scholar] [CrossRef]
- Zhuo, W.; Guo, Q.; Chen, B.; Cheng, G. Estimating the amount and distribution of radon flux density from the soil surface in China. J. Environ. Radioact. 2008, 99, 1143–1148. [Google Scholar] [CrossRef]
- Global Ecosystems Database Project. Global Ecosystems Database Version II: Database, User’s Guide, and Dataset Documentation; US Department of Commerce, National Oceanic and Atmospheric Administration, National Geophysical Data Center: Boulder, CO, USA, 2000.
- Ahn, C.H.; Tateishi, R. Development of global land surface evapotranspiration and water balance data sets. J. Photogramm. Remote Sens. 1994, 33, 51–64. [Google Scholar] [CrossRef]
- Minty, B.R.S.; Franklin, R.; Milligan, P.R.; Richardson, L.M.; Wilford, J. The Radiometric Map of Australia. Explor. Geophys. 2009, 40, 325–333. [Google Scholar] [CrossRef]
- Raupach, M.R.; Briggs, P.R.; Haverd, V.; King, E.A.; Paget, M.; Trudinger, C.M. Australian Water Availability Project. 2008. Available online: http://www.csiro.au/awap/ (accessed on 25 November 2022).
- Raupach, M.R.; Briggs, P.R.; Haverd, V.; King, E.A.; Paget, M.; Trudinger, C.M. Australian Water Availability Project (AWAP): CSIRO Marine and Atmospheric Research Component: Final Report for Phase 3; CAWCR Technical Report; CSIRO: Canberra, Australia, 2009. [Google Scholar]
- Jones, D.A.; Wang, W.; Fawcett, R. Climate Data for the Australian Water Availability Project Final Milestone Report; National Climate Centre, Australian Bureau of Meteorology: Melbourne, Australia, 2007; p. 36.
- Papachristodoulou, C.; Ioannides, K.; Spathis, S. The effect of moisture content on radon diffusion through soil: Assessment in laboratory and field experiments. Health Phys. 2007, 92, 257–264. [Google Scholar] [CrossRef]
- Holford, D.J.; Schery, S.D.; Wilson, J.L.; Phillips, F.M. Modelling Radon Transport in Dry, Cracked Soil. J. Geophys. Res. 1993, 98, 567–580. [Google Scholar] [CrossRef]
- Hildebrand, F.B. Finite-Difference Equations and Simulations, Section 2.2; Prentice-Hall: Englewood Cliffs, NJ, USA, 1968. [Google Scholar]
- Smith, G.D. Numerical Solution of Partial Differential Equations: Finite Difference Methods; Oxford University Press (Clarendon): London, UK; New York, NY, USA, 1977. [Google Scholar]
- Salminen, T. Geochemical atlas of Europe part 1: Background information, methodology and maps. In Geochemical Atlas of Europe; Salminen, T., Ed.; EuroGeosurveys and Foregs: Espoo, Finland, 2006; Volume 1. [Google Scholar]
- FAO/IIASA/ISRIC/ISSCAS/JRC. Harmonized World Soil Database (Version 1.1); FAO: Rome, Italy; IIASA: Luxemburg, 2009. [Google Scholar]
- López-Coto, I.; Mas, J.L.; Bolivar, J.P.; García-Tenorio, R. A short-time method to measure the radon potential of porous materials. Appl. Radiat. Isot. 2009, 67, 133–138. [Google Scholar] [CrossRef]
- Sasaki, T.; Gunji, Y.; Okuda, T. Mathematical modelling of radon emanation. J. Nucl. Sci. Technol. 2003, 41, 151. [Google Scholar]
- Uppala, S.M.; KÅllberg, P.W.; Simmons, A.J.; Andrae, U.; Da Costa Bechtold, V.; Fiorino, M.; Gibson, J.K.; Haseler, J.; Hernandez, A.; Kelly, G.A.; et al. The ERA-40 re-analysis. Q. J. R. Meteorol. Soc. 2005, 131, 2961–3012. [Google Scholar] [CrossRef]
- Quindós, L.S.; Poncela Fernández, P.L.; Gómez Arozamena, J.; Sainz, C.; Fernández, J.A.; Suarez Mahou, E.; Martin Matarranz, J.L.; Cascón, M.C. Natural gamma radiation map (MARNA) and indoor radon levels in Spain. Environ. Int. 2004, 29, 1091–1096, ISSN 0160-4120. [Google Scholar] [CrossRef]
- Grasty, R.L.; Minty, B.R.S. A Guide to the Techncial Specifications for Airborne Gamma-ray Surveys; Australian Geological Survey Organisation: Canberra, Australia, 1995.
- Van der Veer, G.; Vriend, S.P.; Van Gaans, P.F.M.; Klaver, G.T.; Van Os, B.H.J. Appendix III: Geochemical Atlas of the Soils and Their Parent Material in the Netherlands, Digital Version 1.1. 2006. Available online: https://dspace.library.uu.nl/bitstream/1874/13275/22/app3.pdf (accessed on 25 November 2022).
- Salminen, R.; Plant, J.; Reeder, S. Geochemical Atlas of Europe. Part 1, Background Information, Methodology and Maps; Geological Survey of Finland: Espoo, Finland, 2005. [Google Scholar]
- Robertson, L.B. Radon Emissions to the Atmosphere and Their Use as Atmospheric Tracers. Ph.D. Thesis, University of Edinburgh, Scotland, UK, 2004. [Google Scholar]
- Millington, R.J.; Quirk, J.P. Transport in Porous media. In Proceedings of the 7th International Congress of soil Science, Madison, WI, USA, 15–23 August 1960; pp. 97–106. [Google Scholar]
- Hartmann, J.; Moosdorf, N. The new global lithological map database GLiM: A representation of rock properties at the Earth surface. Geochem. Geophys. Geosyst. 2012, 13, Q12004. [Google Scholar] [CrossRef]
- Reynolds, C.; Jackson, T.; Rawls, W. Estimating soil waterholding capacities by linking the Food and Agriculture Organization soil map of the world with global pedon databases and continuous pedotransfer functions. Water Resour. Res. 2000, 36, 3653–3662. [Google Scholar] [CrossRef]
- Rodell, M.; Houser, P.R.; Jambor, U.; Gottschalck, J.; Mitchell, K.; Meng, C.-J.; Arsenault, K.; Cosgrove, B.; Radakovich, J.; Bosilovich, M.; et al. The Global Land Data Assimilation System. Bull. Am. Meteorol. Soc. 2004, 85, 381–394. [Google Scholar] [CrossRef]
- Balsamo, G.; Albergel, C.; Beljaars, A.; Boussetta, S.; Brun, E.; Cloke, H.; Dee, D.; Dutra, E.; Muñoz-Sabater, J.; Pappenberger, F.; et al. ERAInterim/Land: A global land surface reanalysis data set. Hydrol. Earth Syst. Sci. 2015, 19, 389–407. [Google Scholar] [CrossRef] [Green Version]
- Miguez-Macho, G.; Li, H.; Fan, Y. Simulated Water Table and Soil Moisture Climatology Over North America. Bull. Am. Meteorol. Soc. 2008, 89, 663–672. [Google Scholar] [CrossRef]
- Coletti, C.; Ciotoli, G.; Benà, E.; Brattich, E.; Cinelli, G.; Galgaro, A.; Massironi, M.; Mazzoli, C.; Mostacci, D.; Morozzi, P.; et al. The assessment of local geological factors for the construction of a Geogenic Radon Potential map using regression kriging. A case study from the Euganean Hills volcanic district (Italy). Sci. Total Environ. 2022, 808, 152064. [Google Scholar] [CrossRef] [PubMed]
- Annunziatellis, A.; Ciotoli, G.; Lombardi, S.; Nolasco, F. Short- and long-term gas hazard: The release of toxic gases in the Albani Hills volcanic area (central Italy). J. Geochem. Explor. 2003, 77, 93–108. [Google Scholar] [CrossRef]
- Papastefanou, C. Measuring radon in soil gas and groundwaters: A review. Ann. Geophys. 2007, 50, 569–578. [Google Scholar] [CrossRef]
- Petermann, E. Mapping indoor radon using machine learning. In Proceedings of the JRCWorkshop Technical Solutions for Displaying and Communicating Indoor Radon Data/European Radon Week 2020, Vienna, Austria, 24–28 February 2020. [Google Scholar]
- Cinelli, G.; Tollefsen, T.; Bossew, P.; Gruber, V.; Bogucarskis, K.; De Felice, L.; De Cort, M. Digital version of the European Atlas of natural radiation. J. Environ. Radioact. 2019, 196, 240–252. [Google Scholar] [CrossRef]
- Li, M.; Wu, P.; Ma, Z. A comprehensive evaluation of soil moisture and soil temperature from third-generation atmospheric and land reanalysis data sets. Int. J. Climatol. 2020, 40, 5744–5766. [Google Scholar] [CrossRef]
| Publisher’s Note: MDPI stays neutral with regard to jurisdictional claims in published maps and institutional affiliations. |
© 2022 by the authors. Licensee MDPI, Basel, Switzerland. This article is an open access article distributed under the terms and conditions of the Creative Commons Attribution (CC BY) license (https://creativecommons.org/licenses/by/4.0/).


 ,
, 


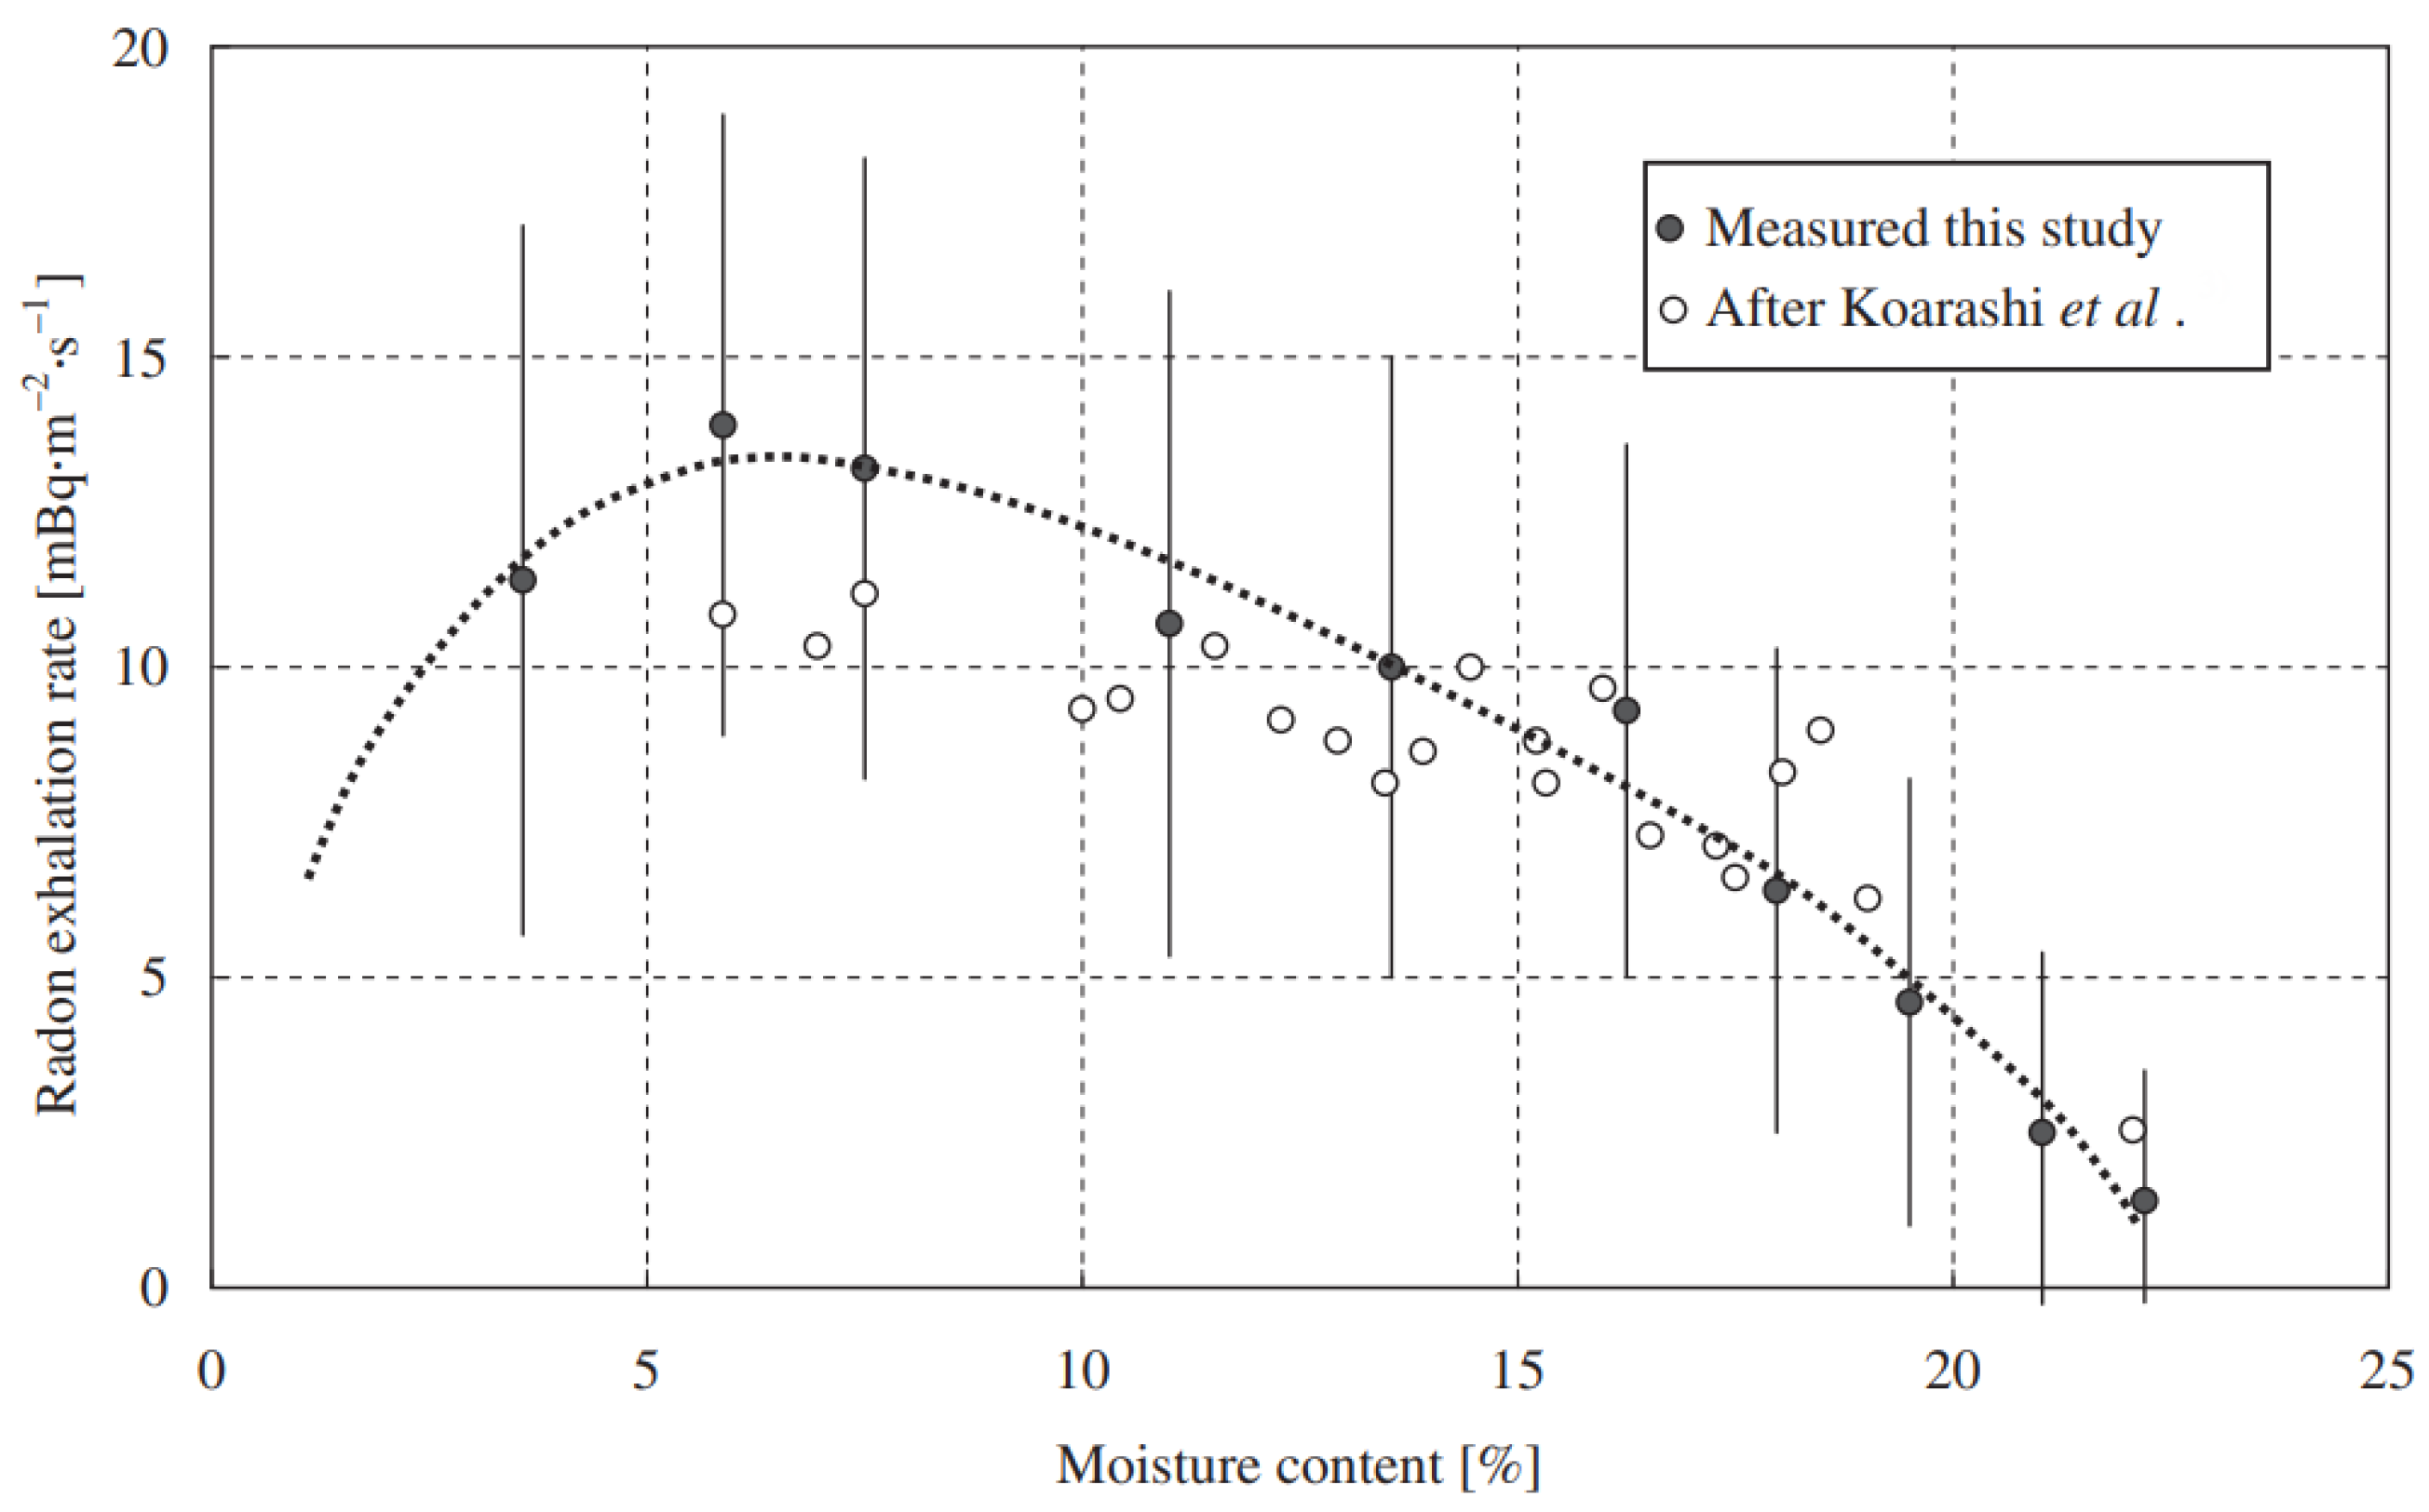
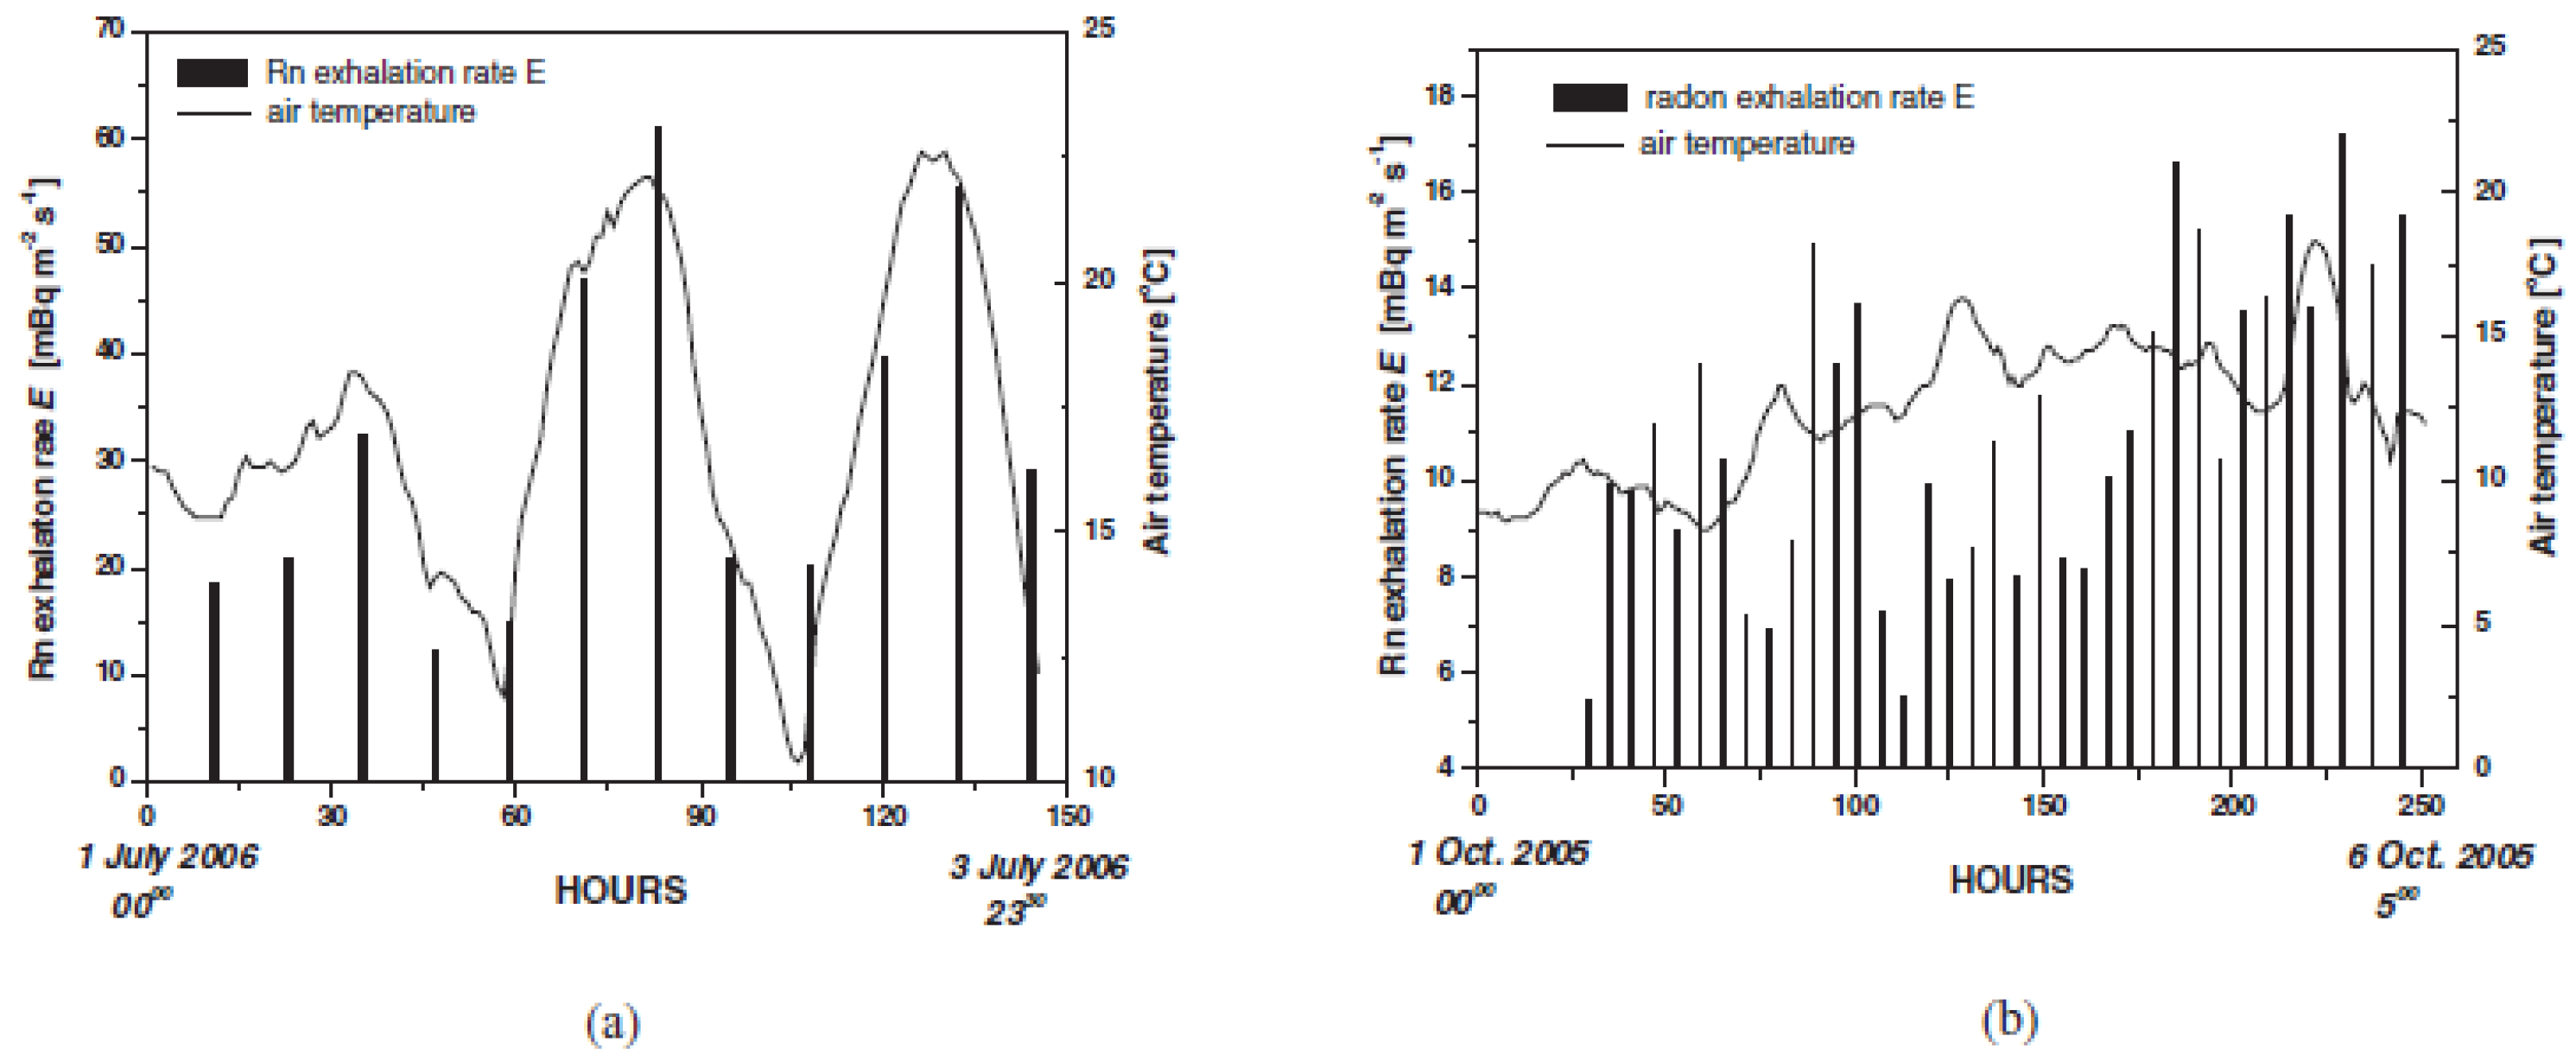
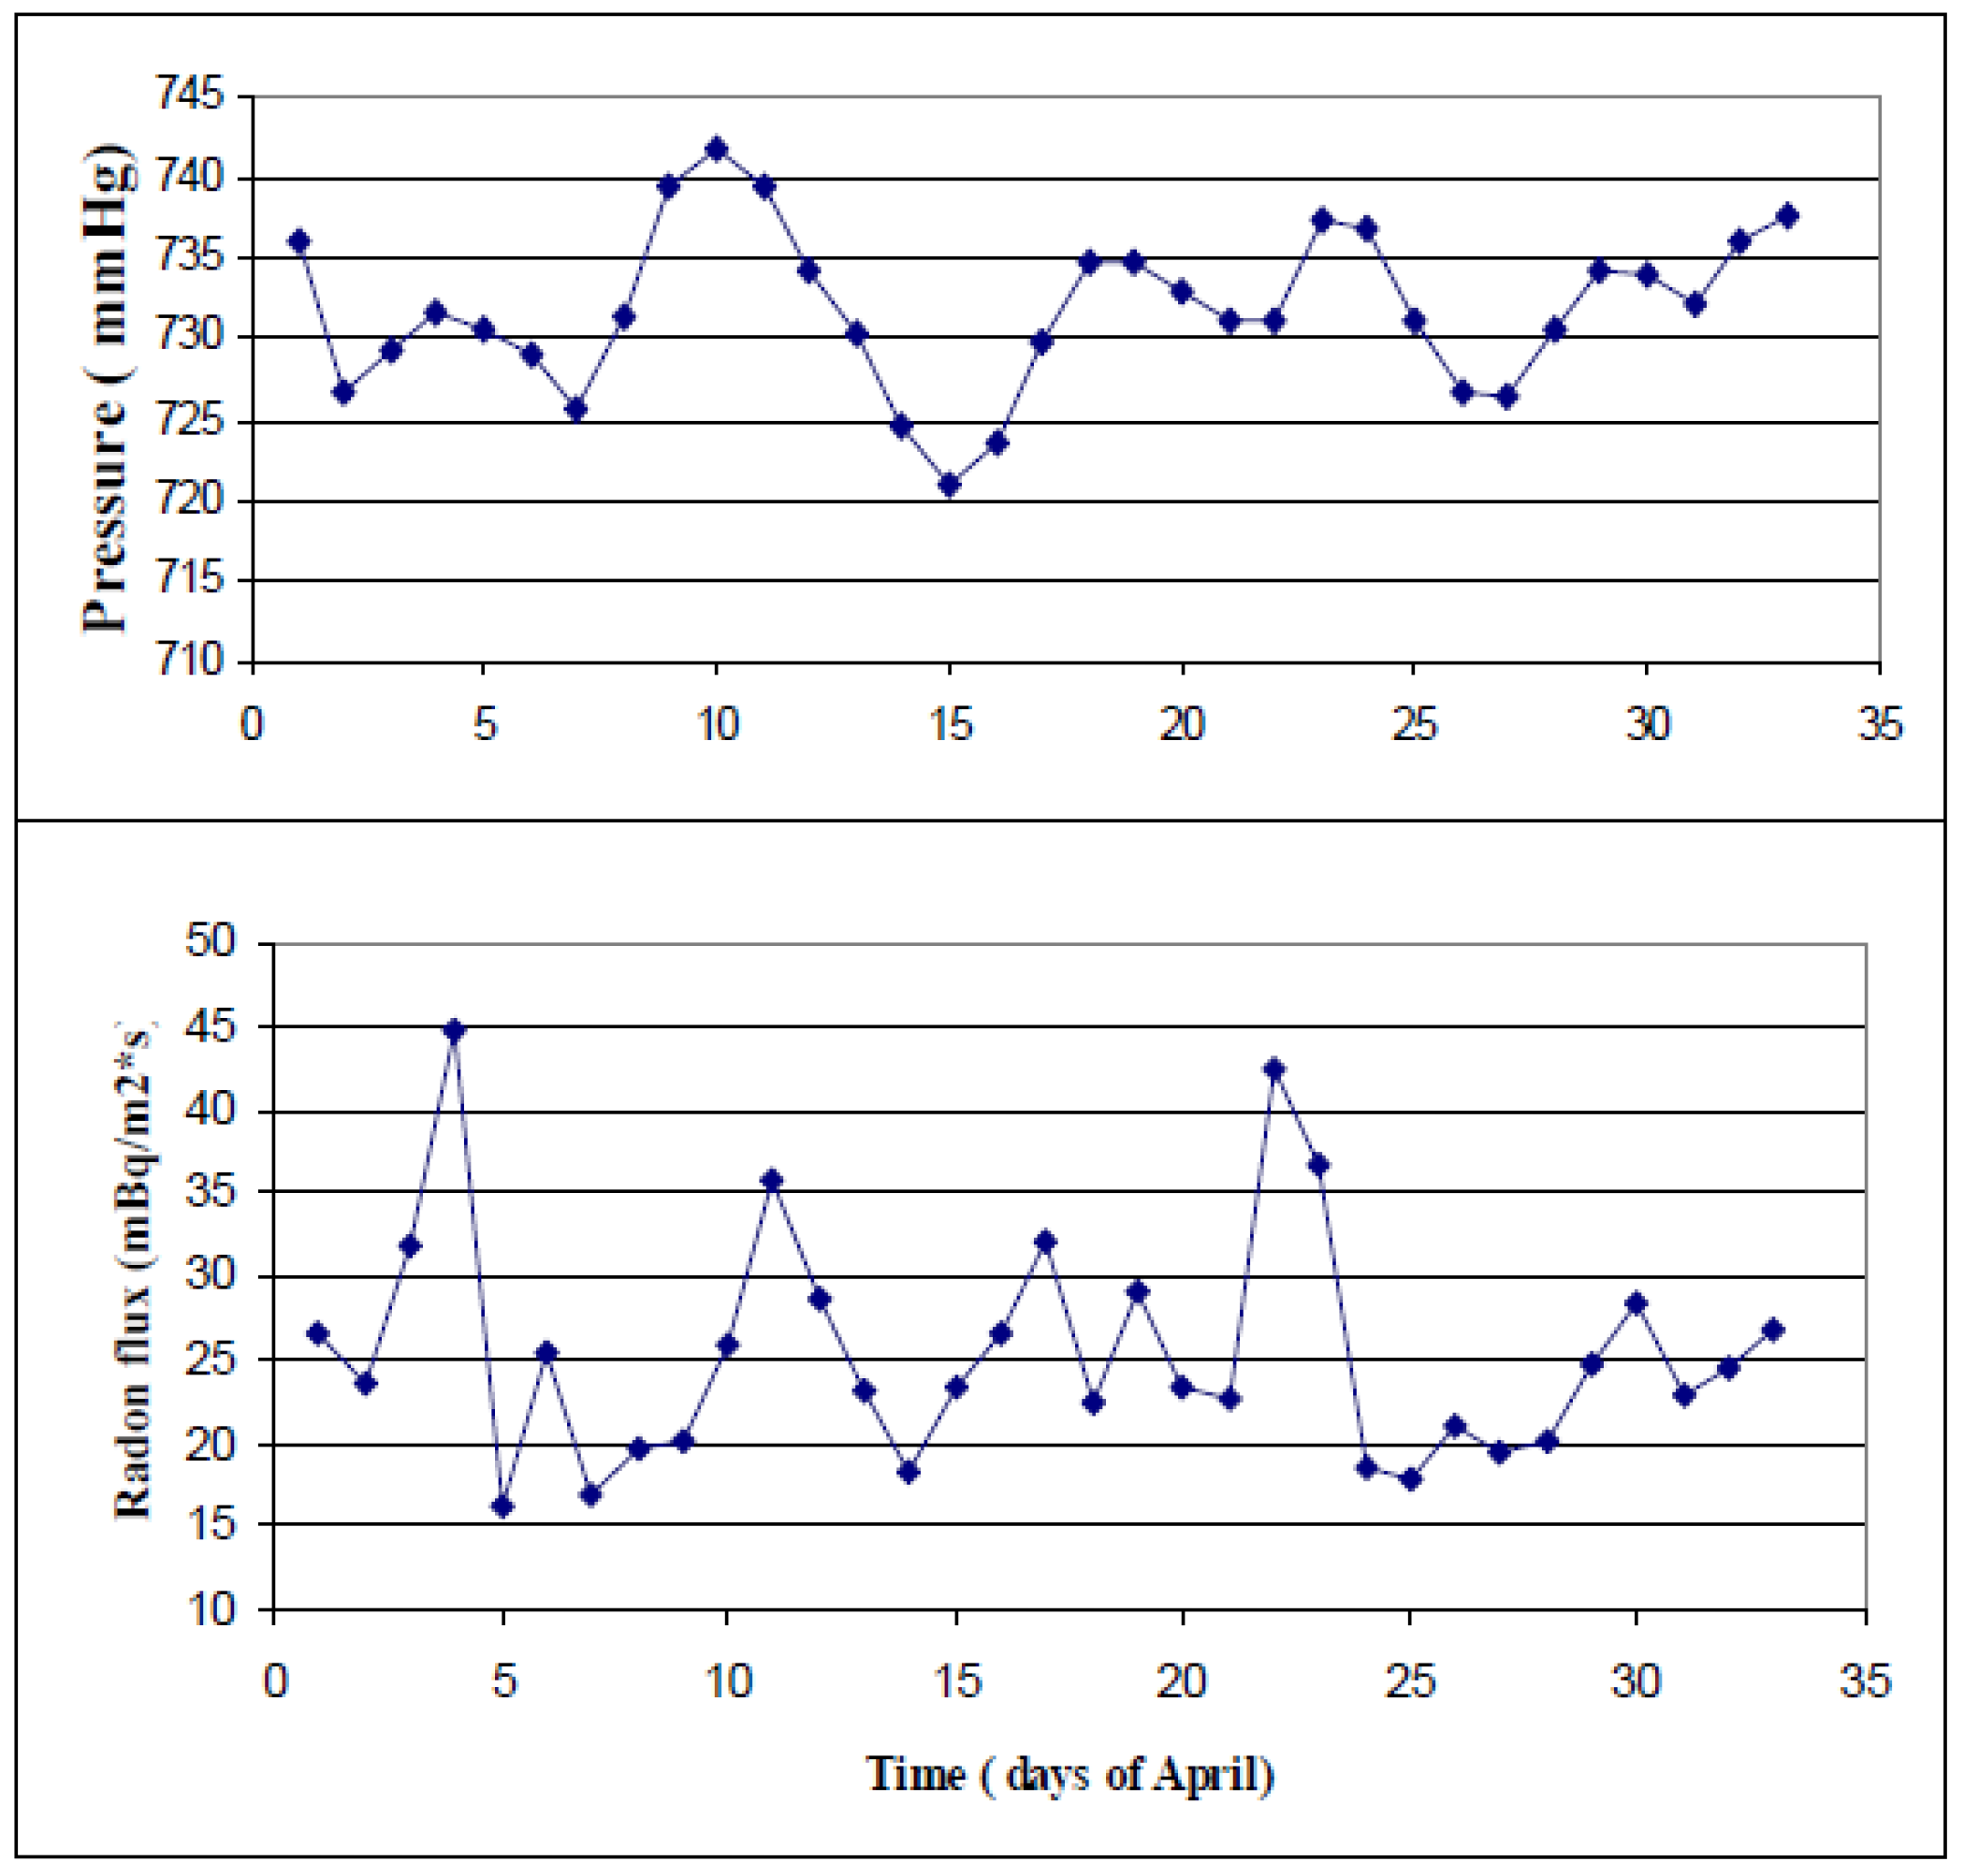
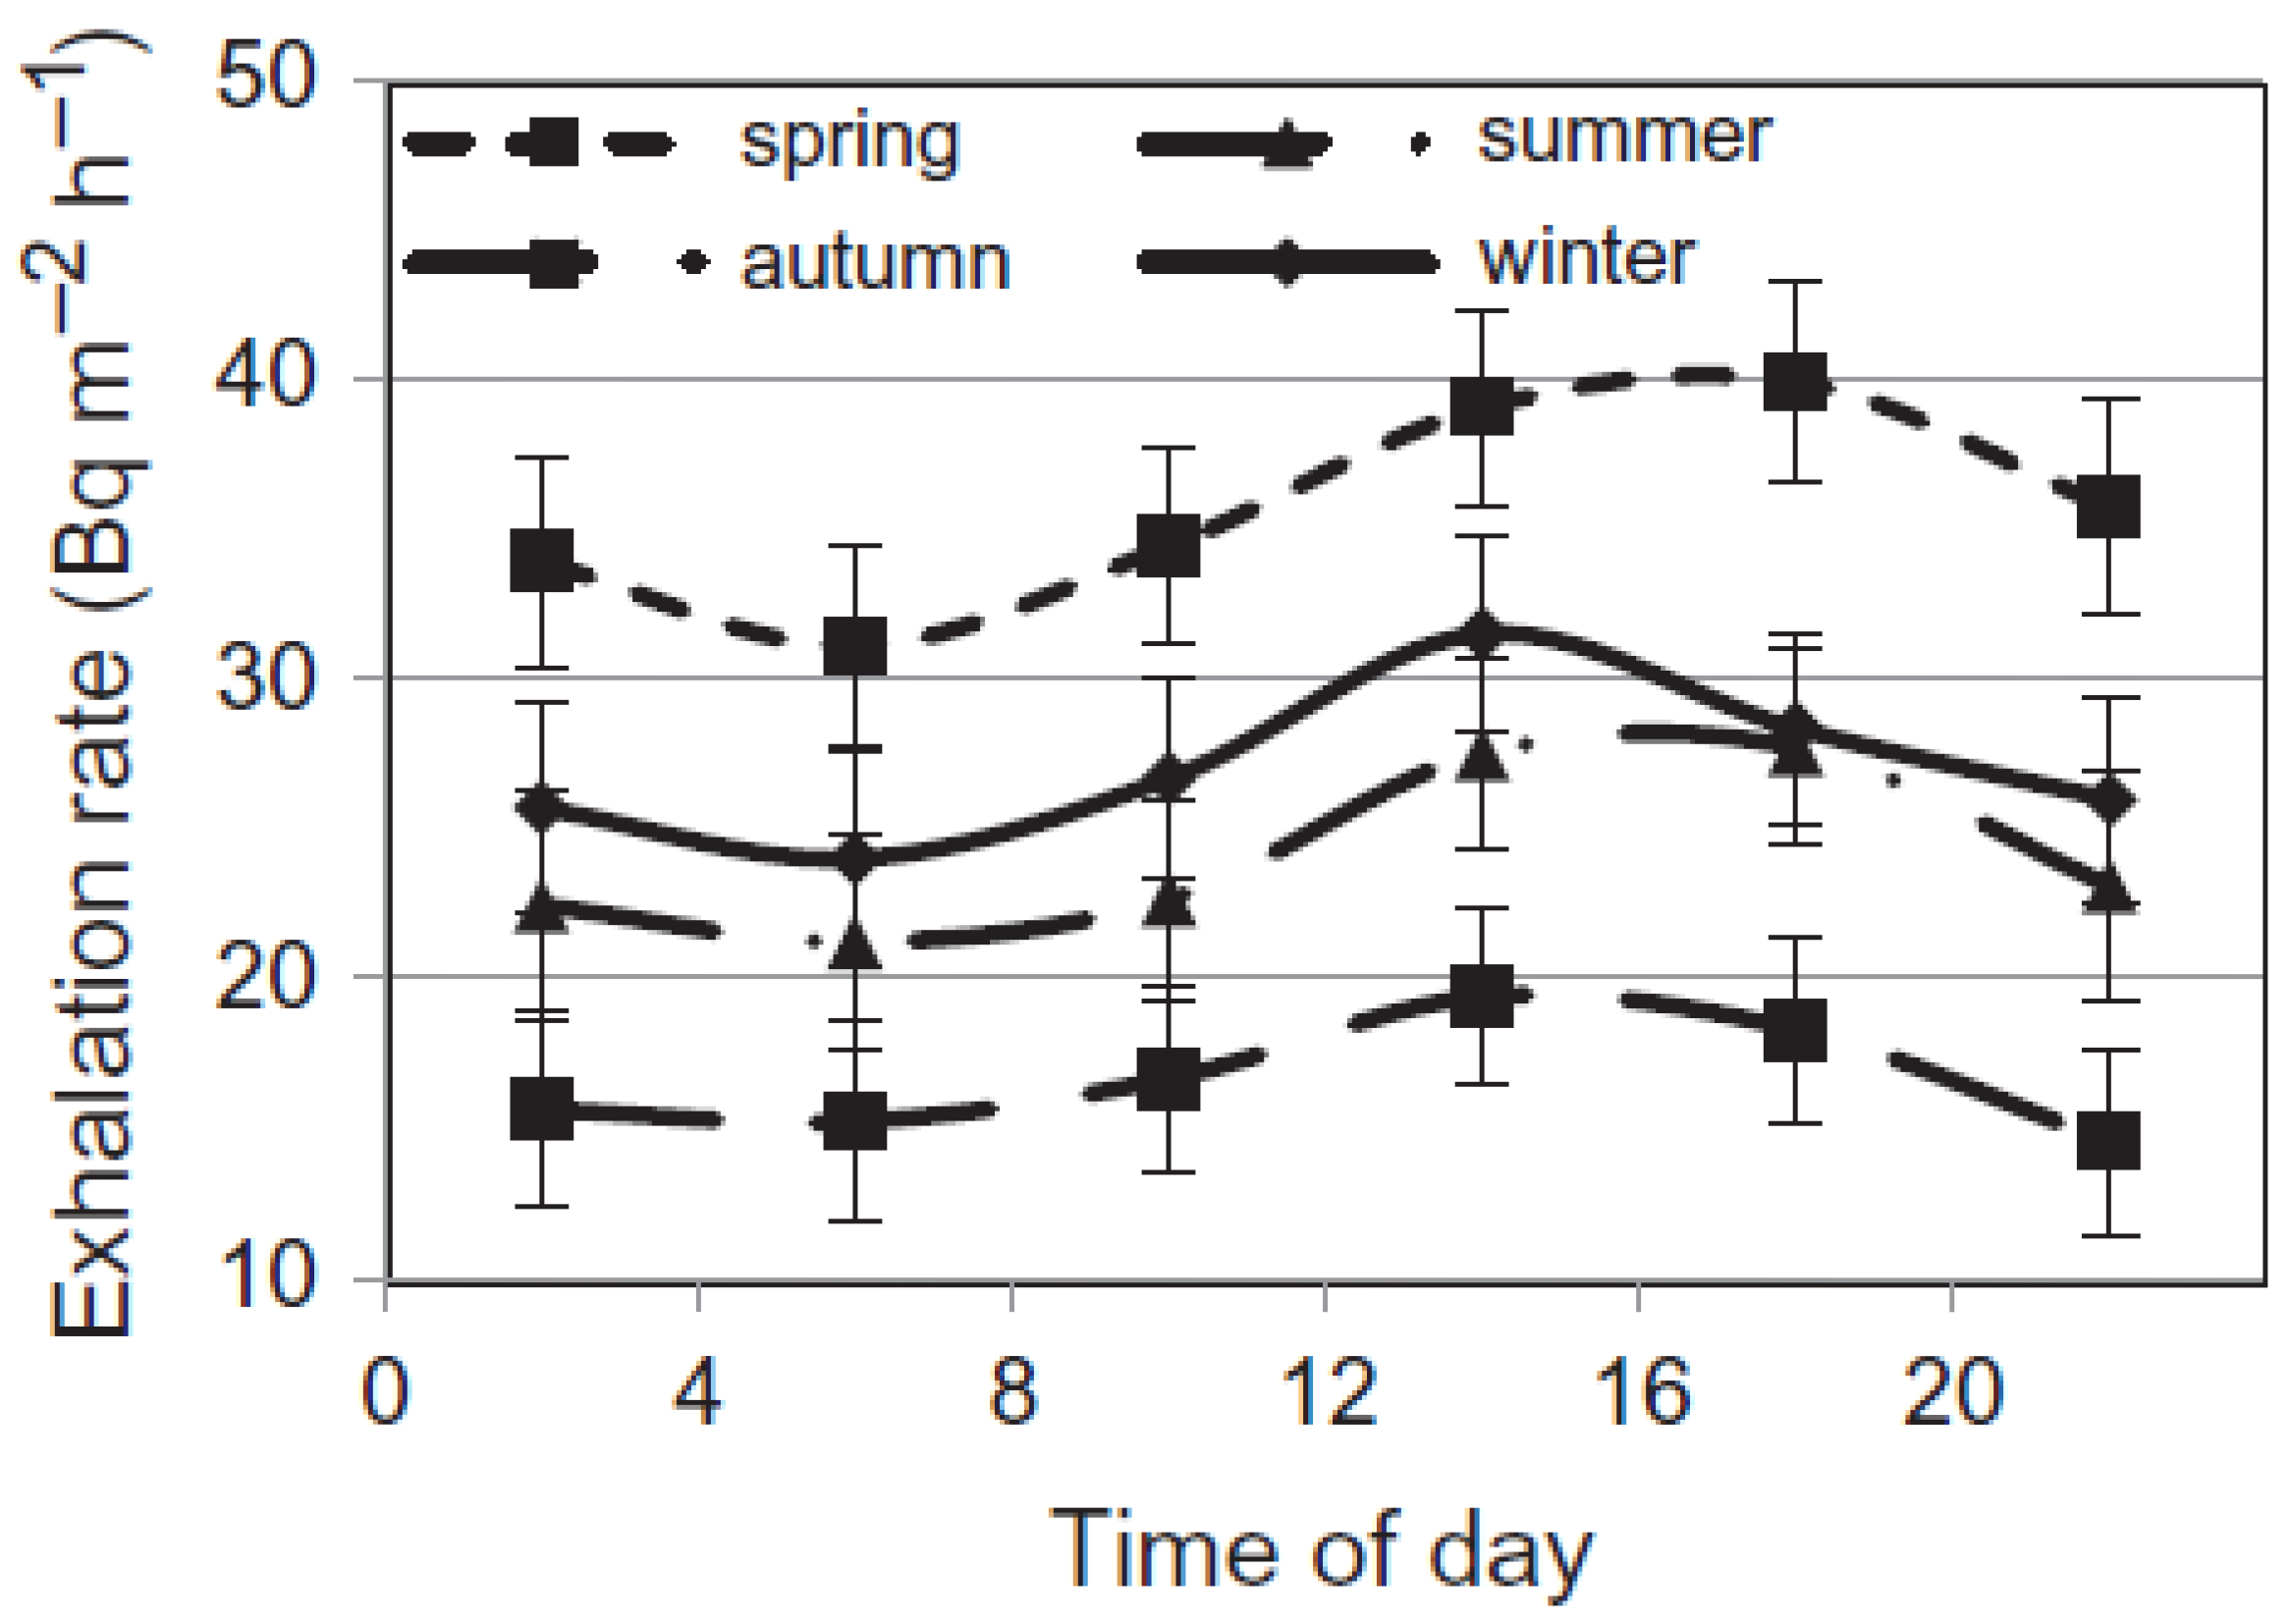
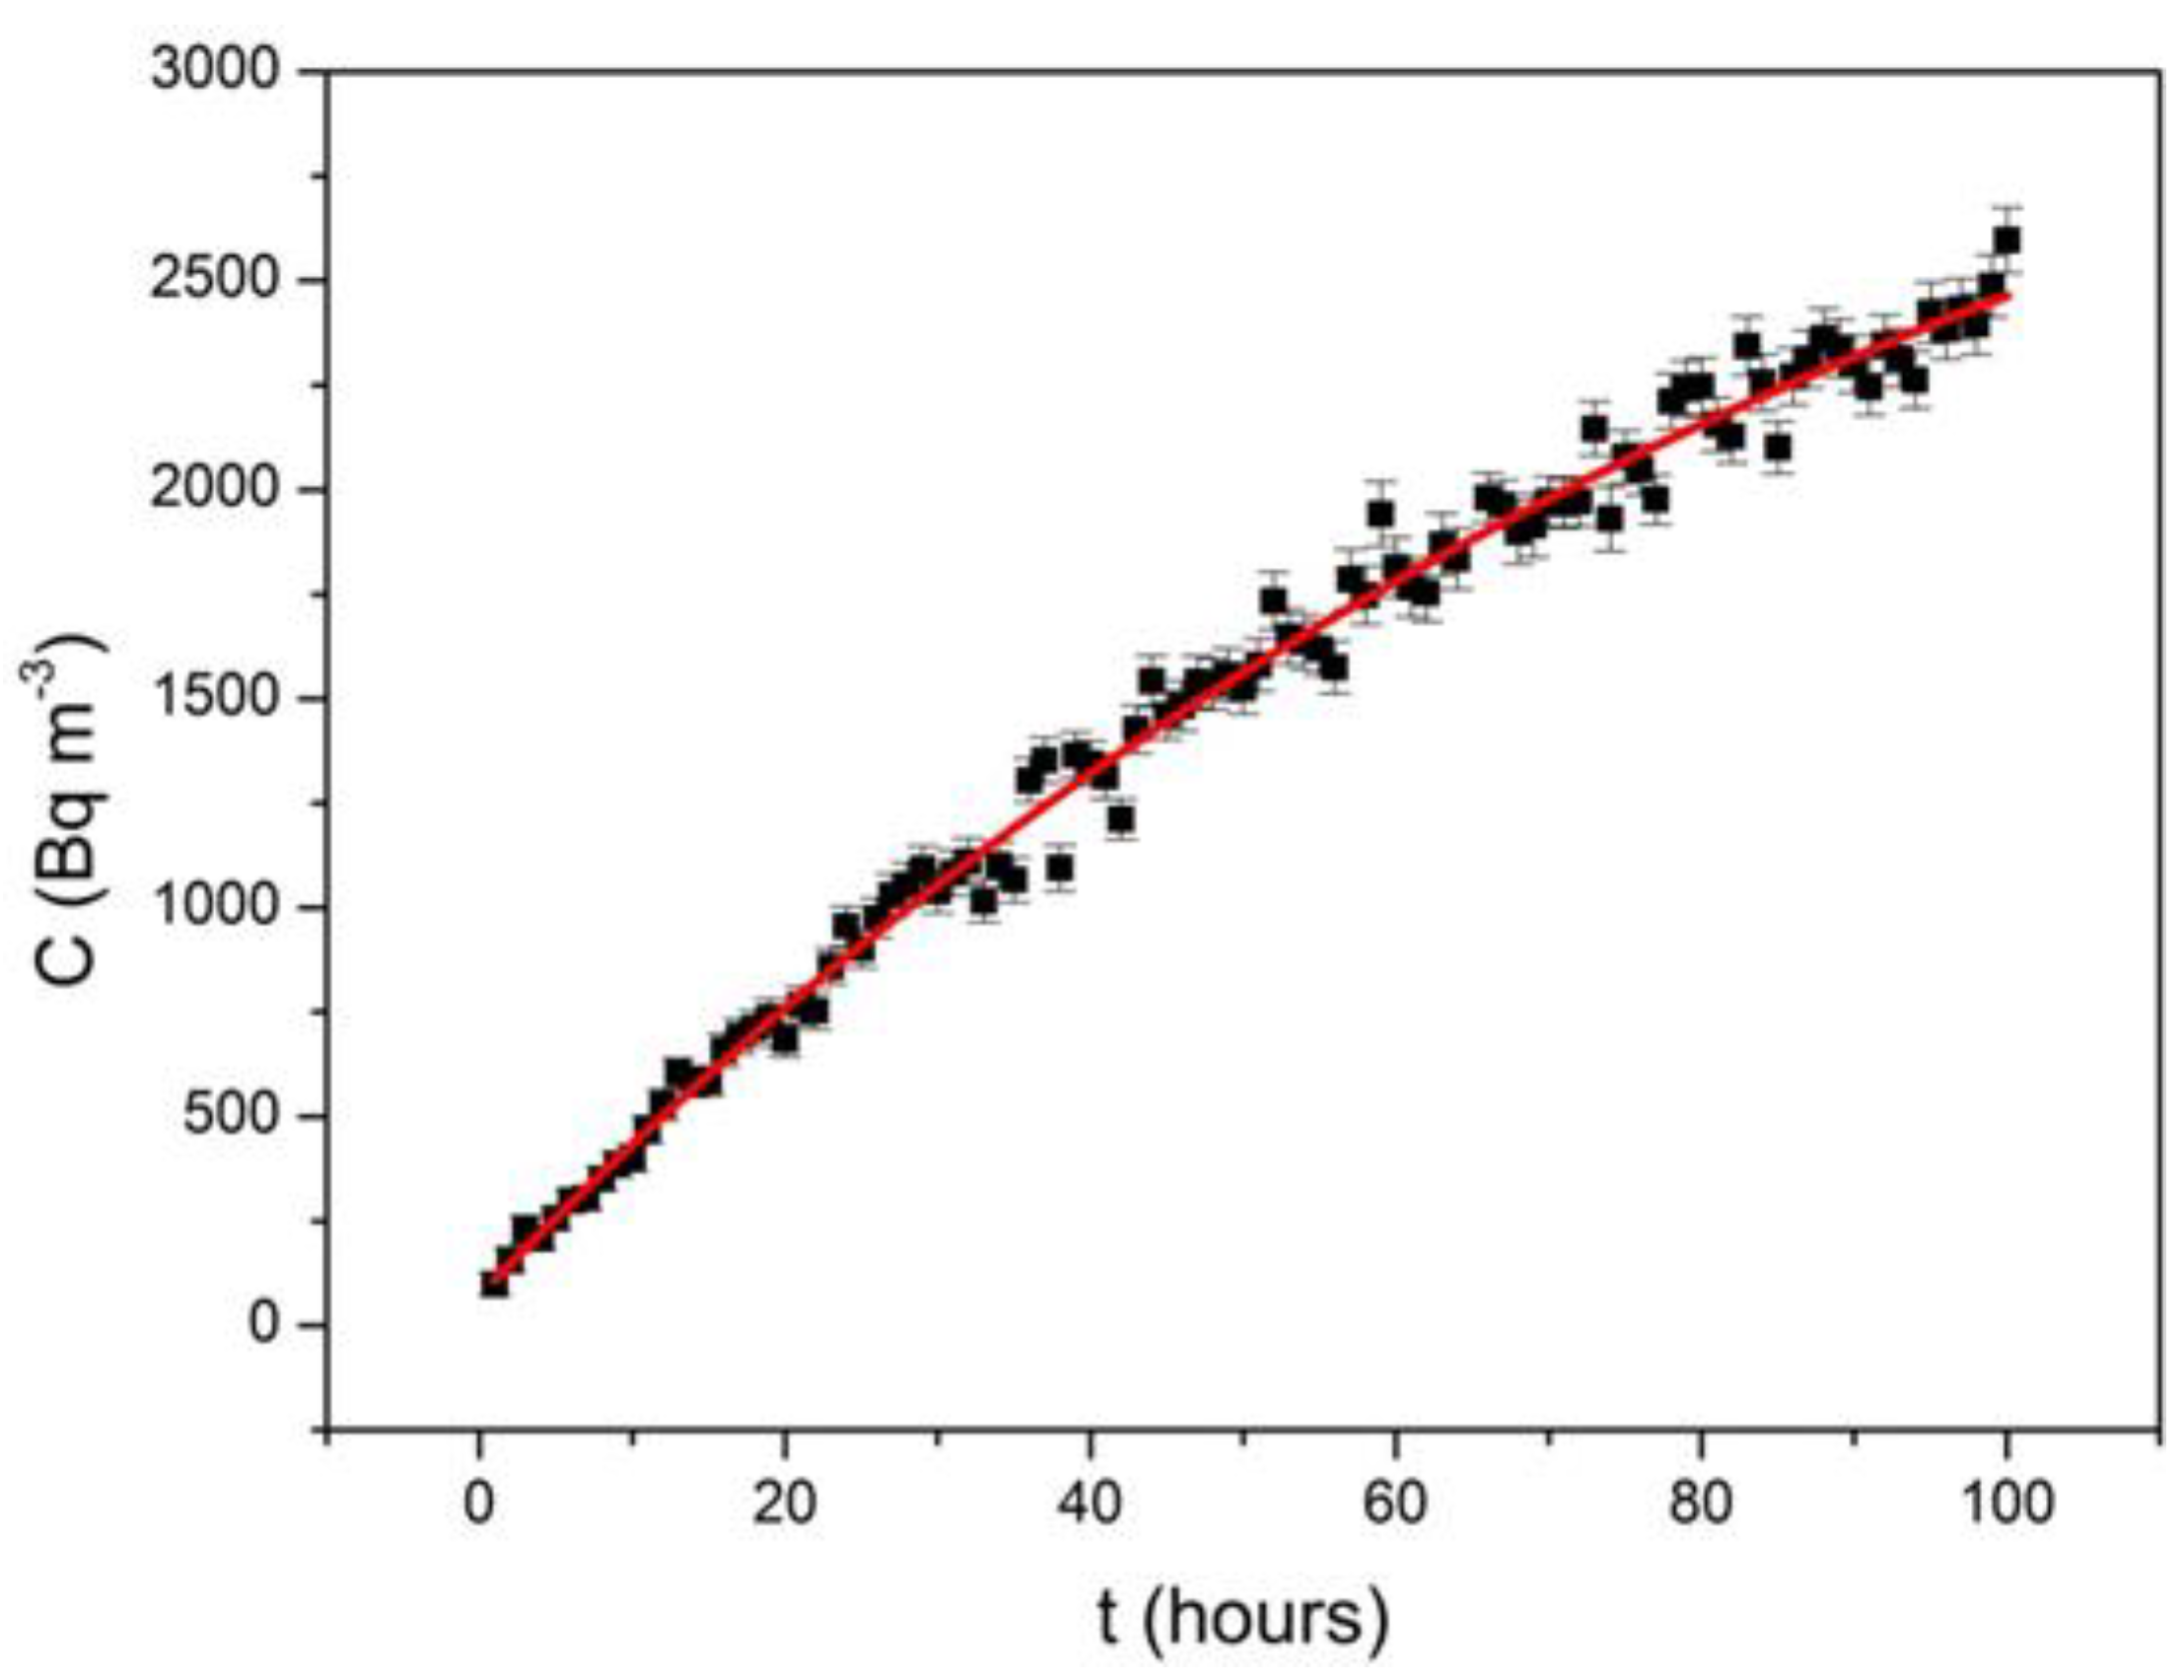
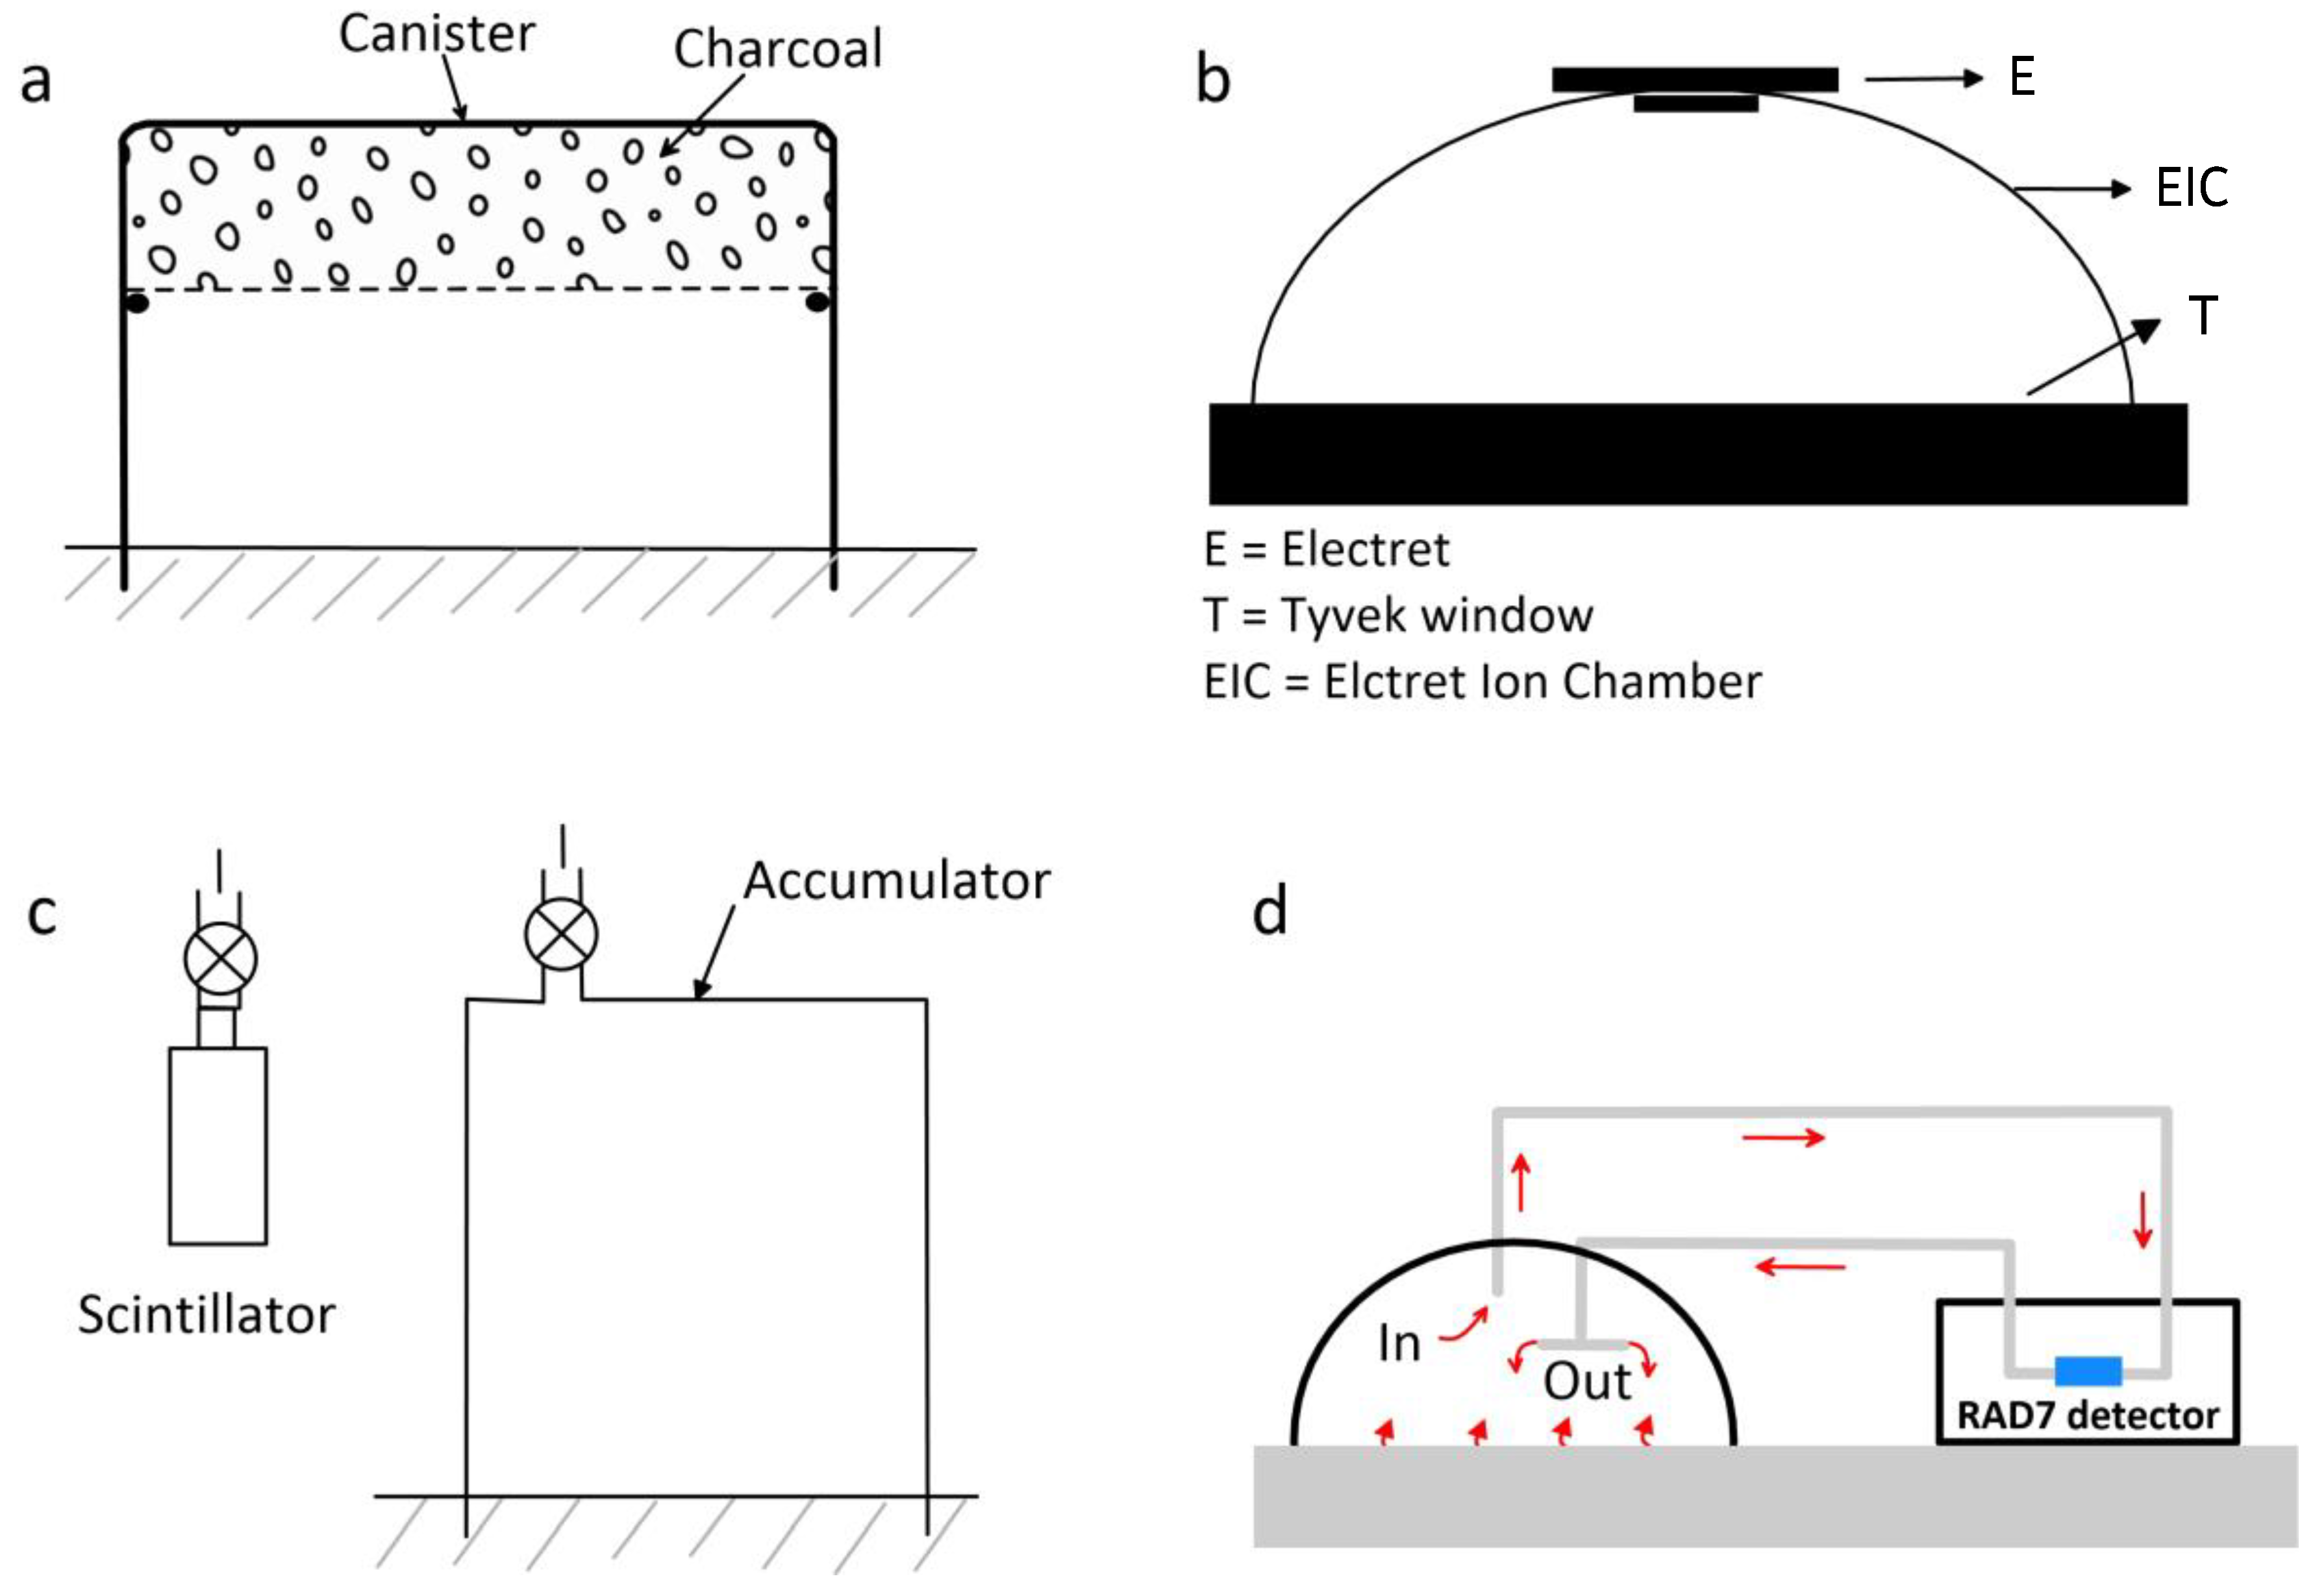
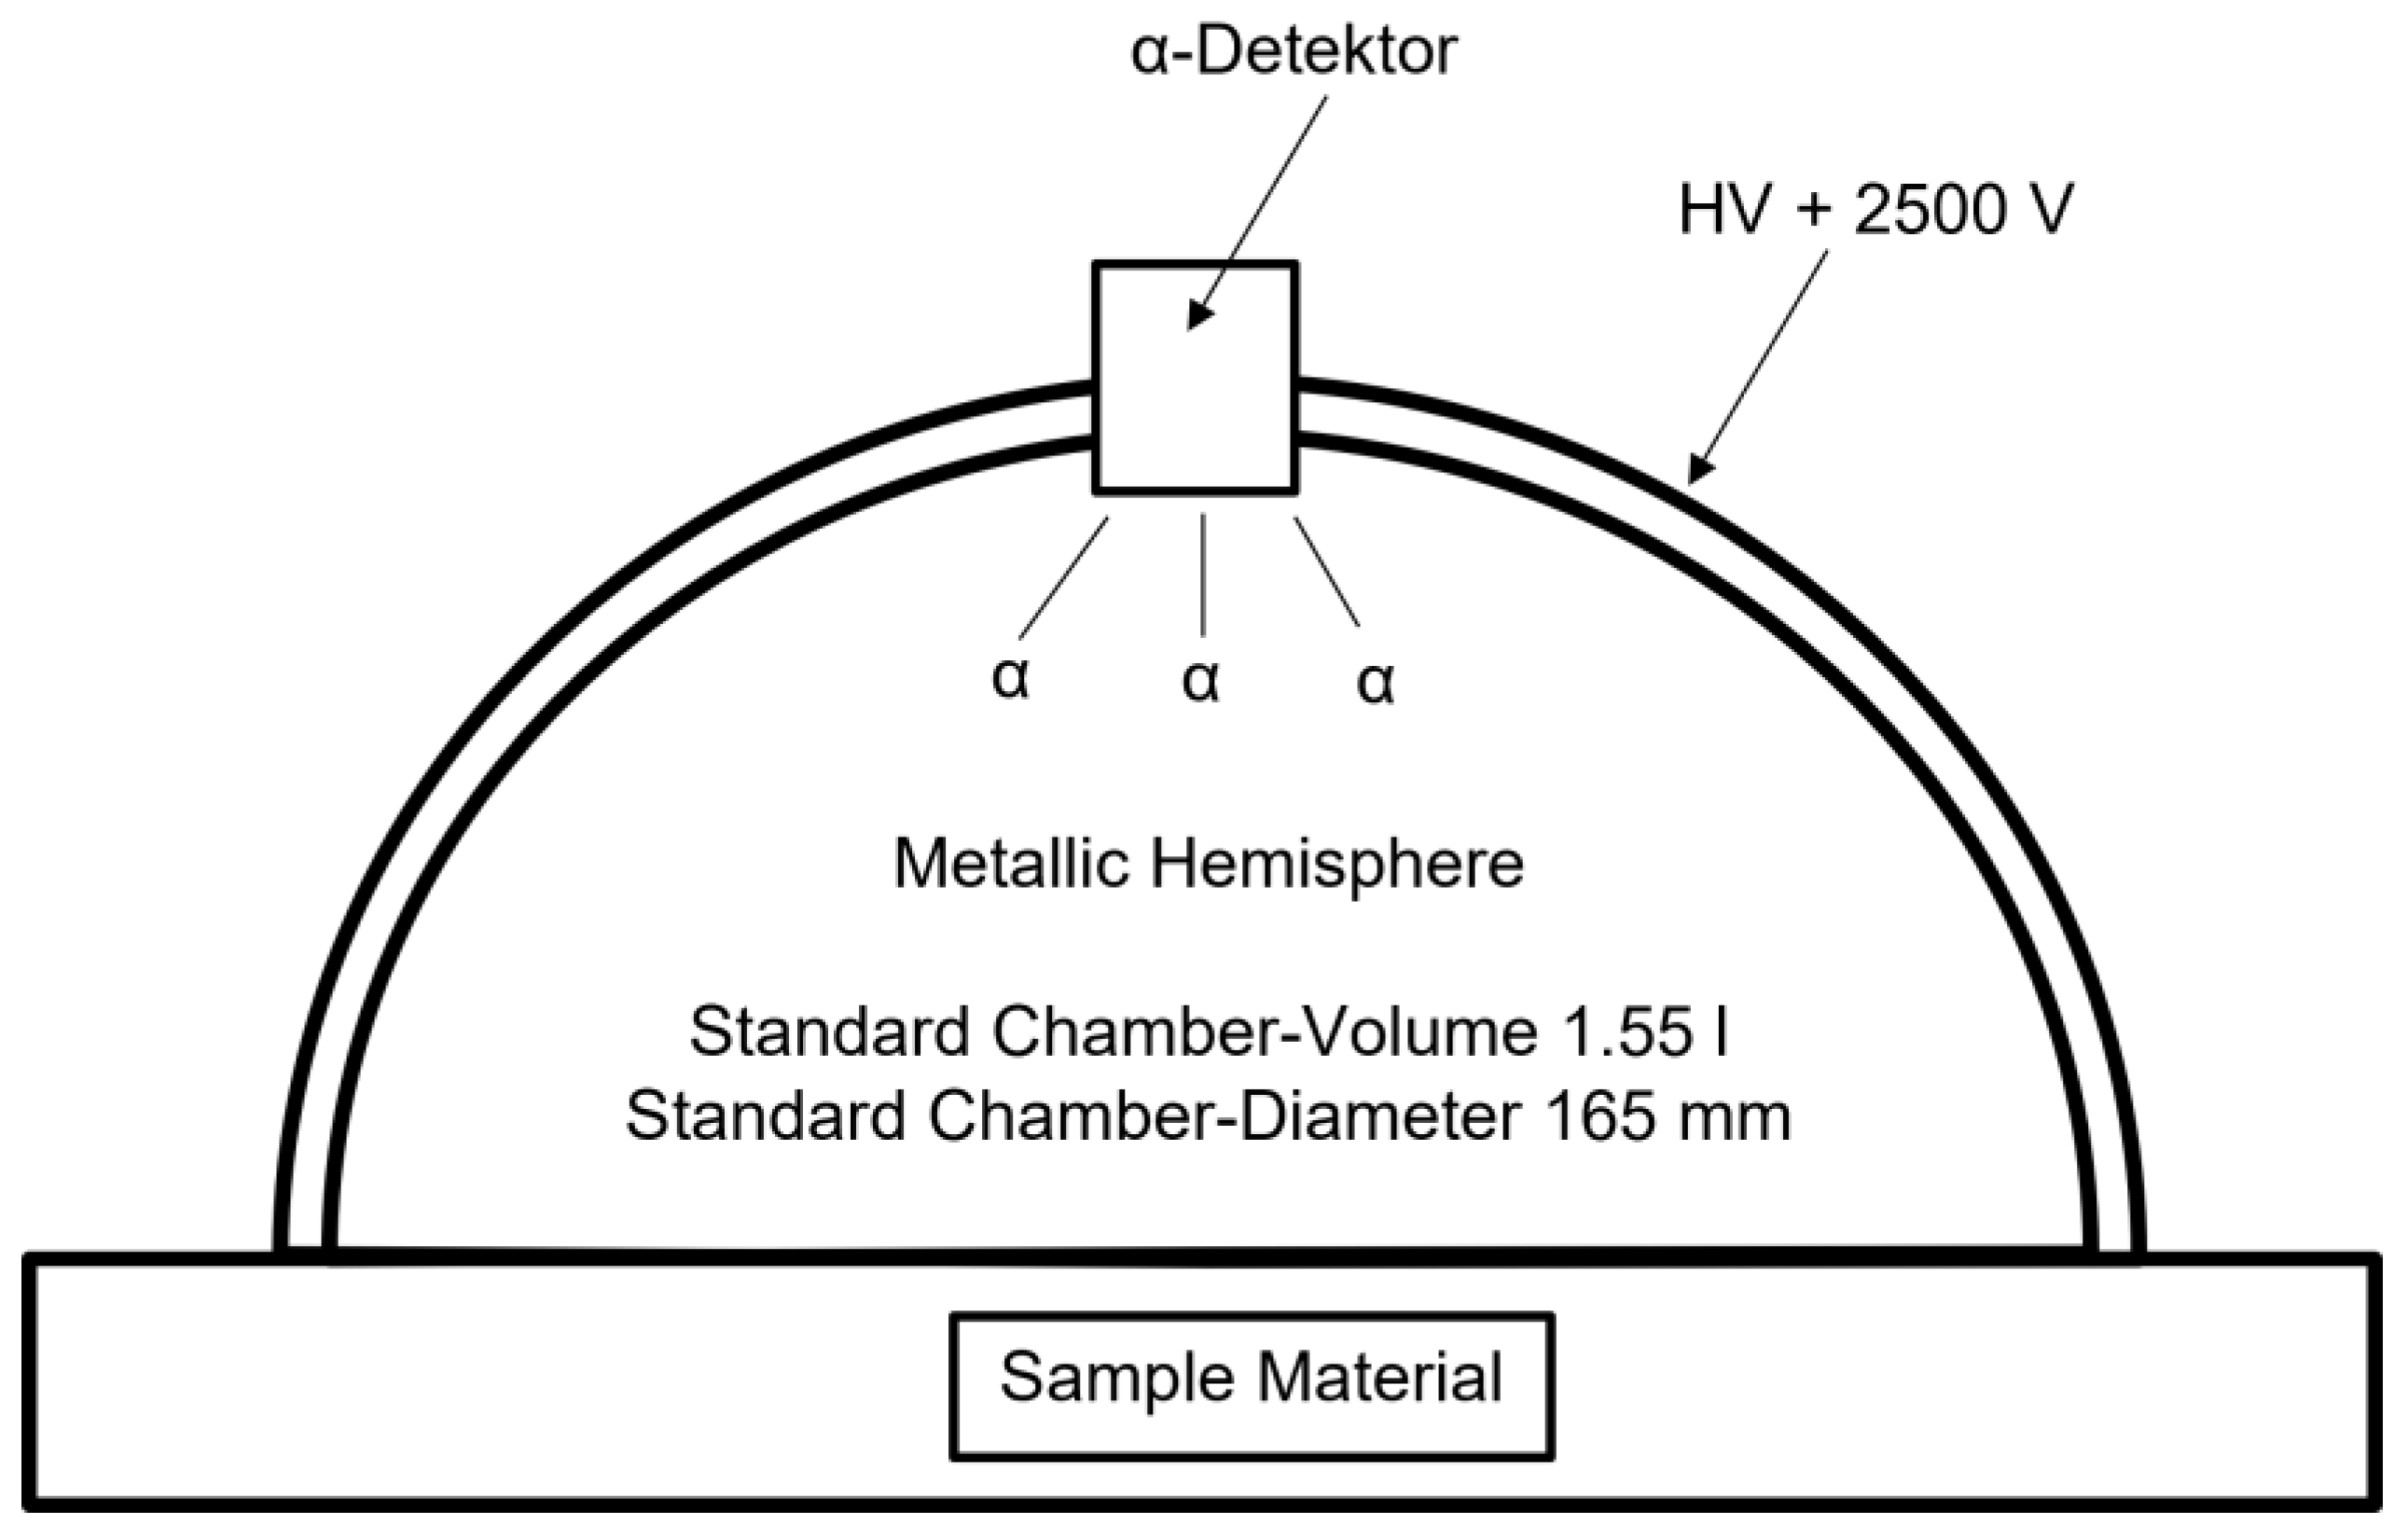
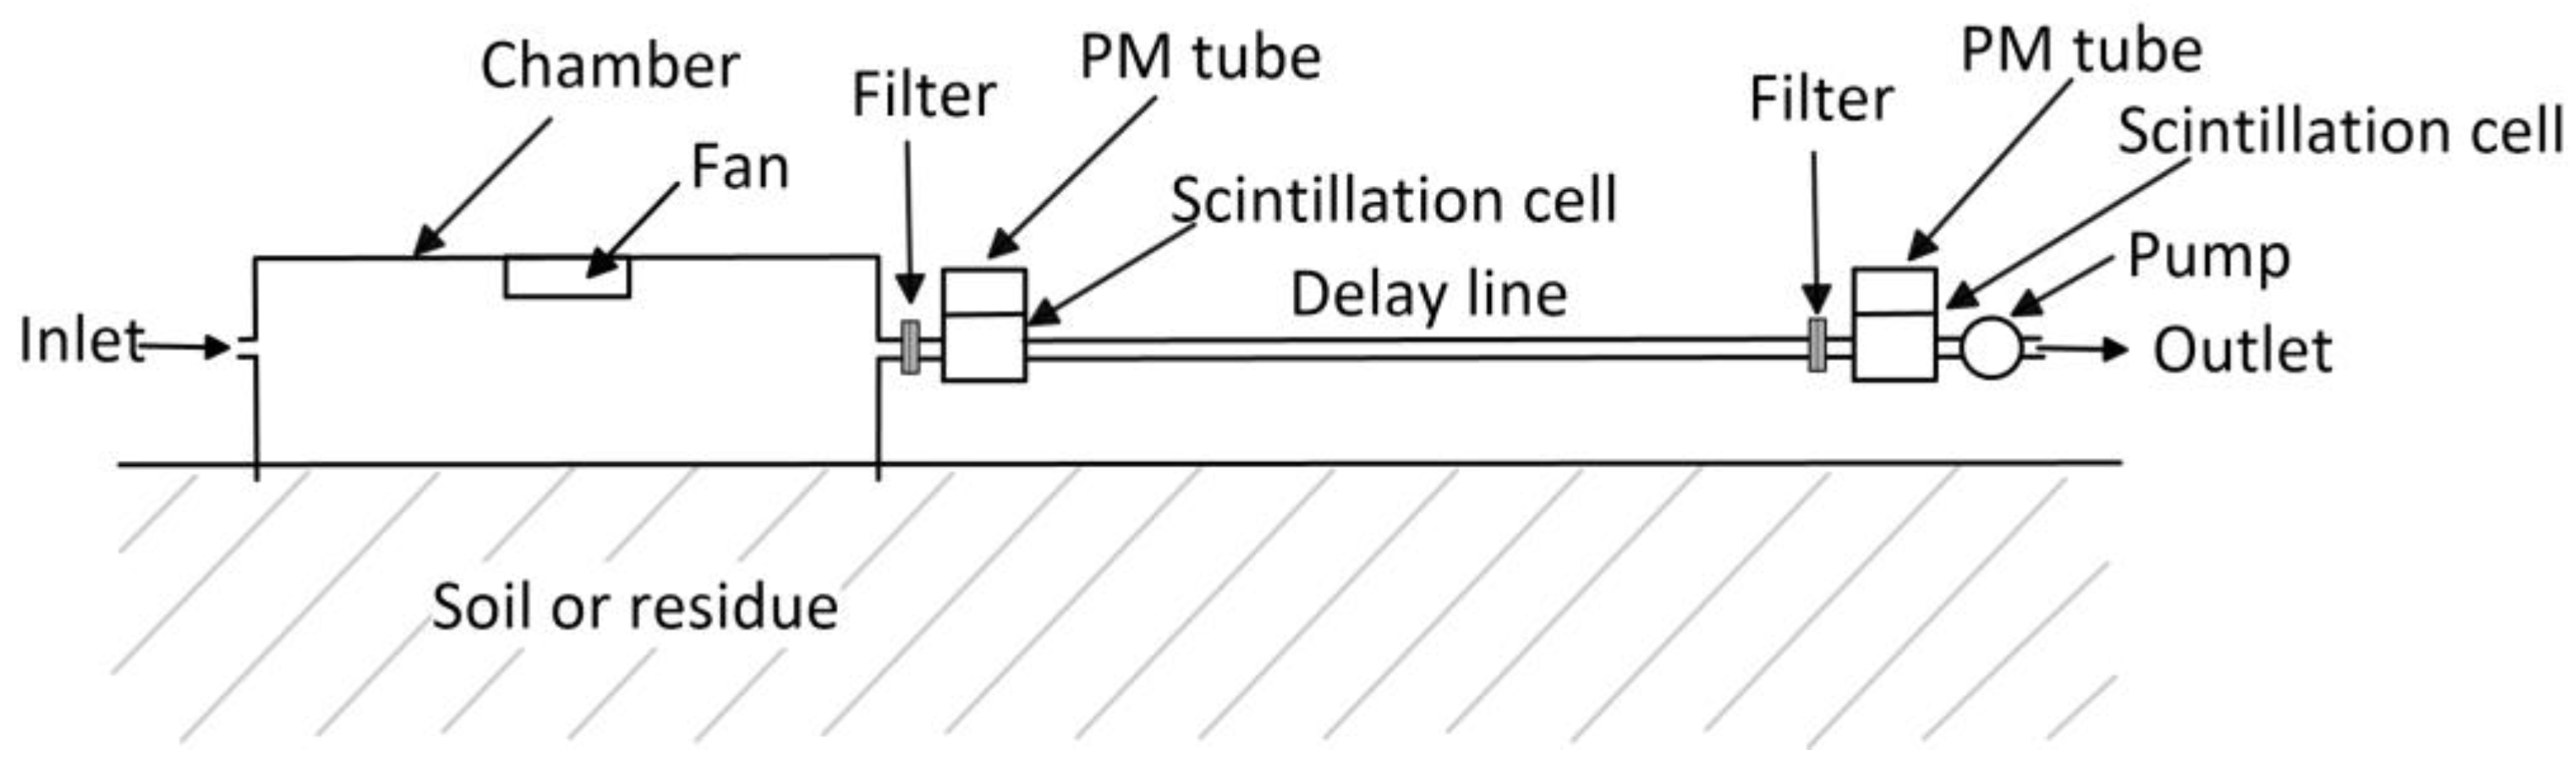
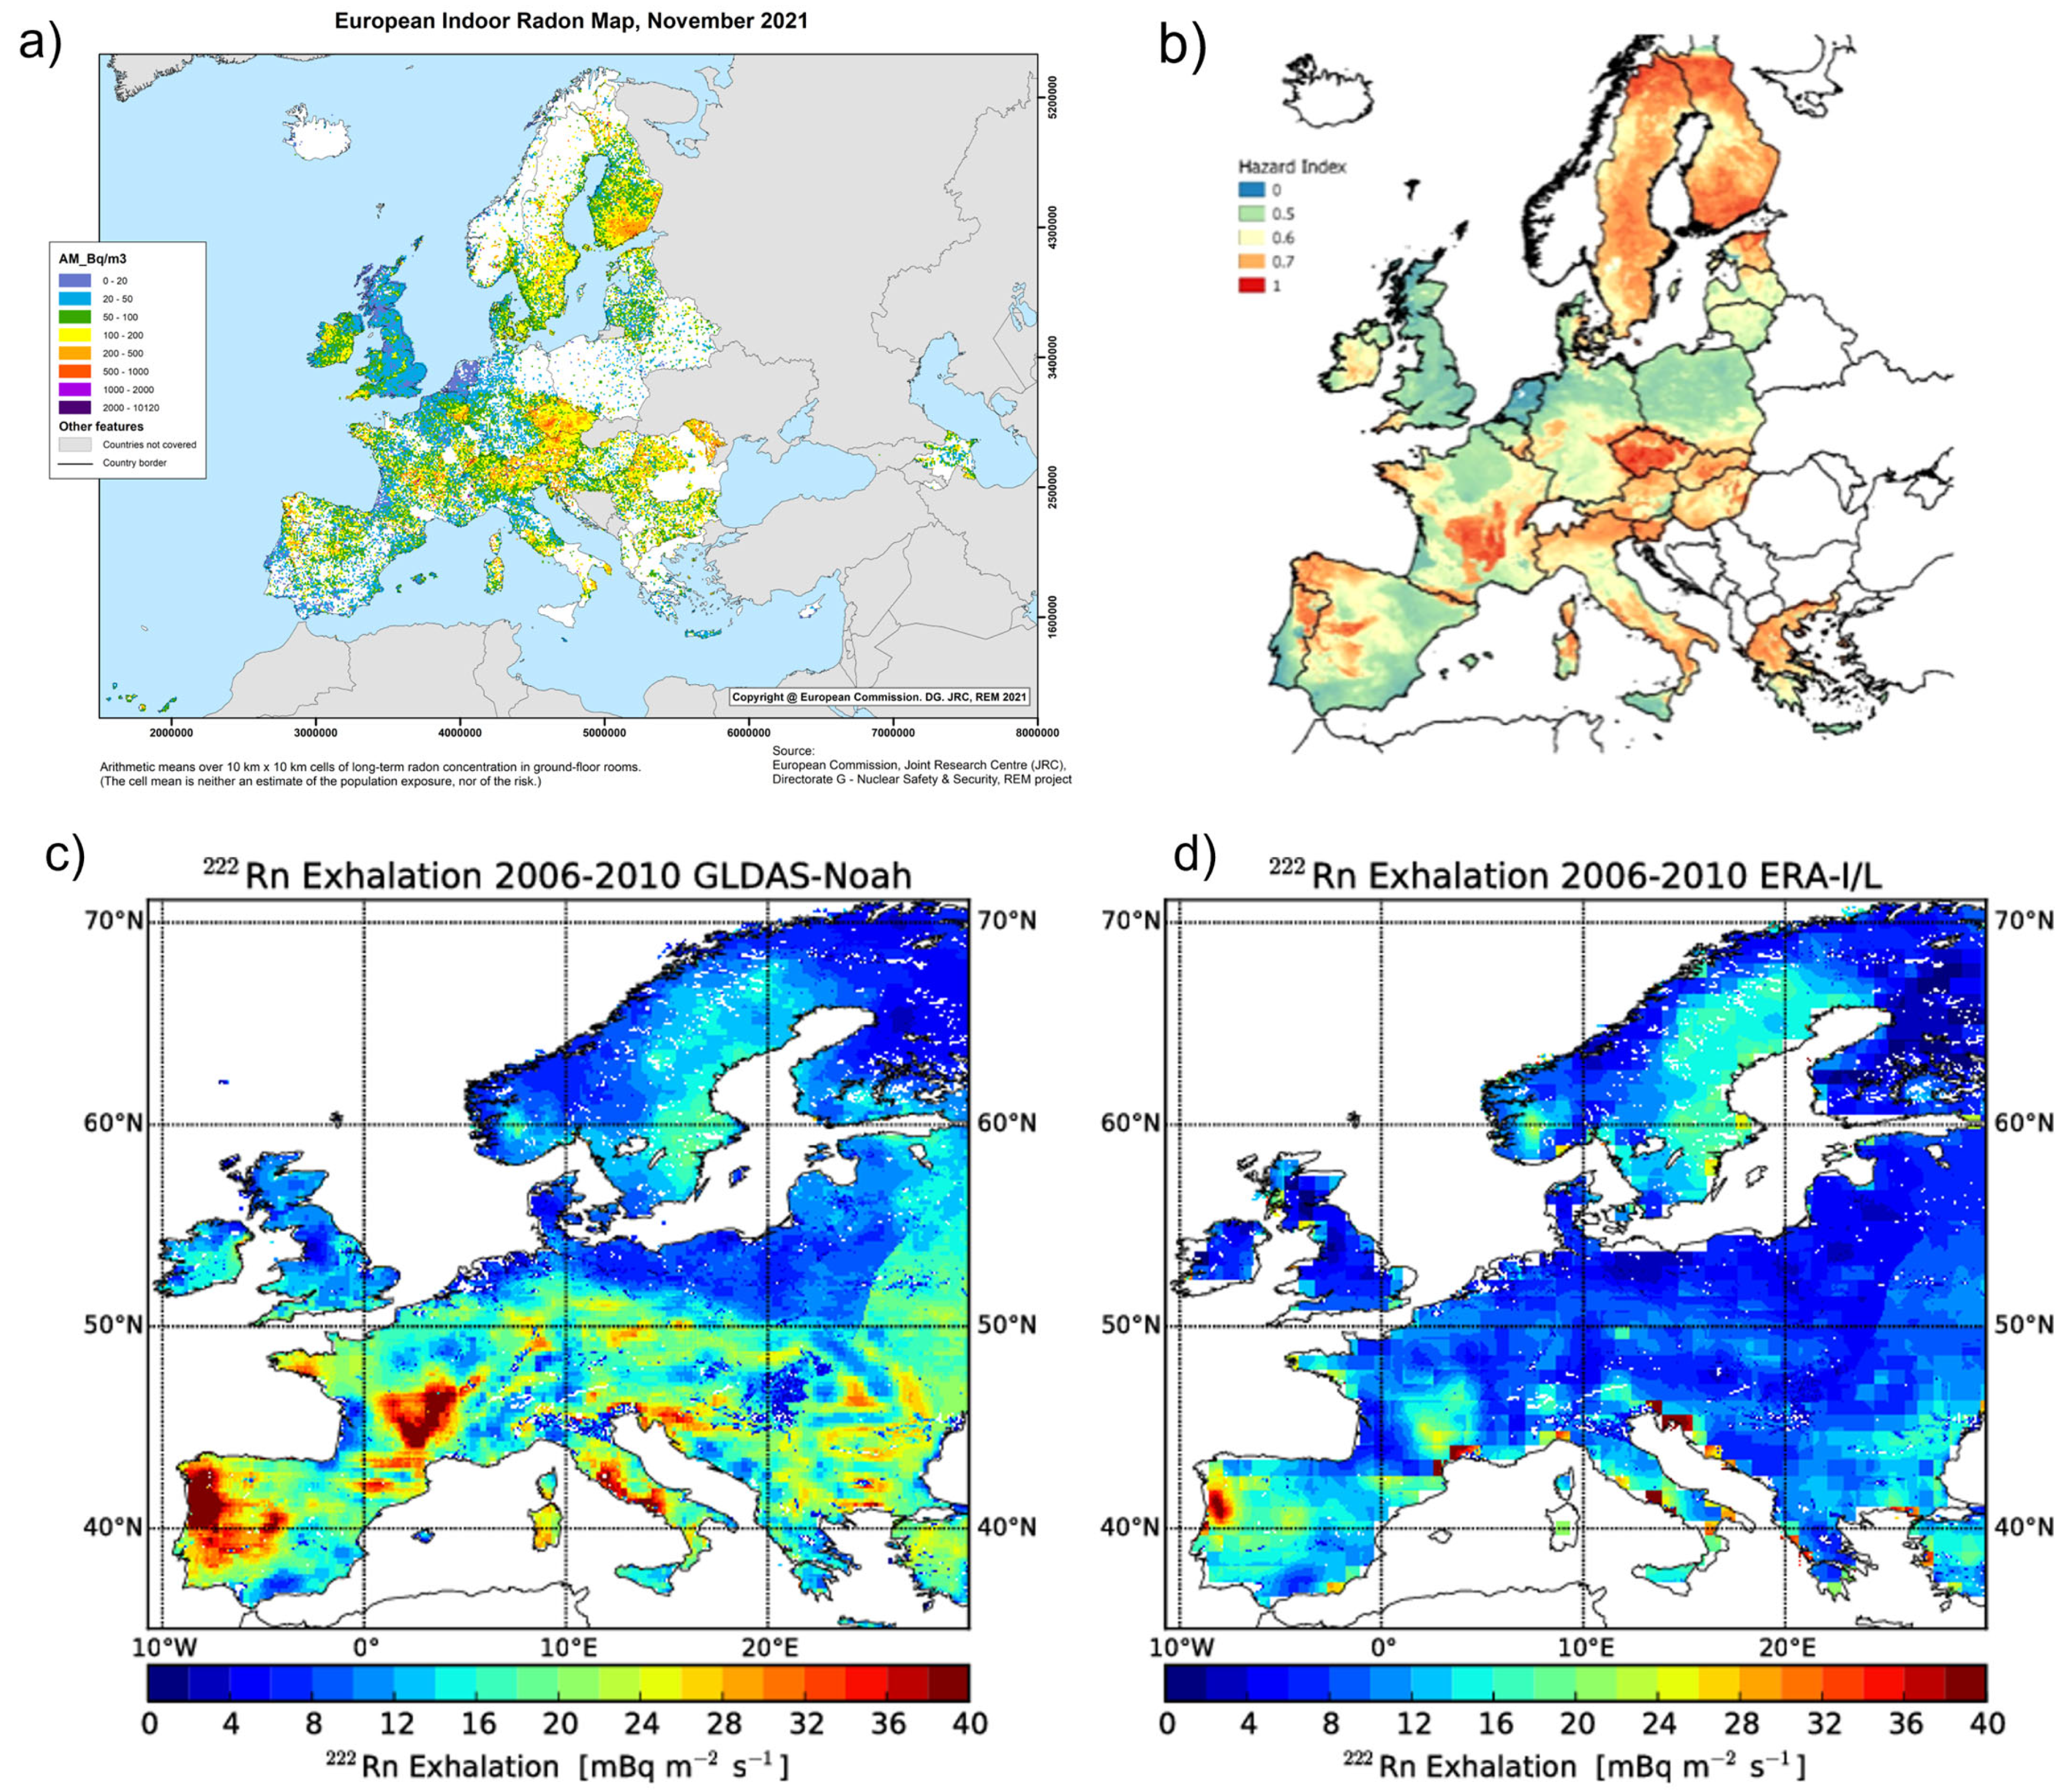