Article

Health Impacts of Surface Ozone in Outdoor and Indoor Environments of Hattar Industrial Units, KPK, Pakistan

1
Department of Environmental Sciences, COMSATS University Islamabad Abbottabad Campus, Abbottabad 22020, Pakistan
2
Department of Biotechnology, Chehla Campus Muzaffarabad, University of Azad Jammu and Kashmir, Muzaffarabad 13100, Pakistan
3
Department of Biotechnology, COMSATS University Islamabad Abbottabad Campus, Abbottabad 22020, Pakistan
4
Department of Chemistry, COMSATS University Islamabad Abbottabad Campus, Abbottabad 22020, Pakistan
5
Department of Zoology, Women University Azad Jammu and Kashmir Bagh, Bagh 12500, Pakistan
6
Civil Engineering Department, College of Engineering, Najran University, Najran 61441, Saudi Arabia
7
Electrical Engineering Department, College of Engineering, Najran University, Najran 61441, Saudi Arabia
*
Authors to whom correspondence should be addressed.
Atmosphere 2022, 13(12), 2002; https://doi.org/10.3390/atmos13122002
Submission received: 7 October 2022 / Revised: 24 November 2022 / Accepted: 24 November 2022 / Published: 29 November 2022
(This article belongs to the Section Air Quality and Human Health)

Abstract

:
This research was carried out to analyze variations in indoor and outdoor ozone concentrations and their health impact on local communities of megacities in Pakistan. For indoor ozone measurements, industrial units of an economic zone, Hattar Industrial Estate, Haripur, KPK, Pakistan, were selected. For outdoor ozone measurements, maximum and minimum peaks from different selected stations of three megacities (Islamabad, Abbottabad, and Haripur Hattar) in Pakistan were analyzed for paired comparisons. The tropospheric ozone levels were measured with the help of a portable SKY 2000-WH-O3 meter from December 2018 to November 2019. According to the findings of this investigation, the indoor ozone concentrations at Hattar Industrial Estate exceeded the permissible limit devised by the WHO. The highest concentration (0.37 ppm) was recorded in the month of May in the food industry, while the lowest concentration (0.00 ppm) was recorded in the cooling area of the steel industry in the month of December. For outdoor ozone concentrations, the maximum concentration (0.23 ppm) was detected in Islamabad in the month of March 2019, whereas the rest of year showed comparatively lower concentrations. In Haripur, the maximum concentration (0.22 ppm) was detected in the month of February 2019 and a minimum concentration (0.11 ppm) was found in the month of November 2019. In Abbottabad, the maximum concentration (0.21 ppm) was detected in the month of March 2019 and the minimum concentration was 0.082 ppm. Increasing tropospheric ozone levels might be harmful for local communities and industrial laborers in the winter season because of the foggy weather. In the Abbottabad and Hattar regions, since COVID infection is indirectly related to low temperature and high emission of gases may compromise the respiratory systems of humans. The results of the present study were shared with industrialists to set precautions for ambient air quality and support the adoption of low emission techniques in industries for the safety of labour and nearby residents.

1. Introduction

Various anthropogenic activities induced the air pollution, becoming severe problem in the modern world is a global environmental problem. The World Health Organization (WHO) declared air pollution as the most potential health hazard for human and all biodiversity. Air pollution comprises various suspension and solid particulate matter and gases such as ozone (O3), nitrogen dioxide (NO2), and carbon monoxide (CO) [1]. Industrial activities, combustion processes, mineral dust, and emissions from automobiles in the atmosphere are the major sources of air pollution in populated cities such as Islamabad, Pakistan [2]. Air pollution affects the health of individuals and the environment [3]. Urbanization and consolidation of populations into dense networks has worsened environmental quality (e.g., air and water pollution) in some areas [4,5,6]. The largest urban sector in China, including the North China Plain, the Yangtze River Delta, and the Sichuan Basin, regularly experienced acute haze at intervals and photochemical pollution that led to high mortality [7,8]. Owing to urbanization and mass movement around the world, populations have been increasingly afflicted by a multitude of negative environmental conditions in recent years. Ground-level ozone pollution has become an increasingly prominent environmental problem leading to premature deaths [9].
Ozone is a protective layer in the atmosphere, but at ground level, high levels of ozone prove harmful for humans [10]. It has been reported in a previous study that tropospheric ozone concentrations are higher in late morning [11]. Although burning of biomass, vehicles, and fossil fuel usage is a primary source of ozone precursors, background concentrations of local and regional ozone have been raised by long-range transport of ozone and ozone precursors [12]. Unlike many other air pollutants, ozone is secondary, intermediate not directly emitted in the air. Instead, volatile organic compounds and nitrous oxides released from vehicles, power plant s, industrial units and underlying processes, landfills, other biomasses, and fossil fuel emissions, react with sunlight to form this secondary pollutant [13]. Thus, ozone levels depend on background conditions as well as types of emissions. They can increase during warmer months, even if emission levels remain the same, and can increase during or after rush hours and depends on what kinds of fuel are being utilized in vehicles and industrial sector [14]. Ozone precursors and ozone itself also move with the wind currents, making it virtually impossible for cities or regions to independently reduce and mitigate the ozone pollution because of its distribution pattern [15]. When ground-level ozone is present in the troposphere, it causes a wide range of adverse health effects for vulnerable population groups, particularly the elderly, and long-term as well as short-term exposure leads to mortality due to respiratory and cardiovascular problems [16]. Approximately 3 million deaths per year have been reported caused by outdoor and indoor air pollution, according to the World Health Organization (WHO), 92% of the world’s population lives in countries where air pollutant concentrations exceed the WHO human health safety limits [17]. Indoor air pollution has a significant impact on human health and can result in a variety of occupational diseases, including allergic reactions and asthma [18]. According to a report by the World Health Organization, indoor air pollution is accountable for 3.8 million deaths on annual basis [19]. The Environmental Protection Agency (EPA) ozone standard is an 8 h average of 0.08 parts per million by volume (ppm) [20]. The Clean Air Act requires periodic review of ambient air quality standards (NAAQS) for gases and surface ozone, which is harmful for community health and surrounding environment.
Variations in biomass burning, Lavish lifestyle, emissions from different mining activities, coal power plants and vehicles, developmental projects, stratospheric-tropospheric ozone, trade from neighboring countries, and climate change patterns have led to increased surface ozone concentration in Pakistan. Seasonal variations and the increase in Ultraviolet radiations (UV), wind direction and speed, the presence of VOCS and NOx, ground-level ozone prevails excessive concentrations mostly in summer and in southern area of Pakistan in winter season. Low O3 concentrations are recorded during the monsoon season in southern parts of Pakistan, whereas in northern areas, the same low level of ozone is linked to high altitude, low temperature, low wind speed, and low air pressure. Surface ozone remains high during the summer period (April-September) as southern Pakistan experiences high temperatures, ranged 35 to 49 °C. Such high temperatures, maximum UV-B radiations reaching the surface, and low wind patterns give rise to favorable conditions for surface ozone formation. Therefore, unlike in winter (October–March), most parts of Pakistan have peak tropospheric or surface ozone in the summertime. A previous study concluded that the maximum increase in surface ozone (2015–2019) was linked to El Nino during 2015–2016, which resulted in warmer temperatures, coupled with massive energy projects and vehicular emissions in the China Pakistan Economic Corridor (CPEC). Deforestation, use of cheaper fuel like CNG, extensive traffic, and smoke producing factories in Hattar Industrial Estate were the leading factors inducing high concentrations of secondary pollutants, posing a vulnerable zone to induce an illness in humans. Due to this present study community can be capable of mitigating ground-level ozone concentrations by shifting to clean and green energy sources, introducing fuel-efficient vehicles and bioenergy etc. [21].
Hattar Industrial Estate, KPK, is an industrial hub, and provided employment to at least 0.2 million people, many of them are poor and illiterate. Due to high exposure to air emissions, lack of protective measures, and lack of awareness for air emissions causing health problems in labour community of Hattar Industrial Estate. Exposure of laborers to high ozone concentrations may be one of the major causes of notable symptoms such as shortness of breath, respiratory tract infections, asthma, and dermatosis, which were noticed during initial visits to Hattar industrial units and confirmed through labour medical histories.
Many cases of industrial ozone pollution have been reported in the current study area, but to date, successful efforts have not been carried out to mitigate levels of ozone emissions. Some protective techniques include the use of ecological indicators, baghouses, and fabric filters [22]. This high ozone levels will require immediate attention and better monitoring of ozone levels, coordinated transboundary strategies, and engagement with civil society and citizen action [23,24]. Periodic health checkups for all contractual and permanent employees who were exposed to ozone emissions for many hours per day working in manufacturing industries are also suggested. This study aims to planned for the measurement of the magnitude of indoor and outdoor ozone concentrations and evaluate population risk factors (AP = AR) to show the possible association between high ozone exposure and disease prevalence among the labor communities in the study area. This study could help to implement policies for ozone-related health risks and pollution control by setting local ambient air standards for indoor air quality and conducting further studies concerning the long-term effects of high concentrations of ozone on occupational health [25,26]. In addition, there is a further need to address the zero emissions target in the industrial sector, which may set new industrial standards for the safety of labors as well as community. Industrial policies in the 21st century must aim to achieve zero emissions and rectify the emission-intensive industries. To date, industrial sectors such as steel, cement, and chemicals have largely been insulated from the effects of climate change policy, but a major shift is needed from contemporary industrial policies to permanent management practices and eco-friendly strategies [27].

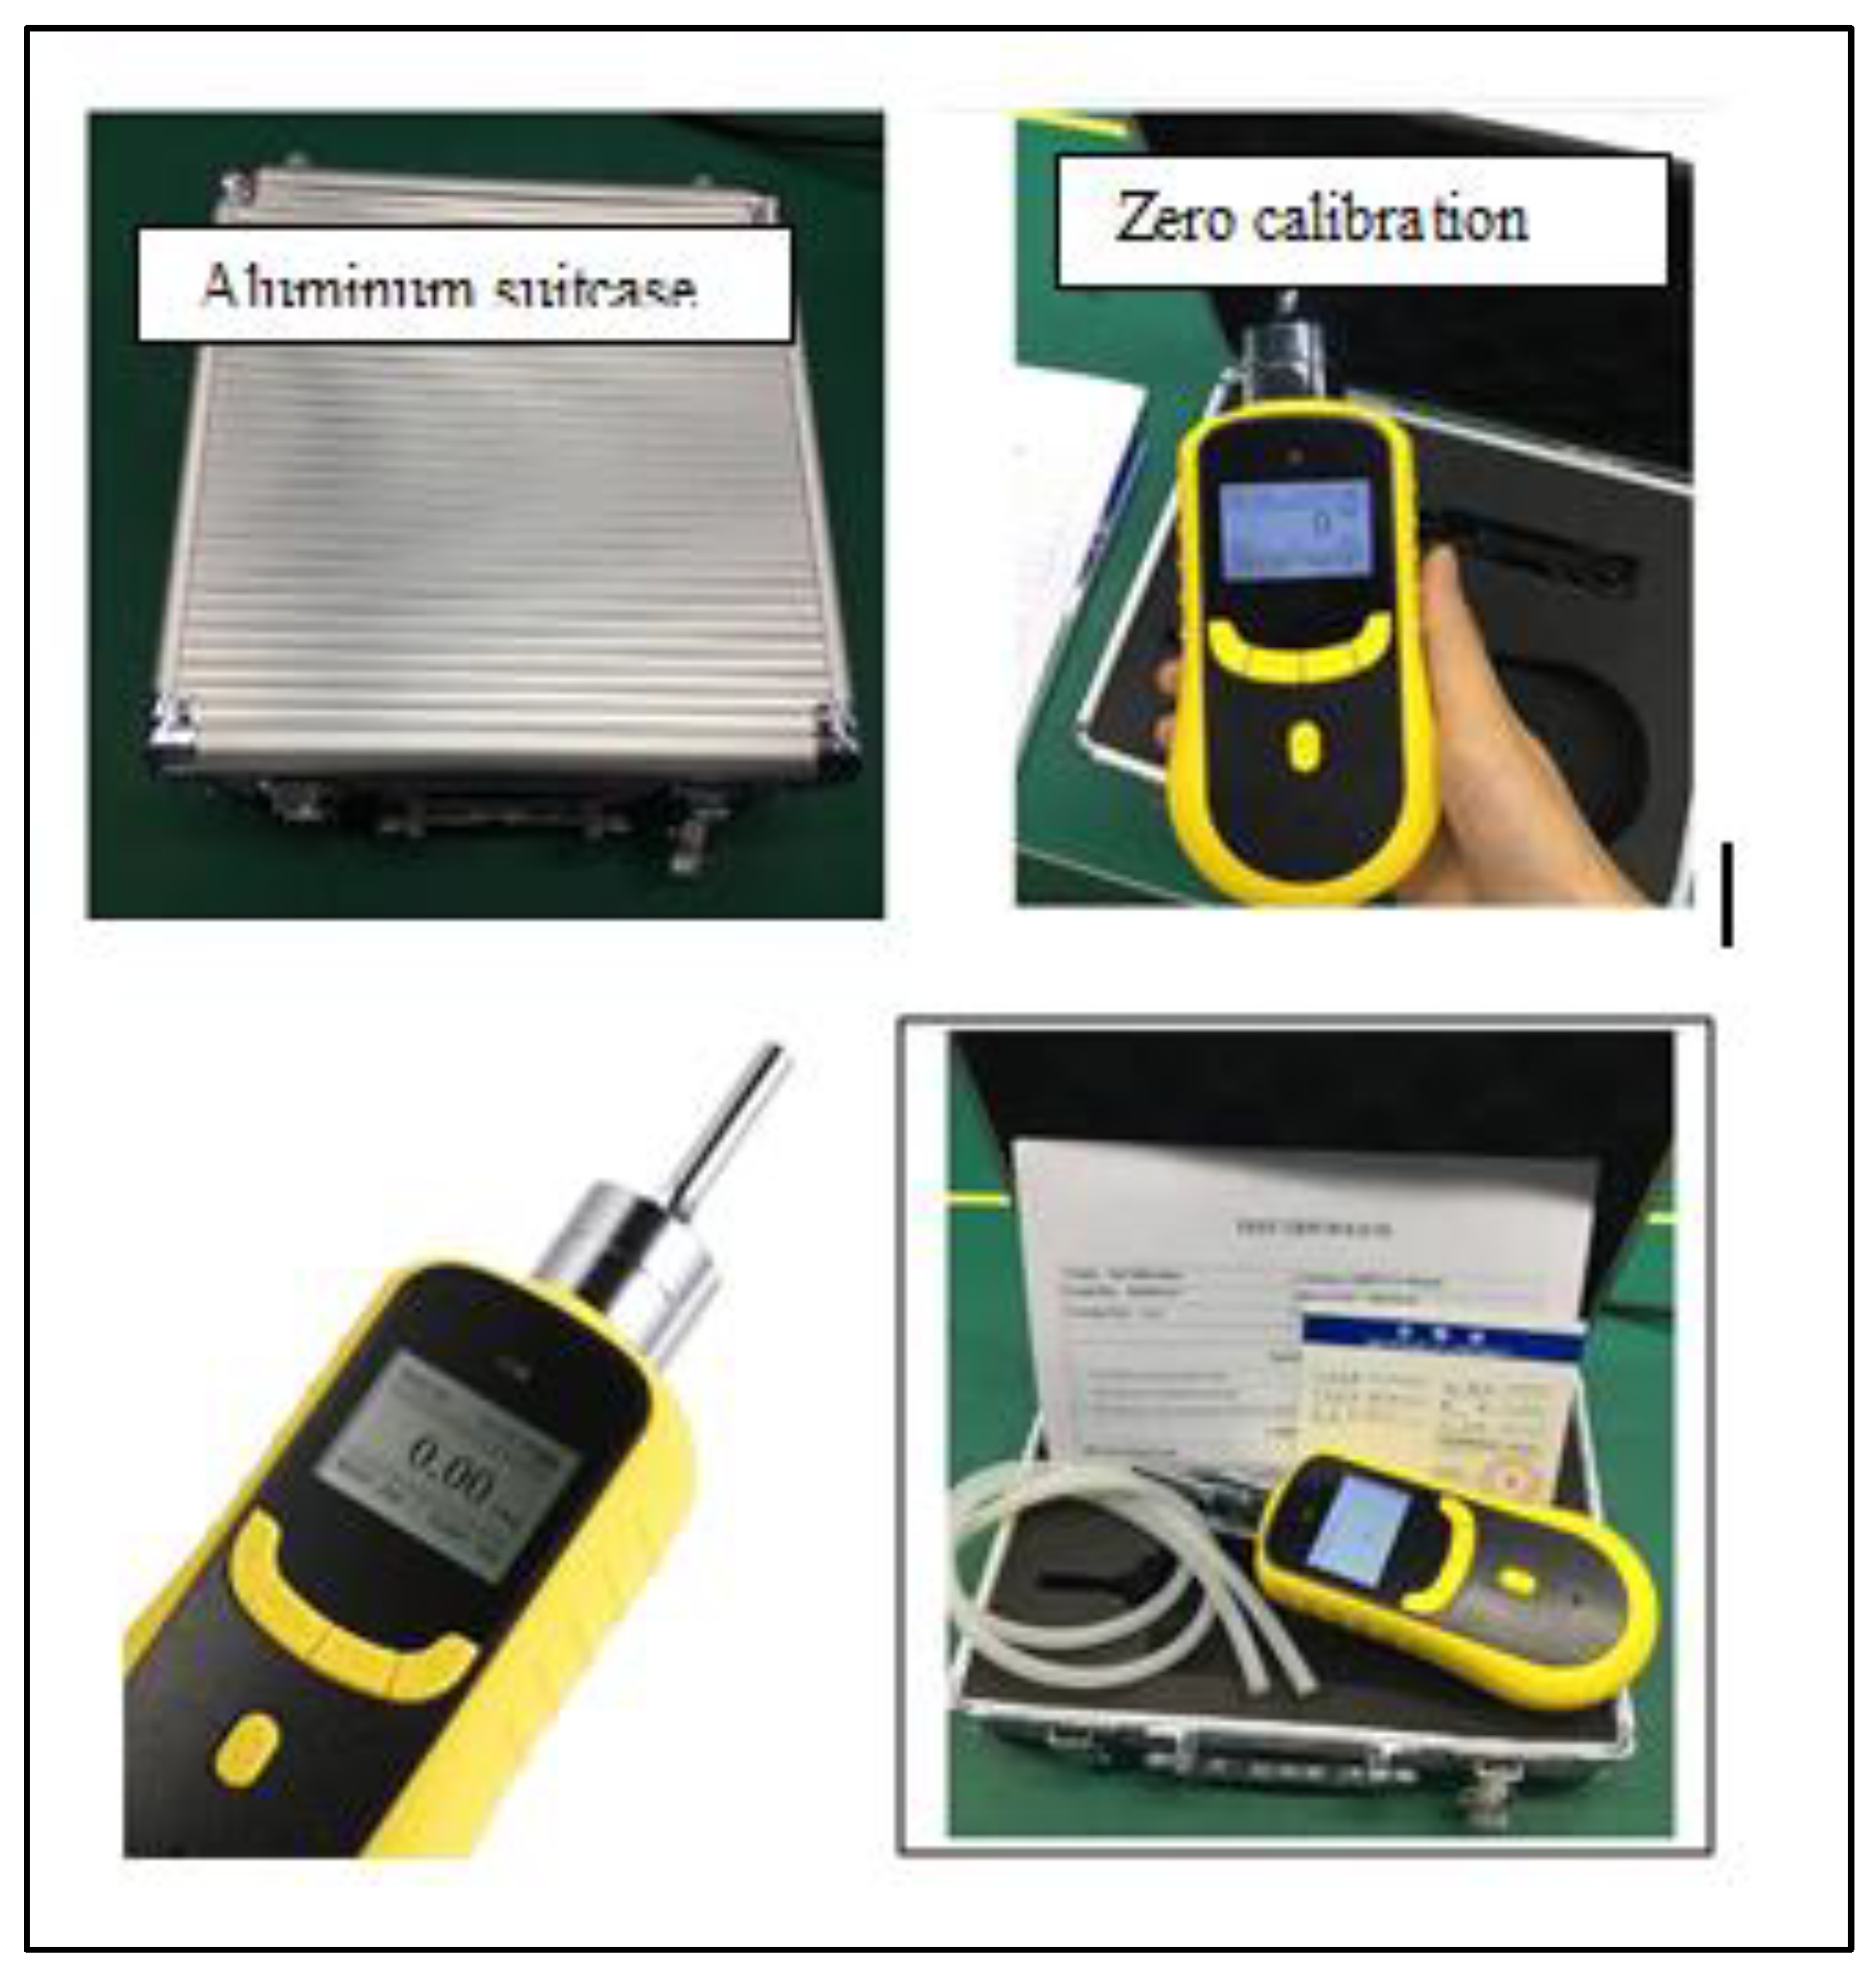
2. Materials and Methods

2.1. Sampling Area and Sample Size

Sampling of ozone was conducted at Hattar Industrial Estate, Haripur, KPK, Pakistan. Sampling was done at indoors industrial units, and outdoors of industries. Hattar is situated in District Khyber Pakhtunkhwa at 33°51′71″ N and 72°51′8″ E. It covers a total area of 4.30 km2 and has many heavy electrical, leather, and cement factories, iron and steel mills, food processing facilities, chemical plants, pharmaceutical firms, butter, fat, and vegetable oil manufacturing industries, etc. as described in Figure 1 [28]. For control sampling of ozone, triplicate readings from 10 sampling points (50 km away from the industries, less polluted area of Sultan Pur) were measured with help of a portable SKY 2000-WH-Ozone meter. For indoor sampling, 288 samples were obtained from units of food processing facilities, such as batter preparation, mixing, baking, cooling, cutting, deposition, and distribution: gate 1, gate 2, and gate 3. From these 8 different units of the food industry, 24 samples were taken per day (24/day) × 12 months = total 288 samples. Average values were used to plot a graph. A similar sampling pattern was followed for the steel and oil industries. The total number of samples obtained from these industries was 864/12 months. For control samples, 20 samples were taken per day from 10 different units of the food industry (20 samples/day) × 12 months = total 240 samples. Average values were used to plot graphs.

2.2. Statistical Analysis for Temporal Variation in Ground-Level Ozone (Indoor)

Different units of three model industries (food, steel, and oil) were selected for the characterization of temporal variations in ground-level ozone from December 2018 to November 2019. Statistical analysis using ANOVA was applied on collected ozone data to calculate the p- value. The p-value was calculated to quantify the significance of recorded data. The calculated p-value at 0.05 significance indicated that the difference between concentration data was valid and significant.

2.3. Sampling Sites (Outdoor)

Ground-level ozone concentrations were measured using the Sky-2000 ozone meter from December 2018 to November 2019 at different temperatures at 30 main stations in three megacities (Islamabad, Abbottabad, and Haripur Hattar) of Pakistan.

2.4. Sample Size (Outdoor)

For outdoor ozone measurement, maximum and minimum peaks from 30 different selected stations of three megacities (Islamabad, Abbottabad, and Haripur Hattar) in Pakistan were analyzed. An average of 120 readings from each station were obtained throughout the year. A total of 360 readings were obtained from the 30 main stations of three megacities in Pakistan with the help of portable ozone meter as shown in Figure 2. Comparisons of exposed and non-exposed groups of the population were presented graphically and prevalence of disease in the population exposed to ozone was calculated by population attributable risk [29].

2.5. Statistical Package for the Social Sciences (SPSS)

Frequency of high ozone saturation has been shown in graphs using SPSS statistical software to perform the statistical analysis [30].

2.6. Statistical Modeling Equation for Attributable Risk (AP)

Data in the current study was also subjected to statistical modeling to determine the health risk of air pollutants (ozone) on population health by calculating attributable risk (AR), attributable proportion (AP) [31], or RR = (risk of exposed group of population/non-exposed group).
The health risk of ozone was statistically calculated using the health risk assessment model equation, as shown below. The attributable proportion (AP) can be calculated by the following equation [32].
A P = [ { R R ( c ) 1 } × P ( c ) ] [ R R ( c ) × P ( c ) ]
RR is the relative risk value for a given air pollutant and health outcome, published by the WHO from epidemiological studies. RR in this equation was greater than 1, showing high association of increased pollutant concentration with disease prevalence among the labour community, where P(c) is the population proportion in category “c” of exposure.

3. Results

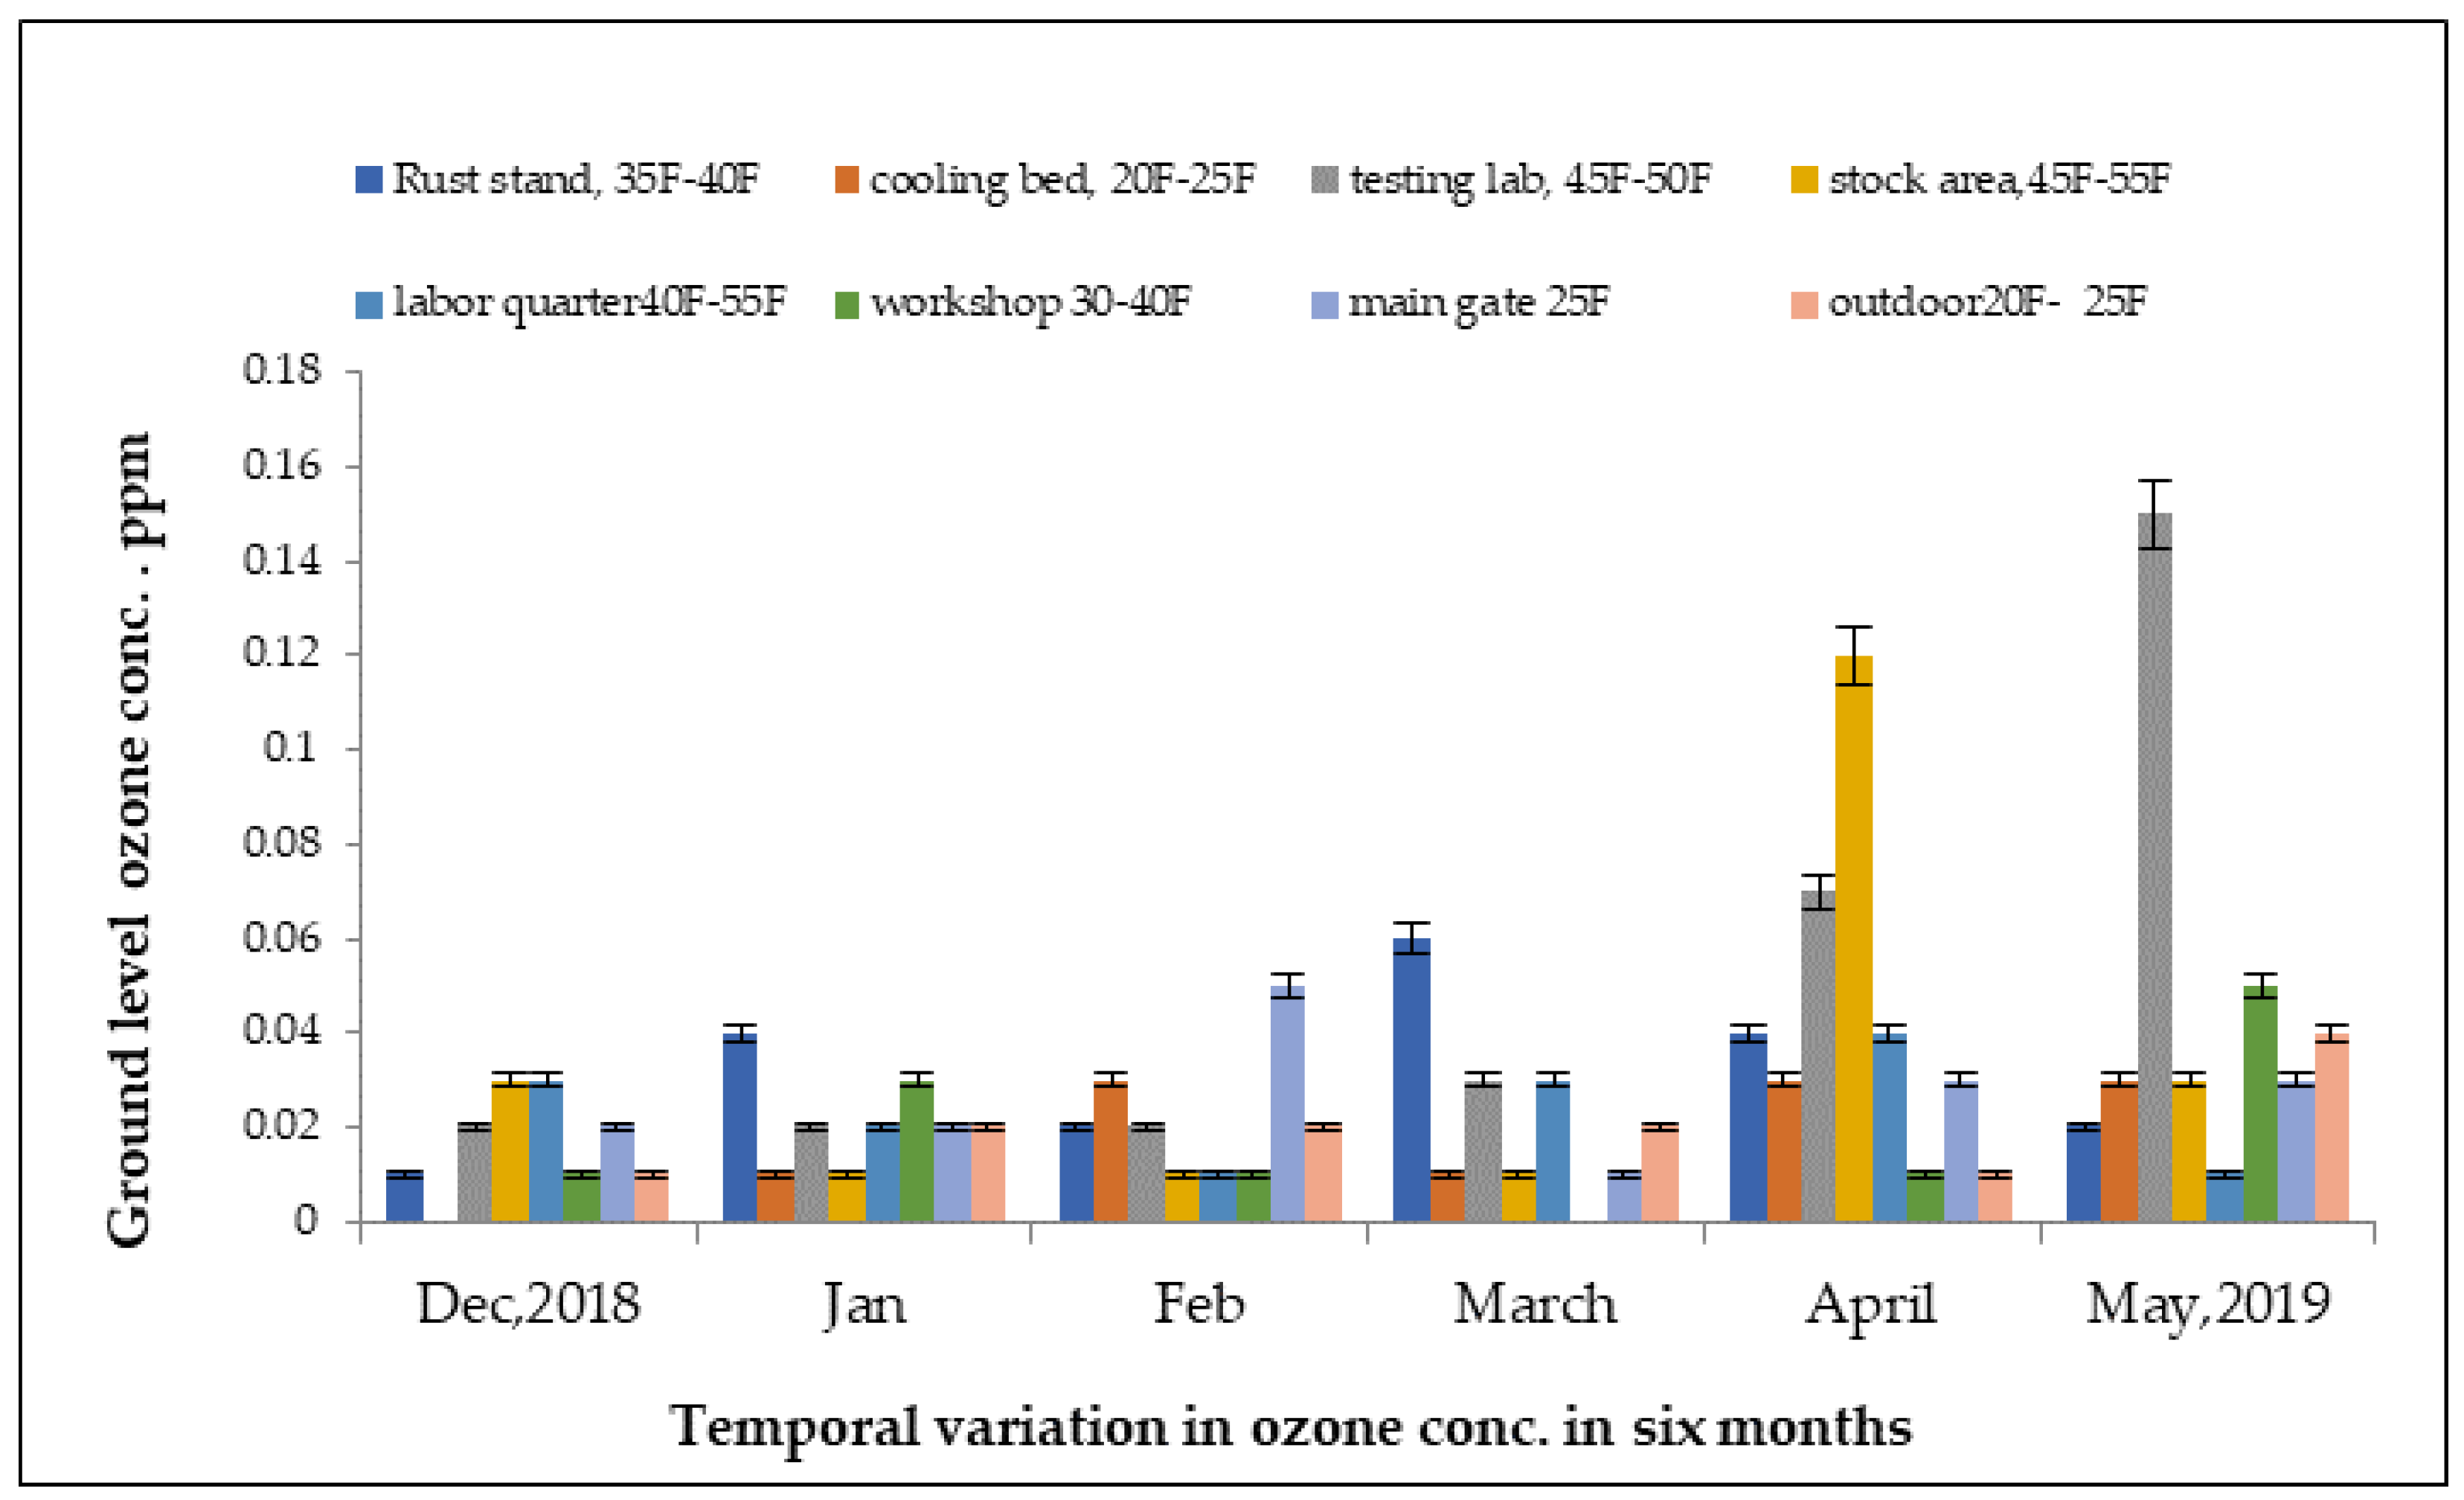
3.1. Indoor Ozone Concentration

3.1.1. Concentration of Ozone in Food Industry

To determine the concentrations of ground-level ozone level were monitored in several units of the food industry from December 2018 to May 2019, as presented in Figure 3, by taking 24 samples from each chamber area, including batter preparation, mixing, cutting, cooling, and baking. Approximately 288 samples were obtained on average over six months. In the oven area, the highest concentration was detected at 0.37 ppm, followed by the baking chamber at 0.36 ppm in the month of March 2019. Meanwhile, the lowest reading was detected at 0.002 ppm in the batter preparation area in the month of December 2018. The temperature of each site was different due to various processes, resulting in changes in ozone concentrations. The outdoor concentration was reduced at gate 3, at approximately 0.03 ppm, which was at least 30 km away from the indoor areas.
Concentrations of ground -level ozone were monitored in several units of the food industry from June 2019 to November 2019, as presented in Figure 4. In the baking area, the greatest reading was detected at 0.17 ppm, followed by 0.13 ppm in the mixing chamber in the month of July 2019. Meanwhile, the lowest reading was detected at 0.002 ppm in the mixing area in the month of June to December 2018. The temperature of each site was different due to various processes, resulting in changes in ozone concentration. The outdoor concentration was reduced at gate 3 in the month of October 2019, at approximately 0.03 ppm, which was at least 30 km away from the indoor areas.

3.1.2. Ozone Concentration in Steel Industry

The ground-level ozone concentrations in understudy steel mill of Hattar Industrial Estate, from December 2018 to May 2019, are shown in Figure 5. The highest concentration was recorded at 0.15 ppm in an indoor environment, while the lowest concentration of ozone was recorded at 0.01 ppm in the loading area. The surface-level ozone concentration was highest in the month of May and lowest in the month of December in units of the steel mill. The high concentration was due to the increase in temperature in the month of May.
Concentrations of ground-level ozone in the steel industry measured from June 2019 to November 2019 are presented in Figure 6. In the rust stand area, the highest reading was detected at 0.17 ppm in the month of July 2019 while lowest reading was detected at 0.001 ppm in the stock unit in the month of November 2019.

3.1.3. Ozone Concentration in Oil Industry

The maximum ground-level ozone concentrations were reported in the boiler section at 0.21 ppm and the hydrogenate section at 0.15 ppm in the month of May 2019, as shown in Figure 7. Due to differences in temperature, the highest concentration was recorded in month of May and the lowest concentration was recorded in the month of February 2019.
Concentrations of ground-level ozone in the oil industry measured from June 2019 to November 2019 are presented in Figure 8. In the boiler unit, the greatest reading was detected at 0.31 ppm in the month of June 2019. The lowest reading was detected at 0.001 ppm in the outside area in the month of November 2019.

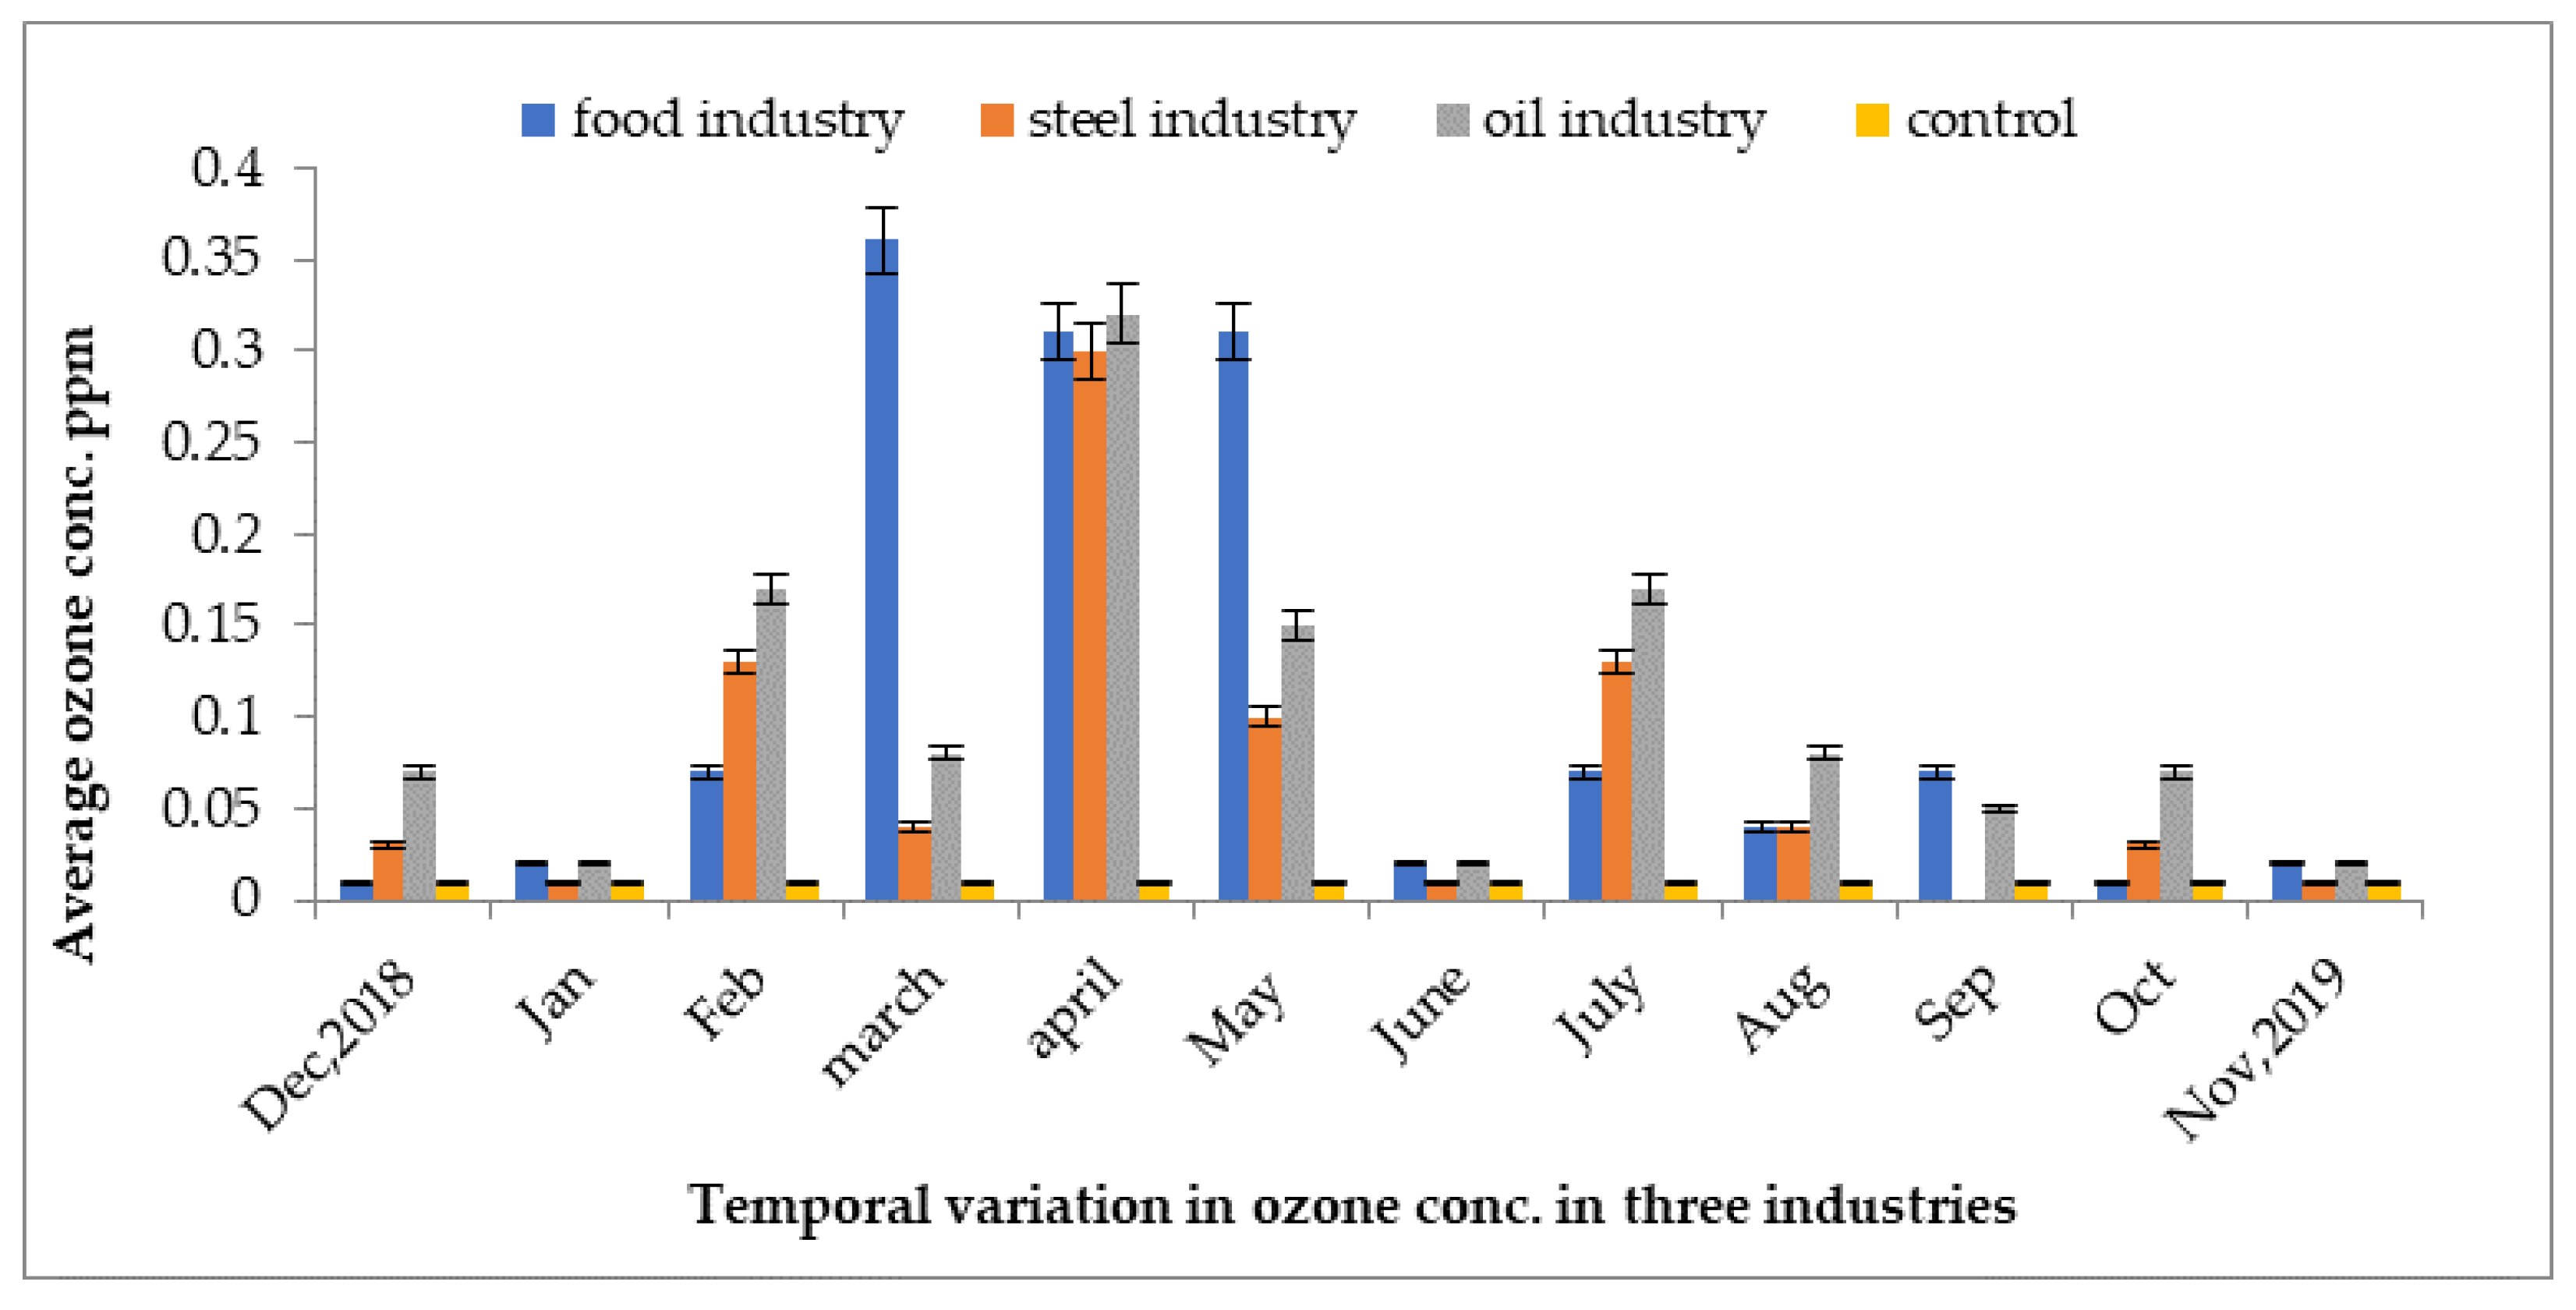
3.1.4. Temporal Variations in Food, Steel, and Oil Industries

The ground-level ozone concentrations of three industries are represented in Figure 9. The highest concentration was recorded at 0.37 ppm in the indoor environment of the food industry, whereas the lowest concentration of ozone was recorded at 0.001 ppm in the cooling area of the steel industry in the month of December. The ground-level ozone concentrations were highest in the month of March and lowest in the month of September in units of the steel mill in the year 2019. The high concentrations were due to the increase in temperature in the months of March, May, and June, as compared to the control site.

3.2. Outdoor Ozone Concentration

There have been some correlations discovered between air pollution and several meteorological characteristics. Generally, the monthly variability of O3 concentrations at ground level peaked in summer and was lowest in winter. Ground-level ozone is also a major component of urban smog, posing a serious risk to human health, the natural environment, and agricultural yields [33,34].

3.2.1. Trends and Spatial Variability of Ozone in Three Cities of Pakistan

The trends and spatial variability showed maximum and minimum peaks for ozone concentrations in three different cities from the months of December 2018 to November 2019. In Islamabad, the O3 concentration was high in the month of March 2019, at 0.22 ppm, whereas the rest of the year showed comparatively lower concentrations of 0.081 ppm, as shown in Figure 10.
Ozone concentrations in the city of Haripur were extremely low at 0.11 ppm in the month of December 2018 and increased to 0.20 ppm in the month of March 2019, as shown in Figure 11.
The concentration of ground-level ozone in Abbottabad was high in the month of March 2019 at 0.021 ppm. However, the rest of the year showed O3 concentrations as low as 0.012 ppm, as shown in Figure 12.

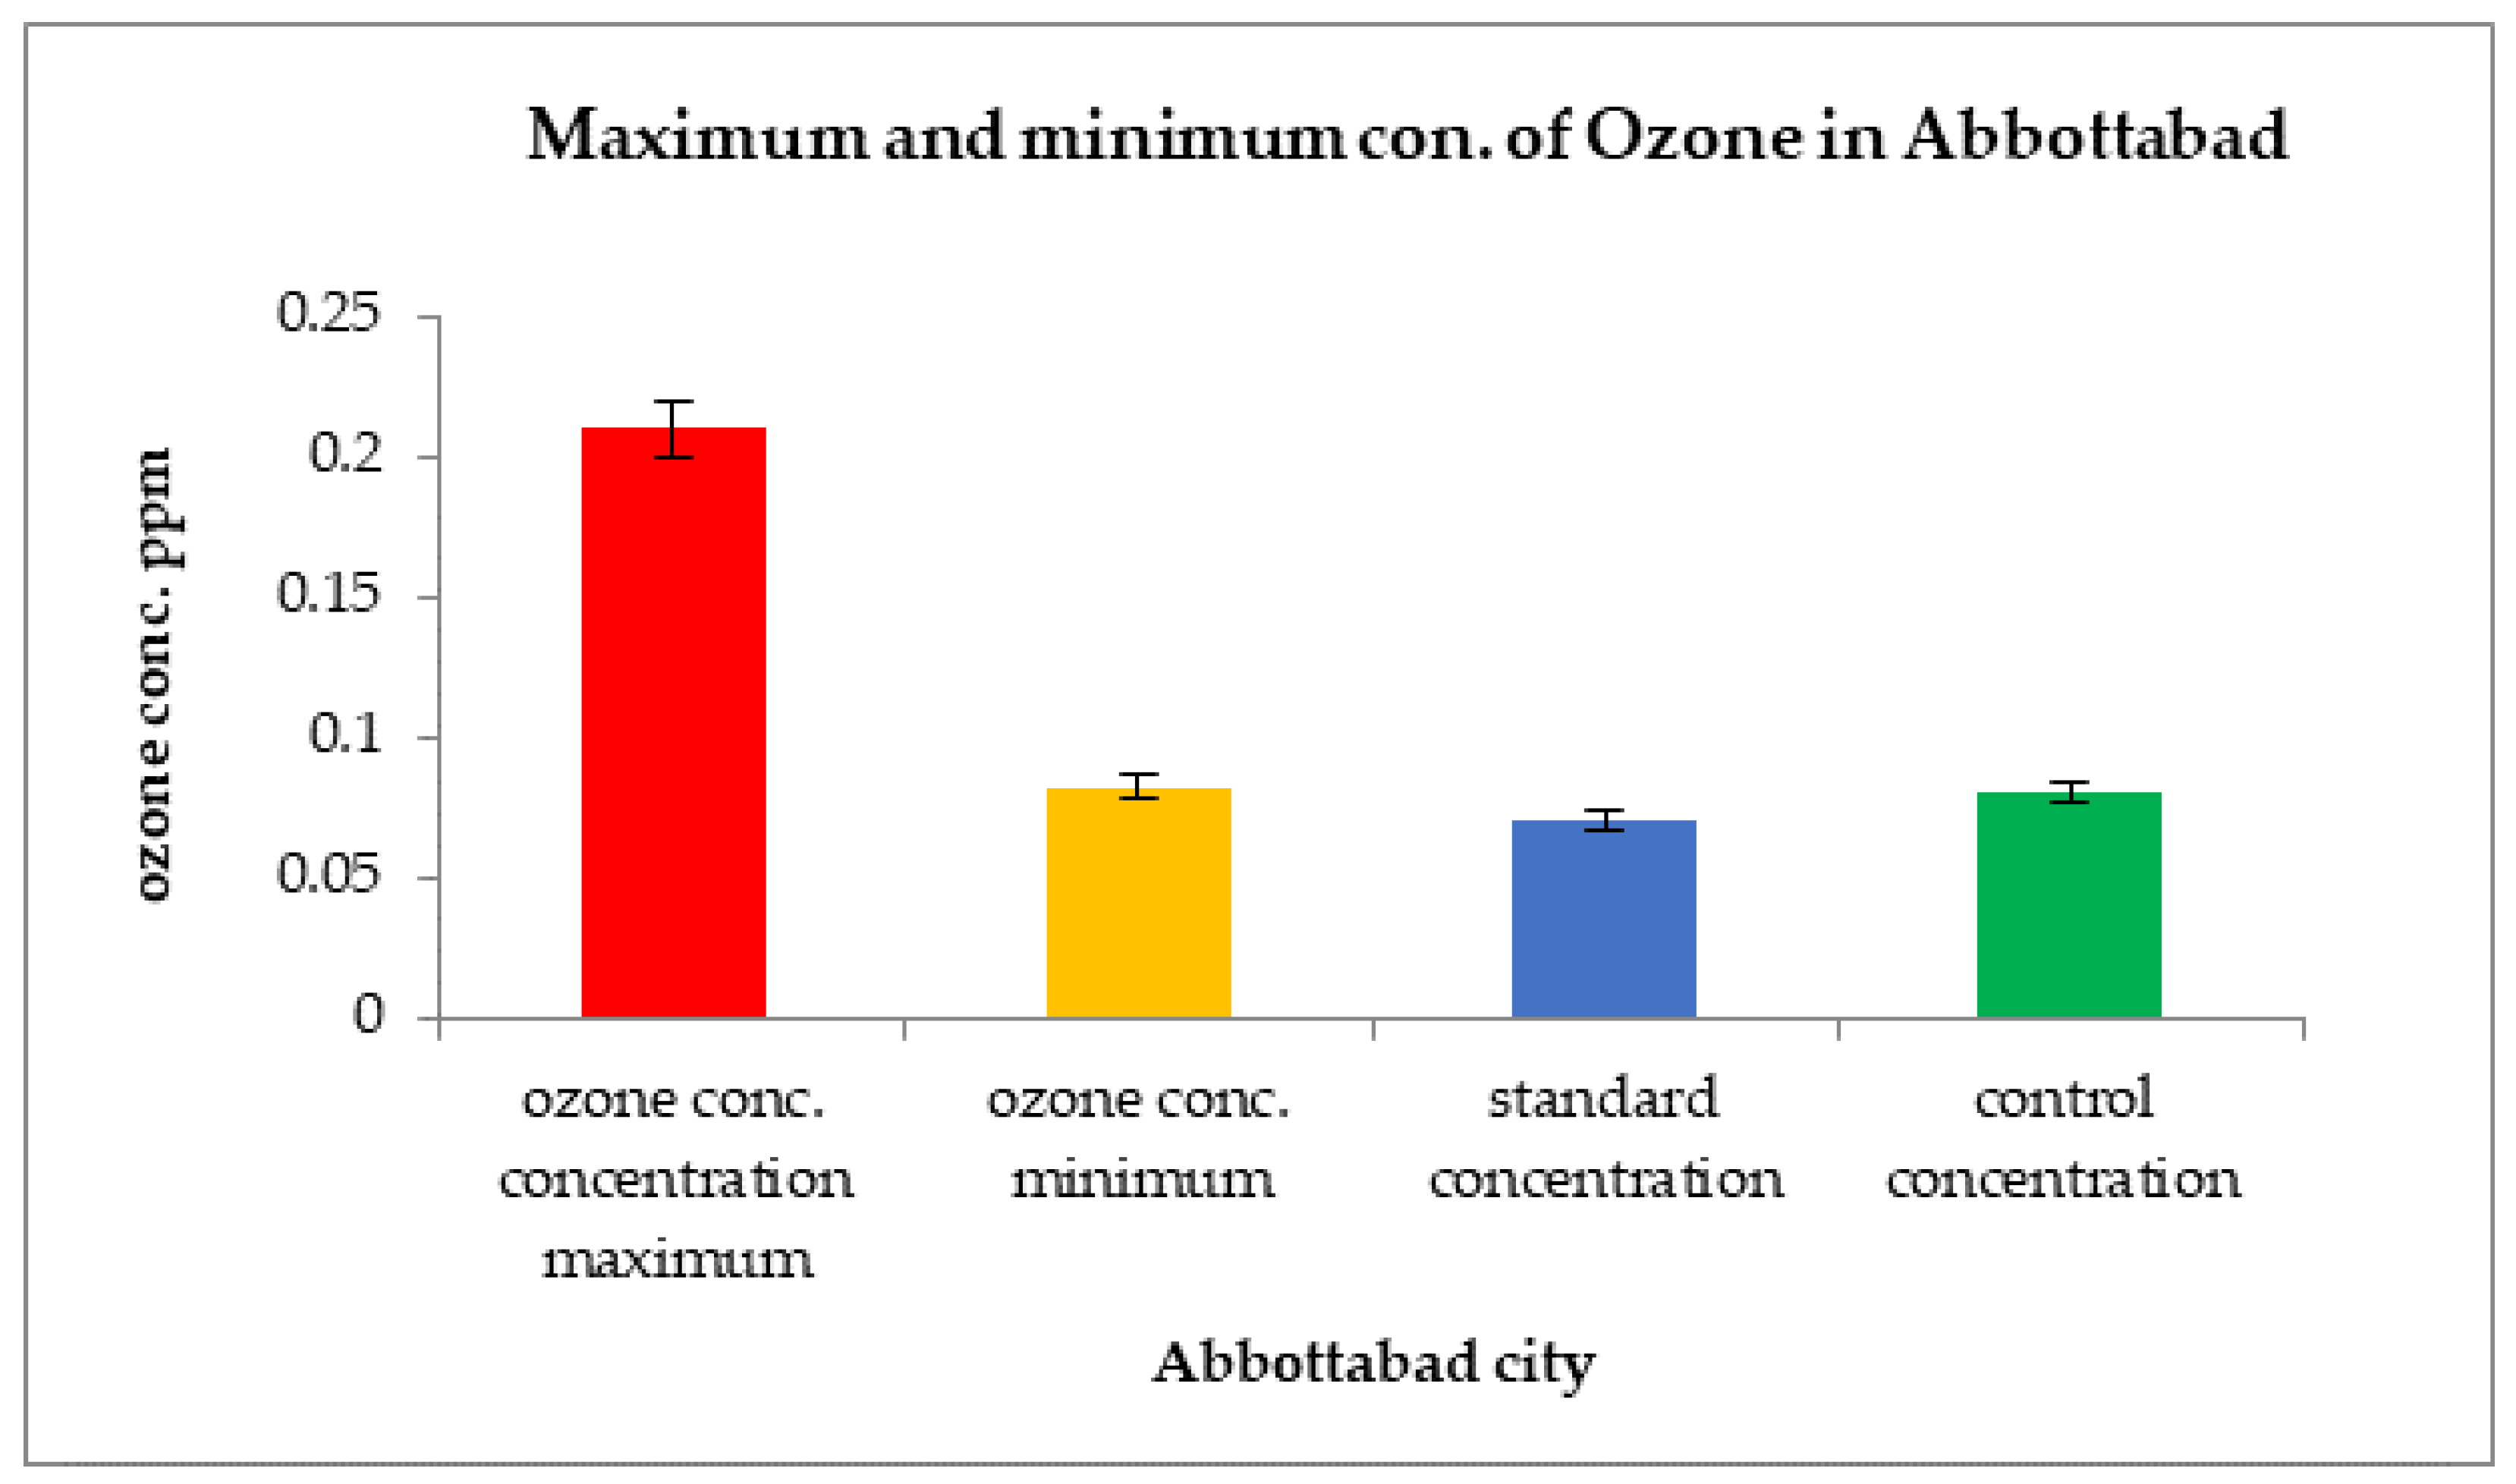
3.2.2. Comparison of Over Than Standard Values of Ozone for Three Cities

Comparisons of over than standard values of ozone concentration with standard values for three cities are shown in Figure 13. The highest outdoor ground-level ozone concentration, at 0.23 ppm, was detected in Islamabad. The minimum ground-level ozone concentration was observed in Abbottabad.

3.2.3. Prevalence of Disease in Population Exposed to Ozone Pollution in Three Megacities of Pakistan

In Haripur city, 32% of the exposed population suffered from skin allergies, 24% from respiratory illnesses, 18% from asthma, 16% from eye inflammation, and 17% suffered from hypertension. In Islamabad, 15% of cases had skin allergies, 11% had respiratory illnesses, 6% had asthma, 5% had eye inflammation, and 6% suffered from hypertension. In Abbottabad city, the results indicated that 17% suffered from skin allergies, 10% from respiratory illnesses, 8% from asthma, 14% from eye inflammation, and 8% suffered from hypertension, as shown in Figure 14.
The prevalence of disease among the population exposed to high ozone emissions compared to the non-exposed population was statistically analyzed using SPSS. Comparison of the two groups showed that those who were not exposed to such high concentrations of ozone emissions had lower percentages of disease compared to those in the exposed group, as shown in Figure 15.

3.2.4. Population Attributable Proportion for Ozone Exposure

The population attributable risk represents the proportion of disease cases in a population that would not have occurred in the absence of a risk factor.
The following equation was used for calculating population attributable risk.
The population attributable proportion indicated that 69.87% of respiratory diseases, 64.06% of dermatosis, and 21.33% of eye inflammation were associated with exposure to ozone emissions, as shown in Table 1.

4. Discussion

Ground-level ozone is ranked among the major secondary air pollutants according to the WHO, and its short- and long-term exposure to ozone has a variety of impacts on human health, including bronchitis and pulmonary cardiac disease, neuro-psychiatric problems, eye irritation, skin problems and cancer [35]. The transient effects of ozone are more closely related to cumulative daily exposure than to one hour peak concentrations, and future revisions of the ambient standard for ozone should take this into account [36].
The concentrations of ozone reported from previous years have increased continuously at ground-level due to industrial emissions, transport, smoke, and climate change [37]. Many Developing countries such as Pakistan, which is switching from a predominantly rural country to an increasingly urban, over-exploitation of resources, high population rate and use of cheaper fuel used in vehicles and industrial sector, and non-seriousness of citizens can face the critical challenges in terms of increasing concentrations of pollutants including ozone [38]. Respiratory infections, chronic obstructive pulmonary disease, pneumothorax, asthma, allergies, hyperthermia, and dehydration are some of human health issues associated with high concentration of ozone at ground-level [39].
In the current study, measurements of ozone were carried out in the food, oil, and steel industries using an ozone meter (Model No SKY2000). The highest concentration was recorded at 0.36 ppm in an indoor environment of the food industry, while the lowest concentration of ozone was recorded at 0.00 ppm in a cooling area of the steel industry in the month of December. The ground-level ozone concentration was observed to be highest in the month of March and the lowest level was observed in the month of September in units of a steel mill in the year 2019. The high concentrations of ground-level ozone were due to the increase in temperature in the months of March, May, and June compared to the control site.
The concentration of O3 in Abbottabad was extremely high in the month of March 2019 at 0.021 ppm. However, the rest of the year showed concentrations as low as 0.012 ppm. The highest concentration of outdoor ground-level ozone, at 0.22 ppm, was detected in Islamabad.
Concentrations of ozone in the Hattar industrial area were greater than those at the control site. The industrial sector and dense population may contribute to increasing ozone concentrations. One of the possible reasons could be the excessive utilization of chemical and petroleum products for energy and production in industrial processes, which accelerates ozone formation. Industrial manufacturing processes, industrial boilers and furnaces, mobile sources, and biogenic emissions are all substantial contributors of photochemical pollution during the summer.
The concentrations of ozone in Islamabad, Haripur, and Abbottabad were greater than those at the control site (Sultanpur Havelian). High ground-level ozone concentrations in these study areas may be due to dense traffic, population, and the use of other chemical products.
Ozone is the second most important air pollutant poses the serious environmental health risk assessment have been presented. In earlier studies, only mortality and subsequent deaths due to acute exposure were accounted for ozone high concentration. Now, for the first time, a World Health Organization working group has recommended concentration response functions for mortality caused by long-term exposure of secondary pollutants [40].
The findings of the current study indicated that ozone concentrations in the Hattar industrial area were greater than those at the control site. Industrial sector and dense population may contribute to increasing ozone concentrations. One of the possible reasons could be the excessive utilization of chemical and petroleum products for energy and production in industrial processes, which accelerates ozone formation. Industrial manufacturing processes, industrial boilers and furnaces, mobile sources, and biogenic emissions are all substantial contributors of photochemical pollution including surface during the summer [41].
Air pollution is the most important emerging problem worldwide, and Pakistan is also facing the same issue in its megacities. Ozone (O3) concentrations present in the atmosphere were studied in some of the most congested and populated cities, such as Islamabad, Haripur, and Abbottabad. A previous study reported that concentrations of ozone increased with increasing temperature [42]. Advanced research has connected both extreme temperatures and elevated ozone pollution to increased risk of mortality. Ozone levels were higher during days with high temperatures, which was associated with excess mortality rate in the city [43].
A previous study reported that the spatial distribution of ozone variations depended on industrial emissions and traffic smoke. However, the central and western regions of Shandong Province were constantly characterized by high ozone concentrations. This pattern was likely due to heavy industrial production in Shandong Province, as large-scale industrial production and frequent traffic flow produce many precursors, thereby exacerbating regional ozone pollution. These characteristics were attributed to emission reduction policies, meteorological conditions, emission intensities of anthropogenic sources, and regional transport in the North China Plain. Overall, for cities with heavy industrial facilities in the central NCP, timely adjustment of the energy and industrial structure, effective control of emissions of precursors, promoting new clean energy, and strengthening regional joint prevention and control were suggested as effective ways to alleviate ozone pollution [44].
The findings of the current study showed significantly high O3 values in several parts of the study area, especially in densely populated cities. Statistical analysis showed that 69.87% of cases of respiratory diseases were attributed to high ozone concentrations, while 64.06% of dermatosis cases and 21.33% of eye disease cases were attributed to high ozone concentrations in the population of the study area.
A previous study reported controlled human exposures to ozone and the associated health impacts with this elevated concentration. A very large database was constructed based on studies in which selected human volunteers were exposed to O3 in purified lab air at specific time intervals. Most studies involved a series of such exposures in random order in which subjects were exposed at one or more concentrations. Many studies involved prescribed periods and intensities of exercise during the exposure interval. The most measured effects were changes in forced expiratory flow rates and volumes and/or changes in airway resistance and compliance [45].
A review was conducted in series by a WHO, the employees found sufficient evidence of ozone effects on chronic mortality, and according to WHO calculations the potential risk might be increased double fold near future. The fraction and proportion of disease induced by ozone exposure is estimated by calculating the population attributable fraction (PAF) (Equation (2)):
P A F = f × ( R 1 ) ÷ f × ( R 1 ) + 1
where f is the fraction of population exposed to given factor, may be environmental and controlled and RR is the relative risk of the exposed population.
Another study reported that on a global and regional scale, increased VOCs, and NOX in developing countries amplified background ozone concentrations [46]. More frequent and intense wildfires, due to global warming and climate change, are also linked to episodic series of high O3 pollution in downwind locations [47]. Spatial-temporal changes in NOx and VOCs and their relative abundance may also contribute to the observed positive trends that the intensity of ozone destruction via NO titration is declining and more VOCs are increasing because of high ozone formation [48]. The New York-Newark-Jersey City, NY-NJ-PA Metro area is the most populated place in North America (area of 17,314 km2 with 19,216,182 residents in 2020) also exposed to high risk of secondary pollutants [49]. It encompasses New York City (NYC), Long Island, the mid and lower Hudson Valley, and major urban areas in New Jersey. This region is a moderate non-attainment area that exceeds the 2015 NAAQS O3 standard above than 70 ppb [50].
The findings of current study conform to those of previous studies depicting analyses of mean atmospheric column nitrogen dioxide (NO2) and carbon monoxide (CO) levels, with significantly high CO and NO2 values detected in several parts of the study area. High ozone values were detected in the Vardar and Polog Valleys and high NO2 values were detected in densely populated cities. A positive correlation (r = 0.78; R2 = 0.61) was found between NO2 concentrations, population statistics, altitude, and CO values in a study area in the Republic of North Macedonia during a six-month period [51].
One previous study conducted in Pakistan reported maximum increases in surface ozone during warmer temperatures, coupled with massive energy projects and vehicular emissions in the China Pakistan Economic Corridor (CPEC). Along the CPEC there is no tree plantation along the roads without any air monitoring devices. Previous modeling analysis has shown that with high growth in O3 precursor emissions and no planned practices have been found to mitigate the ozone pollution. If this situation is remained persisting O3 pollution will turn into a serious global issue by the end of this century. The results from the new scenario analysis and modeling work emphasized the important role of emission controls in determining future O3 concentrations. This analysis also showed that by 2050, climate change may have significant impacts on ground-level O3 levels at local and regional scales. If anthropogenic emissions will increase between 2000 and 2050, and much attention should be paid on full implementation of global emission controls, the mean O3 concentrations during the summer season must be projected to reduce over much of the developed world in 2050 but increase over the developing world. The mitigation strategies must be adopted by switching the petroleum product to clean and green technologies for safe and sustainable environment for fresh breathing.

5. Conclusions

This study highlighted an issue of great concern for developing countries such as Pakistan, with the need to streamline ways to limit ozone pollution and efficiently determine the risk of illness upon exposure to air pollution. Ozone pollution is a matter of great concern in Pakistan because of the associated health risks to individuals. The situation is getting worse in megacities of Pakistan with increasing urbanization, industrialization, and more importantly, the rapidly growing population. Ozone pollution poses a threat to human life in the form of pulmonary, cardiovascular, carcinogenic, or asthmatic diseases. Industries in Hattar, such as the food processing and oil industries, are major contributors to primary and secondary pollutants in the atmosphere. As a result, there is a high prevalence of diseases among the population, with 35% suffering from skin allergies, 35% from respiratory illnesses, 16.7% from asthma, 9% from eye inflammation, and 14% from hypertension. In Peshawar city, 30% suffered from skin allergies, 22% from respiratory, 14% from asthma, 6% from eye inflammation, and 12% from hypertension. In Haripur city, 32% suffered from skin allergies, while 15% of cases in Islamabad were skin allergies and 22% suffered from skin allergies in Quetta city. Meanwhile, in the control group in Abbottabad city, only 17% suffered from skin allergies and asthma was the 2nd most prominent disease caused by surface ozone. High concentrations of different air pollutants from industrial units and vehicles are the main contributors of ozone pollution, changing the country from one of the lower polluters of the natural environment to one of the main pollutant emitters. Pakistan is the 10th most vulnerable country to natural disasters, calculated through the world risk index, after China and Bangladesh. The current study emphasizes the needs for mitigative and adaptive measures to curb ozone levels by shifting to clean and green energy sources, introducing fuel-efficient industrial equipment, and achieving efficient fuel consumption. The study findings will further guide the assessment of health risks associated with polluted environments, especially in populated cities and different industrial areas.

Author Contributions

Conceptualization, S.N.; methodology, S.J.; software, Z.M.; validation, S.N. and Z.M.; formal analysis, A.B.; writing manuscript, preparation of original draft preparation, S.J. and S.M.B.; review and editing, S.N., F.U.; visualization, A.u.H.F. and A.A.J.G.; supervision and lab provision for the installment and evaluating the indoor built environment, S.N.; project administration, M.I.; instrument installation and calibration, S.R., maintenance and installation of software on PC; software analysis, F.U., All authors have read and agreed to the published version of the manuscript.

Funding

Research equipment, sampling, and financial components were provided through the National Research Program for Universities (No. HEC_NRPU9519) awarded to Shamyla Nawazish and funded by the Higher Education Commission, Islamabad.

Institutional Review Board Statement

Not applicable.

Informed Consent Statement

Not applicable.

Data Availability Statement

The standard values were obtained from the World Health Organization and Environment Protection Agency measured values as reference standard to check the permitted limit of O3 generated through different industrial un.

Acknowledgments

The authors acknowledge the support from the Deanship of Scientific Research, Najran University, Kingdom of Saudi Arabia, for funding for this work under the Research collaboration program grant code number (NU/RC/SERC/11/1).

Conflicts of Interest

The authors declare no conflict of interest.

Abbreviations

(ppm)parts per million
FDAThe Food and Drug Administration
GITGastrointestinal tract
PpbParts per billion
O3ozone
PMParticulate matter
NO2Nitrogen dioxide
SO2Sulfur dioxide

References

  1. Bourdrel, T.; Annesi-Maesano, I.; Alahmad, B.; Maesano, C.N.; Bind, M.A. The impact of outdoor air pollution on COVID-19: A review of evidence from in vitro, animal, and human studies. Eur. Respir. Rev. 2021, 30, 200242. [Google Scholar] [CrossRef] [PubMed]
  2. Mehmood, U.; Azhar, A.; Qayyum, F.; Nawaz, H.; Tariq, S. Air pollution and hospitalization in megacities. Empirical evidence from Pakistan. Environ. Sci. Pollut. Res. 2021, 28, 51384–51390. [Google Scholar] [CrossRef] [PubMed]
  3. Fidaev, D.T.; Khunarov, A.M.; Kuchkarova, N.X. Air pollution and its consequences for human health. Acad. Res. Educ. Sci. 2021, 2, 1–4. [Google Scholar]
  4. Luo, Y.L.; Shen, J.; Chen, A.F.; Tao, Q.; Li, Q.Q.; White, P.J. Loss of organic carbon in suburban soil upon urbanization of Chengdu megacity, China. Sci. Total Environ. 2021, 634, 95–108. [Google Scholar] [CrossRef] [PubMed]
  5. Ren, Z.B.; Zheng, H.F.; He, X.Y.; Zhang, D.; Shen, G.Q.; Zhai, C. Changes in spatio-temporal patterns of urban forest and its above-ground carbon storage: Implication for urban CO2 emissions mitigation under China’s rapid urban expansion and greening. Environ. Int. 2019, 129, 438–450. [Google Scholar] [CrossRef] [PubMed]
  6. Van Vliet, J. Direct and indirect loss of natural area from urban expansion. Nat. Sustain. 2019, 2, 755–763. [Google Scholar] [CrossRef]
  7. Wang, T.; Xue, L.K.; Brimblecombe, P.; Lam, Y.F.; Li, L.; Zhang, L. Ozone pollution in China: A review of concentrations, meteorological influences, chemical precursors, and effects. Sci. Total Environ. 2017, 575, 1582–1596. [Google Scholar] [CrossRef]
  8. Zhao, S.P.; Yin, D.Y.; Yu, Y.; Kang, S.C.; Qin, D.H.; Dong, L.X. PM2.5 and O3 pollution during 2015-2019 over 367 Chinese cities: Spatiotemporal variations, meteorological and topographical impacts. Environ. Pollut. 2020, 264, 114694. [Google Scholar] [CrossRef]
  9. Nasir, A.H.; Nawaz, R.; Haider, R.; Irshad, M.A. Modeling Air Pollution Health Risk for Environmental Management of an Internationally Important Site: The Salt Range (Kallar Kahar), Pakistan. Atmosphere 2022, 13, 100. [Google Scholar] [CrossRef]
  10. Manisalidis, I.; Stavropoulou, E.; Stavropoulos, A.; Bezirtzoglou, E. Environmental and health impacts of air pollution: A review. Front. Public Health 2020, 8, 14. [Google Scholar] [CrossRef] [Green Version]
  11. Skowera, B.; Zbigniew, Z.; Alicja, B. Temporal Variability of Tropospheric Ozone Pollution in the Agricultural Region of Central-Eastern Poland. Sustainability 2020, 12, 1–20. [Google Scholar] [CrossRef]
  12. Stanaway, J.D.; Afshin, A.; Gakidou, E.; Lim, S.S.; Abate, D.; Abate, K.H.; Bleyer, A. Global, regional, and national comparative risk assessment of 84 behavioural, environmental and occupational, and metabolic risks or clusters of risks for 195 countries and territories, 1990–2017. A systematic analysis for the Global Burden of Disease Study 2017. Lancet 2018, 392, 1923–1994. [Google Scholar]
  13. Atkinson, R.W.; Butland, B.K.; Dimitroulopoulou, C.; Heal, M.R.; Stedman, J.R.; Carslaw, N.; Anderson, H.R. Long-term exposure to ambient ozone and mortality. Br. Med. J. 2016, 6, 1–11. [Google Scholar]
  14. Drozd, G.T.; Weber, R.J.; Goldstein, A.H. Highly resolved composition during diesel evaporation with modeled ozone and secondary aerosol formation: Insights into pollutant formation from evaporative intermediate volatility organic compound sources. Environ. Sci. Technol. 2021, 55, 5742–5751. [Google Scholar] [CrossRef] [PubMed]
  15. Li, C.Z.; Zhao, Y.; Xu, X. Investigation of dust exposure and control practices in the construction industry: Implications for cleaner production. J. Clean. Prod. 2019, 227, 810–824. [Google Scholar] [CrossRef]
  16. Ndayisenga, J.D.D. Seasonal Variability of Ambient Ozone over Nyarugenge District in Kigali City. Ph.D. Thesis, University of Rwanda, Kigali, Rwanda, 2022. Available online: http://hdl.handle.net/123456789/1636 (accessed on 1 January 2020).
  17. Amoatey, P.; Takdastan, A.; Sicard, P.; Hopke, P.K.; Baawain, M.; Omidvarborna, H.; Khanaibadi, Y.O. Short and long-term impacts of ambient ozone on health in Ahvaz, Iran. Human and Ecological Risk Assessment. Human and Ecological Risk Assessment. Int. J. 2019, 25, 1336–1351. [Google Scholar]
  18. Al-Zaboon, K.K. Indoor air pollution due to household use of olive cake as a source of energy. Int. J. Environ. Waste Man 2017, 19, 248–267. [Google Scholar] [CrossRef]
  19. Tran, V.V.; Park, D.; Lee, Y.C. Indoor air pollution related human diseases and recent trends in the control and improvement of indoor air quality. Int. J. Environ. Res. Public Health 2020, 17, 2927. [Google Scholar] [CrossRef] [Green Version]
  20. Hernandez, A.; Vinals, M.; Pablos, A.; Vilás, F.; Papadakos, P.J.; Wijeysundera, D.N.; Vives, M. Ozone therapy for patients with COVID-19 pneumonia: Preliminary report of a prospective case-control study. Int. Immunopharmacol. 2021, 90, 107261. [Google Scholar] [CrossRef]
  21. Raub, J.A.; Mathieu-Nolf, M.; Hampson, N.B.; Thom, S.R. Carbon monoxide poisoning—A public health perspective. J. Toxicol. 2000, 145, 1–14. [Google Scholar] [CrossRef]
  22. Quarmby, S.; Georgina, S.; Megan, M. Air Quality Strategies and Technologies: A Rapid Review of the International Evidence. Sustainability 2019, 11, 2757. [Google Scholar] [CrossRef] [Green Version]
  23. Shrestha, A.B.; Shukla, D.; Pradhan, N.S.; Dhungana, S.; Azizi, F.; Memon, N.; Huggel, C. Developing a science-based policy network over the Upper Indus Basin. Sci. Total Environ. 2021, 784, 147067. [Google Scholar] [CrossRef] [PubMed]
  24. Kim, D.; Chen, Z.; Zhou, L.F.; Huang, S.X. Air pollutants and early origins of respiratory diseases. Chronic Dis. 2018, 4, 75–94. [Google Scholar] [CrossRef]
  25. Yates, S.; Saint-Charles, J.; Kedote, M.N.; Assogba, S.C. GReducing Air Pollution in West Africa Through Participatory Activities: Issues, Challenges, and Conditions for Citizens’ Genuine Engagement. In Handbook of Communication for Development and Social Change; Springer: Singapore, 2020; pp. 1213–1229. [Google Scholar]
  26. Pant, A.; Sharma, S.; Joshi, R.C. Air quality modeling for effective environmental management in Uttarakhand, India: A comparison of logistic regression and naive bayes. J. Air Pollut. Health 2022, 7, 287–298. [Google Scholar] [CrossRef]
  27. Jehan, S.; Khattak, S.A.; Muhammad, S.; Ali, L.; Rashid, A.; Hussain, M.L. Human health risks by potentially toxic metals in drinking water along the Hattar Industrial Estate, Pakistan. Environ. Sci. Pollut. Res. 2020, 27, 2677–2690. [Google Scholar] [CrossRef] [PubMed]
  28. Kenny, E.; Samavat, H.; Touger-Decker, R.; Parrott, J.S.; Byham-Gray, L.; August, D.A. Adverse perioperative outcomes among patients undergoing gastrointestinal cancer surgery: Quantifying attributable risk from malnutrition. J. Parenter Enter. Nutr. 2022, 46, 517–525. [Google Scholar] [CrossRef] [PubMed]
  29. Yildiz, L.A.; Gultekingil, A.; Kesici, S.; Bayrakci, B.; Teksam, O. Predictors of severe clinical course in children with carbon monoxide poisoning. Pediatr. Emerg. Care 2021, 37, 308–311. [Google Scholar]
  30. Marvel, S.W.; House, J.S.; Wheeler, M.; Song, K.; Zhou, Y.H.; Wright, F.A.; Reif, D.M. The COVID-19 Pandemic Vulnerability Index (PVI) Dashboard: Monitoring county-level vulnerability using visualization, statistical modeling, and machine learning. Environ. Health Perspect. 2021, 129, 017701. [Google Scholar] [CrossRef]
  31. Omidi Khaniabadi, Y.; Sicard, P.; Omidi Khaniabadi, A.; Mohammadinejad, S.; Keishams, F.; Takdastan, A.; Daryanoosh, M. Air quality modeling for health risk assessment of ambient PM10, PM2.5 and SO2 in Iran. Hum. Ecol. Risk Assess. Int. J. 2019, 25, 1298–1310. [Google Scholar] [CrossRef]
  32. Ghorani-Azam, A.; Riahi-Zanjani, B.; Balali-Mood, M. Effects of air pollution on human health and practical measures for prevention in Iran. J. Res. Med. Sci. Off. J. Isfahan Univ. Med. Sci. 2016, 21, 1–11. [Google Scholar]
  33. Munir, R.; Khayyam, U. China-Pakistan economic Corridor and the Impact of Coal-based energy Projects on tropospheric ozone in Pakistan. Pol. J. Environ. Stud. 2020, 29, 3729–3747. [Google Scholar] [CrossRef]
  34. Khan, W.A.; Shah, S.A.; Khan, A. In Pakistan, the Transport and Urban Air Pollution Impacts on Human Health and Practical Steps to Avoid Them. A Review. J. Int. Cooperation Dev. 2022, 5, 20. [Google Scholar] [CrossRef]
  35. Chen, L.; Li, J.; Pang, X.; Shi, K.; Chen, J.; Wang, J.; Xu, M. Impact of COVID-19 Lockdown on Air Pollutants in a Coastal area of the Yangtze River Delta: China. Measured by Low-Cost Sensor Package. Atmosphere 2021, 12, 345. [Google Scholar] [CrossRef]
  36. Kaur, R.; Pandey, P. Air pollution, climate change, and human health in Indian Cities: A brief review. Front. Sustain. Cities 2021, 3, 705131. [Google Scholar] [CrossRef]
  37. Raza, W.; Saeed, S.; Saulat, H.; Gul, H.; Sarfraz, M.; Sonne, C.; Kim, K.H. A review on the deteriorating situation of smog and its preventive measures in Pakistan. J. Clean. Prod. 2021, 279, 123676. [Google Scholar] [CrossRef]
  38. Filippelli, G.M.; Freeman, J.L.; Gibson, J.; Jay, S.; Moreno-Madrinan, M.J.; Ogashawara, I. Climate change impacts on human health at an actionable scale. A state-level assessment of Indiana, USA. Clim. Chang. 2020, 163, 1985–2004. [Google Scholar] [CrossRef]
  39. Hanninen, O.; Lehtomaki, H.; Korhonen, A.; Rumrich, I.; Asikainen, A. Characterizing the health risks attributable to tropospheric ozone in Finland. JSM Environ. Sci. Ecol. 2016, 4, 1023–1029. [Google Scholar]
  40. Guo, W.; Yang, Y.; Chen, Q.; Zhu, Y.; Zhang, Y.; Zhang, Y.; She, J. Chemical reactivity of volatile organic compounds and their effects on ozone formation in a petrochemical industrial area of Lanzhou, Western China. Sci. Total Environ. 2022, 839, 155901. [Google Scholar] [CrossRef]
  41. Janarthanan, R.; Partheeban, P.; Somasundaram, K.; Elamparithi, P.N. A deep learning approach for prediction of air quality index in a metropolitan city. Sustain. Cities Soc. 2021, 67, 102720. [Google Scholar] [CrossRef]
  42. Jiang, Y.; Xing, J.; Wang, S.; Chang, X.; Liu, S.; Shi, A.; Sahu, S.K. Understand the local and regional contributions on air pollution from the view of human health impacts. Front. Environ. Sci. Eng. 2021, 15, 1–11. [Google Scholar] [CrossRef]
  43. Wang, X.; Zhao, W.; Zhang, T.; Qiu, Y.; Ma, P.; Li, L.; Zhao, W. Analysis of the Characteristics of Ozone Pollution in the North China Plain from 2016 to 2020. Atmosphere 2022, 13, 715. [Google Scholar] [CrossRef]
  44. Arjomandi, M.; Balmes, J.R.; Frampton, M.W.; Bromberg, P.; Rich, D.Q.; Stark, P.; Hazucha, M.J. Respiratory responses to ozone exposure. Moses (the multicenter ozone study in older subjects). Am. J. Respir. Crit. Care Med. 2018, 197, 1319–1327. [Google Scholar] [CrossRef] [PubMed]
  45. Wilkins, J.L.; De Foy, B.; Thompson, A.M.; Peterson, D.A.; Hyer, E.J.; Graves, C.; Fishman, J.; Morris, G.A. Evaluation of Stratospheric Intrusions and Biomass Burning Plumes on the Vertical Distribution of Tropospheric Ozone over the Midwestern United States. J. Geophys. Res. Atmos. 2020, 125, e2020JD032454. [Google Scholar] [CrossRef]
  46. Elena, B.; Moiseenko, K.; Skorokhod, A.; Pankratova, N.V.; Belikov, I.; Belousov, V.; Elansky, N.F. Impact of VOCs and NOx on Ozone Formation in Moscow. Atmosphere 2020, 11, 1262. [Google Scholar] [CrossRef]
  47. Jin, X.; Fiore, A.; Boersma, K.F.; De Smedt, I.; Valin, L. Inferring Changes in Summertime Surface Ozone–NOx–VOC. Chemistry over U.S. Urban Areas from Two 48.Decades of Satellite and Ground-Based Observations. Environ. Sci. Technol. 2020, 54, 6518–6529. [Google Scholar] [CrossRef]
  48. U.S. Census Bureau. American Community Survey 5-Year Estimates Data Profiles. 2019. Available online: https://data.census.gov/cedsci/table?tid=ACSDP5Y2019.DP05&g=310XX00US35620 (accessed on 10 December 2021).
  49. Ninneman, M.; Jaffe, D. Observed Relationship between Ozone and Temperature for Urban Nonattainment Areas in the United States. Atmosphere 2021, 12, 1235. [Google Scholar] [CrossRef]
  50. Kaplan, G.; Avdan, Z.Y. Space-borne air pollution observation from sentinel-5p tropomi: Relationship between pollutants, geographical and demographic data. Int. J. Eng. Geosci. 2020, 5, 130–137. [Google Scholar] [CrossRef]
  51. Wang, P.; Yang, Y.; Li, H.; Chen, L.; Dang, R.; Xue, D.; Liao, H. North China Plain as a hot spot of ozone pollution exacerbated by extreme high temperatures. Atmos. Chem. Phys. 2022, 22, 4705–4719. [Google Scholar] [CrossRef]
Figure 1. (a) indoor and (b) outdoor sampling points at industrial units (Hattar).
Atmosphere 13 02002 g001
Figure 2. SKY 2000-WH-O3 meter.
Atmosphere 13 02002 g002
Figure 3. Variations in ground-level ozone concentrations in different units of food industry from December 2018 to May 2019.
Atmosphere 13 02002 g003
Figure 4. Variations in ground-level ozone concentrations in different units of food industry from June 2019 to November 2019.
Atmosphere 13 02002 g004
Figure 5. Variations in ground-level ozone concentrations in different units of steel industry from December 2018 to May 2019.
Atmosphere 13 02002 g005
Figure 6. Variations in ground-level ozone concentrations in different units of steel industry from June 2019 to November 2019.
Atmosphere 13 02002 g006
Figure 7. Variation of ground-level ozone concentration in different units of oil industry from June 2019 to November 2019.
Atmosphere 13 02002 g007
Figure 8. Variations in indoor and outdoor ground-level ozone concentrations in different units of oil industry from June 2019 to November 2019.
Atmosphere 13 02002 g008
Figure 9. Variations in indoor and outdoor ozone concentrations in different units of food, steel, and oil industries from December 2018 to November 2019.
Atmosphere 13 02002 g009
Figure 10. Comparison of maximum and minimum ozone concentrations with control sites and WHO standard values in Islamabad.
Atmosphere 13 02002 g010
Figure 11. Comparison of maximum and minimum ozone concentrations with control sites and WHO standard values in Haripur.
Atmosphere 13 02002 g011
Figure 12. Comparison of maximum and minimum ozone concentrations with control sites and WHO standard values in Abbottabad.
Atmosphere 13 02002 g012
Figure 13. Comparison of mean concentrations of ozone with control sites and WHO standard values in three megacities of Pakistan.
Atmosphere 13 02002 g013
Figure 14. Disease prevalence associated with ozone exposure in 3 megacities of Pakistan.
Atmosphere 13 02002 g014
Figure 15. Disease prevalence in exposed and non-exposed population of 3 megacities of Pakistan.
Atmosphere 13 02002 g015
Table 1. Attributable proportion of diseases prevalence due to exposure to ozone for industrial units of Hattar Haripur Pakistan (AP%).
Formula Used A P = [ { R R ( c ) 1 } P ( c ) ] [ R R ( c ) P ( c ) ]
Respiratory Diseases D e r m a t o s i s Eye Diseases
A P = [ { R R ( c ) 1 } × P ( c ) ] [ R R ( c ) × P ( c ) ]   
A P = 2.9032 / 4.155
A P % = 69.87 %
A P = [ { R R ( c ) 1 } × P ( c ) ] [ R R ( c ) × P ( c ) ]
A P % = 3.0064 / 4.6924
A P % = 64.06 %
A P = [ { R R ( c ) 1 } × P ( c ) ] [ R R ( c ) × P ( c ) ]
A P = 0.21078 / 0.9878
A P % = 21.33 %
Publisher’s Note: MDPI stays neutral with regard to jurisdictional claims in published maps and institutional affiliations.

