Article

Radon Transport, Accumulation Patterns, and Mitigation Techniques Applied to Closed Spaces

1
Department of Construction, Eduardo Torroja Institute for Construction Science, Spanish National Research Council, 28033 Madrid, Spain
2
Faculty of Sciences, University of Cantabria, 39005 Santander, Spain
3
Department of Acoustics and Non-Destructive Evaluation, Institute for Physical and Information Technologies “Leonardo Torres Quevedo”, Spanish National Research Council, 28006 Madrid, Spain
*
Author to whom correspondence should be addressed.
Atmosphere 2022, 13(10), 1692; https://doi.org/10.3390/atmos13101692
Submission received: 25 August 2022 / Revised: 30 September 2022 / Accepted: 10 October 2022 / Published: 16 October 2022
(This article belongs to the Special Issue Radon and NORM: Impact on Air Quality)

Abstract

:
In this study, different techniques for the mitigation of radon gas in indoor spaces were investigated. For this purpose, two different scenarios of a public building were analyzed: two symmetrical facility galleries and a reverberation chamber. Although most workplaces in this building have low radon levels, the complex structure houses spaces have very high radon concentrations. The study also included the surrounding areas of these spaces. The radon concentration and differential pressures were measured, and different mitigation techniques were applied: sealing, balanced ventilation, pressurization with the introduction of fresh air, and depressurization over each space. The pressurization solution was proven to be the most effective way to reduce radon concentration in both scenarios. The introduction of fresh air diluted the radon concentration, and the slight increase in the pressure reduced the entry of gas by the advection mechanism. On the other hand, the depressurization technique was the least effective mitigation technique, as it generated a negative pressure gradient that facilitated a higher radon flux from the source. Therefore, before applying any mitigation technique, it is necessary not only to study the space to be remediated but also the possible impact on neighboring spaces.

1. Introduction

Radon (222Rn) is a naturally occurring radioactive gas. Radon decays into radioactive elements called radon progeny. These elements can be inhaled into the lungs, which is the main cause of lung cancer after smoking [1] and the first in non-smokers [2].
Due to the high presence of radon in various soils, the gas seeps into indoor spaces [3,4]. According to [5], there are two basic radon entry mechanisms: diffusion due to the radon concentration gradient in the environment and advection caused by the pressure difference between the building envelope and the outside atmosphere [6,7]. Radon is approximately 7.5 times heavier than air. It concentrates in basements or ground floors and can be transmitted to upper levels by transport processes and human activity [8]. The concentration of radon indoors can vary according to the climate, the season, and the presence of water in soil [9,10,11], and it is important to carry out a study over time in order to cover different situations.
Common radon mitigation methods include sealing and radon membranes, the ventilation of indoor spaces, and sump depressurization systems or underfloor ventilation [12]. These have been widely studied in houses and small spaces [13,14]. Furthermore, the monitoring results obtained from real models with controlled conditions can be extrapolated to real buildings.
Radon mitigation techniques must be customized for each particular building, becoming more complicated when applied to singular buildings, such as old buildings, where plans and/or technical information are not available. Buildings with poor ventilation that remain closed after working time used to have higher levels than residential places [15]. Better construction and improved ventilation methods reduced radon levels in workplaces [16]. At the same time, the direct application of radon mitigation systems can be difficult due to their large dimensions.
According to a pilot study performed in Spain [17], around 23.5% of public administration buildings studied had radon levels greater than 300 Bq/m3. These levels depended mainly on the materials and construction techniques and the state of preservation of the building [18]. The presence of cracks and damage in the building envelope increases the exchange of radon between the spaces.
Another case is the study of radon levels in underground spaces. Indoor air quality has been studied in settings such as tunnels [19], caves [20,21], and underground galleries and shelters [22]. In these cases, the main source of radon was the soil and underground walls. A lack of ventilation leads to higher radon concentrations. At the same time, old buildings lack effective isolation from the ground. Although the radon diffusion coefficient of bricks is about one-tenth of the radon diffusion coefficient of soils [23], traditional masonry walls exhibit small cracks and construction flaws, which can increase radon entries [24].
The measurement and control of air quality today have growing relevance for public and heritage buildings, even if the application of remediation techniques is not always easy [24,25,26,27]. In this study, we analyzed the radon levels and accumulation patterns in different places of a public research center, the Institute for Physical and Information Technologies “Leonardo Torres Quevedo” in Madrid, Spain. The main objective was to analyze the effectiveness of different methods to reduce radon levels in selected closed spaces: two symmetrical underground galleries and a reverberation chamber situated aboveground, which is very airtight. Although most of the workplaces in this building have radon levels below 300 Bq/m3, the complex structure houses spaces with very high concentrations of radon. Additionally, the study included the surroundings of these spaces: an office and an underground corridor neighboring the two galleries and another office and spaces surrounding the reverberation chamber. The radon concentrations and differential pressures were measured while applying different mitigation techniques: sealing, ventilation, pressurization, and depressurization on each space.

2. Materials and Methods

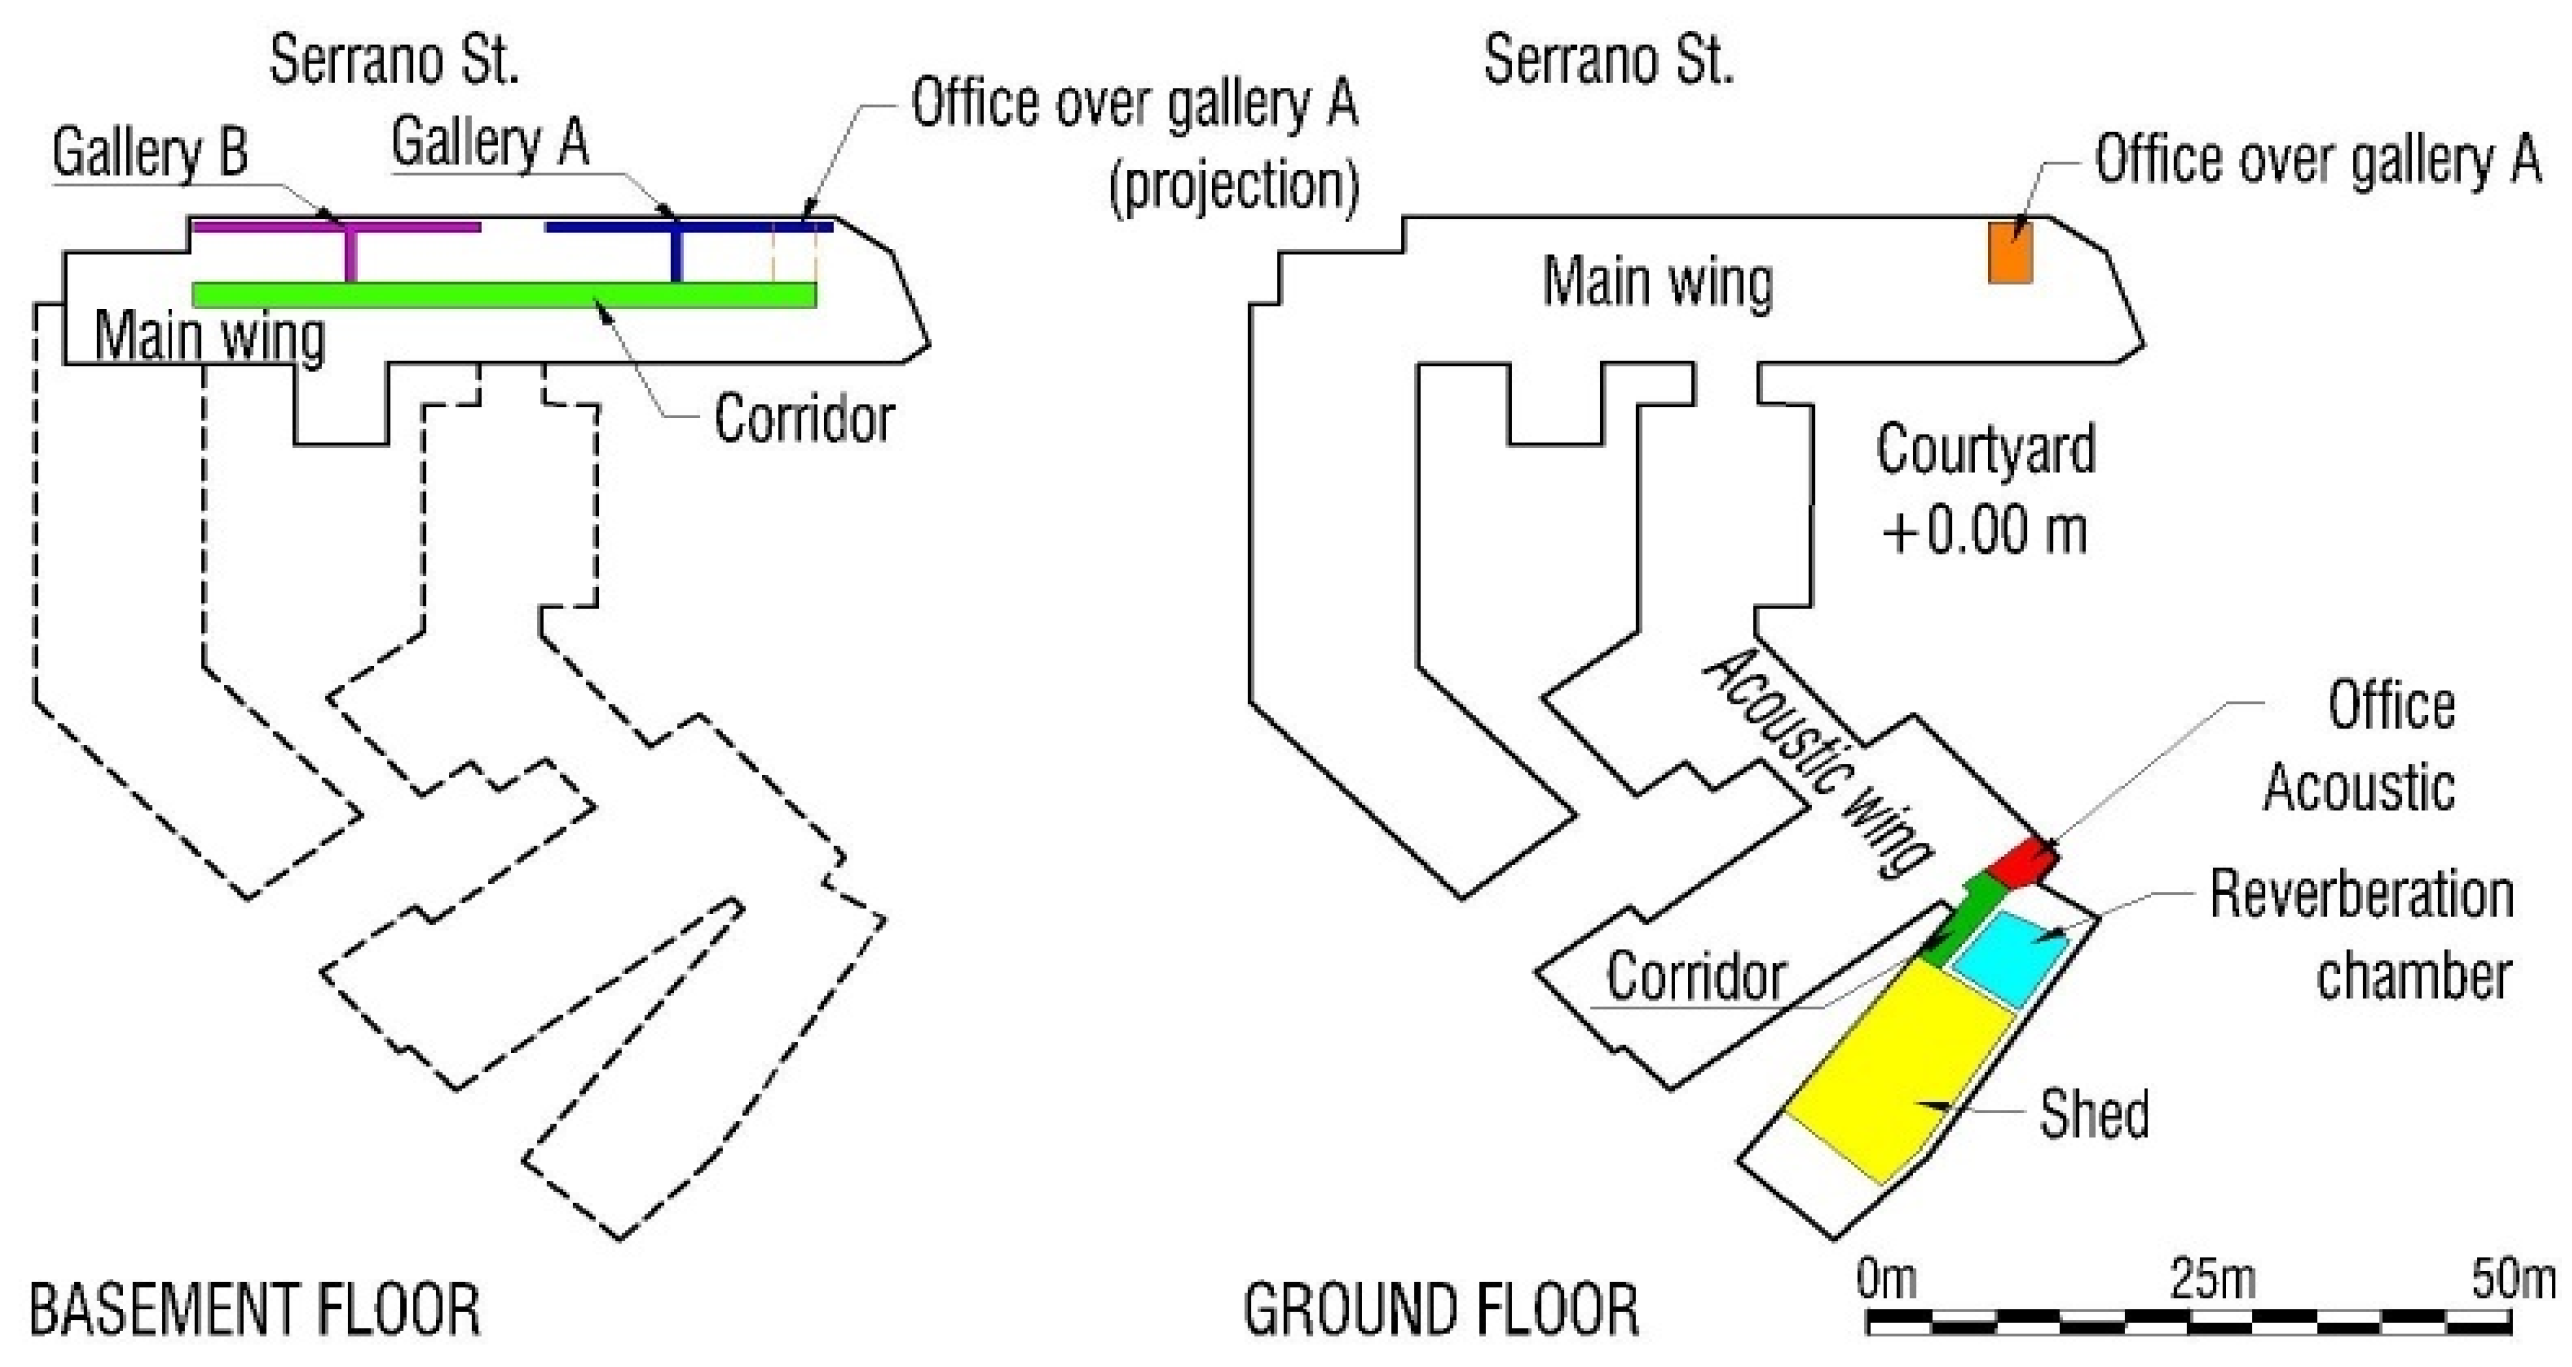
2.1. Construction under Study

In this work, the measurements were made in a historical building built in 1944, the Institute for Physical and Information Technologies Torres Quevedo (ITEFI). This building has always been a public research center and currently belongs to the Spanish National Research Council (CSIC). The building, located in Madrid, Spain, is situated on a plot of coarse-grained clayey sand and a brownish-reddish clayey soil [28]. The soil was classified as having a medium potential risk of radon, according to [29].
The building is made up of different wings with laboratories and offices. The spaces studied are in the main wing and the acoustic wing (Figure 1). In the main wing, the mitigation system acts on a gallery located in the semi-basement. The influence of the mitigation actuation in the symmetrical gallery, a corridor that provides access to both galleries, and an office on the ground floor, placed above one of the galleries, was studied. In the acoustic wing, the mitigation system acts on a reverberation chamber. The influence of the mitigation actuation was studied in an office near the chamber and the corridor that connects both spaces. The reference for the differential pressure measurements was placed in a neighboring shed. The characteristics of each space can be seen in Table 1.

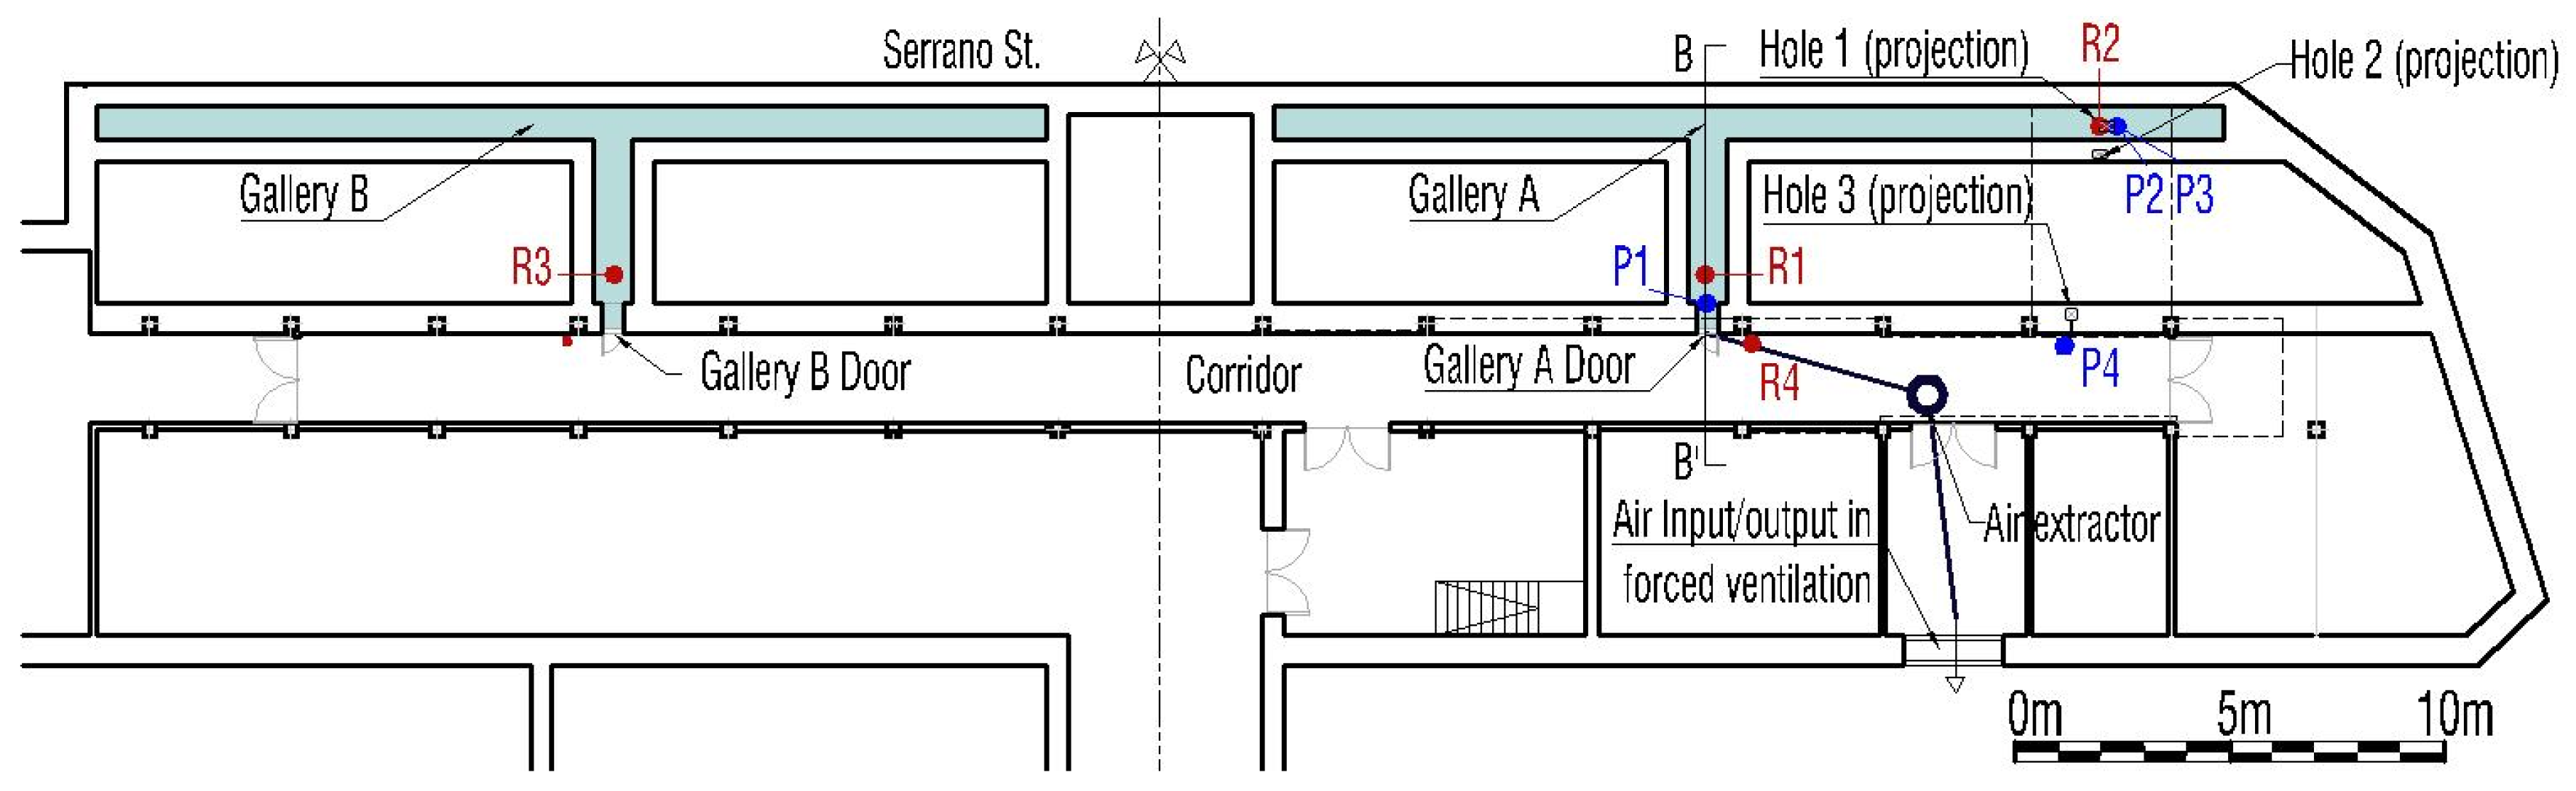
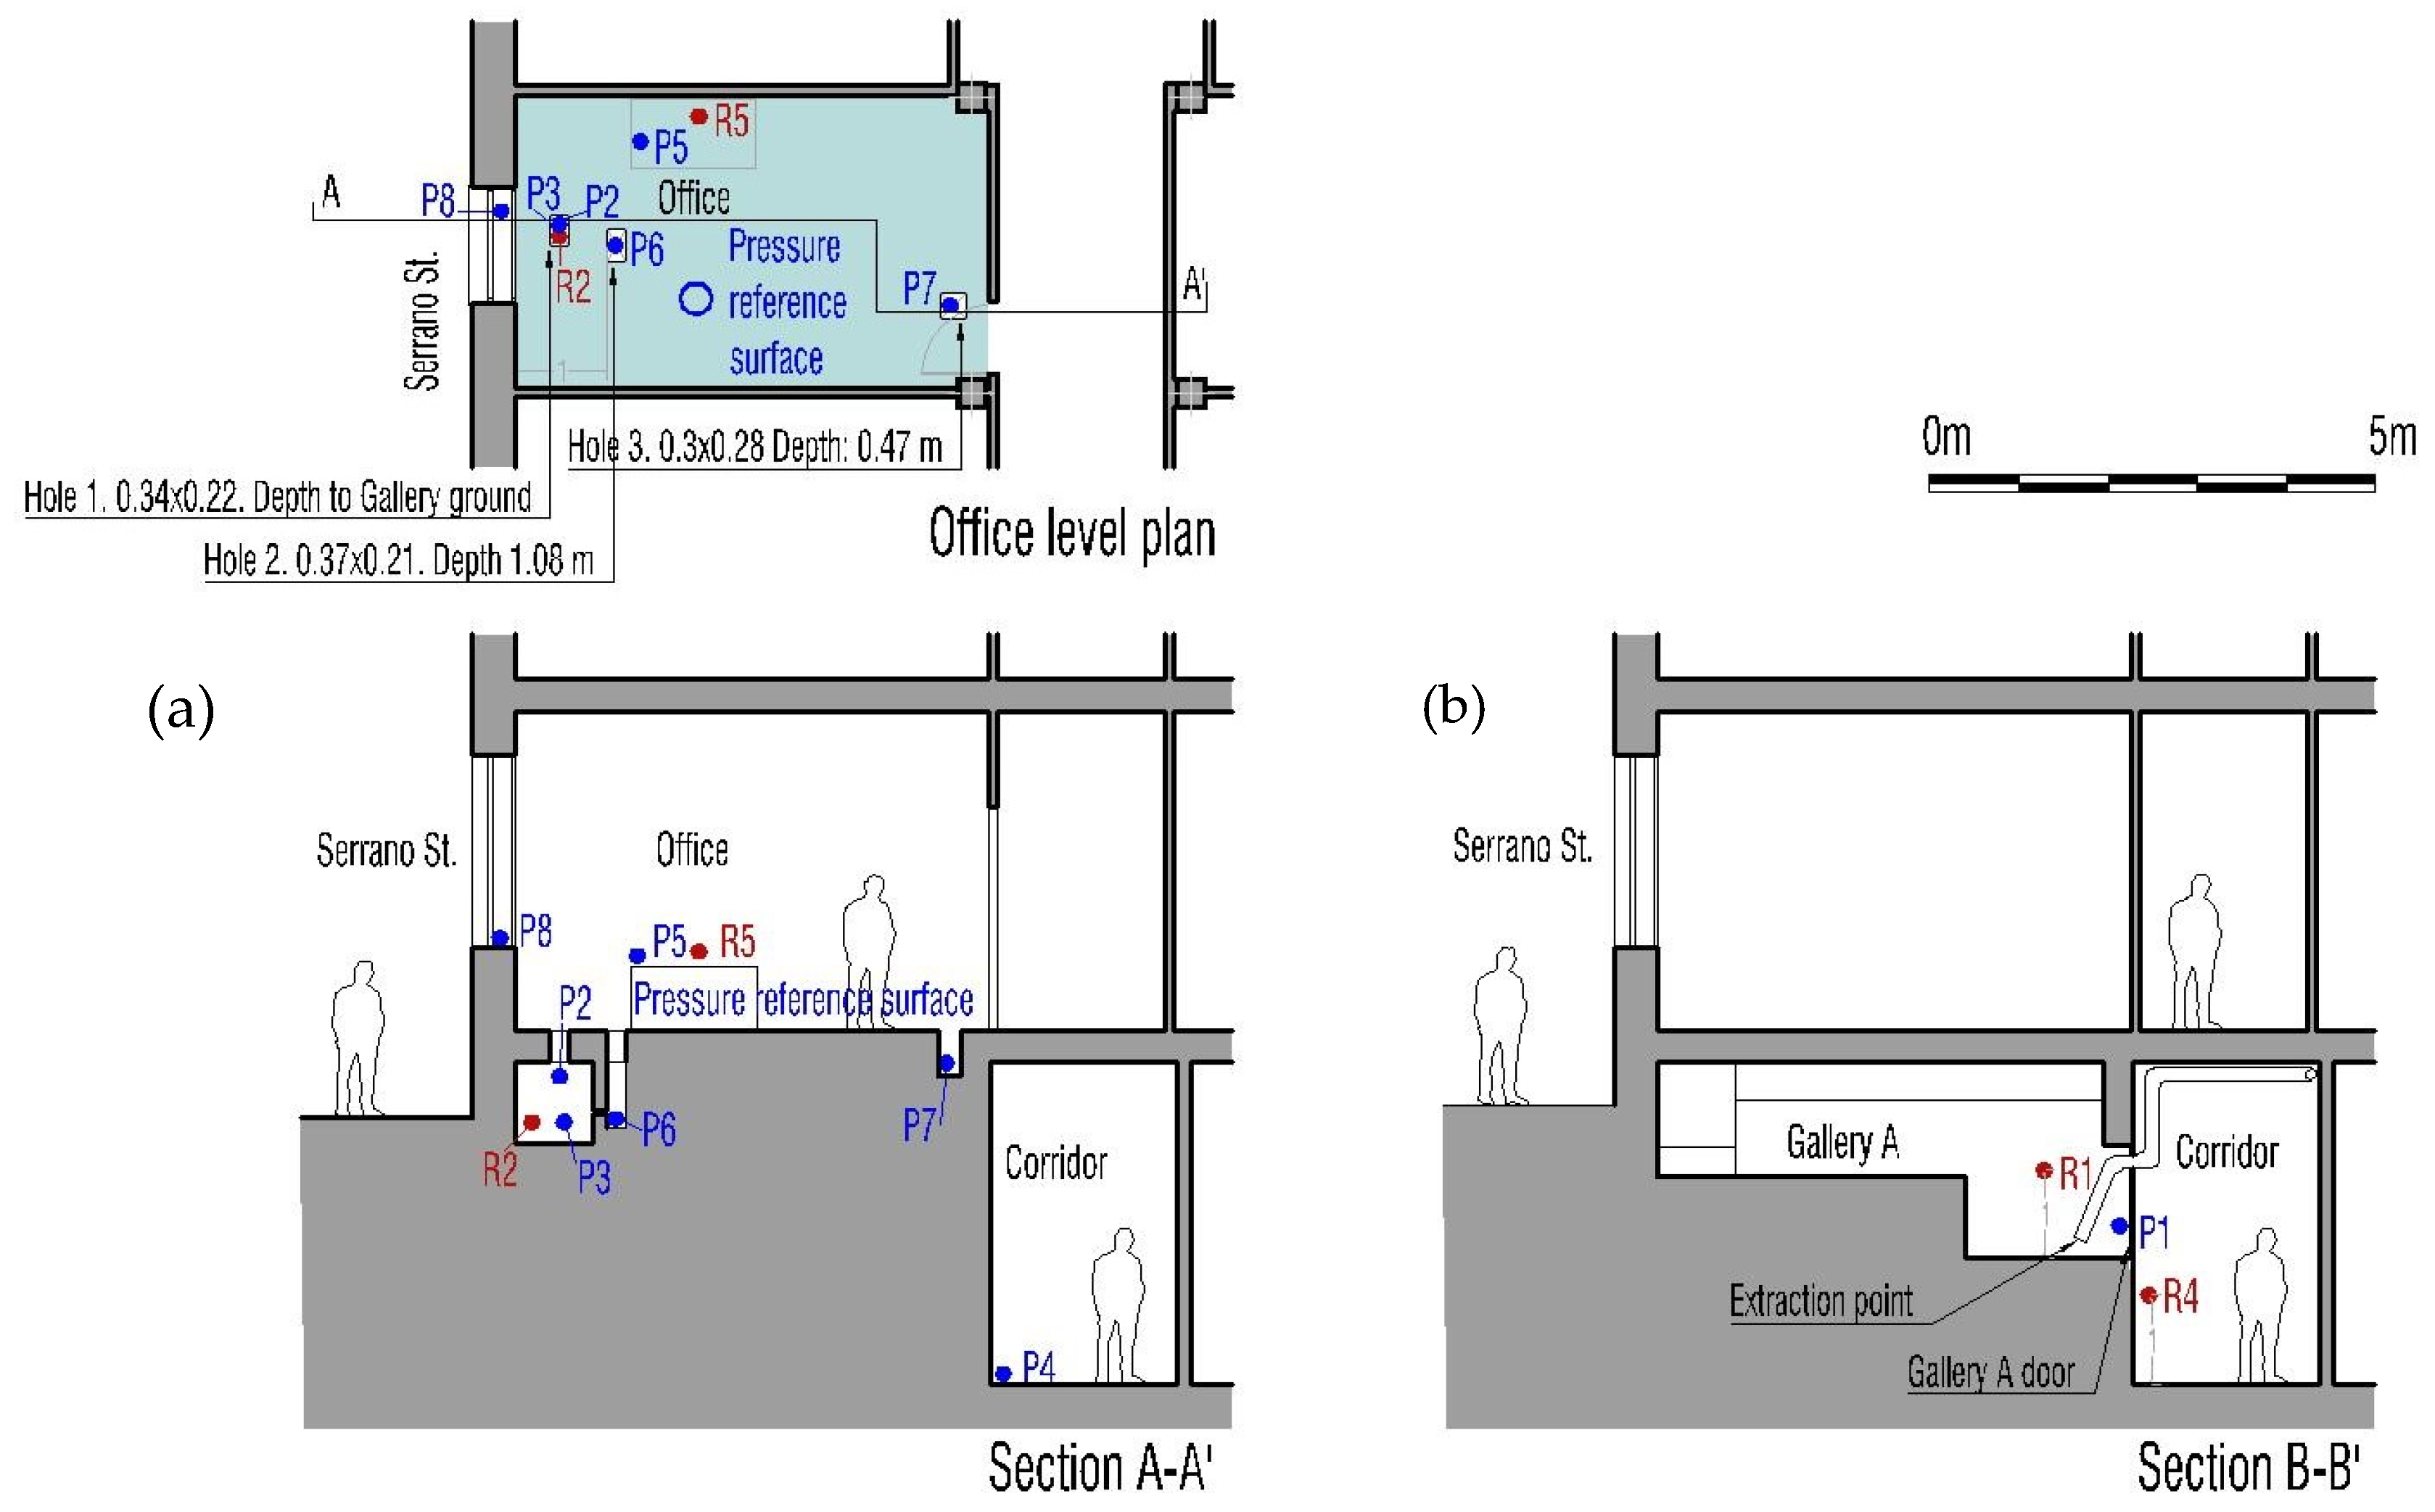
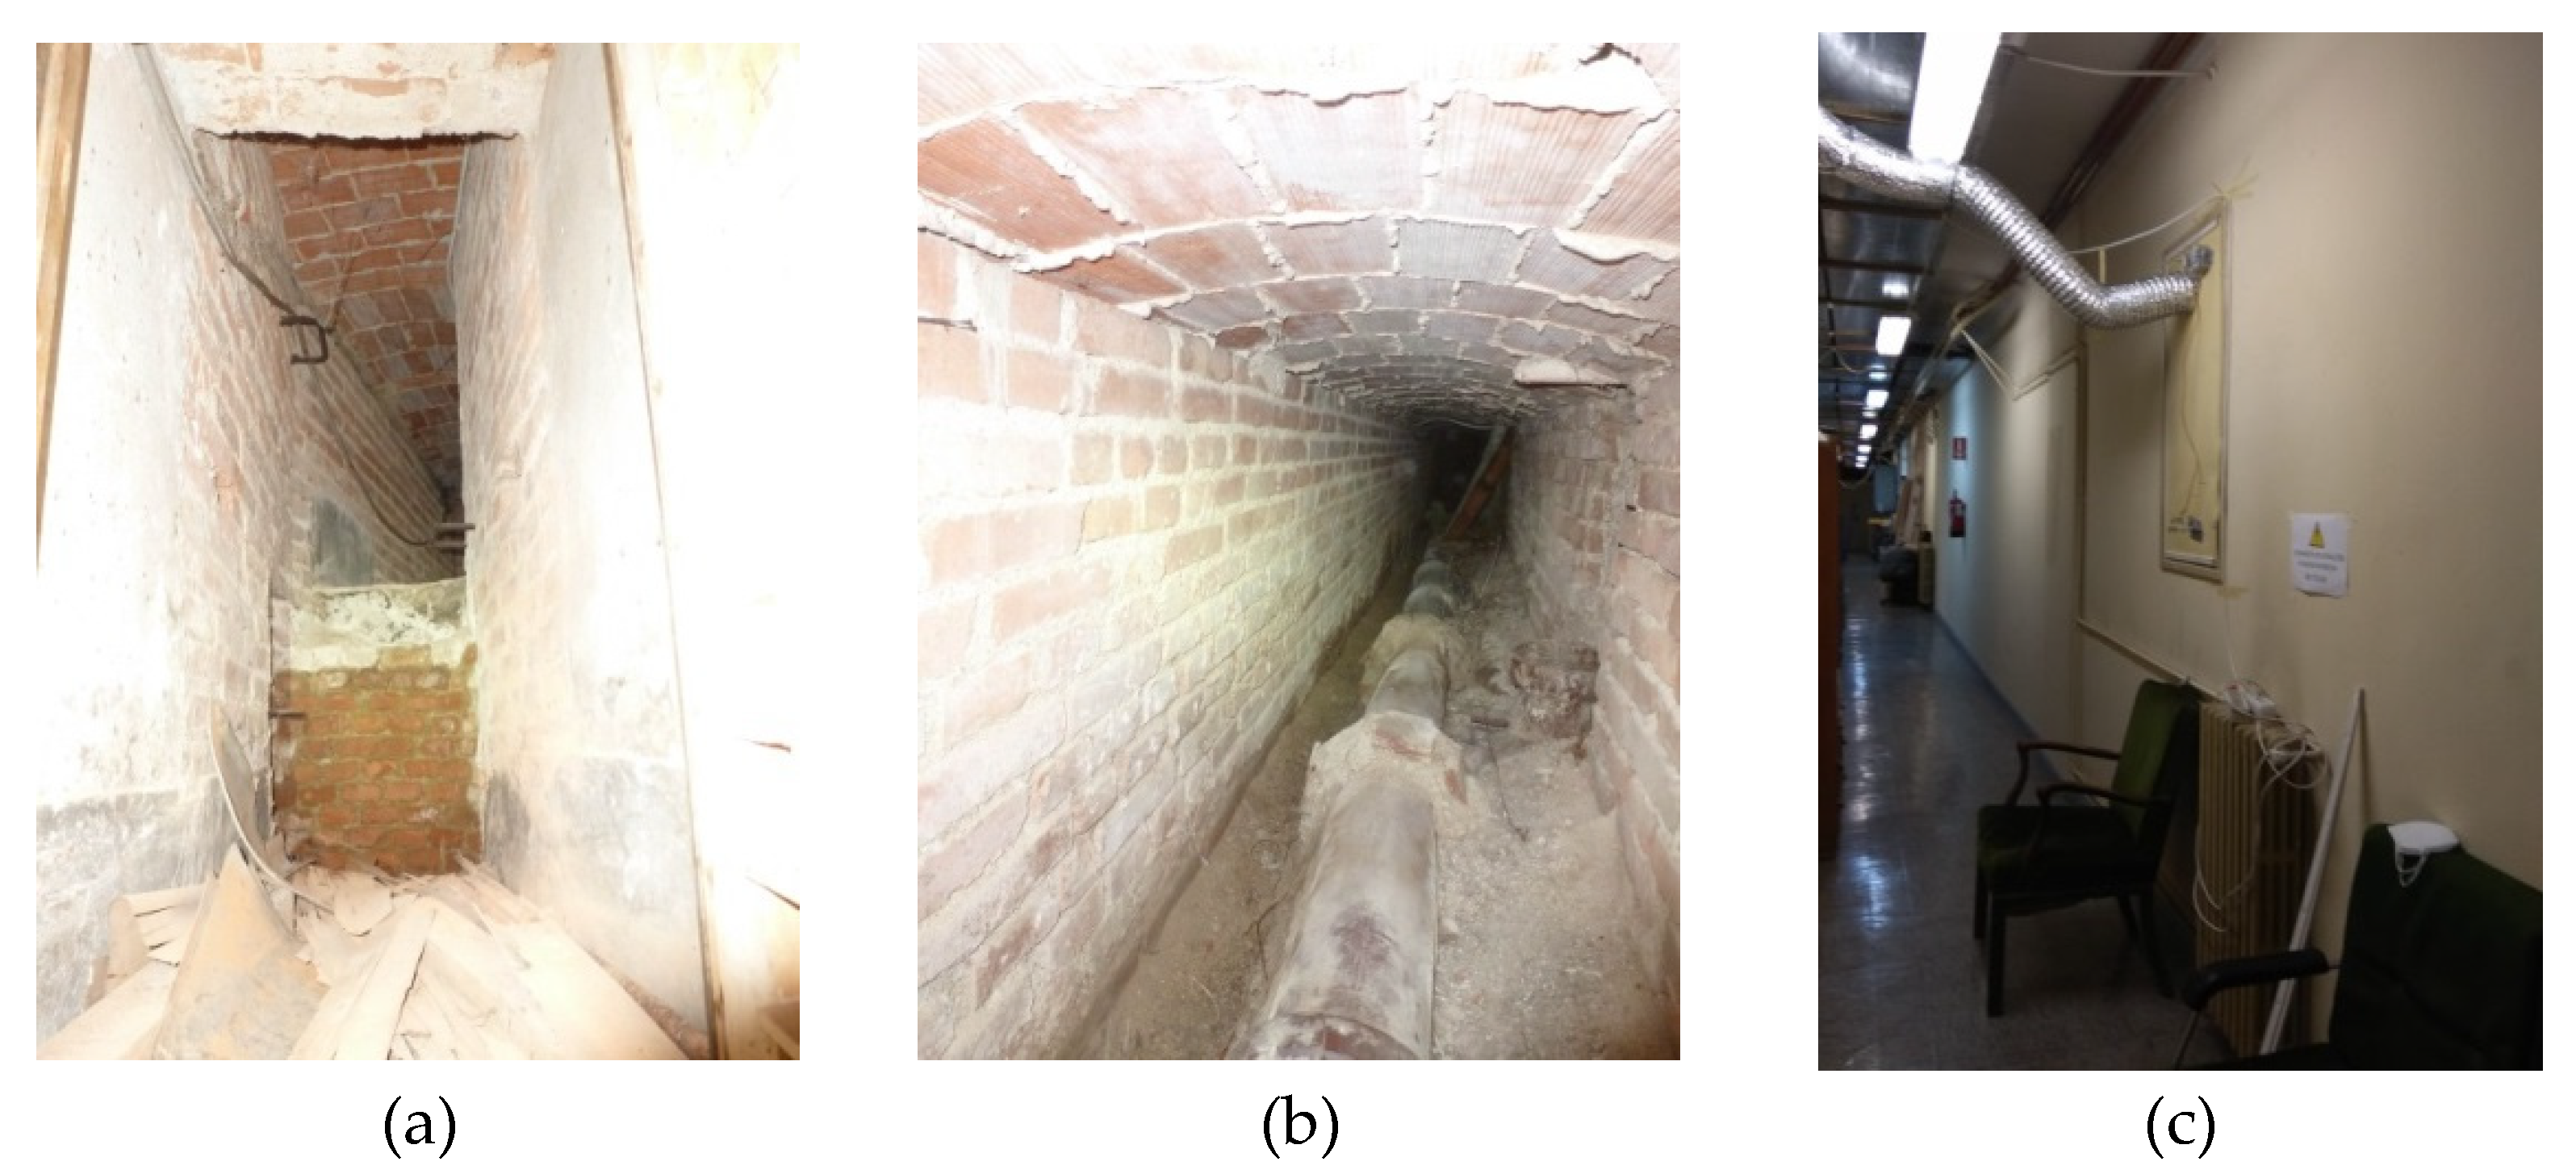
2.1.1. Main Wing: Galleries and Adjacent Spaces

The galleries are in the main wing, behind the west façade. They are two symmetrical areas, with an axis of symmetry in the middle of the main entrance (Figure 2). Gallery A is in the north position, and Gallery B is in the south. Both spaces are T-shaped. The two galleries are physically independent.
The galleries are slightly below the street level. The corridor is around 1.30 m below street level (Figure 3). Both galleries were built as facilities and equipment spaces, each with a small door leading to the basement corridor. The enclosure of the galleries is solid brick (Figure 4). The unknown state of conservation of the galleries prevents entry for an in-depth assessment.
The doors of both galleries and the holes placed in the first-floor office were completely sealed with a flexible radon-proof polyolefin sheet (with a diffusion coefficient of less than 1 × 10⁻¹¹ m2/s).

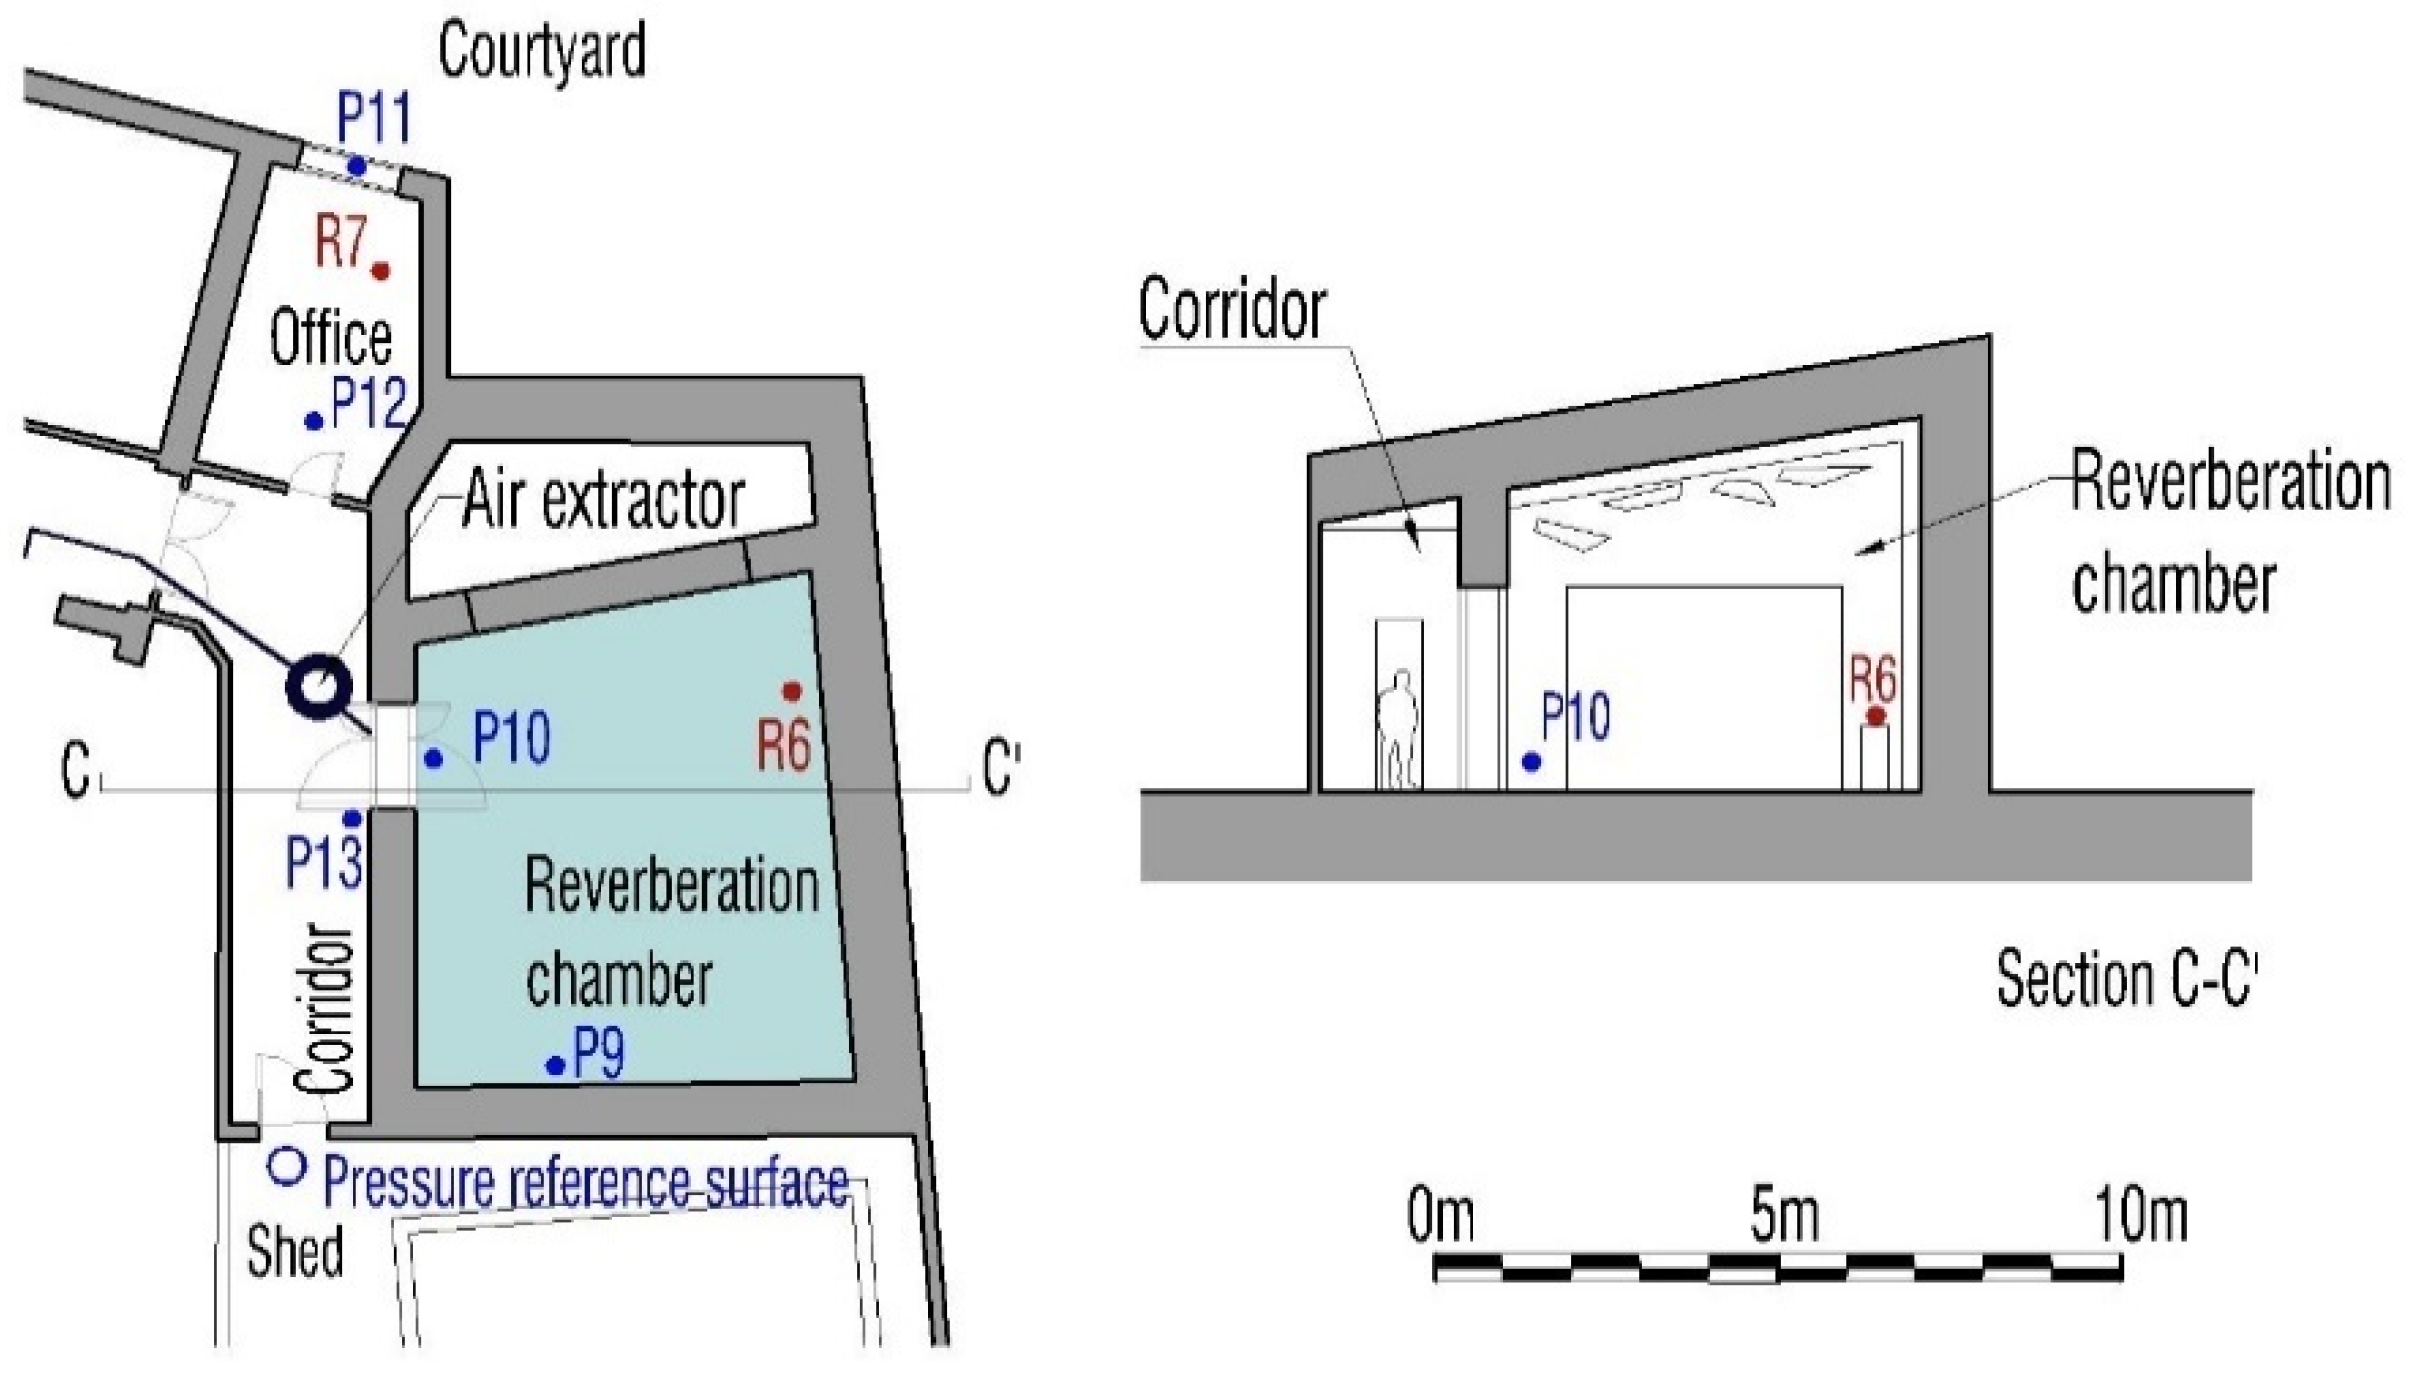
2.1.2. Acoustic Wing: Reverberation Chamber and Adjacent Spaces

This area is a single story. The reverberation chamber is an isolated space with a rhomboid shape (Figure 5). The floor is built over a concrete slab. As an acoustic chamber, the space is completely isolated and highly airtight.
The radon levels were checked in the reverberation chamber and the office. The differential pressure levels were checked in the reverberation chamber, the office, and the corridor that connects both spaces.

2.2. Sensors and Data Acquisition Systems

In this section, the sensors and data acquisition systems used in the experiments are presented. The radon levels, differential pressure, temperature, and relative humidity were monitored in different areas. For this purpose, 3 different systems were used: a radon measuring system, a radon extraction system, and a differential pressure system. Some of these systems were developed by the authors.

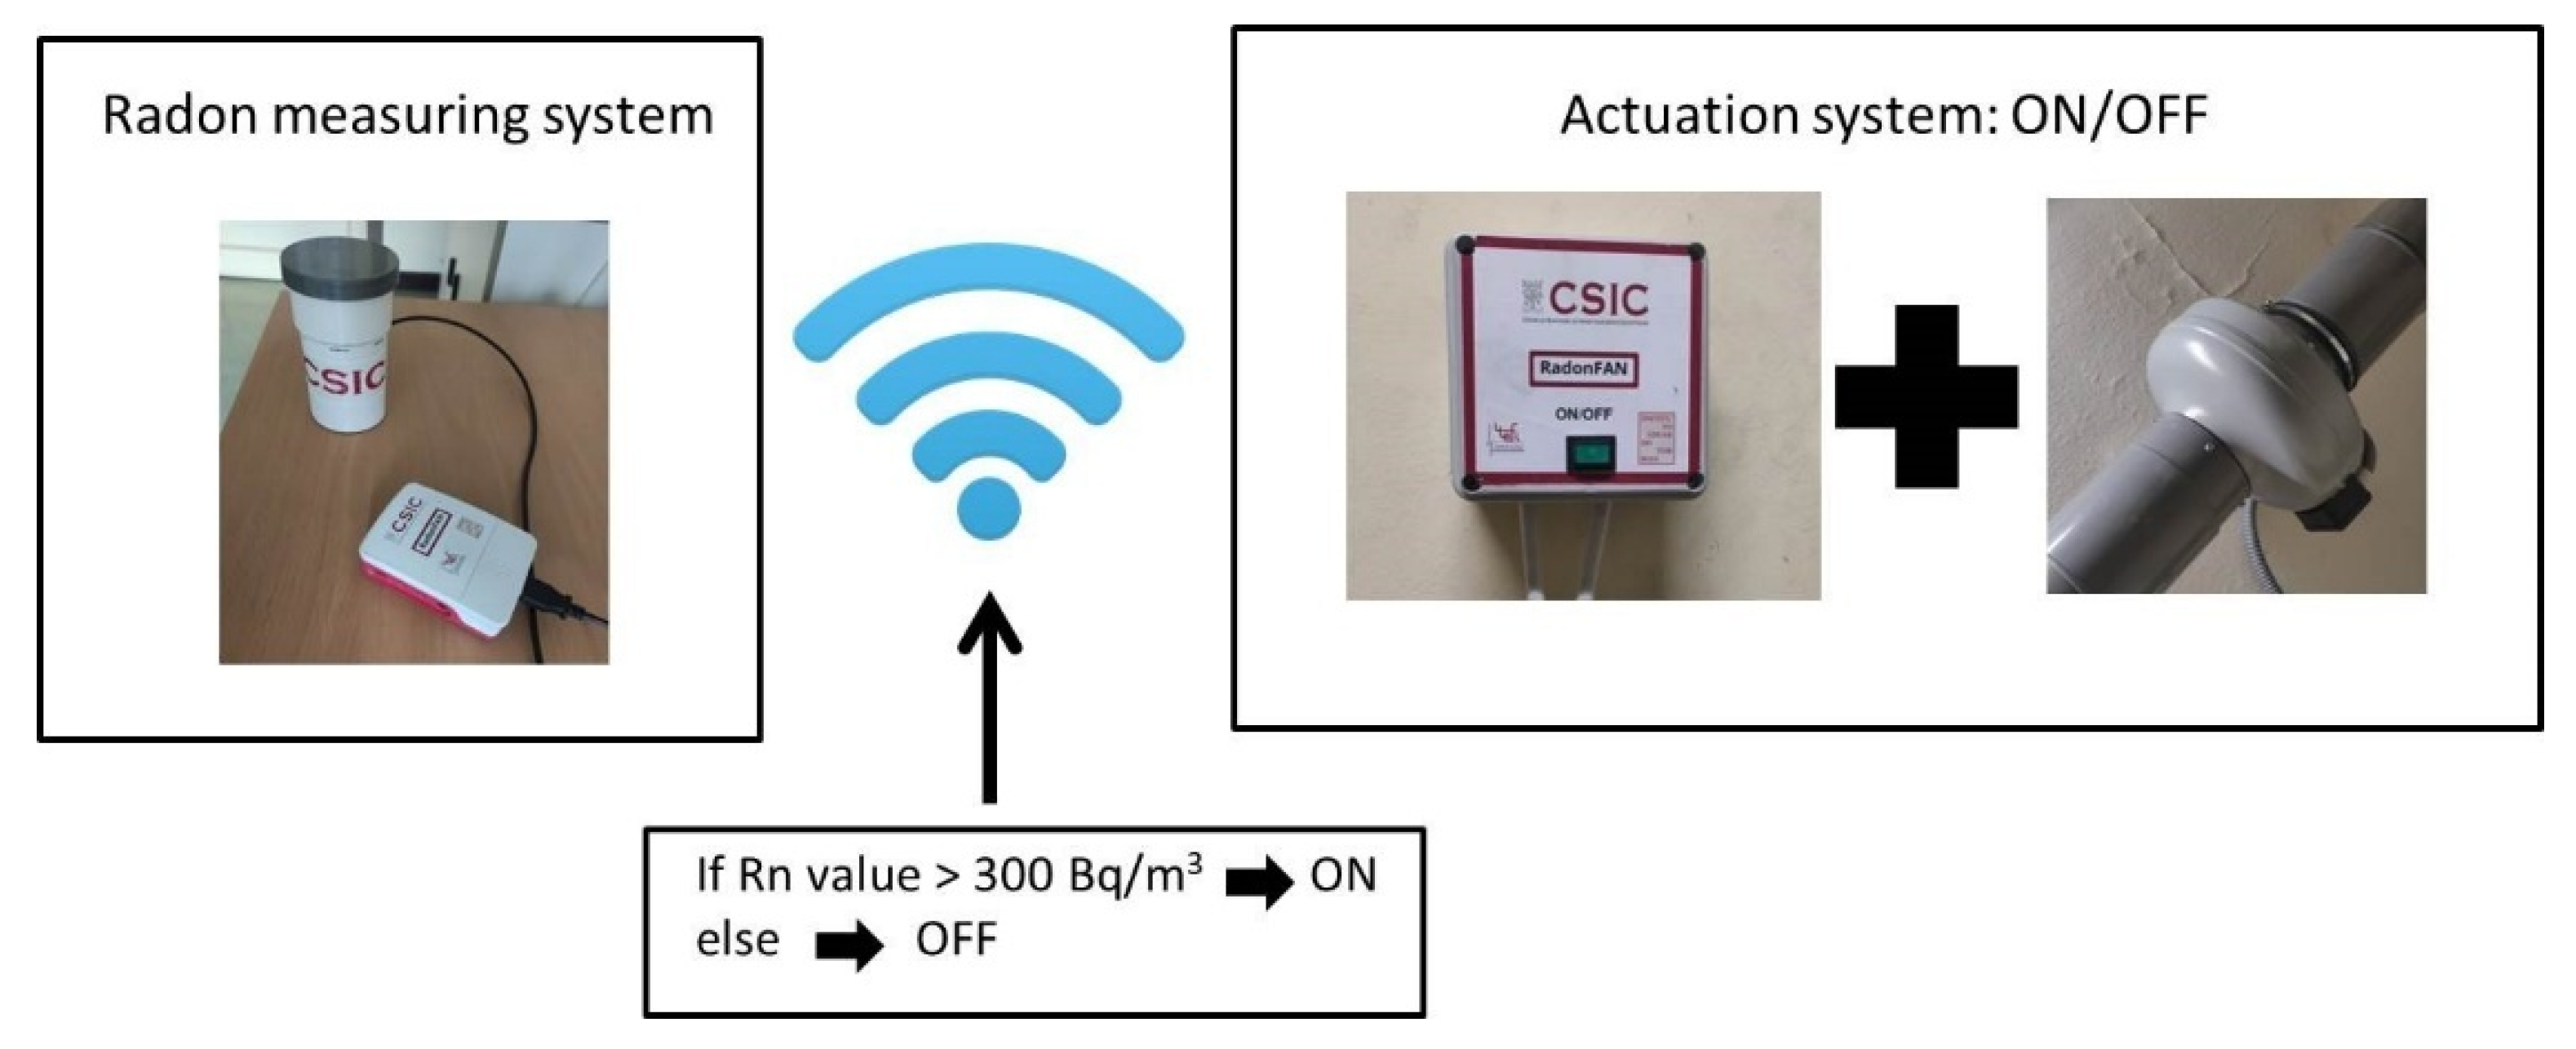
2.2.1. Radon Measuring System

Several commercial radon systems from the FTLab Company, based on the pulsed ionization chamber method, were used to measure the radon values at different places. These included two Radon Eye smart radon detectors connected to Wi-Fi and two Radon Eye detectors connected via Bluetooth with readings every hour. The Radon Eye + detectors also include a temperature and humidity sensor.

2.2.2. Radon Extraction System

A wireless system was designed and developed by the authors to extract radon gas from the interior of buildings. This system is composed of 2 subsystems: the system in charge of monitoring the radon data (radon measuring system) and the system for activating or deactivating a fan to extract the gas (actuation system). An IoT protocol called MQTT is used to communicate between both systems.
Radon measuring system
The designed monitoring system (Figure 6) is based on a calibrated RD200M radon sensor from the FTLab Company connected to a Raspberry Pi 3 B+. The Raspberry is in charge of measuring the radon value every 10 min, saving it in a file, and publishing the value in a topic using MQTT. In case the radon value is greater than the threshold, the Raspberry also publishes an alarm in a different topic to be read by the fan system.
Actuation system
The actuation system is composed of an MKR1000 Arduino connected to a two directions centrifugal air extractor Siber AXC 150A (Figure 6). The Wi-Fi connection of the MKR1000 module is configured for the first time automatically by the Raspberry. After that, the system waits for an alarm to activate the fan. For this purpose, Arduino software is perpetually listening for the alarm using the MQTT protocol.
The 70 W extractor has a maximum flow for ventilation of 195 m3/h. In pressurization and depressurization tests, the ideal flow tends to be 0. The extractor produces a theoretical maximum positive or negative pressurization of 343 Pa (zero flow). The air extractor was connected to a flexible air duct. The connection was completely sealed to prevent flow leakages. The exhaust fan forced indoor air to the outside for the depressurization tests and drew in fresh outside air for the pressurization and ventilation tests.
The extraction system is connected to Gallery A through a hole made in the door. The ventilation test was carried out by opening the hole that connects the gallery and the office and by opening the office window.
In the test carried out in the reverberation chamber, the door was replaced by a cardboard surface suitable for connecting the extraction system. This surface was completely closed and sealed. The pressurization and depressurization tests were carried out towards a single hole, while for the ventilation test, an additional hole was made to provide fresh air inside.

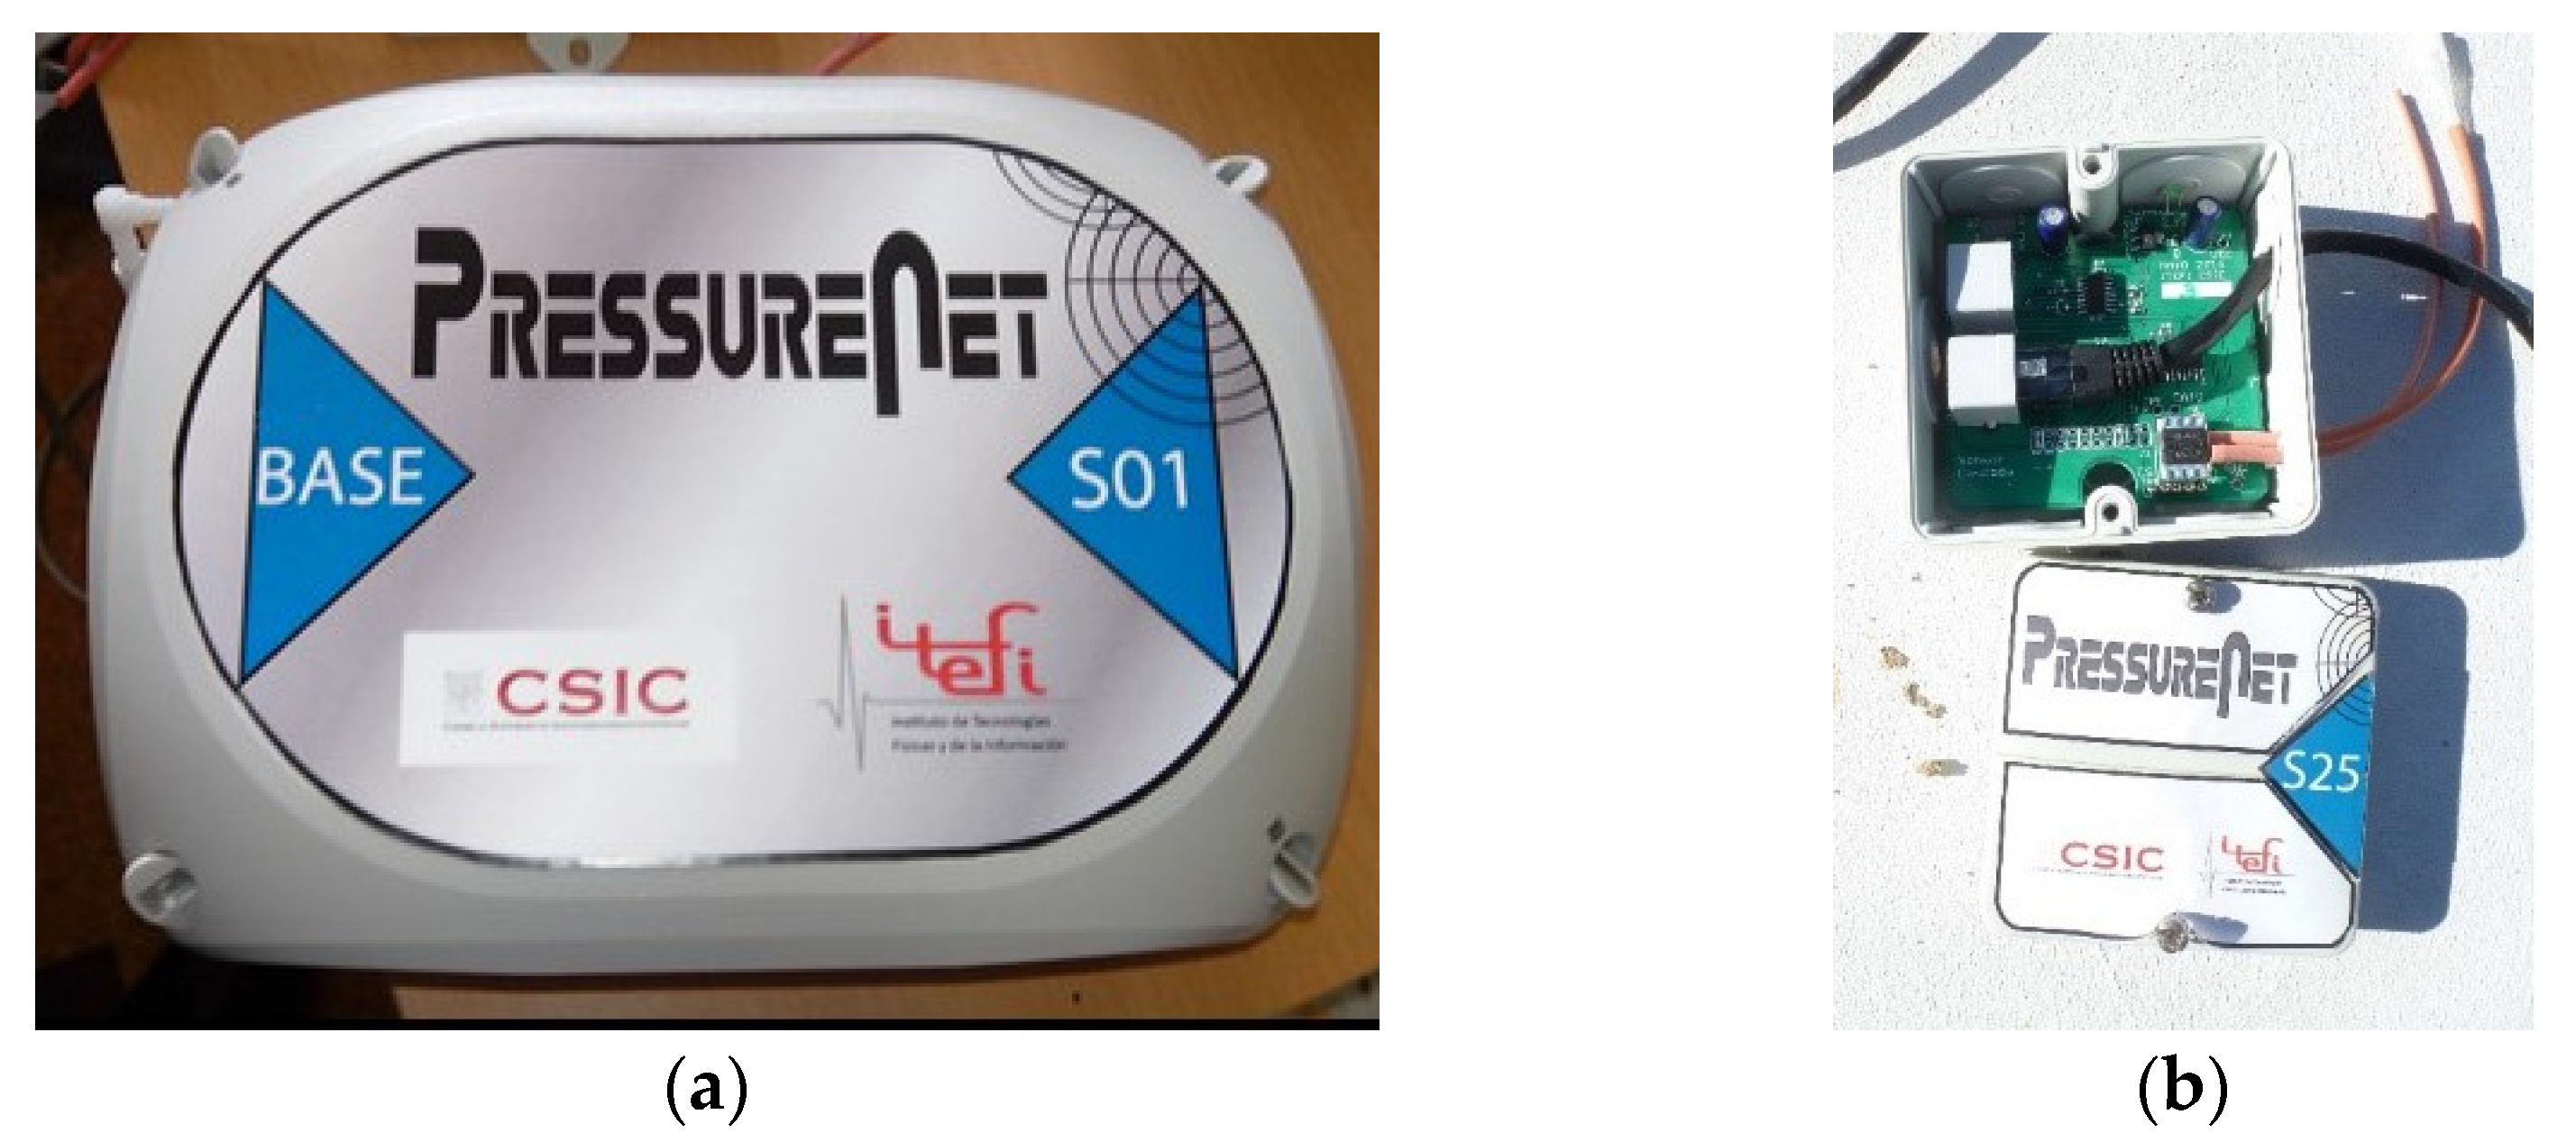
2.2.3. Differential Pressure system

A multi-sensor system (Figure 7) designed and developed by the authors to measure differential pressures in radon gas transport studies was also used in these experiments. This system is composed of 10 pressure sensors, as described in [30]. The data are collected every 10 min.
The position of each sensor is described in Table 2 and Figure 3 and Figure 5.

3. Experiments

Different experiments were performed in the galleries of the main wing and the reverberation chamber of the acoustic wing.

3.1. Tests in Galleries

Tests in the galleries were carried out to determine the radon concentration levels and the influence of the remediation practice on adjoining living spaces. The holes created for the first radon inspection were sealed. The doors were reinforced with a radon-proof sheet. For this purpose, different tests were carried out to determine the influence of pressurization, depressurization, and ventilation actions on the air quality in Gallery A. During the test, the radon concentration and differential pressure data at different points were recorded (Figure 3 and Table 2). Each experiment lasted for at least a week.
  • Pressurization test: The fan drove fresh air into Gallery A, increasing the indoor pressure.
  • Forced ventilation test: The fan extracted the air from Gallery A, forcing the ventilation of the space through the office window.
  • Depressurization test: The fan extracted exhaust air from Gallery A, reducing the internal pressure.
  • Natural one-sided ventilation: Gallery A was connected to the outside through a flexible duct that allowed for the exchange of naturally driven air with the outside.
  • Natural state (reference state): The radon concentrations and pressure levels were measured with the gallery completely closed and sealed. The mitigation systems were disabled. This state is considered to be the reference state for all the experiments.

3.2. Tests in Reverberation Chamber

Tests in the reverberation chamber and the nearest office were conducted to find the influence of natural ventilation on reducing radon levels. At the same time, the reverberation chamber was used to analyze the behavior of radon levels in a completely closed space. The indoor radon levels were outside the healthy limits, so the work focuses on establishing remedial actions to achieve a reduction in the radon concentration. The positions of the sensors can be seen in Figure 5. The experiments carried out in these areas included the following:
  • Initial data: The radon data were recorded in the office and reverberation chamber using two Radon Eye RD200 detectors. The differential pressure data were recorded with pressure sensor equipment. The reverberation chamber maintained normal work activity.
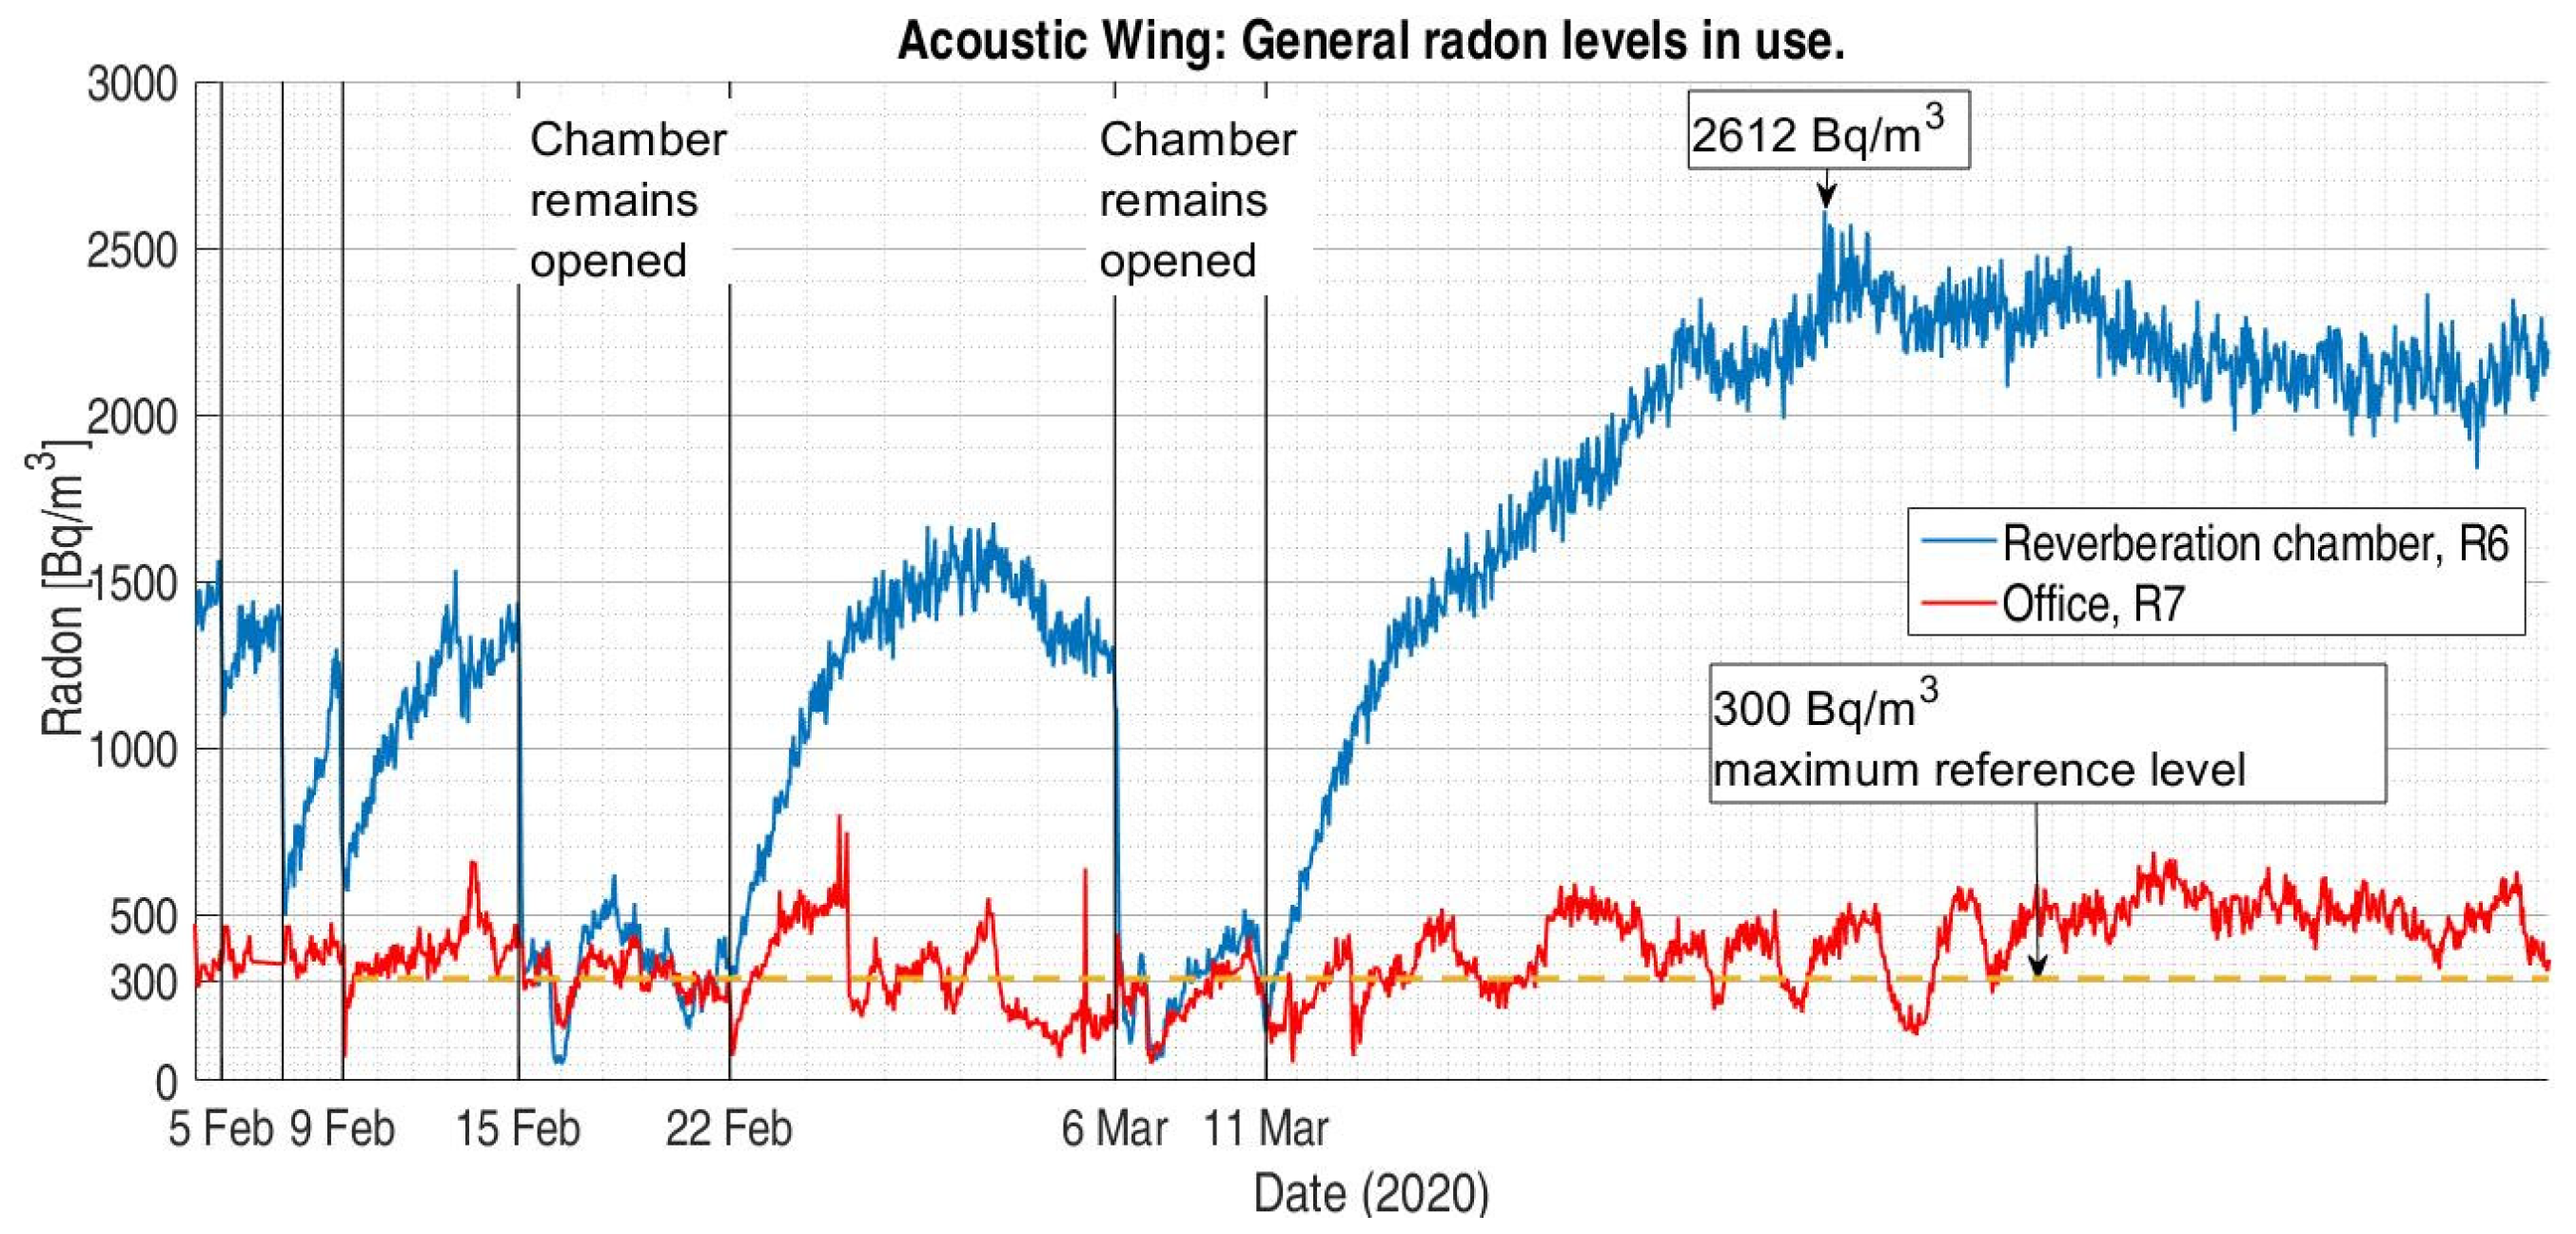
  • Steady test: The evolution of the radon levels in a completely closed space over a long period of time was determined to establish the maximum radon levels reached in the reverberation chamber.
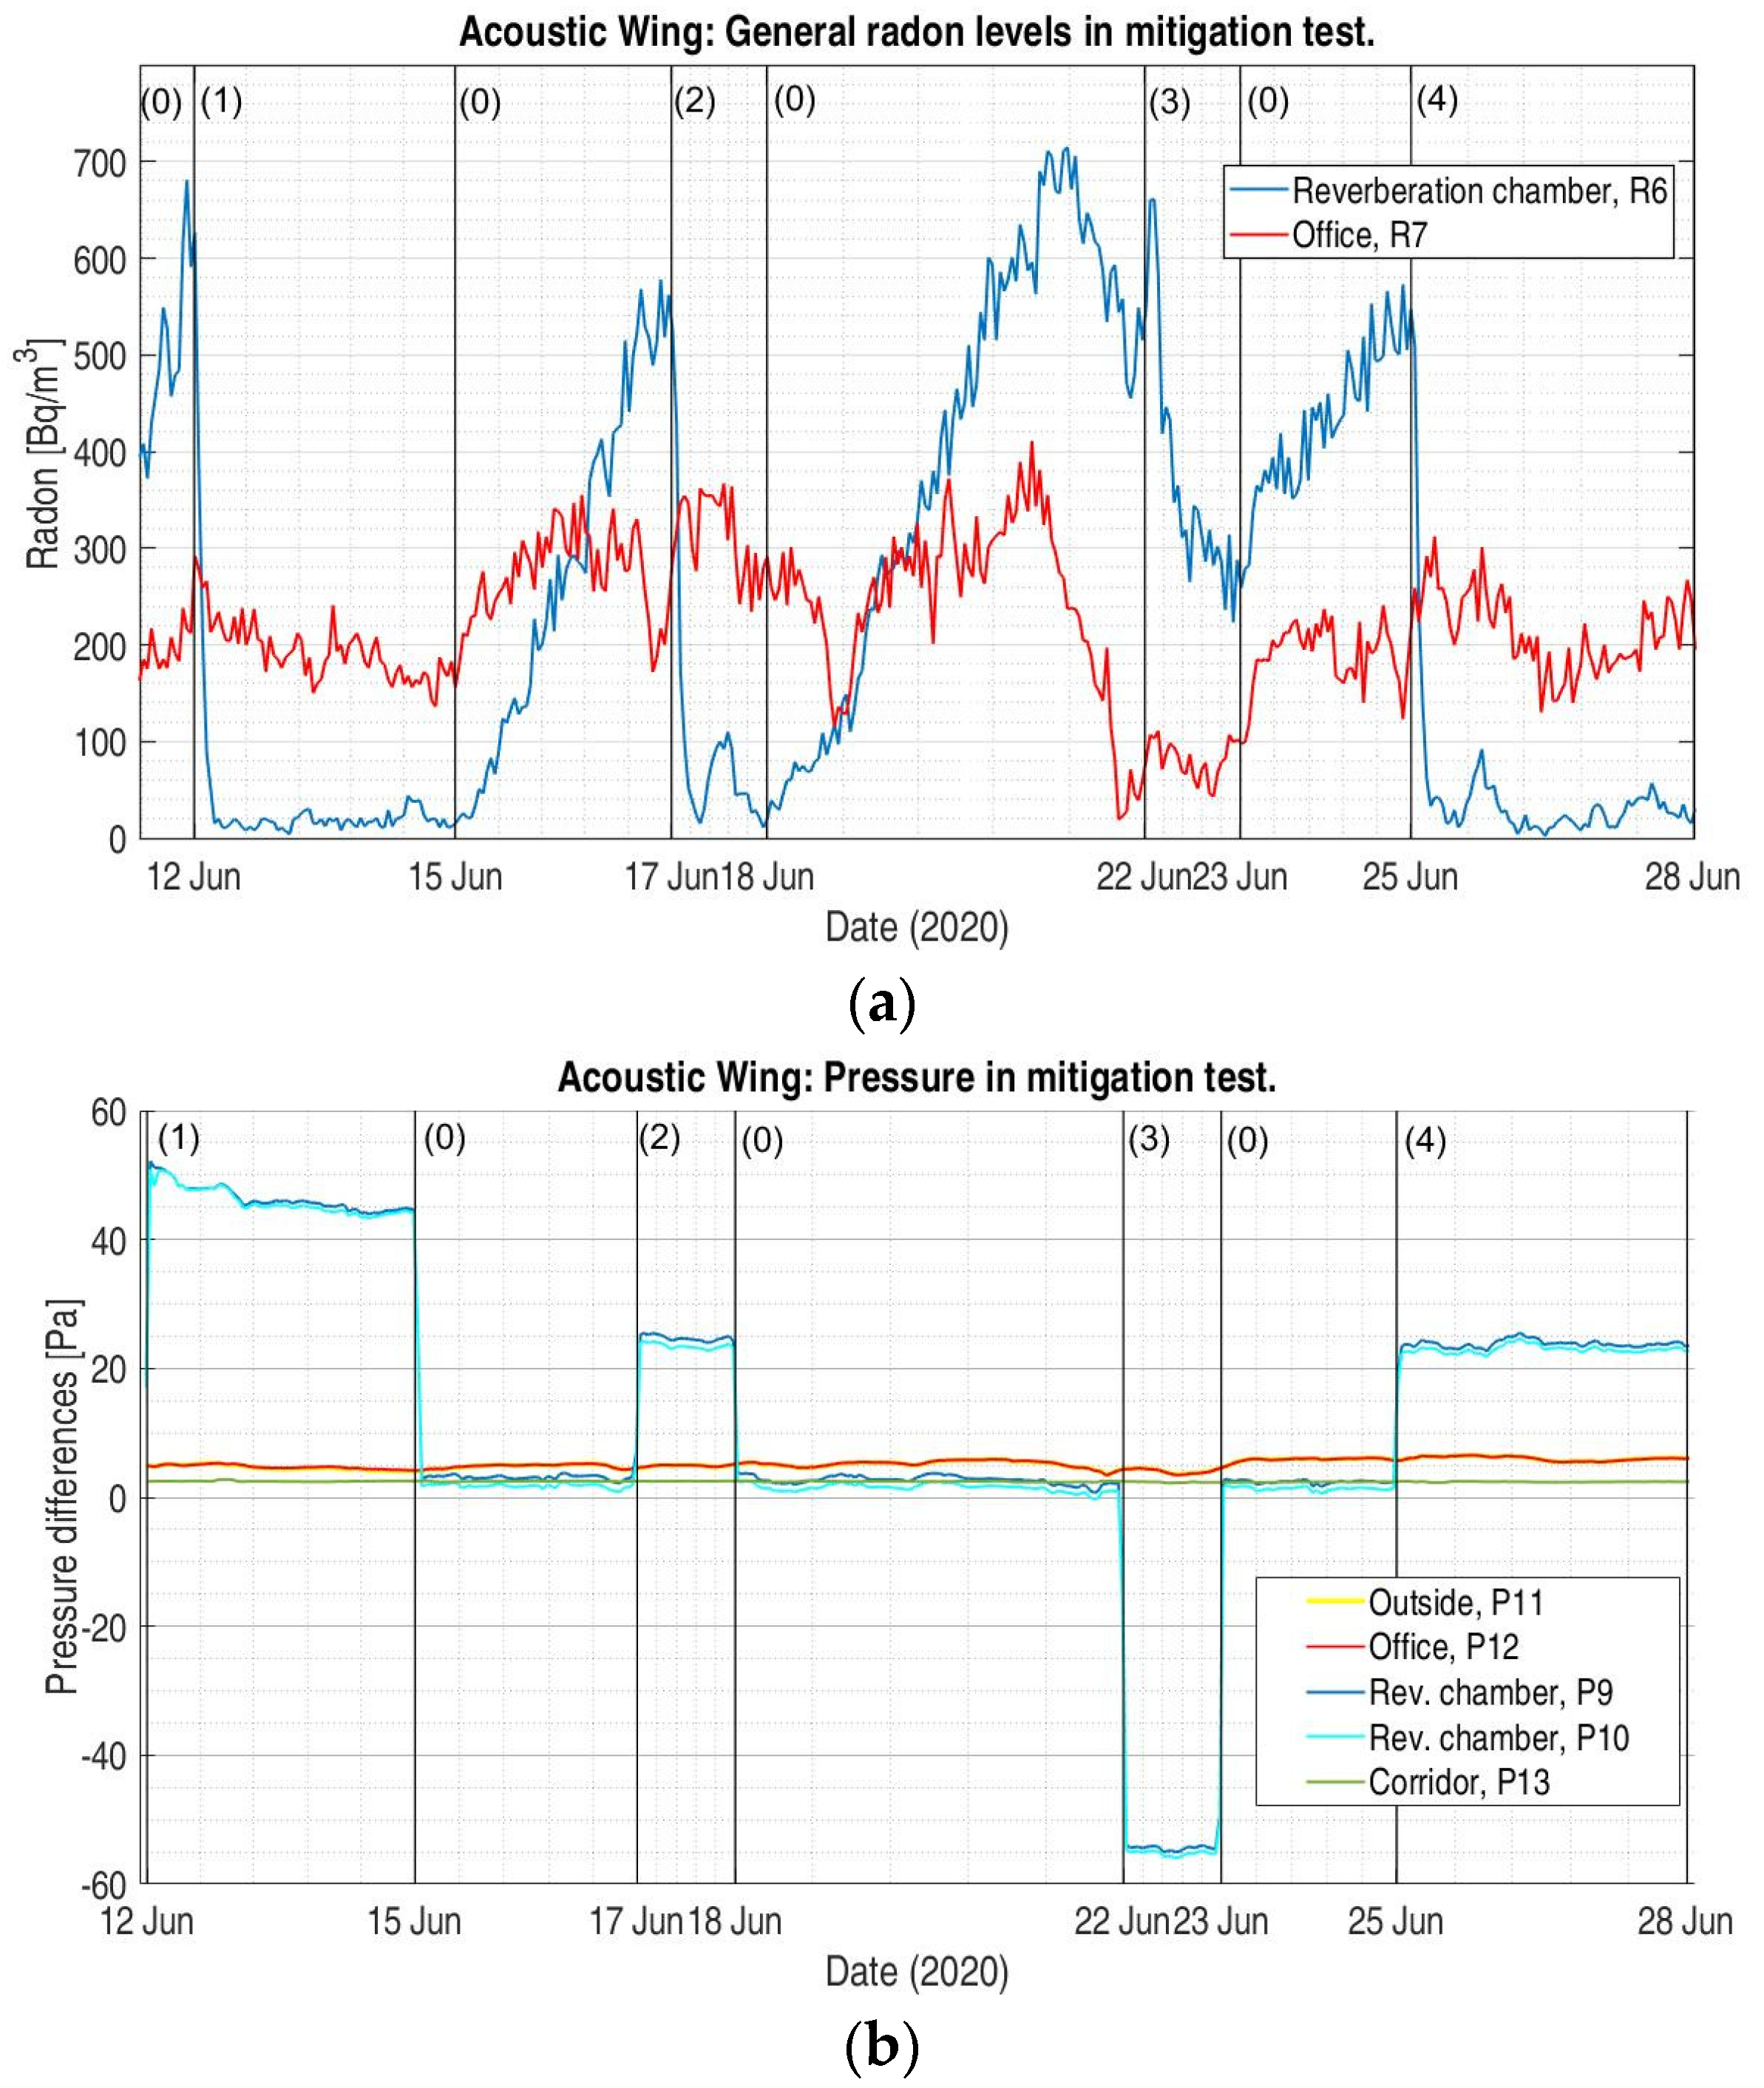
  • Reverberation chamber remediation test: Different remediation tests were carried out to determine the healthy levels of radon concentration in the reverberation chamber. (0) The natural state before remedial actions was measured. The levels were recovered between each test to establish the initial radon levels of around 600 Bq/m3. (1) The pressurization test introduced fresh air into the acoustic chamber. (2) A forced ventilation test was carried out and repeated in (4) to evaluate a rare increase in indoor radon levels. (3) The depressurization test extracted the exhaust air from the interior.

4. Results and Discussion

The two independent experiments (the galleries and the reverberation chamber) covered a whole range of radon mitigation systems applied to closed spaces. The first one was developed in the main wing. The galleries of this space were influenced by external factors due to the indeterminate permeability of the brick walls and the unknown connection to the other urban galleries. These factors give special and unique characteristics to each gallery.
The second experiment was developed in the reverberation chamber. Being closed, this space is completely isolated from external influences. On the other hand, the isolation and absence of noise required to work in the reverberation chamber is a handicap for applying mitigation actions to this space.

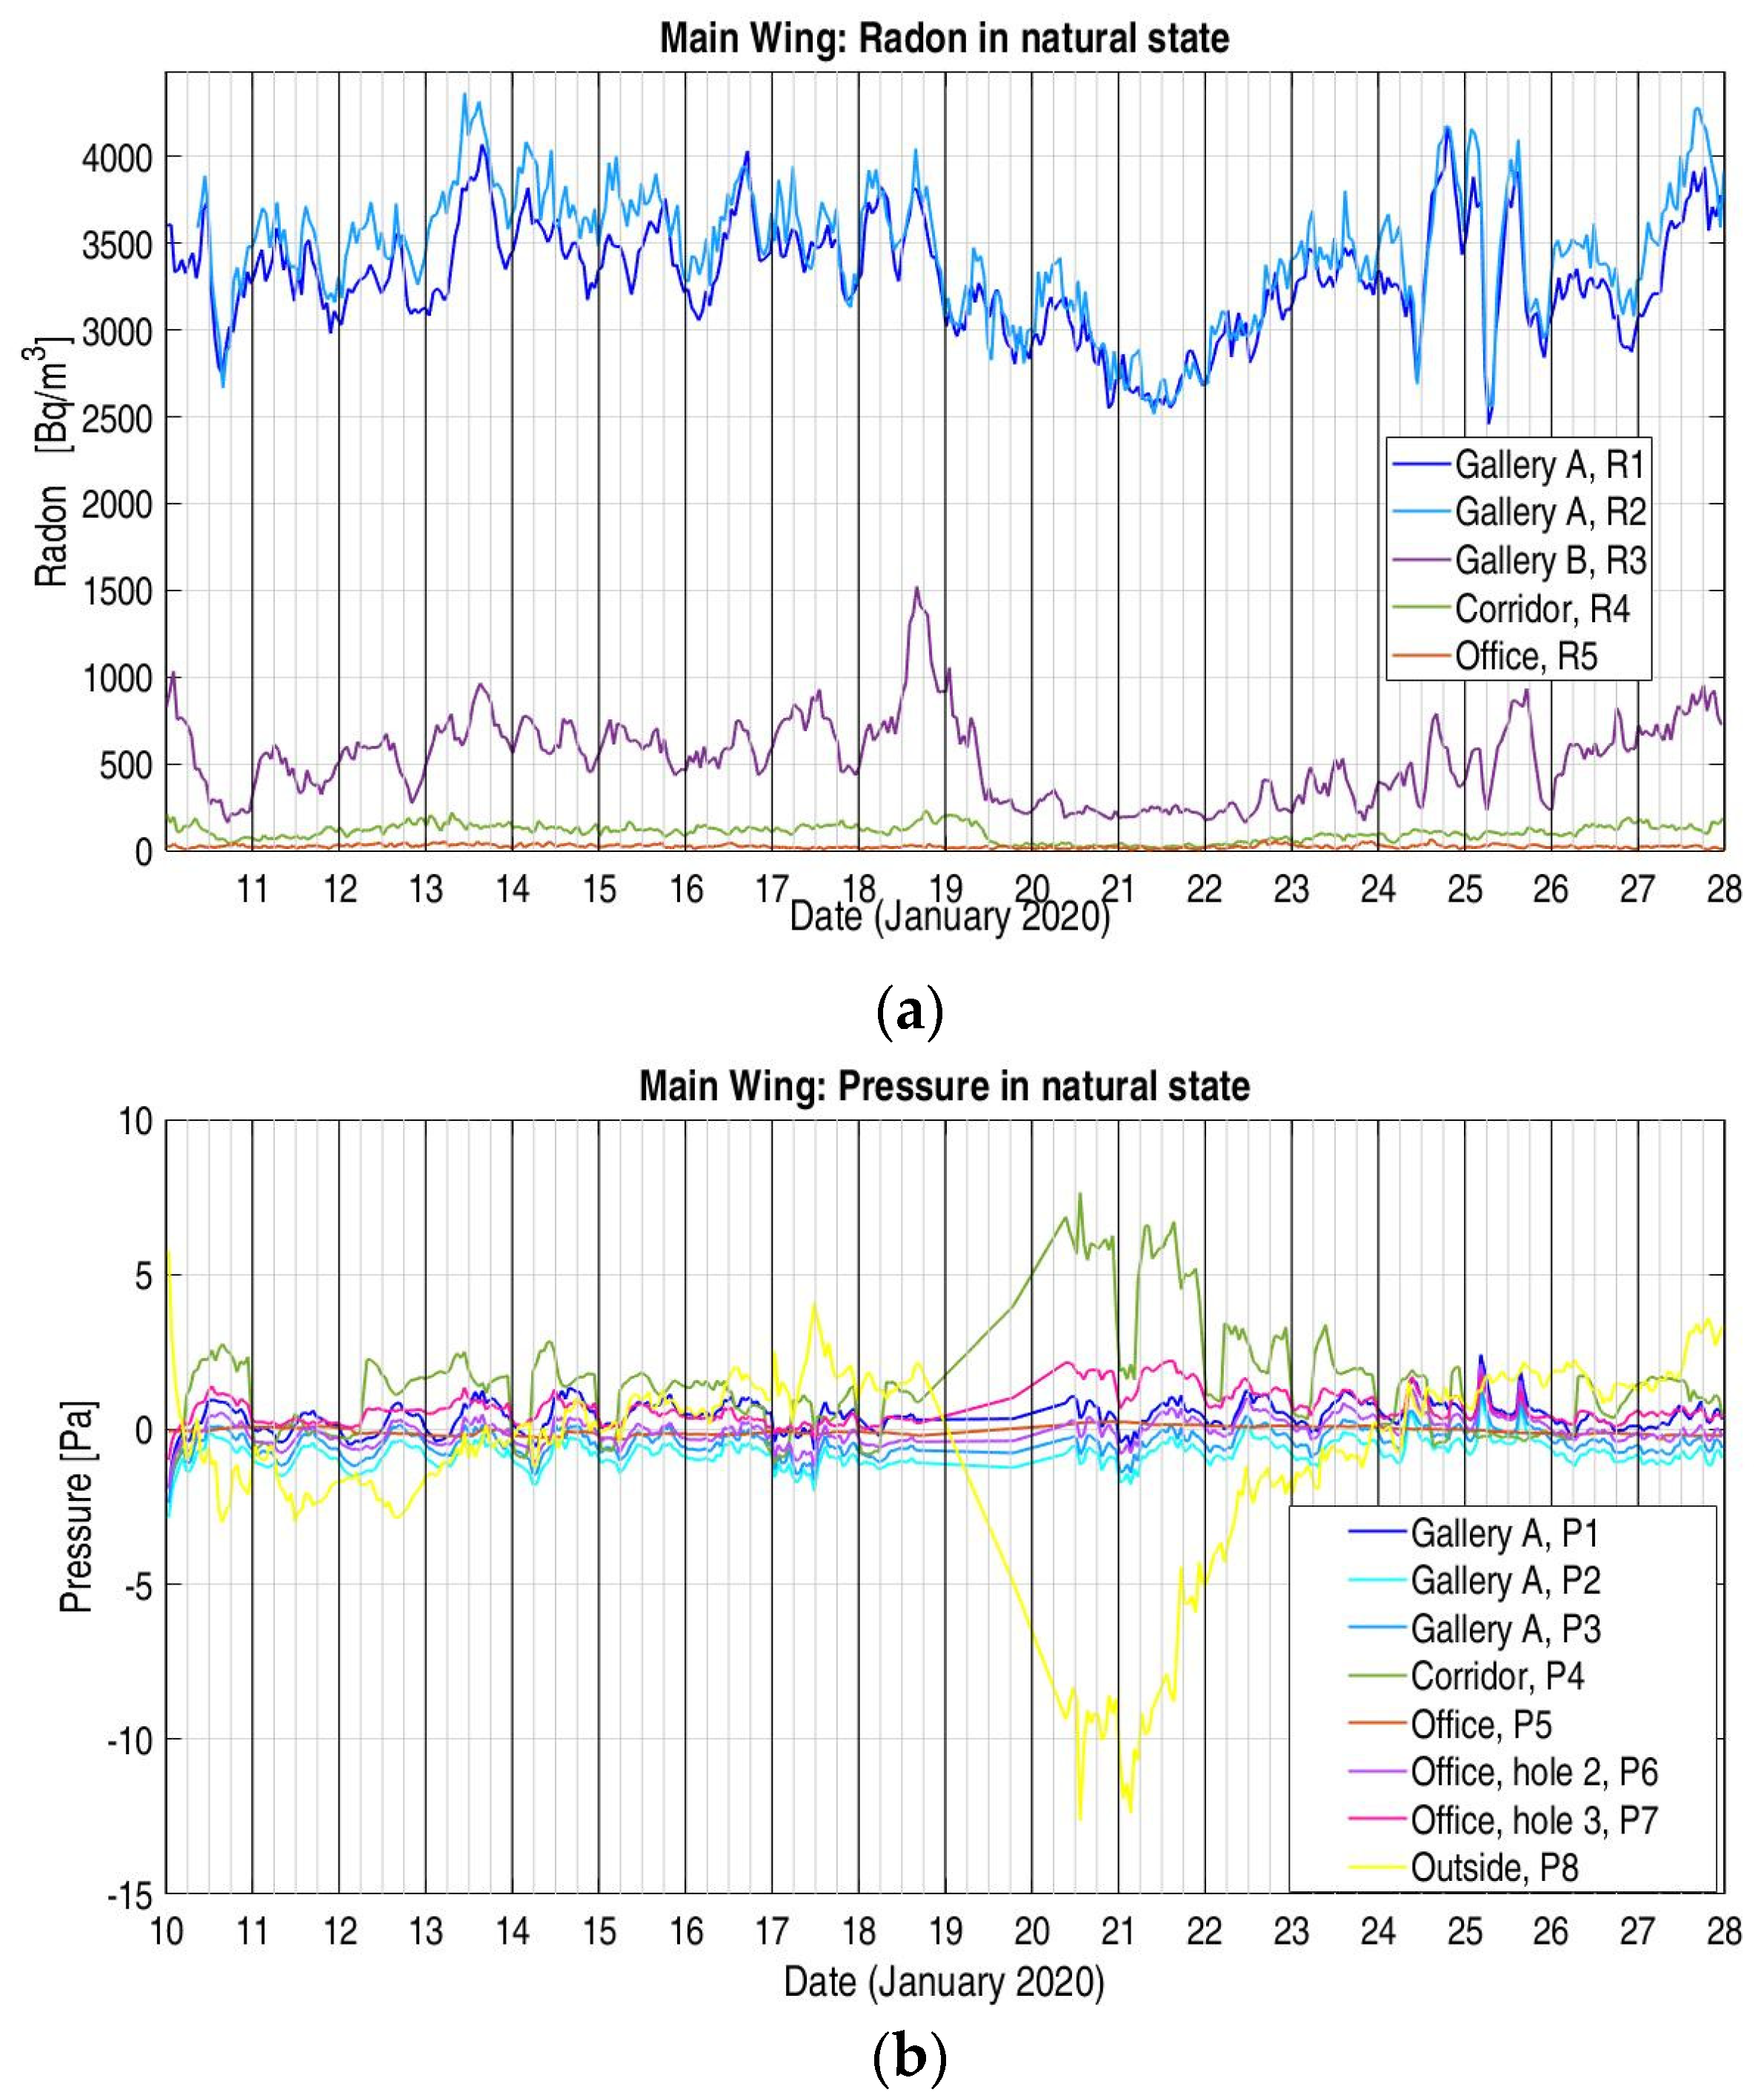
4.1. Main Wing—Results of Facility Galleries and Nearest Living Places: Natural State

The radon levels were tested in two symmetrical T-shaped facility galleries (A and B) and the living spaces surrounding one of the galleries—an office located above Gallery A and a corridor adjacent to both galleries. The two galleries reported high levels of radon. Although both galleries have a similar shape, building forms, and floor, Gallery B had significantly lower radon levels than Gallery A. A cyclical air flow was detected with a period of a few seconds. The source of this airflow could not be determined, but it established a fundamental difference between the radon concentrations in the two galleries. No airflow was detected in Gallery A.
The monitoring of Gallery A was conducted at two different points: at the initial part behind the access door and a more distant point. For Gallery B, a single point was established behind the access door. The sensors and data recorded at each point are described in Section 2.1 and Section 2.2. Figure 8 represents the levels of radon (a) and pressure (b) in the natural state without any external action. The pressure reference for the differential pressure measurement was located on the office floor.
Figure 9a shows a large difference between the radon levels in Galleries A and B. This may have been due to the higher aeration detected in Gallery B.
As can be seen in Figure 8a,b, the pressure and radon values developed a cyclical daily period. Both galleries had very similar pressure trends. The galleries were not isolated, and there is no information about the connections to other underground spaces or city galleries. Cyclical periods can be influenced by ventilation or connection to other underground spaces, heating in the building, or human activity. On the other hand, radon levels decrease when the outside pressure is lower than the inside pressure (outside—P8 pressure sensor). The pressure recorded outside shows an influence of the wind during those days. The office window was placed leeward, and the wind created suction. In opposition, the windward corridor was affected by positive pressurization. High wind rates affected the air in the galleries and indoor spaces, changing the radon levels.
The pressure range of the interior spaces was around 4 Pa. This range increased to 25 Pa between the indoor and outdoor spaces. The pressure in the galleries tended to be lower than in the adjacent spaces. The fact that the pressure differential is very small indicates that a large entry of radon into the living spaces was prevented. Better slab insulation, higher air turnover, and the presence of this pressure gradient explain the lower radon levels in living spaces, as shown in Figure 9a.

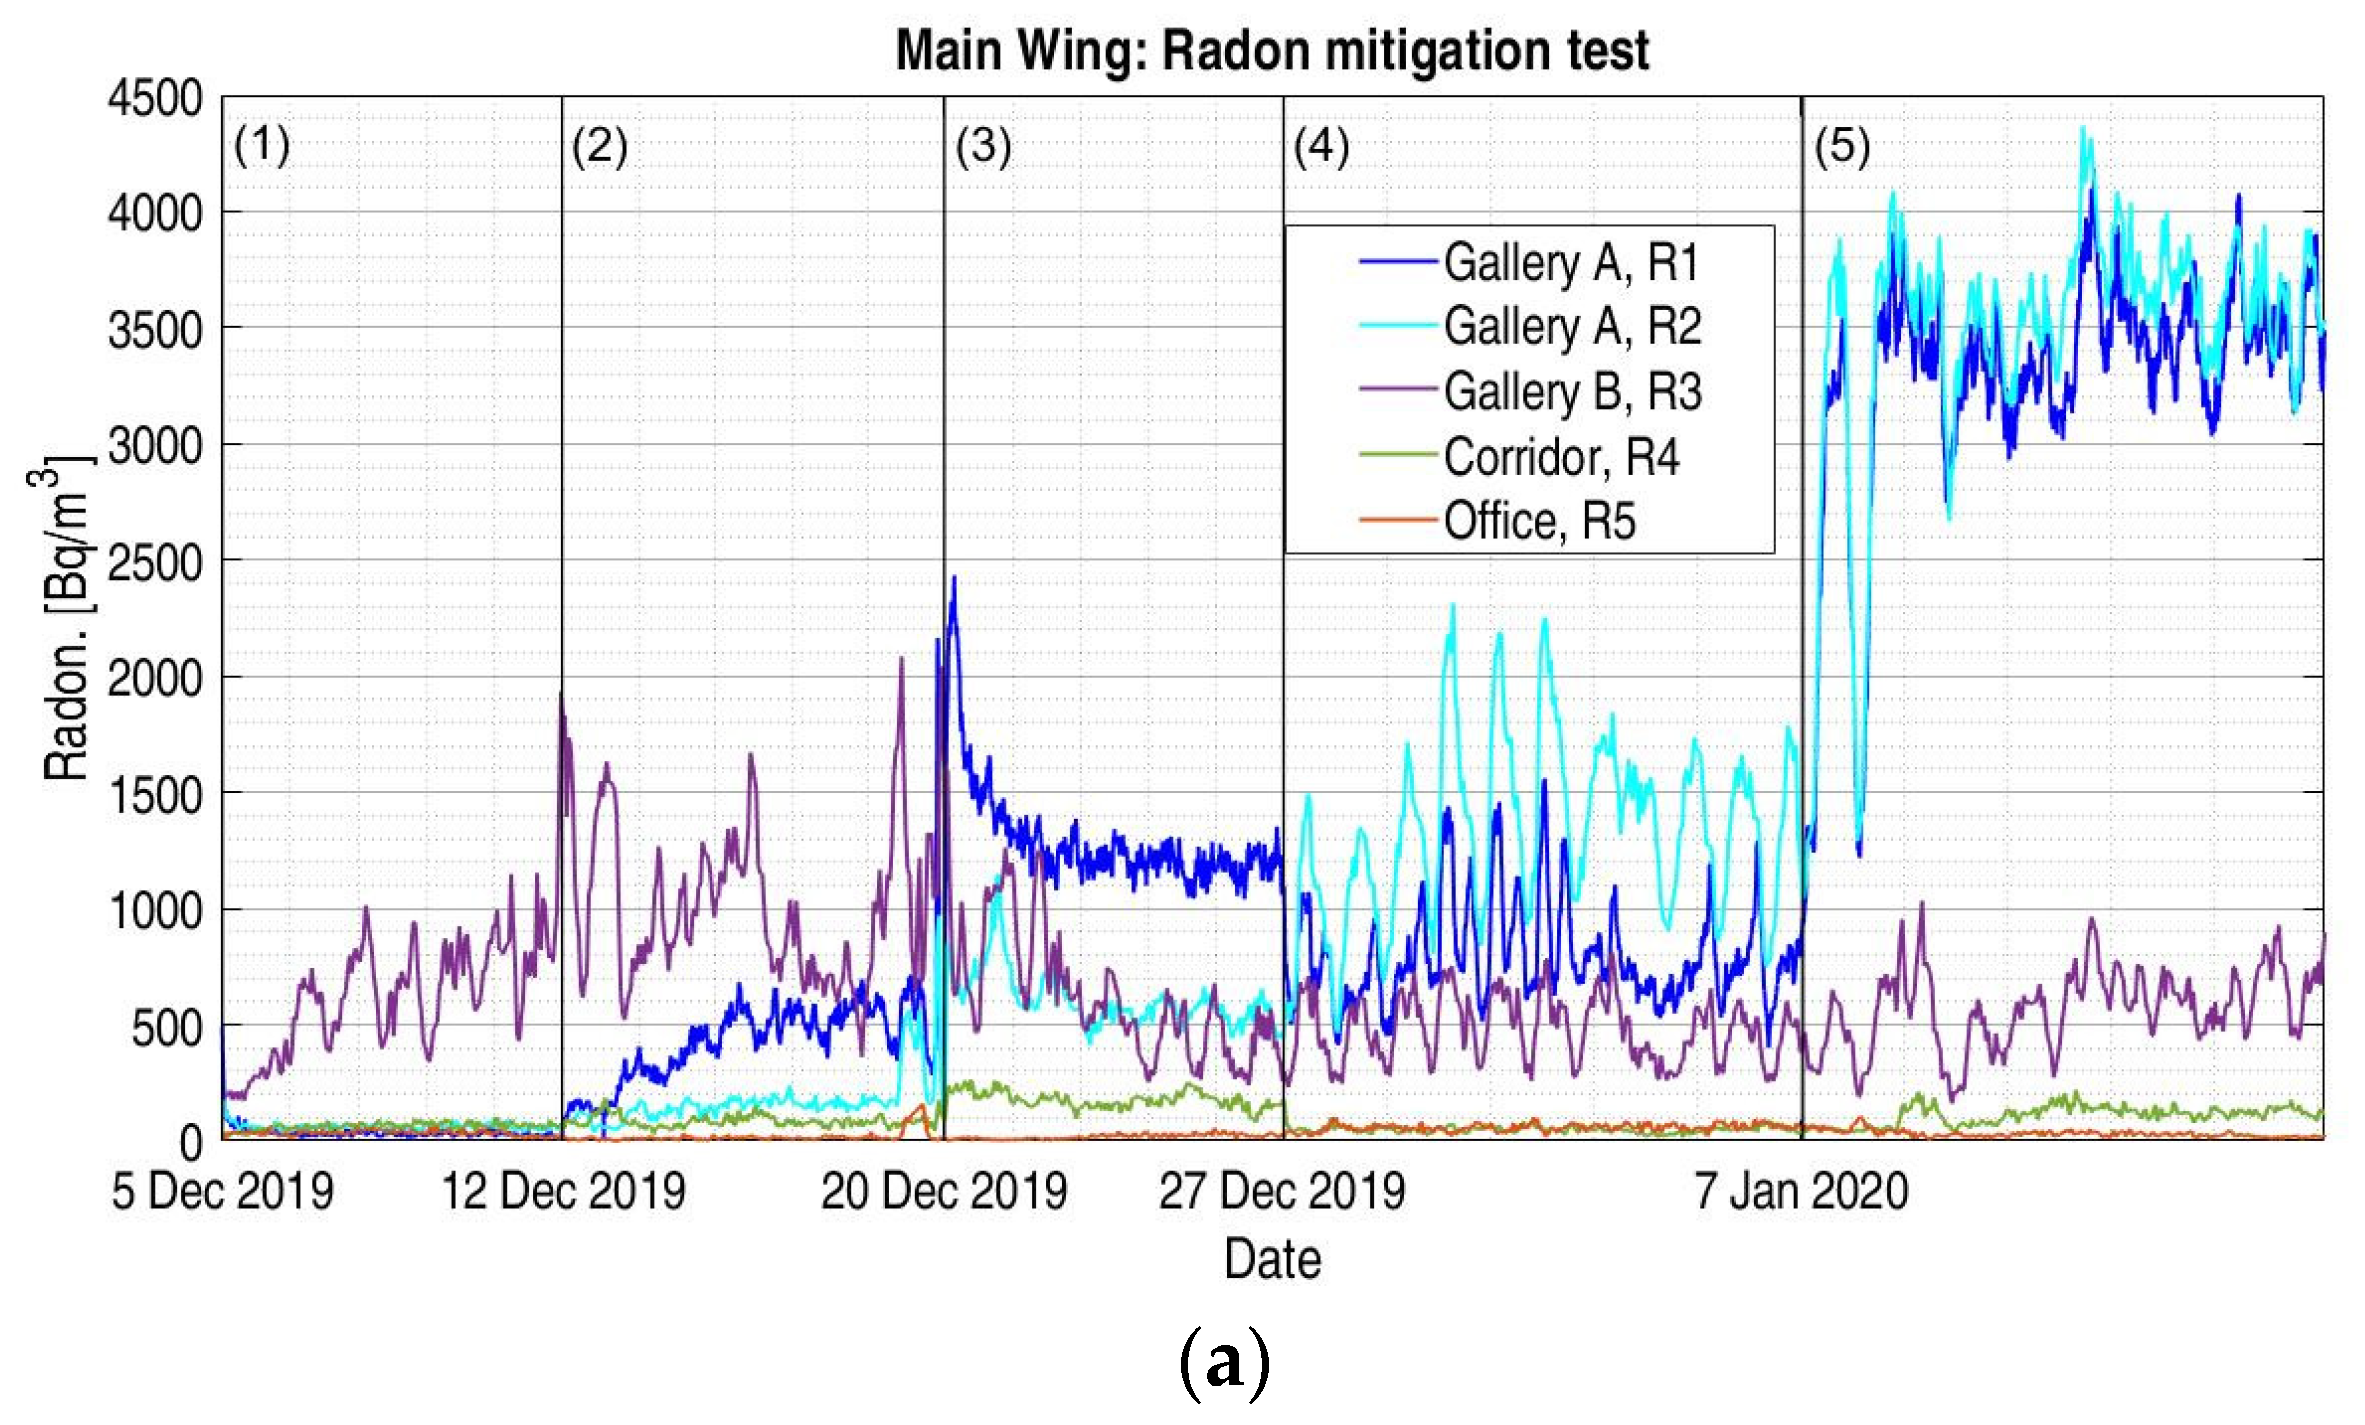
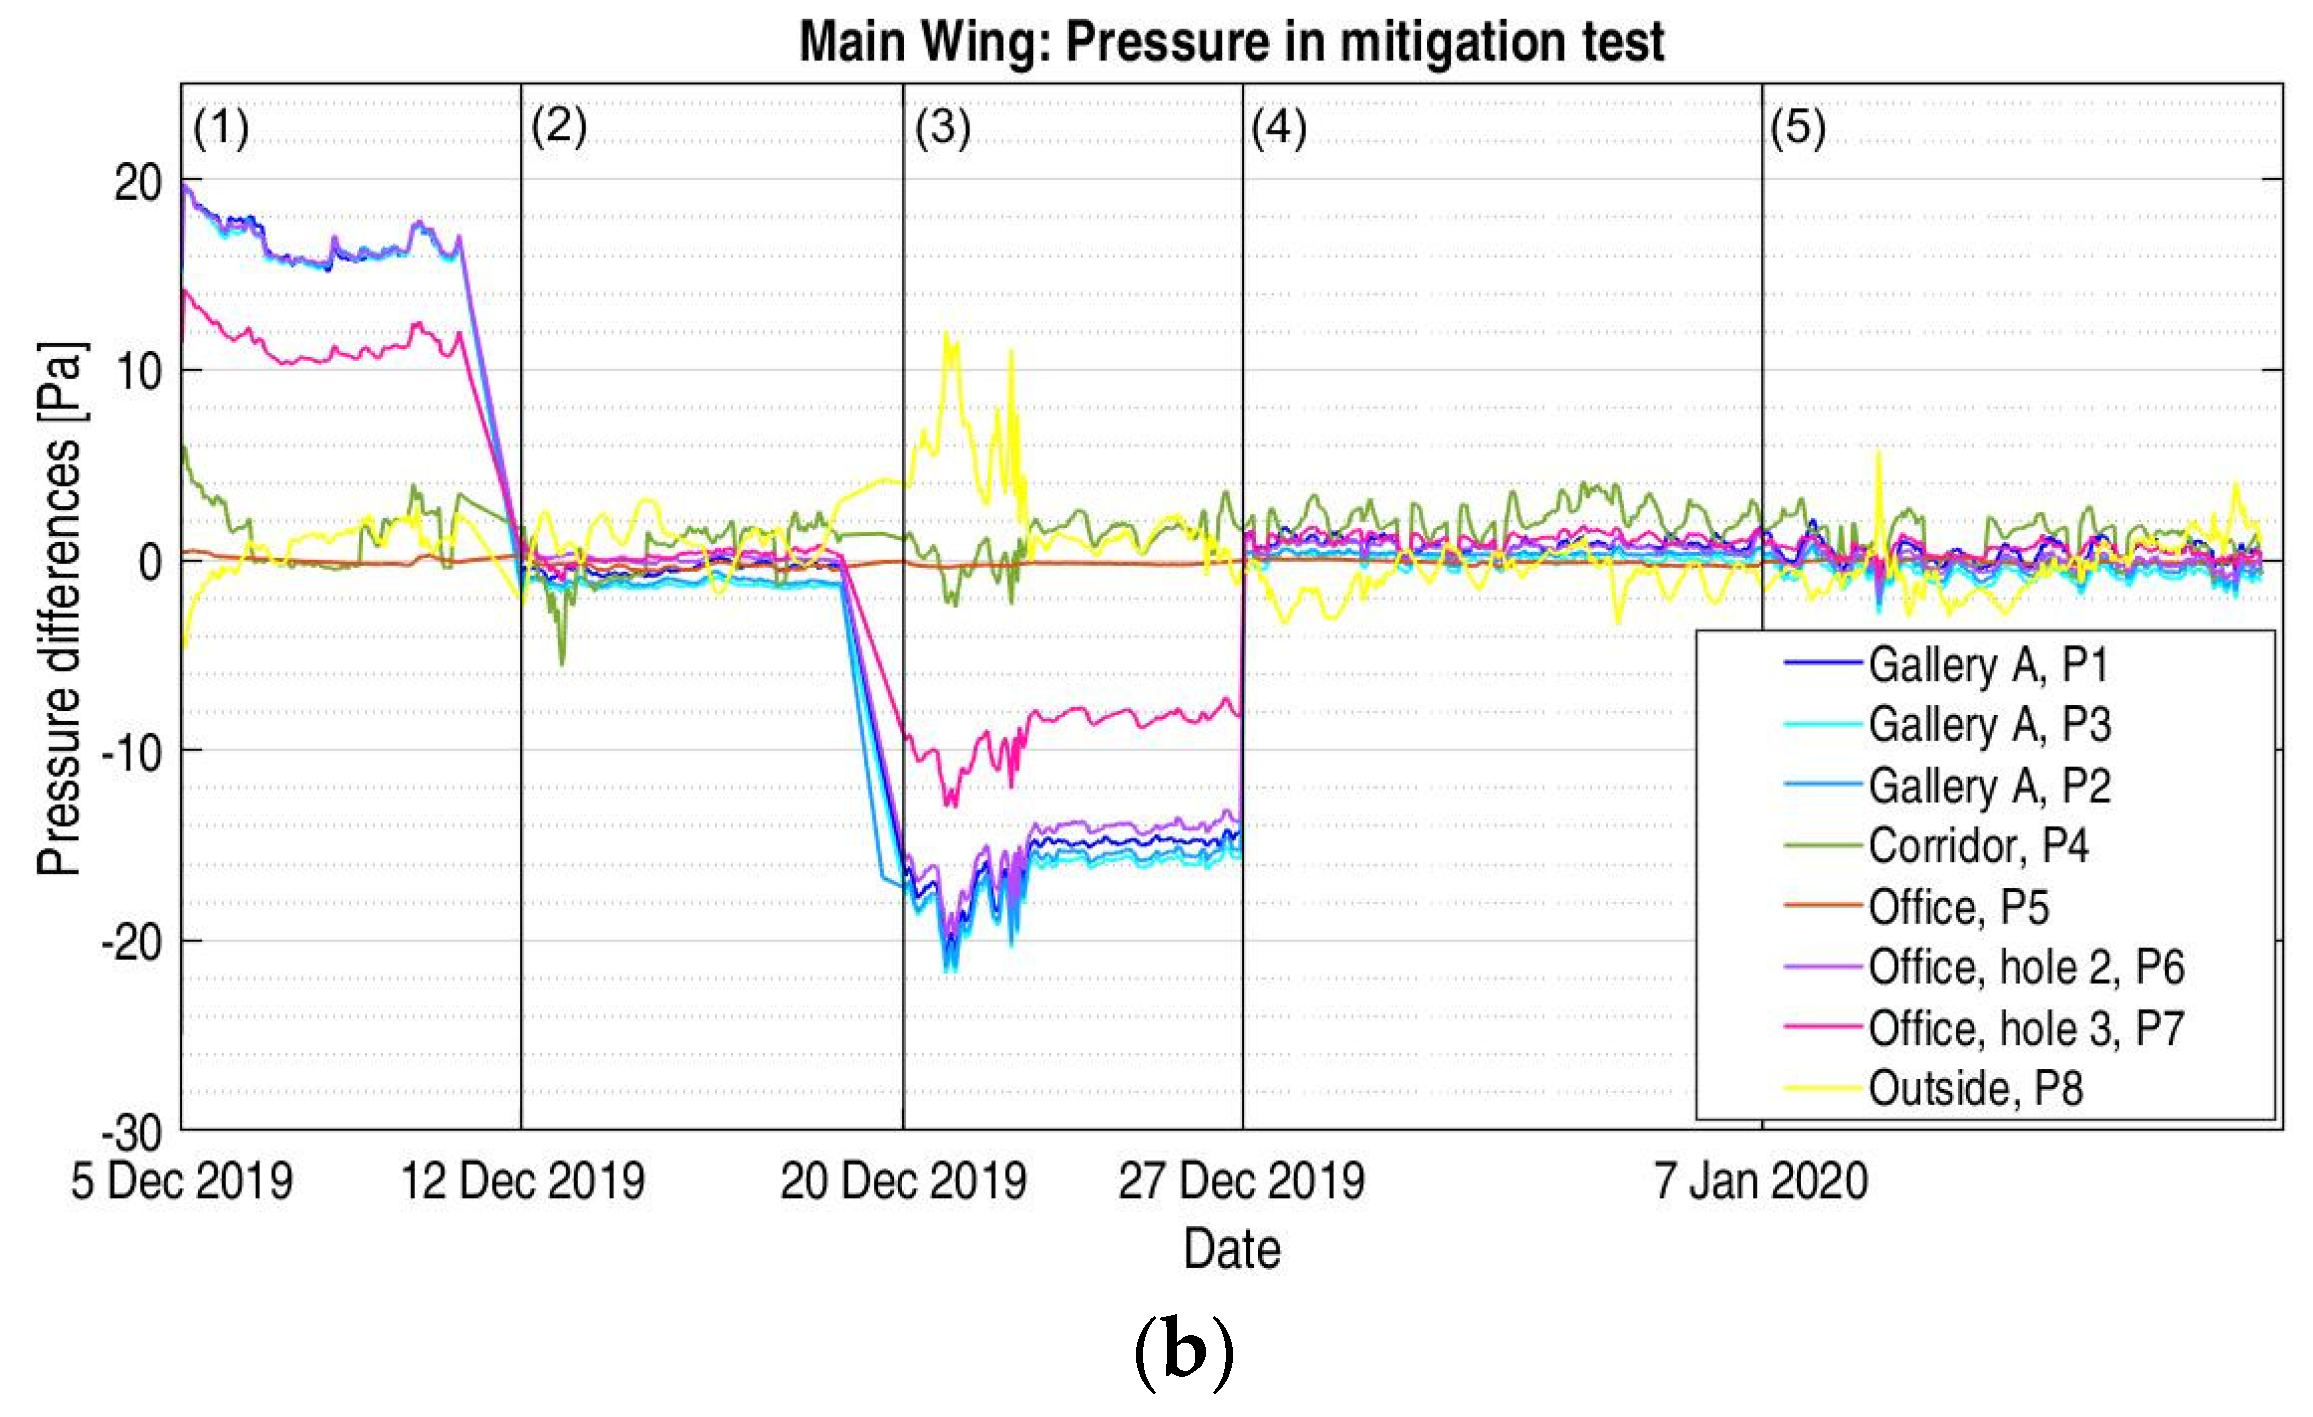
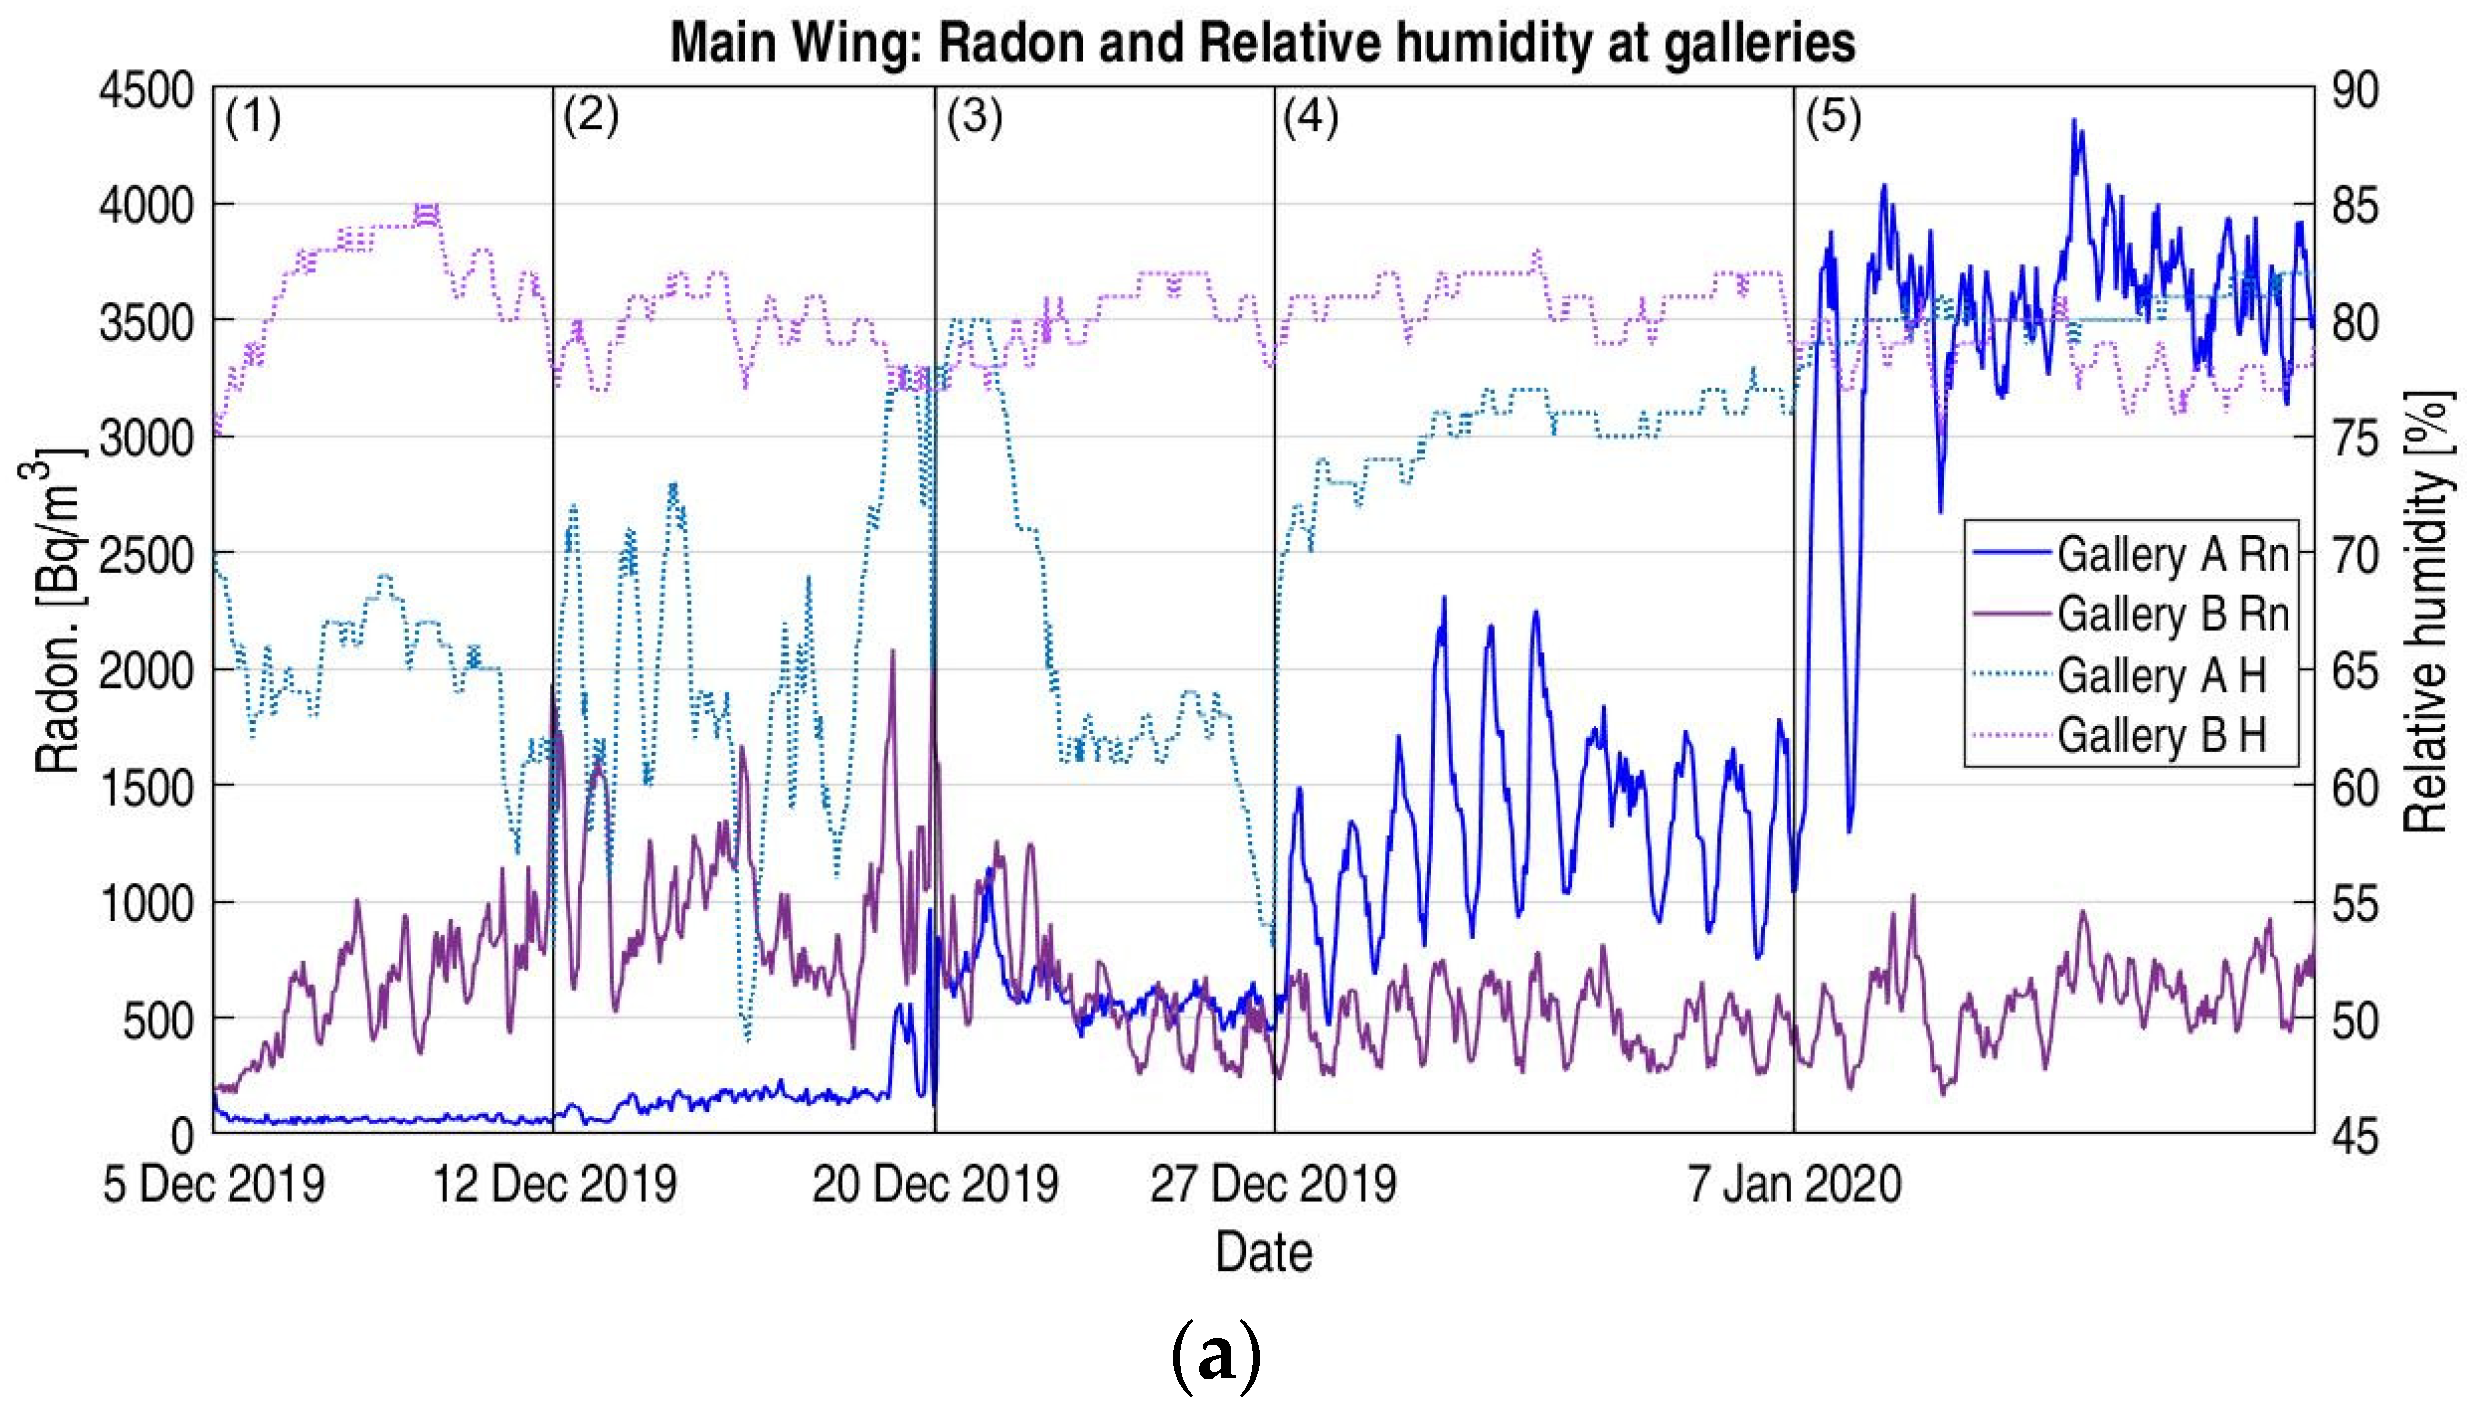
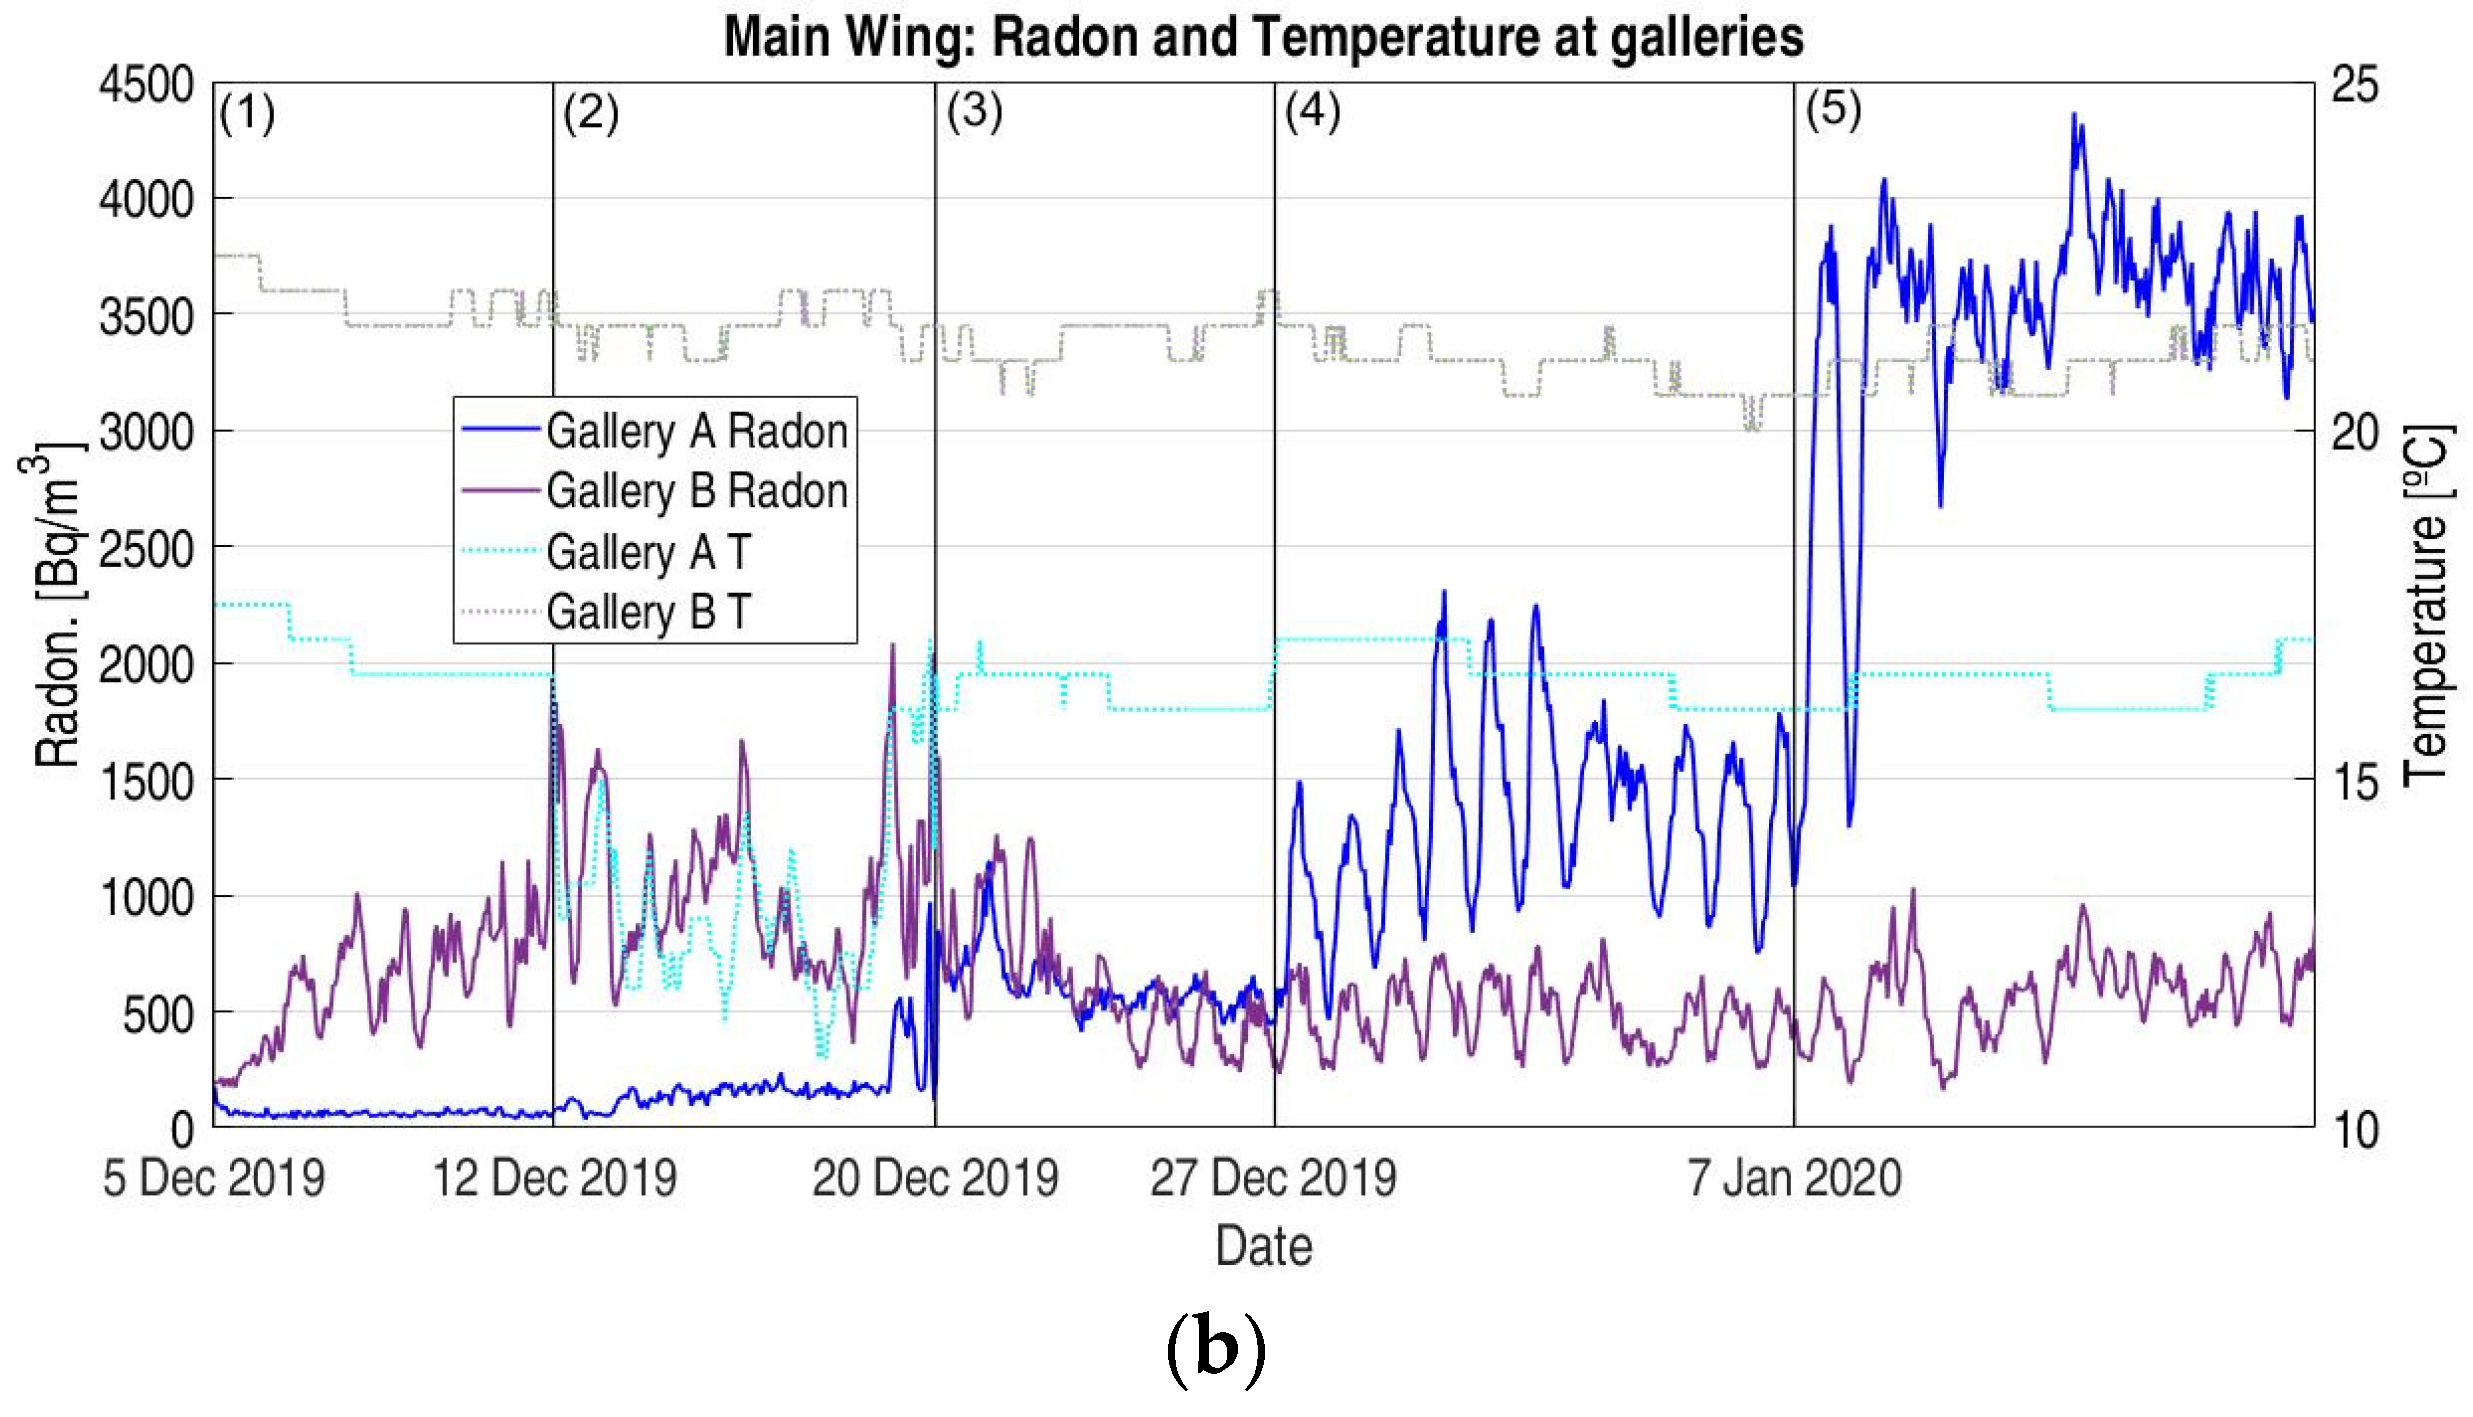
4.2. Main Wing—Radon in Facility Galleries and Nearest Living Places: Radon Mitigation Test

All the radon mitigation techniques were conducted in Gallery A. The data were recorded in both galleries to detect the possible effects on this space due to possible underground connections. Although there is a distance of several meters between the two spaces, the dimensions of the system of tunnels and galleries under the buildings forming Serrano Street were not clear.
The mitigation tests are described in Section 3.1. Each test lasted for at least a whole week. Figure 9a,b shows the impact of the mitigation test on the radon levels and the pressure variation at each space. Test (5) recorded the natural states of the spaces without the activation of the mitigation systems.
The reference point was situated on the floor of the office. As can be seen, the pressures at different points of Gallery A (P1 near the door and P2–P3 at the gallery bottom) were mostly equal. The pressure was transmitted instantly in the open air, as expected. The slight differences could have been due to turbulences due to the extraction system. The pressure in Hole 2 was very close to the pressure in the gallery. The pressure was transmitted through the brick wall that separated both spaces. In addition to the brick permeability, the transmission of pressure was reinforced by the presence of several perforations in the masonry wall. Regarding Hole 3, there was no apparent communication with the gallery. In this case, the 4-m distance is made up of a masonry wall and bulk fill materials. The permeability of this filling material allowed for pressure transmission.
Figure 9a shows that the radon concentration in Gallery A was reduced with all remedial tests applied. However, the average levels of under 300 Bq/m3 in Gallery A were only reached when the pressurization test was carried out (Table 3). The pressurization raised the internal pressure in the gallery and prevented the entry of radon due to advection transport phenomena.
The forced ventilation test (2) was carried out by extracting air from Gallery A, leaving open Hole 1 in the office to provide free fresh air entry through the window. The air flowed via a preferential stream from the window to the outside, driving and diluting the radon. The radon levels in the gallery and the adjacent spaces increased. The ventilation of the gallery was more effective at the bottom of the gallery, where the flux developed. This mitigation method reduced the levels of radon in the gallery with respect to the initial state, but it was less effective than pressurization. The radon levels in the living spaces (office and corridor) cannot be considered as they were influenced by the intake of outside air.
The depressurization test (3) is one of the most commonly used mitigation methods nowadays. Depressurization is usually applied in underground spaces and under the slab to reduce the concentration of radon in the living spaces above. The reduction in the gallery pressure induced the air from the neighboring spaces to enter by advection. This air was polluted, coming from the underground spaces, and fresh air from outside. The radon concentration was reduced by dilution and the movement of indoor air to the outside. Depressurization was, along with single natural ventilation (4), a less effective method to reduce the radon levels in the gallery. The indoor radon concentrations recorded near the gallery door, above 1000 Bq/m3, were far from healthy. However, depressurization was the most effective method of reducing radon in the adjacent spaces, as can be seen from the office data.
Natural single ventilation (4), providing a single free connection to the outdoors, leads to radon reduction without mechanical devices. Radon levels during this test fluctuated widely due to varying outside conditions. The reduction was best near the connection to the outside and was reduced at the rear of the gallery. The radon levels in the office were the highest detected. This test was performed during the Christmas holidays (24 December to 6 January). During this period, work activity and general ventilation were limited. This could have caused abnormal radon concentrations.
As for Gallery B, the radon levels, with their typical fluctuations, remained steady throughout the test period. This proves the independence of the galleries and their associated radon and limits the radius of operation of the mitigation tests to a few meters from Gallery A.
Table 4 shows the mean of the differential pressures achieved during each test, with the reference level on the office floor. The pressurization (1) and the depressurization (3) tests obtained a mean pressure difference greater than 15 Pa. The minimum pressure differences for the effective evacuation of radon in depressurization systems were established at 1–2 Pa [31]. Hence, depressurization pressure in the gallery was an effective way to reduce the radon levels. The pressurization test induced the evacuation of radon from the subsoil through the gallery wall and avoided the entry of new gases. In contrast to the radon levels seen in Table 3, the pressure in Gallery A near the door and the rear was quite similar in both the pressurization and depressurization tests.
Regardless of the forced ventilation pressures (2), the communication established between all spaces (galleries, office, and outside) tended to equalize the pressures. The influence on the radon levels can be seen in the radon analysis.
The relative humidity, temperature, and radon concentrations are inherently related. The humidity is directly related to the radon levels, while the temperature is inversely correlated [32]. As can be seen in Figure 10a, humidity tends to follow the same pattern as the radon levels. In this case, this influence may be increased by the displacement of the air in each test. Exhausting contaminated air, as in the forced ventilation (2) and the depressurization (3) tests, removed radon and humidity. In the same way, the introduction of fresh air during the pressurization (1) test avoided radon entry by pressure differences and disturbed the indoor humidity.
Regarding the temperature (Figure 10b), thermal inertia prevents sudden changes in temperature. This makes it difficult to determine the link between the temperature and radon levels. The temperature gradient in Gallery B was only 2 °C. The pressurization (1) and depressurization (3) tests did not appear to affect the temperature. Air renewal, as in the forced cross-ventilation test (2), equalized the temperature to the outside, avoiding the effects of thermal inertia. It is worth noting the 4 °C difference between the temperature in Galleries A and B, emphasizing the difference between both spaces.

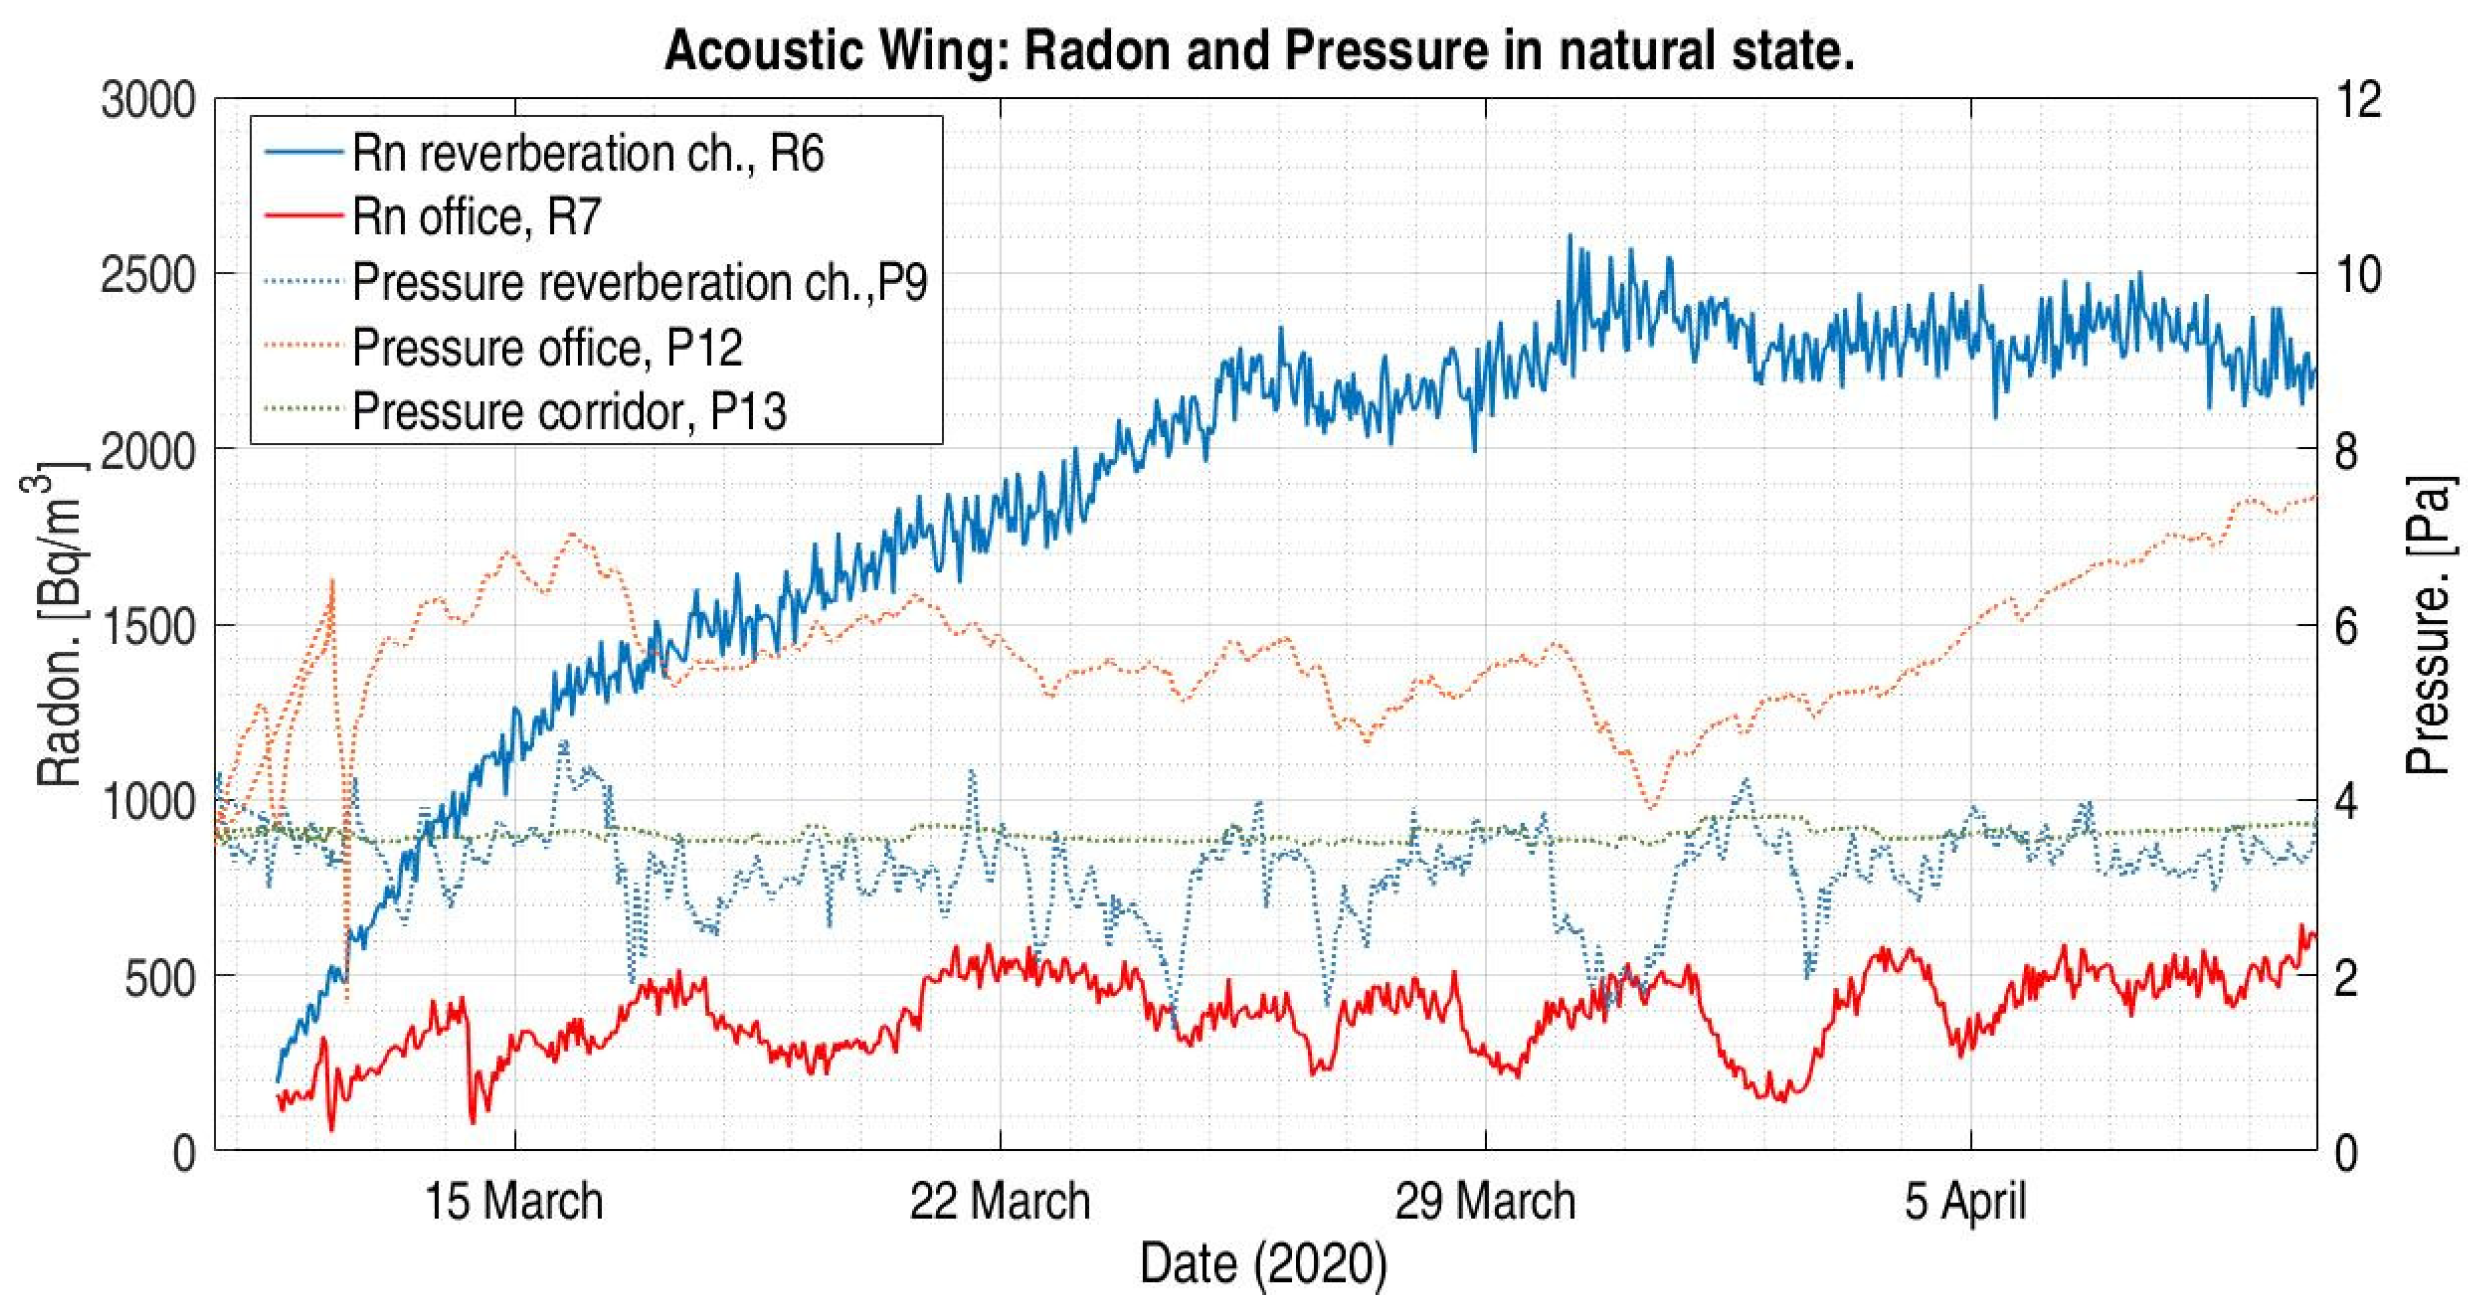
4.3. Acoustic Wing—Results of Reverberation Chamber and Office: Natural State

The reverberation chamber and the office remained in use during the data logging. The work in the reverberation chamber requires complete closure of the space. Although natural ventilation of the chamber quickly reduced the indoor radon levels to less than 300 Bq/m3, once the communication with the outside was closed, the radon levels quickly recovered. Figure 11 shows the radon levels during a typical work period. The vertical lines mark the dates when the reverberation chamber was opened and ventilated. During the work periods, the reverberation chamber was opened or closed at any time. At the same time, the radon levels were influenced by the ventilation of the adjacent spaces, such as the office, corridor, and shed. These actions were not controlled. After 11 March, the reverberation chamber remained completely closed due to work stoppage during the coronavirus disease 2019 lockdown order. This inactivity period made it possible to determine the maximum radon levels that can be reached inside the reverberation chamber. The maximum, 2612 Bq/m3, was reached on 30 March at 4:58 A.M. Due to the lack of contact between the reverberation chamber and the outside spaces, the radon levels were mainly influenced by the radon concentrations, pressure, and soil conditions.
As for radon levels in the acoustic office (Figure 11), the concentration was significantly lower than in the reverberation chamber. The composition of the soil and the details of the slab construction are unknown, but the difference in radon levels between the reverberation chamber and the office may be due to higher and more effective air renewal.
Figure 12 shows the radon and pressure data recorded during a period with no human influences. The pressure reference was established in the outdoor shed. The doors separating the office, the corridor, and the shed are not airtight, so there was slight communication between the spaces. The pressure in the shed seems to have been the lowest of all the places tested. This means that the airflow gradient, and thus, the movement of gases and radon, was directed through the outer shed. The pressure differential with the corridor was steady. This means that there was a connection between the spaces that instantaneously transmitted pressure variations. On the other hand, the reverberation chamber was closed and sealed. This means that the changes in pressure at the shed could not be transmitted to the inside of the chamber. This is reflected in the pressure fluctuations in the chamber.

4.4. Results of Acoustic Wing: Radon Mitigation Test at Reverberation Chamber

The mitigation tests were performed on the closed and sealed reverberation chamber. A recovery period (0) was set before each test to set the indoor radon levels at around 600 Bq/m3. The radon concentration levels were measured with two RadonEye RD200 devices. In the reverberation chamber, the device was placed away from the door and elevated above the floor. The device in the office was placed on a table, away from the door and window.
The pressures were measured with the differential pressure system described in Section 2.2.3. The pressure data were collected at five points: outside, with a sensor placed in the office window, at a point on the office floor, at two points in the reverberation chamber (near the door and at the back), and in the adjacent corridor. To avoid pressure differences due to wind or weather changes, the pressure reference was placed in the shed close to the reverberation chamber. The windows and communication with the outside of this shed were closed during the tests.
The tests were the same as those carried out in Gallery A: Pressurization (1), ventilation (2 and 4), and depressurization (3). As can be seen in Figure 13a, during the first ventilation test, the radon levels increased halfway through the test while the pressure remained steady (Figure 13b). Due to this issue, the same test was replicated at the end of the set (4), and the data were recorded for a week. The peaks were repeated with different values. Radon contamination of the intake air was ruled out.
Similar to the tests conducted in Gallery A, the radon levels were lower when pressurization was applied, and the recovery slope after mitigation was flatter than with ventilation and depressurization. On the other hand, as can be seen in Table 5, the application of depressurization techniques did not provide safe levels in the reverberation chamber. The radon levels recorded with all the mitigation techniques had strong variation, influenced by the natural radon trends. Otherwise, the pressure achieved with the extraction system remained fairly stable throughout the tests, regardless of the influence of weather and wind.

5. Conclusions

In this study, different techniques for the mitigation of radon gas in the indoor spaces of a public research center were investigated. Several locations of the Institute for Physical and Information Technologies Torres Quevedo in Madrid, Spain, were studied. Although most workplaces in this building have radon levels below 300 Bq/m3, the complex structure houses spaces with very high radon concentrations. The closed spaces studied were two symmetrical facility galleries in the main wing of the building and a reverberation chamber used for acoustics tests in the acoustic wing. At the same time, the study included the surroundings of these spaces: an office and an underground corridor adjacent to the two galleries, and another office and the spaces surrounding the reverberation chamber (a corridor and a shed). The radon concentrations and differential pressures were measured while applying different mitigation techniques: sealing, ventilation, pressurization, and depressurization in each space.
Both scenarios—the galleries and the reverberation chamber—show quite similar results. The pressurization test was the best way to reduce the radon concentration. The introduction of fresh air and the increase in pressure diluted the radon concentration and prevented gas ingress.
It was also observed that the pressurization of the spaces was not affected by the adjacent spaces. In the main wing, this may have been due to the isolation between the gallery and the upper office. In the acoustic wing, the reverberation chamber and the adjacent office were not attached, so it was not possible to determine the absence of influence. On the other hand, the application of the depressurization technique was the least effective mitigation technique. This may have been due to the displacement of radon from the soil to the suction point.
Therefore, it can be concluded that these are spaces with unique characteristics in which the possible mitigation actions must be conducted in a conservative way within each, as it is not possible to apply correction measures for the insulation of the floors and walls. Although the galleries studied are non-habitable spaces, the results of the study can be applied in actions to mitigate radon gas in unique buildings. Such would be the case, for example, of buildings with historical heritage, in which crypts, caves, and other interior spaces are found in contact with the ground, with a strong limitation for the application of protection measures against radon gas.
Although the application of overpressure inside is usually effective for the protection of closed spaces where it is not possible to act otherwise and prevents the entry of gas from the ground, the application of one or another measure should be studied on a case-by-case basis. Studies must consider both the space to be remedied and the possible effects of the adjacent spaces, which may lead to the choice of a less effective technique, but one that provides a better overall result to all the spaces.

Author Contributions

I.S.: Conceptualization and methodology, validation, formal analysis, investigation, writing—original draft, writing—review and editing, visualization. S.A.: Conceptualization and methodology, software, validation, investigation, writing—original draft, writing—review and editing, visualization. M.G.: Conceptualization and methodology, resources, writing—review and editing, supervision, project administration, funding acquisition. J.J.A.: Conceptualization and methodology, resources, writing—review and editing, supervision, project administration, funding acquisition. B.F.: Conceptualization and methodology, resources, writing—review and editing, supervision, funding acquisition. All authors have read and agreed to the published version of the manuscript.

Funding

This research was funded by the Project RadonFlow PID2019-109898RB-100 funded by MCIN/AEI/10.13039/501100011033, Spanish National Research Council (CSIC).

Institutional Review Board Statement

Not applicable.

Informed Consent Statement

Not applicable.

Acknowledgments

This work was performed at the Institute for Physical and Information Technologies “Leonardo Torres Quevedo” (CSIC), and the Eduardo Torroja Institute for Construction Science (CSIC).

Conflicts of Interest

The authors declare no conflict of interest.

References

  1. World Health Organization. WHO Handbook on Indoor Radon. A Public Health Perspective; World Health Organization: Geneva, Switzerland, 2009. [Google Scholar]
  2. Ruano-Ravina, A.; Prini-Guadalupe, L.; Barros-Dios, J.M.; Abal-Arca, J.; Leiro-Fernández, V.; González-Silva, A.I.; Golpe-Gómez, A.; González-Barcala, F.J.; Pena, C.; Montero-Martínez, C.; et al. Exposure to Residential Radon and Lung Cancer in Never-Smokers: The Preliminary Results of the LCRINS Study. Arch. Bronconeumol. 2012, 48, 405–409. [Google Scholar] [CrossRef] [PubMed]
  3. Nazaroff, W.W.; Moed, B.A.; Sextro, R.G. Soil as a Source of Indoor Radon, Generation, Migration, and Entry. In Radon and Its Decay Products in Indoor Air; Nazaroff, W.W., Nero, A.V., Eds.; John Wiley & Sons: Hoboken, NJ, USA, 1988; pp. 57–112. [Google Scholar]
  4. Nero, A.V.; Gadgil, A.J.; Nazaroff, W.W.; Reyzen, K.L. Indoor Radon and Decay Products: Concentrations, Causes, and Control Strategies; U.S. Department of Energy, Office of Health and Environmental Research: Washington, DC, USA, 1990; pp. 42–60.
  5. Vasilyev, A.V.; Zhukovsky, M.V. Determination of Mechanisms and Parameters Which Affect Radon Entry into a Room. J. Environ. Radioact. 2013, 124, 185–190. [Google Scholar] [CrossRef] [PubMed]
  6. Font Guiteras, L. Radon Generation, Entry and Accumulation Indoors. Ph.D. Thesis, Universitat Autònoma de Barcelona, Barcelona, Spain, 2011; pp. 5–48. [Google Scholar]
  7. Sabbarese, C.; Ambrosino, F.; D’Onofrio, A. Development of Radon Transport Model in Different Types of Dwellings to Assess Indoor Activity Concentration. J. Environ. Radioact. 2021, 227, 106501. [Google Scholar] [CrossRef] [PubMed]
  8. Yarmoshenko, I.; Zhukovsky, M.; Onishchenko, A.; Vasilyev, A.; Malinovsky, G. Factors Influencing Temporal Variations of Radon Concentration in High-Rise Buildings. J. Environ. Radioact. 2021, 232, 106575. [Google Scholar] [CrossRef]
  9. Girault, F.; Perrier, F. Estimating the Importance of Factors Influencing the Radon-222 Flux from Building Walls. Sci. Total Environ. 2012, 433, 247–263. [Google Scholar] [CrossRef]
  10. Minkin, L.; Shapovalov, A.S. Thermo-Diffusional Radon Waves in Soils. Sci. Total Environ. 2016, 565, 1–7. [Google Scholar] [CrossRef]
  11. Yang, J.; Busen, H.; Scherb, H.; Hürkamp, K.; Guo, Q.; Tschiersch, J. Modeling of Radon Exhalation from Soil Influenced by Environmental Parameters. Sci. Total Environ. 2019, 656, 1304–1311. [Google Scholar] [CrossRef]
  12. Blanco-Rodríguez, P.; Fernández-Serantes, L.A.; Otero-Pazos, A.; Calvo-Rolle, J.L.; Javier, F.; Juez, D.C. Radon Mitigation Approach in a Laboratory Measurement Room. Sensors 2017, 17, 1090. [Google Scholar] [CrossRef] [Green Version]
  13. Vázquez, B.F.; Adán, M.O.; Quindós Poncela, L.S.; Fernandez, C.S.; Merino, I.F. Experimental Study of Effectiveness of Four Radon Mitigation Solutions, Based on Underground Depressurization, Tested in Prototype Housing Built in a High Radon Area in Spain. J. Environ. Radioact. 2011, 102, 378–385. [Google Scholar] [CrossRef]
  14. Cosma, C.; Papp, B.; Cucoş (Dinu), A.; Sainz, C. Testing Radon Mitigation Techniques in a Pilot House from Băiţa-Ştei Radon Prone Area (Romania). J. Environ. Radioact. 2015, 140, 141–147. [Google Scholar] [CrossRef]
  15. Ptiček Siročić, A.; Davor Stank, N.; Dogančić, D.; Trojko, T. Short-Term Measurement of Indoor Radon Concentration in Northern Croatia. Appl. Sci. 2020, 10, 2341. [Google Scholar] [CrossRef] [Green Version]
  16. Whyte, J.; Falcomer, R.; Chen, J. A Comparative Study of Radon Levels in Federal Buildings. Health Phys. 2019, 117, 242–247. [Google Scholar] [CrossRef] [PubMed] [Green Version]
  17. Ruano-Ravina, A.; Narocki, C.; López-Jacob, M.J.; García, A.; De, M.; Calle, C.; Peón-gonzález, J.; Barros-dios, J.M. Indoor Radon in Spanish Workplaces. A Pilot Study before the Introduction of the European Directive 2013/59/Euratom. Gac. Sanit. 2019, 33, 563–567. [Google Scholar] [CrossRef] [PubMed]
  18. Muñoz, E.; Frutos, B.; Olaya, M.; Sánchez, J. A Finite Element Model Development for Simulation of the Impact of Slab Thickness, Joints, and Membranes on Indoor Radon Concentration. J. Environ. Radioact. 2017, 177, 280–289. [Google Scholar] [CrossRef] [PubMed]
  19. Rizo Maestre, C.; Chinchón Yepes, S.; Echarri Iribarren, V. The Radon Gas in Underground Constructions. Railway Tunnel of Alicante (Spain). Int. J. Eng. Technol. 2018, 7, 393–395. [Google Scholar] [CrossRef] [Green Version]
  20. Kowalczk, A.J.; Froelich, P.N. Cave Air Ventilation and CO2 Outgassing by Radon-222 Modeling: How Fast Do Caves Breathe? Earth Planet. Sci. Lett. 2010, 289, 209–219. [Google Scholar] [CrossRef]
  21. Sainz, C.; Rábago, D.; Celaya, S.; Fernández, E.; Quindós, J.; Quindós, L.; Fernández, A.; Fuente, I.; Arteche, J.L.; Quindós, L.S. Continuous Monitoring of Radon Gas as a Tool to Understand Air Dynamics in the Cave of Altamira (Cantabria, Spain). Sci. Total Environ. 2018, 624, 416–423. [Google Scholar] [CrossRef]
  22. Rizo Maestre, C. The Radon Gas in Underground Buildings in Clay Soils. The Plaza Balmis Shelter as a Paradigm. Int. J. Environ. Res. Public Health 2018, 15, 1004. [Google Scholar] [CrossRef] [Green Version]
  23. Soniya, S.R.; Abraham, S.; Uddin, M.; Jojo, P.J. Investigation of Diffusive Transport of Radon through Bricks. Radiat. Phys. Chem. 2021, 178, 108955. [Google Scholar] [CrossRef]
  24. Frutos, B.; Martín-Consuegra, F.; Alonso, C.; Perez, G.; Peón, J.; Ruano-Ravina, A.; Barros, J.M.; Santorun, A.M. Inner Wall Filler as a Singular and Significant Source of Indoor Radon Pollution in Heritage Buildings: An Exhalation Method-Based Approach. Build. Environ. 2021, 201, 108005. [Google Scholar] [CrossRef]
  25. Nastro, V.; Carnì, D.L.; Vitale, A.; Lamonaca, F.; Vasile, M. Passive and Active Methods for Radon Pollution Measurements in Historical Heritage Buildings. Meas. J. Int. Meas. Confed. 2018, 114, 526–533. [Google Scholar] [CrossRef]
  26. Rizo Maestre, C.; Echarri Iribarren, V. The Importance of Checking Indoor Air Quality in Underground Historic Buildings Intended for Tourist Use. Sustainability 2019, 11, 689. [Google Scholar] [CrossRef] [Green Version]
  27. Lario, J.; Sánchez-Moral, S.; Cañaveras, J.C.; Cuezva, S.; Soler, V. Radon Continuous Monitoring in Altamira Cave (Northern Spain) to Assess User’s Annual Effective Dose. J. Environ. Radioact. 2005, 80, 161–174. [Google Scholar] [CrossRef] [PubMed]
  28. Goy Goy, J.L.; Pérez González, A.; Zazo Cardeña, C.; Calvo Sorando, J.P.; Vegas Martínez, R.; San José Lancha, M.A. Mapa Geológico de España E1:50.000 MADRID Segunda Serie—Primera Edición. Hoja 559 19-22 2020. Available online: https://mapas.igme.es/gis/rest/services/Cartografia_Geologica/IGME_MAGNA_50/MapServer (accessed on 1 October 2022).
  29. Garcia-Talavera San Miguel, M.; Martin-Matarranz, J.L.; Gil de Mingo, R.; García Cadierno, J.P.; Suárez Mahou, E. El Mapa Predictivo de Exposición Al Radón En España; Colección Informes Técnicos 38.2013; Consejo de Seguridad Nacional: Madrid, Spain, 2013; Volume 141, pp. 40–42. [Google Scholar]
  30. Sicilia, I.; Aparicio, S.; Frutos, B.; Muñoz, E.; González, M.; Anaya, J.J. A Multisensor System for the Characterization of the Field Pressure in Terrain. Accuracy, Response, and Adjustments. Sensors 2019, 19, 3942. [Google Scholar] [CrossRef] [Green Version]
  31. Rydock, J.P.; Skåret, E. A Case Study of Sub-Slab Depressurization for a Building Located over VOC-Contaminated Ground. Build. Environ. 2002, 37, 1343–1347. [Google Scholar] [CrossRef]
  32. Singh, K.; Singh, M.; Singh, S.; Sahota, H.S.; Papp, Z. Variation of Radon (222Rn) Progeny Concentrations in Outdoor Air as a Function of Time, Temperature and Relative Humidity. Radiat. Meas. 2005, 39, 213–217. [Google Scholar] [CrossRef]
Figure 1. Placement of the studied spaces in the building. The courtyard garden level was taken as the reference height (+0.00) for all plans.
Atmosphere 13 01692 g001
Figure 2. Plan of the basement with positions of spaces and sensors. Galleries A and B.
Atmosphere 13 01692 g002
Figure 3. Positions of spaces and sensors. (a) Office plan and section A-A′, with Gallery A and corridor. (b) Section B-B′: Gallery A, passage section, and neighbor spaces. Radon sensors (R) are highlighted in red. Pressure sensors (P) are highlighted in blue.
Atmosphere 13 01692 g003
Figure 4. (a) Gallery A, inner space observed from the entry door. (b) Gallery A, back. Inner space observed from Hole 1. (c) Gallery A, corridor, and door with the extraction system.
Atmosphere 13 01692 g004
Figure 5. Positions of spaces and sensors. Acoustic wing and reverberation chamber section. Radon sensors (R) are highlighted in red. Pressure sensors (P) are highlighted in blue.
Atmosphere 13 01692 g005
Figure 6. The radon monitoring system developed by the authors.
Atmosphere 13 01692 g006
Figure 7. PressureNet system developed by the authors [30]. (a) The multiplexer card and (b) the modules for pressure sensors.
Atmosphere 13 01692 g007
Figure 8. (a) Levels of radon in main wing spaces. Natural state (reference state). (b) Pressure in main wing spaces. Natural state (reference state). Pressure reference on office floor.
Atmosphere 13 01692 g008
Figure 9. (a) Radon measures during mitigation test. (b) Pressure differences measured during mitigation test. Mitigation test over Gallery A: (1) Pressurization test, (2) forced cross-ventilation test, (3) depressurization test, (4) single-sided natural ventilation, (5) natural state (reference state).
Atmosphere 13 01692 g009aAtmosphere 13 01692 g009b
Figure 10. (a) Radon and relative humidity in Galleries A and B. (b) Radon and temperature in Galleries A and B. (1) Pressurization test, (2) forced cross-ventilation test, (3) depressurization test, (4) single-sided natural ventilation, (5) natural state (reference state).
Atmosphere 13 01692 g010aAtmosphere 13 01692 g010b
Figure 11. Radon levels in the acoustic wing during a usual labor period. The World Health Organisation proposes a maximum reference radon level of 300 Bq/m3 to avoid health hazards [1].
Atmosphere 13 01692 g011
Figure 12. Radon and pressure levels in the acoustic wing. Pressure reference was established on the floor of the shed near the reverberation chamber.
Atmosphere 13 01692 g012
Figure 13. (a) Radon levels measured in the acoustic wing. (b) Pressure measures in the acoustic wing. (0) Initial state and setting of recovery levels. Reverberation chamber closed. (1) Pressurization test, (2) forced ventilation test, (3) depressurization test, (4) forced ventilation test (repeated).
Atmosphere 13 01692 g013
Table 1. Dimensions and characteristics of the analyzed spaces.
?VolumeOutdoor ContactIndoor ContactLevel
(Courtyard Reference)
m3m2m2m
MAIN WING
Gallery A /0.8−0.42/−1.66
Gallery B /0.8−0.42/−1.66
Corridor361contact with ventilated spaceswith several spaces−3.08
Office622.9 window 0.87
ACOUSTIC WING
Reverberation chamber210/5.80
Office—acoustic45.61.95 window1.70
Corridor—acoustic77.9/with several spaces0
Shed—acoustic 0
Table 2. Types of sensors and their placement.
Measure PointsRadonPressureObservations
MAIN WING
Gallery A, doorRadon + Raspberry (R1)1 sensor (P1)
Gallery A, back (Hole 1)Radon Eye RD200 + (R2)2 sensors, at different heights: 1 and 0.5 m from above (P2, P3)
Gallery B, doorRadon Eye RD200 + (R3)
CorridorRadon Eye RD200 (R4)1 sensor (P4)
OfficeRadon Eye RD200 (R5)2 sensors (table, P5 + outside, P8)Referential pressure in floor
Office (Hole 2) 1 sensor (P6)
Office (Hole 3) 1 sensor (P7)
ACOUSTIC WING
Reverberation chamberRadon Eye RD200 (R6)2 sensors (inner, P9 + door, P10)
Office—acousticRadon Eye RD200 (R7)2 sensors (window, P11 + floor, P12)
Corridor—acoustic 1 sensor (P13)
Shed—acoustic Referential pressure in floor
Table 3. Summary of radon levels (Bq/m3) achieved with mitigation tests.
?Gallery A—DoorGallery A—BackGallery B—DoorCorridorOffice
MeanSDMeanSDMeanSDMeanSDMeanSD
1. Pressurization35.732.561.715.3617.0241.762.0 *16.533.911.8
2. Forced ventilation406.0156.2139.540.0989.5315.984.7 *25.011.4 *6.3
3. Depressurization1292.6221.1606.3122.8623.5277.6176.0 *36.218.210.7
4. Natural ventilation802.2217.81319.8391.3482.1142.549.3 *16.356.717.3
5. Natural state3246.2486.33422.3541.1559.5230.1104.349.128.315.4
* Radon mitigation can be affected by the intake of outside air.
Table 4. Summary of pressure differences (Pa) achieved at mitigation tests. Reference level on the office floor.
?Gallery A—DoorGallery A—Back/Sensor P2Gallery A—Back/Sensor P3Office, Hole 2Office, Hole 3Corridor
MeanSDMeanSDMeanSDMeanSDMeanSDMeanSD
1. Pressurization16.651.1316.511.0416.701.0416.701.0311.380.911.381.64
2. Forced ventilation−0.460.29−1.110.15−1.110.170.090.160.200.330.341.53
3. Depressurization−15.851.64−16.471.56−16.471.61−15.001.55−9.011.300.981.18
4. Natural ventilation0.840.340.030.270.280.190.680.261.100.342.060.99
5.Natural state0.400.53−0.820.46−0.470.45−0.140.440.560.461.311.52
Table 5. Acoustic wing. Summary of radon levels and pressure differences achieved at mitigation tests. Reference level for pressure in the neighboring shed.
DescriptionPressure in Chamber
(Pa)
Radon in Chamber (Bq/m3)Pressure in Office
(Pa)
Radon in Office
(Bq/m3)
DoorInner
MeanSDMeanSDMeanSDMeanSDMeanSD
1Pressurization46.331.9045.822.0228.0452.104.730.31192.4528.75
2Ventilation24.670.4423.430.4276.2686.184.920.11315.5742.70
3Depressurization−54.221.04−55.031.04362.61121.684.010.3781.1319.96
4Ventilation 223.840.5622.960.5732.6532.866.010.34213.1140.43
Publisher’s Note: MDPI stays neutral with regard to jurisdictional claims in published maps and institutional affiliations.

