1. Introduction
In some parts of the world, radon gas from geological bedrocks and building materials can accumulate indoors and reach high activity concentrations exceeding the reference or action levels established by national and local legislation [
1,
2,
3]. The main mitigation strategies are based on sealing cracks, building protection with radon barrier materials, increasing home ventilation (natural or forced ventilation), and room pressurization. This work deals with radon barrier materials available on the market, coupled with forced ventilation [
4,
5].
Radon barriers are impermeable materials that block radon so it cannot enter the building. By inserting them between the foundation and the floor, these barriers are now required in new homes in known high-radon areas. Older homes or workplaces with high radon levels need to take advantage of other radon mitigation measures, such as increased ventilation and a radon pump, in addition to or as an alternative to radon barriers [
6,
7]. These materials can be applied to all horizontally and vertically constructed surfaces, thus isolating the building from radon exhaled from the subsoil and the building walls.
Among the products available on the market, the most popular are polymeric barrier materials, bitumen membranes, and aluminum foils, alone or coupled in a variety of ways, often reinforced with a polyester fiber matrix or glass fiber. Liquid membranes, such as bituminous emulsions or epoxy resin coated onto solid panels are also used.
The suitability of a material as a radon-proof barrier can be tested using the radon diffusion coefficient, a property that defines radon transport through the material [
8,
9]. Waterproof materials commonly used for protecting buildings have a radon diffusion coefficient ranging from 10
−11 to 10
−13 m
2 s
−1 [
10,
11,
12]. Experimental procedures for radon diffusion coefficient determination are based on the ISO/TS11665-13:2017 norm [
13]. Several papers used this method to illustrate the procedure and classify materials. See, for example, [
8,
9].
In this paper, we evaluate the properties of radon barrier materials using a different experimental approach (the model room approach). The inner walls of a scale model room created with an ignimbrite very rich in radon precursors [
6,
14] are covered with different types of membranes, and the indoor radon reduction is calculated. According to this procedure, the radon source is a building material, but the experimental outcomes have a broader exportability to the performance of the tested materials applied horizontally to the foundations of new homes, where soil radon may contribute significantly to indoor exposure. In addition, this experimental configuration allows for testing home ventilation coupled with radon barrier materials to reduce indoor radon [
6,
14].
2. Materials and Methods
Different types of radon barrier materials used in the construction industry were tested to evaluate their ability to reduce indoor radon accumulation in a scale model room [
6,
14] created with a porous ignimbrite rich in radon precursors.
2.1. Radon Barrier Materials
Twelve commercial products available on the market as radon barriers and plasterboard supports were tested. They were bituminous products, HDPE membranes, synthetic resins, polyurea-based membranes, polyurethane membranes and silane terminated polymers. They were applied on 11 mm thick plasterboard panels in different ways: glued for solid membranes or spread for liquid emulsions. Uncoated plasterboard supports were tested before analysing the barrier products applied to them. In the case of liquid membranes, the quantity of product applied on the plasterboard panels was chosen considering the running operative procedures in the construction industry.
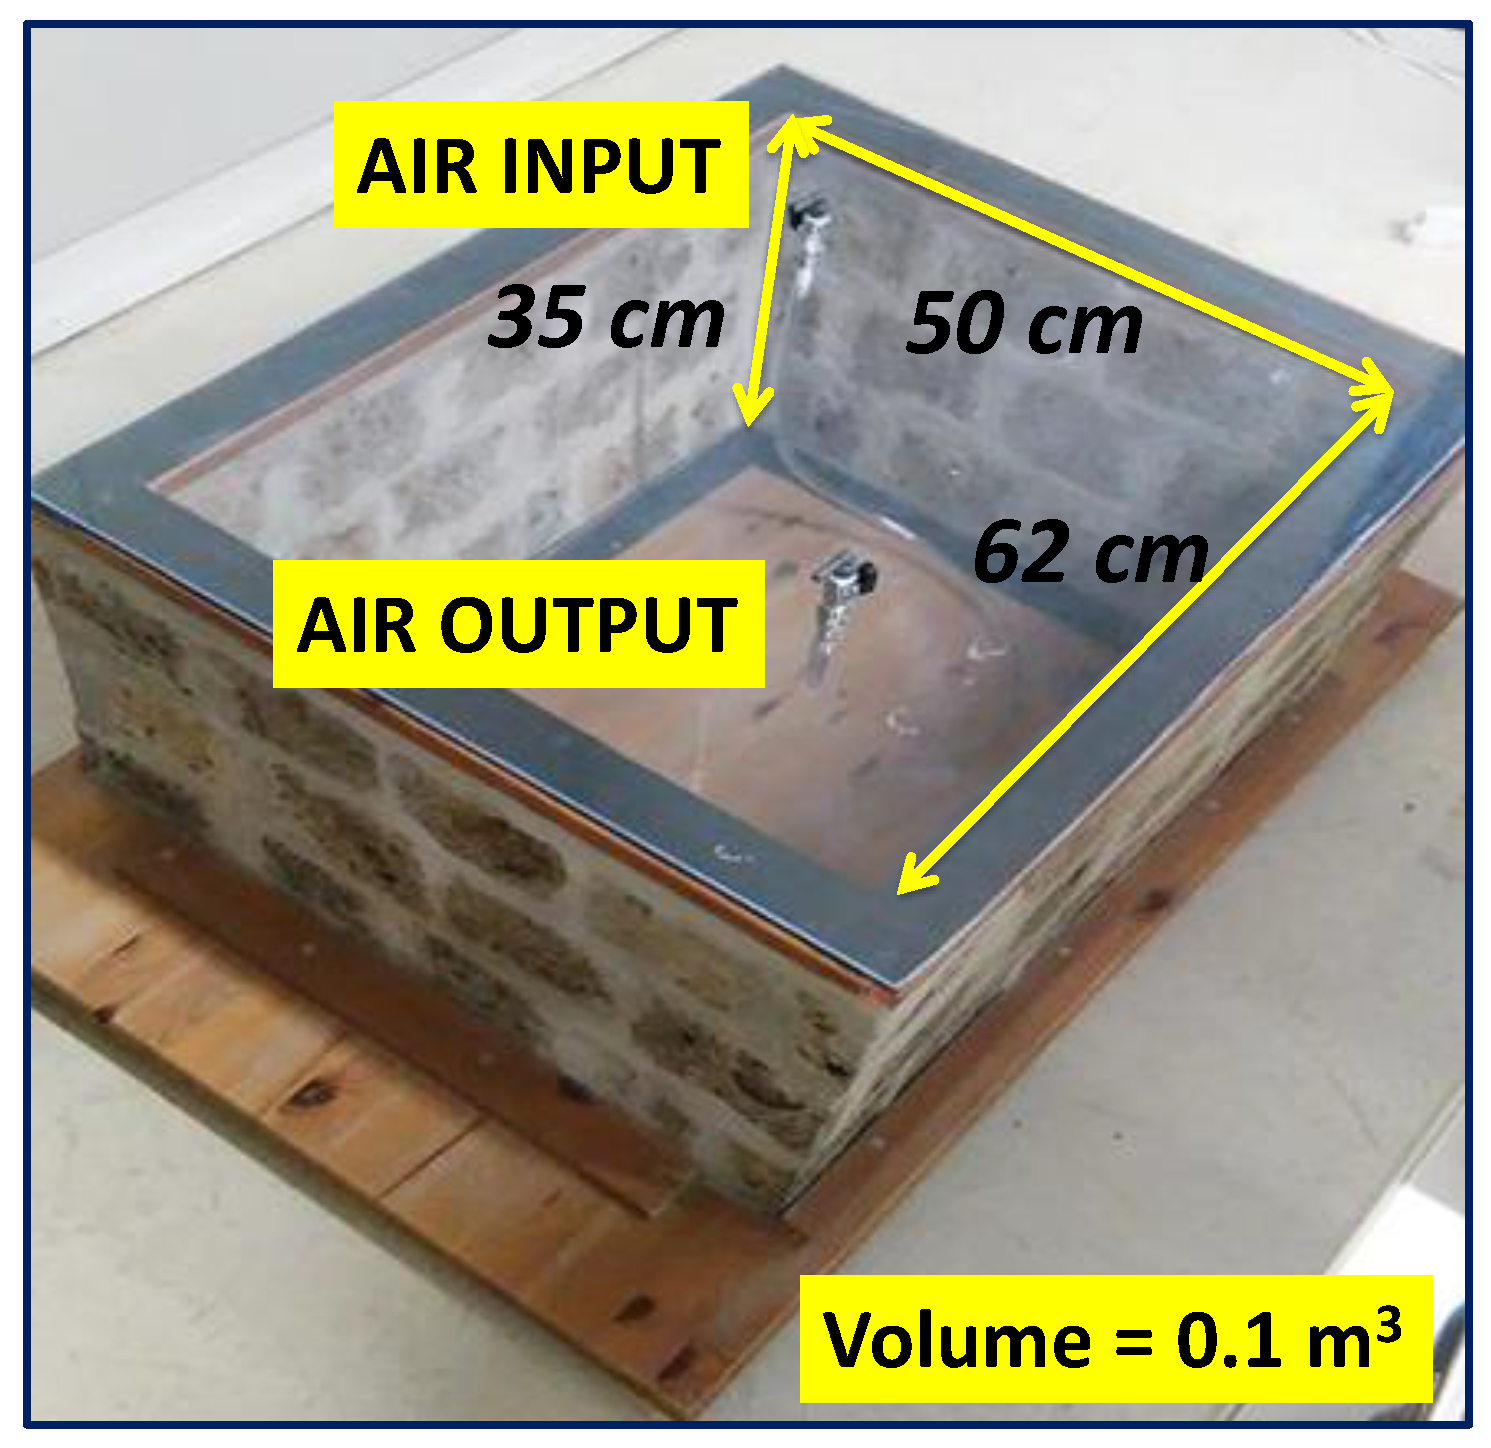
2.2. The Scale Model Room
As reported in [
6,
14], the model room was built with a very porous ignimbrite, called “Tufo di Gallese”, rich in radon and thoron precursors and thus characterised by high radon and thoron exhalation rates of 5.91 ± 0.14 and 6434 ± 494 Bq m
−2 h
−1, respectively. Only the walls of the chamber were created with ignimbrite stone (surface area of 0.78 m
2), while the floor and the roof were created with plexiglas boards. The system was created to evaluate the prevalent role of the chamber walls on indoor radon concentration while also considering its interaction with the outdoor environment. The inner volume of the room was approximately 0.110 m
3. Two taps applied on the upper Plexiglas board (
Figure 1) allowed the air exchange and the connection with the RAD7 monitor (Durridge Company Inc., Billerica, MA, USA) via vinyl tubing.
2.3. Radon Measurements
Indoor radon activity concentration in the scale model room was measured using the AER PLUS (Algade Instrumentation, Bessines-sur-Gartempe, France) and the RAD7 (Durridge Company, Inc.) radon monitors. The AER PLUS is a small solid-state radon detector with local storage for temperature and relative humidity data. It is battery supplied with an autonomy of one year.
The RAD7 is a continuous radon monitor that collects radon and thoron daughters (polonium isotopes) on the surface of its planar silicon detector, enabling high-resolution alpha spectroscopy of their decay energies. The instrument is equipped with a built-in pump to exchange air with the environment or with vials or chambers connected to it in a closed air loop. Temperature and relative humidity data are collected throughout the run.
No drierite was employed to avoid the effect of radon absorption by desiccant [
15]. Consequently, absolute humidity rose to 14.5 g of water in a kg of dry air during some experiments. This made it necessary to correct for the effect of water molecules on the efficiency of the two instruments, cross-calibrating them with respect to the radon chamber of the Istituto Nazionale di Geofisica e Vulcanologia (INGV, Roma, Italy), following the approach reported in [
16,
17]. More information on the derived corrections is reported in
Appendix A. An additional figure (
Figure A1) describing the experimental apparatus is provided in
Appendix B.
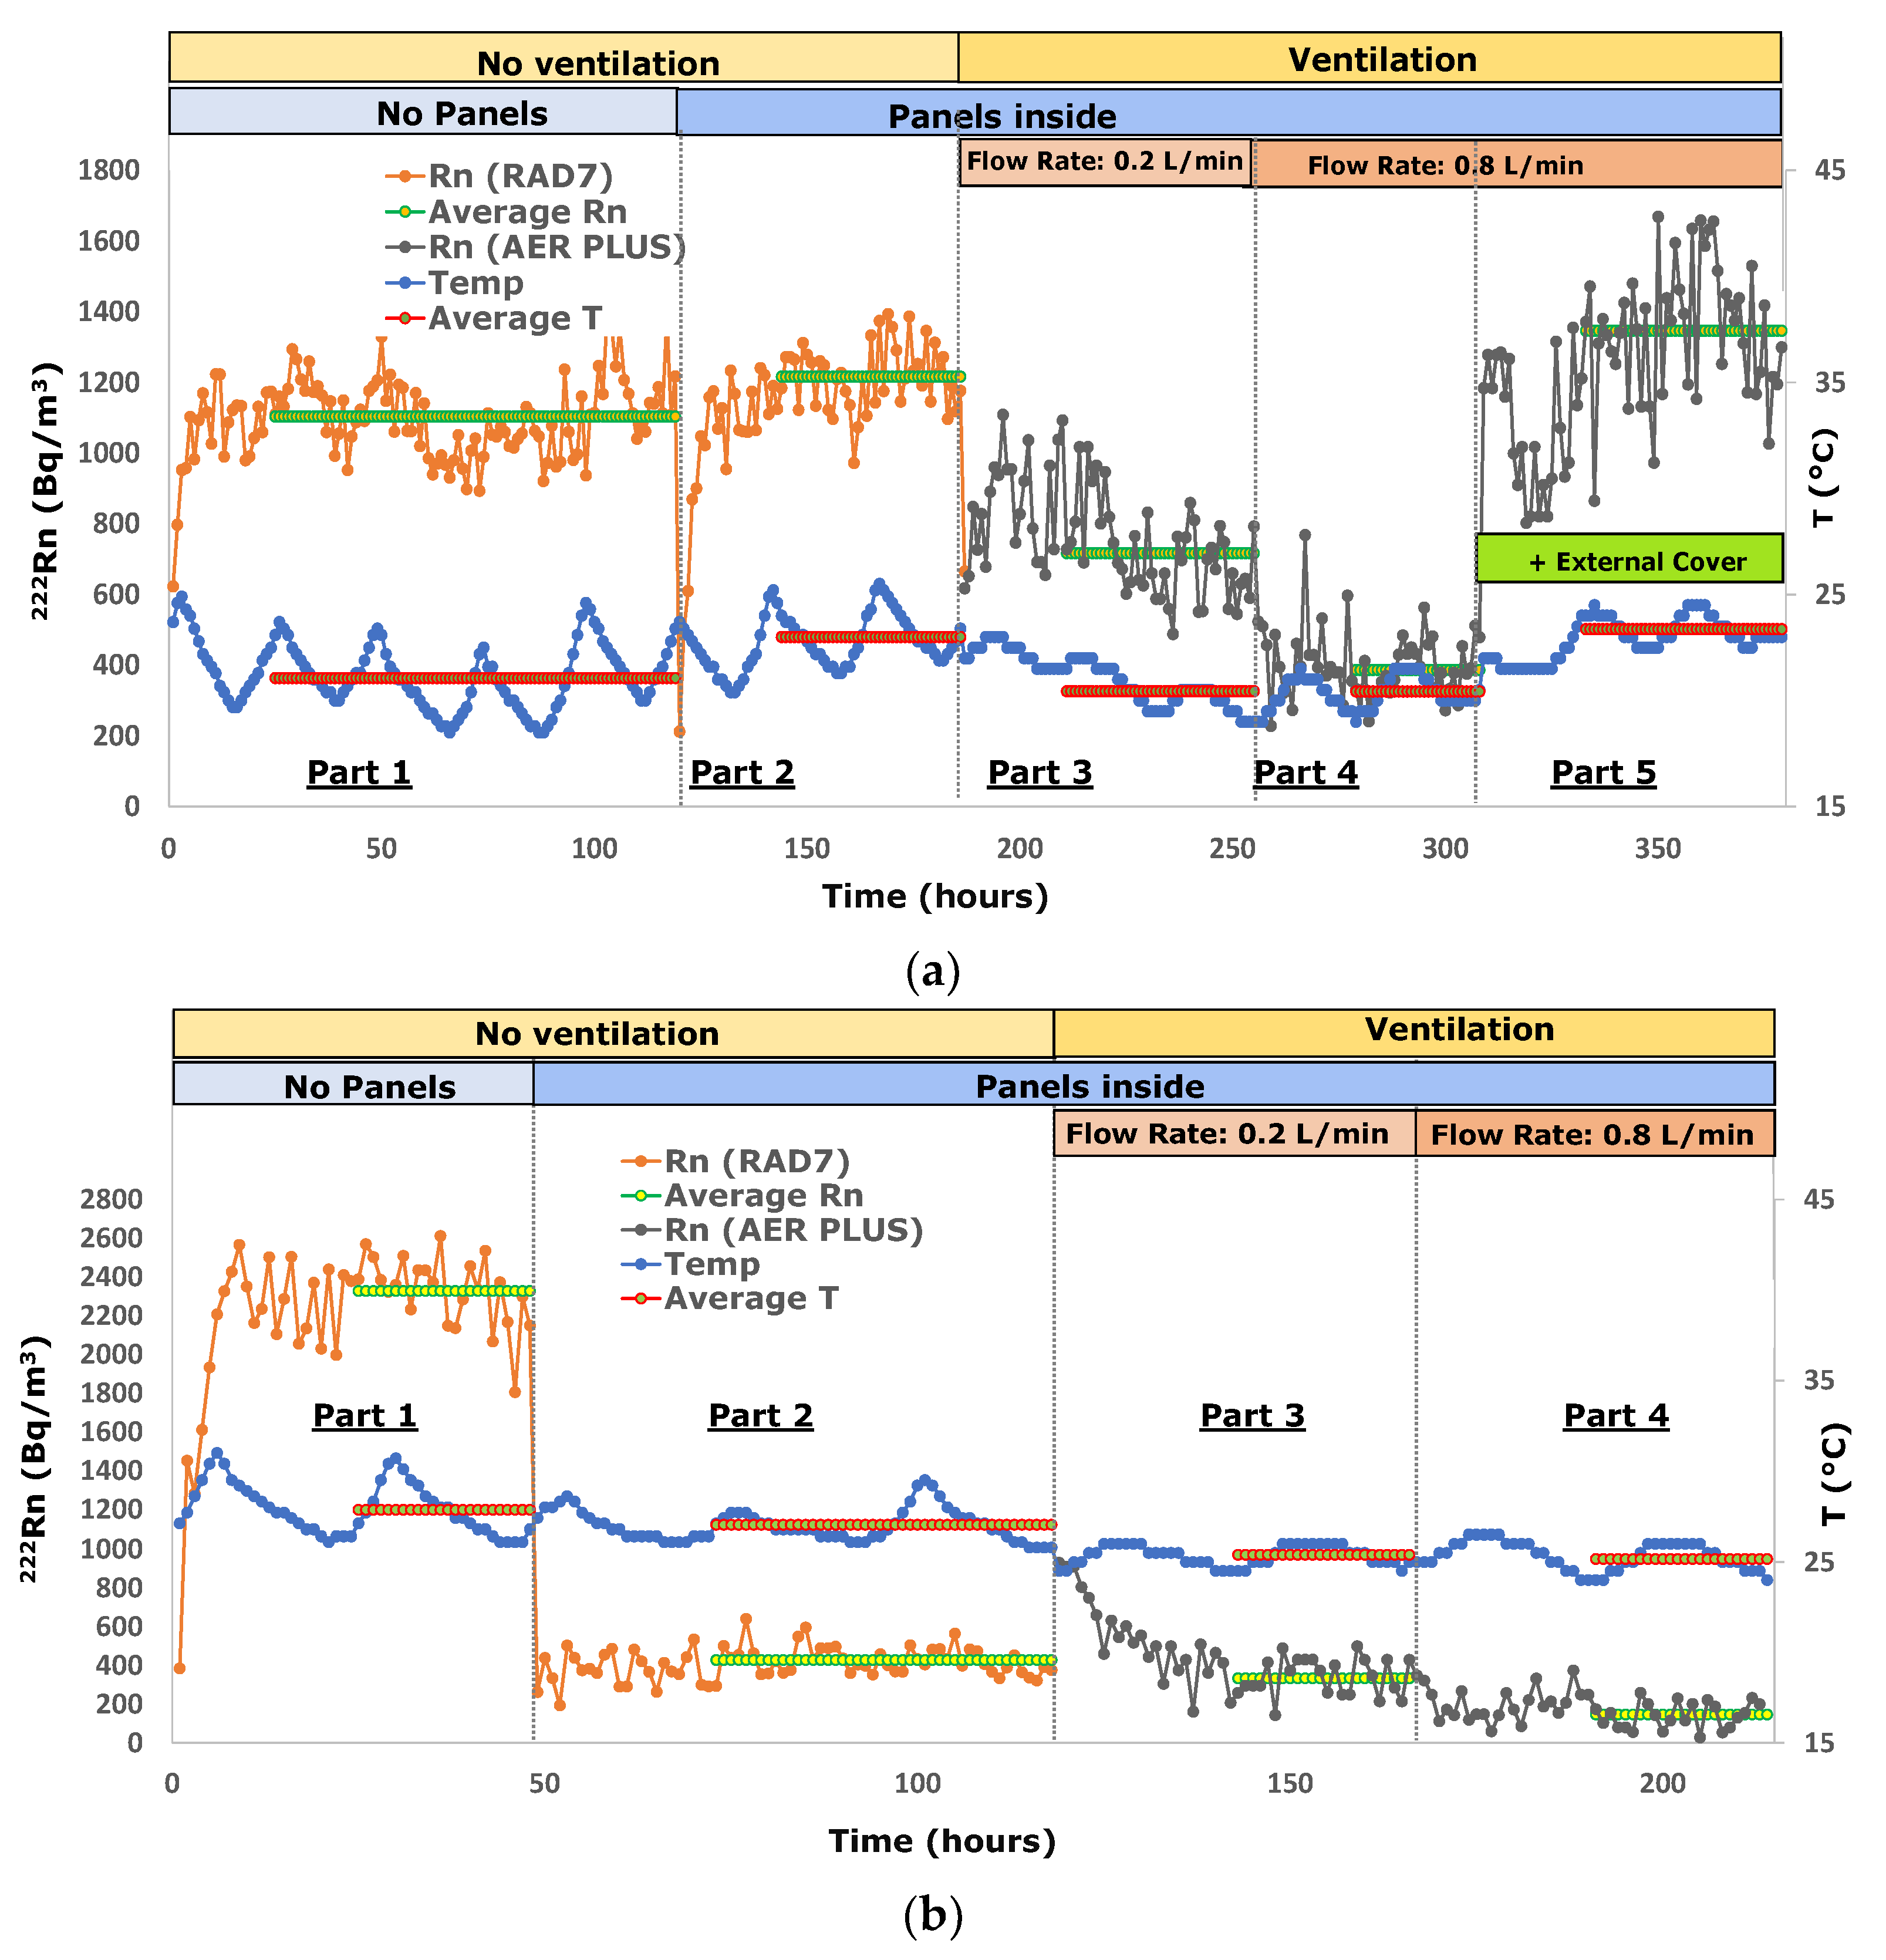
2.4. Experiments
Each experiment was divided into five parts: (1) the measurement of equilibrium 222Rn activity concentration without any panel on the inner side of the walls; (2) the determination of equilibrium 222Rn in the room with panels of plasterboard on the walls; (3) 222Rn evaluation with the introduction of outdoor air to the room at 0.2 L/min, keeping the panels on the walls; (4) 222Rn measurements with panels and air introduction at 0.8 L/min; (5) equilibrium 222Rn assessment without changing the previous experimental condition, except for a plastic cover on the outer side of the walls.
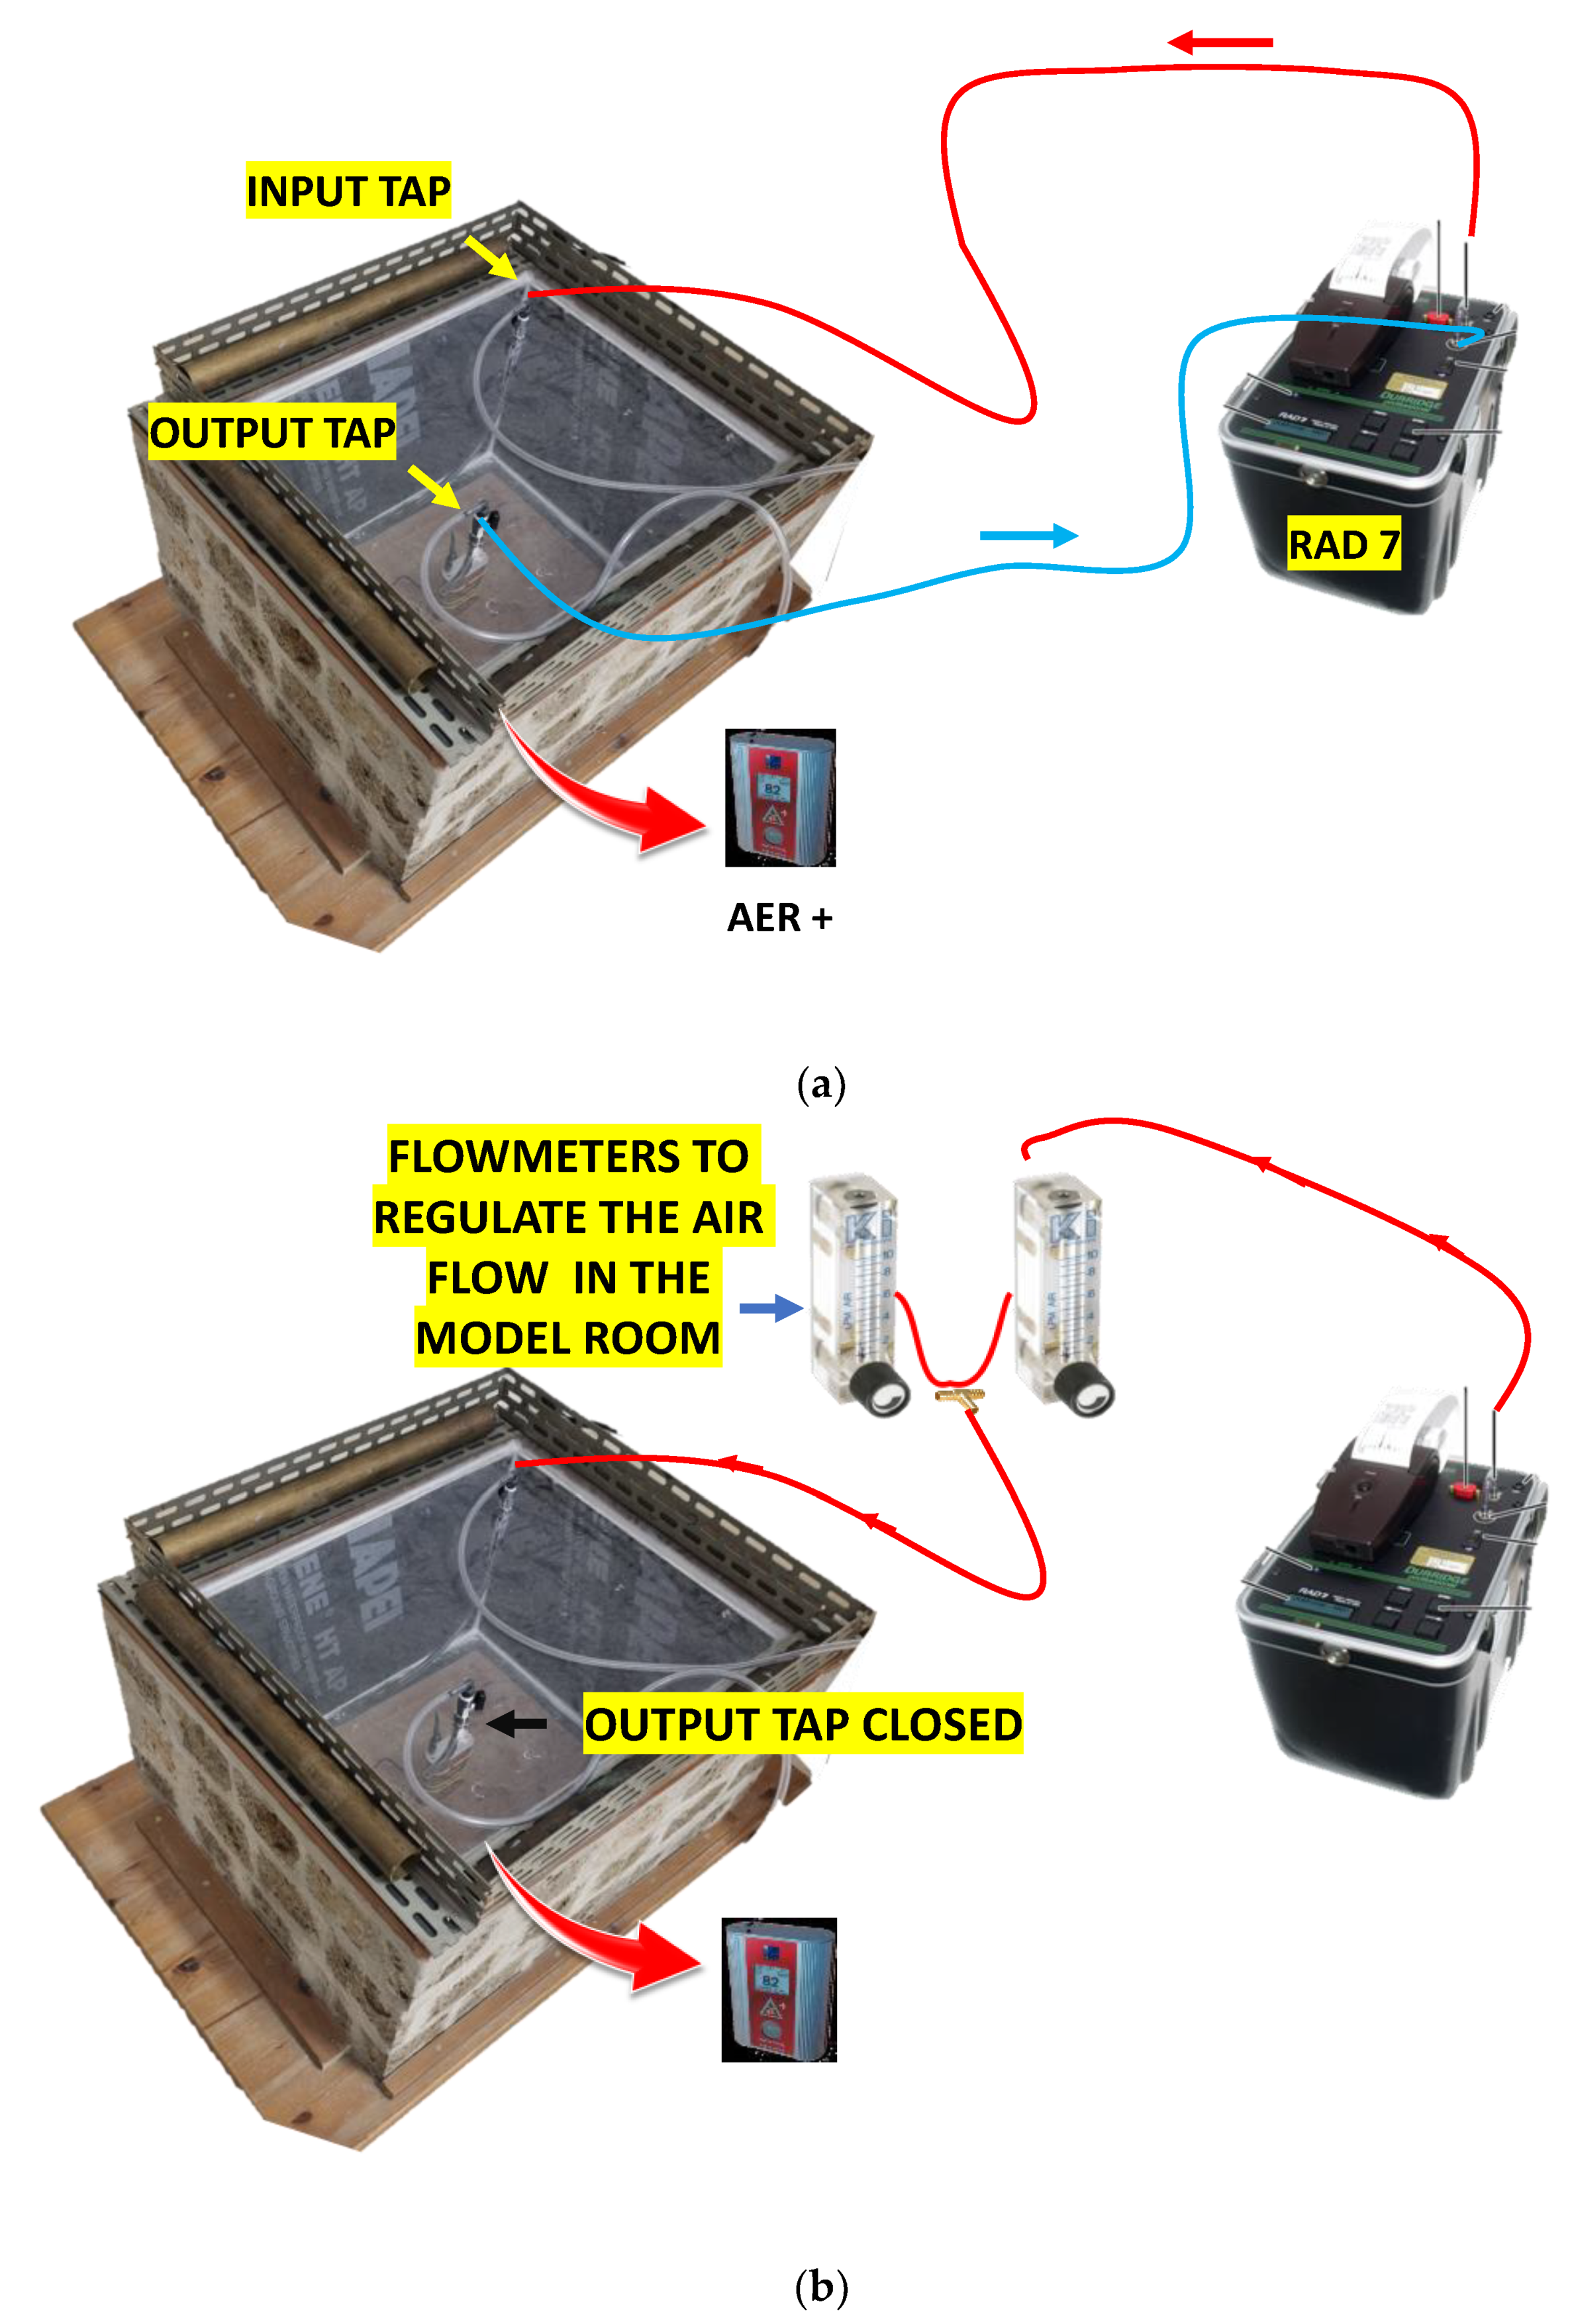
Equilibrium radon activity concentrations in the model room were detected with the AER PLUS and RAD7 radon monitors. In parts 1 and 2, both instruments were employed to have the possibility to crosscheck and compare results obtained in the different experimental phases where just one monitor could be used. However, the RAD7 data from parts 1 and 2 were processed because of the higher sensitivity and precision of this device.
The RAD 7 was not used in parts 3, 4 and 5 because it was employed to pump air in the model room, which was isolated from the outer environment. This implied that it was not possible to convey indoor air to the RAD7 and that only a small device (AER PLUS) placed in the chamber could monitor radon. See also
Figure A1 in
Appendix B.
The measurement interval was adjusted at 1 h for both instruments. The equilibrium between the radon exhaled from the ignimbrite and the decaying radon was always reached within 24 h. This condition was evaluated analytically (see
Appendix C).
After this time, radon, temperature and relative humidity data were averaged for the entire duration of the individual experimental phases and used to determine the levels of radon, temperature and relative humidity to be attributed to each part of the test (
Table 1).
All equilibrium radon data (Rn, in Bq m
−3) were linearly corrected for the effect of ambient temperature (T
ambient, in °C) on radon exhalation from the chamber walls using an experimental Equation (1), which refers all radon data to a temperature of 23 °C (Rn
23), which was the average temperature in the laboratory during the first experiments.
After this correction, the relative change of Indoor Radon (RIR) detected in the second, third and fourth parts of each experiment (Rn
B) with respect to the reference radon level of the first part (Rn
A) was expressed following Equation (2). Only for the evaluation of the radon change in the fifth part of the experiments (the same experimental conditions of part 4, but with an external cover on the walls), Rn
A was the indoor radon of step 4.
3. Results
The results of all the experiments are reported in
Table 2. Equilibrium radon data, normalized at 23 °C, are quoted as the average plus or minus one standard deviation from the mean, calculated starting from the 25th hour of each experimental phase. The standard deviations calculated for high radon levels or measured with the RAD7 are relatively lower than those for low radon activity concentrations or obtained with the AER PLUS.
The tested materials are listed according to their chemical nature because this parameter is generally considered the most important for defining the properties of commercial products, such as radon barriers [
10,
11,
12], although other factors, such as porosity, may affect radon diffusion, as discussed in the next section.
The radon and temperature data of experiments 1 and 13 are plotted in
Figure 2 as an example to show the data trends during the laboratory analyses of the inert material that supports radon barriers (the plasterboard in experiment 1) and, especially, of the product with the best performance (Aquaflex S1K in experiment 13).
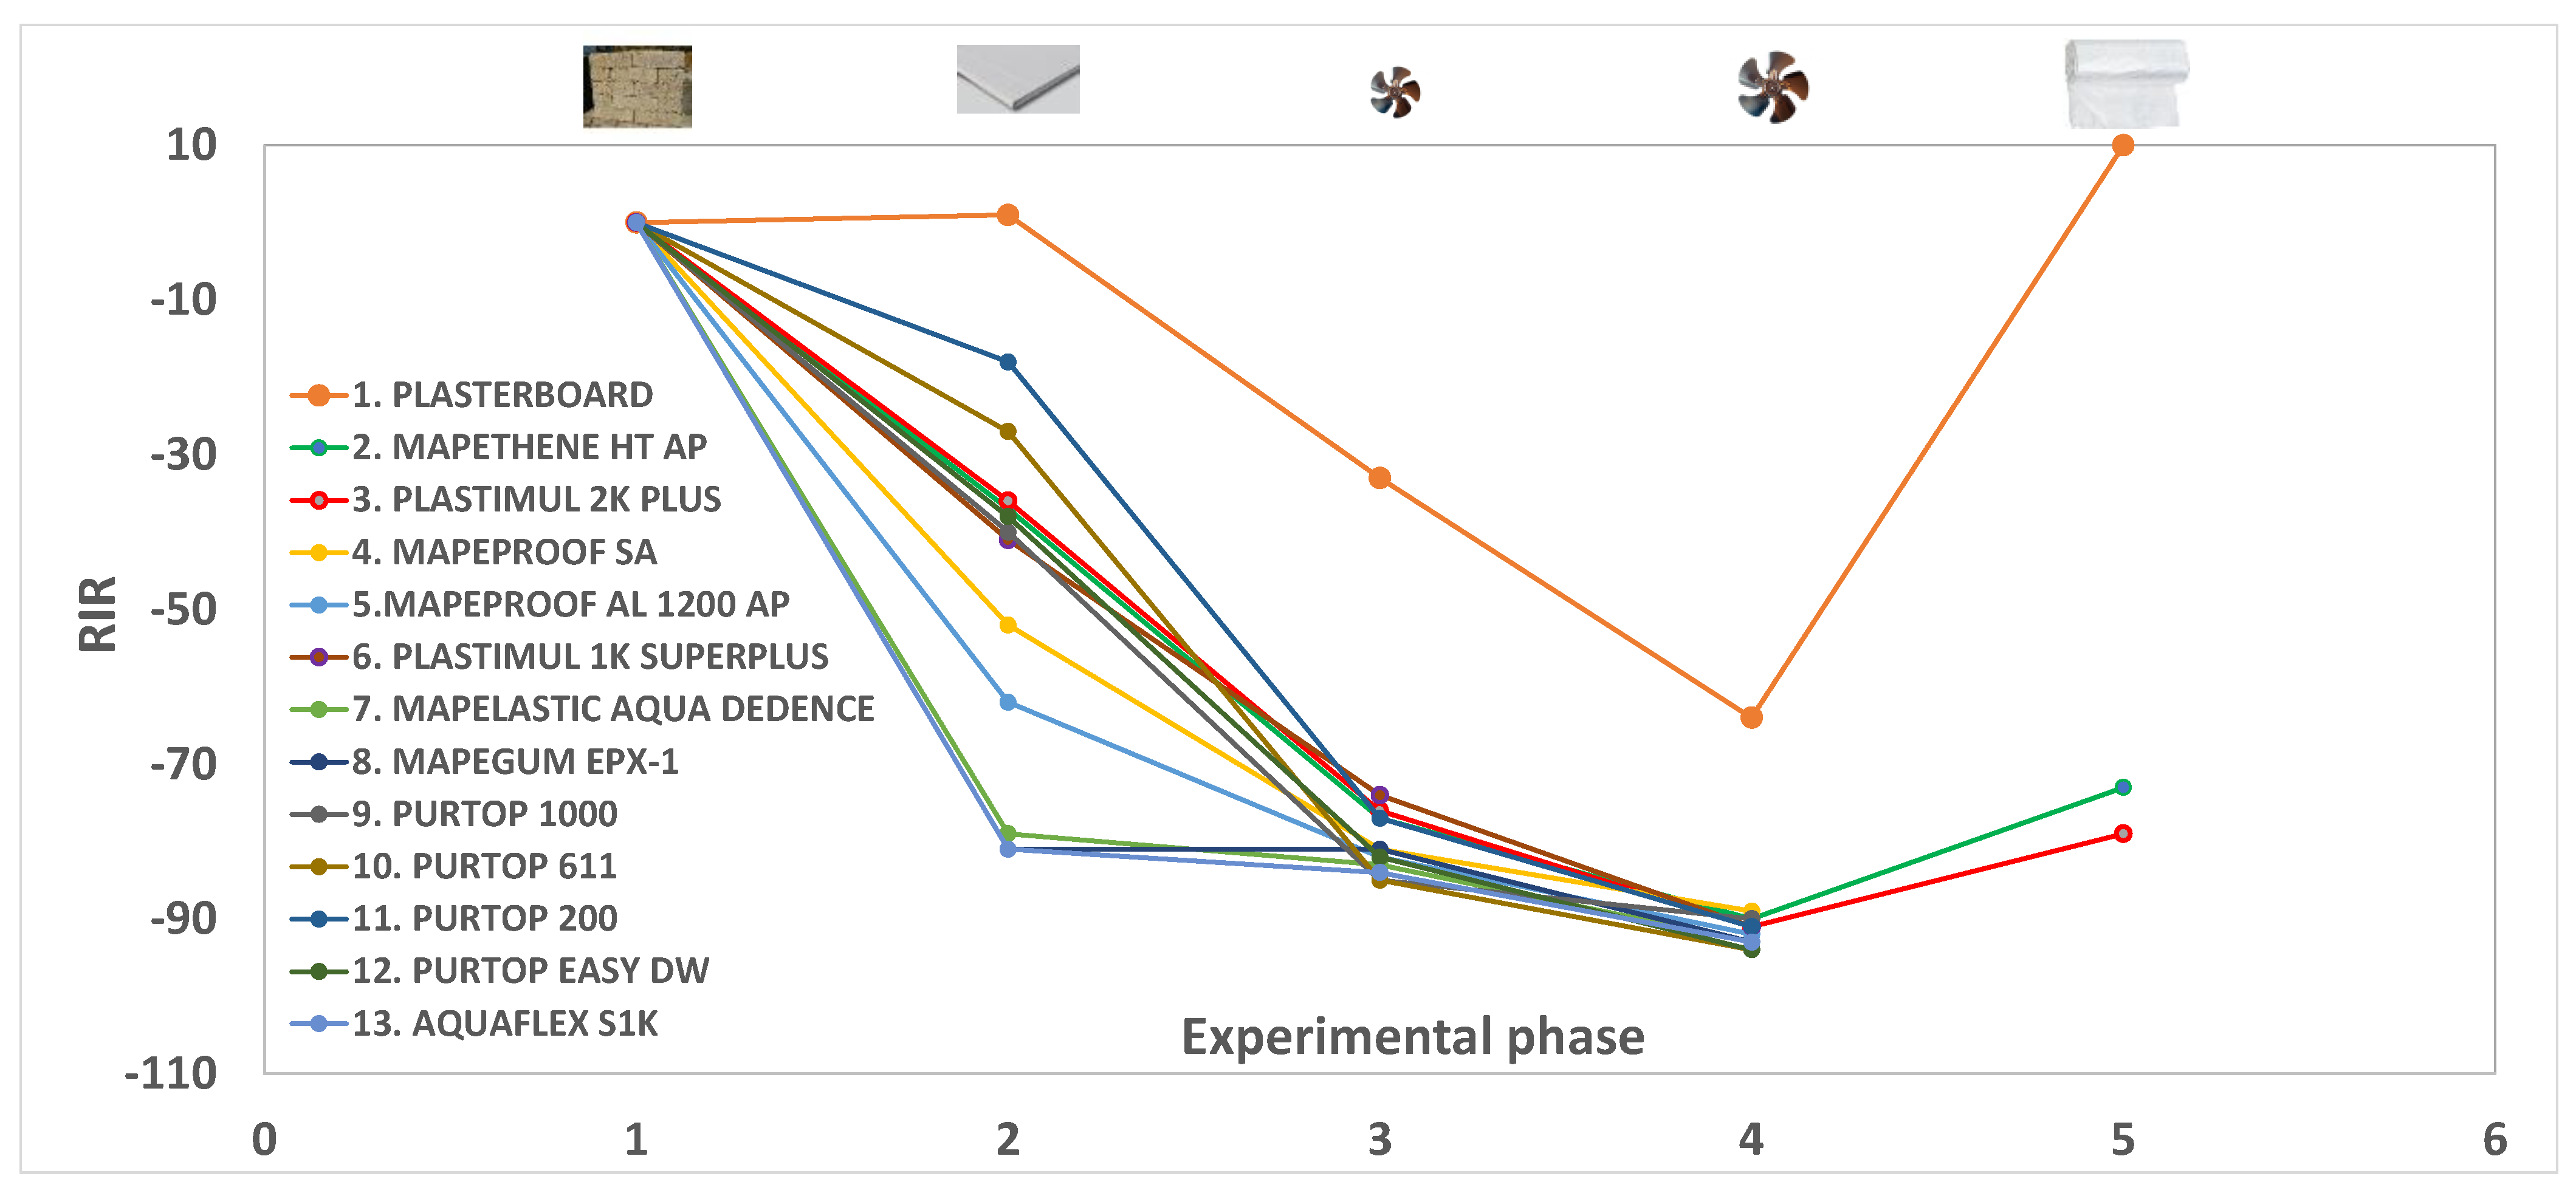
The average equilibrium radon in the model room related to the first part of the experiments (no panels on the walls) was 1502 ± 278 Bq m−3. As for the second part of the laboratory experiences (determinations with panels on the walls and no ventilation), samples 2, 3, and 6, belonging to the group of bitumen emulsion, provided RIR values of approximately −38, samples 4 and 5 (HDPE membranes) between −52 and −62, and samples 7 and 8 (synthetic resins) provided radon changes of approximately −80. Polyurea-based membranes analyzed in experiments 9, 10 and 11 were characterized by radon reductions in the model room ranging between −18 and −42. Finally, the polyurethane membrane (sample 12) and silane terminated polymer (sample 13) cut indoor radon by −38 and −81%, respectively.
The RIR data calculated in the third part of the experiments (test with panels on the walls and air introduction at 0.2 L min−1) range from −74 to −85, whereas corresponding values in the fourth part of the experiments (test with panels on the walls and air introduction at 0.8 L min−1) range from −89 to −94.
The fifth part of the experiments (conditions similar to those of part 4, except for a plastic cover on the outer side of the walls) was carried out only for samples 1, 2 and 3 because it was difficult to reproduce the outer insulation of the room from experiment to experiment. The indoor radon of part 5, compared with that of part 4, shows a relative increase ranging from 126% to 204%, with 126% referring to the plasterboard alone.
4. Discussion
Based on the results shown in
Table 2, the plasterboard (experiment 1) does not prevent radon diffusion. As a matter of fact, the equilibrium concentrations obtained in the first and second parts of the test correspond within the error range (
Figure 2a), making it suitable to support all radon barrier materials, either in the form of paint or adhesive films, and enhance their different properties.
Taking into consideration the relative change in indoor radon (RIR) determined in the second part of the experiments (
Table 2 and
Figure 3), it emerges that synthetic resins (samples 7 and 8) are the products with the best performance, reducing radon by approximately 81%. A similar outcome is provided by a silane-terminated polymer (sample 13, see
Figure 2b).
Intermediate behaviors with an average RIR of −57 were shown by HDPE materials (samples 5 and 4), while bituminous products (samples 2, 3, and 6) provided an average radon reduction of −38%. Finally, polyurea-based and polyurethane membranes (samples 9, 10, 11, and 12) supplied RIRs ranging from −18 to −42, although these differences could be due to the different structures of these polymers.
The performance of radon barrier materials is broadly correlated to radon diffusion coefficients, as shown by a comparison of RIR values obtained in this paper with radon diffusion coefficients reported in the technical reports of the products (
Table 2). HDPE membranes (samples 4 and 5) with an average RIR of −57% are characterized by the lowest diffusion (1.21–1.43 · 10
−13 m
2 s
−1), while bitumen membranes (samples 2, 3 and 6) with an average RIR of −38% provided radon diffusion coefficients ranging from 1.99 to 7.81 · 10
−13 m
2 s
−1.
The ability of tested materials to stop radon flow is dependent on the chemical nature of the products but also on their porosity. This issue is well described by polyurea-based membranes with a different concentration of hydrogen bonds and degree of branching in the structure, and thus a different porosity. The materials with the highest concentrations of hydrogen bonds and an average degree of branching (sample 9), characterized by the lowest porosity, provided the highest RIR (−42%). Medium and lowest densities of hydrogen bonds and low degrees of branching (samples 10 and 11) correspond to medium and lowest RIR values (−27 and −18, respectively), demonstrating that the hydrogen bond concentration and the degree of branching are inversely correlated with porosity, but directly with the ability of anti-radon barriers to stop the gas.
Looking at the results of the third and fourth parts of the experiments, it is evident that the introduction of air enhances the performance of anti-radon barriers, and the higher the airflows, the stronger the radon reduction (approximately 81% at flows of 0.2 L min
−1 and 92% at 0.8 L min
−1). This behavior, linked to a progressive overpressure in the model room and thus to a decreasing pressure gradient between the room and the outside, drives radon exhaled from the chamber walls outward, as already reported in [
6].
According to this, the improved performances of tested materials at higher flows are dramatically reduced for products with the best barrier properties (
Table 2 and
Figure 3). For example, the RIR of sample 11 changed from −18 (part 2 of the test) to −77 (part 3) to −91 (part 4), while the radon reduction of sample 13 is −81% (part 2), −84% (part 3) and −93% (part 4). This is due to a progressive reduction of pressure gradients induced by more efficient materials as the airflow increases. Similarly, the plasterboard alone induces the lowest overpressure in the model room, resulting in the lowest radon reduction at an increasing flow (
Figure 3).
Since the advantage created by the simultaneous use of radon barrier materials (samples 7, 8, and 13) and forced ventilation is dramatically reduced for products with the best barrier properties, it appears that the exclusive use of these products, without ventilation, could reduce energy consumption and costs with similar results.
Finally, the external closure of the room with impervious materials (part 5 of experiments 1, 2, and 3) demonstrates that if the air exchange is inhibited, radon exhaled from the room’s walls moves inward, despite the forced ventilation [
14].
5. Conclusions
Using the scale model room approach and the plasterboard as an inert support for waterproofing products, the radon barrier properties of twelve materials were evaluated.
Synthetic resin and a silane-terminated polymer provided an indoor radon reduction of approximately 80%, HDPE membrane provided between 52% and 62%, bitumen products, polyurea-based membranes and a polyurethane polymer provided RIRs between −18 and −41. This behavior depends on the chemical composition of the products but seems to be related to their structure and porosity. Further studies are necessary to ascertain that.
The simultaneous use of membranes and forced ventilation improves radon reduction because of an increase in room overpressure as airflow increases. This effect is much less significant for the products with the best capacity to isolate the room because radon exhaled from the room’s walls is preferentially driven outward. Based on that, it is possible to reach approximately the same result without turning on the ventilation, with an evident energy savings, and avoiding an increase in noise pollution.
Author Contributions
M.P., P.T., M.S. and G.G. were equally involved in conceptualization, methodology, formal analysis, investigation, and writing. C.L. and D.V. participated to investigation and validation. All authors have read and agreed to the published version of the manuscript.
Funding
This research was carried out in the frame of a PhD project”, funded by Università degli Studi “Roma Tre”, PON DM 1061. C.L and D.V. provided us with the products to be tested.
Institutional Review Board Statement
Not applicable.
Informed Consent Statement
Not applicable.
Data Availability Statement
All data are reported in the present manuscript.
Acknowledgments
Authors wish to thank Federica Sola and Ilaria Rocchetti for technical support.
Conflicts of Interest
The authors declare no conflict of interest. The funders had no role in the design of the study; in the collection, analyses, or interpretation of data; in the writing of the manuscript, or in the decision to publish the results.
Appendix A
The effect of water molecules on the electrostatic collection of 218Po ions onto the surface of the AER PLUS and RAD7 silicon detectors (neutralization) was evaluated through comparison with the INGV radon chamber equipped with a scintillation cell (ZnS), which is not affected by air humidity.
The INGV radon chamber is a 56 L stainless steel box equipped with a scintillation cell (ZnS) coupled with a photomultiplier. A range of 1.5 to 14.5 g of H
2O in a kg of dry air was investigated to reproduce the laboratory climatic conditions according to experimental configurations described in [
16,
17]. New equations were developed to correct the efficiencies of the AER PLUS and the RAD7 radon detectors after a few years of previous calibrations [
16,
17].
The radon activity concentration detected by the AER with reference to that provided by the scintillation cell (R) was equal to:
Radon activity concentration detected by the RAD7 with reference to the radon value provided by the scintillation cell (R) was equal to:
Appendix B
A schematic diagram of the experimental apparatus is shown in
Figure A1.
Figure A1.
Experimental configurations used in parts 1 and 2 (a) and in parts 3, 4, and 5 (b) of the tests. The red arrows indicate that the AER PLUS monitor was placed in the model room.
Figure A1.
Experimental configurations used in parts 1 and 2 (a) and in parts 3, 4, and 5 (b) of the tests. The red arrows indicate that the AER PLUS monitor was placed in the model room.
Appendix C
The results of a data analysis procedure applied to all experiments are reported in
Table A1; namely, the standard deviation from the mean of different segments of a test was used to demonstrate that the equilibrium of radon activity concentration was already reached after 24 h within the error range. As an example, we report the analysis of experiment 13. In regards to part 1, we compared the average and the standard deviation of the radon data from 25 to 48 h with those from 13 to 24 h. For all parts (including part 1), we compared the average and the standard deviations of the radon data from 25 to 48 h with those of the first (25–36 h) and following 12 (from 37 to 48 h) hours of the considered 24-h interval (from 24 to 48 h). Where available, we compared the average and the standard deviation of the radon data from 25 to 48 h with those from the following periods (49–70 h for the specific experiment in
Table A1).
Table A1.
Average and standard deviation of radon activity concentrations in different intervals of experiment 13 (
Table 2 and
Figure 2b) demonstrate that equilibrium conditions are already reached after 24 h from the beginning of each part. Time counting is continuous within each test and not interrupted at the end of the single experimental parts.
| | Average and Standard Deviation of Radon Data |
|---|
| | From 13 to 24 h | From 25 to 48 h | From 25 to 36 h | From 37 to 48 h | From 49 to 70 h |
|---|
| Part 1 | 2269 | ± | 191 | 2329 | ± | 184 | 2428 | ± | 107 | 2231 | ± | 194 | - | - | - |
| Part 2 | - | - | - | 438 | ± | 82 | 434 | ± | 96 | 443 | ± | 68 | 415 | ± | 63 |
| Part 3 | - | - | - | 334 | ± | 99 | 338 | ± | 105 | 329 | ± | 96 | - | - | - |
| Part 4 | - | - | - | 146 | ± | 69 | 139 | ± | 70 | 153 | ± | 71 | - | - | - |
References
- Bossew, P. Local probability of indoor radon concentration to exceed the threshold estimated from geogenic radon potential. Nucl. Technol. Radiat. Prot. 2017, 32, 70–76. [Google Scholar] [CrossRef]
- Ciotoli, G.; Voltaggio, M.; Tuccimei, P.; Soligo, M.; Pasculli, A.; Beaubien, S.E.; Bigi, S. Geographically weighted regression and geostatistical techniques to construct the geogenic radon potential map of the Lazio region: A methodological proposal for the European Atlas of Natural Radiation. J. Environ. Radioact. 2017, 166, 355–375. [Google Scholar] [CrossRef] [PubMed]
- Petermann, E.; Bossew, P. Mapping indoor radon hazard in Germany: The geogenic component. Sci. Total Environ. 2021, 780, 146601. [Google Scholar] [CrossRef] [PubMed]
- Ennemoser, O.; Oberdorfer, E.; Brunner, P.; Schneider, P.; Purtscheller, F.; Stingl, V.; Ambach, W. Mitigation of indoor radon in an area with unusually high radon concentrations. Health Phys. 1995, 69, 227–232. [Google Scholar] [CrossRef]
- Pol, R.; Rodríguez, R.; Quindós, L.S.; Fuente, I. Measurement and Mitigation of Radon Concentration in a Traditional Dwelling in Galicia, Spain. Atmosphere 2022, 13, 14. [Google Scholar] [CrossRef]
- Lucchetti, C.; Galli, G.; Tuccimei, P. Indoor/outdoor air exchange affects indoor radon. The use of a scale model room to develop a mitigation strategy. Adv. Geosci. 2022, 57, 81–88. [Google Scholar] [CrossRef]
- Marley, F.; Phillips, P.S. Investigation of the potential for radon mitigation by operation of mechanical systems affecting indoor air. J. Environ. Radioact. 2001, 54, 205–219. [Google Scholar] [CrossRef] [PubMed]
- Jiranek, M.; Rovenska, K.; Fronka, A. Radon diffusion coefficient—A material property determining the applicability of waterproof membranes as radon barriers. In Proceedings of the American Association of Radon Scientists and Technologists, Las Vegas, NV, USA, 14–17 September 2008. [Google Scholar]
- Ruvira, B.; García-Fayos, B.; Juste, B.; Arnal, J.M.; Verdú, G. Experimental estimation of the diffusion coefficient in radon barrier materials based on ISO/TS 11665-13:2017. Radiat. Phys. Chem. 2022, 193, 109993. [Google Scholar] [CrossRef]
- Jiranek, M.; Hůlka, J. Radon diffusion coefficient in radon-proof membranes—Determination and applicability for the design of radon barriers. Int. J. Archit. Herit. 2000, 1, 149–155. [Google Scholar]
- Jiranek, M.; Hůlka, J. Applicability of various insulating materials for radon barriers. Sci. Total Environ. 2001, 272, 79–84. [Google Scholar] [CrossRef] [PubMed]
- Jiranek, M.; Kotrbata, M. Radon diffusion coefficients in 360 waterproof materials of different chemical composition. Radiat. Prot. Dosim. 2011, 145, 178–183. [Google Scholar] [CrossRef] [PubMed]
- ISO/TS 11665-13: 2017; Measurement of Radioactivity in the Environment—Air: Radon 222—Part 13: Determination of the Diffusion Coefficient in Waterproof Materials: Membrane Two-Side Activity Concentration Test Method. International Standardization Organization (ISO): Geneva, Switzerland, 2017.
- Lucchetti, C.; Castelluccio, M.; Altamore, M.; Briganti, A.; Galli, G.; Soligo, M.; Tuccimei, P.; Voltaggio, M. Using a scale model room to assess the contribution of building material of volcanic origin to indoor radon. Nukleonika 2020, 65, 71–76. [Google Scholar] [CrossRef]
- De Simone, G.; Galli, G.; Lucchetti, C.; Tuccimei, P. Calibration of BIG Bottle RAD H2O set-up for radon in water using HDPE bottles. Radiat. Meas. 2015, 76, 1–7. [Google Scholar] [CrossRef]
- Galli, G.; Cannelli, V.; Nardi, A.; Piersanti, A. Implementing soil radon detectors for long term continuous monitoring. Appl. Radiat. Isot. 2019, 153, 108813. [Google Scholar] [CrossRef] [PubMed]
- De Simone, G.; Lucchetti, C.; Galli, G.; Tuccimei, P. Correcting for H2O interference using electrostatic collection-based silicon detectors. J. Environ. Radioact. 2016, 162–163, 146–153. [Google Scholar] [CrossRef] [PubMed]
| Disclaimer/Publisher’s Note: The statements, opinions and data contained in all publications are solely those of the individual author(s) and contributor(s) and not of MDPI and/or the editor(s). MDPI and/or the editor(s) disclaim responsibility for any injury to people or property resulting from any ideas, methods, instructions or products referred to in the content. |
© 2022 by the authors. Licensee MDPI, Basel, Switzerland. This article is an open access article distributed under the terms and conditions of the Creative Commons Attribution (CC BY) license (https://creativecommons.org/licenses/by/4.0/).


