
Blockage of Autophagy Increases Timosaponin AIII-Induced Apoptosis of Glioma Cells In Vitro and In Vivo

 , , and
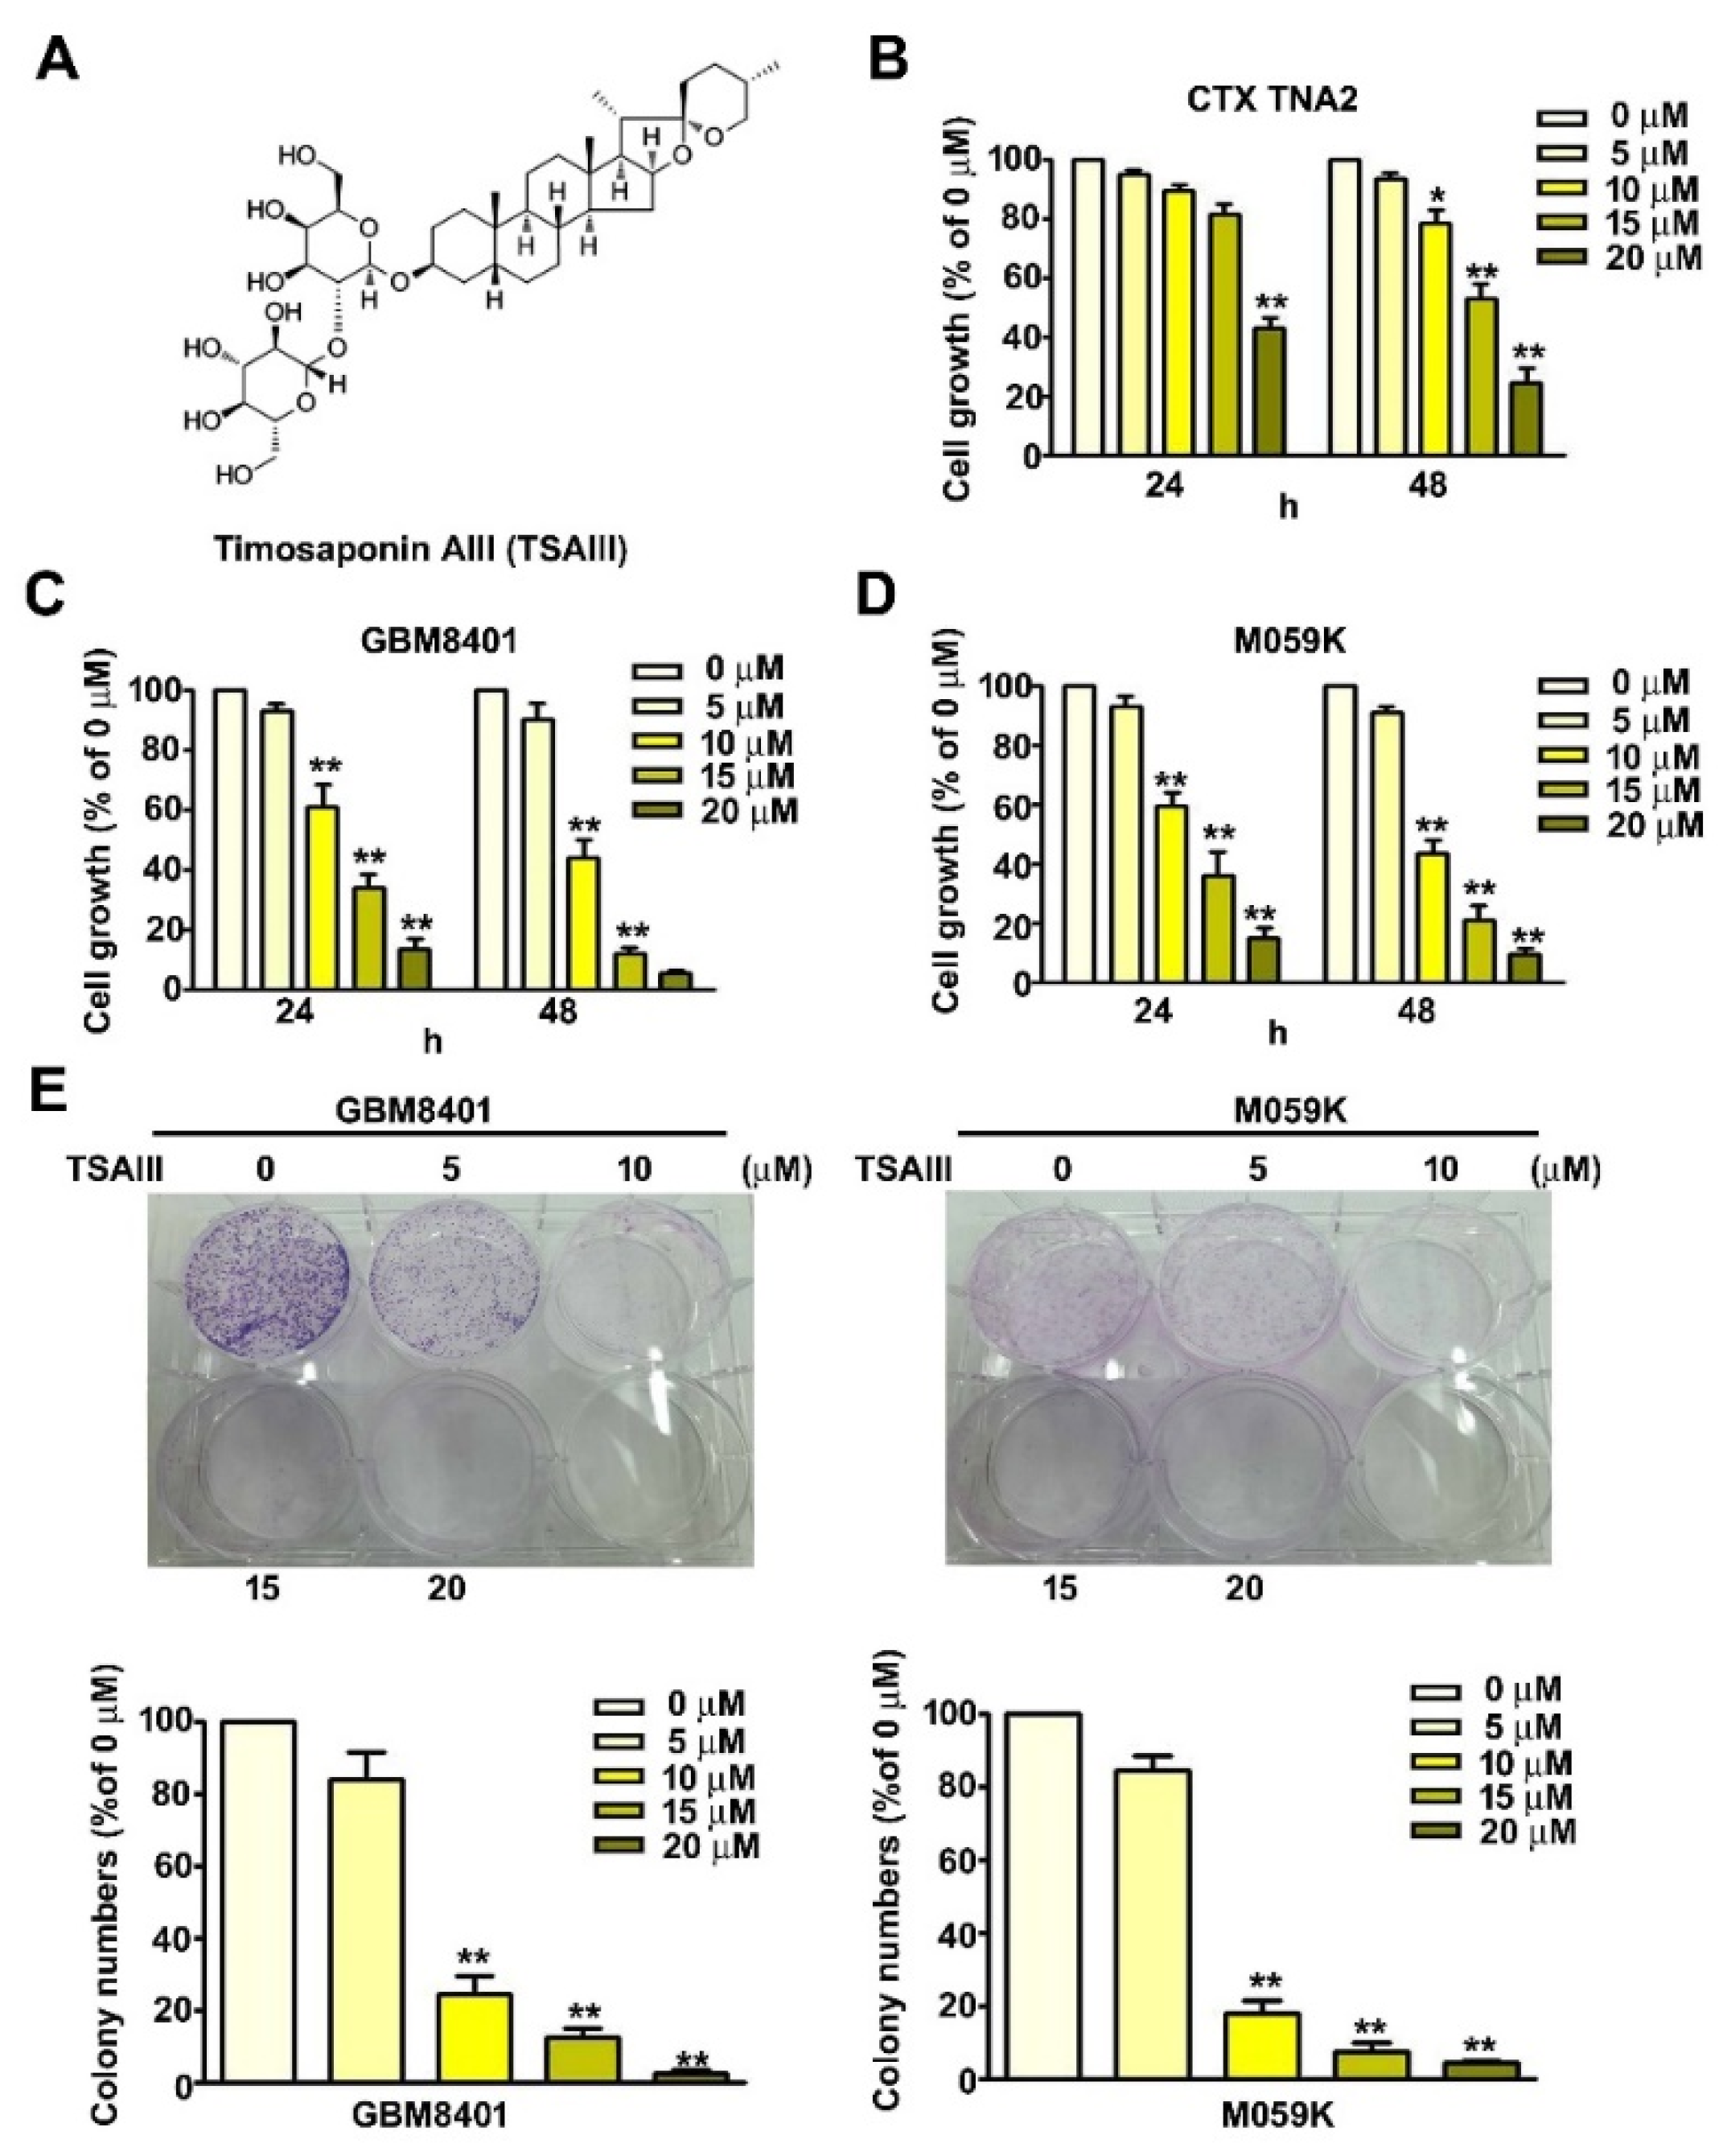
Abstract
:1. Introduction
2. Materials and Methods
2.1. Chemicals and Reagents
2.2. Cell Lines and Culture Conditions
2.3. Cell Proliferation Assay
2.4. Colony Formation Assay
2.5. Apoptosis Assay with Annexin V/PI Staining
2.6. Mitochondrial Function Assay with JC-1 Staining
2.7. Detection of Autophagy with AO Staining
2.8. siRNA Transfection Assay
2.9. Western Blot Analysis
2.10. In Vivo GBM8401 Xenograft-Bearing Mice and GBM Orthotopic Mice Model
2.11. Immunohistochemical Analysis
2.12. Statistical Analysis
3. Results
3.1. TSAIII Decreases Viability and Inhibits Proliferation of Human Glioma Cells
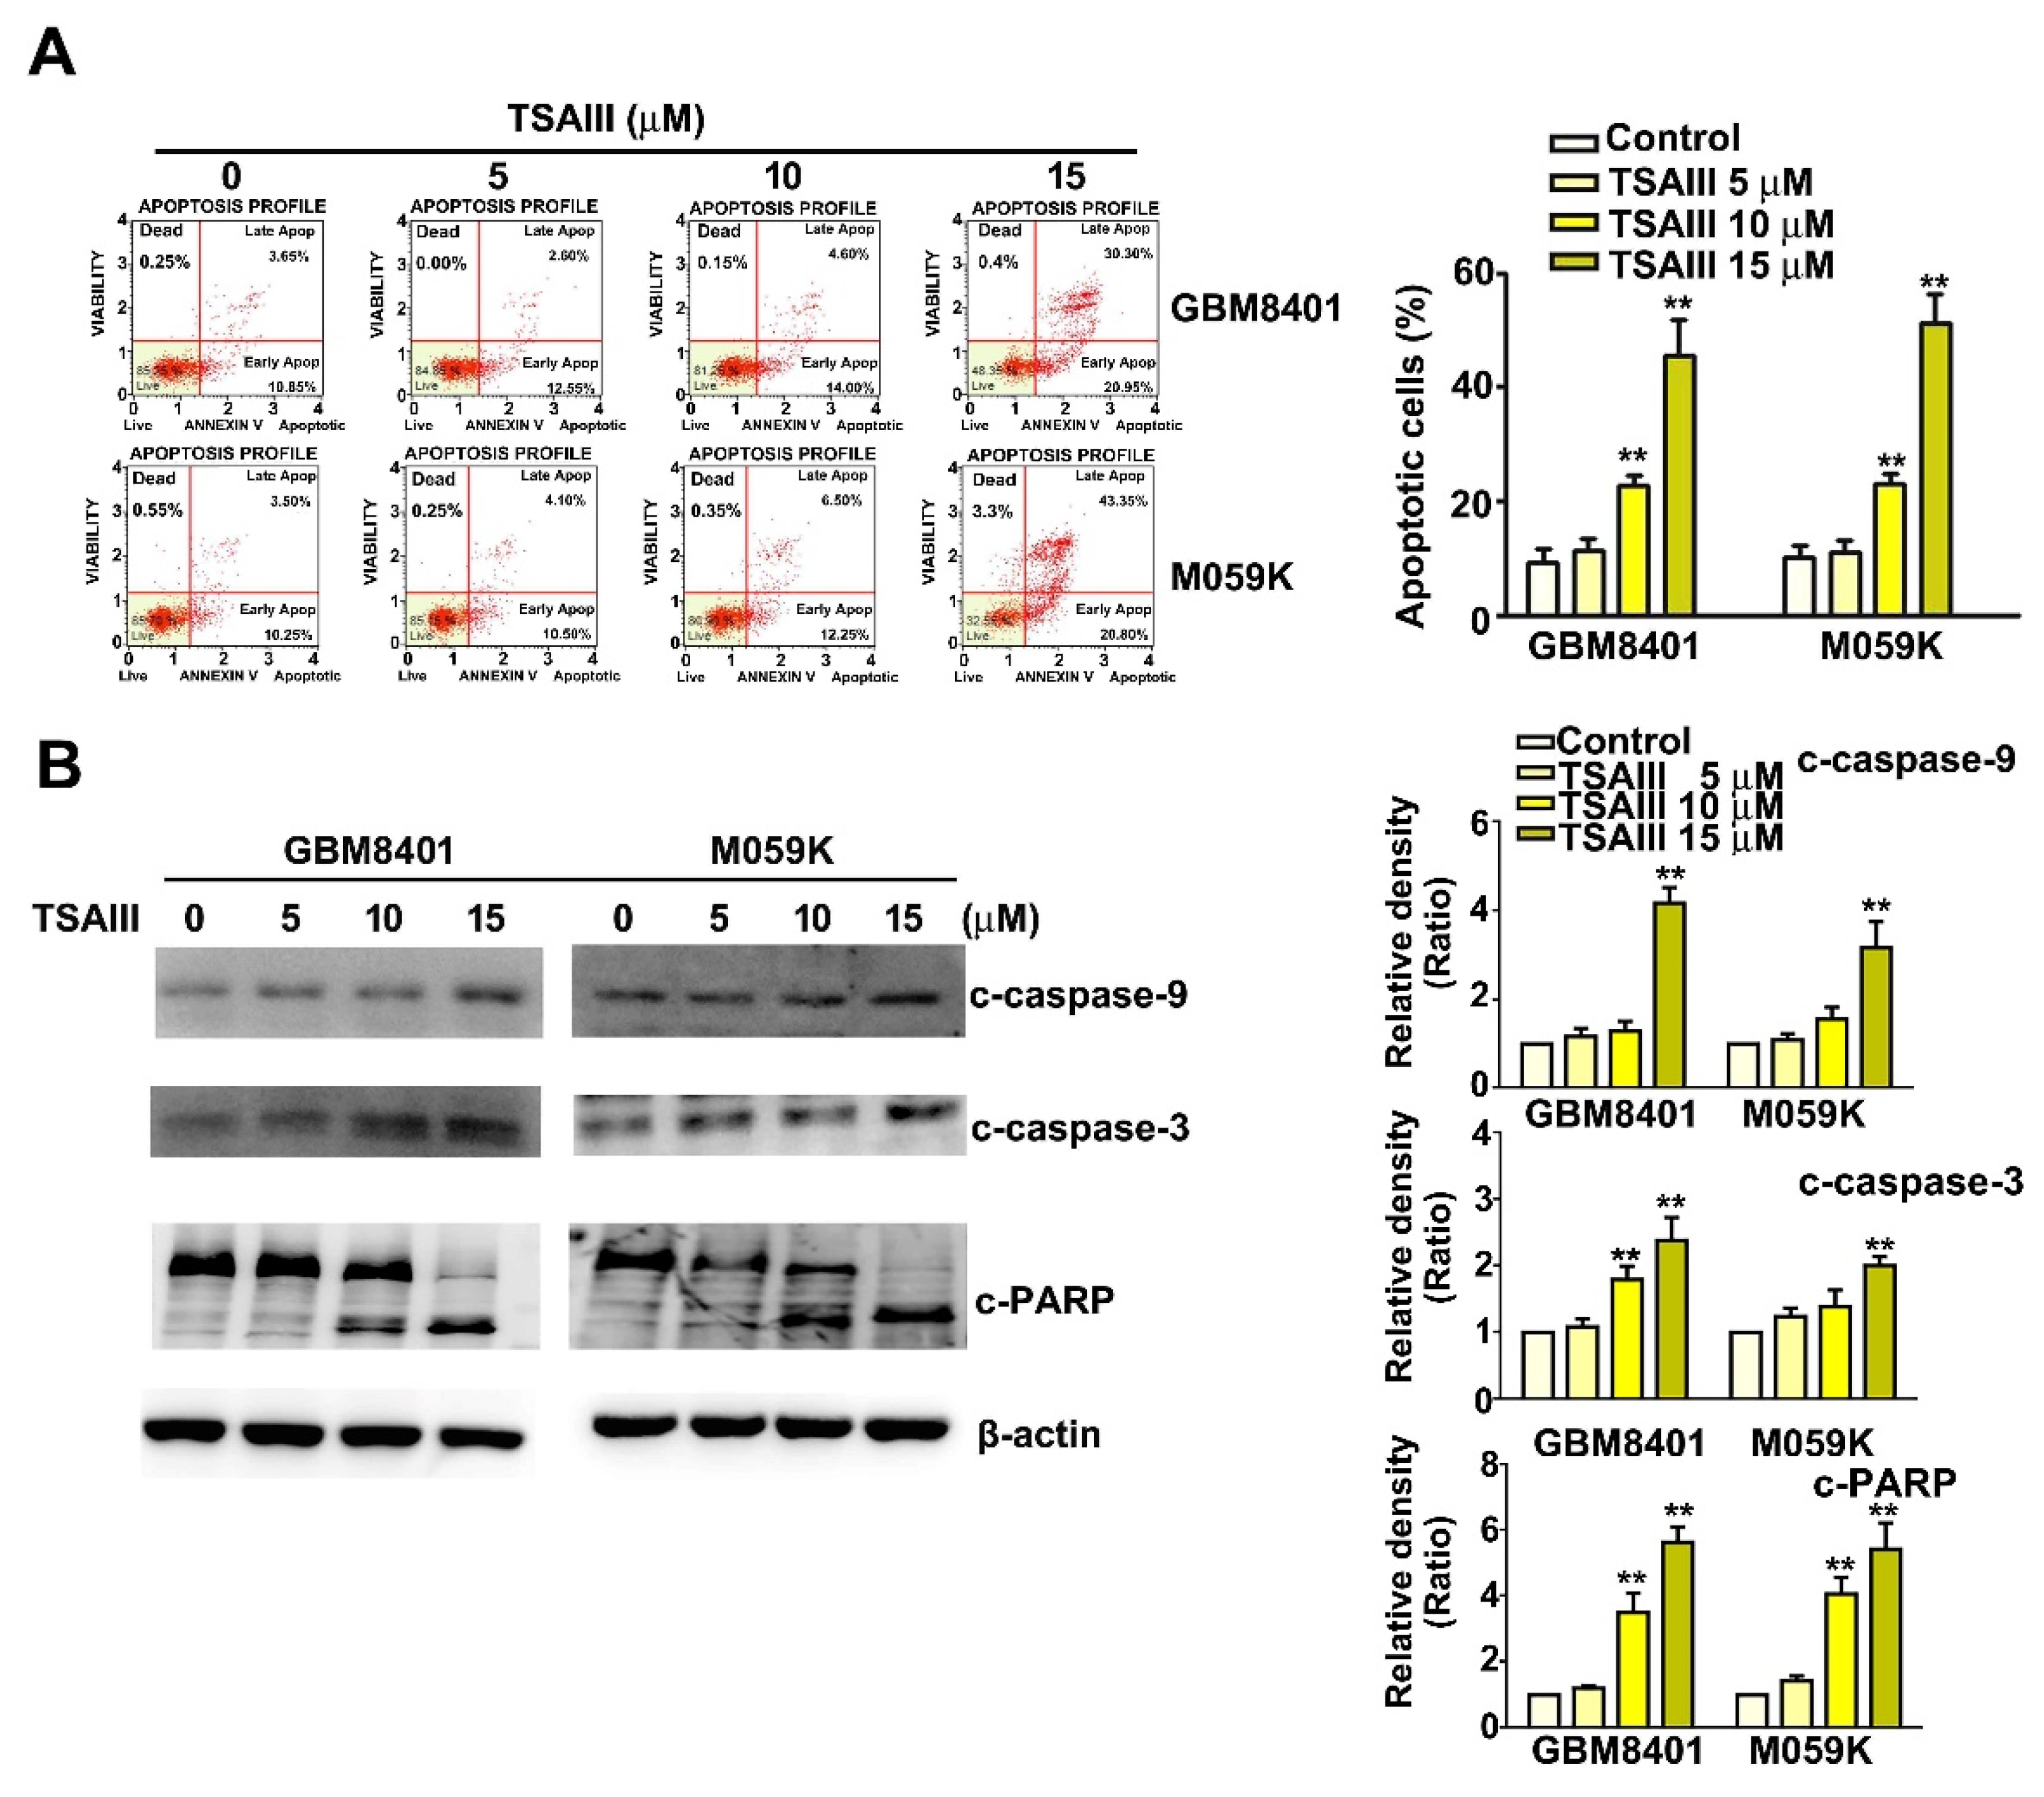
3.2. TSAIII Induces Apoptosis of GBM8401 and M059K Cells
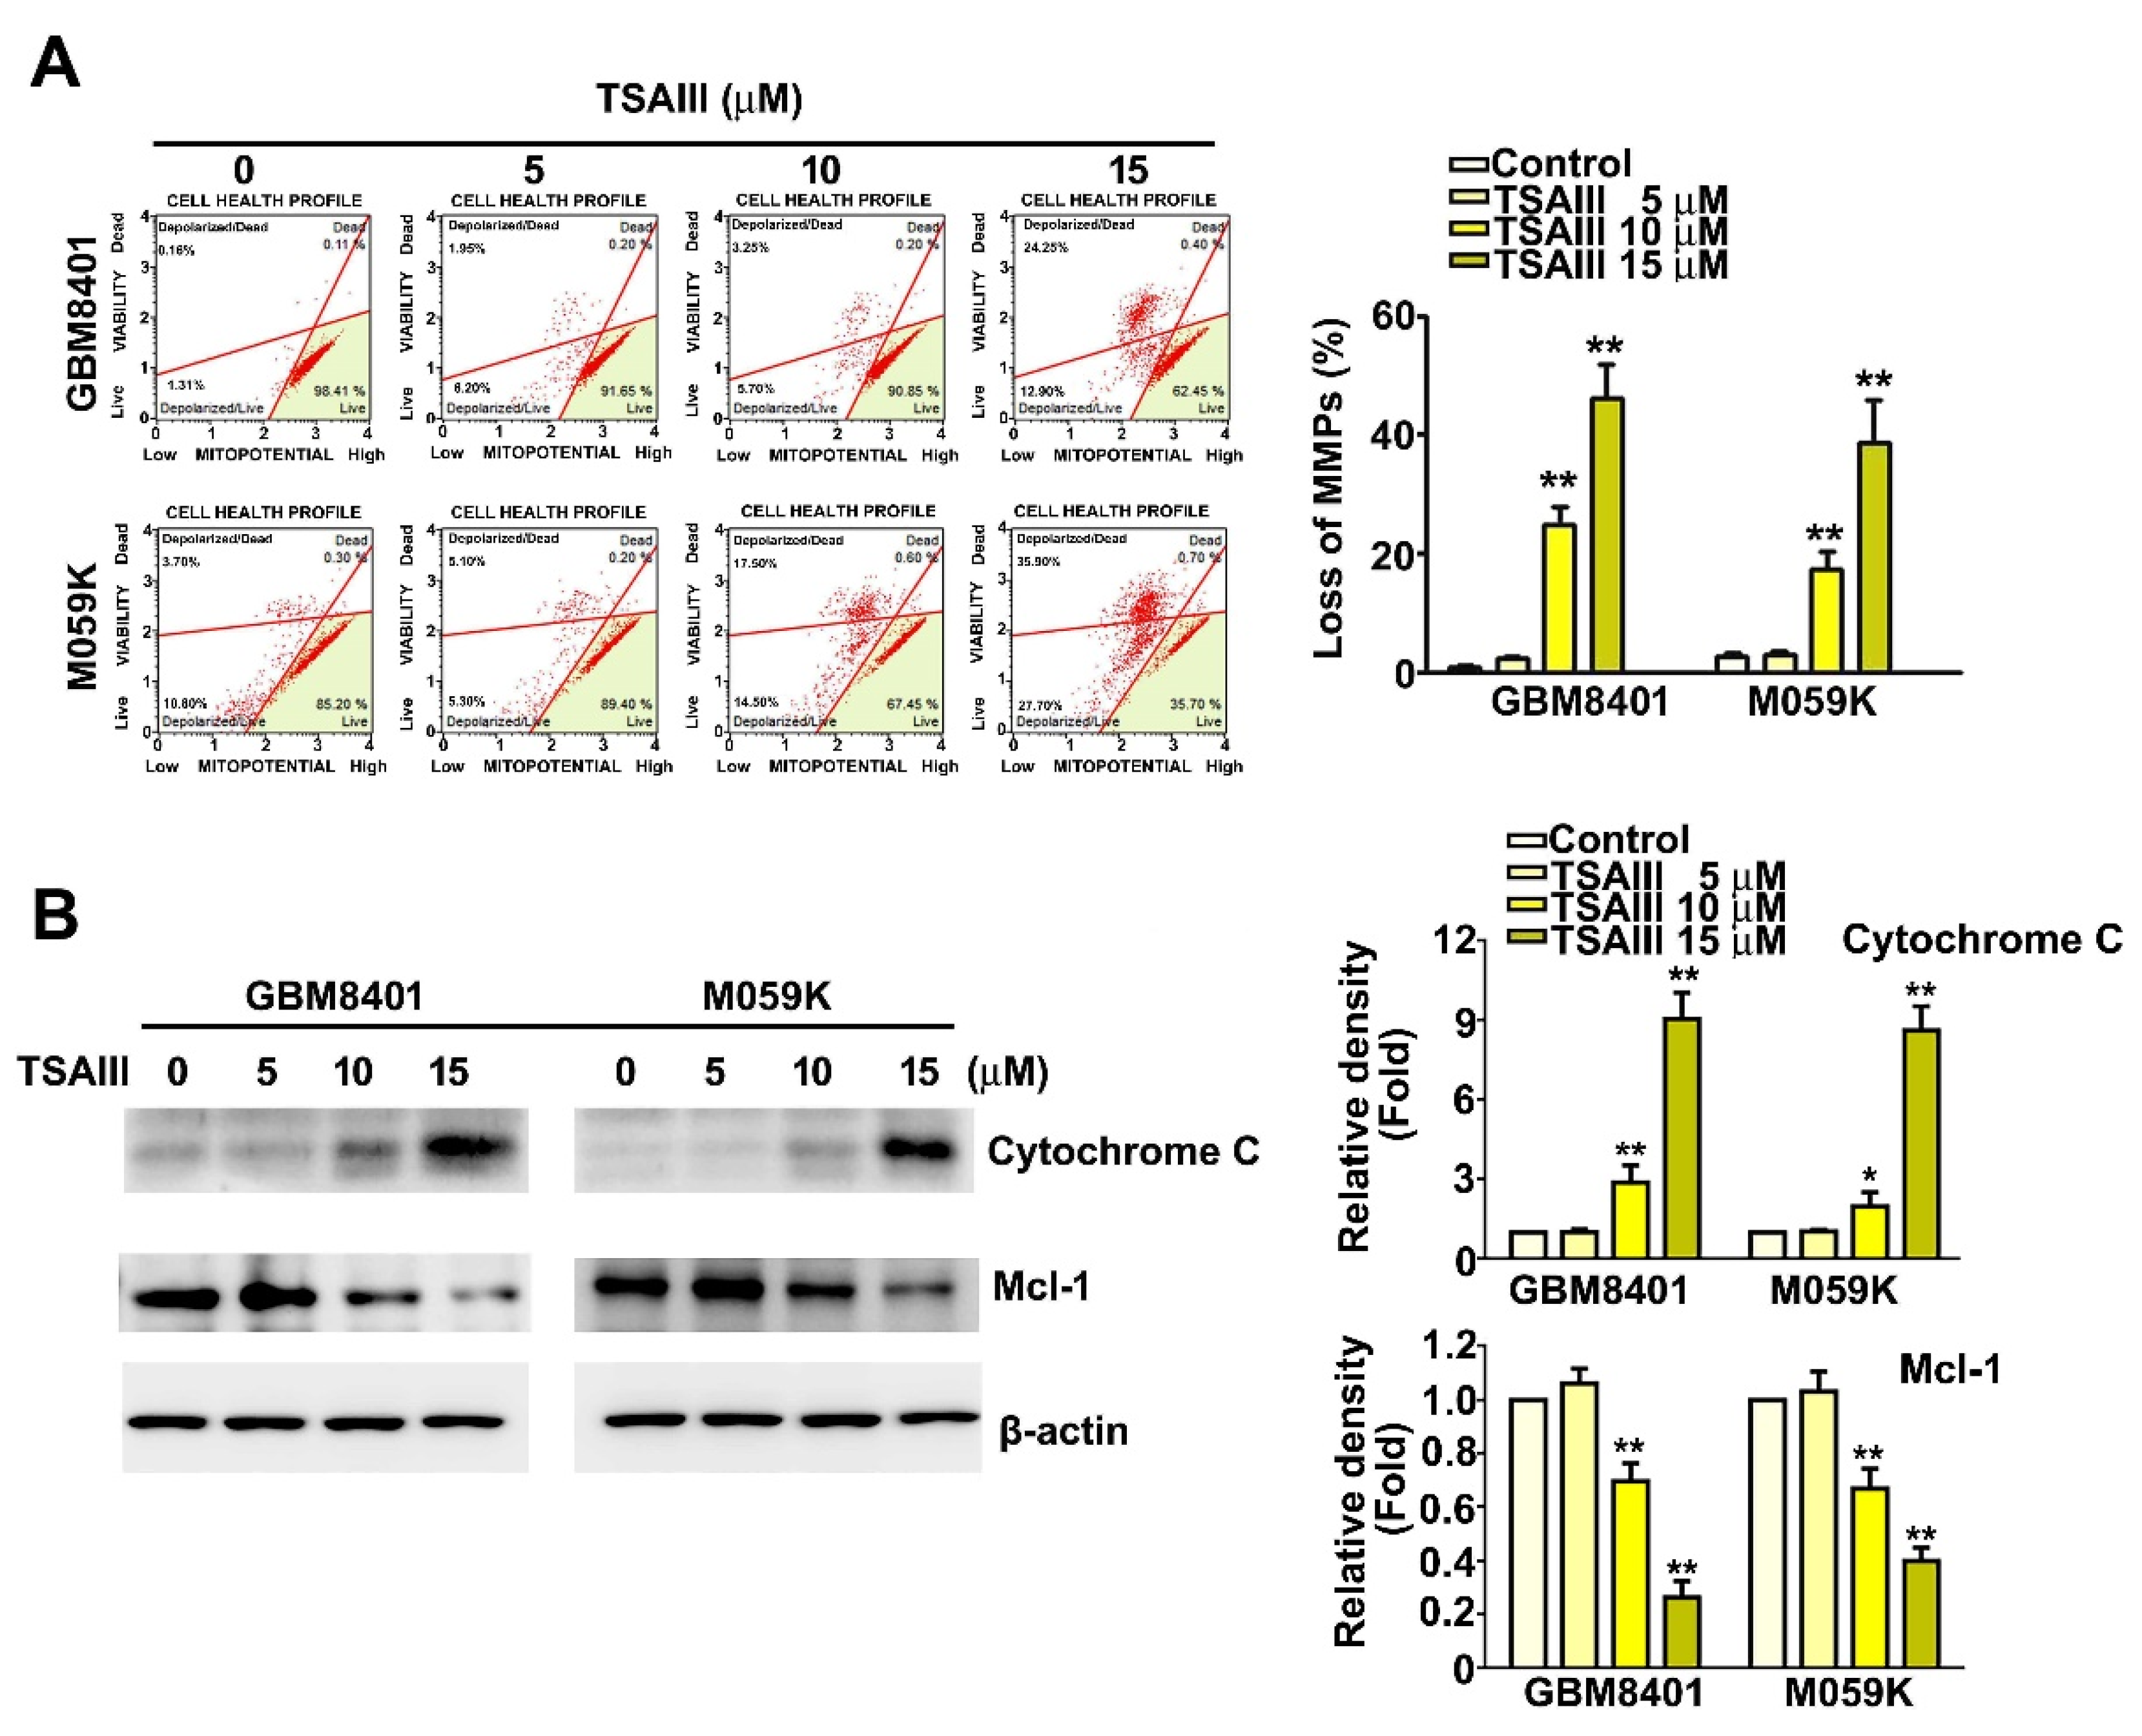
3.3. TSAIII Induces Mitochondrial Dysfunction, Increases Cytochrome C Expression, and Decreases Mcl-1 Expression
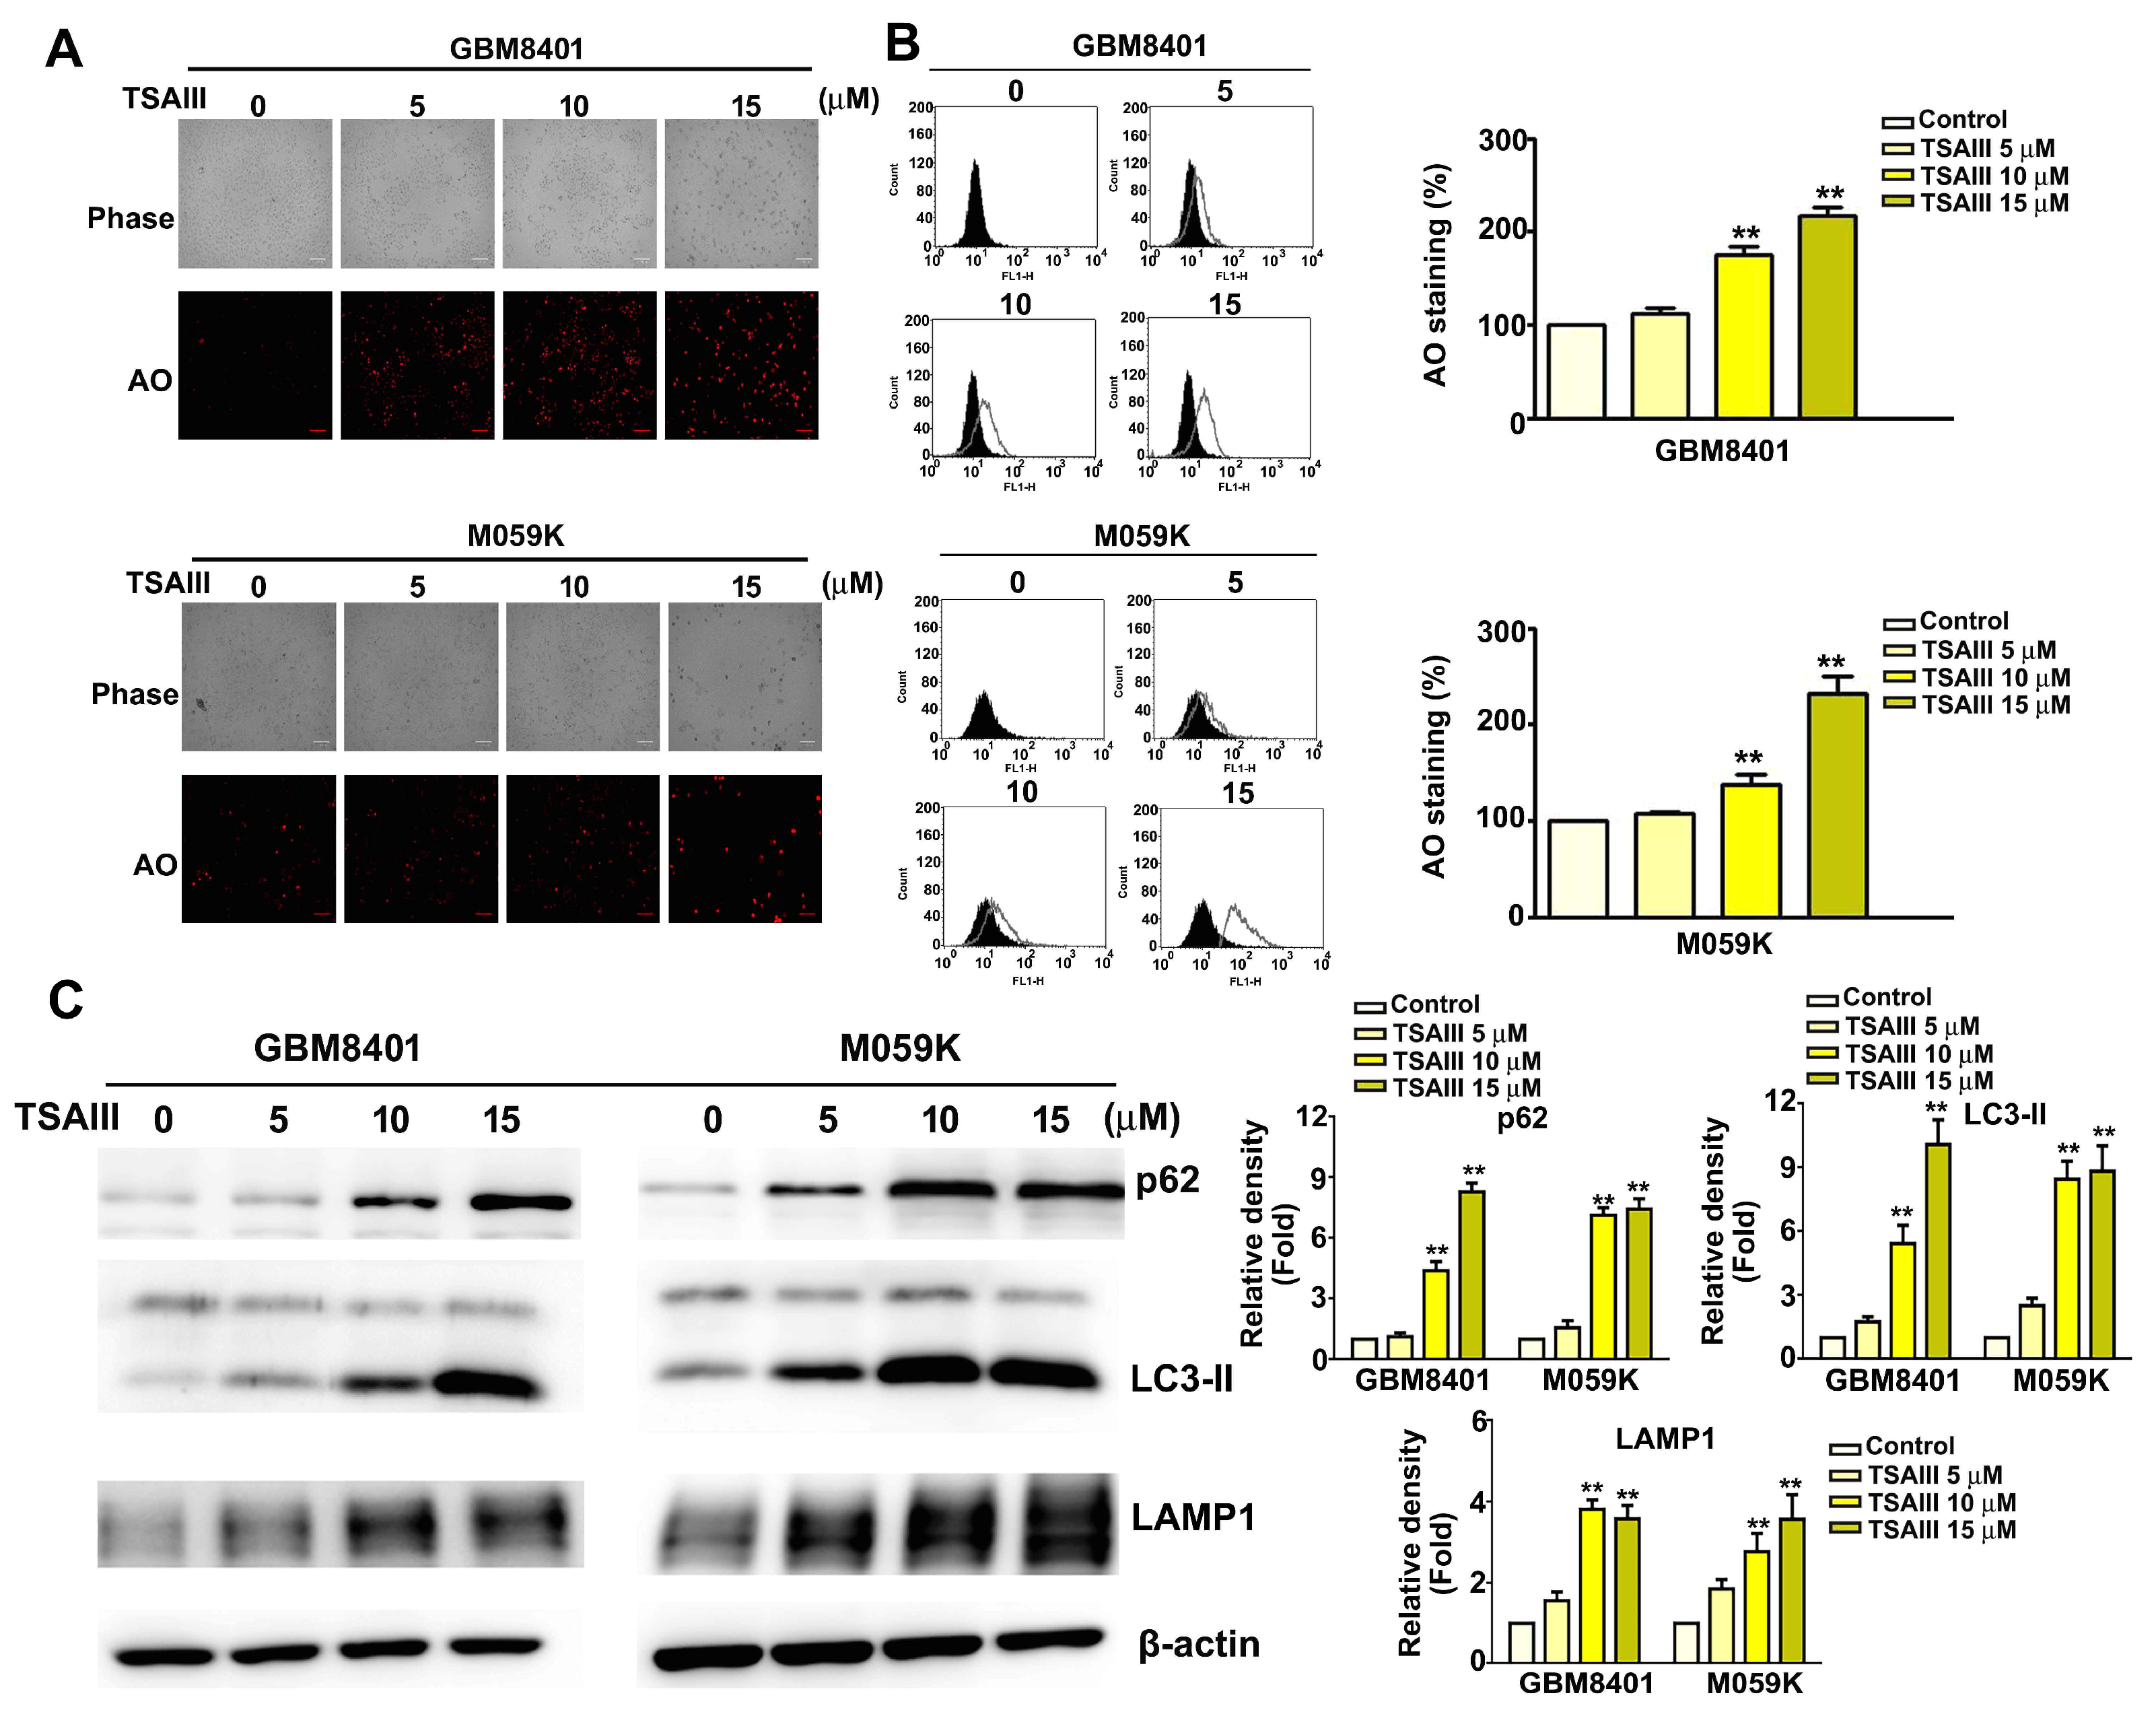
3.4. TSAIII Induces Autophagy in Glioma Cells
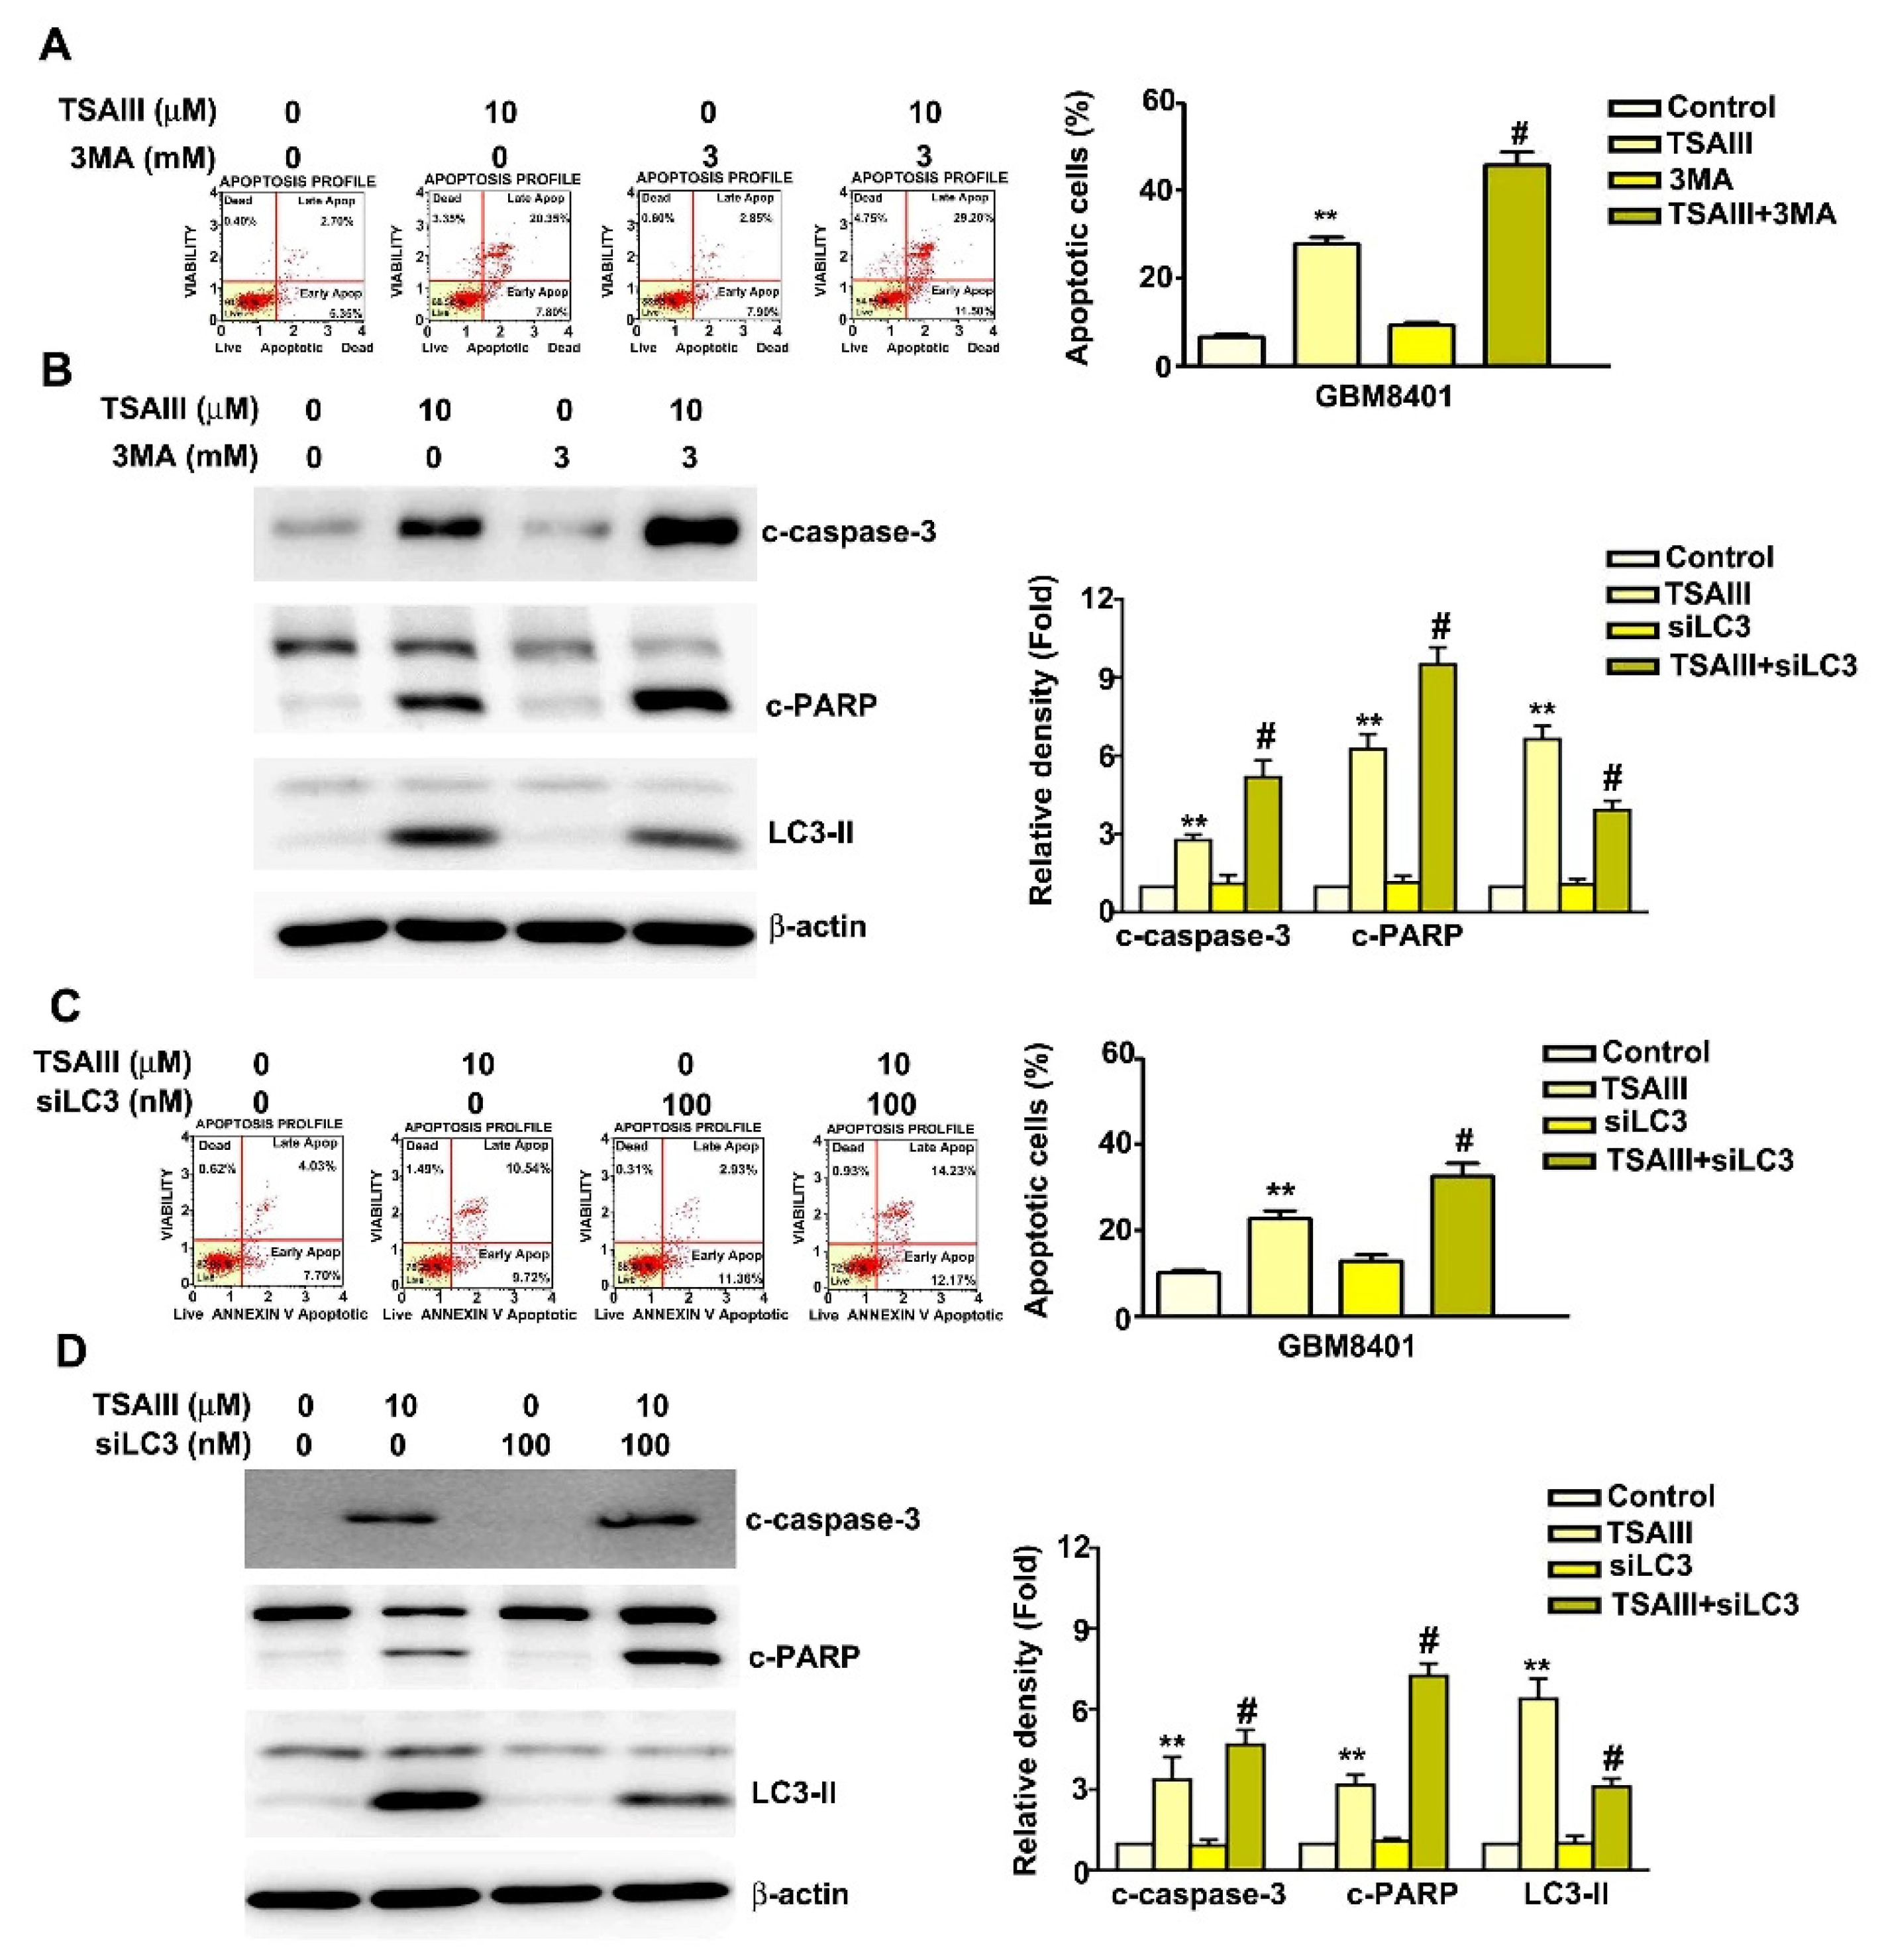
3.5. Inhibition of Autophagy Increased TSAIII-Induced Apoptosis in GBM8401 and M059K Cells
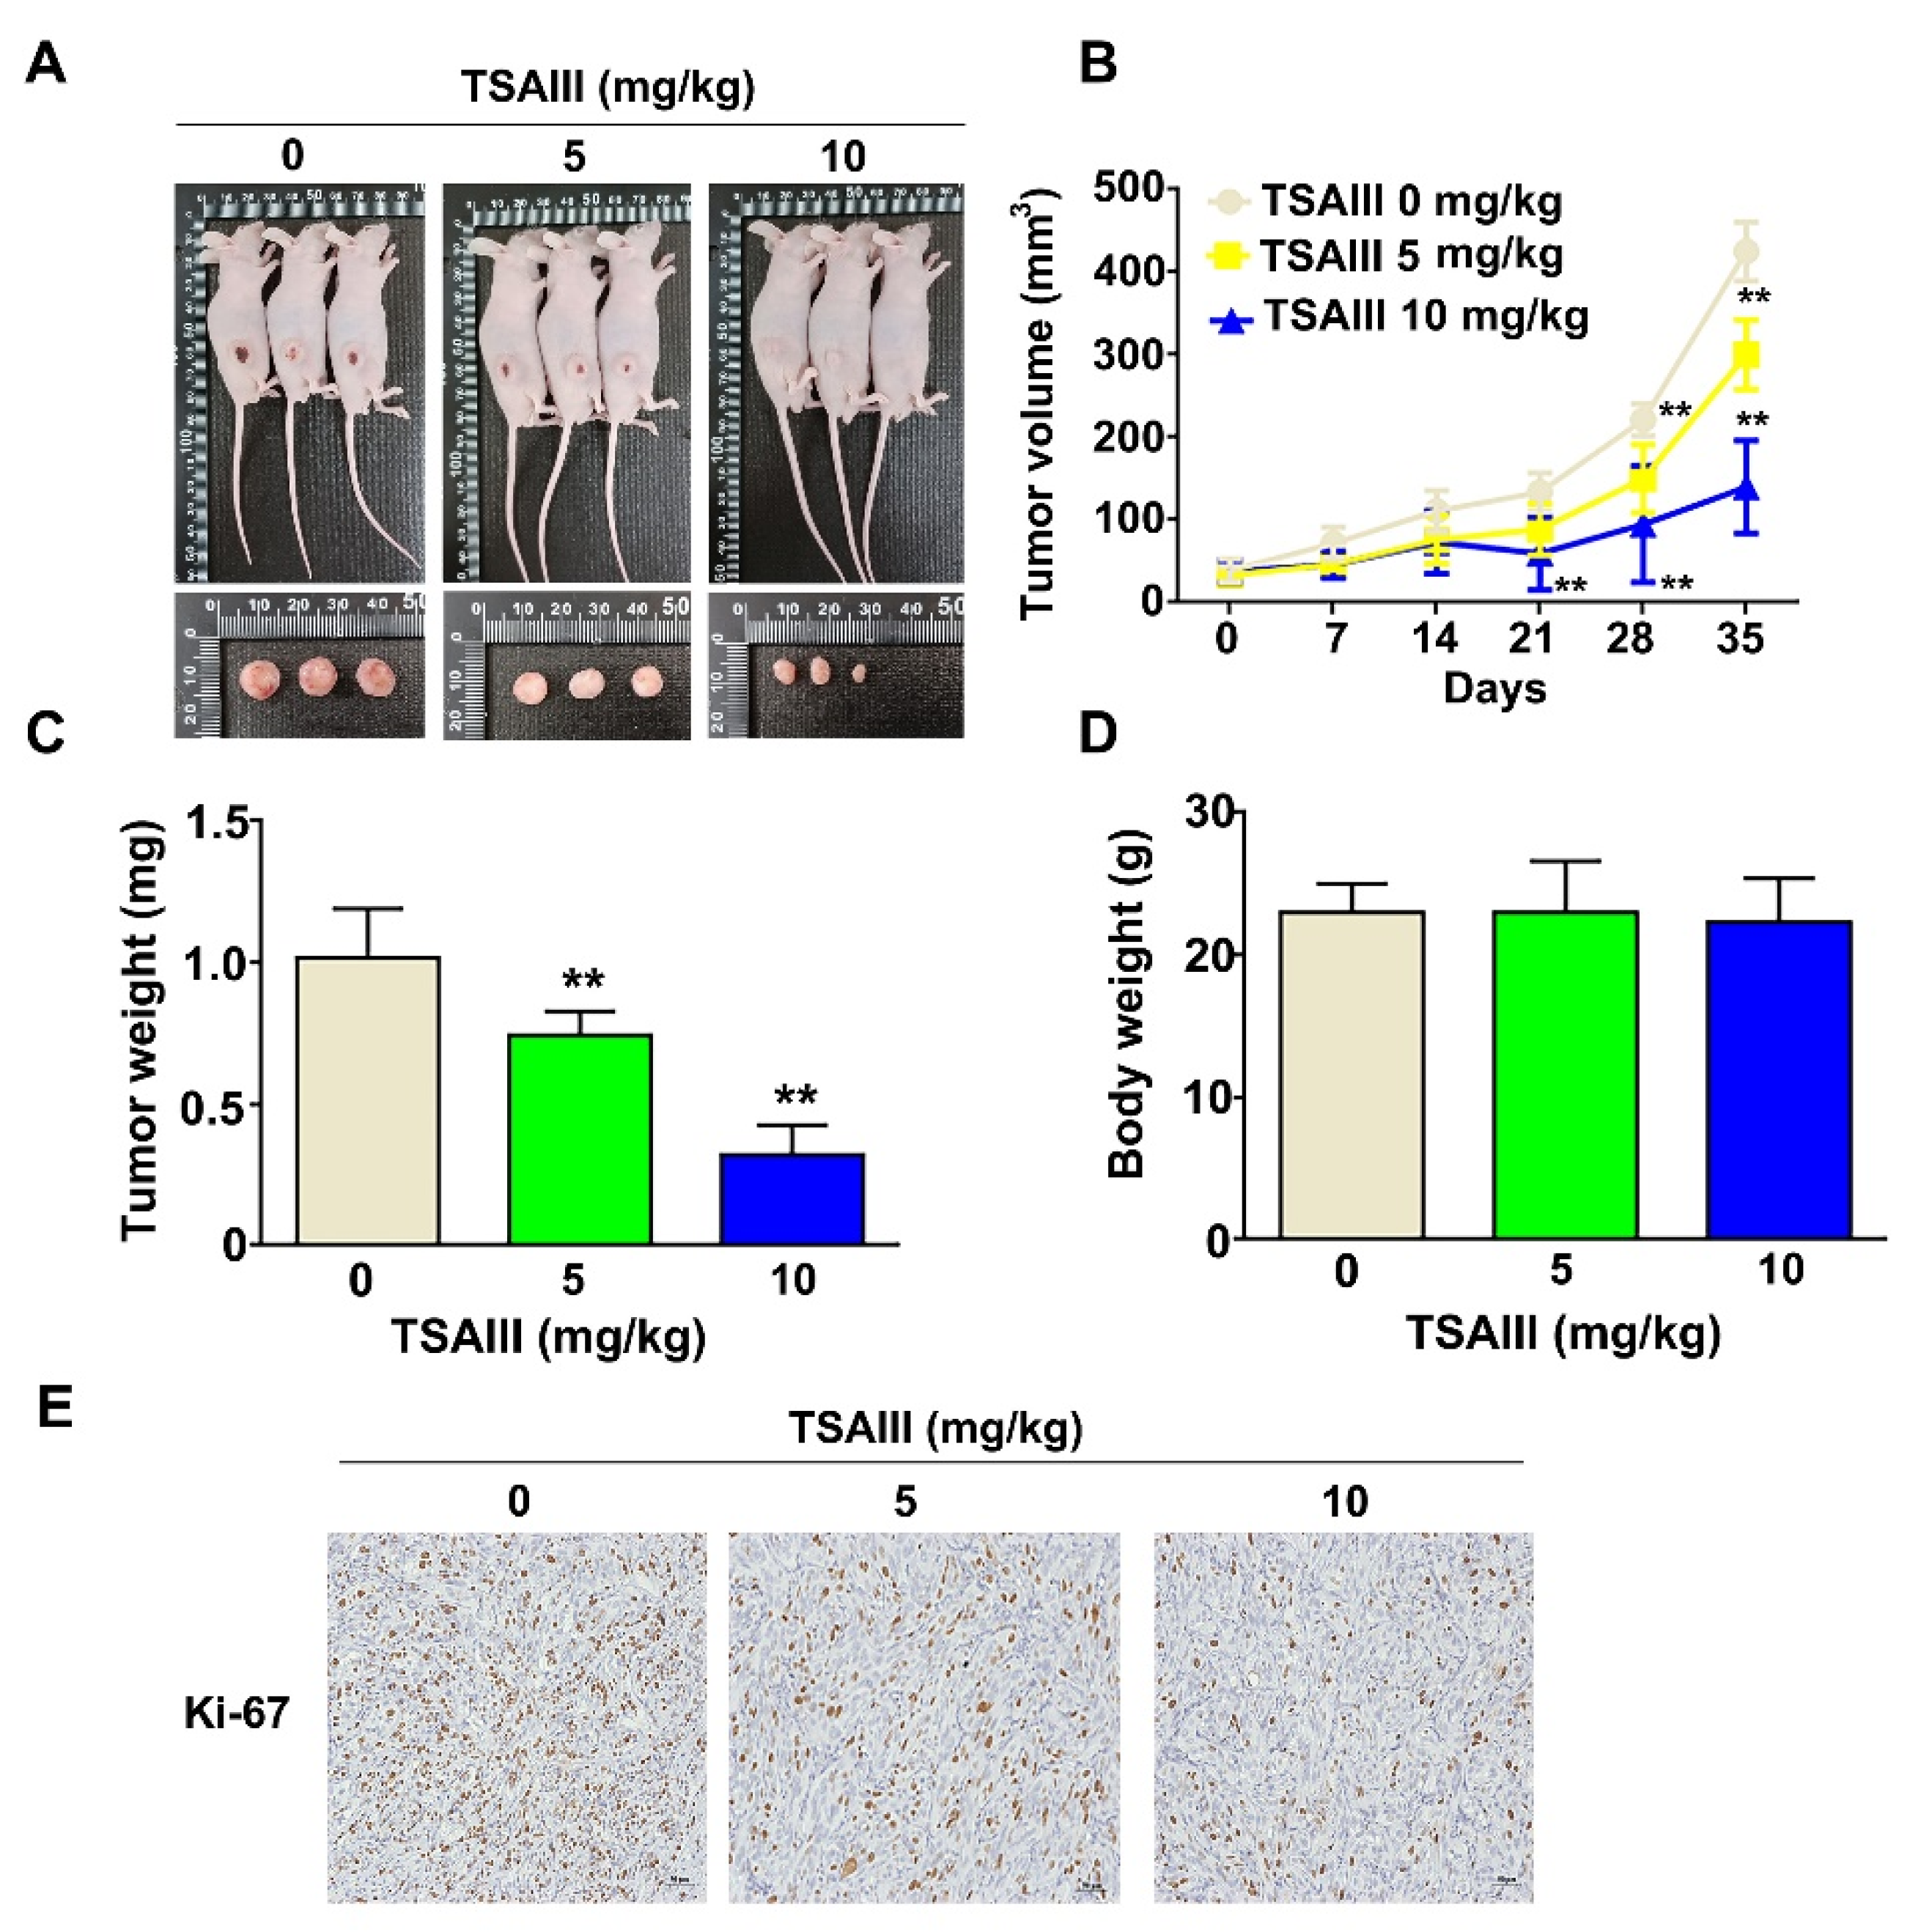
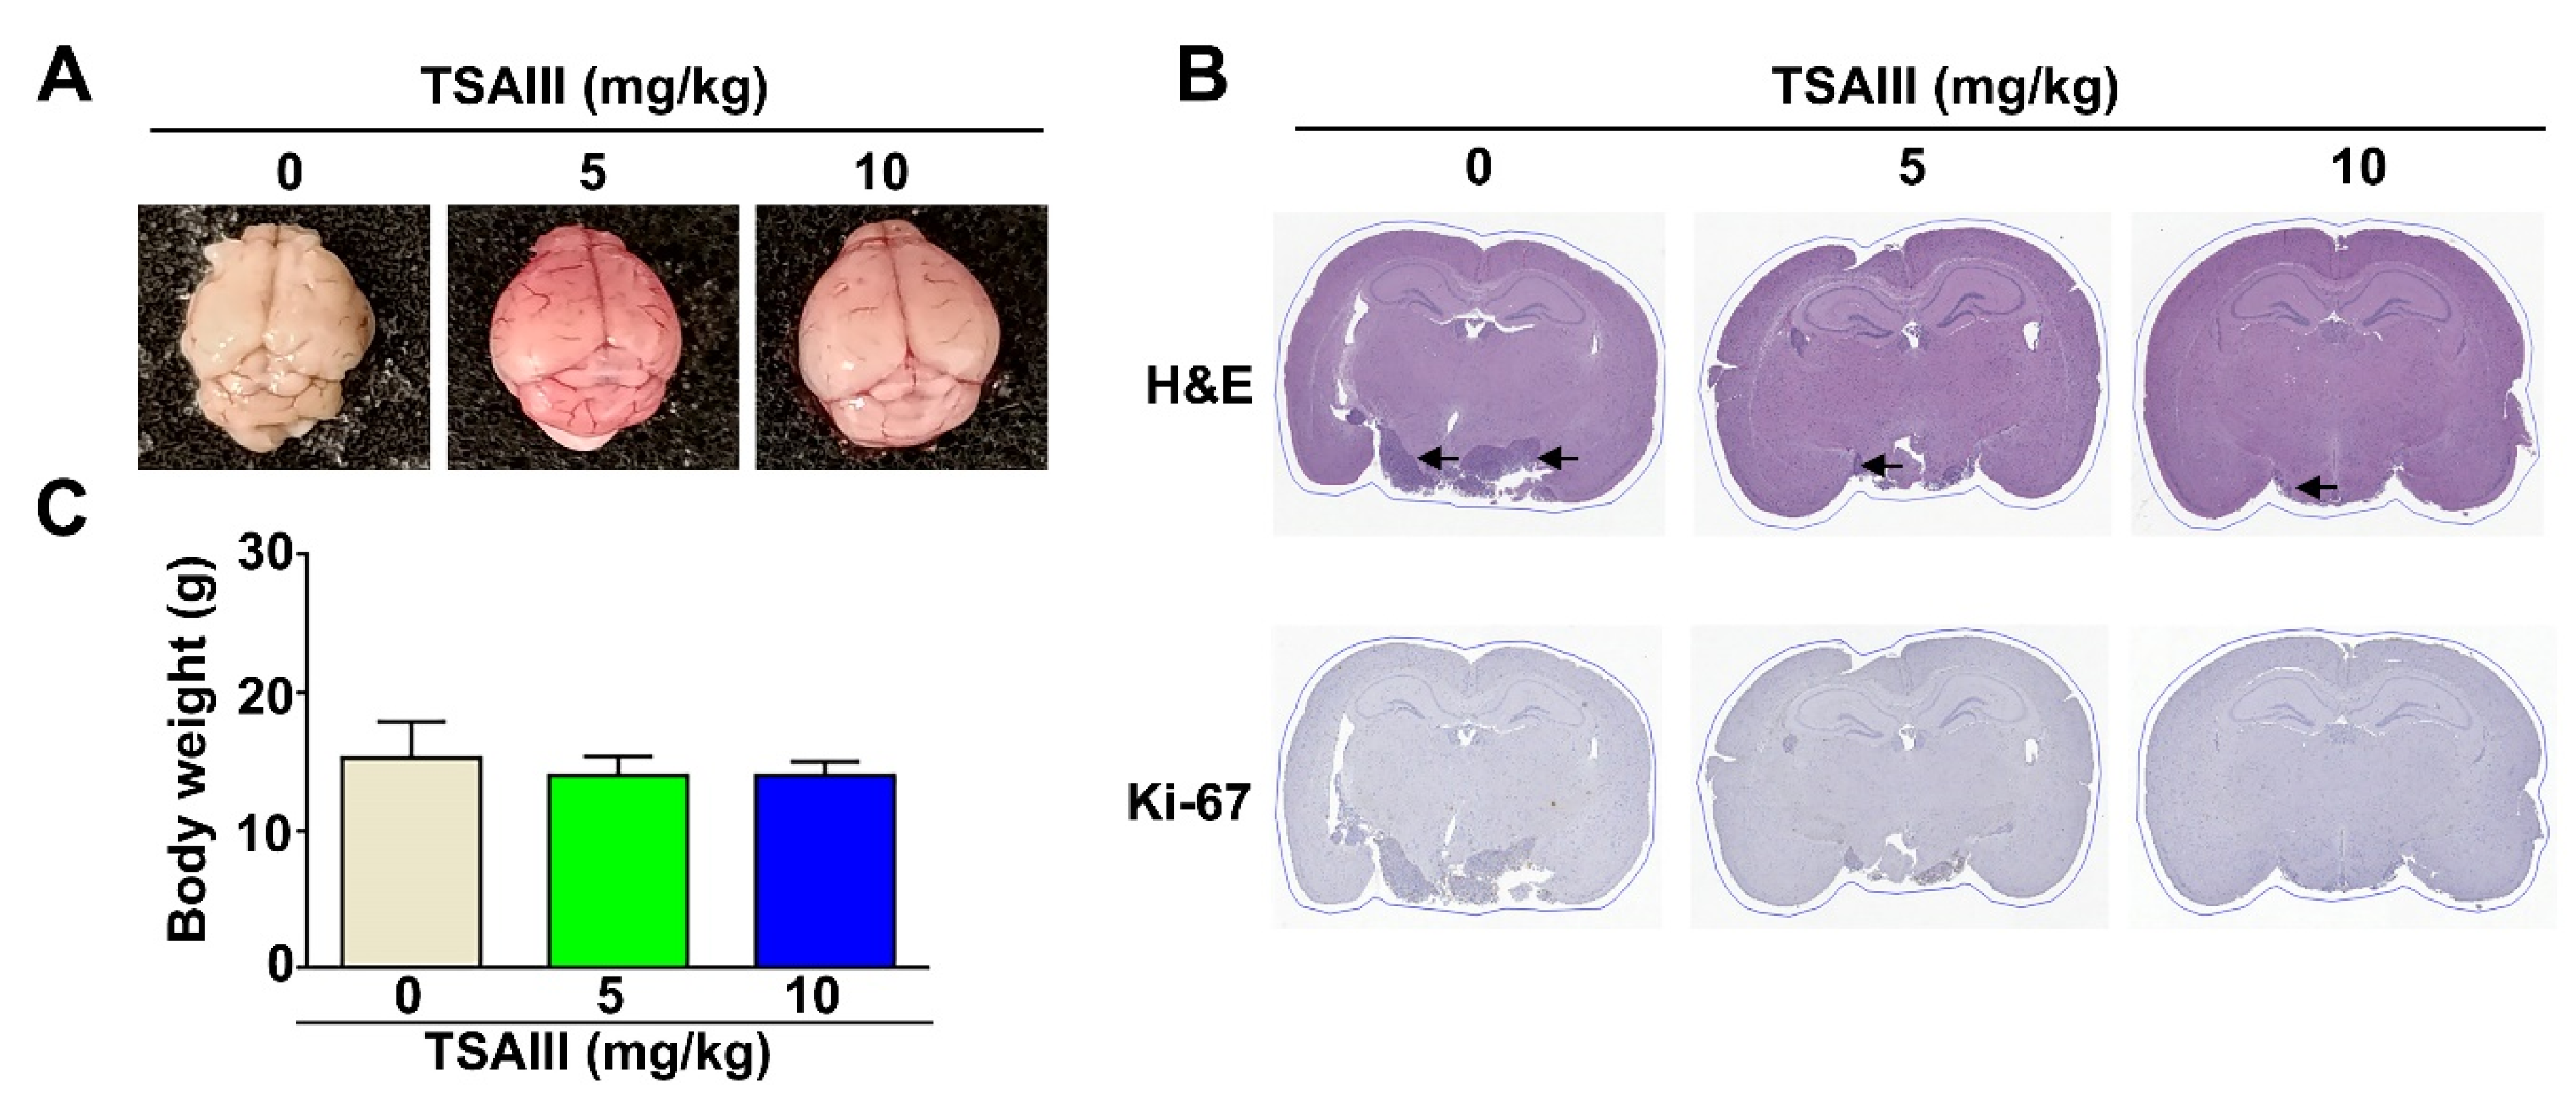
3.6. TSAIII Inhibits Tumor Growth of GBM8401-Xenograft-Bearing Mice and Orthotropic Glioma Mice Model
4. Discussion
5. Conclusions
Author Contributions
Funding
Institutional Review Board Statement
Informed Consent Statement
Data Availability Statement
Conflicts of Interest
References
- Young, R.M.; Jamshidi, A.; Davis, G.; Sherman, J.H. Current trends in the surgical management and treatment of adult glioblastoma. Ann. Transl. Med. 2015, 3, 121. [Google Scholar] [CrossRef] [PubMed]
- Louis, D.N.; Perry, A.; Wesseling, P.; Brat, D.J.; Cree, I.A.; Figarella-Branger, D.; Hawkins, C.; Ng, H.K.; Pfister, S.M.; Reifenberger, G.; et al. The 2021 WHO Classification of Tumors of the Central Nervous System: A summary. Neuro-Oncology 2021, 23, 1231–1251. [Google Scholar] [CrossRef] [PubMed]
- Afonso, M.; Brito, M.A. Therapeutic Options in Neuro-Oncology. Int. J. Mol. Sci. 2022, 23, 5351. [Google Scholar] [CrossRef] [PubMed]
- Van Meir, E.G.; Hadjipanayis, C.G.; Norden, A.D.; Shu, H.K.; Wen, P.Y.; Olson, J.J. Exciting New Advances in Neuro-Oncology: The Avenue to a Cure for Malignant Glioma. CA Cancer J. Clin. 2010, 60, 166–193. [Google Scholar] [CrossRef] [PubMed] [Green Version]
- Sun, T.; Warrington, N.M.; Luo, J.; Brooks, M.D.; Dahiya, S.; Snyder, S.C.; Sengupta, R.; Rubin, J.B. Sexually dimorphic RB inactivation underlies mesenchymal glioblastoma prevalence in males. J. Clin. Investig. 2014, 124, 4123–4133. [Google Scholar] [CrossRef] [Green Version]
- Baehrecke, E.H. Autophagy: Dual roles in life and death? Nat. Rev. Mol. Cell Biol. 2005, 6, 505–510. [Google Scholar] [CrossRef] [PubMed]
- Pankiv, S.; Clausen, T.H.; Lamark, T.; Brech, A.; Bruun, J.-A.; Outzen, H.; Øvervatn, A.; Bjørkøy, G.; Johansen, T. p62/SQSTM1 Binds Directly to Atg8/LC3 to Facilitate Degradation of Ubiquitinated Protein Aggregates by Autophagy. J. Biol. Chem. 2007, 282, 24131–24145. [Google Scholar] [CrossRef] [Green Version]
- Islam, M.A.; Sooro, M.A.; Zhang, P. Autophagic Regulation of p62 is Critical for Cancer Therapy. Int. J. Mol. Sci. 2018, 19, 1405. [Google Scholar] [CrossRef] [Green Version]
- Klionsky, D.J.; Abdelmohsen, K.; Abe, A.; Abedin, M.J.; Abeliovich, H.; Acevedo Arozena, A.; Adachi, H.; Adams, C.M.; Adams, P.D.; Adeli, K.; et al. Guidelines for the use and interpretation of assays for monitoring autophagy (3rd edition). Autophagy 2016, 12, 1–222. [Google Scholar] [CrossRef] [Green Version]
- Rogov, V.; Dötsch, V.; Johansen, T.; Kirkin, V. Interactions between Autophagy Receptors and Ubiquitin-like Proteins Form the Molecular Basis for Selective Autophagy. Mol. Cell 2014, 53, 167–178. [Google Scholar] [CrossRef]
- Shi, C.; Pan, B.-Q.; Shi, F.; Xie, Z.-H.; Jiang, Y.-Y.; Shang, L.; Zhang, Y.; Xu, X.; Cai, Y.; Hao, J.-J.; et al. Sequestosome 1 protects esophageal squamous carcinoma cells from apoptosis via stabilizing SKP2 under serum starvation condition. Oncogene 2018, 37, 3260–3274. [Google Scholar] [CrossRef] [PubMed]
- Yu, H.; Su, J.; Xu, Y.; Kang, J.; Li, H.; Zhang, L.; Yi, H.; Xiang, X.; Liu, F.; Sun, L. p62/SQSTM1 involved in cisplatin resistance in human ovarian cancer cells by clearing ubiquitinated proteins. Eur. J. Cancer 2011, 47, 1585–1594. [Google Scholar] [CrossRef] [PubMed]
- Oh, J.-M.; Kim, E.; Chun, S. Ginsenoside Compound K Induces Ros-Mediated Apoptosis and Autophagic Inhibition in Human Neuroblastoma Cells In Vitro and In Vivo. Int. J. Mol. Sci. 2019, 20, 4279. [Google Scholar] [CrossRef] [Green Version]
- Cain, K.; Bratton, S.B.; Cohen, G.M. The Apaf-1 apoptosome: A large caspase-activating complex. Biochimie 2002, 84, 203–214. [Google Scholar] [CrossRef] [PubMed]
- Clohessy, J.G.; Zhuang, J.; de Boer, J.; Gil-Gómez, G.; Brady, H.J.M. Mcl-1 Interacts with Truncated Bid and Inhibits Its Induction of Cytochrome c Release and Its Role in Receptor-mediated Apoptosis. J. Biol. Chem. 2006, 281, 5750–5759. [Google Scholar] [CrossRef] [PubMed] [Green Version]
- Jin, Z.; Li, Y.; Pitti, R.; Lawrence, D.; Pham, V.C.; Lill, J.R.; Ashkenazi, A. Cullin3-Based Polyubiquitination and p62-Dependent Aggregation of Caspase-8 Mediate Extrinsic Apoptosis Signaling. Cell 2009, 137, 721–735. [Google Scholar] [CrossRef] [PubMed] [Green Version]
- Decuypere, J.-P.; Parys, J.B.; Bultynck, G. Regulation of the Autophagic Bcl-2/Beclin 1 Interaction. Cells 2012, 1, 284–312. [Google Scholar] [CrossRef]
- Rubinstein, A.D.; Eisenstein, M.; Ber, Y.; Bialik, S.; Kimchi, A. The Autophagy Protein Atg12 Associates with Antiapoptotic Bcl-2 Family Members to Promote Mitochondrial Apoptosis. Mol. Cell 2011, 44, 698–709. [Google Scholar] [CrossRef] [Green Version]
- Li, A.; Chen, X.; Jing, Z.; Chen, J. Trifluoperazine induces cellular apoptosis by inhibiting autophagy and targeting NUPR1 in multiple myeloma. FEBS Open Bio 2020, 10, 2097–2106. [Google Scholar] [CrossRef]
- Yu, C.-L.; Lee, H.-L.; Yang, S.-F.; Wang, S.-W.; Lin, C.-P.; Hsieh, Y.-H.; Chiou, H.-L. Protodioscin Induces Mitochondrial Apoptosis of Human Hepatocellular Carcinoma Cells Through Eliciting ER Stress-Mediated IP3R Targeting Mfn1/Bak Expression. J. Hepatocell. Carcinoma 2022, 9, 327–341. [Google Scholar] [CrossRef]
- Wang, N.; Xu, P.; Wang, X.; Yao, W.; Wang, B.; Wu, Y.; Shou, D. Timosaponin AIII attenuates inflammatory injury in AGEs-induced osteoblast and alloxan-induced diabetic osteoporosis zebrafish by modulating the RAGE/MAPK signaling pathways. Phytomedicine 2020, 75, 153247. [Google Scholar] [CrossRef] [PubMed]
- Kim, Y.; Kim, K.-H.; Lee, I.-S.; Park, J.Y.; Na, Y.-C.; Chung, W.-S.; Jang, H.-J. Apoptosis and G2/M cell cycle arrest induced by a timosaponin A3 from Anemarrhena asphodeloides Bunge on AsPC-1 pancreatic cancer cells. Phytomedicine 2018, 56, 48–56. [Google Scholar] [CrossRef] [PubMed]
- Wang, H.; Dong, R.; Fan, W.; Zheng, X.; Li, A.; Wang, W. Timosaponin A-III induces autophagy of T-cell acute lymphoblastic leukemia Jurkat cells via inhibition of the PI3K/Akt/mTOR pathway. Oncol. Rep. 2019, 41, 2937–2944. [Google Scholar] [CrossRef] [PubMed]
- Jung, O.; Lee, J.; Lee, Y.J.; Yun, J.-M.; Son, Y.-J.; Cho, J.Y.; Ryou, C.; Lee, S.Y. Timosaponin AIII inhibits migration and invasion of A549 human non-small-cell lung cancer cells via attenuations of MMP-2 and MMP-9 by inhibitions of ERK1/2, Src/FAK and β-catenin signaling pathways. Bioorganic Med. Chem. Lett. 2016, 26, 3963–3967. [Google Scholar] [CrossRef]
- Zhang, M.; Qu, J.; Gao, Z.; Qi, Q.; Yin, H.; Zhu, L.; Wu, Y.; Liu, W.; Yang, J.; Huang, X. Timosaponin AIII Induces G2/M Arrest and Apoptosis in Breast Cancer by Activating the ATM/Chk2 and p38 MAPK Signaling Pathways. Front. Pharmacol. 2021, 11, 601468. [Google Scholar] [CrossRef]
- Wang, Y.; Xu, L.; Lou, L.-L.; Song, S.-J.; Yao, G.-D.; Ge, M.-Y.; Hayashi, T.; Tashiro, S.-I.; Onodera, S.; Ikejima, T. Timosaponin AIII induces apoptosis and autophagy in human melanoma A375-S2 cells. Arch. Pharmacal Res. 2016, 40, 69–78. [Google Scholar] [CrossRef]
- Yu, C.-L.; Yang, S.-F.; Hung, T.-W.; Lin, C.-L.; Hsieh, Y.-H.; Chiou, H.-L. Inhibition of eIF2α dephosphorylation accelerates pterostilbene-induced cell death in human hepatocellular carcinoma cells in an ER stress and autophagy-dependent manner. Cell Death Dis. 2019, 10, 418. [Google Scholar] [CrossRef] [Green Version]
- Lin, C.-L.; Chen, C.-M.; Lin, C.-L.; Cheng, C.-W.; Lee, C.-H.; Hsieh, Y.-H. Norcantharidin induces mitochondrial-dependent apoptosis through Mcl-1 inhibition in human prostate cancer cells. Biochim. Biophys. Acta BBA Mol. Cell Res. 2017, 1864, 1867–1876. [Google Scholar] [CrossRef]
- Hung, H.-Y.; Wu, T.-S. Recent progress on the traditional Chinese medicines that regulate the blood. J. Food Drug Anal. 2016, 24, 221–238. [Google Scholar] [CrossRef] [Green Version]
- King, F.W.; Fong, S.; Griffin, C.; Shoemaker, M.; Staub, R.; Zhang, Y.-L.; Cohen, I.; Shtivelman, E. Timosaponin AIII Is Preferentially Cytotoxic to Tumor Cells through Inhibition of mTOR and Induction of ER Stress. PLoS ONE 2009, 4, e7283. [Google Scholar] [CrossRef]
- Nho, K.J.; Chun, J.M.; Kim, H.K. Induction of mitochondria-dependent apoptosis in HepG2 human hepatocellular carcinoma cells by timosaponin A-III. Environ. Toxicol. Pharmacol. 2016, 45, 295–301. [Google Scholar] [CrossRef] [PubMed]
- Liu, G.; Cui, Z.; Gao, X.; Liu, H.; Wang, L.; Gong, J.; Wang, A.; Zhang, J.; Ma, Q.; Huang, Y.; et al. Corosolic acid ameliorates non-alcoholic steatohepatitis induced by high-fat diet and carbon tetrachloride by regulating TGF-β1/Smad2, NF-κB, and AMPK signaling pathways. Phytotherapy Res. 2021, 35, 5214–5226. [Google Scholar] [CrossRef] [PubMed]
- Sy, L.-K.; Yan, S.-C.; Lok, C.-N.; Man, R.Y.; Che, C.-M. Timosaponin A-III Induces Autophagy Preceding Mitochondria-Mediated Apoptosis in HeLa Cancer Cells. Cancer Res 2008, 68, 10229–10237. [Google Scholar] [CrossRef] [PubMed] [Green Version]
- Wang, N.; Feng, Y.; Zhu, M.; Siu, F.-M.; Ng, K.-M.; Che, C.-M. A novel mechanism of XIAP degradation induced by timosaponin AIII in hepatocellular carcinoma. Biochim. Biophys. Acta BBA Mol. Cell Res. 2013, 1833, 2890–2899. [Google Scholar] [CrossRef] [PubMed] [Green Version]
- Klionsky, D.J. Autophagy revisited: A conversation with Christian de Duve. Autophagy 2008, 4, 740–743. [Google Scholar] [CrossRef] [Green Version]
- Kang, Y.-J.; Chung, H.-J.; Nam, J.-W.; Park, H.J.; Seo, E.K.; Kim, Y.S.; Lee, D.; Lee, S.K. Cytotoxic and Antineoplastic Activity of Timosaponin A-III for Human Colon Cancer Cells. J. Nat. Prod. 2011, 74, 701–706. [Google Scholar] [CrossRef]
- Lee, B.; Jung, K.; Kim, D.-H. Timosaponin AIII, a saponin isolated from Anemarrhenaasphodeloides, ameliorates learning and memory deficits in mice. Pharmacol. Biochem. Behav. 2009, 93, 121–127. [Google Scholar] [CrossRef]
- Webers, A.; Heneka, M.T.; Gleeson, P.A. The role of innate immune responses and neuroinflammation in amyloid accumulation and progression of Alzheimer’s disease. Immunol. Cell Biol. 2019, 98, 28–41. [Google Scholar] [CrossRef]
- Mizushima, N.; Yoshimori, T.; Levine, B. Methods in Mammalian Autophagy Research. Cell 2010, 140, 313–326. [Google Scholar] [CrossRef] [Green Version]
- Pawlowska, E.; Szczepanska, J.; Szatkowska, M.; Blasiak, J. An Interplay between Senescence, Apoptosis and Autophagy in Glioblastoma Multiforme—Role in Pathogenesis and Therapeutic Perspective. Int. J. Mol. Sci. 2018, 19, 889. [Google Scholar] [CrossRef]
- Kim, T.W.; Lee, S.Y.; Kim, M.; Cheon, C.; Ko, S.-G. Kaempferol induces autophagic cell death via IRE1-JNK-CHOP pathway and inhibition of G9a in gastric cancer cells. Cell Death Dis. 2018, 9, 875. [Google Scholar] [CrossRef] [Green Version]
- Lin, M.; Liu, Y.; Ding, X.; Ke, Q.; Shi, J.; Ma, Z.; Gu, H.; Wang, H.; Zhang, C.; Yang, C.; et al. E2F1 transactivates IQGAP3 and promotes proliferation of hepatocellular carcinoma cells through IQGAP3-mediated PKC-alpha activation. Am. J. Cancer Res. 2019, 9, 285–299. [Google Scholar] [PubMed]
- Chen, P.; Wu, S.; Dong, X.; Zhou, M.; Xu, P.; Chen, B. Formosanin C induces autophagy-mediated apoptosis in multiple myeloma cells through the PI3K/AKT/mTOR signaling pathway. Hematology 2022, 27, 977–986. [Google Scholar] [CrossRef] [PubMed]
- Wang, K.; Liu, R.; Li, J.; Mao, J.; Lei, Y.; Wu, J.; Zeng, J.; Zhang, T.; Wu, H.; Chen, L.; et al. Quercetin induces protective autophagy in gastric cancer cells: Involvement of Akt-mTOR- and hypoxia-induced factor 1α-mediated signaling. Autophagy 2011, 7, 966–978. [Google Scholar] [CrossRef] [PubMed]


Disclaimer/Publisher’s Note: The statements, opinions and data contained in all publications are solely those of the individual author(s) and contributor(s) and not of MDPI and/or the editor(s). MDPI and/or the editor(s) disclaim responsibility for any injury to people or property resulting from any ideas, methods, instructions or products referred to in the content. |
© 2022 by the authors. Licensee MDPI, Basel, Switzerland. This article is an open access article distributed under the terms and conditions of the Creative Commons Attribution (CC BY) license (https://creativecommons.org/licenses/by/4.0/).
Share and Cite
Lee, C.-C.; Tsai, J.-P.; Lee, H.-L.; Chen, Y.-J.; Chen, Y.-S.; Hsieh, Y.-H.; Chen, J.-C. Blockage of Autophagy Increases Timosaponin AIII-Induced Apoptosis of Glioma Cells In Vitro and In Vivo. Cells 2023, 12, 168. https://doi.org/10.3390/cells12010168
Lee C-C, Tsai J-P, Lee H-L, Chen Y-J, Chen Y-S, Hsieh Y-H, Chen J-C. Blockage of Autophagy Increases Timosaponin AIII-Induced Apoptosis of Glioma Cells In Vitro and In Vivo. Cells. 2023; 12(1):168. https://doi.org/10.3390/cells12010168
Chicago/Turabian StyleLee, Chu-Che, Jen-Pi Tsai, Hsiang-Lin Lee, Yung-Jen Chen, Yong-Syuan Chen, Yi-Hsien Hsieh, and Jin-Cherng Chen. 2023. "Blockage of Autophagy Increases Timosaponin AIII-Induced Apoptosis of Glioma Cells In Vitro and In Vivo" Cells 12, no. 1: 168. https://doi.org/10.3390/cells12010168