Article

Special Microbial Communities Enhanced the Role of Aged Biochar in Reducing Cd Accumulation in Rice

Key Laboratory of Crop Physiology, Ecology and Genetic Breeding, Ministry of Education College of Agronomy, Jiangxi Agricultural University, Nanchang 330045, China
*
Author to whom correspondence should be addressed.
Agronomy 2023, 13(1), 81; https://doi.org/10.3390/agronomy13010081
Submission received: 5 December 2022 / Revised: 21 December 2022 / Accepted: 22 December 2022 / Published: 26 December 2022
(This article belongs to the Special Issue In Memory of Professor Longping Yuan, the Father of Hybrid Rice)

Abstract

:
Biochar exhibits a good adsorption ability for heavy metals in soil and has been widely used as a remediation material in Cd-contaminated soil. However, the status of Cd uptake by rice driven by soil physicochemical properties and rhizosphere microbial communities after years of biochar application is not well understood. In this study, the relationship between the rhizosphere microbial community and soil physicochemical properties and rice Cd accumulation were investigated during the main rice growth stages. The results showed that in comparison to the non-biochar treatment (control), a noticeable reduction in Cd content in rice stem sheaths, leaves, rice husks and milled rice with different growth stages were observed in the biochar treatment after four years, which decreased by 38.76–66.18%, 40.93–70.27%, 43.64–47.92% and 31.91–34.38%, respectively. Compared to non-biochar treatment (control), the properties of the soil in different growth stages by biochar treatment of the soil pH, soil organic matter (SOM), total nitrogen (TN) and available phosphorus (AP) were significantly increased, which increased by 10.5–16.13%, 8–25%, 75–130.13% and 132.95–191.43%, respectively. The content of available Cd (ACd) concentration in different stages by biochar treatment was significantly decreased, which decreased by 26.57–44.24%. Biochar application after four years changed the rhizosphere bacterial community structure composition (phyla level) in all stages. The relative abundance of Proteobacteria, Bacteroidetes and Nitrospirae was increased, while the relative abundance of Chloroflexi, Acidobacteria and Actinobacteria was decreased. Meanwhile, the biochar application enriched Rhodocyclaceae, Burkholderiaceae, Nitrosomonadaceae, Anaerolineaceae, Ignavibacteriales and Bacteroidales, which may contribute to the reduction of Cd uptake and accumulation in rice. These results suggest that biochar treatment after four years changed the rhizosphere microbial community structure and soil physicochemical properties and promoted the colonization of specific microbial populations in the rice rhizosphere to form a special protective system in the rice rhizosphere, which reduced Cd uptake by rice.

1. Introduction

The effect of soil heavy metal pollution on the crop growth and development has become a global concern. Compared with other crops, rice has a high capacity for Cd accumulation. This has led to excessive intake of Cd in countries and regions where rice is a staple food, which has a serious impact on people’s health [1,2]. According to the China soil contamination survey in 2014, 19.4% of the soil was contaminated, and 7% of the arable land was contaminated with cadmium (Cd). These factors seriously affect the safe production of grains, especially rice, which is prone to absorb and accumulate Cd [3]. It is estimated that more than 10 million tons of grains are reduced every year by heavy metal contamination [4]. The accumulation of Cd in the food chain will eventually pose a great threat to human health [5], such as kidney dysfunction and osteoporosis. Therefore, it is urgent to develop treatment strategies for Cd contamination in arable soil. Currently, the main measures to improve heavy metal pollution in agricultural soils include physical amendments, the addition of amendments, microbial remediation and agricultural measures [6,7,8].
Biochar is a carbon-rich solid material with a high surface area, porous surface and abundant functional groups [9]. Biochar has been widely used in the treatment of soil heavy metal pollution as a highly efficient, low-cast and environmentally friendly modified dosage agent [10]. The combination of biochar and ZnO Nanoparticles can reduce the absorption of toxic metals in biomass, enhance the growth and enhance the physiological characteristics of the soil [11]. The immobilization of heavy metals by biochar mainly occurs through adsorption, cation exchange, surface complexation and precipitation [12]. Meanwhile, biochar can indirectly fix or release heavy metal ions by changing soil characteristics, such as improving soil aggregates, soil pH, SOM and changing microbial community structure [13,14]. Biochar increases soil pH, SOM, total N, available P, available K and inorganic N contents in acidic soils [15].
Because biochar has a high stable carbon structure, dense aromatic structure and higher aromatic C, it was not easy to decompose by microorganisms, and can exist in nature for a long time [15]. Deposited in the environment over a period of time, biochar produced a series of physical and chemical property reactions; these reactions are called biochar aging [15,16]. The physical fragmentation values of biochar increase significantly with aging. Meanwhile, functional groups are formed on the surface of biochar. Aged biochar also increases the interaction between biochar, SOM, contaminants, soil minerals, nutrients and microorganisms [17], which alters the microbial community structure. Aged biochar is decomposed by microorganisms into water-soluble matter, such as fulvic and humic acid [18], which affects the form of contaminants in the soil. Fan et al. [19] found that the pH and total organic carbon was significantly increased in a six-year field experiment by biochar amendment, thus significantly increasing bacteria. Similarly, Li et al. [20] reported that aging biochar, with richer oxygen-containing functional groups (OCFG) and surface area (SA), increased the C/N ratio and decreased the availability of Cd in soil, thus significantly altering the proportion of Gram-positive/Gram-negative bacteria. The application of biochar for the remediation of Cd contamination varies with the aging of biochar. Therefore, it is necessary to explore the late effects of biochar on Cd-contaminated soil, soil chemical properties and microorganisms through the aging of biochar in soil.
The rhizosphere microbial community plays a key role in the microecology of the root system, where nutrient uptake is closely linked [21] and also mediates the biogeochemical cycling of heavy metals through redox and methylation processes or form complexes with heavy metals through the secretion of organic acids [22], thus inhibiting the absorption of heavy metals. Meanwhile, certain specific bacterial communities in the rhizosphere were activated by certain organic substances secreted by the roots in the contaminated soil, inhibiting the transport of heavy metal ions to the roots [23]. For example, sulfate-reducing and iron-oxidizing bacteria reduced the accumulation of Cd in rice plants and formed secondary iron deposits through complexation of reduced iron oxides and manganese oxides with Cd2+ [24]. The root-secreted amino acids form complexes with Cd in rhizosphere soil and reduce soil transport to roots [25]. In addition, the response of rhizosphere microorganisms to Cd stress differed among varieties. The rhizosphere of high Cd-accumulating rice varieties specifically recruited some bacterial groups that could be directly or indirectly involved in metal mobilization, while the rhizosphere of low Cd-accumulating rice varieties recruited some bacterial groups that was involved in promoting the plant growth [23]. Currently, most studies have investigated changes in rhizosphere microbial community structure and effects on plant uptake of heavy metals with artificially aged biochar or successive years of biochar addition [18,26]. However, little has been reported on the influence of rhizosphere microbial changes and rice Cd uptake after years of biochar monotonic amendment of Cd-contaminated soils during the critical rice growth stages.
In this study, the focus was on investigating the effects of biochar on the rhizosphere microbial community structure, soil available Cd content and plant uptake of cadmium after four years of biochar application. It was hypothesized that: (1) aged biochar can still improve soil pH, organic matter and some nutrient elements four years after application to soil; (2) aged biochar can reduce Cd accumulation in rice mainly by reducing soil available Cd content; and (3) aged biochar facilitates Cd fixation by improving one or some specific microbial communities in the rhizosphere soil.

2. Materials and Methods

2.1. Soil Sampling and Biochar Production

Soil samples (0–20 cm in the cultivated layer) were taken from a typical heavy metal-contaminated rice soil in southern Jiangxi Province. The soil samples were air-dried and passed through a 5-mm sieve to remove the debris, then mixed well for the pot experiments. The soil pH was 5.73 ± 0.06 and contained 16.07 ± 1.7 g kg−1 organic matter (SOM), 1.61 ± 0.3 g kg−1 total nitrogen (TN), 26.13 ± 2.3 mg kg−1 available phosphorus (AP) and 87.89 ± 7.9 mg kg−1 available potassium (AK), The soil was mainly polluted by Cd, the total amount of which was 1.18 ± 0.05 mg kg−1. The biochar used was based on the rice straw, which was pyrolyzed at 700 °C for 2 h with limited oxygen.

2.2. Experimental Design

This experiment was conducted in the experimental field of Jiangxi Agricultural University (115°55′ E, 28°46′ N) during 2021. The sample site has a subtropical humid monsoon climate with an average annual temperature of 16.6 °C, an average daily temperature ≥10 °C, a cumulative temperature of 5532.6 °C, a frost-free period of approximately 272 d and an annual precipitation of 1790.9 mm. The biochar was added to soil in plastic pots at 60 g/kg−1 (BC) by mass and mixed thoroughly with the soil in 2018, and biochar absence as the control (CK). Based on the preliminary experimental results set biochar dosages [27,28]. The tribute of the pots used was a plastic bucket 32 cm and 25 cm high. In 2021, Huanghuazhan and Meixiangzhan 2 were planted in each of the treatment. Rice seedlings were transplanted 28 days after sowing. Three holes were transplanted into each pot, with two basic seedlings of equal length in each hole. The rice was irrigated with flooded water throughout the growth process, with the water depth maintained at 3–5 cm. Soil, rhizosphere soil and plant tissue samples were collected at the panicle initiation stage, heading stage and maturity stage. The rhizosphere soil samples were collected according to the method of Edwards et al. [29]. Using gloves, the rice plant was harvested by firmly holding the shoot and slowly pulling the root system out of the ground. Then, the roots were vigorously shaken to remove loose soil, leaving only the soil layer firmly attached to the root. This layer constitutes the rhizosphere compartment. The soil layer firmly attached to the root was the rhizosphere soil and the loose soil that was removed was the bulk soil [29]. Then, the samples were refrigerated to −80 °C for 16S RNA sequencing. Soil chemical characterization and determination of total and effective cadmium in soil samples. The Cd content in each tissue was determined by using plant samples.

2.3. Soil and Plant Analysis

Each soil sample was divided into two parts. The first part was air-drying indoors, pulverized and 2 mm screened for the soil chemistry to determine basic soil properties, such as pH, soil organic matter (SOM), total nutrient content and effective phosphorus. The other part was analyzed for total Cd and available Cd through a 0.15 mm screen. Soil pH was determined by a pH meter with a deionized water to the soil ratio of 5 (v/w). Soil organic matter was determined by the potassium dichromate method. Soil total nitrogen was determined by the Kjeldahl method. Effective phosphorus was determined by the molybdenum-antimony colorimetric method. In order to determine the total cadmium content in the soil, microwave irradiation HNO3-H2O2-HF (6:2:2, v/v/v) ablation was used, and Inductively Coupled Plas Mamass Spectrometry (ICP-MS) (Agilent Technologies, 7500 CX, Santa, Clara, CA, USA) was used to determine the cadmium content in the soil. The available Cd in the soil was extracted with DTPA extractant and determined by ICP-MS [30,31]. Plants were harvested at the panicle initiation stage, heading stage and maturing stage, then rinsed two to three times with deionized water, divided into roots, stems and leaves, bleached at 105 °C for 30 min, dried to constant weight at 70 °C and ground into powder. The concentration of Cd in the plants was determined by microwave digestion using a HNO3-H2O2 (4:1, v/v) mixture at 150 °C and quantified by ICP-MS.

2.4. Rhizosphere Soil DNA Extraction and Sequencing

All rhizosphere bacterial DNA was extracted with the TGuide S96 Magnetic Soil/Stool DNA Kit (Tiangen Biotech (Beijing) Co., Ltd., Beijing, China) according to the manufacturer’s protocol. The rhizosphere bacterial DNA concentration was measured with the Qubit dsDNA HS Assay Kit and Qubit 4.0 Fluorometer (Invitrogen, Thermo Fisher Scientific, Bend, OR, USA), and then DNA was stored at −80 °C in a refrigerator for later sequencing analysis. The V3-V4 region of the bacterial 16S rRNA gene was united with adapter sequences and barcode sequences by commonly used primers (forward primer 338F, 5′-GTGAATCATCGARTC-3′; reverse primer 86R, 5′-TCCTCCGCTTATTGAT-3′) [32]. After extracting the total DNA of the samples, the primers were designed according to the conserved regions, and sequencing connectors were added at the end of the primers. PCR amplification was performed, and the products were purified, quantified and homogenized to form a sequencing library. The library was first subjected to library quality control; the libraries that passed the quality control were sequenced with an Illumina Novaseq 6000 (Illumina, San Diego, CA, USA) [33,34].
The samples were sequenced by the Illumina NovaSeq platform at Biomarker Technologies Corporation, Beijing, China. Trimmomatic (version 0.33, https://github.com/usadellab/Trimmomatic (accessed on 24 January 2021)) [34] filtered primarily raw data, while Cutadapt (version 1.9.1, http://cutadapt.readthedocs.org/ (accessed on 24 January 2021)) [33] identified and removed primer sequences. USEARCH (version 10, http://drive5.com/usearch (accessed on 24 January 2021)) [35] assembled PE reads, and UCHIME (version 8.1, www.biocloud.net) [36] removed chimera.

2.5. Data and Statistical Analysis

All quantitative data were statistically analyzed using one-way ANOVA considering replicates by SPSS 23.0 (IBM Corporation, Armonk, NY, USA), and the means of the treatments were examined by the Duncan test at p = 0.05 probability level. Graphics were drawn with Origin Pro 8.0 (Origin lab, Northampton, MA, USA). The PCoA result was illustrated using the R package “ggplot2”.
Microbial community analysis was performed using BMK Cloud (www.biocloud.net (accessed on 24 January 2021)). Operational taxonomic units (OTUs) were clustered with 97% similarity cutoff using UPARSE (version10.0, www.biocloud.net (accessed on 24 January 2021)) [34]. Taxonomy annotation of the OTUs was analyzed by Naive Bayes with a confidence threshold of 70%. Both QIIME2 (version6.0, https://qiime2.org (accessed on 24 January 2021)) [37] and R software calculated and displayed by Alpha diversity, respectively. Beta diversity was determined by QIIME, then evaluating the degree of similarity of microbial communities from different samples. The beta diversity was analyzed by principal coordinate analysis (PCoA). Furthermore, the significant taxonomic difference among group was tested by Linear Discriminant Analysis (LDA) effect size (LEfSe [35]), and the threshold for discriminative features was 4.0. The package “vegan” performed a redundancy analysis (RDA) in R to explore the dissimilarities of the microbiome among different factors.

3. Results

3.1. Plant Cd Uptake

Biochar significantly reduced the Cd content in stems, leaves, rice husks and milled rice of both varieties (Table 1). At the panicle initiation stage, the Cd contents of stems and leaves were reduced by 66.18% and 68.52% in Huanghuazhan and 62.07% and 70.27% in Meixiangzhan2, respectively. The same trend was observed at the heading stage and maturity stage. Furthermore, the Cd contents of rice husk and milled rice were reduced by 47.92% and 31.91% in Huanghuazhan and 43.64% and 34.38% in Meixiangzhan2 at maturity, respectively.

3.2. Changes in Soil Chemical Properties

Biochar amendments significantly improved soil physicochemical properties (Table 2). The biochar significantly increased the soil pH, but the differences were not significant at different periods (Table 2). Soil organic matter increased on average by 0.8–1.1-fold in the biochar treatment compared to the control treatments (Table 2). Soil total N showed the same trend as soil organic matter, significantly decreasing (9% in Huanghuazhan; 17.8% in Meixiangzhan2) at the ripening stage with aging biochar treatment (Table 2). Biochar treatment also significantly increased the soil available P by 1.3–1.9-fold (Table 2).

3.3. Soil Available Cd Concentration

Biochar treatment significantly reduced the concentration of available Cd in the soil (Table 3). Compared with the control, the soil-available Cd concentration was reduced by 23.6–29.59%, 21.19–20.80% and 30.53–33.24% at the panicle initiation stage, heading stage and maturity stage, respectively, in the biochar treatment compared to the control treatment.

3.4. Effect of Biochar on the Rrhizosphere Microbial Community

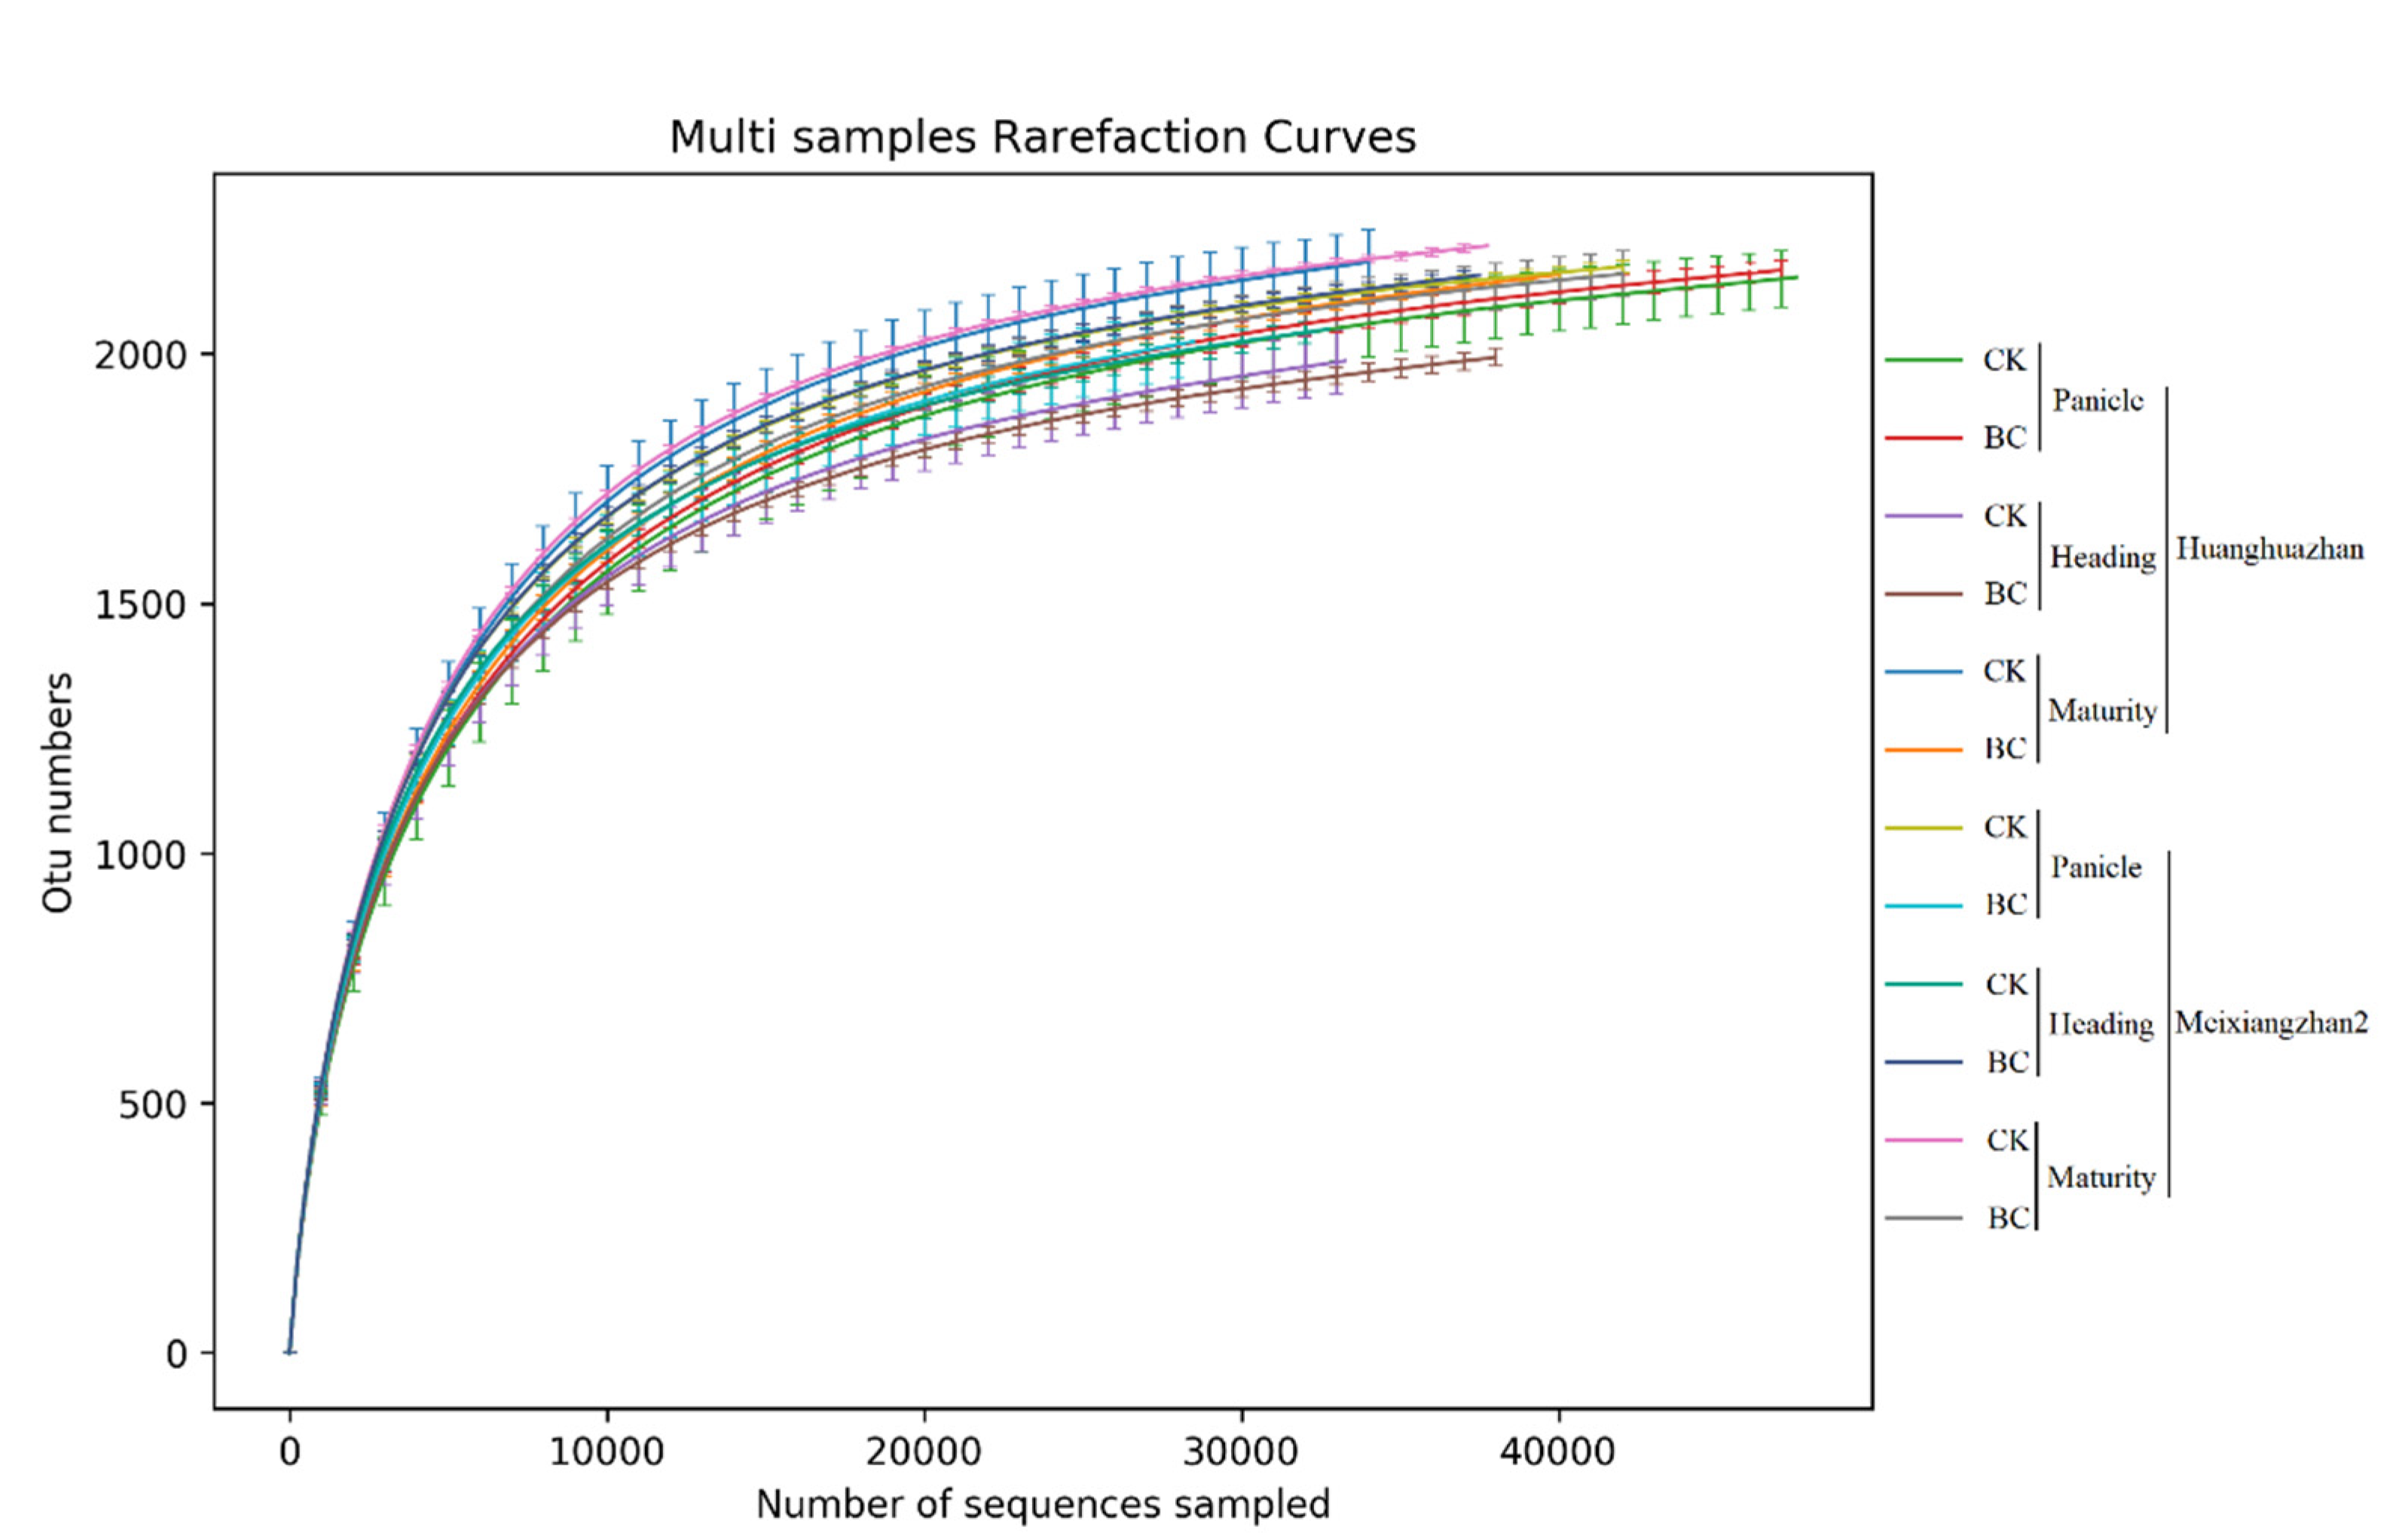
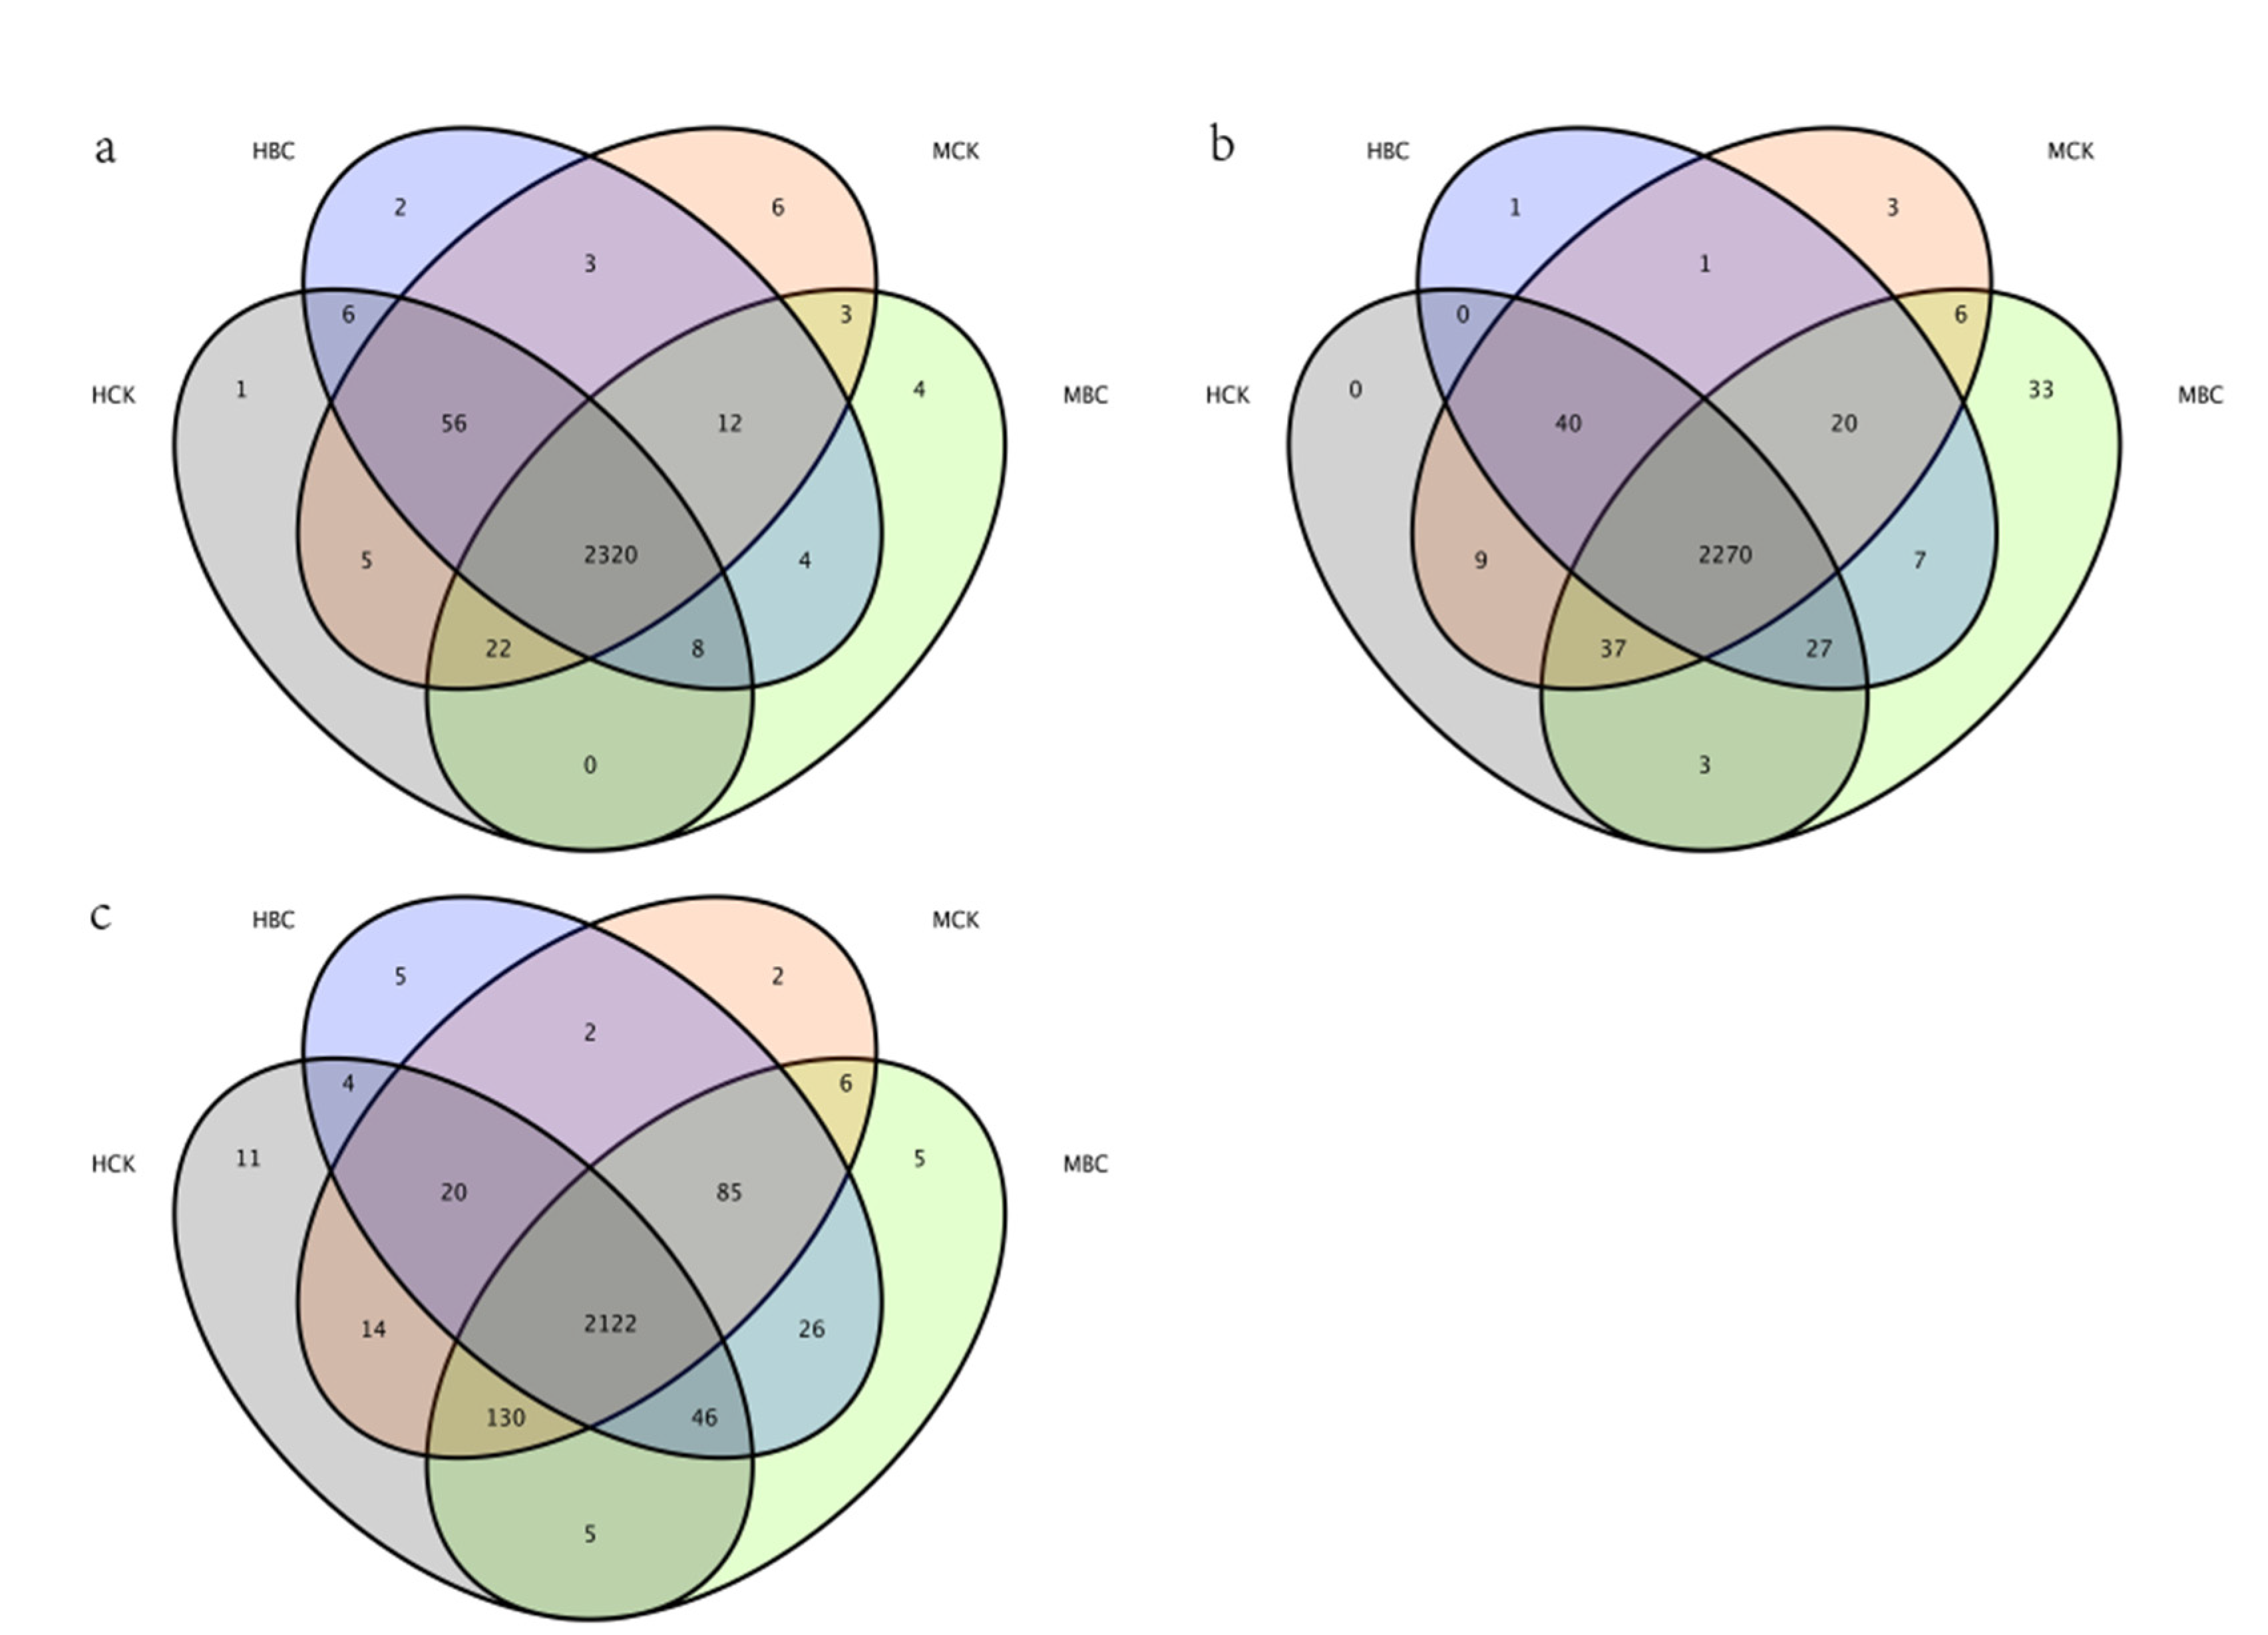
3.4.1. Bacterial Community Diversity and Abundance

According to the high-throughput sequencing reads, a similarity level of 97%, ranging from 2310 to 2427 operational taxonomic units (OTUs), was detected. The rarefaction curve of all samples approached saturation (Figure 1), indicating that the sequence database can accurately reflect the diversity and abundance of species communities of rhizosphere soil. Shannon and Simpson indices were used to compare the abundance of dominant species in the bacterial community, reflecting the diversity of the bacterial community. Biochar had no significant effect on the richness and diversity of rice rhizosphere microorganisms (Table 4). The biochar-treated rhizosphere microbial community still accumulated unique microbial populations in different fertility periods, with differences by variety and growth stage. The Venn diagram of OTUs shows that there were familiar OTUs and unique OTUs after the biochar addition (Figure 2a–c). Different fertility stages had an effect on the changes in microbial communities, and the enrichment of unique species increased with the rice growths and development. The endemic OTUs were 21, 30 and 118 for the three periods (panicle initiation stage, heading stage and maturity stage, respectively) of the biochar treatment at Huanghuazhan and 16, 70 and 82 at Meixiangzhan2.

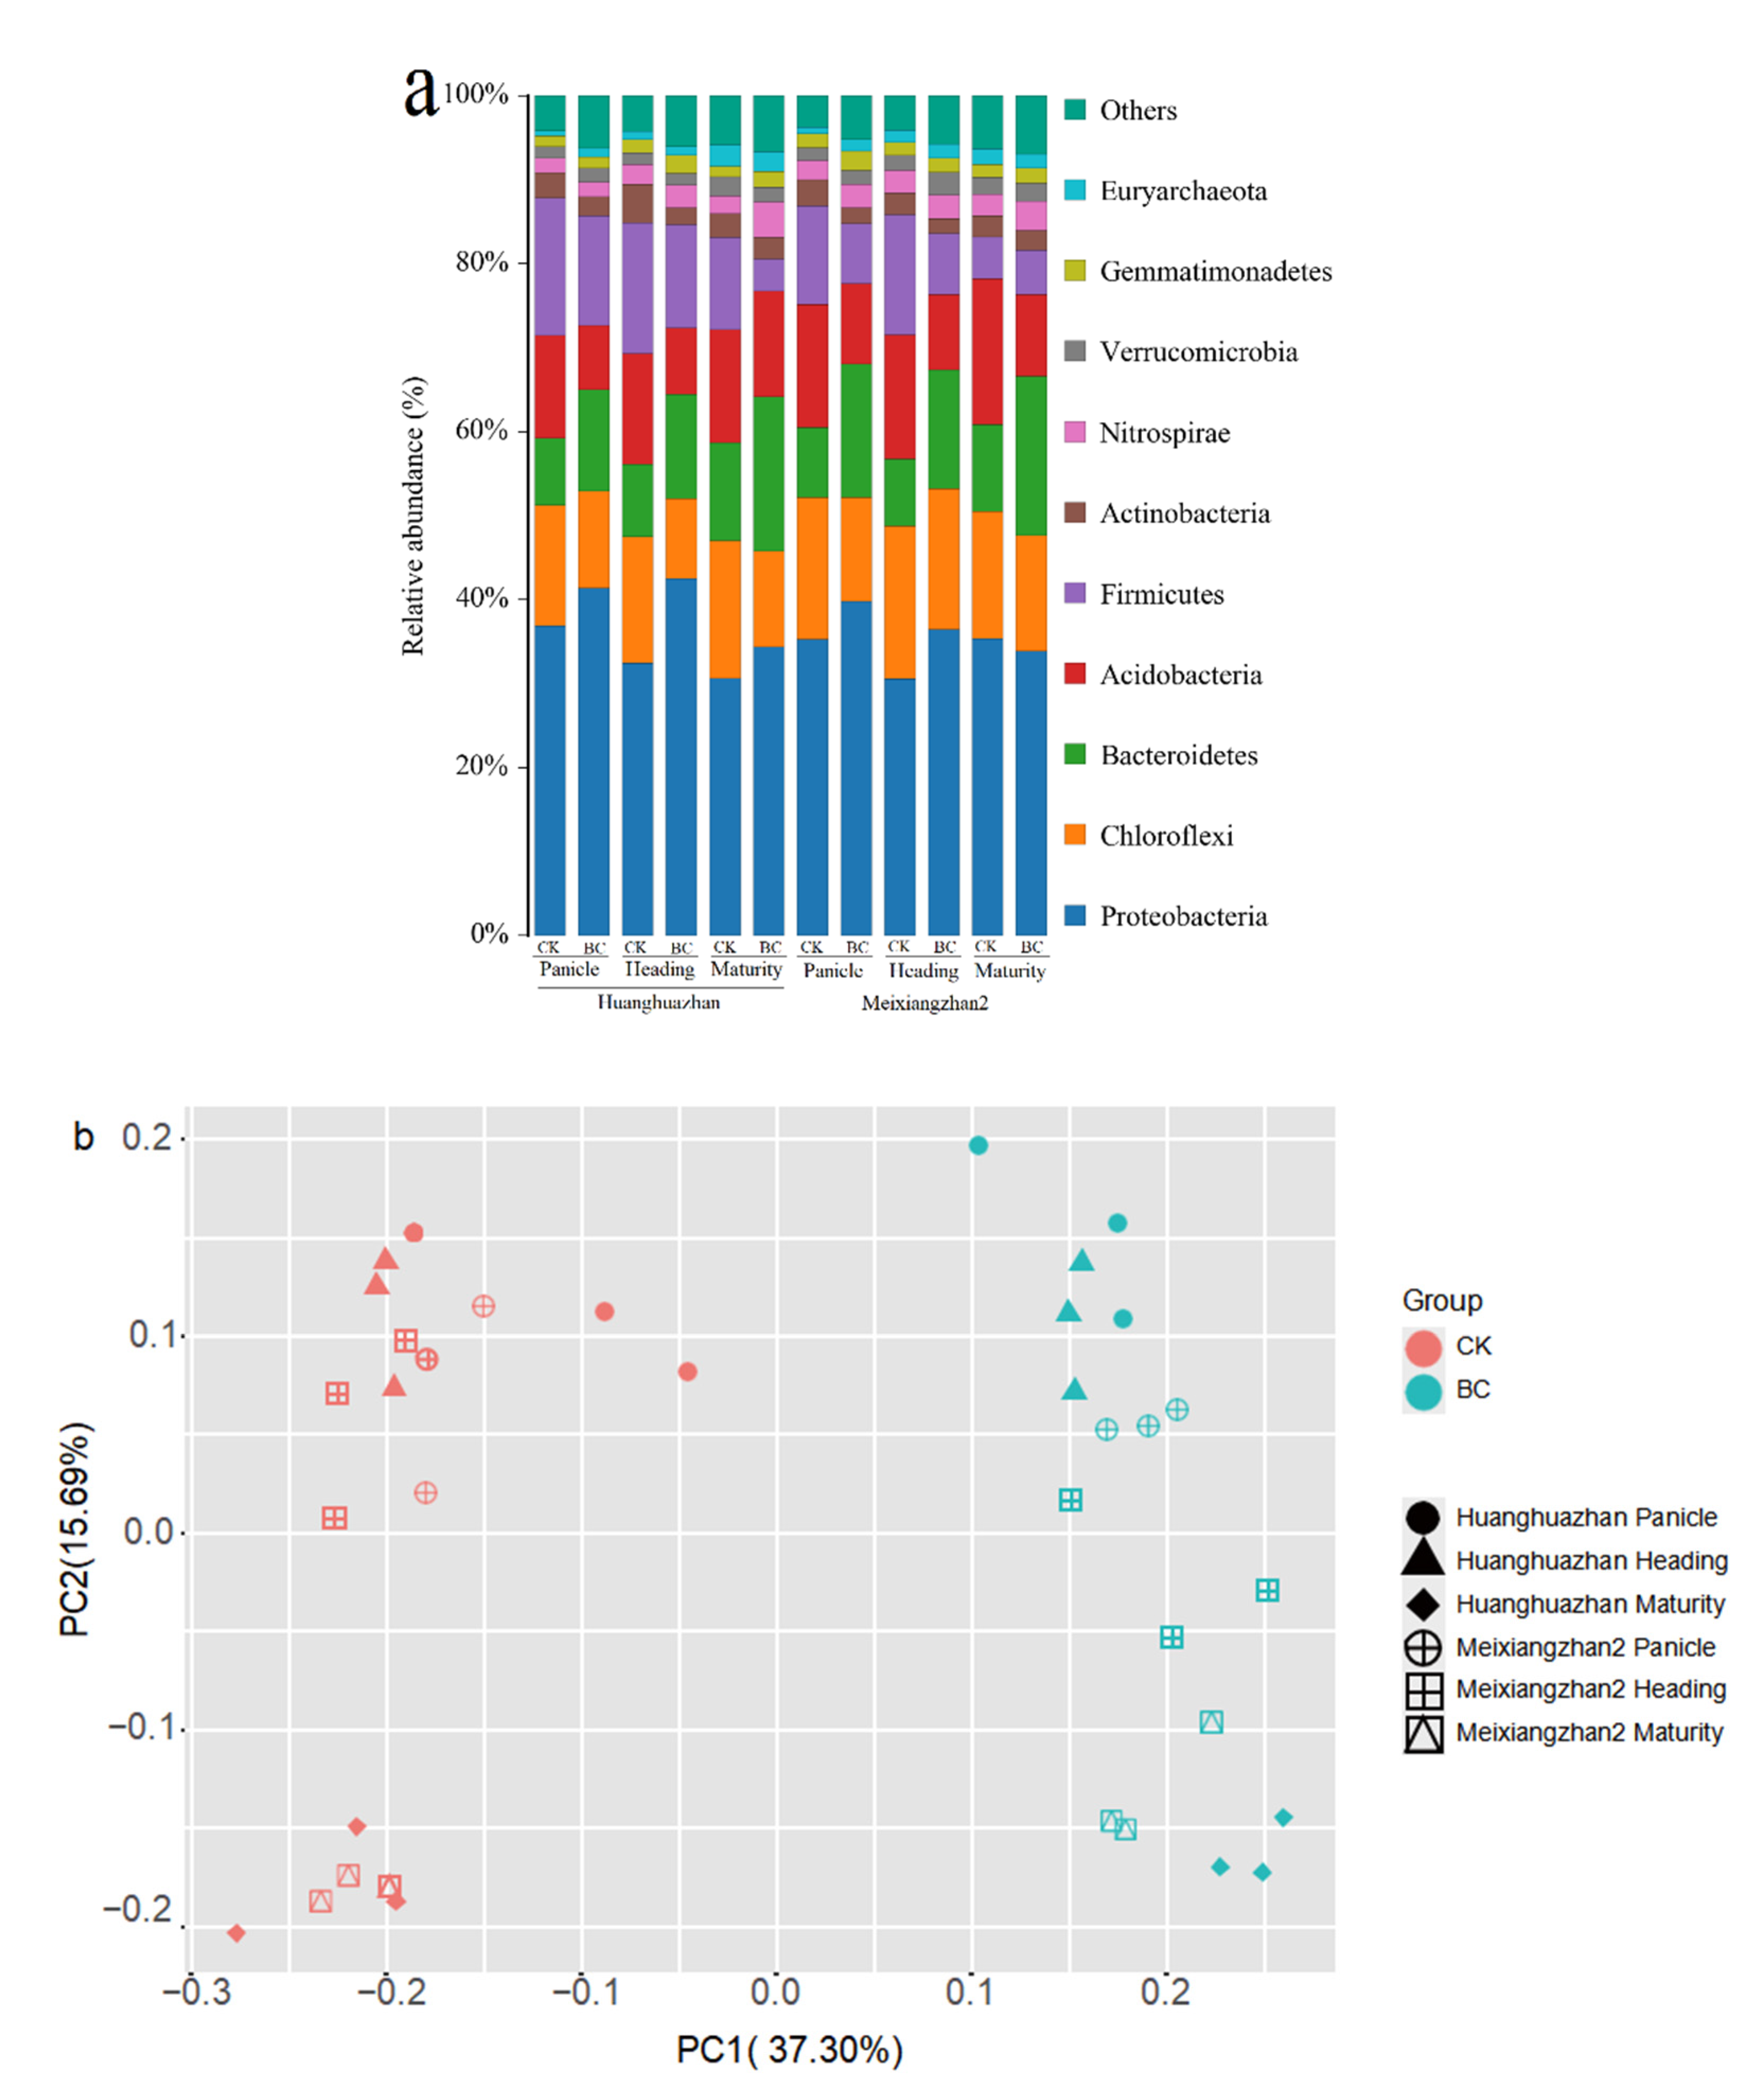
3.4.2. Bacterial Community Structure

The community composition of the rhizosphere soil was changed by biochar treatment. The dominant species in rhizosphere soil accounted for more than 93% of the detected flora. Throughout the whole growth period, the abundance of Proteobacteria, Bacteroidetes, Nitrospirae and Verrucomicrobia increased in the biochar treatment compared to the control treatment, while the abundance of Chloroflexi, Acidobacteria, Firmicutes and Actinobacteria decreased (Figure 3). The abundance of Bacteroidates, Nitrospirae and Euryarchaeota, at the level of phylum, increased with rice maturation, and the abundance of Acidobacteria and Fitrospirae decreased, which accelerated this trend with the application of biochar. In particular, Bacteroidates and Fitrospirae had the most significant changes (Figure 3a). Principal coordinates analysis (PCoA) based on the Bray-Curtis metric also showed that the rhizosphere microbial communities changed significantly in different periods after biochar application (Figure 3b). Principal coordinates 1 (PC1) vs. principal coordinates 2 (PC2) accounted for 52.99% of the variation, suggesting that the microbial community of rhizosphere soil was greatly changed by biochar treatment during different periods of rice growth. These results further indicated that the rhizosphere microbial community was significantly altered by the application of biochar at different rice growth stages.

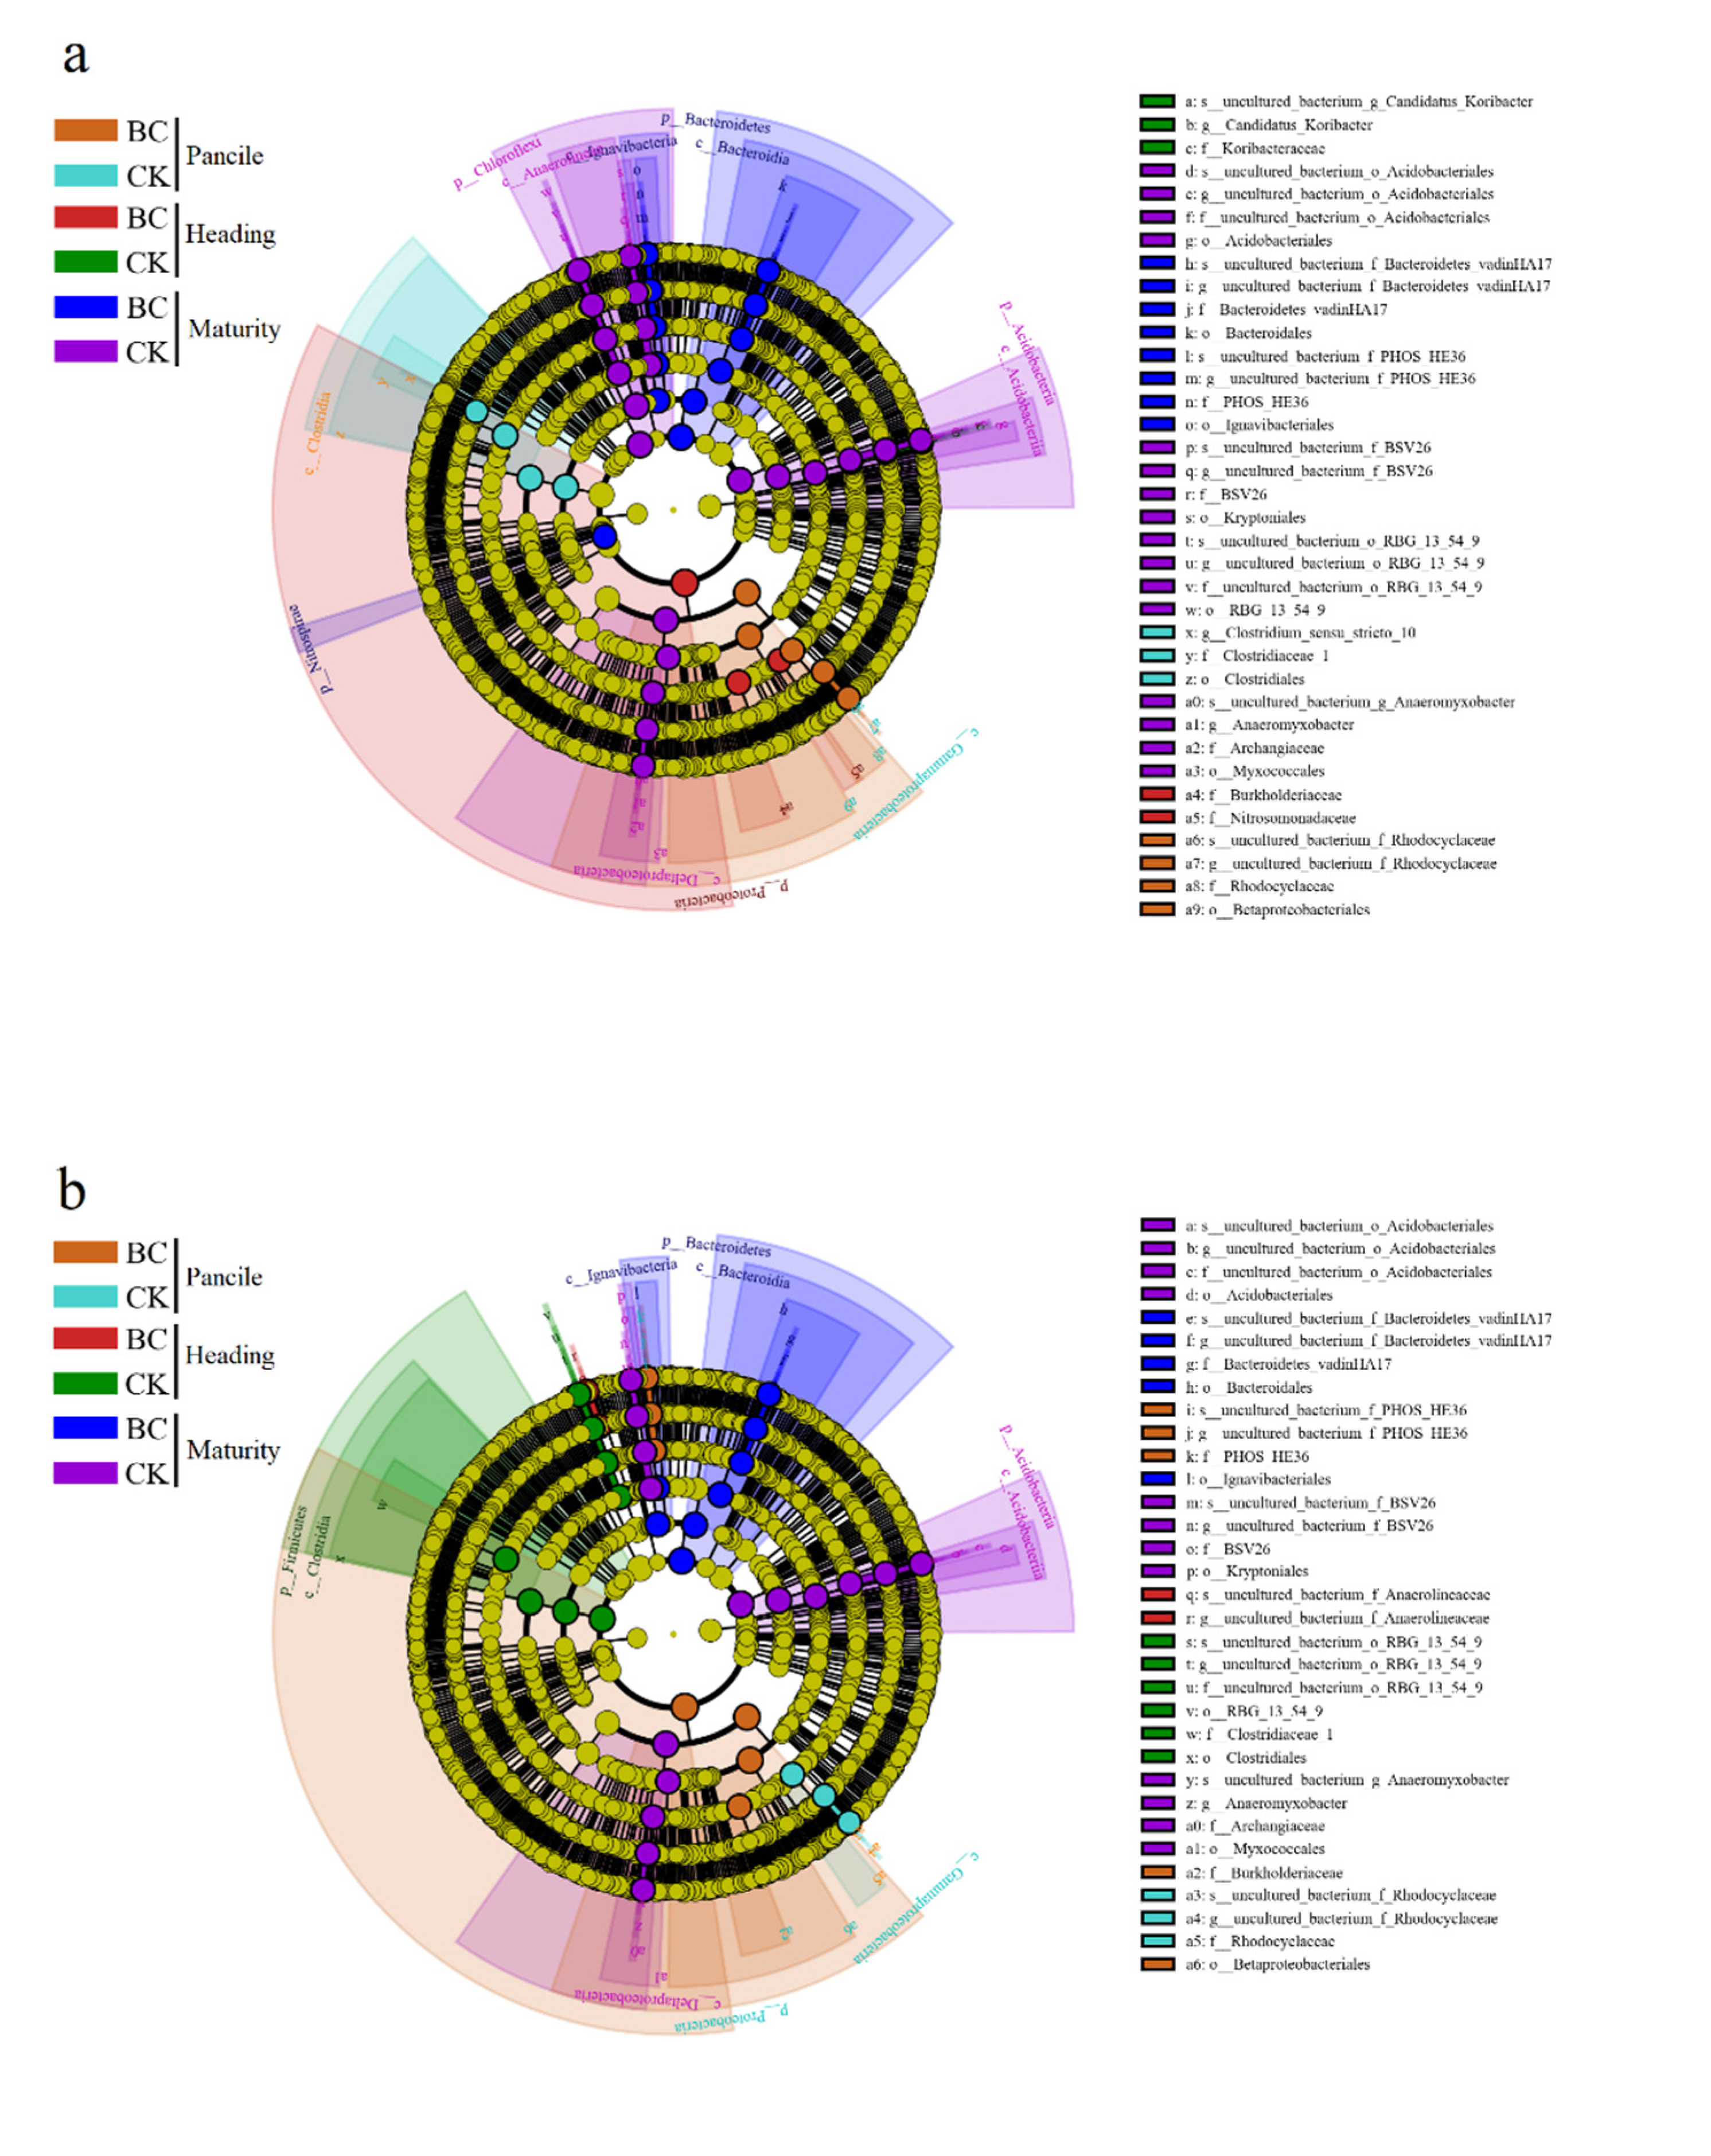
3.4.3. Specific Bacterial Assemblages in the Rhizosphere

The taxonomic cladogram line discriminant analysis effect size (LEfSe) suggested that the predominant discriminant taxa of the bacterial communities in the rhizosphere soil of the biochar treatment in different periods (Figure 4). With the biochar application, the Huanghuazhan rhizosphere was enriched in Proteobacteria (including the family Rhodocyclaceae) at the panicle initiation stage, Proteobacteria (including the families Burkholderiaceae and Nitrosomonadaceae) and some microbes that belong to the phylum Nitrospirae at the heading stage and Bacteroidetes (including the orders Ignavibacteriales and Bacteroidales) at the maturity stage (Figure 4a). In the Meixiangzhan2 rhizosphere, biochar treatment facilitated the colonization of Bacteroidetes (including the family Burkholderiaceae and the order Ignavibacteriales) at the panicle initiation stage. At the heading stage with biochar treatment, Chloroflexi (including the family Anaerolineaceae) was observed. In Meixiangzhan2, the rhizosphere was enriched in Bacteroidetes (including the orders Ignavibacteriales and Bacteroidales) at the maturity stage (Figure 4b). Under biochar treatment, the fixation of some microbes is promoted in different varieties, such as Bacteroidetes_vadinHA17, which belongs to the phylum Bacteroidetes.

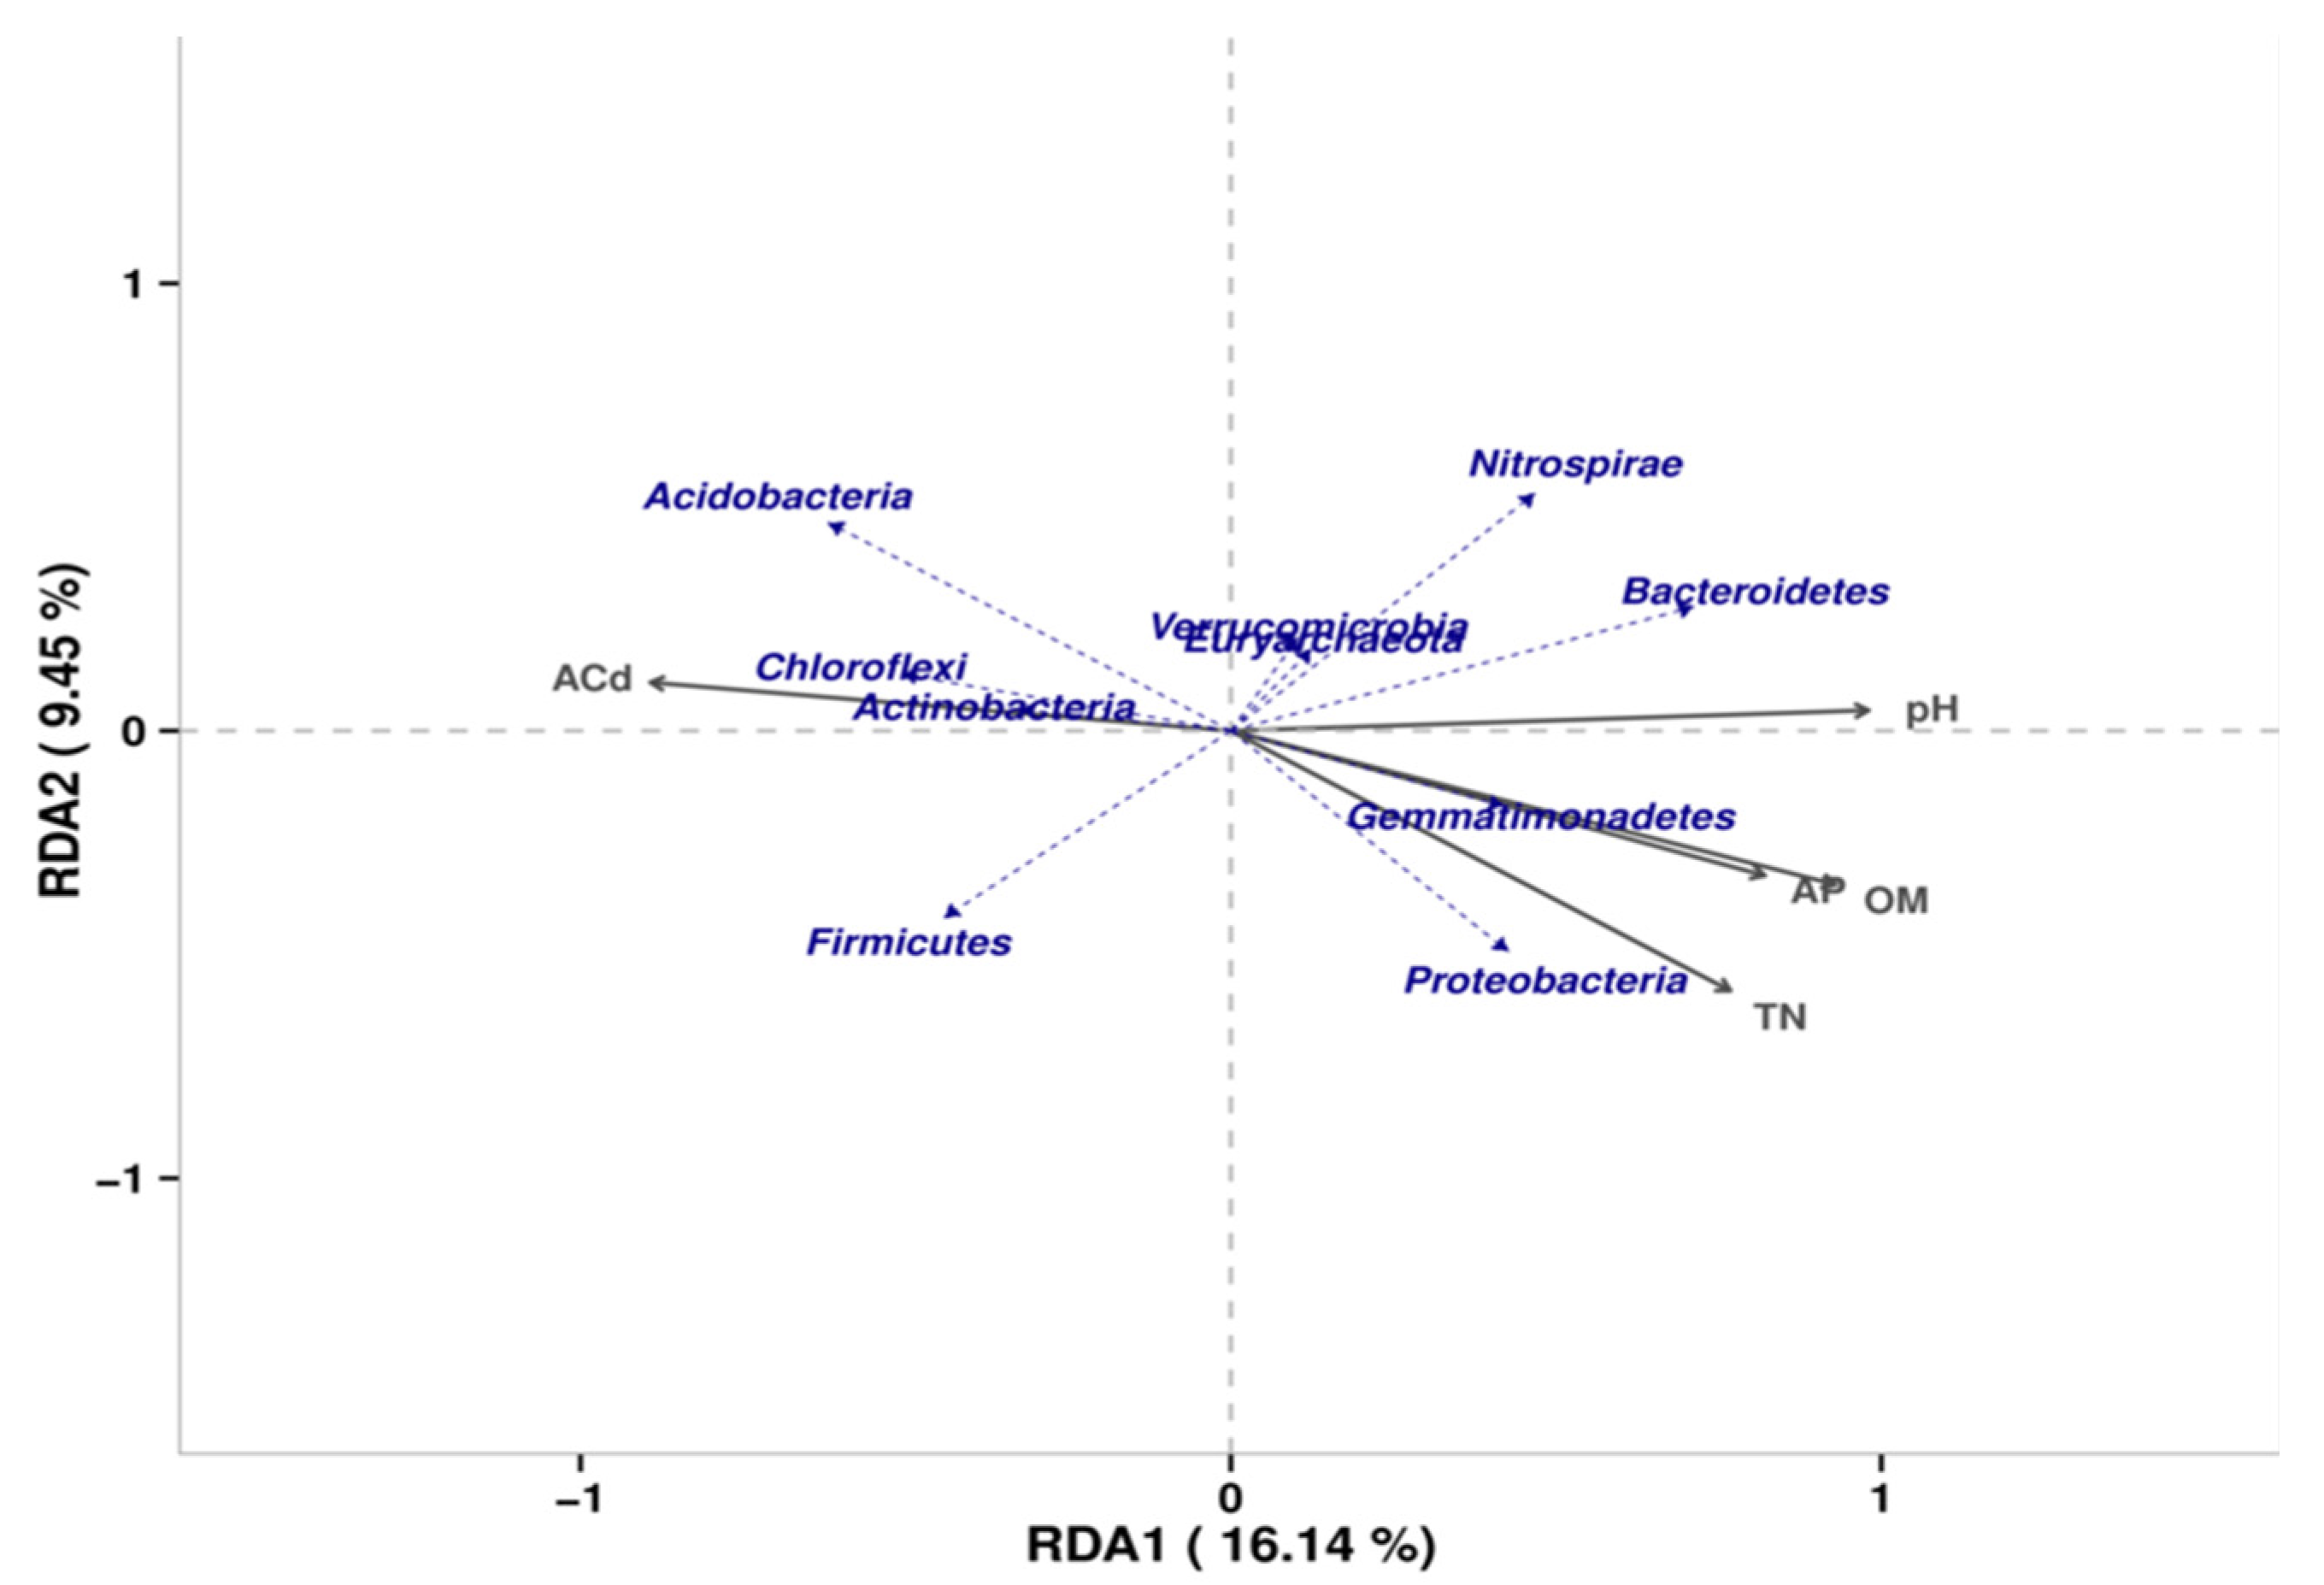
3.4.4. Environmental Factors Associated with the Microbial Community

Redundancy analysis (RDA) suggested that the environmental factors pH, SOM, AP, TN and available Cd (ACd) were significantly positively or negatively correlated with microbes (Figure 5). PH, TN, SOM and AP were positively correlated with the phyla Proteobacteria, Bacteroidetes, Nitrospirae and Verrucomicrobia and negatively correlated with the phyla Chloroflexi, Acidobacteria, Actinobacteria and Firmicutes. The correlation with ACd was reversed. The RDA results further revealed that biochar treatment could indirectly affect the rhizosphere microbial community structure by altering the soil physicochemical properties and Cd content.

4. Discussion

4.1. Effects of Biochar Aging on Soil Physicochemical Properties and Available Cd Concentration

Rice soil physical and chemical properties have important effects on heavy metal morphology and heavy metal absorption by rice and have important effects on soil effective cadmium concentrations [38,39]. The acidification of paddy soil resulted in a decline in soil fertility and the activation of heavy metals [6]. Previous studies showed that biochar improved soil properties and nutrient content [40,41]. The immobilization of heavy metals in soil were affected by the application time of biochar, and the contents of Cd and Cu in soil decreased in two years [27,42]. Our results suggest that the application of rice straw biochar after four years significantly increased the soil pH, SOM, TN and AP (Table 2), while decreased the soil Cd concentration significantly (Table 3). Our result is similar with the findings that the addition of biochar to the soil continuously increased the soil pH and organic matter, thereby reducing the soil available Cd concentration [38]. The considerable Increased soil pH might be that biochar is rich in organic functional groups (e.g., OH, COOH, R–OH), which was attributed to cation exchange capacity (ECE), and ash content combines with Al3+ and H+ in the soil to reduce acidity [12,43]. In addition, biochar increases soil organic matter by promoting the release of its own soluble organic matter and the formation of soil agglomerates as it ages in the soil [12,44]. Meanwhile, biochar provides suitable habitat for microorganisms and accelerates the transformation of soil organic matter [14].
In addition, biochar immobilizes heavy metals in soil through complexation, adsorption, coprecipitation and ion exchange [45]. The immobilization of heavy metals by biochar was affected by soil pH (Table 2); with the increase of soil pH, the negative surface charge was increased, thus increasing the adsorption capacity of metals [45]. In higher pH soil, acid-extractable Cd could be converted to greater oxidization by biochar [3].

4.2. Effects of Biochar Aging on Rhizosphere Microbial Community Structure Composition

Rhizosphere microorganisms can directly or indirectly drive the transformation of the active state of soil heavy metals to stable forms, thus reducing the plant uptake of heavy metals [14]. The microporous structure and nutrients of biochar provide a habitat and nutrient substrate for the reproduction of microbial communities [25]. Our results suggest that the composition of rhizosphere microbial communities was significantly changed by biochar application after four years (Figure 4). The relative abundance of the phyla Proteobacteria, Bacteroidetes, Nitrospirae and Verrucomicrobia was increased under biochar application, while the relative abundance of the phyla Chloroflexi, Acidobacteria, Firmicutes and Actinobacteria was decreased. Proteobacteria had the highest relative abundance of 30.52–42.50%, which is consistent with the findings of Zhang et al. [46] and Fan et al. [19]. Zheng et al. [47] also showed that the relative abundance of Acidobacteria was decreased and the soil pH was increased significantly in biochar treatment. Actinobacteria has been reported play an important role in the degradation of organic matter [48]. Biochar application reduced the relative abundance of Actinobacteria in Cd-contaminated soil, possibly due to synergistic effects [25].
Meanwhile, it was observed that four bacteria, Proteobacteria (including the families Rhodocyclaceae, Burkholderiaceae and Nitrosomonadaceae), Chloroflexi (including the families Anaerolineaceae), Bacteroidetes (including the orders Ignavibacteriales and Bacteroidales) and Nitrospirae were enhanced after four years of biochar treatment (Figure 4), which was previously confirmed to promote nutrient cycling and heavy metal immobilization. Rhodocyclaceae (phylum Proteobacteria) exhibits high resistance to heavy metals in contaminated soil and can form a special protective film at the rhizosphere to inhibit cadmium uptake by rice roots [49]. Alphaproteobacteria was found to have a positive correlation with Na+, and Gemmatimonadetes was also found have a positive correlation with total phosphorus (TP) [50]. Burkholderiaceae may be involved in plant growth, nitrogen fixation and the degradation of pollutants [46]. Studies have shown that Burkholderiaceae indirectly alters the availability of micronutrients and cadmium in rhizosphere soil by promoting the iron-nitrogen coupling cycle [51]. In addition, biochar treatment increased the abundance of the Nitrospirae phylum, which altered the abundance of bacterial communities associated with the nitrogen cycle in the soil, thus affecting the microbial mechanisms of soil nitrogen leaching [52]. Anaerolineaceae (phylum Chloroflexi) degrades organic matter and fix available Cd by synergistic interaction with methane metabolism microbiota, while also interacting with other microorganisms to reduce the toxic effects of heavy metals [7,12]. Bacteroidales play an important role in the decomposition of toxic and nondegradable carbohydrates and polycyclic aromatic hydrocarbons (PAHs) in soil [53]. Biochar application promoted the enrichment of the orders Ignavibacteriales and Bacteroidales in the rice rhizosphere. These results all indicate that biochar treatment can promote the colonization of Cd-resistant rhizosphere microbial populations.

4.3. Effects of Aging Biochar on Rice Uptake of Cd

The growth of rice in Cd- and Pb-contaminated soil was inhibited, and the metal accumulation increased [54]. However, the contents of chlorophyll a, b and total chlorophyll were significantly enhanced by biochar addition [55]. In addition, the addition of biochar significantly stimulated plant growth as compared to the control. Indeed, the shoot biomass, grain yield, number of tillers and the height of tillers all improved significantly [56].
The available Cd content in soil plays an important role in the uptake and accumulation by plants. This study showed that the biochar treatment after four years reduced the Cd concentrations in various parts of rice (Table 1) due to the increase in soil pH and SOM and the enrichment of rhizosphere microbes during the biochar aging process, which fixed soil-available Cd and indirectly inhibited the transfer of Cd to aboveground parts of rice [57] (Table 2). Yin et al. [58] reported that biochar reduced porewater Cd in the rhizosphere, resulting in a remarkable reduction in grains. Biochar also promotes the absorption of mineral elements, such as Mg, Zn and Fe, by rice, which competes with soil Cd for the same transporter vector, thus reducing Cd uptake and transport in rice [59]. In this study, it was also found that some specific microbial populations were enriched in the rice rhizosphere during the biochar aging process, which promoted soil available Cd fixation (Figure 3 and Figure 4). These microorganisms formed a special protection system in the rhizosphere to inhibit rice root Cd uptake. However, the mechanism of soil Cd fixation by specific microbial-assisted biochar enriched in the rhizosphere is not well understood, which may be due to the uptake of Cd by the rhizosphere microbes themselves, the symbiotic occupation of Cd absorption sites with rice roots, or the modification of the chemical form of Cd in the soil or plant. However, the exact mechanism of action needs to be further investigated.

5. Conclusions

Our results showed that biochar could improve soil properties and reduce Cd accumulation in rice after being applied to soil for many years. Moreover, biochar changed the rhizosphere bacterial community structure composition (phyla level) in all stages. The relative abundance of Proteobacteria, Bacteroidetes and Nitrospirae was increased, while the relative abundance of Chloroflexi, Acidobacteria and Actinobacteria was decreased. Meanwhile, the application of biochar enriched Rhodocyclaceae, Burkholderiaceae, Nitrosomonadaceae, Anaerolineaceae, Ignavibacteriales and Bacteroidales, which may contribute to the reduction of Cd uptake and accumulation in rice. However, the causal relationship between biochar enrichment in specific Cd-resistant bacterial communities and the function of Cd fixation by rhizosphere bacterial communities has not been fully demonstrated and analyzed, and further studies are needed.

Author Contributions

Y.Z. designed the experiments; X.D., C.L. and L.C. performed the experiments; Y.D., Z.Z. and L.G. analyzed the data; X.D. wrote the manuscript. All authors have read and agreed to the published version of the manuscript.

Funding

This study was supported by the Special Funds of the Rice Industry System of Jiangxi Province (JXARS-02-03) and the Special Project for Young and Middle-aged Science and Technology Innovation Leaders ([2018] No. 175).

Institutional Review Board Statement

Not applicable.

Informed Consent Statement

Not applicable.

Data Availability Statement

The data reported in this study are contained within the article.

Conflicts of Interest

The authors declare no conflict of interest.

References

  1. Chen, H.; Tang, Z.; Wang, P.; Zhao, F. Geographical variations of cadmium and arsenic concentrations and arsenic speciation in Chinese rice. Environ. Pollut. 2018, 238, 482–490. [Google Scholar] [CrossRef] [PubMed]
  2. Wang, Y.; Xu, Y.; Li, D.; Tang, B.; Man, S.; Jia, Y.; Xu, H. Vermicompost and biochar as bio-conditioners to immobilize heavy metal and improve soil fertility on cadmium contaminated soil under acid rain stress. Sci. Total Environ. 2018, 621, 1057–1065. [Google Scholar] [CrossRef] [PubMed]
  3. Song, W.; Chen, S.; Liu, J.; Chen, L.; Song, N.; Li, N.; Liu, B. Variation of Cd concentration in various rice cultivars and derivation of cadmium toxicity thresholds for paddy soil by species-sensitivity distribution. J. Integr. Agric. 2015, 14, 1845–1854. [Google Scholar] [CrossRef]
  4. Jia, X.; Zhou, C.; Dong, S. Effects of Pb2+/Cd2+ on the number of microorganisms in the rhizosphere of winter wheat seedings. J. Shenyang Agric. Univ. 2011, 42, 443–448. [Google Scholar]
  5. Shi, Z.; Carey, M.; Meharg, C.; Williams, P.N.; Signes-Pastor, A.J.; Triwardhani, E.A.; Pandiangan, F.I.; Campbell, K.; Elliott, C.; Marwa, E.M.; et al. Rice Grain Cadmium Concentrations in the Global Supply-Chain. Expo. Health 2020, 12, 869–876. [Google Scholar] [CrossRef] [Green Version]
  6. Zou, M.; Zhou, S.; Zhou, Y.; Jia, Z.; Guo, T.; Wang, J. Cadmium pollution of soil-rice ecosystems in rice cultivation dominated regions in China: A review. Environ. Pollut. 2021, 280, 116965. [Google Scholar] [CrossRef]
  7. Cheng, Z.; Shi, J.; He, Y.; Wu, L.; Xu, J. Assembly of root-associated bacterial community in cadmium contaminated soil following five-year consecutive application of soil amendments: Evidences for improved soil health. J. Hazard. Mater. 2022, 426, 128095. [Google Scholar] [CrossRef]
  8. Shahid, M.; Ali, S.; Shabir, G.; Siddique, M.; Rizwan, M.; Seleiman, M.F.; Afzal, M. Comparing the performance of four macrophytes in bacterial assisted floating treatment wetlands for the removal of trace metals (Fe, Mn, Ni, Pb, and Cr) from polluted river water. Chemosphere 2019, 243, 125353. [Google Scholar] [CrossRef]
  9. Lehmann, J. A handful of carbon. Nature 2007, 447, 143–144. [Google Scholar] [CrossRef]
  10. Bandara, T.; Franks, A.; Xu, J.; Bolan, N.; Wang, H.; Tang, C. Chemical and biological immobilization mechanisms of potentially toxic elements in biochar-amended soils. Crit. Rev. Environ. Sci. Technol. 2020, 50, 903–978. [Google Scholar] [CrossRef]
  11. Seleiman, M.F.; Alotaibi, M.A.; Alhammad, B.A.; Alharbi, B.M.; Refay, Y.; Badawy, S.A. Effects of ZnO nanoparticles and biochar of rice straw and cow Manure on characteristics of contaminated soil and sunflower productivity, oil quality, and heavy metals uptake. Agronomy 2020, 10, 790. [Google Scholar] [CrossRef]
  12. Li, H.; Dong, X.; Da, S.; Oliveira, L.; Chen, Y.; Ma, L. Mechanisms of metal sorption by biochars: Biochar characteristics and modifications. Chemosphere 2017, 178, 466–478. [Google Scholar] [CrossRef]
  13. Lehmann, J.; Rillig, M.; Thies, J.; Masiello, C.; Hockaday, W.; Crowley, D. Biochar effects on soil biota—A review. Soil Biol. Biochem. 2011, 43, 1812–1836. [Google Scholar] [CrossRef]
  14. Gorovtsov, A.V.; Minkina, T.M.; Mandzhieva, S.S.; Perelomov, L.V.; Soja, G.; Zamulina, I.V.; Rajput, V.D.; Sushkova, S.N.; Mohan, D.; Yao, J. The mechanisms of biochar interactions with microorganisms in soil. Environ. Geochem. Health 2020, 42, 2495–2518. [Google Scholar] [CrossRef]
  15. Jiang, X.; Tan, X.; Cheng, J.; Haddix, M.L.; Cotrufo, M.F. Interactions between aged biochar, fresh low molecular weight carbon and soil organic carbon after 3.5 years soil-biochar incubations. Geoderma 2019, 333, 99–107. [Google Scholar] [CrossRef]
  16. De la Rosa, J.; Rosado, M.; Paneque, M.; Miller, A.; Knicker, H. Effects of aging under field conditions on biochar structure and composition: Implications for biochar stability in soils. Sci. Total Environ. 2018, 613–614, 969–976. [Google Scholar] [CrossRef] [Green Version]
  17. Pei, J.; Li, J.; Mia, S.; Singh, B.; Wu, J.; Dijkstra, F.A. Biochar aging increased microbial carbon use efficiency but decreased biomass turnover time. Geoderma 2020, 382, 114710. [Google Scholar] [CrossRef]
  18. Quan, G.; Fan, Q.; Zimmerman, A.R.; Sun, J.; Cui, L.; Wang, H.; Gao, B.; Yan, J. Effects of laboratory biotic aging on the characteristics of biochar and its water-soluble organic products. J. Hazard. Mater. 2020, 382, 121071. [Google Scholar] [CrossRef]
  19. Fan, S.; Zuo, J.; Dong, H. Changes in Soil Properties and Bacterial Community Composition with Biochar Amendment after Six Years. Agronomy 2020, 10, 746. [Google Scholar] [CrossRef]
  20. Li, K.; Yin, G.; Xu, Q.; Yan, J.; Hseu, Z.; Zhu, L.; Lin, Q. Influence of Aged Biochar Modified by Cd2+ on Soil Properties and Microbial Community. Sustainability 2020, 12, 4868. [Google Scholar] [CrossRef]
  21. Hu, J.; Wei, Z.; Kowalchuk, G.; Xu, Y.; Shen, Q.; Jousset, A. Rhizosphere microbiome functional diversity and pathogen invasion resistance build up during plant development. Environ. Microbiol. 2020, 22, 5005–5018. [Google Scholar] [CrossRef] [PubMed]
  22. Rai, P.; Lee, S.; Zhang, M.; Tsang, Y.; Kim, K. Heavy metals in food crops: Health risks, fate, mechanisms, and management. Environ. Int. 2019, 125, 365–385. [Google Scholar] [CrossRef] [PubMed]
  23. Hou, D.; Wang, R.; Gao, X.; Wang, K.; Lin, Z.; Ge, J.; Liu, T.; Wei, S.; Chen, W.; Xie, R.; et al. Cultivar-specific response of bacterial community to cadmium contamination in the rhizosphere of rice (Oryza sativa L.). Environ. Pollut. 2018, 241, 63–73. [Google Scholar] [CrossRef] [PubMed]
  24. Xu, X.; Chen, C.; Wang, P.; Kretzschmar, R.; Zhao, F. Control of arsenic mobilization in paddy soils by manganese and iron oxides. Environ. Pollut. 2017, 231, 37–47. [Google Scholar] [CrossRef] [PubMed]
  25. Wang, M.; Wang, L.; Zhao, S.; Li, S.; Lei, X.; Qin, L.; Sun, X.; Chen, S. Manganese facilitates cadmium stabilization through physicochemical dynamics and amino acid accumulation in rice rhizosphere under flood-associated low pe+ pH. J. Hazard. Mater. 2021, 416, 126079. [Google Scholar] [CrossRef]
  26. Wang, B.; Lehmann, J.; Hanley, K.; Hestrin, R.; Enders, A. Adsorption and desorption of ammonium by maple wood biochar as a function of oxidation and pH. Chemosphere 2015, 138, 120–126. [Google Scholar] [CrossRef] [Green Version]
  27. Chen, L.; Guo, L.; Liao, P.; Xiong, Q.; Deng, X.; Pan, X.; Zeng, Y.; Zhang, H. Effects of biochar on the dynamic immobilization of Cd and Cu and rice accumulation in soils with different acidity levels. J. Clean. Prod. 2022, 372, 133730. [Google Scholar] [CrossRef]
  28. Chen, L.; Guo, L.; Liao, P.; Xiong, Q.; Deng, X.; Gao, H.; Wei, H.; Dai, Q.; Pan, X.; Zeng, Y.; et al. Rice Straw Biochar Reduces Cd Accumulation and promotes Cu accumulation in rice: Irrigation regime is the driving factor. J. Soils Sediments 2022. [Google Scholar] [CrossRef]
  29. Edwards, J.; Santos-Medellín, C.; Sundaresan, V. Extraction and 16S rRNA sequence analysis of microbiomes associated with rice Roots. Bio-Protocol 2018, 8, e2884. [Google Scholar] [CrossRef]
  30. Lindsay, W.; Norvell, W. Development of a DTPA soil test for zinc, iron, manganese, and copper. Soil Sci. Soc. Am. J. 1978, 42, 421–428. [Google Scholar] [CrossRef]
  31. Xiao, Q.; Wang, Y.; Lü, Q.; Wen, H.; Han, B.; Chen, S.; Zheng, X.; Lin, R. Responses of glutathione and phytochelatins biosysthesis in a cadmium accumulator of Perilla frutescens (L.) Britt. under cadmium contaminated conditions. Ecotoxicol. Environ. Saf. 2020, 201, 110805. [Google Scholar] [CrossRef]
  32. Huang, D.; Xu, Y.; Lei, F.; Yu, X.; Ouyang, Z.; Chen, Y.; Jia, H.; Guo, X. Degradation of polyethylene plastic in soil and effects on microbial community composition. J. Hazard. Mater. 2021, 416, 126173. [Google Scholar] [CrossRef]
  33. Callahan, B.J.; McMurdie, P.J.; Rosen, M.J.; Han, A.W.; Johnson AJ, A.; Holmes, S.P. DADA2, High-resolution sample inference from Illumina amplicon data. Nat. Methods 2016, 13, 581–583. [Google Scholar] [CrossRef] [Green Version]
  34. Edgar, R.C. UPARSE: Highly accurate OTU sequences from microbial amplicon reads. Nat. Methods 2013, 10, 996. [Google Scholar] [CrossRef]
  35. Segata, N.; Izard, J.; Waldron, L.; Gevers, D.; Miropolsky, L.; Garrett, W.S.; Huttenhower, C. Metagenomic biomarker discovery and explanation. Genome Biol. 2011, 12, R60. [Google Scholar] [CrossRef] [Green Version]
  36. Quast, C.; Pruesse, E.; Yilmaz, P.; Gerken, J.; Schweer, T.; Yarza, P.; Peplies, J.; Glöckner, F.O. The SILVA ribosomal RNA gene database project: Improved data processing and web-based tools. Nucleic Acids Res. 2012, 41, D590–D596. [Google Scholar] [CrossRef]
  37. Bolyen, E.; Rideout, J.R.; Dillon, M.R.; Bokulich, N.A.; Abnet, C.C.; Al-Ghalith, G.A.; Alexander, H.; Alm, E.J.; Arumugam, M.; Asnicar, F.; et al. Reproducible, interactive, scalable and extensible microbiome data science using QIIME 2. Nat. Biotechnol. 2019, 37, 852–857. [Google Scholar] [CrossRef]
  38. Alkharabsheh, H.M.; Seleiman, M.F.; Battaglia, M.L.; Shami, A.; Jalal, R.S.; Alhammad, B.A.; Almutairi, K.F.; Al-Saif, A.M. Biochar and its broad impacts in soil quality and fertility, nutrient leaching and crop productivity: A Review. Agronomy 2021, 11, 993. [Google Scholar] [CrossRef]
  39. Li, Z.; Liang, Y.; Hu, H.; Shaheen, S.; Zhong, H.; Tack, F.; Wu, M.; Li, Y.-F.; Gao, Y.; Rinklebe, J.; et al. Speciation, transportation, and pathways of cadmium in soil-rice systems: A review on the environmental implications and remediation approaches for food safety. Environ. Int. 2021, 156, 106749. [Google Scholar] [CrossRef]
  40. Futa, B.; Oleszczuk, P.; Andruszczak, S.; Kwiecińska-Poppe, E.; Kraska, P. Effect of Natural Aging of Biochar on Soil Enzymatic Activity and Physicochemical Properties in Long-Term Field Experiment. Agronomy 2020, 10, 449. [Google Scholar] [CrossRef] [Green Version]
  41. Wang, C.; Chen, D.; Shen, J.; Yuan, Q.; Fan, F.; Wei, W.-X.; Li, Y.; Wu, J. Biochar alters soil microbial communities and potential functions 3-4 years after amendment in a double rice cropping system. Agric. Ecosyst. Environ. 2021, 311, 107291. [Google Scholar] [CrossRef]
  42. Bian, R.; Joseph, S.; Cui, L.; Pan, G.; Li, L.; Liu, X.; Zhang, A.; Rutlidge, H.; Wong, S.; Chia, C.; et al. A three-year experiment confirms continuous immobilization of cadmium and lead in contaminated paddy field with biochar amendment. J. Hazard. Mater. 2014, 272, 121–128. [Google Scholar] [CrossRef] [PubMed]
  43. Dai, Z.; Zhang, X.; Tang, C.; Muhammad, N.; Wu, J.; Brookes, P.C.; Xu, J. Potential role of biochars in decreasing soil acidification—A critical review. Sci. Total Environ. 2017, 581–582, 601–611. [Google Scholar] [CrossRef] [PubMed]
  44. Liu, Z.; Zhu, M.; Wang, J.; Liu, X.; Guo, W.; Zheng, J.; Bian, R.; Wang, G.; Zhang, X.; Cheng, K.; et al. The responses of soil organic carbon mineralization and microbial communities to fresh and aged biochar soil amendments. Glob. Change Biol. Bioenergy 2019, 11, 1408–1420. [Google Scholar] [CrossRef] [Green Version]
  45. Jia, M.; Yu, J.; Li, Z.; Wu, L.; Christie, P. Effects of biochar on the migration andtransformation of metal species in a highly acid soil contaminated with multiplemetals and leached with solutions of different pH. Chemosphere 2021, 278, 130344. [Google Scholar] [CrossRef] [PubMed]
  46. Zhang, J.; Li, Q.; Zeng, Y.; Zhang, J.; Lu, G.; Dang, Z.; Guo, C. Bioaccumulation and distribution of cadmium by Burkholderia cepacia GYP1 under oligotrophic condition and mechanism analysis at proteome level. Ecotoxicol. Environ. Saf. 2019, 176, 162–169. [Google Scholar] [CrossRef]
  47. Zheng, J.; Chen, J.; Pan, G.; Liu, X.; Zhang, X.; Li, L.; Bian, R.; Cheng, K.; Jinwei, Z. Biochar decreased microbial metabolic quotient and shifted community composition four years after a single incorporation in a slightly acid rice paddy from southwest China. Sci. Total Environ. 2016, 571, 206–217. [Google Scholar] [CrossRef]
  48. Kirby, R. Actinomycetes and lignin degradation. Adv. Appl. Microbiol. 2009, 58, 125. [Google Scholar]
  49. Wang, R.; Wei, S.; Jia, P.; Liu, T.; Hou, D.; Xie, R.; Lin, Z.; Ge, J.; Qiao, Y.; Chang, X.; et al. Biochar significantly alters rhizobacterial communities and reduces Cd concentration in rice grains grown on Cd-contaminated soils. Sci. Total Environ. 2019, 676, 627–638. [Google Scholar] [CrossRef]
  50. Soothar, M.K.; Hamani, A.K.M.; Sardar, M.F.; Sootahar, M.K.; Fu, Y.; Rahim, R.; Soothar, J.K.; Bhatti, S.M.; Abubakar, S.A.; Gao, Y.; et al. Maize (Zea mays L.) Seedlings Rhizosphere Microbial Community as Responded to Acidic Biochar Amendment Under Saline Conditions. Front. Microbiol. 2021, 12, 789235. [Google Scholar] [CrossRef]
  51. Wang, C.; Huang, Y.; Yang, X.; Xue, W.; Zhang, X.; Zhang, Y.; Pang, J.; Liu, Y.; Liu, Z. Burkholderia sp. Y4 inhibits cadmium accumulation in rice by increasing essential nutrient uptake and preferentially absorbing cadmium. Chemosphere 2020, 252, 126603. [Google Scholar] [CrossRef]
  52. Xu, N.; Tan, G.; Wang, H.; Gai, X. Effect of biochar additions to soil on nitrogen leaching, microbial biomass and bacterial community structure. Eur. J. Soil Biol. 2016, 74, 1–8. [Google Scholar] [CrossRef]
  53. Tang, T. The effect of different straws on anaerobic removal of ficiency and mechanism of polycyclic aromatic hydroc-arbons in sludge by co-metabolism pathway. Master's Thesis, Guizhou University, Guiyang, China, 2019; p. P72. [Google Scholar]
  54. Xie, L.; Hao, P.; Cheng, Y.; Ahmed, I.; Cao, F. Effect of combined application of lead, cadmium, chromium and copper on grain, leaf and stem heavy metal contents at different growth stages in rice. Ecotoxicol. Environ. Saf. 2018, 168, 71–76. [Google Scholar] [CrossRef]
  55. Yue, L.; Lian, F.; Han, Y.; Bao, Q.L.; Wang, Z.Y.; Xing, B.S. The effect of biochar nanoparticles on rice plant growth and the uptake of heavy metals: Implications for agronomic benefits and potential risk. Sci. Total Environ. 2019, 656, 9–18. [Google Scholar] [CrossRef]
  56. Khan, S.; Chao, C.; Waqas, M.; Arp, H.P.H.; Zhu, Y.G. Sewage Sludge Biochar Influence upon Rice (Oryza sativa L.) Yield, Metal Bioaccumulation and Greenhouse Gas Emissions from Acidic Paddy Soil. Environ. Sci Technol 2013, 47, 8624–8632. [Google Scholar] [CrossRef]
  57. Lv, G.; Yang, T.; Chen, Y.; Hou, H.; Liu, X.; Li, J.; Wei, L.; Li, J. Biochar-based fertilizer enhanced Cd immobilization and soil quality in soil-rice system. Ecol. Eng. 2021, 171, 106396. [Google Scholar] [CrossRef]
  58. Yin, D.; Wang, X.; Peng, B.; Tan, C.; Ma, L.Q. Effect of biochar and Fe-biochar on Cd and As mobility and transfer in soil-rice system. Cheosphere 2017, 186, 928–937. [Google Scholar] [CrossRef]
  59. Liu, Y.; Luo, H.; Tie, B.; Li, D.; Liu, S.; Lei, M.; Du, H. The long-term effectiveness of ferromanganese biochar in soil Cd stabilization and reduction of Cd bioaccumulation in rice. Biochar 2021, 3, 499–509. [Google Scholar] [CrossRef]
Figure 1. Rarefaction analyses of multi samples.
Agronomy 13 00081 g001
Figure 2. Venn diagram of common and unique OTUs present in microbial communities at different conditions. HBC means the biochar treatment in Huanghuanzhan, HCK means the control treatment in Huanghuanzhan, MBC means the biochar treatment in Meixiangzhan2, MCK means the control treatment in Meixiangzhan2; (a) panicle initiation stage; (b) heading stage; (c) maturity stage.
Agronomy 13 00081 g002
Figure 3. Mean relative abundance of microbe phyla in different conditions (a). Principal coordinate analysis (PCoA) (b) of microbes in different conditions using the Bray–Curtis metric. The x- and y-axes in panel (b) are indicated by the first and second coordinates, respectively, and the values in parentheses show the percentages of the community variation explained.
Agronomy 13 00081 g003
Figure 4. A taxonomic cladogram of Line Discriminant Analysis Effect Size (LEfSe) effect size for a comparison of samples collected from the rhizosphere of (a) the varieties of Huanghuazhan and (b) the varieties of Meixiangzhan2 in Cd soils. The discriminant taxon nodes are colored and branches are shaded according to the highest-ranked group for that taxon. The yellow nodes represent the microbial groups that did not play an important role in different groups, and no condition was found here (LDA > 4). If a taxon does not represent significant differences among sample groups, the corresponding node is yellow. The selected highly abundant taxa are indicated with letters.
Agronomy 13 00081 g004
Figure 5. Redundancy analysis (RDA) including dominant bacterial community in different rice growth stages and soil properties as explanatory variables. RDA1 and RDA2 stand for two components reflects the sample difference to the greatest extent. The percentage stand for component contribution rate. The point represents the sample. The blue letters represent the top 10 dominant bacterial community and the gray arrows represent different environmental factors.
Agronomy 13 00081 g005
Table 1. The content of Cd in different organs of rice as affected by biochar treatment.
VarietiesStageTreatmentCd Content (mg kg−1)
RootStemLeafRice HuskMilled Rice
HuanghuazhanPanicle initiation stageCK2.304bcd0.207b0.432a--
BC2.85b0.070d0.136d--
Heading stageCK2.496bc0.161bc0.43a--
BC1.589ef0.089d0.254c--
Maturity stageCK1.458f0.173b0.394ab0.048ab0.047b
BC1.697def0.102d0.156d0.025c0.032c
Meixiangzhan2Panicle initiation stageCK4.475a0.203b0.407a--
BC2.239bcde0.077d0.121d--
Heading stageCK2.023cdef0.178b0.423a--
BC2.361bcd0.109cd0.14d--
Maturity stageCK2.159bc0.269a0.333b0.055a0.064a
BC1.351f0.095d0.165d0.031bc0.042bc
The values in the table are presented as means; CK = control; BC = Biochar; “-” is presented as no data, the same letter in one column means no significant difference, while different letters mean significant differences among the same group treatment at p ≤ 0.05. Differences among the same group treatment at p ≤ 0.05.
Table 2. The properties of the soil in different periods by biochar treatment.
VarietiesStageTreatmentpHTotal N Concentration (g.kg−1)Organic Matter (g.kg−1)Available P (mg.kg−1)
HuanghuazhanPanicle initiation stageCK5.74g1.72cd29.43d10.97c
BC6.61bc2.02a64.351a31.97a
Heading stageCK5.81fg1.66cd28.91d10.28c
BC6.73bc2.06a65.58a24.69b
Maturity stageCK5.89ef1.63cd28.29d8.8c
BC6.84ab1.89b59.1b20.5b
Meixiangzhan2Panicle initiation stageCK6de1.68cd28.86d12.34c
BC6.63bc2.1a63.56ab29.14a
Heading stageCK5.7g1.67cd28.38d9.43c
BC6.58c2.05a65.31a23.05b
Maturity stageCK6.02d1.61d28.06d9.34c
BC6.87a1.74c49.35c21.79b
The values in the table are presented as means, the same letter in one column means no significant difference, while different letters mean significant differences among the same group treatment at p ≤ 0.05.
Table 3. The content of Cd in different periods by biochar treatment.
VarietiesStageTreatmentTotal Cd Concentration (mg.kg−1)Available Cd Concentration (mg.kg−1)
HuanghuazhanPanicle initiation stageCK0.615c0.365a
BC0.521d0.257b
Heading stageCK0.859a0.362a
BC0.677bc0.286b
Maturity stageCK0.854a0.366a
BC0.642c0.244b
Meixiangzhan2Panicle initiation stageCK0.597c0.344a
BC0.496d0.267b
Heading stageCK0.725b0.388a
BC0.605c0.269b
Maturity stageCK0.878a0.357a
BC0.676bc0.248b
The values in the table are presented as means, where the same letter in one column means no significant difference, while different letters mean significant differences among the same group treatment at p ≤ 0.05.
Table 4. Diversity and abundance indices of species of samples.
VarietiesStageTreatmentRichness IndexDiversity Index
ACEChao1SimpsonShannon
HuanghuazhanPanicle initiation stageCK2302.599ab2336.273a0.997a9.7145a
BC2289.064abc2310.65ab0.9965a9.5742a
Heading stageCK2252.6464abc2263.174ab0.9966a9.5353a
BC2269.816abc2290.751ab0.997a9.6272a
Maturity stageCK2121.454d2149.383c0.997a9.5964a
BC2114.756d2140.713c0.9965a9.5967a
Meixiangzhan2Panicle initiation stageCK2271.278abc2293.013ab0.9975a9.7879a
BC2200.051bcd2214.644bc0.997a9.6706a
Heading stageCK2314.535a2334.605a0.9975a9.8159a
BC2266.177abc2283.945ab0.9965a9.6309a
Maturity stageCK2182.848cd2204.73bc0.9969a9.6999a
BC2266.117abc2292.072ab0.9967a9.7393a
The same letter in one column means no significant difference, while different letters mean significant differences among the same group treatment at p ≤ 0.05.
Disclaimer/Publisher’s Note: The statements, opinions and data contained in all publications are solely those of the individual author(s) and contributor(s) and not of MDPI and/or the editor(s). MDPI and/or the editor(s) disclaim responsibility for any injury to people or property resulting from any ideas, methods, instructions or products referred to in the content.

