Article

Comparison of the Effect of NaOH Pretreatment and Microbial Agents on Rice Straw Decomposition

1
Hunan Provincial Key Laboratory of Crop Genetic Engineering, College of Agronomy, Hunan Agricultural University, Changsha 410128, China
2
Department of Agronomy, College of Tropical Crops, Hainan University, Haikou 570228, China
*
Author to whom correspondence should be addressed.
These authors contributed equally to this work.
Agronomy 2023, 13(3), 816; https://doi.org/10.3390/agronomy13030816
Submission received: 30 January 2023 / Revised: 1 March 2023 / Accepted: 9 March 2023 / Published: 10 March 2023
(This article belongs to the Special Issue In Memory of Professor Longping Yuan, the Father of Hybrid Rice)

Abstract

:
Rice straw contains a large amount of lignocellulose which is difficult to be decomposed. The objective of this study was to determine the effect of alkaline pretreatment (sodium hydroxide, NaOH) and microbial agents on the decomposition of rice straw. The experimental detail consisted of NaOH (control and NaOH solution pretreatment) and microbial agent (Bacillus licheniformis agent, Bacillus subtilis agent, Trichoderma viride agent, and no microbial agent) treatments. Compared with no NaOH pretreatment, the pH of NaOH pretreatment increased by 6.30–18.28%, while the electrical conductivity decreased by 49.18%, but the change in total nutrient content was not obvious. Under no NaOH pretreatment, Bacillus subtilis agent improved the temperature of the rice straw decomposition. Compared with Bacillus licheniformis agent and Trichoderma viride agent, Bacillus subtilis agent increased the alkali-hydrolyzable nitrogen, available phosphorus, and available potassium in rice straw by 1.39–10.30%. The organic carbon content was reduced by 3.50% and 17.15%. The germination index was greater than 80%. Under NaOH pretreatment, the pile with Bacillus subtilis agent reached the maximum temperature (39.5 °C) on the 12th day. Compared with Bacillus licheniformis agent and Trichoderma viride agent, Bacillus subtilis agent increased the content of alkali-hydrolyzable nitrogen and available phosphorus in rice straw by 1.64–11.87%. The humus polymerization, organic carbon, and carbon/nitrogen ratio were reduced by 6.40–44.06%. In addition, gray analysis, principal component analysis, and comprehensive evaluation were used to comprehensively evaluate the effect of straw decomposition. The results showed that Bacillus subtilis agent under NaOH pretreatment and no NaOH pretreatment had the most obvious effect on rice straw composting. This study provides a scientific basis for efficient decomposition of rice straw.

1. Introduction

With the rapid development of global agriculture, a large amount of agricultural waste is produced every year. Among them, rice straw is the main waste from a rice field after the rice harvest. Rice is the largest grain crop in China, so the output of straw is correspondingly large. The annual straw production in China has reached one billion tons [1]. Although various countries have paid attention to the comprehensive utilization of this straw, a lot of straw is still dumped, buried, or burned. This will not only lead to the low utilization efficiency of straw but also cause environmental pollution.
The main components of straw are lignin, hemicellulose, and cellulose. Straw’s structure is cross-linked by lignin, hemicellulose, and cellulose through a carbon chain. Lignin is firmly wrapped around cellulose and hemicellulose, which protects the straw. Lignin in straw is the most difficult part to decompose during straw decomposition. Therefore, only by decomposing lignin first, can we achieve a more efficient decomposition effect.
Composting can mineralize and humify organic materials, such as straw. This is the process of straw decomposing into available nitrogen, phosphorus, potassium, and other nutrients and synthesizing stable humus, all of which can be absorbed and utilized by plants. The essence of composting is to use microorganisms that are widely distributed in nature to decompose the organic material. Industrialized high-temperature aerobic composting has proven that microbial compound microbial agents with the ability to degrade lignocellulose efficiently could effectively promote composting maturity and improve composting efficiency [2]. Adding a straw composting agent and fresh cow dung could improve the hydrothermal conditions of retting straw and increase the activity of straw hydrolase, further accelerating the process of straw retting decomposition [3]. The fermented material decomposed by the straw decomposition agent was mixed with the soil to create the substrate for raising rice seedlings. Straw compost could change the microbial community structure in the original environment and be beneficial for rice growth [4]. Therefore, the decomposition process of straw could be promoted either by using natural environmental microorganisms or by directly adding exogenous microbial decomposition agents.
Anaerobic digestion technology is widely used in the treatment of high-concentration wastewater, municipal sludge, municipal domestic waste and agricultural straw, due to its low energy consumption and clean and pollution-free biogas. Among all the kinds of biomass available for human use, lignocellulosic raw materials account for the vast majority and are mainly composed of lignin, cellulose, and hemicellulose. The decomposition of lignin requires molecular oxygen, and its degradation ability is poor under anaerobic conditions, which is the main factor hindering the degradation of lignin. An alkali pretreatment is a common and effective method to degrade lignin. Sodium hydroxide (NaOH) is one of the common alkali treatment reagents. A low-concentration NaOH solution is used to pretreat straw and other lignocellulosic materials. This can separate lignins and carbohydrates. At the same time that the raw materials are expanded, the internal surface area is significantly increased, and the crystallinity and polymerization degree are reduced [5]. The increase in the internal surface area represents the increase in the effective area of microbial enzymatic hydrolysis. This accelerates the speed of enzymatic hydrolysis, further increases the decomposition of cellulose, and promotes enzymatic hydrolysis and saccharification [6]. Alkaline pretreatment with NaOH can improve the conversion rate of enzymatic hydrolysis and destroy the lignin tissue on the surface of rice straw [7]. The straw soaked in NaOH solution for 72 h was anaerobically digested. The cumulative gas production increased by 38–119% [8]. After a solid-phase treatment with 6% NaOH, the cumulative gas production increased by 27.3–64.5% [9]. Currently, the NaOH pretreatment method is widely used in the process of biogas production.
The straw contains a large amount of cellulose, hemicellulose, and lignin, so it is difficult to degrade. A major problem of straw decomposition is the slow degradation rate, which takes a long time in natural degradation. Fungi can penetrate the corneum of straw and enter the gap of straw, and increase the contact area of straw lignocellulose and decomposition-related enzymes, so they have strong cellulose degradation ability. Fungi with straw decomposition ability include Trichoderma, Aspergillus, Penicillium, Coprinus, Polyporus, Pleurotus ostratus, White rot fungi, Basidiomycete, etc. [10,11]. Bacteria have a potential metabolic pathway to degrade aromatic compounds and have more advantages than fungi in environmental adaptability. The bacteria that can decompose straw have been found to include Micrococcus, Bacillus, Paenibacillus, Pseudomonas, Streptococcus, Nocardia, Mycobacterium, etc. [12,13]. Actinomyces are filamentous prokaryotes similar to bacteria. They can use different carbohydrates, including sugar, starch, powdered organic acid, cellulose, hemicellulose, etc., as energy. Actinomyces with straw decomposition ability include Alternaria alternate, Aureobasidium, Streptomyces, etc. [14,15].
NaOH solution can effectively destroy the pectin and wax layer on the surface of rice straw. After treatment, the tissue gap and mesopore cavity of rice straw are increased, and the specific surface area is increased, which is conducive to the contact between the microorganisms and cellulose in rice straw, thus significantly enhancing its denitrification potential [16]. However, NaOH pretreatment of rice straw has not had its physicochemical properties analyzed, and nutrient content changes after lignin degradation need to be studied. Previous studies found that Bacillus licheniformis, Bacillus subtilis and Trichoderma viride have the ability to degrade the straw in wheat and corn as well as other types of straw. The good application effect of these three microbial agents was confirmed [17,18,19]. Therefore, this study compared the composting effects of exogenous Bacillus licheniformis, Bacillus subtilis, and Trichoderma viride with NaOH pretreatment and without NaOH pretreatment. The objectives of this work were (1) to determine the changes in the temperature, pH, electrical conductivity (EC value), degree of humus polymerization (E4/E6 value), nitrogen, phosphorus, potassium, carbon–nitrogen ratio (C/N) and phytotoxicity of the NaOH pretreatment treatment and exogenous microbial agent treatment on rice straw, (2) to compare of application effects of NaOH pretreatment and no NaOH pretreatment on rice straw, (3) to evaluate the application effects of exogenous microbial agents in the process of rice straw composting, and (4) to explore the synergistic effects of NaOH pretreatment and exogenous microbial agents on rice straw composting. Thus, this study provides novel insights into the efficient utilization of rice straw resources.

2. Materials and Methods

2.1. Experiment Materials

The straw of late rice was collected from the comprehensive experimental base of Hunan Agricultural University in Yanxi Town, Liuyang City, Hunan Province. A complete straw with the same thickness and length was selected. After drying to constant weight at 70 °C, the straw was put into the cutting machine and cut into 2–3 cm. Among them, a part of straw was soaked in 1% (w/w) NaOH solution for 24 h and then washed repeatedly with clean water for standby. The others were soaked in water for 24 h. The water content of straws was finally controlled at 60%.

2.2. Experimental Design

In this experiment, rice straw soaked in NaOH solution was used to simulate alkali treatment, and rice straw soaked in sterile distilled water was used as control. Bacillus licheniformis agent, Bacillus subtilis agent, Trichoderma viride agent were provided by the Rice Research Institute of Hunan Agricultural University. Each treatment was provided with the addition of Bacillus licheniformis agent, Bacillus subtilis agent, Trichoderma viride agent, and no microbial agent (CK). There was a total of eight processes (Table 1). Among them, the microbial agent was 0.8% of the straw quantity. In addition, each treatment needed to have urea (0.4 kg, 46% pure nitrogen) added, equal to the amount of microbial agent for the initial propagation of microorganisms. The mixing method of composting agent, urea, and straw was a layer of straw, a layer of composting agent, and urea mixture. The straw pile weighing 40 kg was placed in a large glass greenhouse, and its length, width, and height were 50, 50, and 80 cm, respectively. Samples were taken on the 9th, 18th, 27th, and 36th day after decomposition of straw pile. The physicochemical properties and nutrient content related to decomposition were determined.

2.3. Determination Items and Methods

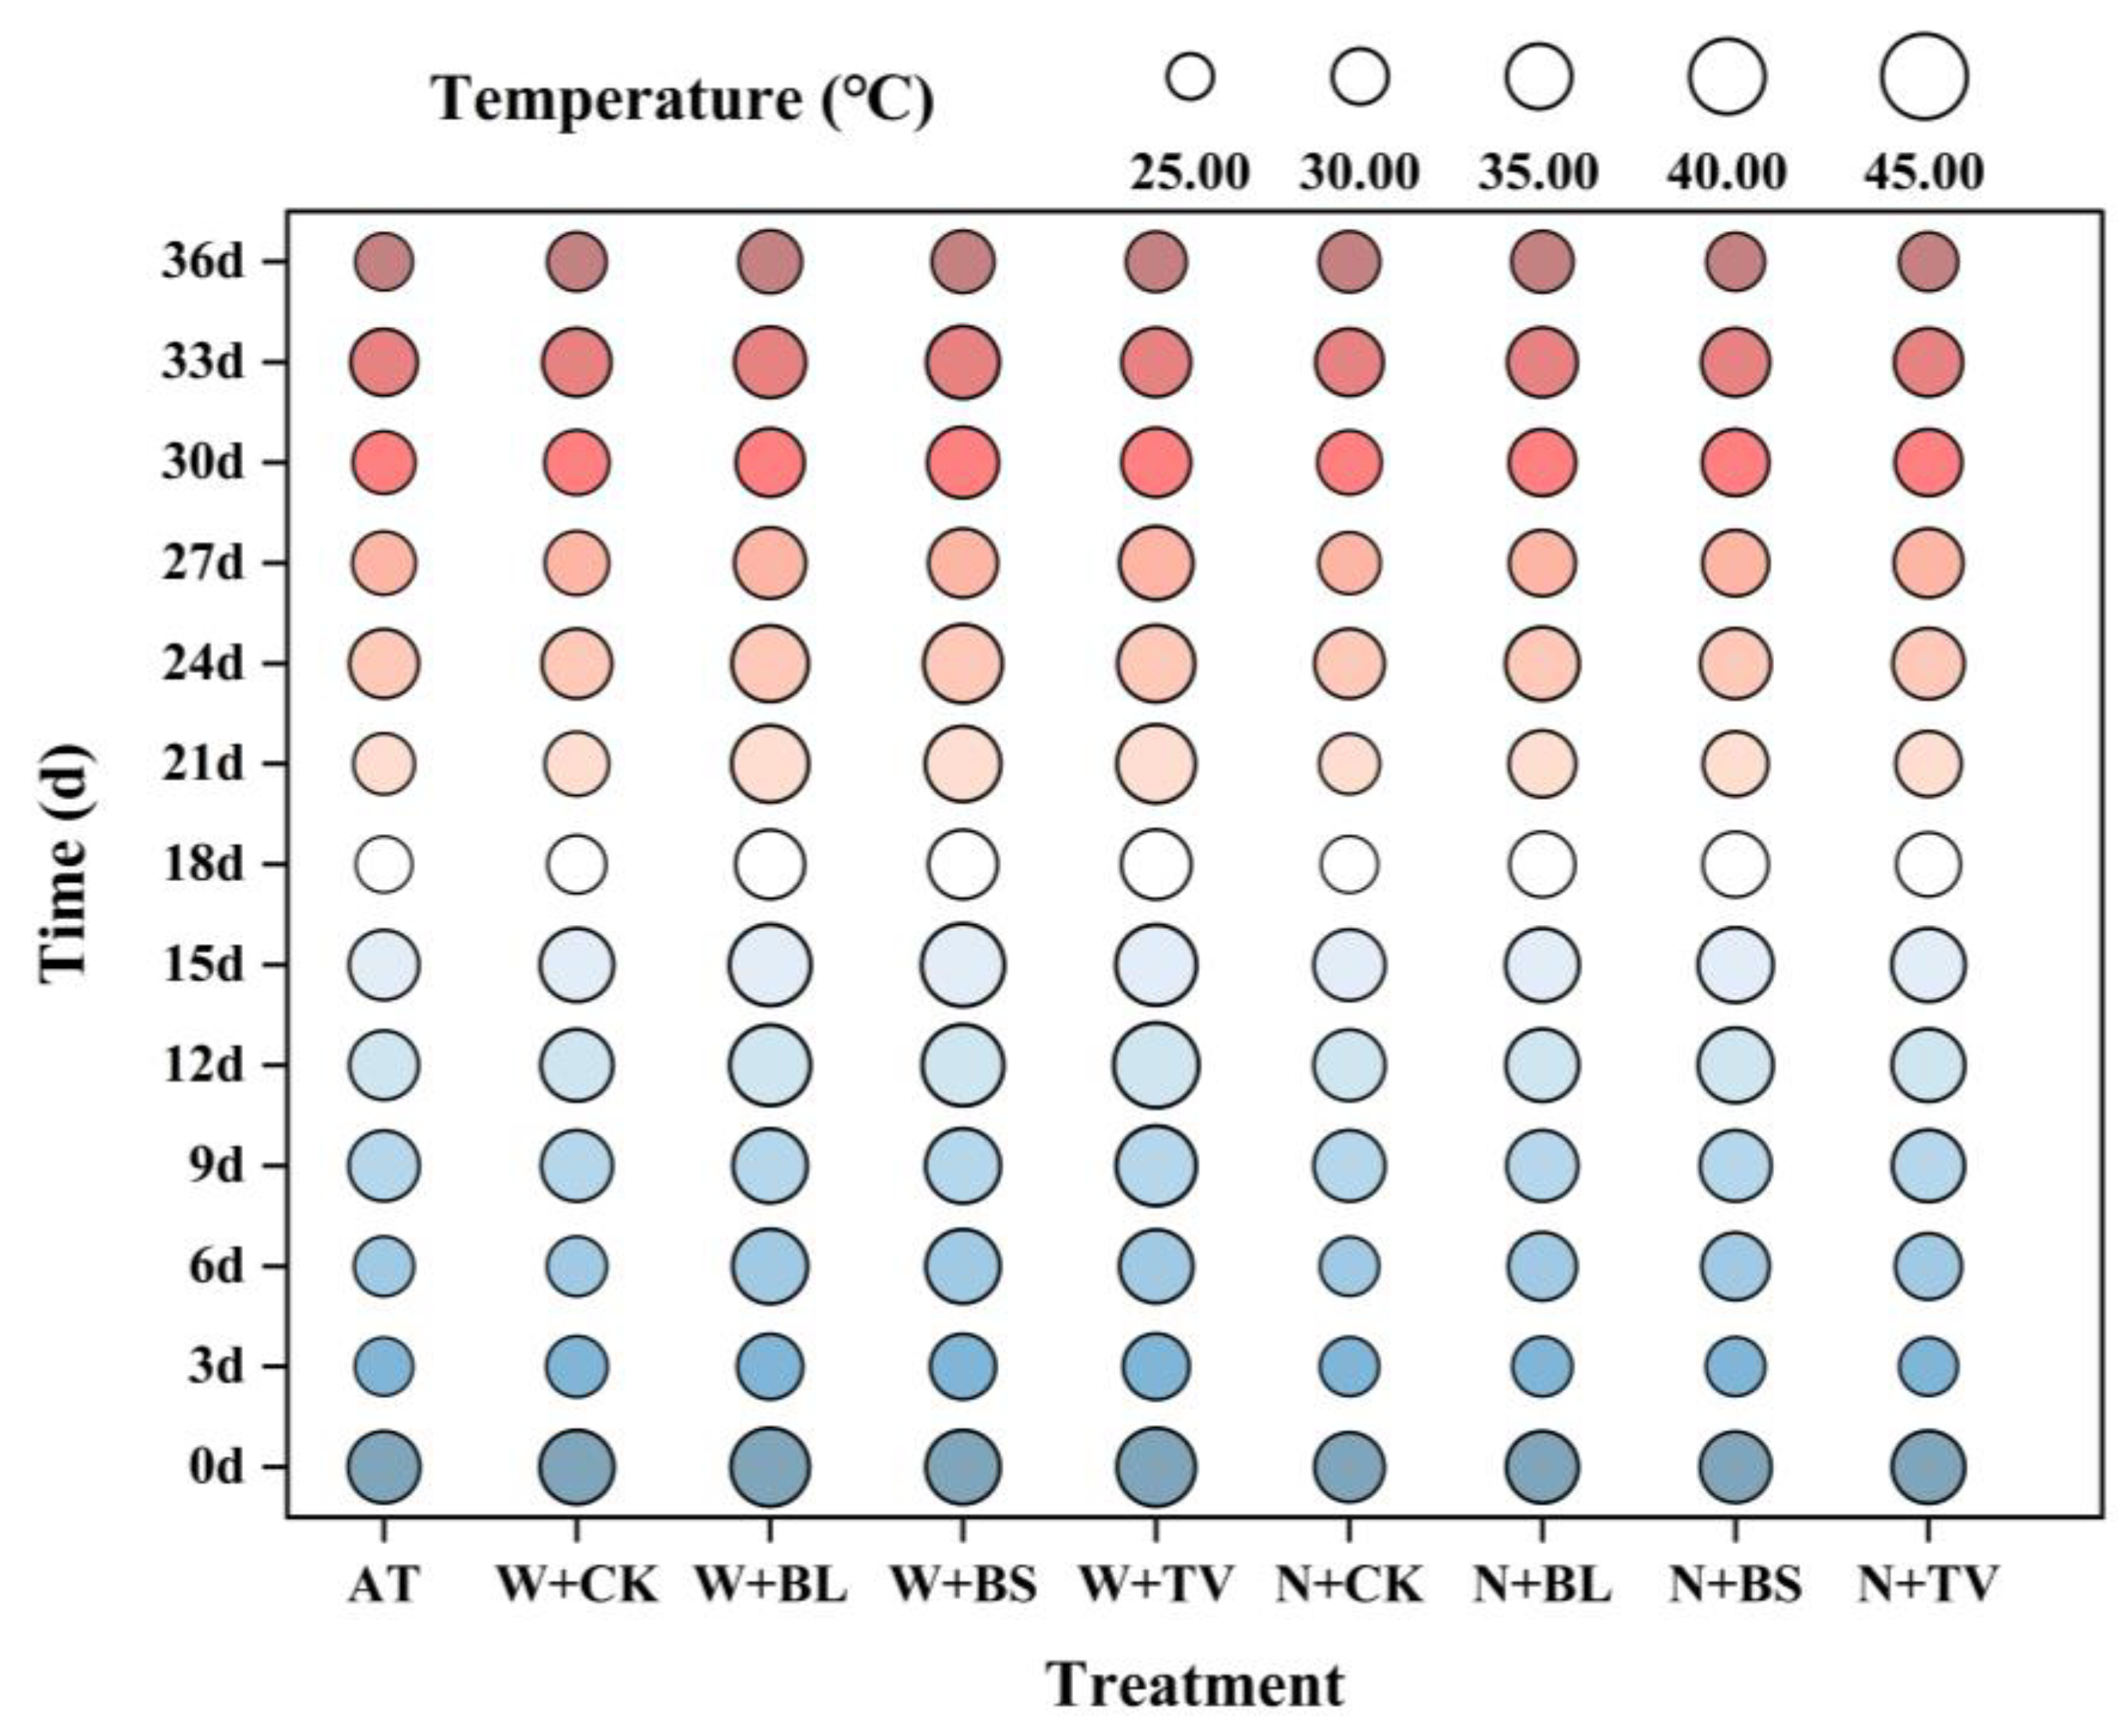
2.3.1. Recording the Temperature of the Pile

The mercury thermometer was inserted into the straw pile at 25 cm to measure the temperature. The temperature change of straw piles was investigated every three days. Each measurement was repeated five times, and the ambient temperature was recorded.

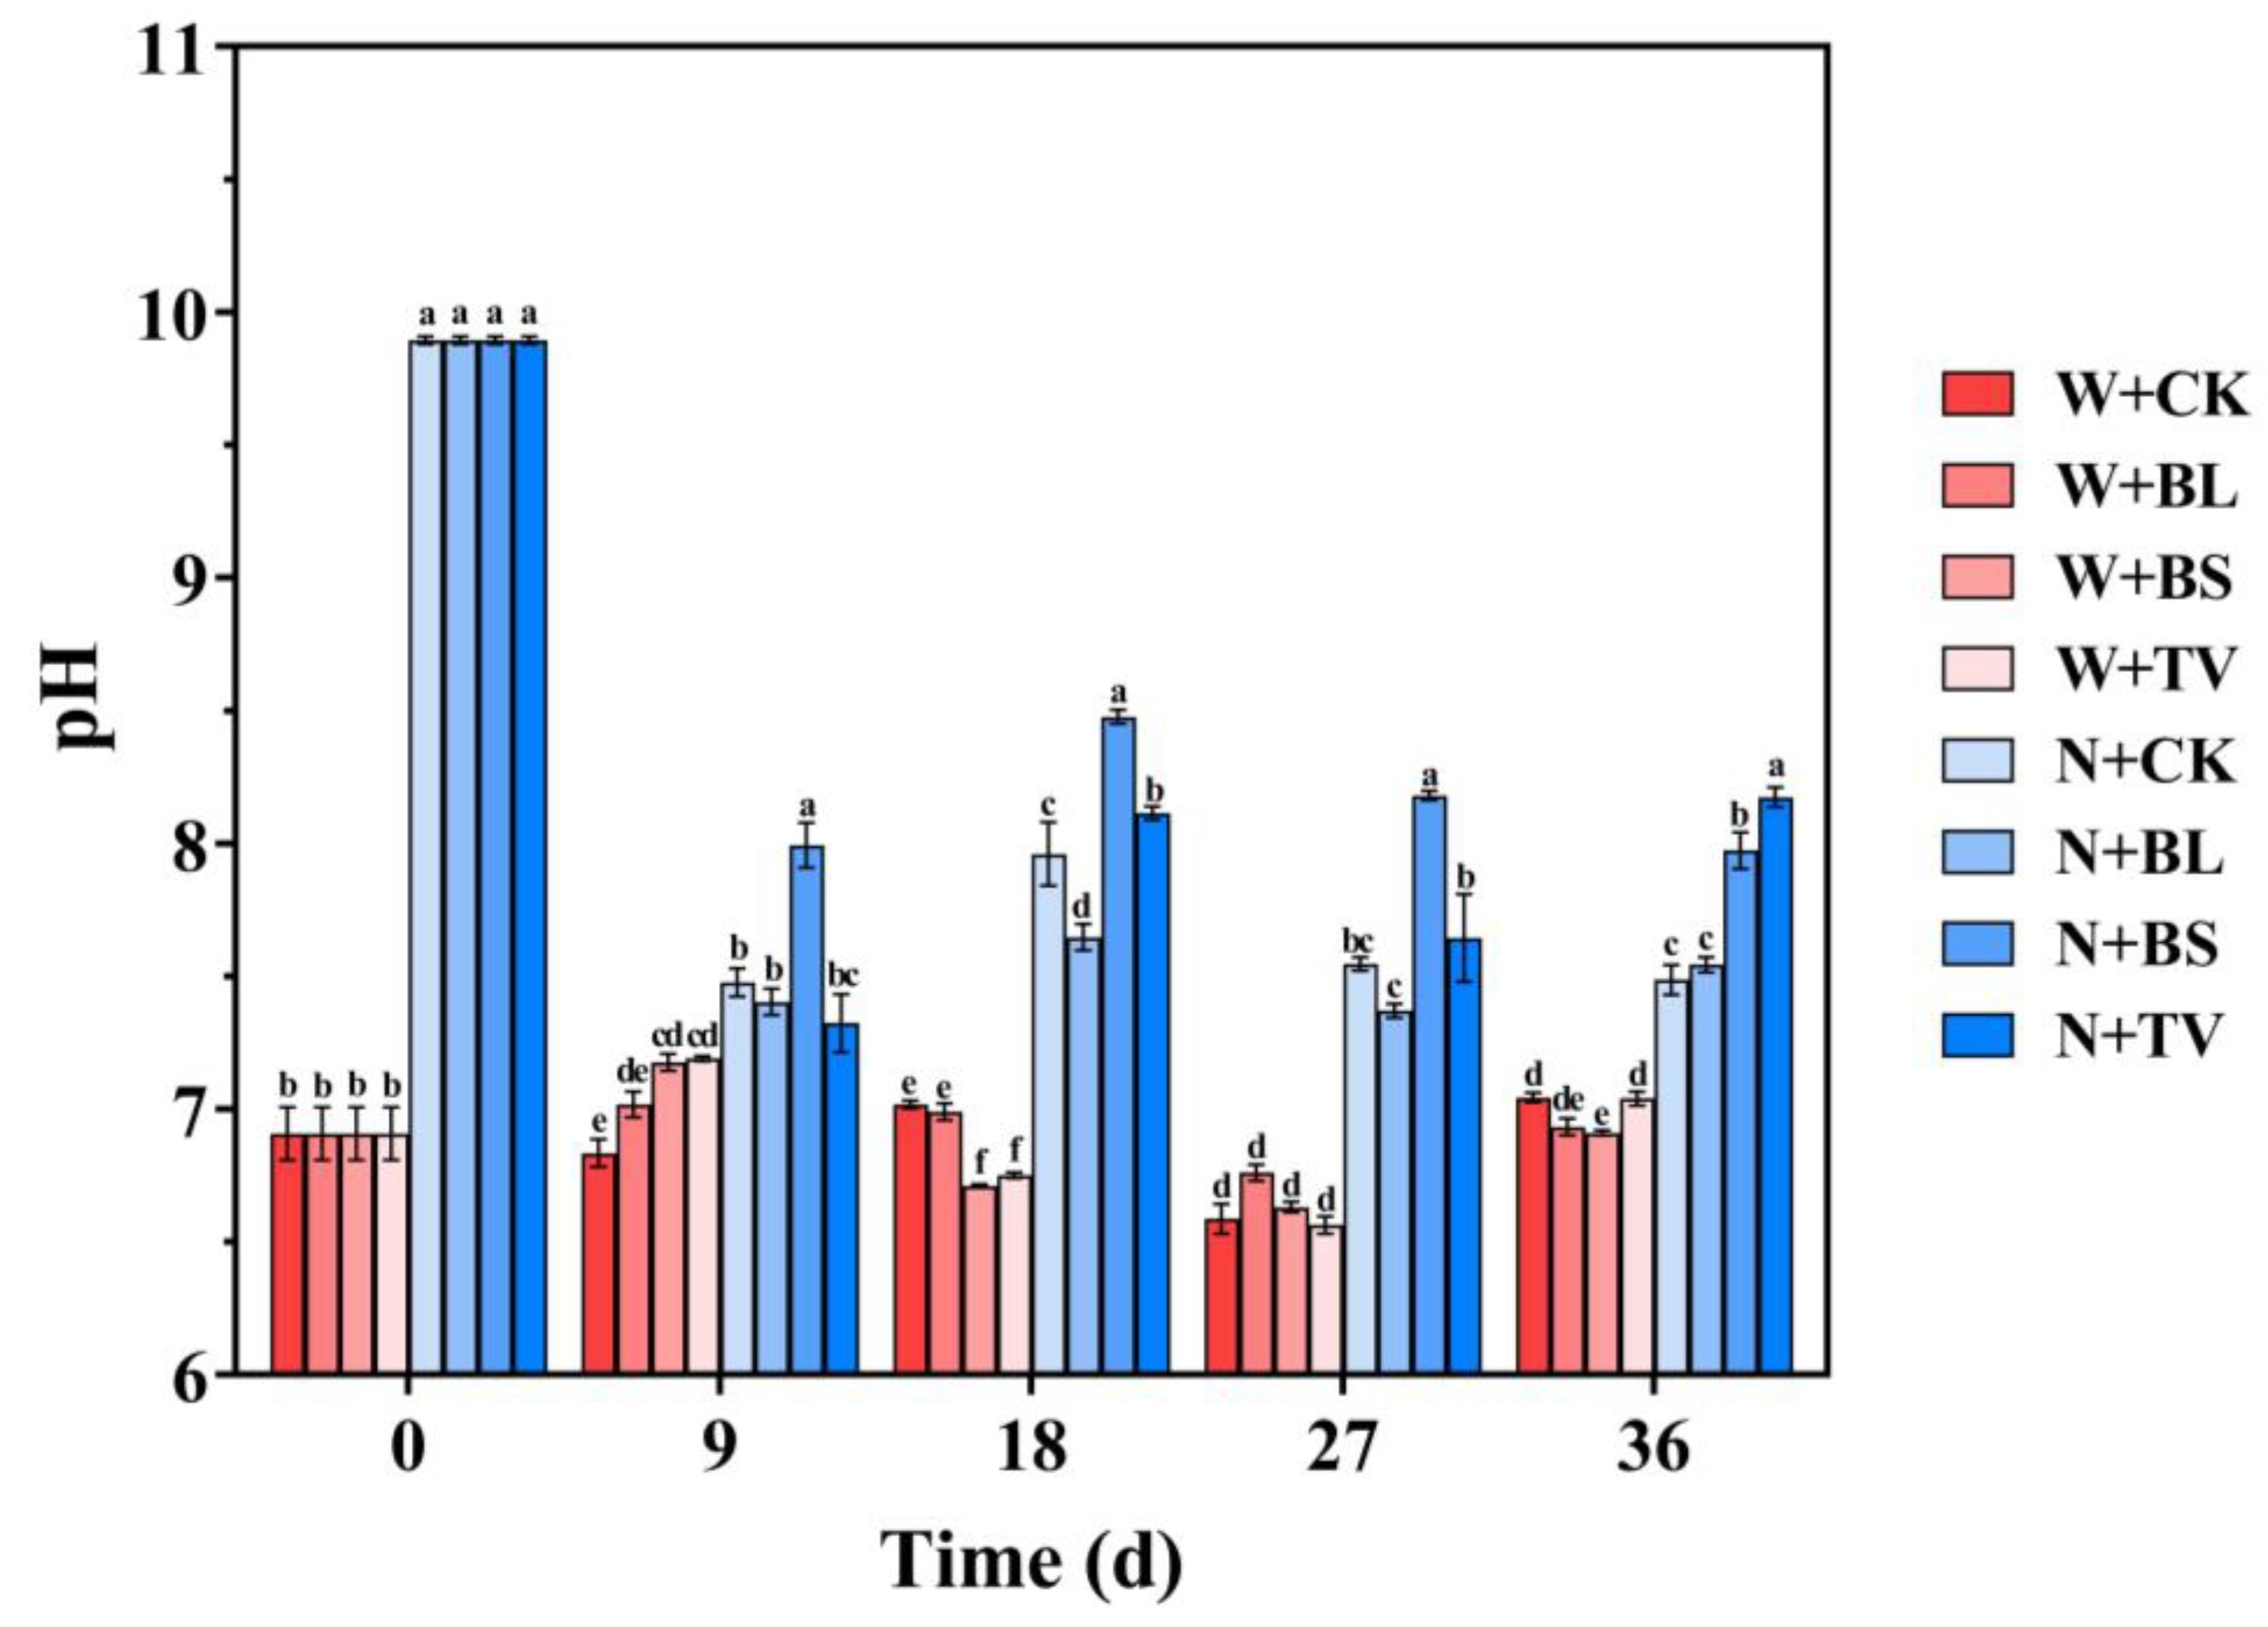
2.3.2. Determination of pH and Electrical Conductivity (EC Value)

The fresh decomposed samples were mixed in a box sterilized with ethanol. The sample was mixed with deionized water in a ratio of 1:10 (W (g):V (mL)). Horizontal oscillation occurred at 180 r/min for 30 min at room temperature. After filtering with filter paper, pH was measured with pH meter and EC value with a conductivity meter.

2.3.3. Determination of Humus Polymerization (E4/E6 Value)

The fresh decomposed samples were mixed in a box sterilized with ethanol. The sample was mixed with deionized water in a ratio of 1:10 (W (g):V (mL)). Horizontal oscillation occurred at 200 r/min for 1 h at room temperature. After being filtered by filter paper, the absorbance value at 465 and 665 nm was measured by visible ultraviolet spectrophotometer. The ratio of the two is the E4/E6 value [20].

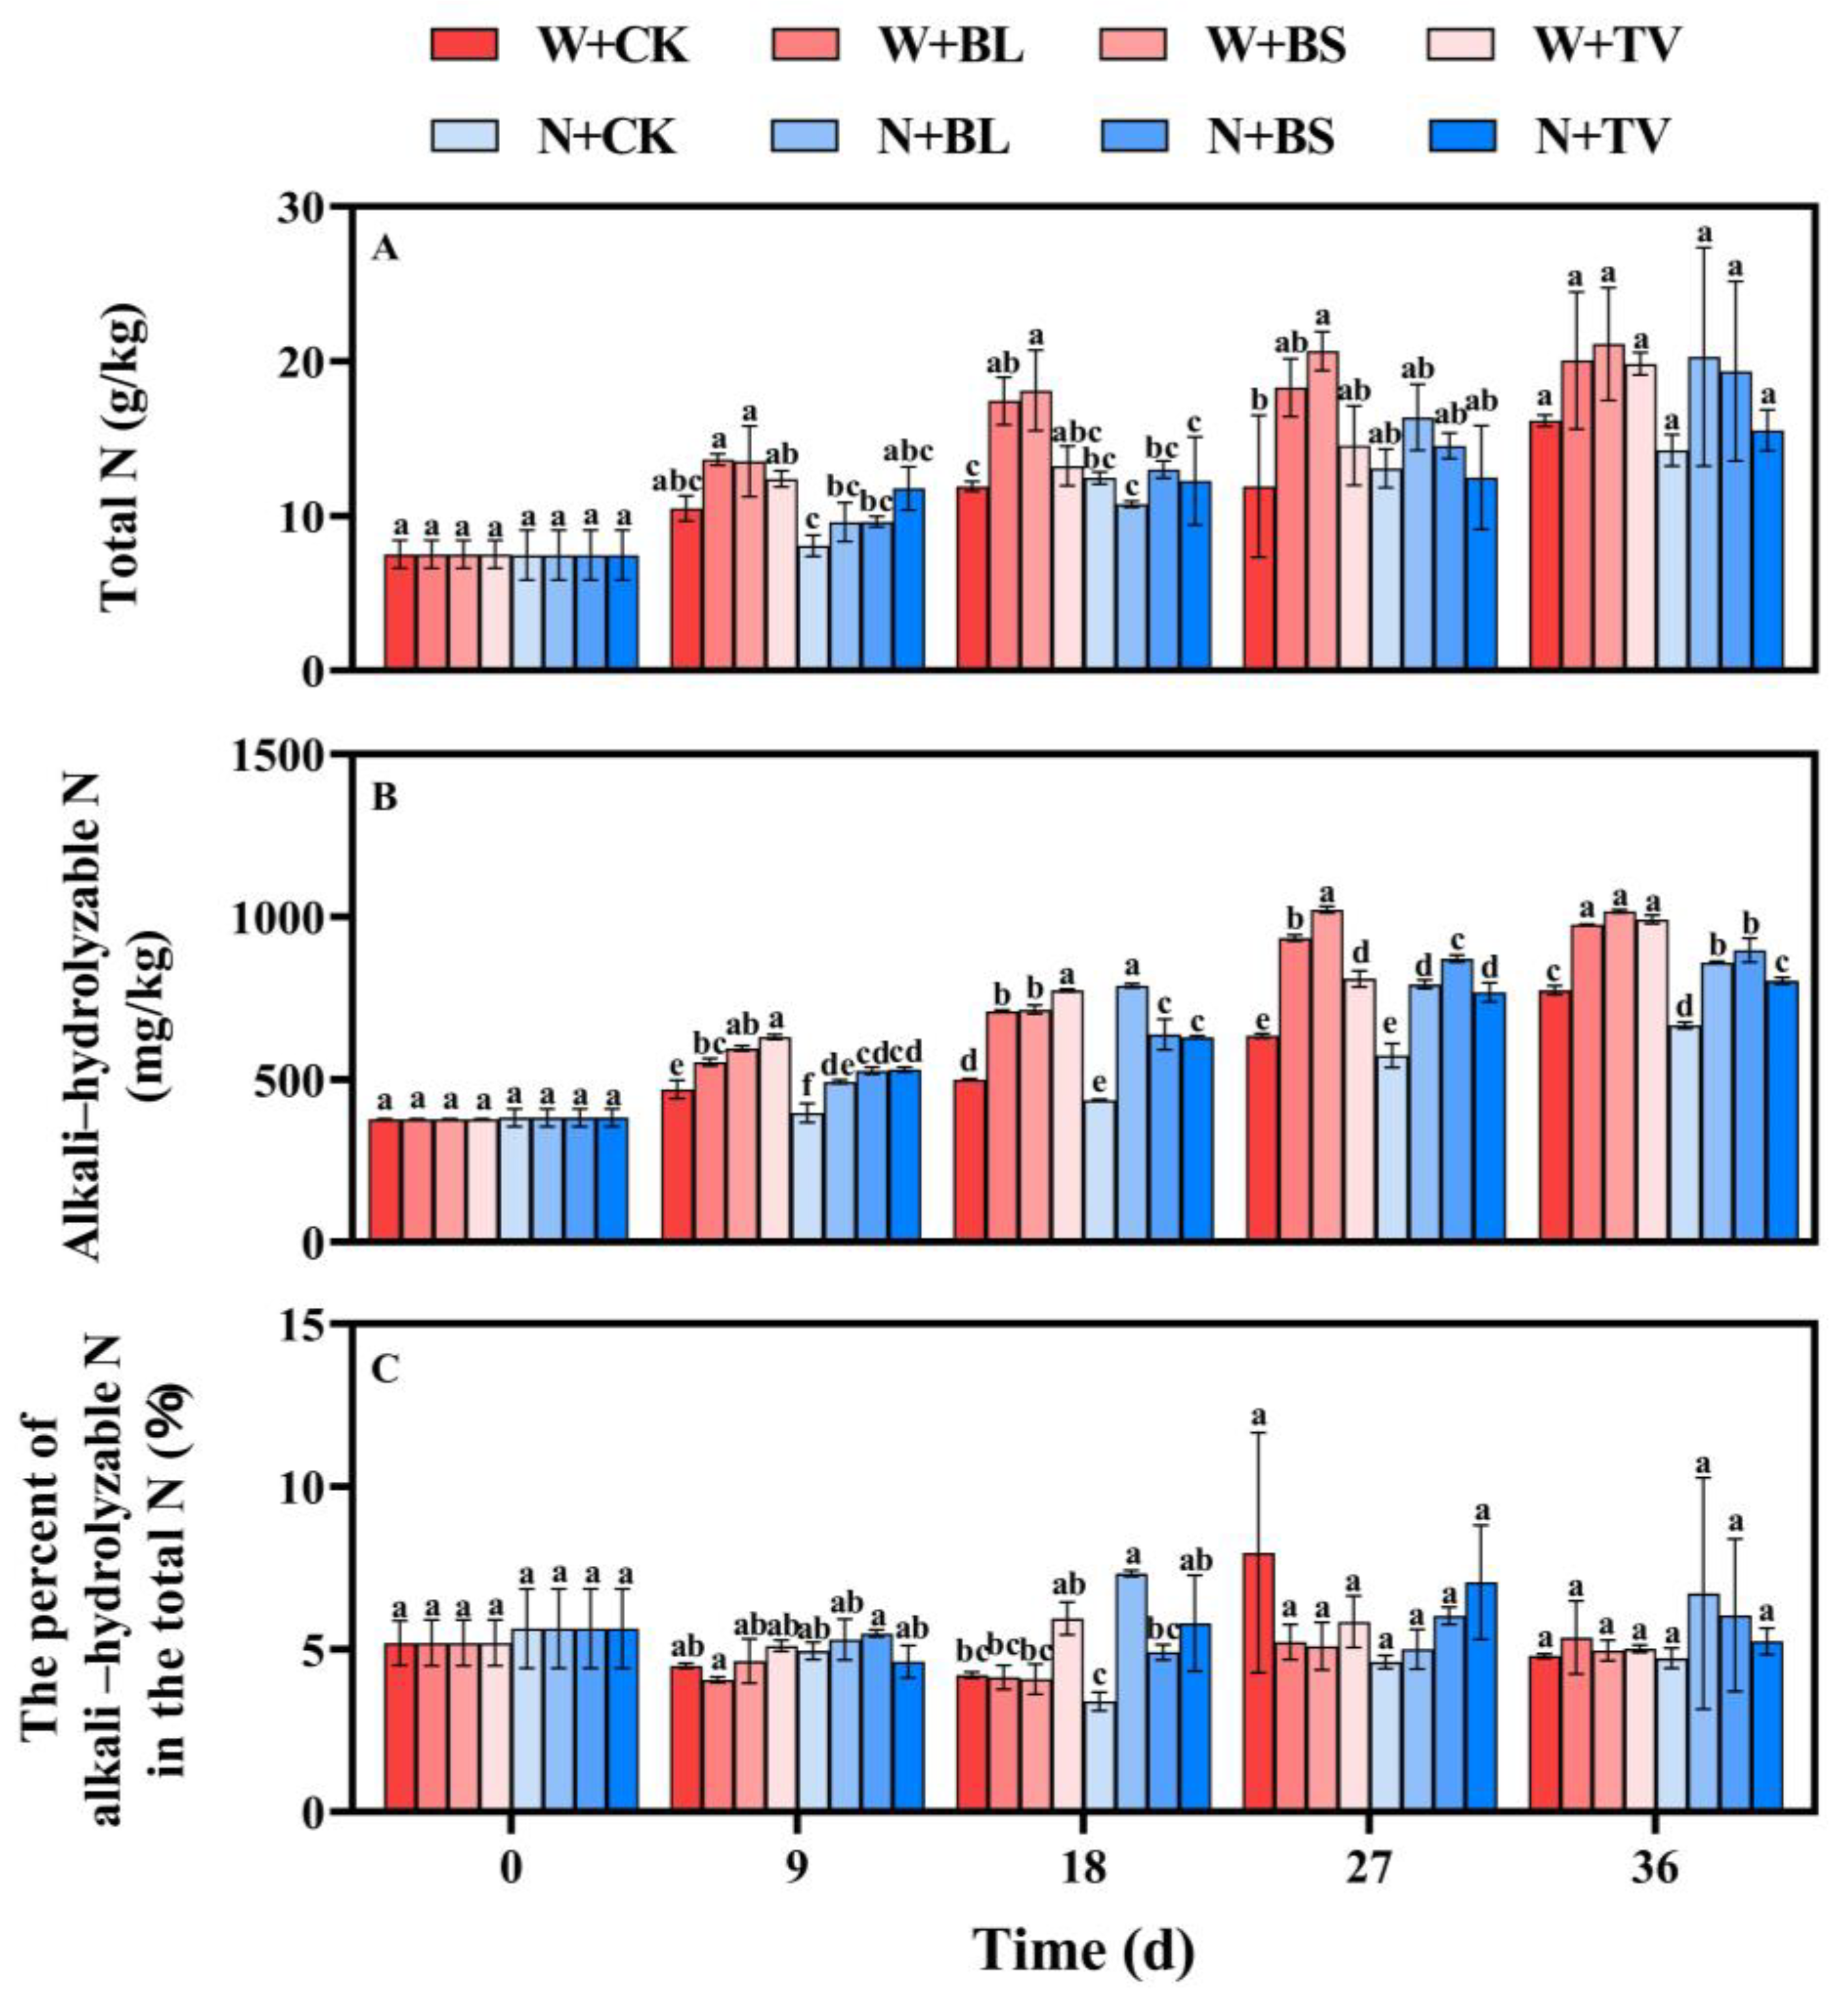
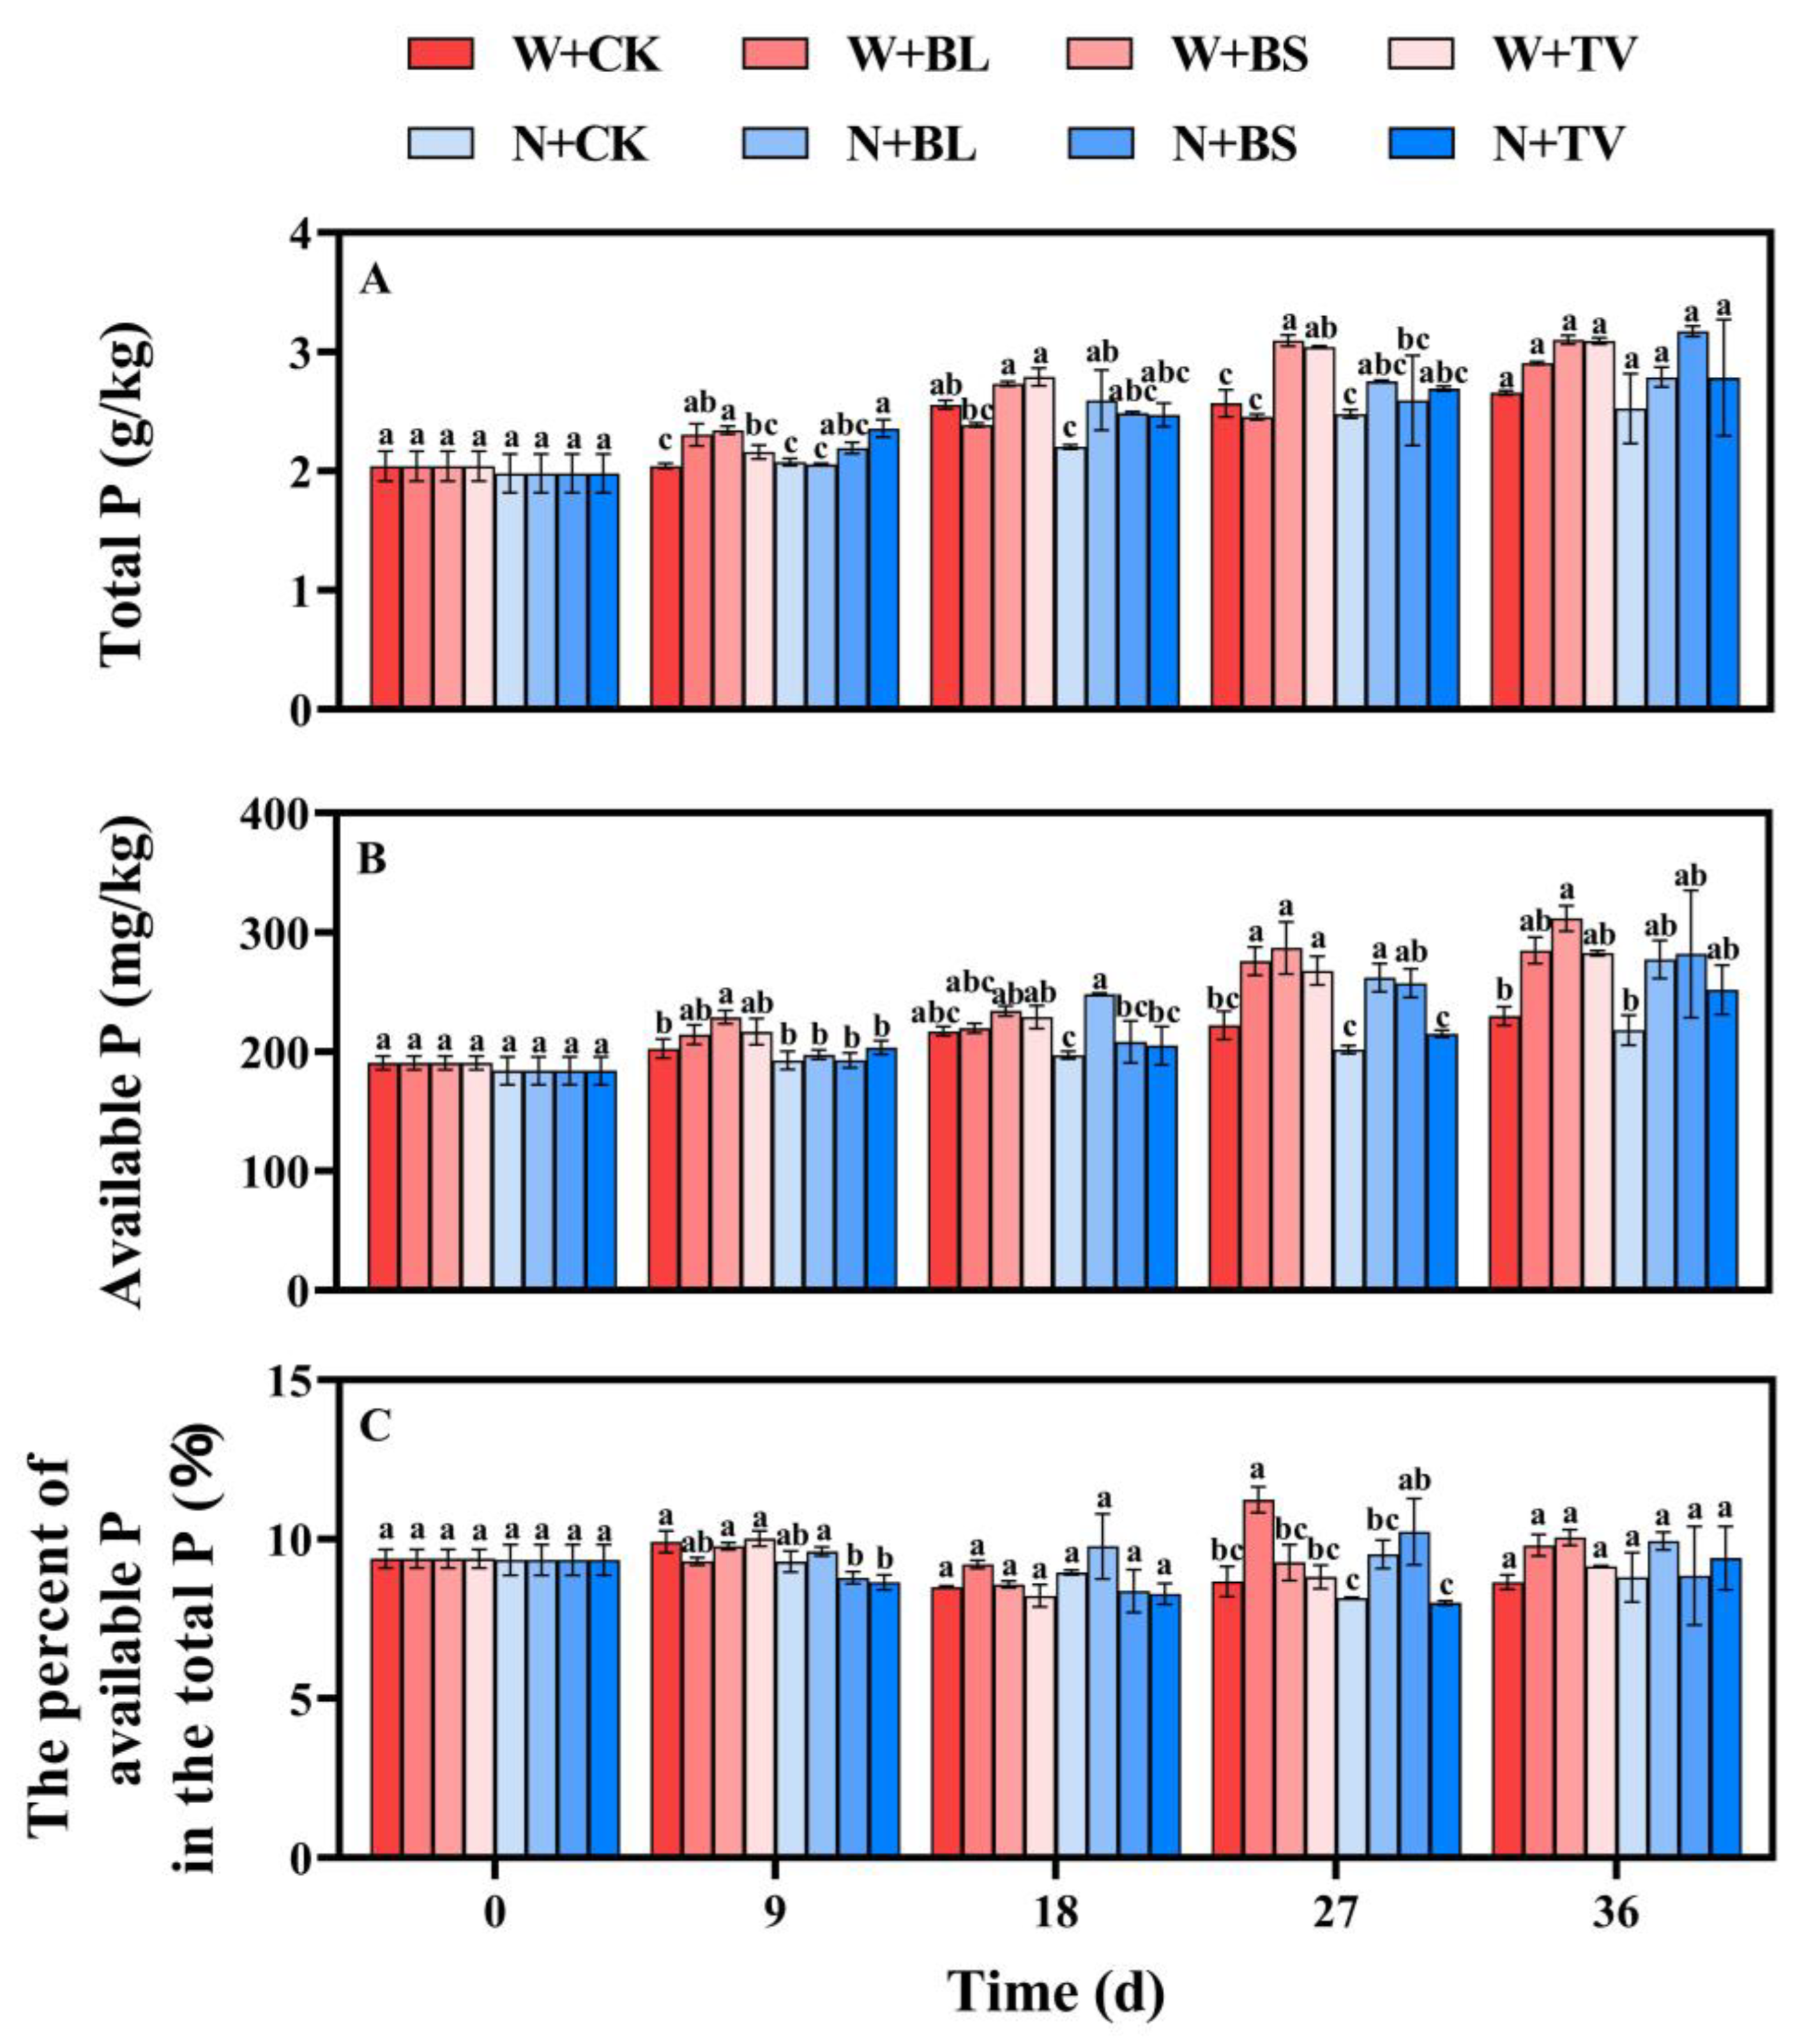
2.3.4. Determination of Nutrient Content

The decomposed sample was dried to constant weight at 65 °C and passed through a 0.150 mm mesh screen for standby. The content of organic carbon was determined by the thermal dilution method [21]. After H2SO4-H2O2 digestion and filtration, AA3 continuous flow analyzer was used to determine the content of total nitrogen and total phosphorus [22]. The total potassium content was determined by flame spectrophotometer colorimetry. The content of alkali-hydrolyzable nitrogen was determined by the alkali-hydrolysis diffusion method. The content of available phosphorus was determined by molybdenum antimony resistance colorimetry. The content of available potassium was determined by flame spectrophotometer colorimetry [23].

2.3.5. Determination of Germination Index

The seed germination index can be used to evaluate the phytotoxicity of compost products [24]. The germination paper was put into a clean and sterile germination box with a diameter of 10 cm. Ten mL straw extracting solution was added to the germination box to wet the germination paper. The distilled water was used as the control. The seeds of rice variety Xiangzaoxian 45 were tested for phytotoxicity. Each germination box was sowed with 100 seeds and placed in a 37 °C constant temperature light incubator. The germination rate was determined on the 7th day. The germination of seeds was recorded daily. Seeds were considered to be germinated when the total shoot length exceeded half the length of the seeds, and root length exceeded the length of the seeds [25]. The root length of the seed was measured with a vernier caliper. The seed germination rate and germination index were calculated according to the following formula.
Germination Rate (GR, %) = (Germinated seedlings/number of total seeds) × 100%
Germination Index (%) = (treated seed germination rate × seed root length)/(control seed germination rate × control seed root length)

2.4. Statistical Analysis and Evaluation of Decomposing Effects

Microsoft Excel 2017 was used for data collation. Data Processing System (DPS) was used for difference significance analysis (Duncan’s new multiple range method was used for significance test, p < 0.05). Graph Pad Prism 9 was used to make drawings.
The basic principle of gray correlation analysis is to quantitatively describe and compare a developing and changing system. The degree of correlation is judged by the similarity of curve geometry. The shape of the curve can indicate a greater correlation [25]. Due to the different dimensions or units of each character factor, the data need to be standardized. The correlation coefficient is calculated according to the following formula [26]:
ξ i j = m i n Δ i j + ρ m a x Δ i j Δ i j + ρ m a x Δ i j
minΔij and maxΔij indicate the minimum and maximum of all absolute differences, ρ is the resolution coefficient. The correlation degree is calculated according to the following formula:
r i = 1 N j = 1 N ξ i j
In the formula, N is the number of evaluation indexes.
Principal component analysis (PCA) was an analysis method in which one group of variables was transformed into another group of variables through orthogonal transformation to achieve the purpose of data dimensionality reduction. Dimension reduction was the process of simplifying data by reducing indicators (or variables) in data. It was a linear transformation that transformed data into a new coordinate system. After reducing the dimension of n indicators into r principal components (r < n), these principal components would be sorted according to the size of variance, called principal component (PC) 1, principal component 2, principal component r. The proportion of the variance of each principal component in the total variance of this group of variables was the contribution of the principal component. Generally speaking, the principal components with the first 2 or 3 contributions were shown, which meant that the two-dimensional or three-dimensional PCA scatter diagram was obtained [27,28]. The specific calculation formula is as follows:
F = j = 1 n F j · W j
W j = P j j = 1 n P j
F is the comprehensive score, and Wj is the weight. Among them, j = 1, 2, n. Fj represents the jth principal component, and Pj represents the contribution rate of the jth principal component. Through such visual processing, (1) the shorter the distance between sample points, the greater the similarity, (2) the value of the original variable corresponding to the arrow after projecting to the horizontal and vertical directions could reflect the correlation between the variable and PC1 and PC2, respectively, (3) the distance between the sample point and the arrow reflected the relationship between the sample and the original variable.
The specific subordinate function value calculation formula of each index of each sample was as follows [29]:
Xu = (X − Xmin)/(Xmax − Xmin)
Xu = 1 − (X − Xmin)/(Xmax − Xmin)
In the formula, X is the measured value of an index of the test sample, and Xmax and Xmin are the maximum and minimum values of the index in all samples, respectively. If the measured indices were positive correlation, Equation (7) was used to calculate the membership value, and Equation (8) was used for negative correlation. Finally, the membership function values of each index for each sample were accumulated, and the average value was taken.

3. Results

3.1. Changes in Temperature Values between the Treatments during Decomposition

The change in stack temperature reflects the change in the microbial activity in a stack. The temperature change can determine whether the stack is safe and completed. The overall change trend of the temperature of each treatment first increased and then decreased (Figure 1). In addition, the temperature of different treatments in different periods was higher than the ambient temperature. The temperature of each treatment decreased significantly on the 3th and 18th days. This was consistent with the sudden drop in ambient temperature. With no NaOH pretreatment, the temperature of the treatment stack with the microbial agent was higher than that of the treatment stack without a microbial agent (W+CK), at different times. Among these, the temperature of the straw pile with added Trichoderma viride agent (W+TV) in the early stage of decomposition increased significantly faster than that with added Bacillus licheniformis agent (W+BL) and Bacillus subtilis agent (W+BS). That is, the temperature of the pile with added Trichoderma viride agent (W+TV) rose to the highest temperature (45 °C) of the pile on the 12th day. It was also the highest temperature of all eight treatments. The straw piles with added Bacillus licheniformis agent (W+BL) and Bacillus subtilis agent (W+BS) reached the highest temperature for their straw piles, 43.17 °C and 44 °C, respectively, on the 15th day. At the same time, the days with a high temperature and high-efficiency decomposition for the straw piles with added Bacillus licheniformis agent (W+BL), Bacillus subtilis agent (W+BS), and Trichoderma viride agent (W+TV) at 40 °C were 6 days, 6 days, and 9 days, respectively. With NaOH pretreatment, the temperature of the treatment stacks with the microbial agent was also higher than those without a microbial agent (N+CK) at different times. Among these, the temperature of the straw pile with added Bacillus subtilis agent (N+BS) in the early stage of decomposition was significantly faster than that of the straw pile with added Bacillus licheniformis agent (N+BL) and Trichoderma viride agent (N+TV). That is, the temperature of the pile with added Bacillus subtilis agent (N+BS) rose to the highest temperature (39.5 °C) of the pile on the 12th day. This was also the highest temperature of all NaOH pretreatments. The straw piles with added Bacillus licheniformis agent (N+BL) and Trichoderma viride agent (N+TV) reached the highest temperature for their straw piles at 38.84 °C and 39 °C, respectively, on the 15th day. The maximum temperature of each treatment with NaOH pretreatment did not exceed 40 °C. Comparing the stacks with NaOH pretreatment and without NaOH pretreatment, the temperature for stacks without NaOH treatment and with the same added bacterial agent is higher than that of NaOH pretreatment at different times.

3.2. Changes in pH Values between the Treatments during Decomposition

The pH values for NaOH pretreatment and no NaOH pretreatment during the whole decomposition process are obviously different. In addition, the change trend of the pH of each treatment showed an overall trend of first increasing, then decreasing, and again increasing (Figure 2). In the absence of NaOH pretreatment, the pH of the treatment with microbial agents increased to the highest value on the 9th day. Among the microbial agents, the addition of Bacillus subtilis agent (W+BS) and Trichoderma viride agent (W+TV) significantly increased the pH. The treatments with added microbial agents decreased the pH to the lowest value on the 27th day. This decrease was also obvious with the addition of Bacillus subtilis agent (W+BS) and Trichoderma viride agent (W+TV). On the 36th day, the pH of the treatment with a microbial agent was lower than that without a microbial agent (W+CK), and the pile with Bacillus subtilis agent (W+BS) was the lowest, which was 6.91. With NaOH pretreatment, the pH value for microbial agent treatments increased to the highest value on the 18th day. Among these, the addition of Bacillus subtilis agent (N+BS) significantly increased the pH. On the 27th day, the treatments with Bacillus licheniformis agent (N+BL) and Trichoderma viride agent (N+TV) decreased the pH to the lowest values, which were 7.37 and 7.64, respectively. However, the treatment with Bacillus subtilis agent (N+BS) decreased the pH to the lowest value, 7.97 on the 36th day. The final pH of each treatment group was stable, within the range of 6–9. All the treatment groups met the requirements of safety decomposition.

3.3. Changes in Electrical Conductivity (EC Values) between the Treatments during Decomposition

Without NaOH pretreatment, the electrical conductivity of each treatment was always kept between 2.00–4.00 dS/m, with a small change range. With NaOH pretreatment, the electrical conductivity of each treatment decreased significantly from 0 to 9 days (Figure 3). The electrical conductivity of each treatment with added microbial agents decreased by 4.46, 2.81, and 4.43 dS/m on the 9th day compared with the 1st day. During the process of decomposition, high electrical conductivity forms osmotic stress. This causes salt damage to crop growth. Insufficient electrical conductivity leads to insufficient nutrition, which is not conducive to the normal growth of crops. After 36 days of decomposition, the final electrical conductivity of all treatments was 0.75–4.00 dS/m. This met the requirement that the crops can grow normally.

3.4. Changes in E4/E6 Values between the Treatments during Decomposition

The overall trend of E4/E6 value change in all treatments first increased and then decreased (Figure 4). Without NaOH pretreatment, the change range of the E4/E6 value for the pile with a microbial agent was greater than that for the pile without a microbial agent (W+CK). The pile with added Trichoderma viride agent (W+TV) rose to the highest value in 0–9 days and continued to decline in 9–36 days. The pile with added Bacillus subtilis agent (W+BS) rose to the highest value in 0–27 days and continued to decline in 27–36 days. The addition of Bacillus licheniformis agent (W+BL) produced a small change. With NaOH pretreatment, the change range of the E4/E6 value for the pile with a microbial agent is also greater than that for the pile without a microbial agent (N+CK). The maximum change range was found in 0–36 days when adding Bacillus subtilis agent (N+BS).

3.5. Changes in Nitrogen Concentrations between the Treatments during Decomposition

After 36 days of decomposition, the contents of the total nitrogen and alkali-hydrolyzable nitrogen in each treatment showed a gradually increasing trend (Figure 5A,B). Without NaOH pretreatment, the addition of microbial agents could significantly increase the accumulation of total nitrogen and alkali-hydrolyzable nitrogen. After 36 days of composting, the total nitrogen increase in the piles with a microbial agent was 3.90, 4.96, and 3.67 g/kg higher than that of the pile without a microbial agent (W+CK). The increase in alkali-hydrolyzable nitrogen was 202.26, 247.83, and 217.74 mg/kg higher than that of the pile without a microbial agent (W+CK). With NaOH pretreatment, adding microbial agents can also improve the accumulation of total nitrogen. After 36 days of decomposition, the total nitrogen increase in the piles with a microbial agent was 6.06, 5.12, and 1.30 g/kg higher than that of the pile without a microbial agent (N+CK). The increase in alkali-hydrolyzable nitrogen was 193.45, 231.26, and 137.69 mg/kg higher than that of the pile without a microbial agent (N+CK). After 36 days of maturity, the treatments’ total nitrogen accumulation in order from high to small was W+BS, N+BL, W+BL, W+TV, N+BS, N+TV, W+CK, and N+CK. The treatments’ accumulated amount of alkali-hydrolyzable nitrogen in order from high to small was W+BS, W+TV, W+BL, N+BS, N+BL, N+TV, W+CK, and N+CK. The efficiency of total nitrogen production and the conversion of total nitrogen to alkali-hydrolyzable nitrogen were different for the different treatment groups of the different microbial agents. That is, the percentage of the alkali-hydrolyzable nitrogen in the total nitrogen during decomposition (Figure 5C) was different by comparing the percentage change before and after decomposition. With NaOH pretreatment and without NaOH pretreatment, the percentage of the piles without microbial agents decreased. The percentage of added Trichoderma viride agent decreased. The percentage of added Bacillus licheniformis agent increased. However, the percentage of added Bacillus subtilis agent decreased without NaOH pretreatment and increased with NaOH pretreatment.

3.6. Changes in Phosphorus Concentrations between the Treatments during Decomposition

The increase in total phosphorus was mainly related to the concentration phenomenon. The increase in available phosphorus was related to the conversion rate of the total phosphorus to the available phosphorus. The contents of the total phosphorus and available phosphorus increased (Figure 6A,B). With no NaOH pretreatment, the total phosphorus increase in the piles with added Bacillus licheniformis agent, Bacillus subtilis agent, and Trichoderma viride agent was 0.25, 0.44, and 0.43 g/kg higher, respectively, than that of the heap without a microbial agent (W+CK). The increase in available phosphorus was 55.14, 81.93, and 52.85 mg/kg higher than that of the pile without a microbial agent (W+CK). With NaOH pretreatment, the total phosphorus increase in the piles with added Bacillus licheniformis agent, Bacillus subtilis agent, and Trichoderma viride agent was 0.26, 0.65, and 0.26 g/kg higher, respectively, than that without a microbial agent (N+CK). The increase in available phosphorus was 59.39, 63.95, and 34.05 mg/kg higher than that of the pile without the addition of a microbial agent (N+CK). After 36 days of decomposition, the treatments’ total phosphorus accumulation in order from high to small was N+BS, W+BS, W+TV, W+BL, N+BL, N+TV, W+CK, and N+CK. The treatments’ available phosphorus accumulation in order from high to small was W+BS, W+BL, W+TV, N+BS, N+BL, N+TV, W+CK, and N+CK. Figure 6C shows the percentage of the available phosphorus in the total phosphorus during the decomposition process. After 36 days of decomposition, the percentage of Bacillus licheniformis agent (N+BL) added to the NaOH pretreatment group was the highest, reaching 9.94%. The percentage of added Bacillus subtilis agent (W+BS) without NaOH pretreatment was the highest among all treatments, reaching 10.05%. This is 1.40 percentage points higher than the percentage of no microbial agent (N+CK) added in the NaOH pretreatment and 0.11 percentage points higher than that of Bacillus licheniformis agent (N+BL) added in the NaOH pretreatment.

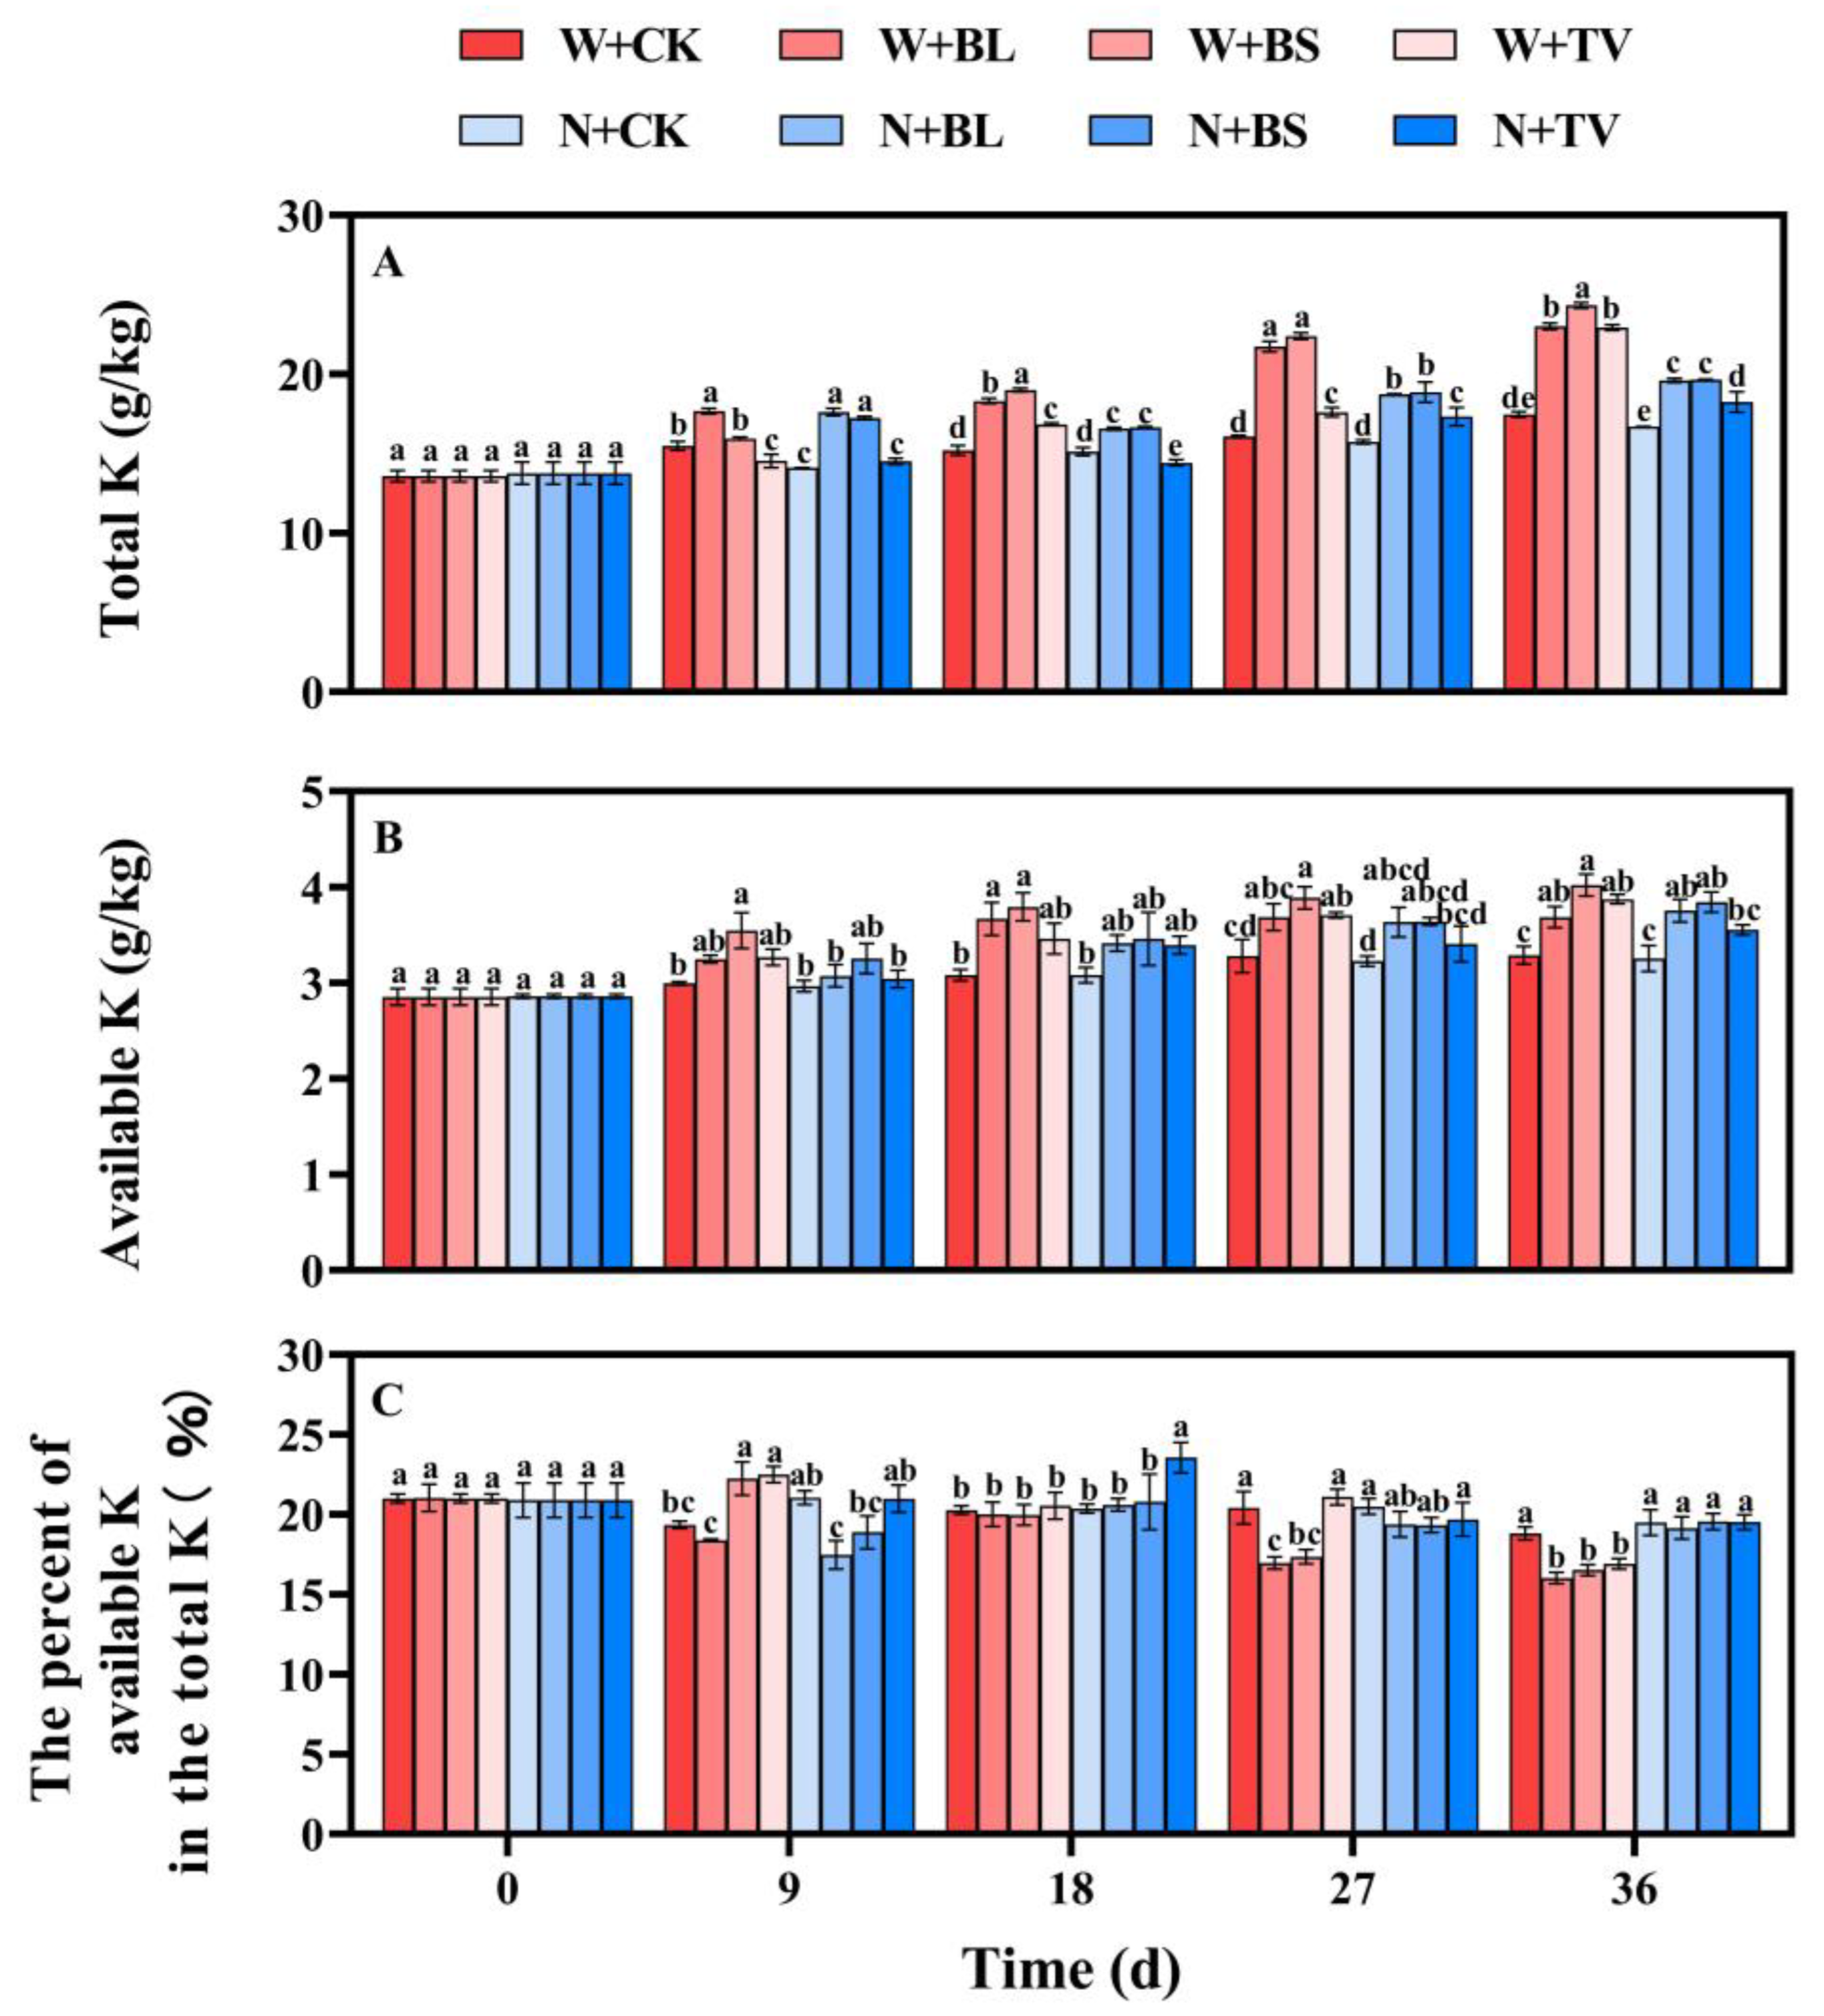
3.7. Changes in Potassium Concentrations between the Treatments during Decomposition

The content of total potassium and available potassium showed an increasing trend. The reason for such a change is similar to that of total phosphorus and available phosphorus (Figure 7A,B). With no NaOH pretreatment, the increase in total potassium in the piles with Bacillus licheniformis agent, Bacillus subtilis agent, and Trichoderma viride agent was 5.53, 6.87, and 5.47 g/kg higher, respectively, than that without a microbial agent (W+CK). The increase in available potassium was 0.4, 0.73, and 0.59 g/kg higher than that of the pile without a microbial agent (W+CK). With NaOH pretreatment, the increase in total potassium in the piles with Bacillus licheniformis agent, Bacillus subtilis agent, and Trichoderma viride agent was 2.91, 2.94, and 1.54 g/kg higher, respectively, than that without a microbial agent (N+CK). The increase in available potassium was 0.5, 0.59, and 0.3 g/kg higher, respectively, than that without a microbial agent (N+CK). After 36 days of decomposition, the treatments’ total potassium accumulation in order from high to small was W+BS, W+BL, W+TV, N+BS, N+BL, N+TV, W+CK, and N+CK. The treatments’ available potassium accumulation in order from high to small was W+BS, W+TV, N+BS, N+BL, W+BL, N+TV, W+CK, and N+CK. Figure 7C shows the percentage of the available potassium in the total potassium during decomposition. After 36 days of decomposition, the percentage of all treatments was less than the initial percentage.

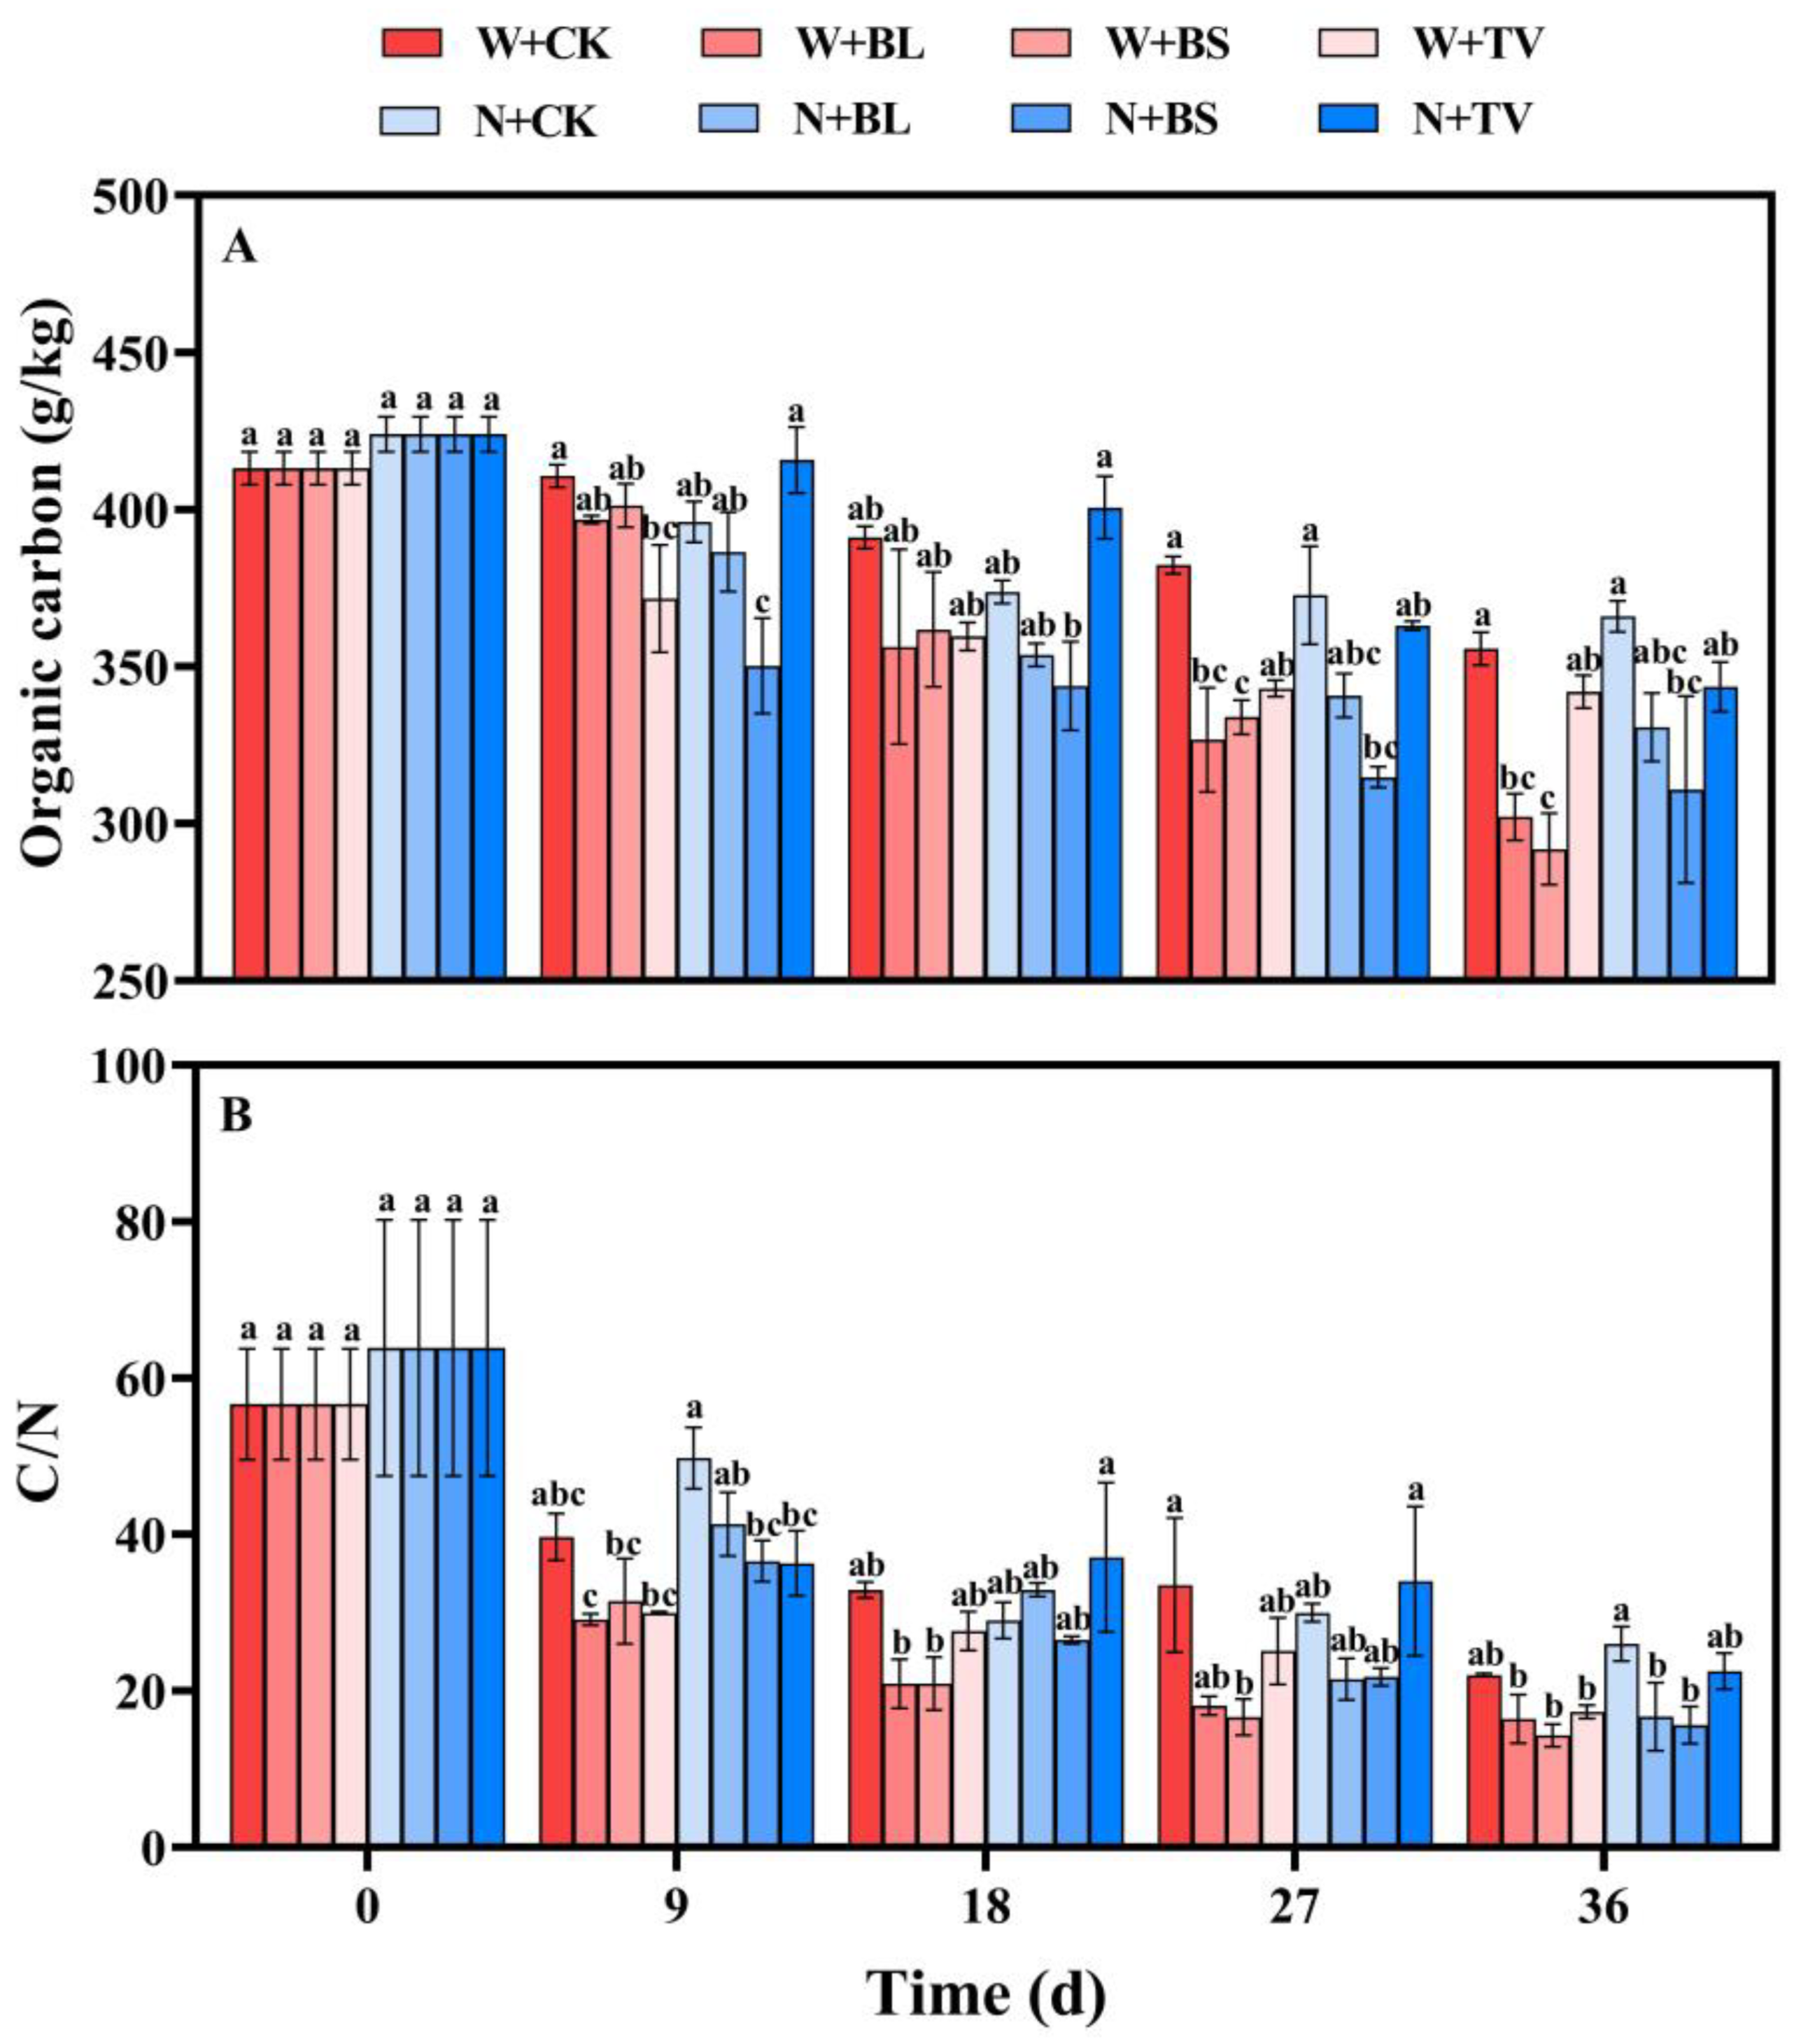
3.8. Changes in Carbon and Carbon–Nitrogen Ratio (C/N) between the Treatments during Decomposition

The organic carbon content of all treatments showed a decreasing trend. The addition of microbial agents could promote the decomposition of organic carbon (Figure 8A). After 36 days of composting, without NaOH pretreatment, the amount of organic carbon reduction in the piles with Bacillus licheniformis agent, Bacillus subtilis agent and Trichoderma viride agent was 53.53, 63.74, and 13.67 g/kg higher, respectively, than that without a microbial agent (W+CK). With NaOH pretreatment, the organic carbon reduction in the piles with Bacillus licheniformis agent, Bacillus subtilis agent and Trichoderma viride agent was 35.31, 55.19, and 22.49 g/kg higher, respectively, than that without a microbial agent (W+CK). After 36 days of decomposition, the treatments’ organic carbon reduction in order from high to small was W+BS, W+BL, N+BS, N+BL, W+TV, N+TV, W+CK, and N+CK.
During the whole decomposition process, the carbon–nitrogen ratio (C/N) of each treatment showed a downward trend (Figure 8B). After 36 days of decomposition, the C/N of W+CK, W+BL, W+BS, W+TV, N+CK, N+BL, N+BS, and N+TV decreased by 34.63, 40.24, 42.34, 39.34, 37.82, 47.15, 48.22, and 41.34, respectively. The C/N of the pile was less than 20, which means that the pile had decomposed to the best effect. The final C/N of W+BL, W+BS, W+TV, N+BL, and N+BS was 16.40, 14.30, 17.30, 16.68, and 15.61, respectively, meeting the requirements.

3.9. Changes in Seed Germination Index between the Treatments during Decomposition

On the 9th day of decomposition, the germination index (GI) of W+CK, W+BL, W+BS, W+TV, N+CK, N+BL, N+BS, and N+TV was 82.86%, 77.36%, 73.53%, 79.05%, 68.21%, 73.23%, 52.64%, and 85.66%, respectively (Figure 9). Only when the seed germination index is more than 80% can it be considered as not harmful to crops. Except for when no microbial agent (W+CK) was added to the no NaOH pretreatment and when Trichoderma viride agent (N+TV) was added to the NaOH pretreatment, the other treatments did not meet the requirements. After 36 days of decomposition, the germination index (GI) of W+CK, W+BL, W+BS, W+TV, N+CK, N+BL, N+BS, and N+TV was 104.88%, 107.15%, 124.30%, 117.89%, 95.71%, 86.45%, 80.92%, and 80.23%, respectively; each was greater than 80%. Except for when the germination index of the NaOH pretreatment with Trichoderma viride agent (N+TV) decreased, the germination index of the other treatments increased by 22.02%, 29.78%, 50.76%, 38.84%, 27.50%, 13.21%, and 28.29%, respectively, compared with that of the 9th day at the beginning of decomposition. According to the increase amplitude of different treatments, the values in order from high to small were those of W+BS, W+TV, W+BL, N+BS, N+CK, W+CK, N+BL, and N+TV.

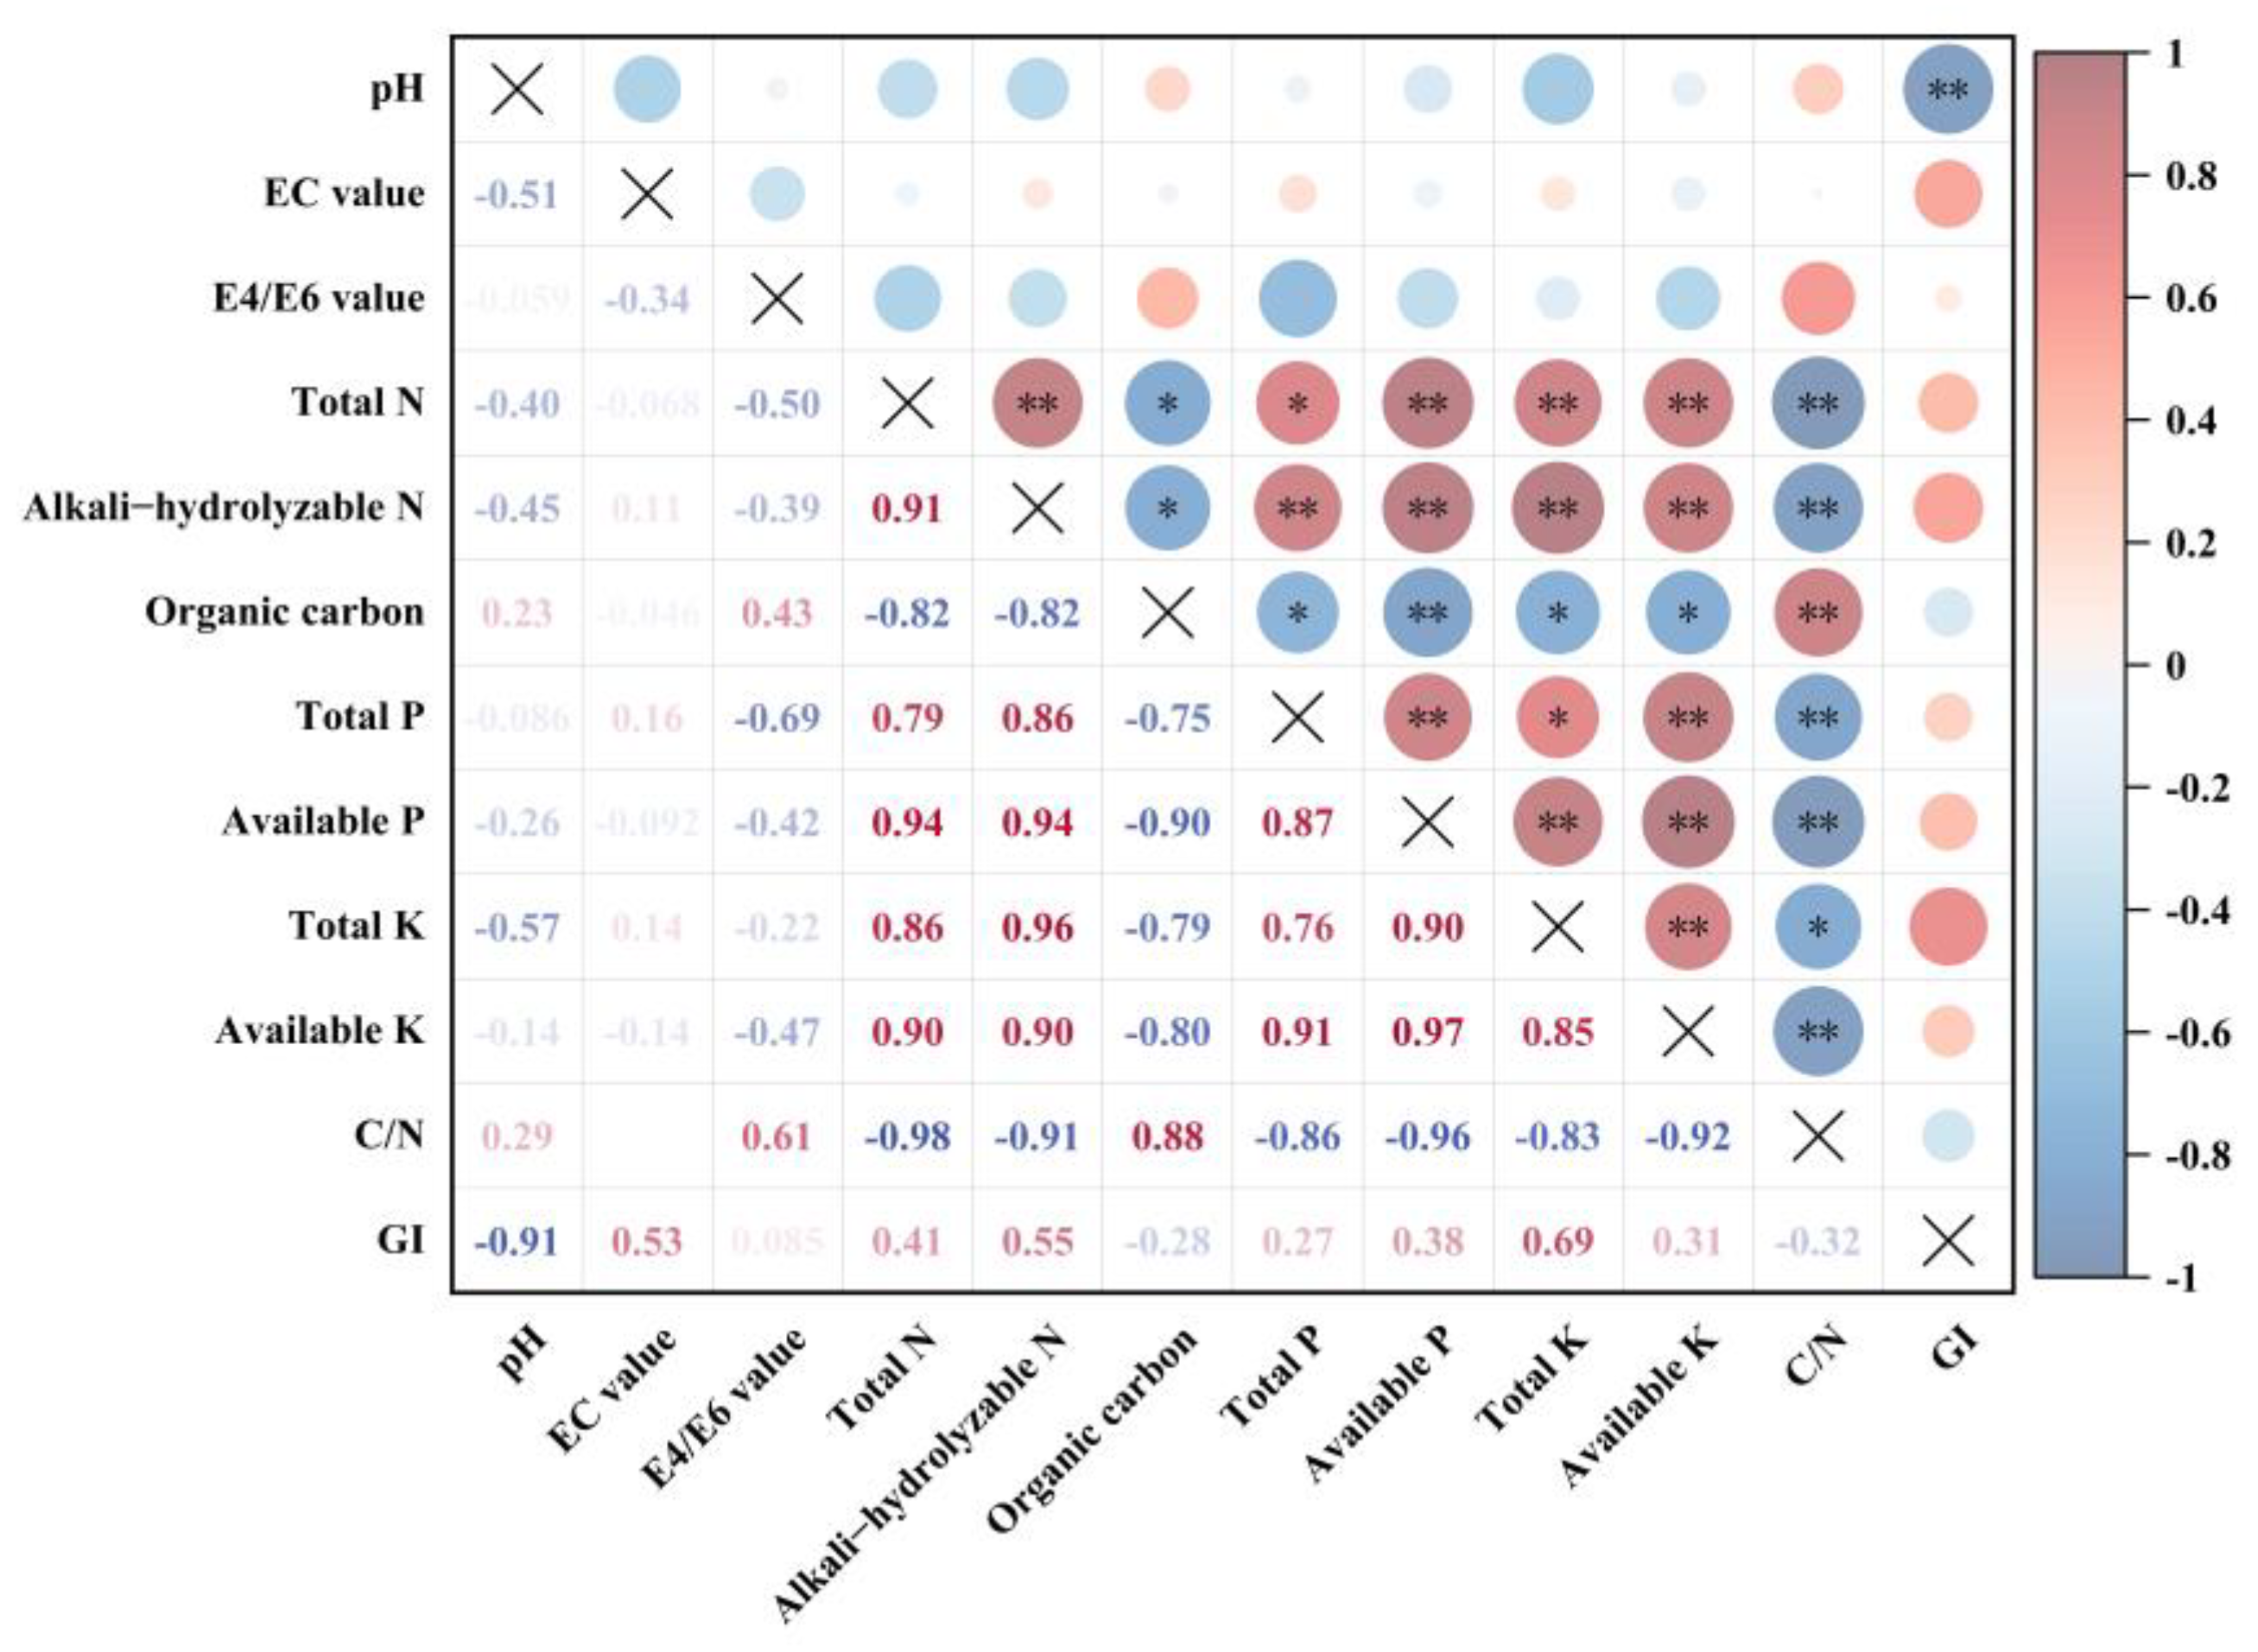
3.10. Correlation Analysis between Indicators Related to the Treatments during Decomposition

In combination with the analysis of the maturity indicators in PCA, further correlation analysis of maturity indicators was conducted (Figure 10). Among these indicators, the carbon-to-nitrogen ratio was significantly negatively correlated with total nitrogen content, alkali-hydrolyzable nitrogen content, total phosphorus content, available phosphorus content and available potassium content (p < 0.01). In addition, it was negatively correlated with total potassium content (r = −0.83 *, p < 0.05) but was positively correlated with organic carbon content (r = 0.88 **, p < 0.01). The organic carbon content was negatively correlated with total nitrogen content and alkali-hydrolyzable nitrogen content (r = −0.82 *, p < 0.05). The germination index was negatively correlated with pH (r = −0.91 **, p < 0.01). In addition, each nutrient content had a significant or extremely significant correlation with each other in varying degrees.

3.11. Gray Analysis between C/N and Other Indexes

The carbon source is the energy used by microorganisms. The nitrogen source provides the nutrients for these microorganisms. The change in carbon and nitrogen is one of the basic characteristics of compost. C/N is a parameter commonly used to evaluate the degree of maturity. Figure 11 shows the gray analysis of C/N and other indicators. The correlation coefficient between pH, E4/E6 value, organic carbon content, and GI and C/N was above 0.30, with a high correlation. Among them, pH, E4/E6 value, and organic carbon content are chemical indicators. This is the same as the C/N indicator attribute. GI is a biological indicator, that is, it judges whether a pile is toxic by the size of the germination index and by comparing the composting effects.

3.12. Principal Component Analysis (PCA) between the Treatments during Decomposition

The decomposition effect of eight treatments in the process of decomposition was evaluated by principal component analysis. Figure 12 shows that PC1 and PC2 account for 53.96% and 13.51% of the total variation, respectively. The cumulative contribution rate of the two principal components was as high as 67.47%. The results showed that the two principal components represented most of the information regarding the temperature change, pH, EC value, E4/E6 value, nutrient index, and germination index of the eight treatments. The characteristic value of PC1 was 6.48. Indicators of a positive eigenvalue include total nitrogen, total phosphorus, total potassium, alkali-hydrolyzable nitrogen, available phosphorus, available potassium, and germination index. The other indicators are negative eigenvalue indicators. The characteristic value of PC2 is 1.62. Indicators of a positive eigenvalue include organic carbon, C/N, EC value, germination index, and available phosphorus. The other indicators are negative eigenvalue indicators. At the same time, the distribution of C/N, organic carbon, E4/E6 value, EC value, and pH was relatively loose. That is, these indicators had a greater impact on the judgment of the overall decomposition effect.
Among them, the first principal component distinguished the effects of different treatments at different times along the x-axis. That is, the decomposition effect obviously changed under different times and different treatments. The second principal component distinguished NaOH pretreatment from no NaOH pretreatment, that is, the effect of decomposition was obviously different among different treatments. Among them, the 36th day without NaOH pretreatment was in the first quadrant, the 4th day without NaOH pretreatment was in the second quadrant, the 4th day NaOH pretreatment was in the third quadrant, the 36th day NaOH pretreatment was in the fourth quadrant. In the first principal component, the 36th day, each treatment was far from the same treatment in the 4th day. This showed that the similarity of the decomposition effect decreased with the reasoning time. Further comparison of different treatments of the second principal component showed that both no NaOH pretreatment and NaOH pretreatment were divided into two parts at the 4th day and the 36th day, that is, the similarities among the decomposition effects of different treatments at different times was low. In addition, the two treatment groups without the addition of a microbial agent showed that they were closer at different times. However, the treatment with a microbial agent was far away regarding the difference in time.

3.13. Comprehensive Evaluation of the Treatments during Decomposition

Figure 13 shows that the decomposition effect of different treatments was comprehensively evaluated using the membership function analysis method. The results showed that the effect of adding Bacillus subtilis agent to the no NaOH pretreatment was the best. No NaOH pretreatment with Trichoderma viride was the second-best. The addition of Bacillus subtilis to NaOH pretreatment ranked third. The decomposition effect of NaOH pretreatment without adding microbial agents was the worst.

4. Discussion

In this study, NaOH pretreatment and the addition of microbial agents had a certain role in promoting the decomposition of rice straw. However, the promotion degree was different. Temperature is a key factor in the decomposition process and an important indicator for judging the degree of decomposition. During the process of stacking, too low of a temperature leads to the slow degradation of macromolecular organics and a longer stacking period. If the temperature is too high, the volatilization loss of nitrogen is accelerated, which may kill some beneficial microorganisms and prolong the stacking cycle.
The results of this study showed that the rice straw without NaOH pretreatment could be heated quickly, and the high temperature lasted for a long time after adding microbial agents. Among them, the pile temperature for rice straw treated with Trichoderma viride agent was the highest, reaching 45 °C, which was sustained for nine days. The relevant research showed that Trichoderma viride, as a highly efficient cellulose-degrading bacterium, has a strong degradation effect on crops [30]. After NaOH pretreatment, the maximum temperature of each pile of rice straw did not exceed 40 °C. Sun et al. [31] showed that pretreatment of rice straw with NaOH could increase the softening effect of straw, which is beneficial to straw bonding. Zhang et al. [32] showed that temperature, oxygen concentration, and water content were the main factors affecting the degree of decay of materials in the reactor. Hypoxia reduces the activity of aerobic bacteria, and even anaerobic bacteria are produced. If the moisture content is too high, the temperature of the material rises. Therefore, it is speculated that NaOH pretreatment can increase straw adhesion. This resulted in a slow aeration rate and water evaporation rate for the whole pile, which affected the temperature rise of the pile.
During the composting process, organic nitrogen is mineralized and decomposed under the action of microorganisms to produce NH3 [33]. This leads to a rapid increase in pH. However, strong nitrification makes organic carbon and total nitrogen continuously degraded by microorganisms to form carbonate and organic acid. This causes a rapid decrease in pH. At the end of decomposition, with the gradual depletion of organic matter and oxygen consumption, the activity of microorganisms gradually weakens. The volatilization ability of ammonia decreases, forming a carbonate buffer system. The decomposition environment tends to be stable. In this study, the pH of each treatment without NaOH pretreatment increased at the early stage (9 days), which was significantly lower than that of each treatment with NaOH pretreatment (18 days). The trend of change after that was basically the same. This showed that the mineralization and decomposition time of rice straw pile without NaOH pretreatment is short. It can quickly enter the nitrification process of continuous degradation of macromolecular organics such as organic carbon and total nitrogen. At the same time, the pH of piles with added Bacillus subtilis agent during NaOH pretreatment changed greatly from 0 to 18 days, and the change trend was first increasing and then decreasing. This was obviously different from the treatment with Bacillus licheniformis and Trichoderma viride. Studies showed that Bacillus subtilis agent is a recognized probiotic. It can inhibit different diseases and directly antagonize microbial pathogens by competing for space and nutrients [34,35]. Therefore, this study indicated that Bacillus subtilis agent has strong adaptability. With NaOH pretreatment, it still had strong environmental adaptability and remained active. According to electrical conductivity observation, the increase in conductivity of the same microbial agents without NaOH pretreatment occurred earlier than that with NaOH pretreatment. The E4/E6 value can indirectly reflect the humification degree of the pile. A large number of macromolecular organics in the material were decomposed into small molecular substances under the decomposition of microorganisms, so the E4/E6 value increased. Then, it polymerized to form new humus substances under the action of microorganisms, so the E4/E6 value decreased. The results showed that the change range of NaOH pretreatment was greater than that of no NaOH pretreatment. That is, NaOH pretreatment was conducive to the decomposition of macromolecular organics and the condensation of humus.
Through microbial decomposition, cellulose, hemicellulose, lignin, and other parts of straw can be decomposed into simple compounds for plants. This provides N, P, K, and other elements for the environment. Zhu et al. [36] showed that the addition of a microbial composting agent could significantly increase the content of N, P, and K in compost. Liu et al. [37] showed that a multi-strain compound bacterial agent can increase the nitrogen content and the utilization rate of phosphorus and potassium. It can also accelerate the decomposition of organic matter. Through the comparison of nutrient content in this study, Bacillus subtilis agent had the best promotion effect on the formation of total nitrogen, alkali-hydrolyzable nitrogen, total potassium, available potassium, total phosphorus, and available phosphorus without NaOH pretreatment. With NaOH pretreatment, Bacillus licheniformis agent had the best effect on total nitrogen production. Bacillus subtilis agent had the best promotion effect on the formation of total potassium, available potassium, total phosphorus, available phosphorus, and alkali-hydrolyzable nitrogen. Relevant studies showed that nitrogen-containing organics were continuously decomposed into volatile substances such as ammonia during the decomposition process, causing nitrogen loss. At the same time, with the advance of composting, the humus produced by the pile played a role in fixing the ammonium nitrogen by reducing the volatilization loss of the nitrogen [38,39]. In this study, the percentage change trend of the alkali-hydrolyzable nitrogen in the total nitrogen showed a general trend of first decreasing and then increasing. This showed that at the early stage of decomposition, the humus produced by the pile was less, and the fixation capacity of ammonium nitrogen was weak. With the advance of decomposition, the content of ammonium nitrogen increased, the volatilization loss of nitrogen decreased, and the percentage increased. During decomposition, phosphorus, and potassium are not easy to volatilize. The increase in their content is mainly due to the continuous decline of the total mass of the pile with the decomposition of straw. This causes the content to rise due to concentration. Therefore, the increase in total phosphorus and total potassium content in this study was mainly due to the concentration of the pile.
The seed germination index is an important index to simply detect whether the compost is biotoxic to plants and judge whether the fermentation maturity of the compost is harmless and stable [40]. Relevant research showed that the germination index can take into account the germination percentage. It also reflects the influence of toxic substances on seeds. If the germination index is greater than 80%, it means that the compost is non-toxic to the plant or the heap has been decomposed [41]. The results showed that the germination index of each treatment at the end of decomposition was more than 80%. This indicated that each treatment was non-toxic to plants. Among them, the germination index of each treatment without NaOH pretreatment was significantly higher than that with NaOH pretreatment.
Principal component analysis is a statistical method that combines multiple variables into several independent variables. It can be used to study the similarities among different samples and select the optimal variable from the subset of the original variable, to form an optimal set. The results showed that principal component analysis could distinguish different treatment groups at different times in different quadrants. According to the first principal component, time can increase the effect of straw decomposition. According to the second principal component, straw without NaOH pretreatment is more conducive to the decomposition of straw. At the same time, C/N, organic carbon, E4/E6 value, EC value, and pH each have their particularity in judging the maturity effect. They have a great influence on the overall judgment of the decomposition effect and are important indicators for judging the decomposition effect. According to the correlation analysis, there is a significant or extremely significant correlation between C/N and nutrient content.
Finally, by using the membership function analysis method and the gray correlation analysis method, a comprehensive evaluation of the maturity of the various microorganisms was carried out. The results showed that the effect of adding Bacillus subtilis agent to NaOH pretreatment was the best. Compared with no NaOH pretreatment, the effect of NaOH pretreatment on the physicochemical properties and nutrient content of rice straw compost was not obvious. Due to the filling capacity of rice straw’s raw materials, NaOH soaking treatment of rice straw is related to the residual sodium ions in the fermentation broth after fermentation, which may affect the physical and chemical properties and nutritional components of rice straw compost. In addition, C/N is often used in research and practical production as an index for comparative evaluation of maturity. In this study, C/N and other indicators were used for gray analysis. The results showed that pH, E4/E6 value, organic carbon content, and GI were highly correlated with C/N. Among them, GI as a biological indicator was different from other indicators. Therefore, in follow-up research and actual production, the ripening effect can be preliminarily judged by the simple determination of C/N and GI. The compost maturity was evaluated from the combination of chemical and biological indicators. The data results are of a high reference value.

5. Conclusions

Alkali pretreatment can change the lignocellulose structure of straw, destroy the structure of the lignin–carbohydrate complex, effectively remove lignin and hemicellulose from straw fiber and improve the crystallinity of treated rice straw fiber. Alkali pretreatment can also carry out anaerobic fermentation on straw, significantly improving the gas production rate. However, there is still a lack of research on the mechanism of alkali pretreatment to improve the efficient utilization characteristics of rice straw. In this study, the decomposition effect of NaOH pretreatment and microbial agents on rice straw was studied. Compared with no NaOH pretreatment, the effect of NaOH pretreatment on the physicochemical properties and nutrient content of rice straw compost was not obvious, but NaOH pretreatment could increase temperature and pH to accelerate the composting process of rice straw decomposition. The added Bacillus subtilis agent with NaOH pretreatment and without NaOH pretreatment could increase the content of alkali-hydrolyzable nitrogen, available potassium, and reduce organic carbon. Co-application of NaOH pretreatment and Bacillus subtilis agent had the best decomposition effect on rice straw. These results can provide a reference for the efficient utilization of rice straw resources and also provide new ideas for rice production.

Author Contributions

Y.W. conceived and supervised the work; Q.C. and Y.L. conducted the experiments, analyzed the data and prepared the figures; C.W. assisted in the data analysis; Y.W. drafted the manuscript, together with Q.C., Y.L. and C.W. All authors have read and agreed to the published version of the manuscript.

Funding

This work was funded by the National Key R&D Program of China (2017YFD0301501).

Institutional Review Board Statement

Not applicable.

Informed Consent Statement

Not applicable.

Data Availability Statement

All of the data is contained within the article.

Acknowledgments

The authors thank Yu Zhou and Cui Wu of Hunan Agricultural University for all their help during the experiment.

Conflicts of Interest

The authors declare no conflict of interest.

References

  1. Jia, W.; Qin, W.; Zhang, Q.; Wang, X.; Ma, Y.; Chen, Q. Evaluation of crop residues and manure production and their geographical distribution in China. J. Clean. Prod. 2018, 188, 954–965. [Google Scholar] [CrossRef]
  2. He, Y.Y.; Xu, X.; Liu, C.; Liu, H.J.; Li, R.; Shen, Q.R. Using wood fiber degrading compound microbial agents to promote maturity of composting. Soils 2020, 52, 728–735. [Google Scholar] [CrossRef]
  3. Gao, R.P.; Liu, X.Y.; Pan, Z.T.; Zhang, D.X.; Shen, X.J.; Su, Y.F.; Huang, J.; Jing, Y.P. Effects of biological agents on hydrothermal status and enzyme activity during composting of corn straw. J. Agric. Sci. Technol. 2022, 1–8. [Google Scholar] [CrossRef]
  4. Wang, J.; Wei, S.J.; Wei, L.M. Effect of straw decomposition agent on rice seedling quality and the substrate microorganism. J. Nucl. Agric. Sci. 2021, 35, 2413–2422. [Google Scholar] [CrossRef]
  5. Li, H.; Zou, S.X.; Li, C.C.; Jin, Y.Y. Alkaline post-treatment for improved sludge anaerobic digestion. Bioresour. Technol. 2013, 140, 187–191. [Google Scholar] [CrossRef]
  6. Li, H.Y.; Huang, K.L.; Jin, M.; Wei, Q.Q.; Li, G.Z. Effects of alkaline ozone pretreatment on rice straw. Trans. Chin. Soc. Agric. Eng. 2009, 35, 611–614. [Google Scholar] [CrossRef]
  7. Qi, H.; Wu, X.F.; Chen, L.; Deng, M.; Wang, K.Q. The enzymatic hydrolysis conversion rate of cellulose in rice straw improved by using NaOH solution collaborated with irradiation. J. Nucl. Agric. Sci. 2019, 33, 1190–1198. [Google Scholar] [CrossRef]
  8. Wu, J.; Xu, L.L.; Xie, J.L. The effect of alkali-pretreatment on anaerobic digestion of solid organic waste. Acta Sci. Circumstantiae 2006, 26, 252–255. [Google Scholar] [CrossRef]
  9. He, Y.F.; Pang, Y.Z.; Liu, Y.P.; Li, X.J.; Wang, K.S. Physicochemical characterization of rice straw pretreated with sodium hydroxide in the solid state for enhancing biogas production. Energ. Fuel. 2008, 22, 2775–2781. [Google Scholar] [CrossRef]
  10. Wei, Y.; Zhang, S.H. Abiostress resistance and cellulose degradation abilities of haloalkaliphilic fungi: Applications for saline-alkaline remediation. Extremophiles 2018, 22, 155–164. [Google Scholar] [CrossRef]
  11. Mei, X.L.; Zheng, H.P.; Li, S.X.; Yang, T.J.; Jiang, G.F. Construction and evaluation of bacterial-fungal consortia for rice straw degradation. J. Agro-Environ. Sci. 2021, 40, 2217–2225. [Google Scholar] [CrossRef]
  12. Passoth, V.; Sandgren, M. Biofuel production from straw hydrolysates: Current achievements and perspectives. Appl. Microbiol. Biotechnol. 2019, 103, 5105–5116. [Google Scholar] [CrossRef] [PubMed] [Green Version]
  13. Meng, J.Y.; Ji, J.H.; Guo, H.Q.; Tao, Y.; Feng, F.Y.; Zhao, H.B. Isolation of room temperature cellulose-degrading bacteria and construction of degrading consortia. J. Biol. 2020, 37, 86–90. [Google Scholar] [CrossRef]
  14. Gong, X.J.; Yu, Y.; Hao, Y.B.; Wang, Q.J.; Ma, J.T.; Jiang, Y.B.; Lv, G.Y.; Li, L.; Qian, C.R. Characterizing corn-straw-degrading actinomycetes and evaluating application efficiency in straw-returning experiments. Front Microbiol. 2022, 13, 1003157. [Google Scholar] [CrossRef]
  15. Liu, B.P.; Wang, H.Y.; Fang, H.Y.; Wang, L.; Zhu, Z.M.; Guo, A.L.; Xu, H.M. Isolation and screening of bacteria and actinomycetes in degrade stalks. J. Northeast Agric. Univ. 2010, 41, 49–54. [Google Scholar] [CrossRef]
  16. Lv, S.; Wu, Z.C.; Wang, Z.W.; Li, B.; Yu, H.G.; Zhang, Y.F. Study on alkali-pretreatment of straw to provide carbon source for denitrification. Technol. Water Treat. 2012, 38, 25–29. [Google Scholar] [CrossRef]
  17. Ding, Z.G.; Guo, L.; Jiang, J.J.; Yuan, L.L. Effect of inoculating Bacillus licheniformis on quality of wheat and rice straws. J. Yangzhou Univ. (Agric. Life Sci. Ed.) 2010, 31, 82–86. [Google Scholar] [CrossRef]
  18. Zhang, Z.H.; Wang, Y.Q.; Ren, G.Y.; Li, Y.X.; Zhao, L.P.; Wu, Q.J.; Zhang, Z.J. Evaluation of fermentation quality of corn straw silage treated with different additives based on principal component analysis and membership function analysis. Chin. J. Anim. Nutr. 2022, 34, 2677–2688. [Google Scholar] [CrossRef]
  19. He, C.; Wang, W.Q.; Hou, J.L. Advances in mechanism and application of Trichoderma viride on biodegradation and biologicalcontrol. J. Microbiol. 2019, 39, 122–128. [Google Scholar] [CrossRef]
  20. Huang, F.; Liu, H.B.; Wen, J.X.; Zhao, C.; Lu, D.; Liu, H. Underestimated humic acids release and influence on anaerobic digestion during sludge thermal hydrolysis. Water Res. 2021, 201, 117310. [Google Scholar] [CrossRef]
  21. Lu, R.K. Methods for Agrochemical Analysis of Soil; China Agriculture Press: Beijing, China, 2000; pp. 272–282. (In Chinese) [Google Scholar]
  22. Gu, P.Y.; Luo, F.F.; Tao, W.Q.; Li, Y.; Wang, D.J.; Wu, X.; Ju, X.X.; Chao, L.; Zhang, Y.L. Higher nitrogen content and auxin export from rice tiller enhance low-ammonium-dependent tiller outgrowth. J. Plant Physiol. 2022, 268, 153562. [Google Scholar] [CrossRef]
  23. Bao, S.D. Agrochemical Analysis of Soil, 3rd ed.; China Agriculture Press: Beijing, China, 2000; pp. 30–107. (In Chinese) [Google Scholar]
  24. Kong, Y.L.; Wang, G.Y.; Chen, W.J.; Yang, Y.; Ma, R.N.; Li, D.Y.; Shen, Y.J.; Li, G.X.; Yuan, J. Phytotoxicity of farm livestock manures in facultative heap composting using the seed germination index as indicator. Ecotoxicol. Environ. Saf. 2022, 247, 114251. [Google Scholar] [CrossRef]
  25. Yu, Y.; Deng, L.; Zhou, L.; Chen, G.; Wang, Y. Exogenous Melatonin Activates Antioxidant Systems to Increase the Ability of Rice Seeds to Germinate under High Temperature Conditions. Plants 2022, 11, 886. [Google Scholar] [CrossRef]
  26. Su, D.W.; Mei, L.; Lin, H.; Luo, H.L.; Zhang, L.L.; Song, J.; Song, J.; Liu, J.; Lin, Z.X. Grey correlation analysis of physiological traits related to drought tolerance in pennisetum sp. Agric. Basic Sci. Technol. 2017, 18, 1158–1163. [Google Scholar]
  27. Shi, S.; Wang, E.; Li, C.; Zhou, H.; Cai, M.; Cao, C.; Jiang, Y. Comprehensive Evaluation of 17 Qualities of 84 Types of Rice Based on Principal Component Analysis. Foods 2021, 10, 2883. [Google Scholar] [CrossRef] [PubMed]
  28. Li, X.; Zhu, W.Z.; Shu, S.M.; Sheng, Z.L.; Wang, W.W. Soil quality assessment of grassland in dry and warm valley of Dadu River based on principal component analysis. Acta Ecol. Sin. 2021, 41, 3891–3900. [Google Scholar] [CrossRef]
  29. Sun, Q.; Hu, J.J. Research Technology of Plant Physiology; Northwest University of Agriculture and Forestry Science and Technology Press: Yangling, Xianyang, China, 2005; p. 67. (In Chinese) [Google Scholar]
  30. Wonglom, P.; Ito, S.; Sunpapao, A. Volatile organic compounds emitted from endophytic fungus Trichoderma asperellum T1 mediate antifungal activity, defense response and promote plant growth in lettuce (Lactuca sativa). Fungal Ecol. 2020, 43, 100867. [Google Scholar] [CrossRef]
  31. Sun, D.H.; Bao, A.H.; Chen, L. On Softening Effect of NaOH Pretreatment on Rice Straw. J. Southwest China Norm. Univ. (Nat. Sci. Ed.) 2020, 45, 73–78. [Google Scholar] [CrossRef]
  32. Zhang, J.; Chen, T.B.; Gao, D.; Zheng, G.D. Research progress in mathematical models of temperature, oxygen and moisture in aerobic composting process. China Water Wastewater 2010, 26, 148–152. [Google Scholar] [CrossRef]
  33. Chen, M.L.; Huang, Y.M.; Wang, C.; Gao, H. The conversion of organic nitrogen by functional bacteria determines the end-result of ammonia in compost. Bioresour Technol. 2020, 299, 122599. [Google Scholar] [CrossRef]
  34. Kloepper, J.W.; Ryu, C.M.; Zhang, S. Induced systemic resistance and promotion of plant growth by Bacllus spp. Phytopathology 2004, 94, 1259–1266. [Google Scholar] [CrossRef] [Green Version]
  35. Shafi, J.; Tian, H.; Ji, M. Bacllus species as versatile weapons for plant pathogens: A review. Biotechnol. Biotechnol. Equip. 2017, 31, 446–459. [Google Scholar] [CrossRef] [Green Version]
  36. Zhu, J.L.; Liu, X.L.; Li, S.M.; You, P.; Gao, W.L.; Tang, L. Effect of two microbial agents on tobacco fine waste high-temperature compost maturity. J. Agro-Environ. Sci. 2010, 29, 194–199. [Google Scholar]
  37. Liu, J.; Li, J.; Ge, C. Advance in role mechanism of microbial fertilizer. J. Microbiol. 2001, 21, 33–36. [Google Scholar] [CrossRef]
  38. Delaune, P.B.; Moore, P.A.; Daniel, T.C.; Lemunyon, J.L. Effect of chemical and microbial amendments on amm- onia volatilization from composting poultry litter. J. Environ. Qual. 2004, 33, 728–735. [Google Scholar] [CrossRef] [Green Version]
  39. Raviv, M.; Medina, S.; Krasnovsky, A.; Ziadna, H. Organic Matter and Nitrogen Conservation in Manure Compost for Organic Agriculture. Compos. Sci. Util. 2013, 12, 6–10. [Google Scholar] [CrossRef]
  40. Wei, Y.H.; Yu, J.H.; Jie, J.M.; Zhang, G.B. Effects of different additives on high temperature composting of cow dung. J. Gansu Agric. Univ. 2012, 47, 52–56. [Google Scholar] [CrossRef]
  41. Chen, T.B.; Luo, W.; Zheng, G.D.; Gao, D. Effects of pile-turning on chemical and physical properties in static forced-aeration composting of sewage sludge and pig manure. Acta Sci. Circumstantiae 2005, 25, 117–122. [Google Scholar] [CrossRef]
Figure 1. Changes in temperature values in the treatments. AT: Ambient temperature. Means ± SEs with different letters in each parameter indicate significant statistical differences (p < 0.05).
Agronomy 13 00816 g001
Figure 2. Changes in pH values in the treatments. Means ± SEs with different letters in each parameter indicate significant statistical differences (p < 0.05).
Agronomy 13 00816 g002
Figure 3. Changes in EC values in the treatments. Means ± SEs with different letters in each parameter indicate significant statistical differences (p < 0.05).
Agronomy 13 00816 g003
Figure 4. Changes in E4/E6 values in the treatments. Means ± SEs with different letters in each parameter indicate significant statistical differences (p < 0.05).
Agronomy 13 00816 g004
Figure 5. Changes in nitrogen concentrations in the treatments. Means ± SEs with different letters in each parameter indicate significant statistical differences (p < 0.05). (A) Total N, (B) Alkali-hydrolyzable N, (C) The percentage of alkali-hydrolyzable N in the total N.
Agronomy 13 00816 g005
Figure 6. Changes in phosphorus concentrations in the treatments. Means ± SEs with different letters in each parameter indicate significant statistical differences (p < 0.05). (A) Total P; (B) Available P; (C) The percentage of available P in the total P.
Agronomy 13 00816 g006
Figure 7. Changes in potassium concentrations in the treatments. Means ± SEs with different letters in each parameter indicate significant statistical differences (p < 0.05). (A) Total K; (B) Available K; (C) The percentage of available K in the total K.
Agronomy 13 00816 g007
Figure 8. Changes in carbon and carbon–nitrogen in the treatments. Means ± SEs with different letters in each parameter indicate significant statistical differences (p < 0.05). (A) Organic carbon; (B) C/N.
Agronomy 13 00816 g008
Figure 9. Changes in seed germination index (GI) in the treatments. Means ± SEs with different letters in each parameter indicate significant statistical differences (p < 0.05).
Agronomy 13 00816 g009
Figure 10. Correlation analysis between indicators related to the treatments during decomposition. * indicates a significant difference (p < 0.05), and ** indicates an extremely significant difference (p < 0.01).
Agronomy 13 00816 g010
Figure 11. Gray analysis of C/N and other indicators.
Agronomy 13 00816 g011
Figure 12. Principal component analysis in the treatments. X1: pH; X2: EC value; X3: E4/E6 value; X4: Total N; X5: Alkali-hydrolyzable N; X6: Organic carbon; X7: Total P; X8: Available P; X9: Total K; X10: Available K; X11: C/N; X12: GI.
Agronomy 13 00816 g012
Figure 13. Comprehensive evaluation in the treatments. (A) Value of the membership function; (B) Mean value of the membership function. X1: pH; X2: EC value; X3: E4/E6 value; X4: Total N; X5: Alkali-hydrolyzable N; X6: Organic carbon; X7: Total P; X8: Available P; X9: Total K; X10: Available K; X11: C/N; X12: GI.
Agronomy 13 00816 g013
Table 1. Treatments and numbering.
Treatment MethodNo NaOH Pretreatment (W)NaOH Pretreatment (N)
Decomposing Agents
No microbial agent (CK)W+CKN+CK
Bacillus licheniformis agentW+BLN+BL
Bacillus subtilis agentW+BSN+BS
Trichoderma viride agentW+TVN+TV
Disclaimer/Publisher’s Note: The statements, opinions and data contained in all publications are solely those of the individual author(s) and contributor(s) and not of MDPI and/or the editor(s). MDPI and/or the editor(s) disclaim responsibility for any injury to people or property resulting from any ideas, methods, instructions or products referred to in the content.

