Article

Analysis of Photosynthetic Differences of Rice Germplasm in Southeast Asia Based on Leaf-Tissue Structure, Physiology, and iTRAQ

1
Guangxi Key Laboratory of Rice Genetics and Breeding, Rice Research Institute, Guangxi Academy of Agricultural Sciences, Nanning 530007, China
2
Agricultural Science and Technology Information Research Institute, Guangxi Academy of Agricultural Sciences, Nanning 530007, China
3
Guangxi Academy of Agricultural Sciences, Nanning 530007, China
*
Author to whom correspondence should be addressed.
These authors contributed equally to this work.
Agronomy 2022, 12(12), 3207; https://doi.org/10.3390/agronomy12123207
Submission received: 2 November 2022 / Revised: 6 December 2022 / Accepted: 12 December 2022 / Published: 16 December 2022
(This article belongs to the Special Issue In Memory of Professor Longping Yuan, the Father of Hybrid Rice)

Abstract

:
Photosynthesis is responsible for 90–95% of organic matter in crop yield. The light energy utilization rate of high-yielding rice varieties is 1.0–1.5%, but the ideal value is about 3–5%. Yield can be further improved by improving photosynthetic function. Through the initial screening and re-screening of 220 Southeast Asian germplasm resources, we found that the net photosynthetic rate of Southeast Asian germplasm resource C1 was 36.96 μmol m−2 S−1, which is close to that of C4 plant maize and 3.26 times higher than that of Southeast Asian germplasm resource G164 at 11.26 μmol m−2 S−1. Using C1 and G164 as materials, we compared the tissue structure, chloroplast ultrastructure, photosynthetic physiological indicators, and proteomics of sword leaves to determine the factors affecting photosynthetic function. Compared with G164, C1 exhibited increased number of vascular bundles, increased stomatal size and density, more abundant and neatly arranged chloroplasts and thylakoid grana, and higher chlorophyll fluorescence parameters. The activities and contents of the key photosynthetic enzyme Rubisco were higher in C1 than in G164. The two germplasm resources were subjected to iTRAQ analysis, and the results showed that compared with C1, nine proteins were down-regulated and one protein was up-regulated and associated with photosynthetic electron transport in G164; a total of 17 differential proteins were associated with CO2 fixation, and nine were up-regulated and eight differential proteins were down-regulated in G164. The identified genes encode proteins in the photosynthesis and carbon fixation pathways, and the changes in gene expression were verified by real-time qPCR. The gene expression patterns were consistent with the protein expression patterns. The results suggest that most differential proteins are involved in electron transfer from PSII to PSI and in the CO2 fixation pathway, and increasing the levels of such proteins can effectively enhance the photosynthetic efficiency. C1 can be used as a donor material for selection of high light efficiency varieties and in-depth photosynthesis studies.

1. Introduction

Rice (Oryza sativa L.) provides food for over 50% of the world’s population, but world food production rates will increase by at least 50% by 2050 to meet the needs of a growing population [1]. Thus, further increasing rice production is essential to meet the future demand for food. Improvement of yield based solely on plant type and increased fertilizer application has been very difficult. A total of 90–95% of the organic matter in crop yield comes from photosynthetic products. The light energy utilization rate of existing high-yielding rice varieties is 1.0–1.5%, but the ideal value is about 3–5%. The plant canopy structure cannot be changed, so efforts to improve rice yield have shifted from the selection of ideal plant types to improvement of the leaf photosynthetic rate [2]. Improving the photosynthesis and energy conversion efficiency is an important approach to promote crop yield [3,4,5]. High-light-efficiency germplasm resources can be used as material sources to investigate photosynthetic function. The photosynthetic productivity of crops mainly depends on light energy interception capacity and light energy conversion efficiency, with the former related to the development of leaf area and the latter related to the single-leaf photosynthetic rate. In addition to photosynthetic rate, photosynthetic functional period, chlorophyll content, and quantum efficiency are important parameters of photosynthetic function [6]. Additionally, C3 plant photosynthesis can be significantly affected by leaf conductance and stomatal conductance, and the introduction of C4 plant genes can increase the CO2 concentration and the expression of ribulose-1,5-bisphosphate carboxylase (Rubisco) in rice leaves, thus increasing the overall leaf photosynthetic rate [7]. Studies on photosynthetic functions in rice have been limited to physiological level analysis and gene localization, with limited studies using proteomic techniques to identify key photosynthetic proteins.
Taking advantage of the geographical and natural environment of Guangxi, our team has established a large collection of rice germplasm resources in Southeast Asia and worked to evaluate the differences in the photosynthetic characteristics of these resources. We screened photosynthetic characteristics of ~220 Southeast Asian rice germplasm resources, and found the net photosynthetic rate (Pn) of a single leaf varied from 11.26 μmol m−2 S−1 for G164 to 36.96 μmol m−2 S−1 for C1—a three-fold difference—and the net photosynthetic rate of C1 is close to that of C4 plant maize. However, the underlying mechanisms explaining this three-fold difference in the photosynthetic rate of C1 compared to G164 were not known. We hypothesized that significant differences in leaf tissue structure, chloroplast ultrastructure, photosynthetic key enzymes, and chlorophyll fluorescence parameters and protein might explain the difference between C1 and G164.
In this study, we systematically investigated the underlying mechanisms explaining the high Pn of C1 germplasm and the low Pn of G164 by analyzing the tissue structure, chloroplast ultrastructure, and photosynthetic physiological characteristics, and by applying proteomic methods. The results of our study improve our understanding of the physiological basis of the high photosynthetic rate of C1 germplasm and lay the foundation for analysis of related genes and practical breeding utilization.

2. Materials and Methods

2.1. Plant Material and Experimental Design

Two Southeast Asian rice germplasm varieties, C1 and G164, were used in this study. The experiment was conducted from plants cultivated in early planting in 2021 at the Rice Research Institute of Guangxi Academy of Agricultural Sciences Institute, China (108°14′51″ E, 22°50′54″ N). The soil in the experimental field is clay (Ultisol, USDA taxonomy) with the following properties: pH = 6.10, organic matter = 20.6 g kg–1, available N = 79 mg kg–1, available P = 28 mg kg–1, and available K = 71 mg kg–1. Soil testing was performed using samples obtained from the upper 20 cm layer prior to planting in 2021. C1 and G164 were each planted in five rows of 16 plants each, with a planting area of 16 cm × 20 cm. Routine water, fertilizer, and pest and disease control practices were utilized. In the heading and flowering stage, sword leaves were taken to measure morphological indicators including leaf tissue structure and chloroplast ultrastructure; physiological indicators including photosynthetic characteristics, chlorophyll fluorescence parameters, chlorophyll content (soil and plant analyzer development, SPAD) and relative steady phase of chlorophyll content (RSP); and proteomics. Three biological replicates were performed for each indicator.

2.2. Investigations and Measurements

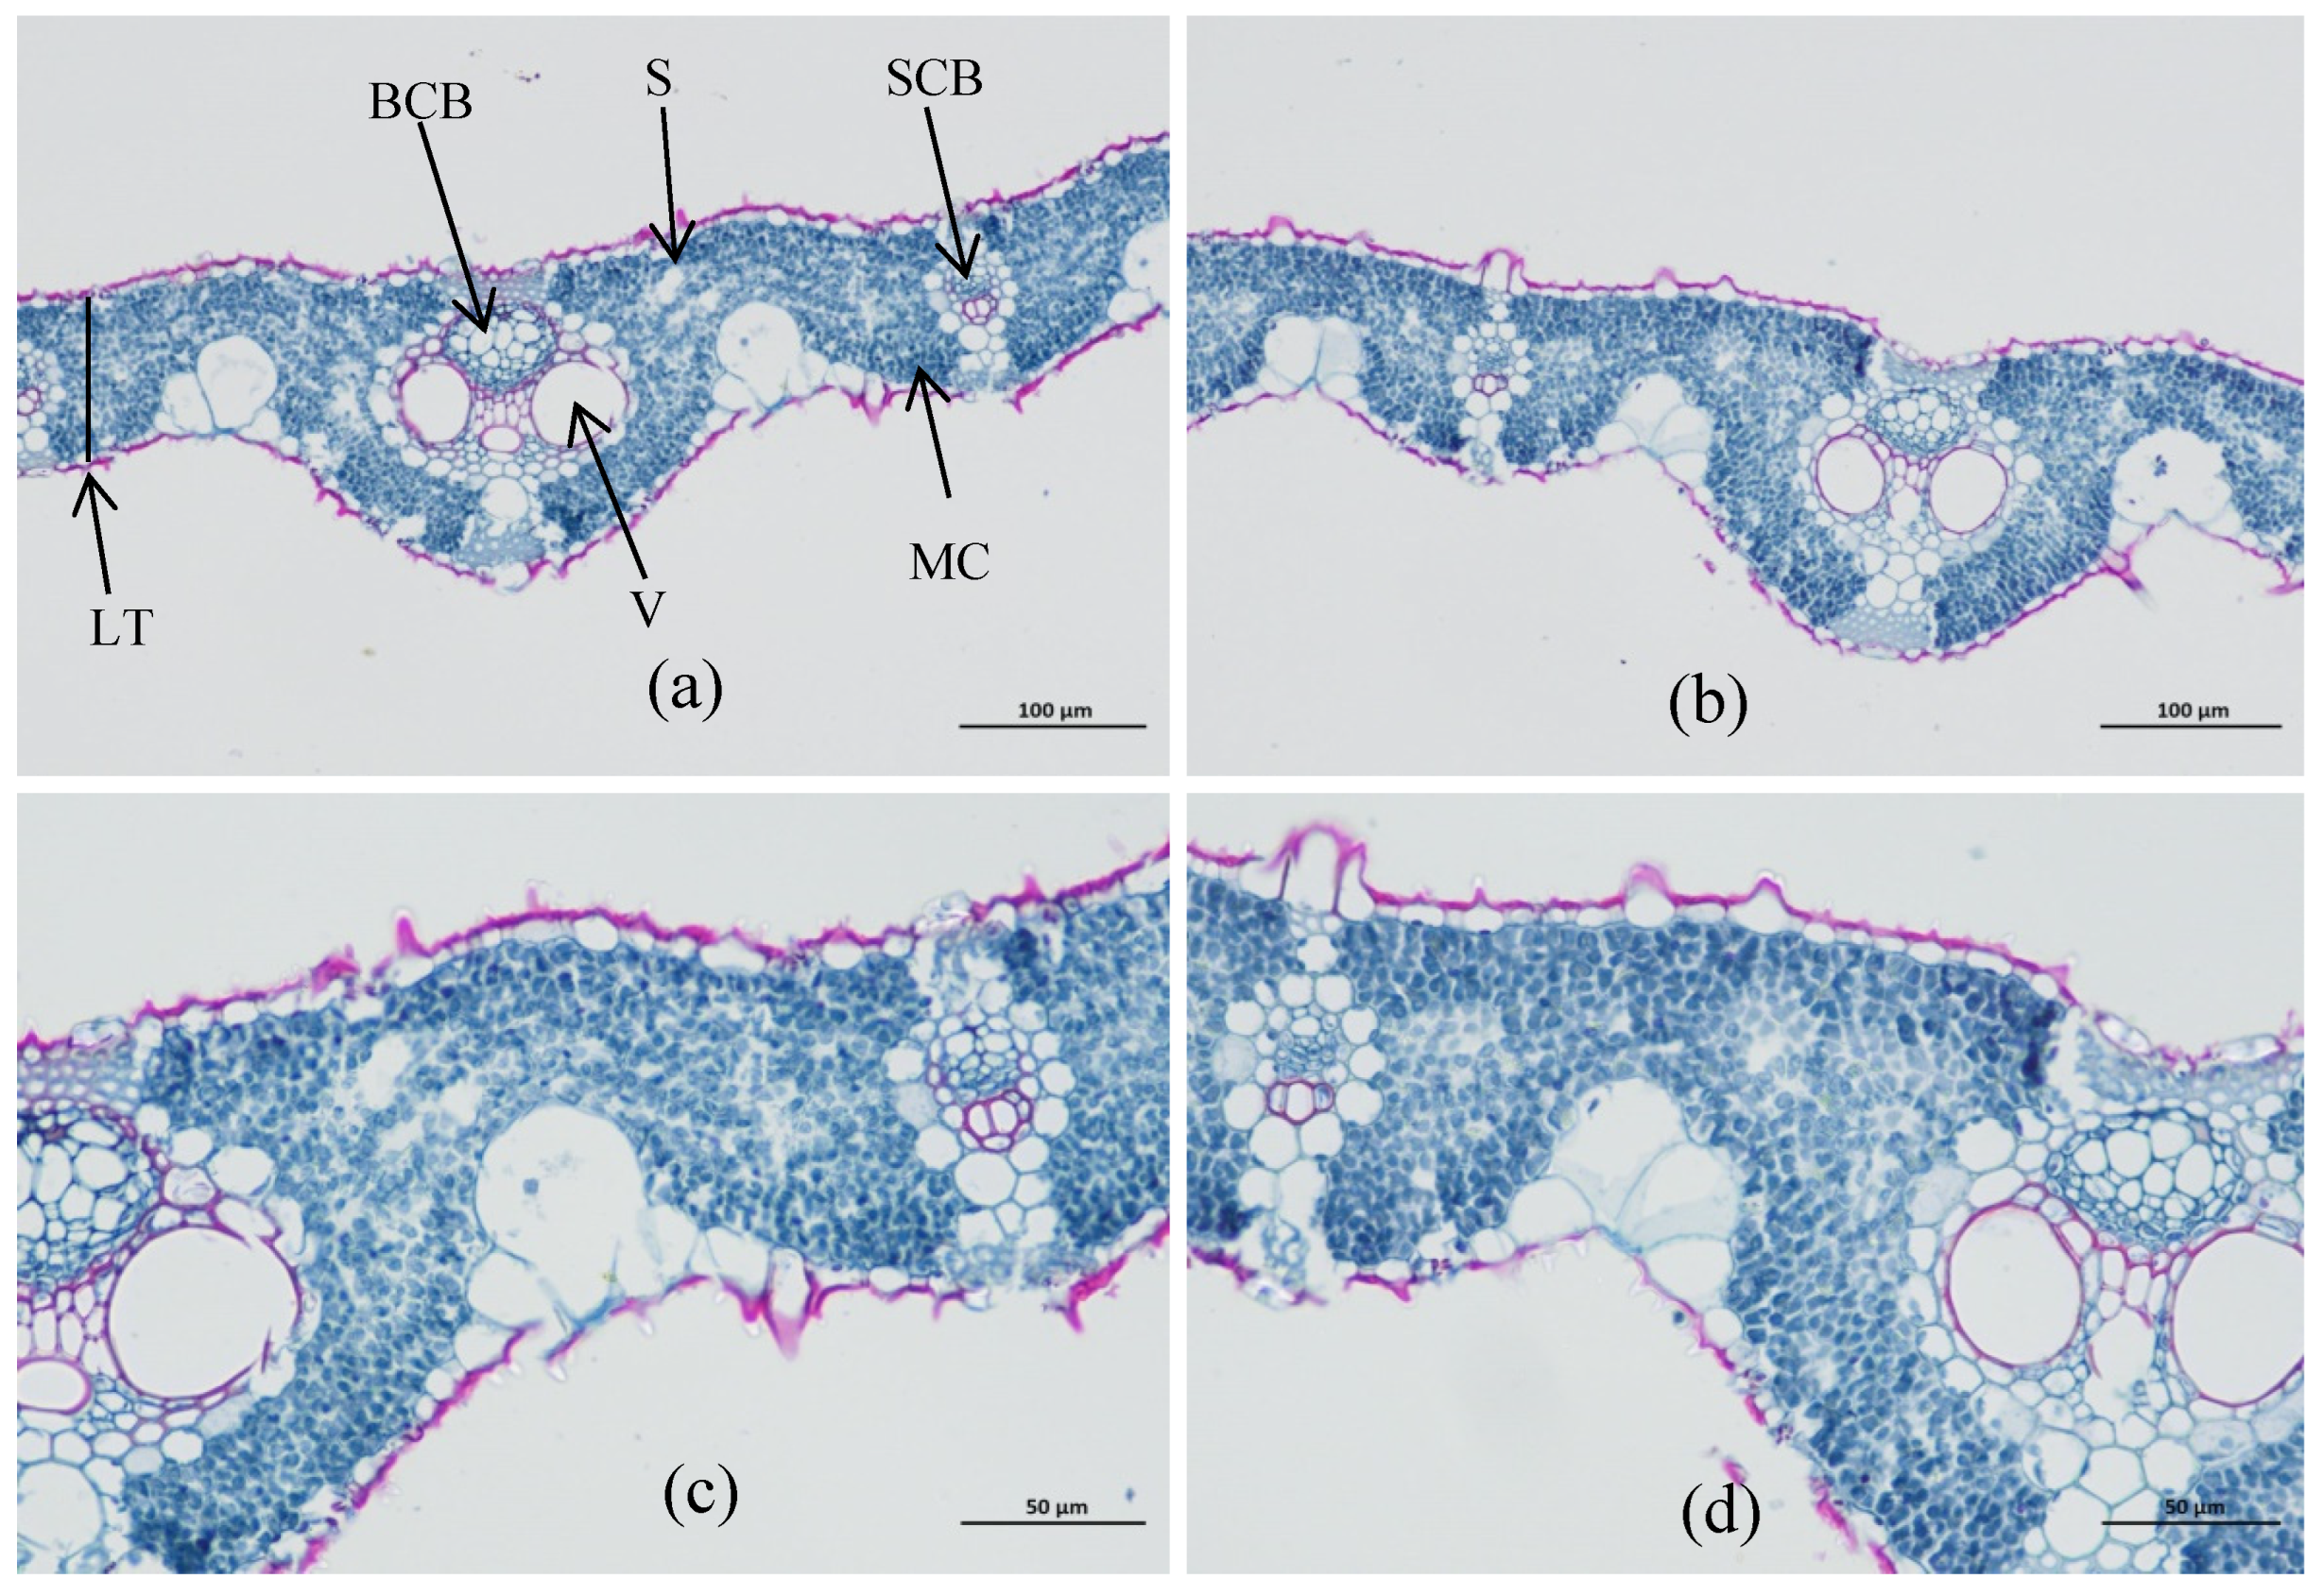
2.2.1. Leaf Tissue Structure

Ten small pieces with dimensions of 1 cm × 0.2 cm were cut from the middle of sword leaves of each variety, fixed with FAA fixative, and dehydrated with ethanol. The samples were paraffin embedded, sliced on a Leica RM2235 microtome (Leica Microsystems, Solms, Germany) at a thickness of 8 µm, and prepared as permanent sections with saffron-solid green counterstain (1% saffron and 0.5% solid green) and toluidine blue. Samples were subjected to microscopic examination, photography, and observation using Image-pro plus 6.0 (Media Cybernetics, Inc., Rockville, MD, USA) for analysis.

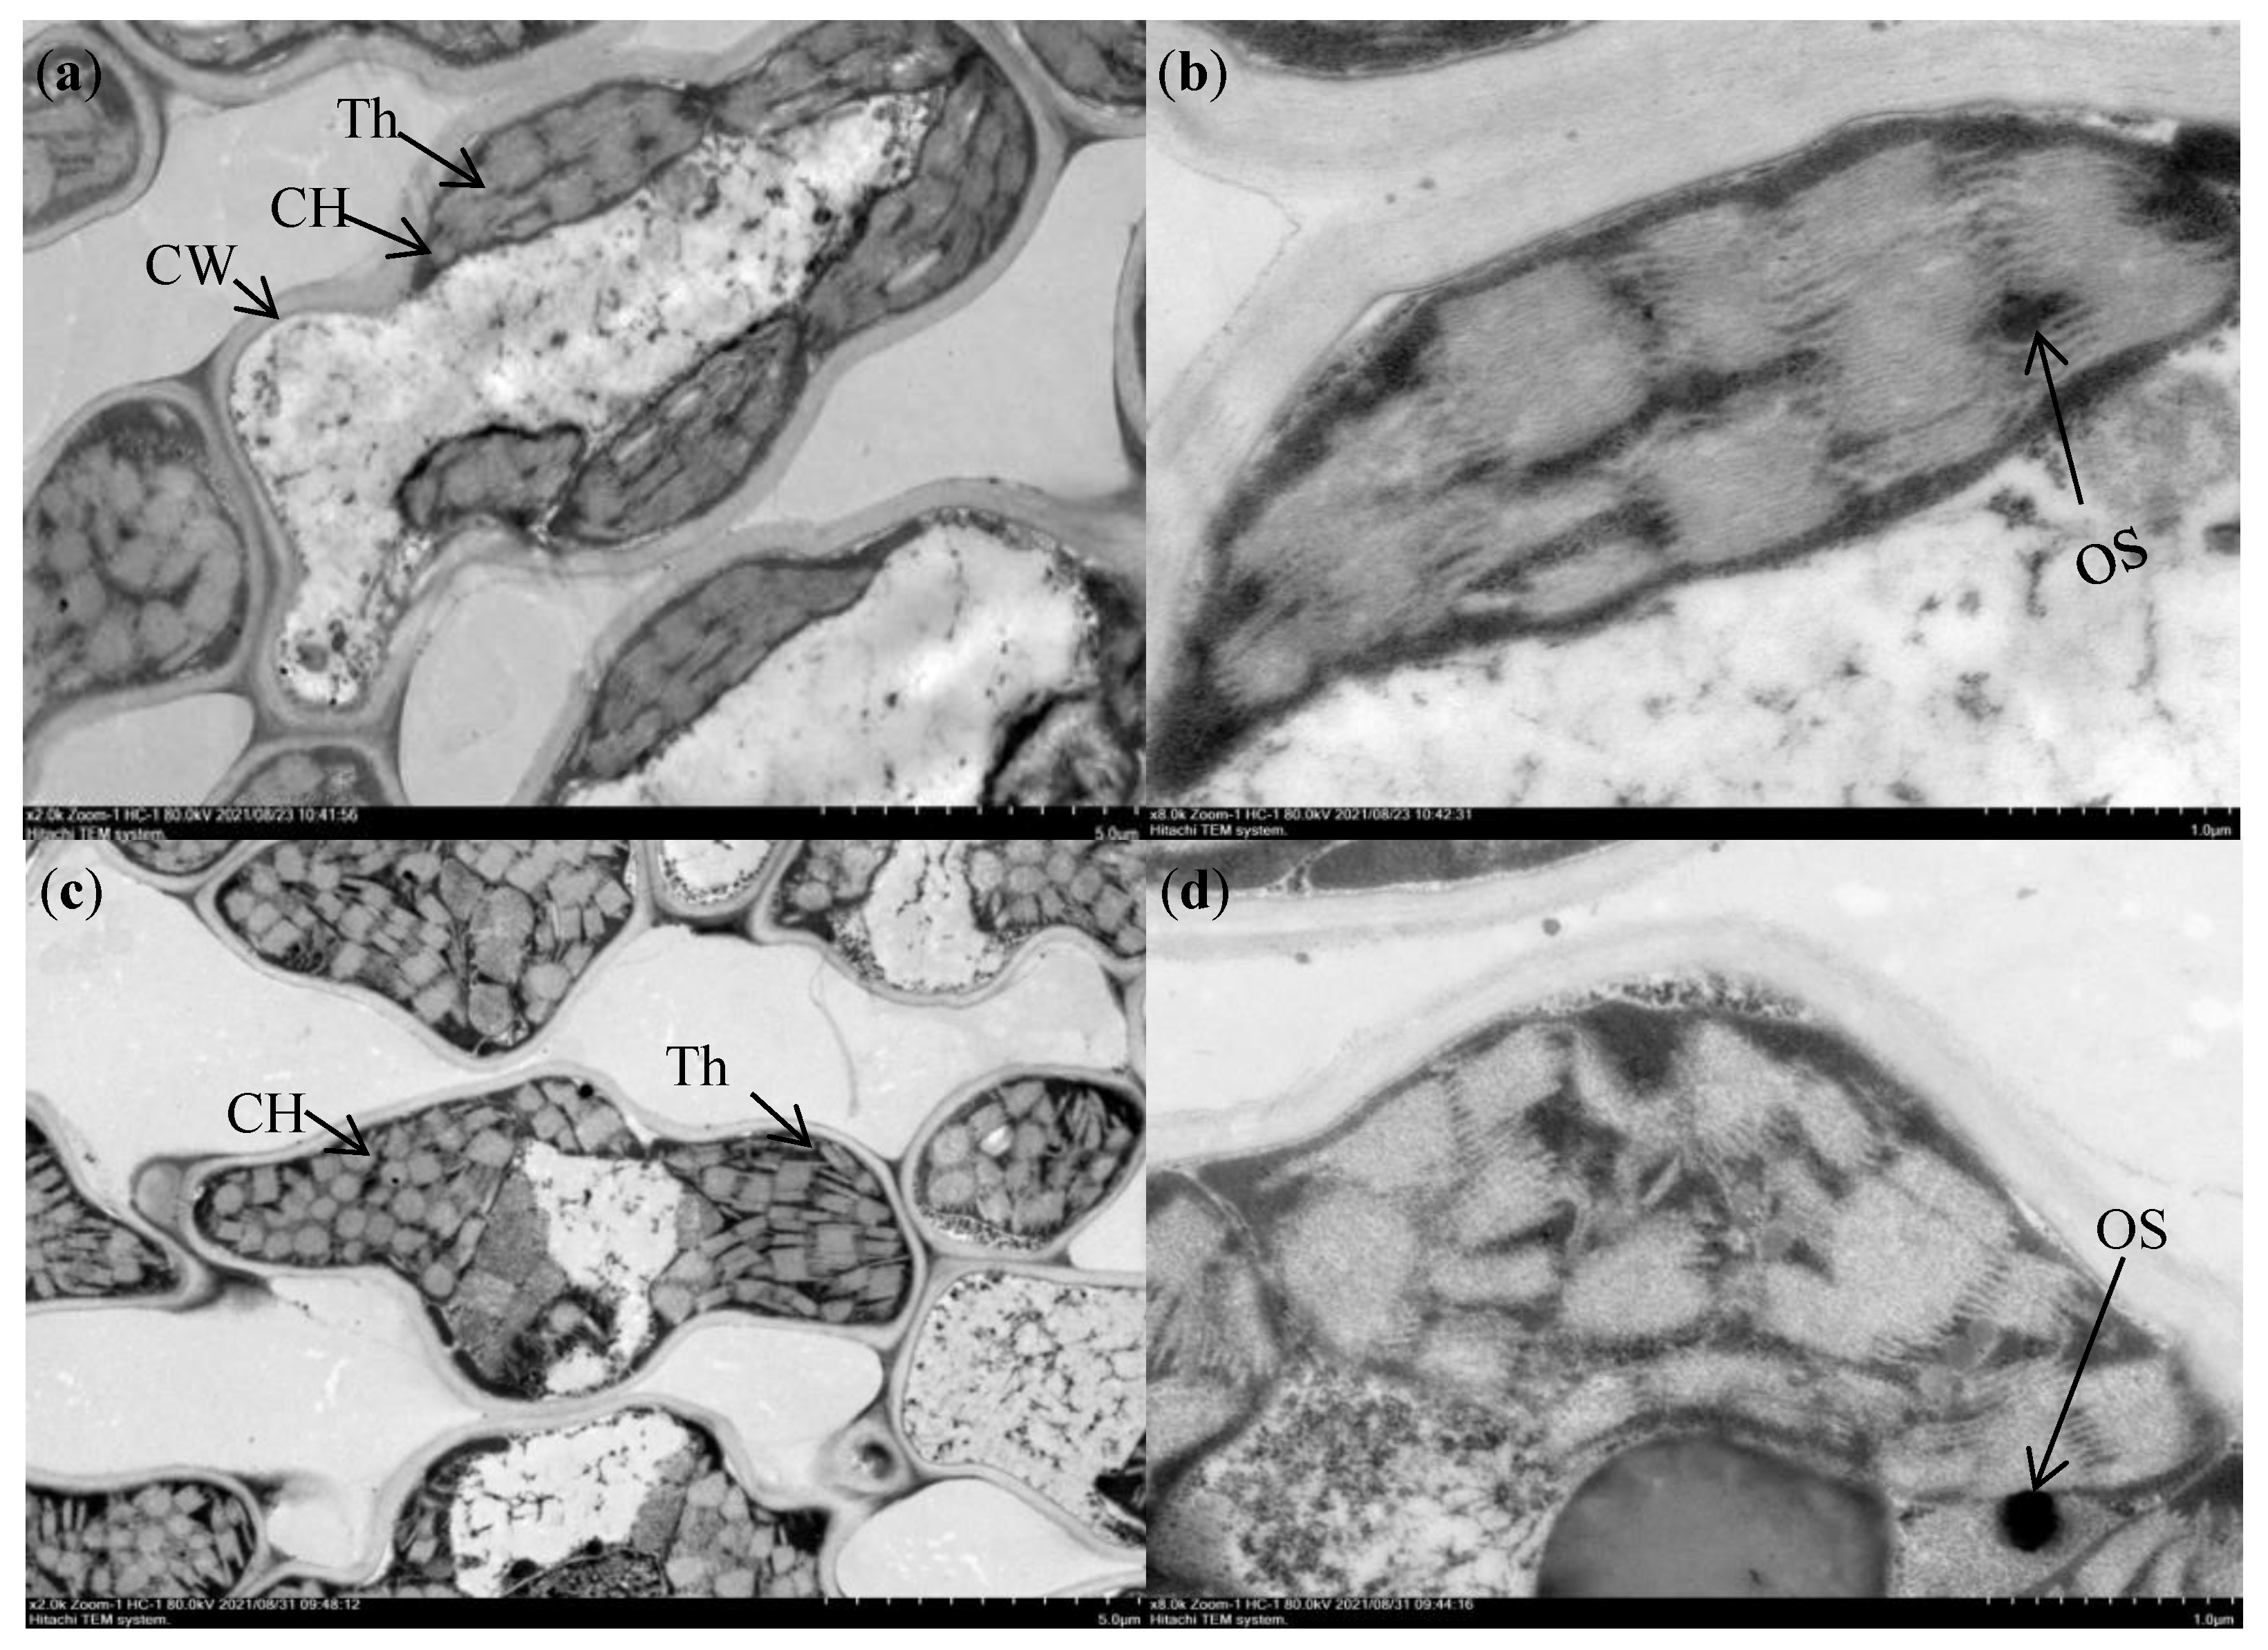
2.2.2. Chloroplast Ultrastructure

Ten sword leaves of each material were subjected to electron-microscope ultrastructure observation. The rapier leaves were interrupted at the heading and flowering stage, and 4–5 small strips with a width of 1 mm and length of 2–3 mm were cut with sharp scissors and immediately placed in pre-cooled 2.5% (pH 7.2) glutaraldehyde for pumping until they sank. After 2 h, the leaves were rinsed three times with 0.1 mmol L−1 phosphate buffer (pH 7.4) for 15 min each time and then dehydrated with gradient-concentration acetone, impregnated with epoxy resin, and embedded. After polymerization into embedding blocks, the leaves were cut into 60–80 nm ultrathin sections on a Leica UC7 ultramicrotome (Leica Microsystems CMS GmbH, Wetzlar, Germany), sliced with a 150-mesh copper mesh, and double stained with uranyl acetate and citric acid. Finally, images were collected and analyzed under a HITACHI HT7800 transmission electron microscope (Hitachi High-Technologies Ltd., Narco, Japan).

2.3. Physiological Indicators

2.3.1. Photosynthetic Characteristics

Photosynthetic characteristics of Pn, stomatal conductance (Gs), intercellular CO2 concentration (Ci), and transpiration rate (Tr), were measured using an LI-6400XT portable photosynthesis measurement system (Li-6400 XT, LI-COR Inc., Lincoln, NE, USA). The following method of measurement was used. During the heading and flowering stage, the light intensity was set at 1500 µmol m−2 s−1, the temperature was 28 °C, the CO2 concentration was 380 µL L−1, and gas flow rate was set to 500 µmol s−1. The upper and middle leaf parts were selected for measurement, with three replicates per plant.

2.3.2. Chlorophyll Fluorescence Parameters

Three sword leaves with the same growth at the heading and flowering stages were selected, dark-adapted for 30 min, and measured using the LI-6400XT portable photosynthesis measurement system (Li-6400 XT, LI-COR Inc., Lincoln, NE, USA), with measurements performed three times. The minimal fluorescence (F0), maximum fluorescence (Fm), minimal fluorescence in light (F0’), maximal fluorescence in light (Fm’), fluorescence in the stable state (Fs), the maximum photochemical quantum yield of photosystem II (PSII) (Fv/Fm), and the photochemical burst (qP) were calculated from the measured values [8]. Photo chemical quenching (qP), non-photochemical quenching (NPQ), electron transport rate (ETR), and the fraction of absorbed light energy used for pigment dissipation in the PSII antennae (%D) were determined, where Fv/Fm = (Fm − F0)/Fm, ΦPSII = (Fm’ − Fs)/Fm’, qP = (Fm’ − Fs)/ (Fm’ − F0’), and NPQ = (Fm − Fm’)/Fm’.

2.3.3. Chlorophyll Content SPAD and RSP

Chlorophyll content was measured using a SPAD-502 Plus chlorophyll meter (Konica Minolta, INC., Tokyo, Japan). The middle of the leaf and the upper and lower leaf parts were about 3 cm away from the middle and were each measured once (avoiding the midvein of the leaf), and the average of three measurements was calculated as the SPAD measurement value of the leaf. RSP was measured during the period from the leaf sheath of the sword leaf until the yellowing of the leaf, with chlorophyll content measured by SPAD-502 Plus chlorophyll analyzer.

2.3.4. Rubisco Enzyme Activity and Content

Rubisco enzyme activity and content were determined following the method of Li et al. [9].

2.4. iTRAQ Proteomics

2.4.1. Protein Extraction, Trypsin Digestion and iTRAQ Labeling

Samples were ground with liquid nitrogen and then the powder was transferred to a 5 mL centrifuge tube and sonicated three times on ice in lysis buffer using a high intensity ultrasonic processor (Scientz, Ningbo, China). An equal volume of tris-saturated phenol (pH 8.0) was added and mixed. After centrifugation (4 °C, 10 min, 12,000× g), the upper phenol phase was transferred to a new centrifuge tube. At least four volumes of ammonium sulphate-saturated methanol were added to precipitate the protein and the mixture was incubated at −20 °C for at least 6 h. The remaining precipitate was washed with ice-cold methanol, followed by three washes of ice-cold acetone. The precipitated protein was redissolved in 8 M urea, and the protein concentration was determined using a BCA kit (A045-4-2, NanJing JianCheng Institute of Biological Engineering Ltd., Nanjing, China).
The protein solution was reduced with 5 mM dithiothreitol for 30 min at 56 °C, and then alkylated with 11 mM iodoacetamide for 15 min at room temperature in the dark. The protein sample was diluted into 100 mM triethylammonium bicarbonate (TEAB) urea at a concentration of less than 2 M. Finally, trypsin was added at a 1:50 trypsin-to-protein mass ratio for overnight digestion, followed by a second addition at a 1:100 trypsin-to-protein mass ratio and digested for 4 h.
After trypsin digestion, the peptide solution was desalted by Strata × C18 SPE column (Phenomenex) and vacuum-dried. The peptides were reconstituted in 0.5 M (TEAB) and processed according to the iTRAQ kit manufacturer’s protocol. Briefly, one unit of iTRAQ reagent was thawed and reconstituted in acetonitrile. The peptide mixtures were then incubated at room temperature for 2 h, pooled, desalted, and dried by vacuum centrifugation.

2.4.2. High-Performance Liquid Chromatography (HPLC) Fractionation

High-pH reverse-phase HPLC was utilized to separate the tryptic peptides using an Agilent 300 Extend C18 column (5 µm particles, 4.6 mm ID; 250 mm length). The peptides were initially divided into 60 sections over the course of 60 min using a gradient of 8% to 32% acetonitrile (pH 9.0). Then, the peptides were divided into 18 sections and vacuum centrifuged dried.

2.4.3. Liquid Chromatography (LC) Tandem Mass Spectrometry (MS/MS) Analysis

The tryptic peptides were dispersed in 0.1% formic acid (solvent A) before being immediately put onto a home-made reversed-phase analytical column (15 cm length, 75 µm i.d.). An EASY-nLC 1000 ultra-performance LC (UPLC) system was used to complete the gradient, which involved increasing solvent B from 6% to 23% (0.1% formic acid in 98% ace-tonitrile) over the course of 26 min, from 23% to 35% in 8 min, to 80% in 3 min, and then holding it at 80% for the final 3 min. The peptides were subjected to NSI source followed by MS/MS in Q ExactiveTM Plus (Thermo Fisher Scientific Inc., Bremen, Germany) coupled online to UPLC. The electrospray voltage applied was 2.0 kV. Intact peptides were found in the Orbitrap with a resolution of 70,000 in the m/z scan range of 350 to 1800. The fragments were detected in the Orbitrap at a resolution of 17,500 after peptides were then selected for MS/MS using the NCE setting at 28. A data-dependent procedure alternated between one MS scan followed by 20 MS/MS scans with 15.0 s dynamic exclusion. Automatic gain control was set at 5 × 10⁴ and a fixed first mass was set as 100 m/z.

2.4.4. Database Search

The search engine MaxQuant was used to process the generated MS/MS data (v.1.6.15.0). Tandem mass spectra were compared with the 20,422 entries SwissProt database concatenated with reverse decoy database. The cleavage enzyme, trypsin/P, was designated and permitted up to two missed cleavages. The mass tolerance for precursor ions was set as 20 ppm in first search and 5 ppm in the initial search, and the mass tolerance for fragment ions was set as 0.02 Da.

2.5. Bioinformatics Analysis

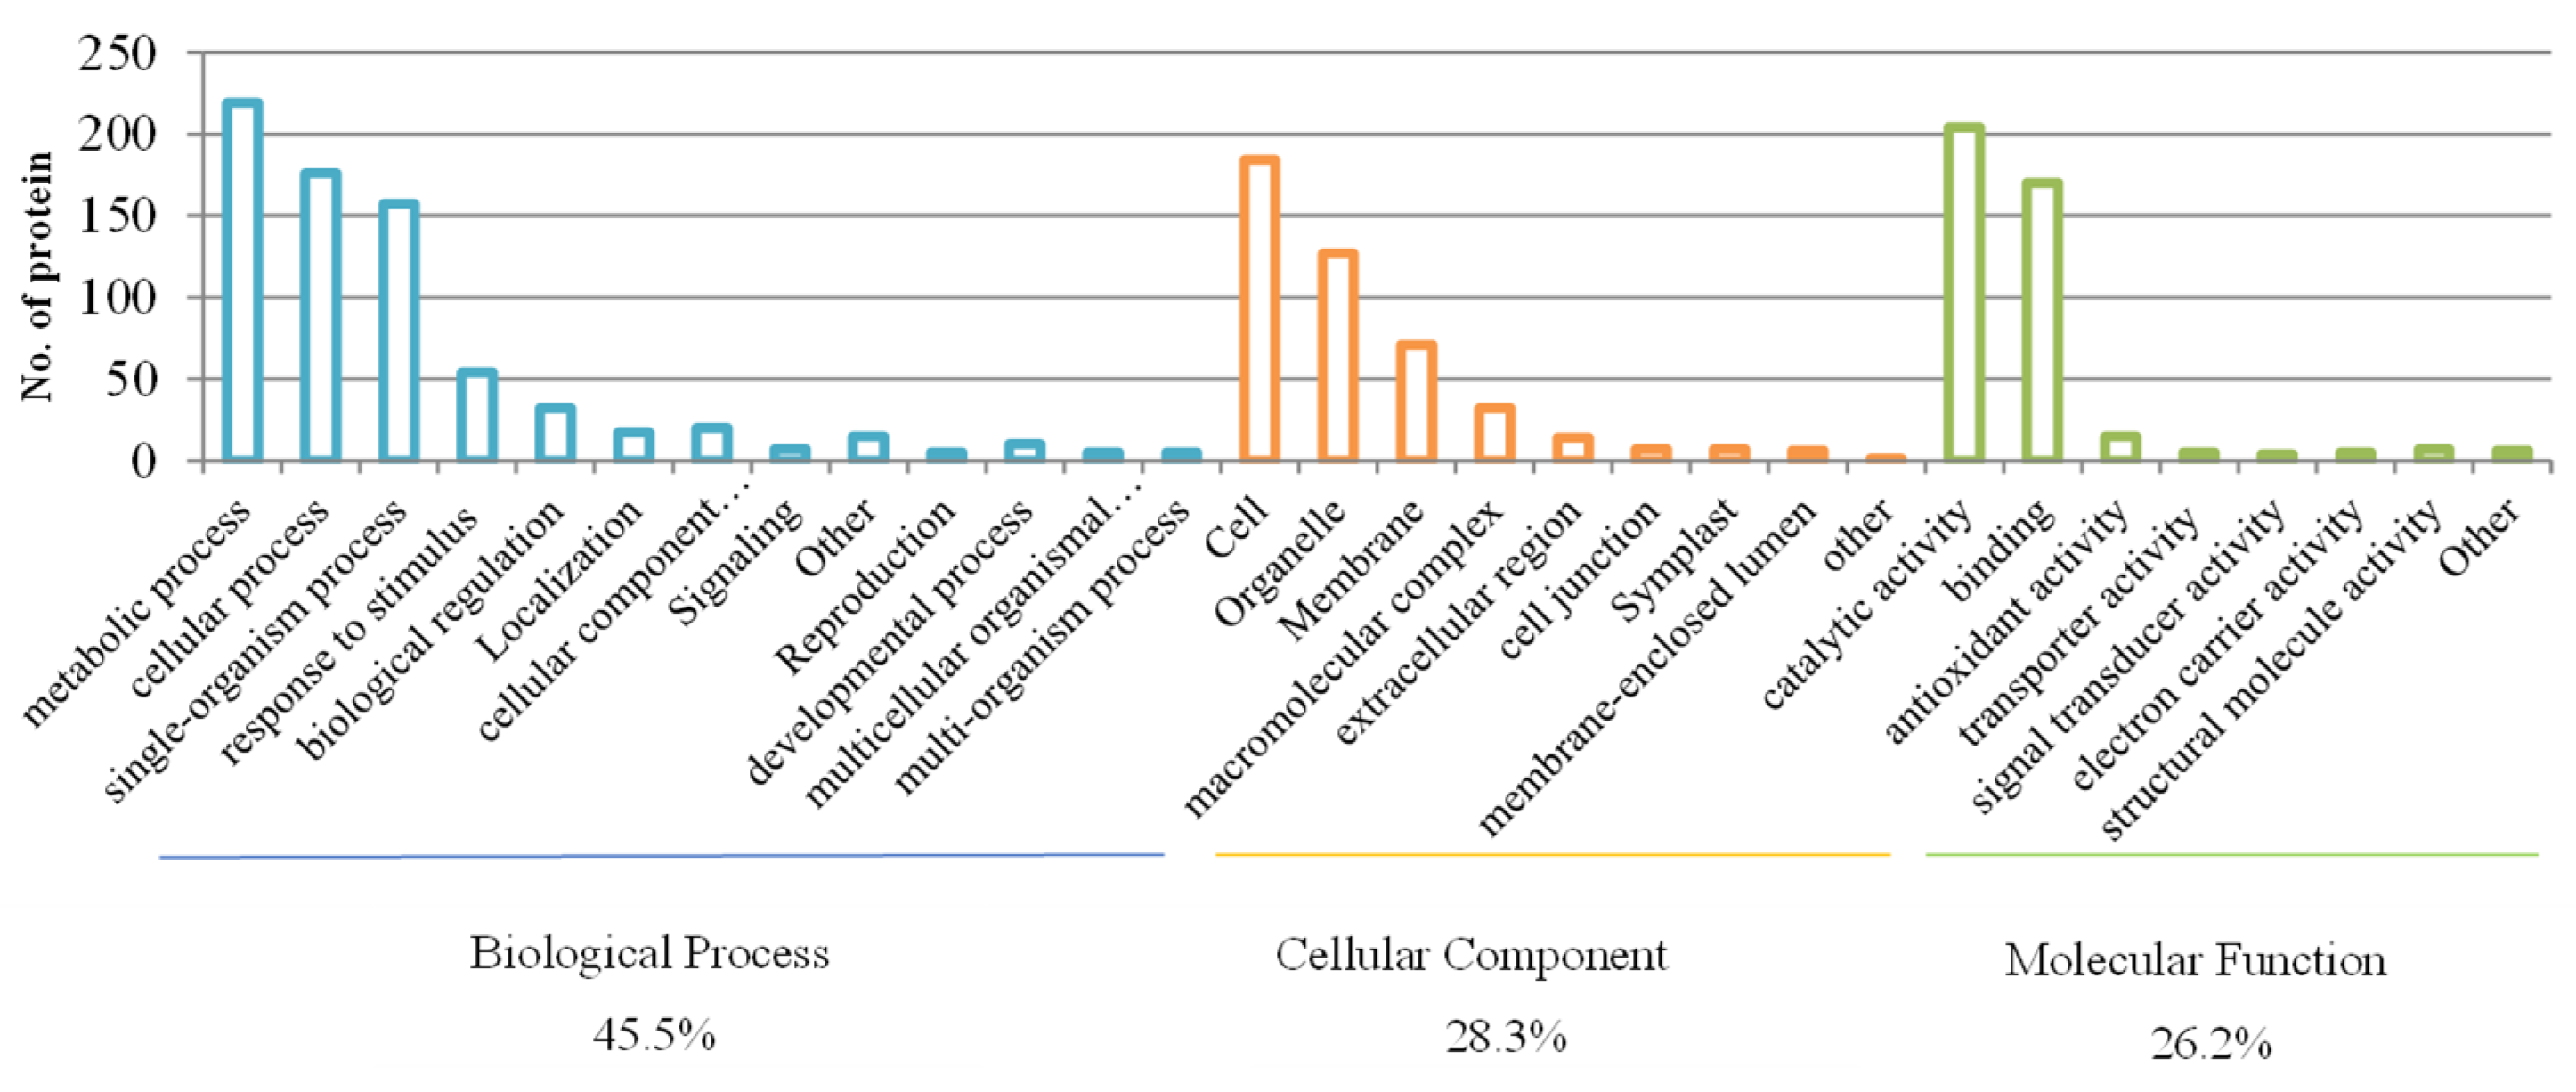
2.5.1. Gene Ontology (GO) Annotation

Proteomic data were obtained from the UniProt-GOA database (http://www.ebi.ac.uk/GOA/, accessed on 14 September 2021). First, each identified protein ID was converted to UniProt ID and then mapped to GO IDs. If several identified proteins were not annotated by the UniProt-GOA database, InterProScan software was used to annotate the protein’s GO functional property based on protein-sequence alignment. Then, the proteins were classified by GO annotation into three categories: biological process, cellular component, and molecular function.

2.5.2. Domain Annotation

The identified protein domains and functional descriptions were annotated using InterProScan (a sequence analysis application) based on protein sequence alignment and using the InterPro domain database (http://www.ebi.ac.uk/interpro/, accessed on 14 September 2021). This database integrates diverse information about protein families, domains, and functional sites central to the database are diagnostic models, known as signatures, against which protein sequences can be searched to determine their potential function. InterPro can be used for the large-scale analysis of whole and meta-genomes and characterization of individual proteins.

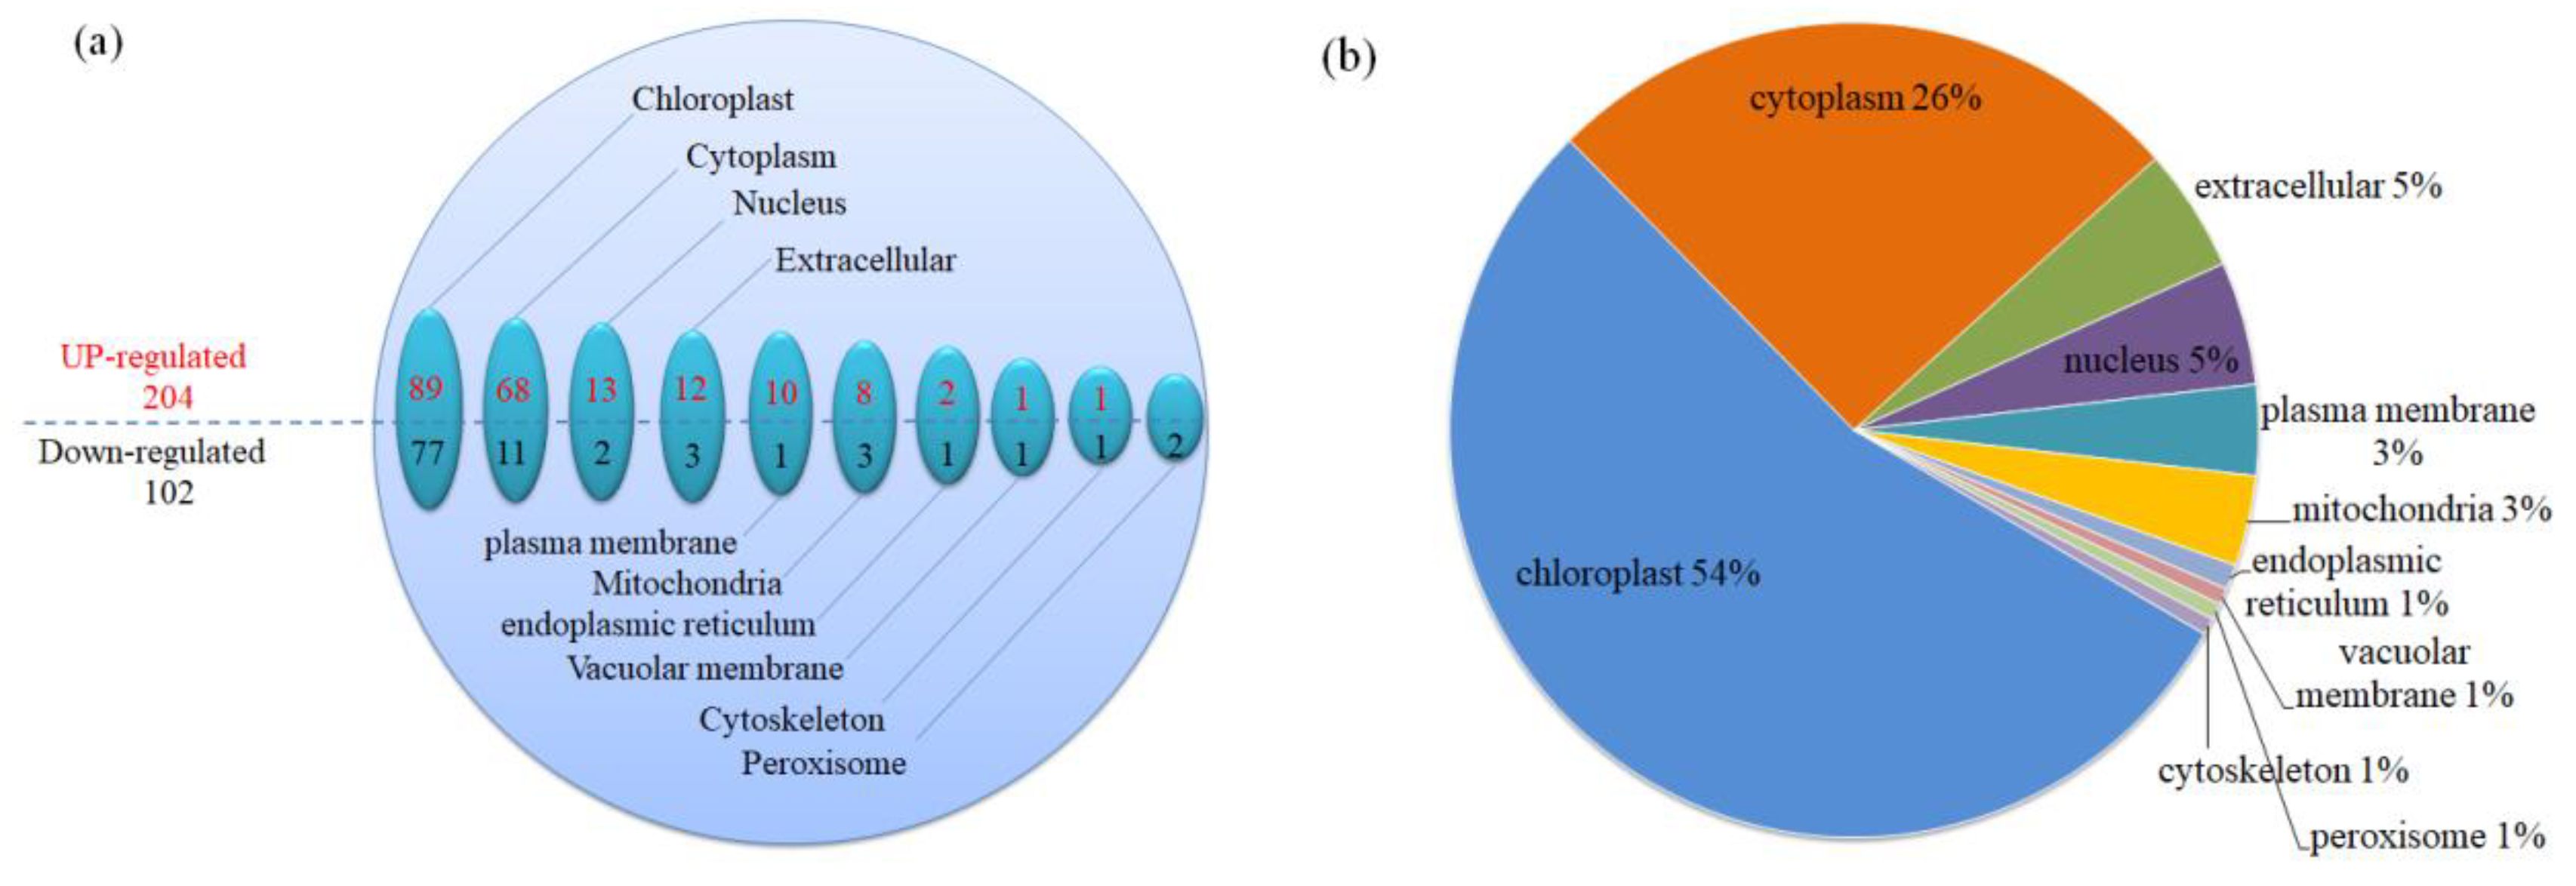
2.5.3. Sequence Subcellular Localization

We used WoLF PSORT, a subcellular localization prediction software (v.1.0 https://wolfpsort.hgc.jp/, accessed on 14 September 2021), to predict subcellular localization.

2.5.4. Enrichment of GO Analysis

Proteins were classified by GO annotation into three categories: biological process, cellular compartment, and molecular function. For each category, a two-tailed Fisher’s exact test was employed to test the enrichment of differentially expressed proteins against all identified proteins. GO values with a corrected p-value < 0.05 were considered significant.

2.5.5. Enriched Pathway Analysis

The Kyoto Encyclopedia of Genes and Genomes (KEGG) database was used to identify enriched pathways by a two-tailed Fisher’s exact test to assess the enrichment of differentially expressed proteins against all identified proteins. A pathway with a corrected p-value < 0.05 was considered significant. These pathways were classified into hierarchical categories as described on the KEGG website.

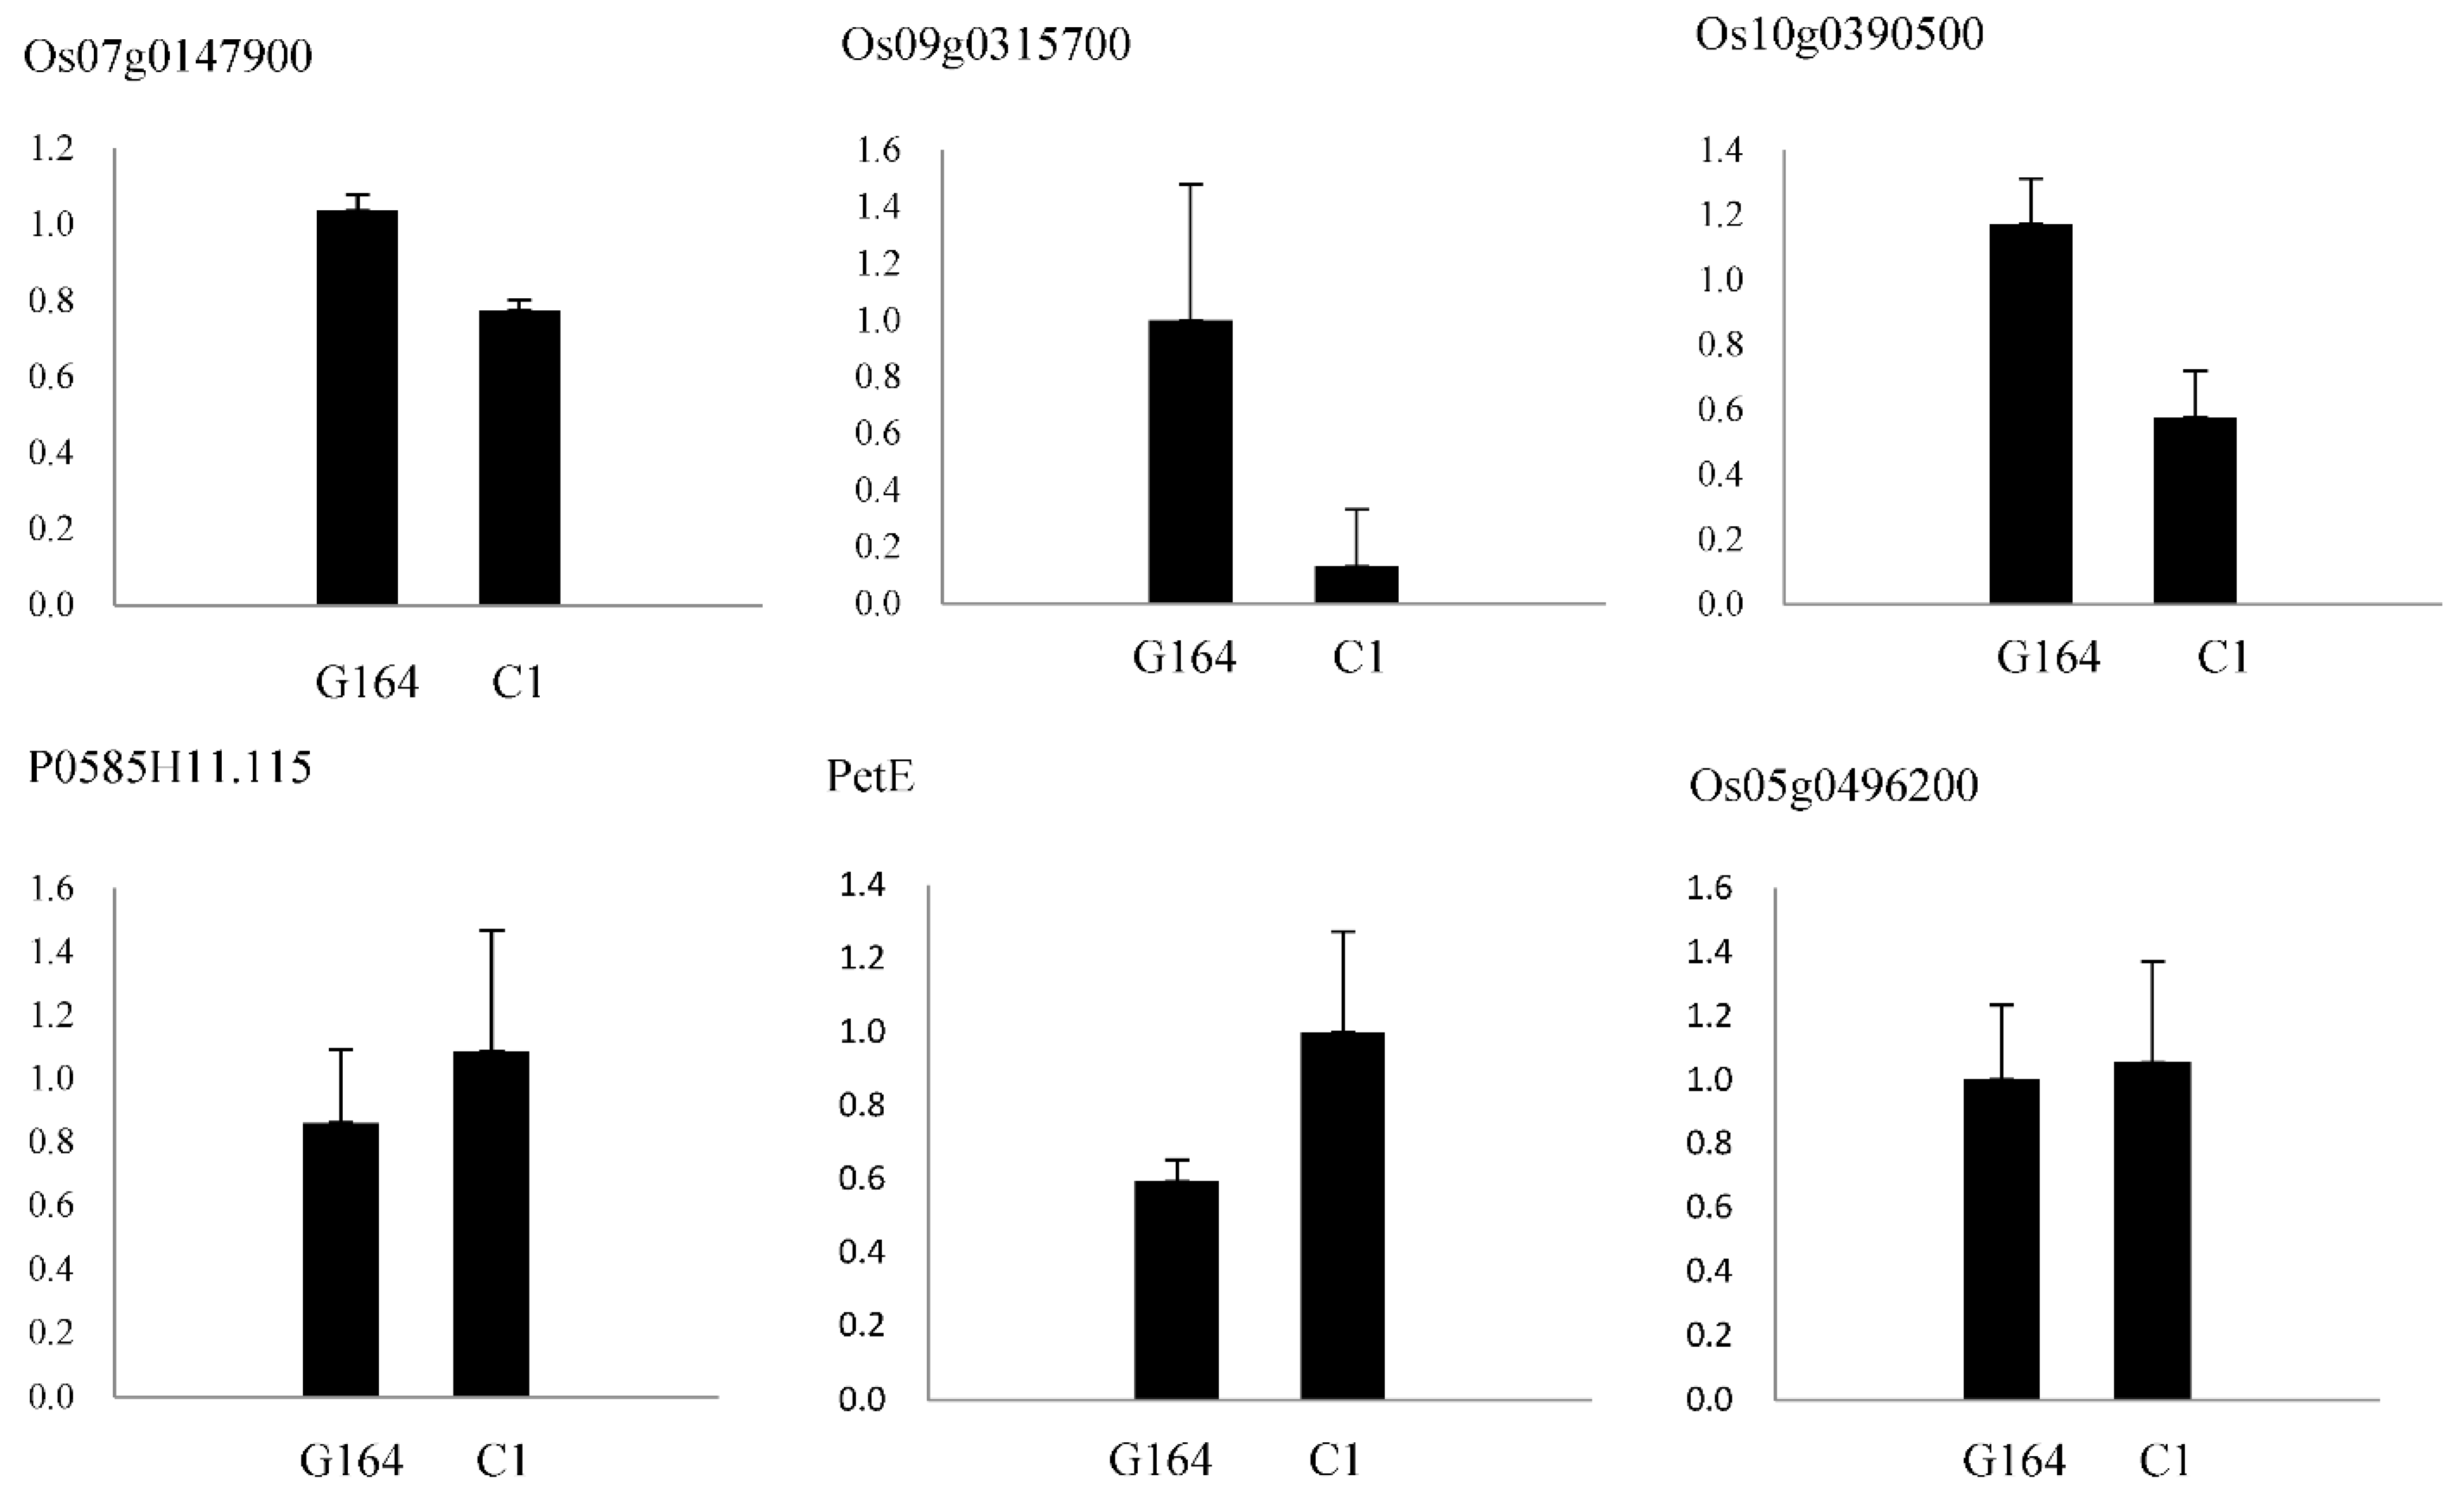
2.6. Real-Time Quantitative PCR Analysis

RNA was extracted with a kit (RA106-02, Biomed Genetic Technology Co., Beijing, China) and measured by real-time quantitative PCR (qRT-PCR) assay. The GAPDH gene was used as the reference control in the study. All qRT-PCR reactions were performed using a CFX96 system (Bio-Rad laboratories, Inc., Singapore).

2.7. Statistics and Analysis

The experimental data were analyzed and processed using Microsoft Office Excel 2010, and SPSS 19.0 was used for significance analysis. Analysis of variance (ANOVA) was performed using the least significant difference LSD test, which at the 0.01 and 0.05 level were used to determine the difference between the means of each treatment. In proteomics, the fold change value of differential proteins was tested by t-test.

3. Results

3.1. Differences in Leaf Structure

Table 1 shows that compared to G164, C1 had higher stomatal density, stomatal size, LT, and numbers of big vascular bundles (BCBs) and small vascular bundles (SCBs), whereas the areas of BCB and SCB, vessel (V) diameter, and size of mesophyll cells were higher in G164 than C1 (Figure 1). C3 plants perform photosynthesis in mesophyll cells, and vascular bundle cells transport metabolic-related products to leaf veins and provide structural support for leaves [10]. The results show that photosynthetic rate is more closely related to the numbers of BCB and SCB, and the stomatal characteristics.

3.2. Differences in Chloroplast Ultrastructure

The chloroplasts (Ch) of C1 sword leaves were neatly arranged in a spindle shape in the mesophyll cells. The thylakoid (Th) structure was complete, orderly, and densely arranged, and the lamellae were thick and compact along the long axis of the Ch. In contrast, the envelope and stroma in G164 Ch were separated, the edges were irregular, and their lamellae were irregularly arranged (Figure 2). The vesicle-like lamellae were not uniformly arranged, the lamellae were thinner than those in C1, and the light-catching ability was relatively weak.

3.3. Differences in Chlorophyll Value and Photosynthetic Rate

The difference in the photosynthetic efficiency (Pn) values between C1 and G164 was 3.26-fold, a significant difference. The RSP and SPAD values of C1 were 35.2% and 21.2% higher than those of G164, respectively. The RSP values were highly significantly different and the SPAD values were not significantly different between the two varieties (Figure 3).

3.4. Differences in Chlorophyll Fluorescence Parameters and Rubisco

Chlorophyll fluorescence parameters of Fv/Fm, qP, ETR, and ΦPSII, were higher in C1 than in G164, and NPQ was higher in G164 than in C1, but these differences were not significant. In the heading and flowering stage, the activity and content of the key photosynthetic enzyme Rubisco in the sword leaves were higher in C1 than G164, with a significant difference in Rubisco activity between the two varieties (Table 2).

3.5. Proteomic Analysis of Different Germplasm Resources

3.5.1. Protein Identification and GO Analysis

The rice varieties C1 and G164 were next subjected to proteomic analysis by iTRAQ technology. Using 1.2-fold as the change threshold and a t-test p-value < 0.05, three groups of repeats were compared. A total of 204 proteins showed up-regulated expression and 102 showed down-regulated expression in G164 compared to C1. Based on the GO annotation, the identified proteins were classified into three large categories of biological processes, cellular components, and molecular functions (45.5%, 28.3%, and 26.2%), and 30 small groups (Figure 4). The top three categories in each functional group were as follows: metabolic, molecular, and single biological processes in the biological process category; catalytic activity, binding, and antioxidant activity in the molecular function category; cells, organelles, and cell membranes in the cellular component category. The groups include 27 proteins related to photosynthetic operation: compared with G1, there are nine up-regulated proteins and 18 down-regulated proteins in G6 (Table 3).
Photosynthesis occurs in the chloroplasts, and the analysis revealed that most of the differential proteins are distributed in chloroplasts. Other differentially expressed proteins are found in the cytoplasm, nucleus, and mitochondria (Table 3). Compared with C1, G164 had ten differential proteins associated with photosynthetic electron transport in the photosynthetic pathway, with nine down-regulated proteins and one up-regulated protein. The down-regulated differential proteins included one ferredoxin (Fd) and three ferredoxin-NADP+ reductases (FNR), which are present on the vesicle-like surface; three PS II compound proteins (PSB28, PSB27, PSBP); two cytochrome b6-f complex iron-sulfur subunits (cytb6); and one plastocyanin (PC). Compared with C1, a total of 17 differential proteins were associated with CO2 fixation in G164. Among these differential proteins, nine were up-regulated: two phosphoenolpyruvate carboxylases (PPC), one alanine transaminase (GPT), three malate dehydrogenases (MDH), one fructose-1,6-bisphosphatase I (FBP), one phosphoglycerate kinase (PGK), and one glyceraldehyde 3-phosphate dehydrogenase (GAPDH). There were eight down-regulated differential proteins: one triosephosphate isomerase (TPI), two glutamate–glyoxylate aminotransferases (GGAT), two malate dehydrogenases (MDH), phosphoglycerate kinase (PGK), two glyceraldehyde-3-phosphate dehydrogenase (NADP+) (GAPA), and ribulose-bisphosphate carboxylase small chain (RuBisCO, rbcS). Interestingly, the proteomics revealed that the C4 key enzyme PEPC exhibited a higher content in G164 than in C1.

3.5.2. Classification of Subcellular Structure Localization

Subcellular structure prediction and classification were performed for differentially expressed proteins using WoLF PSORT software V1.0 (Figure 5). A total of 89 and 77 of the up-regulated and down-regulated proteins, respectively, were distributed in the chloroplasts in G164 compared to C1 (Figure 5a). The chloroplasts are the most widely distributed of the subcellular structures (Figure 5b).

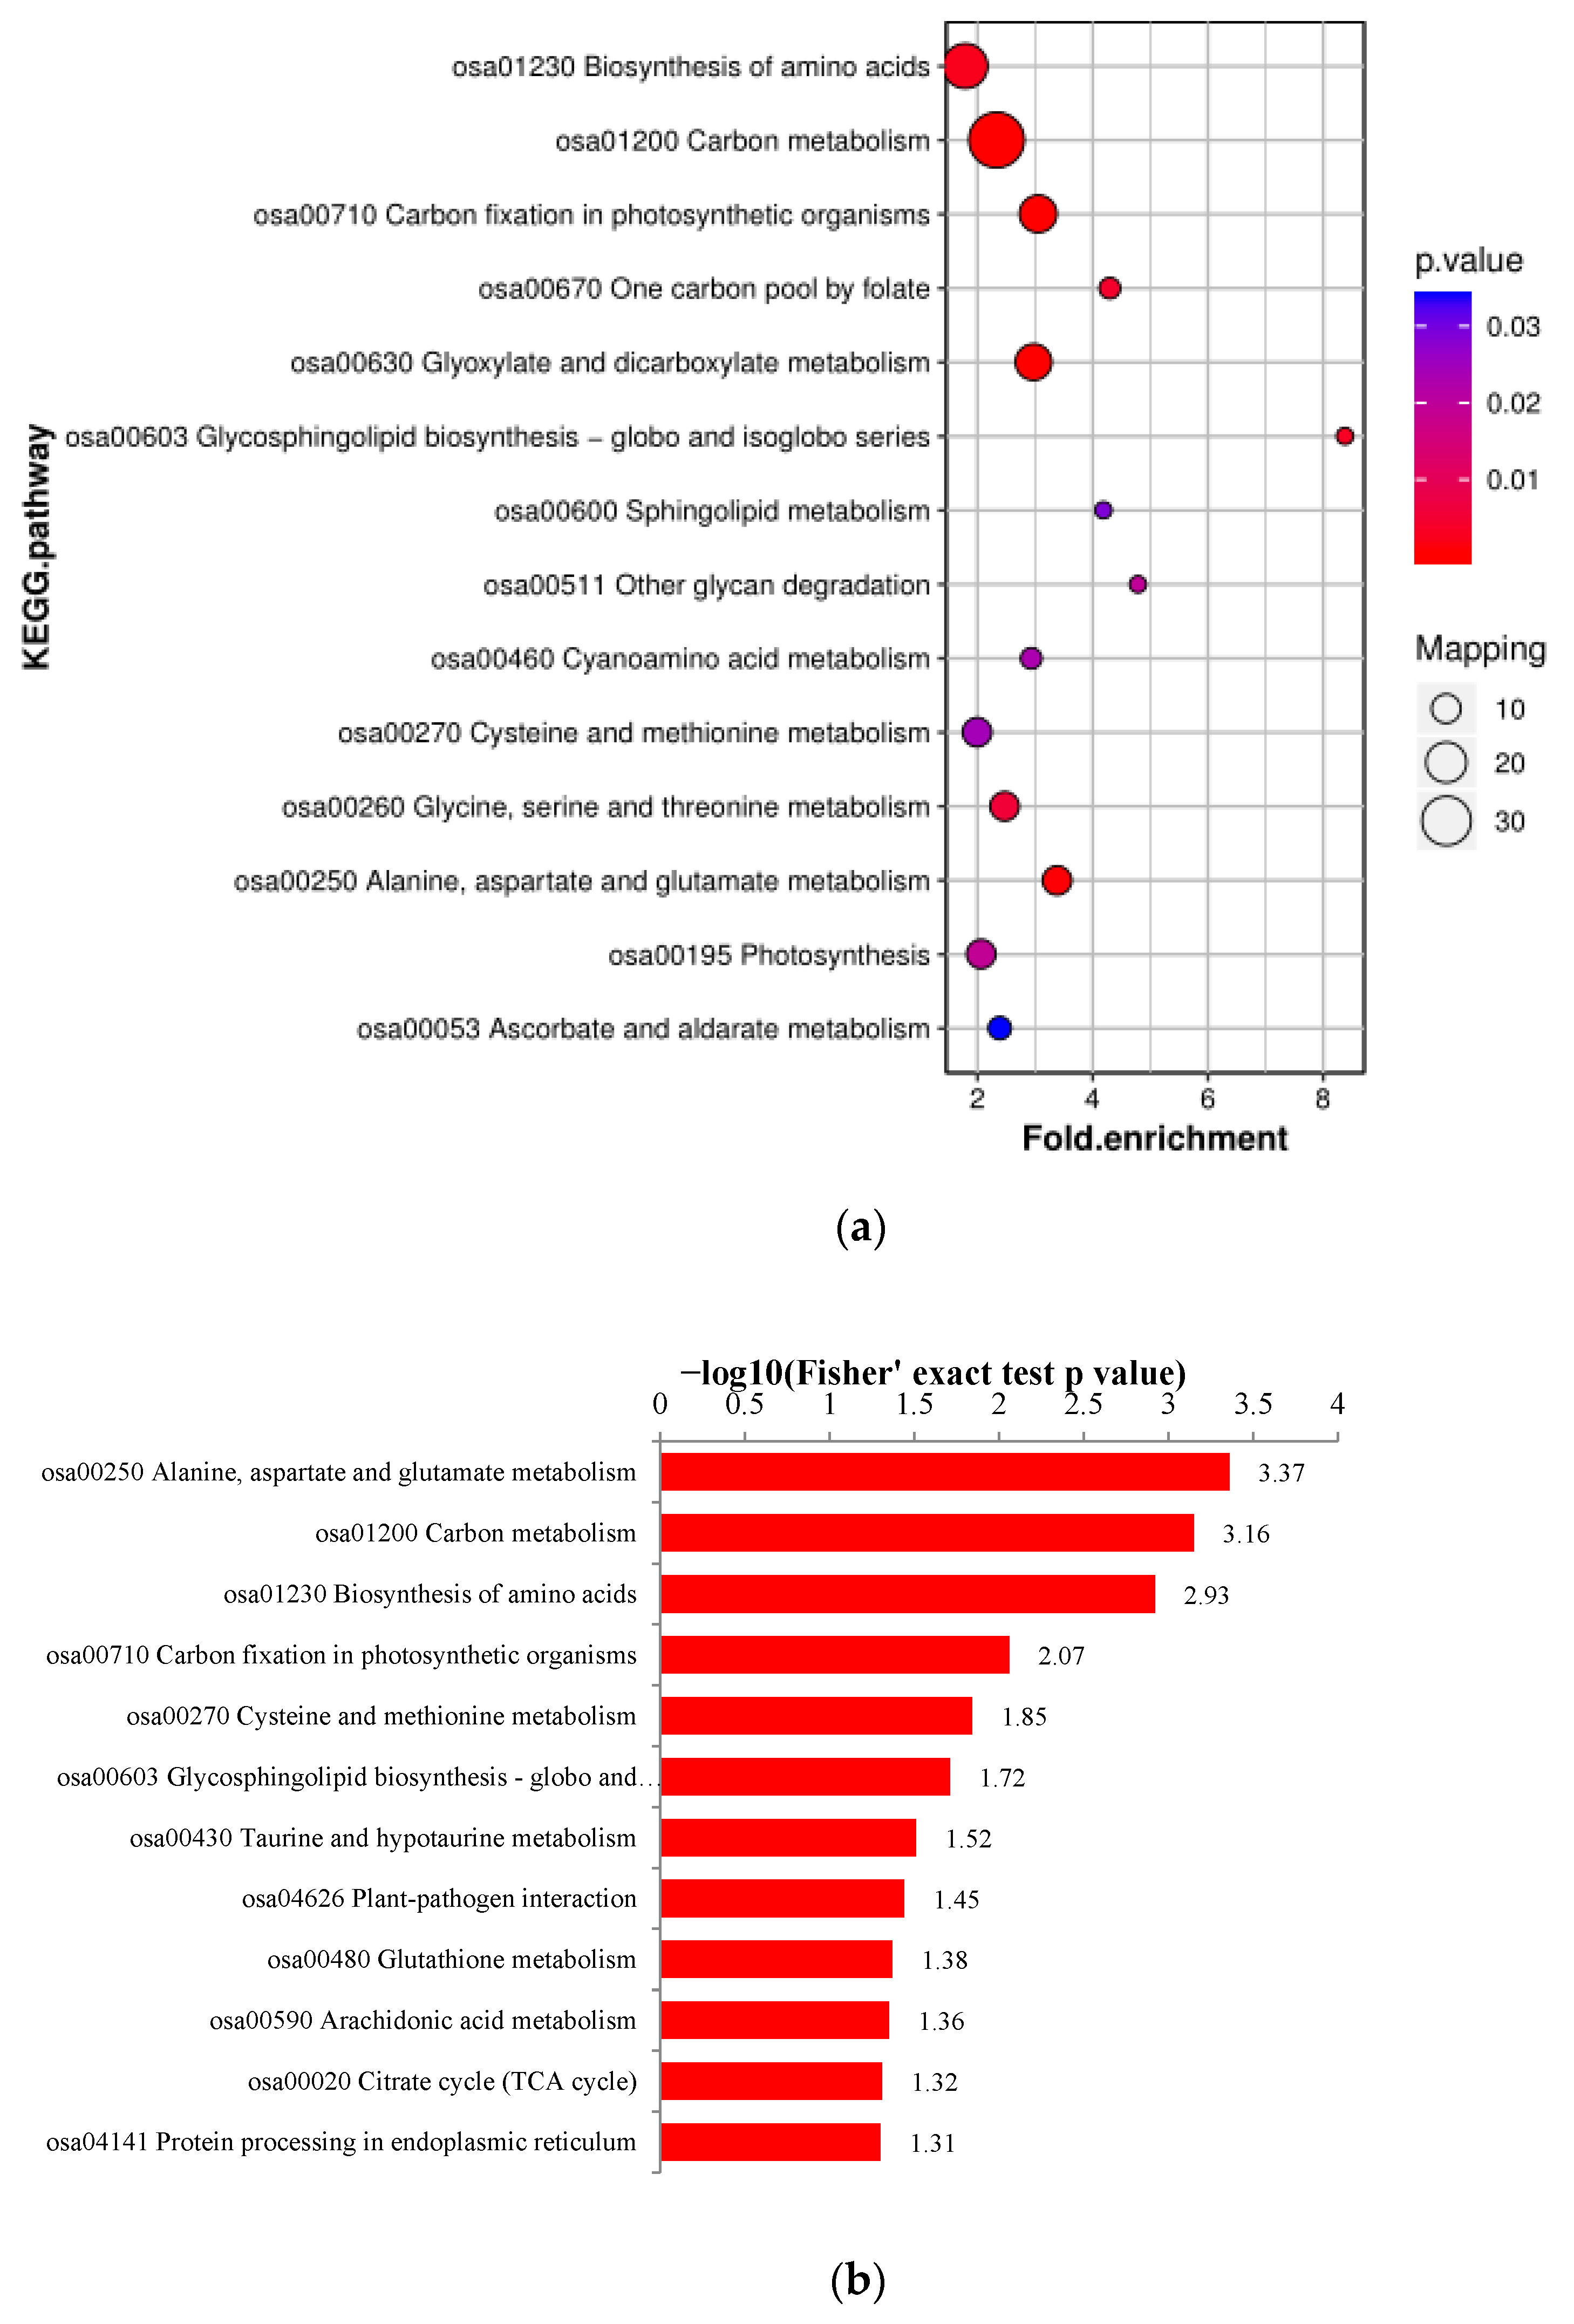
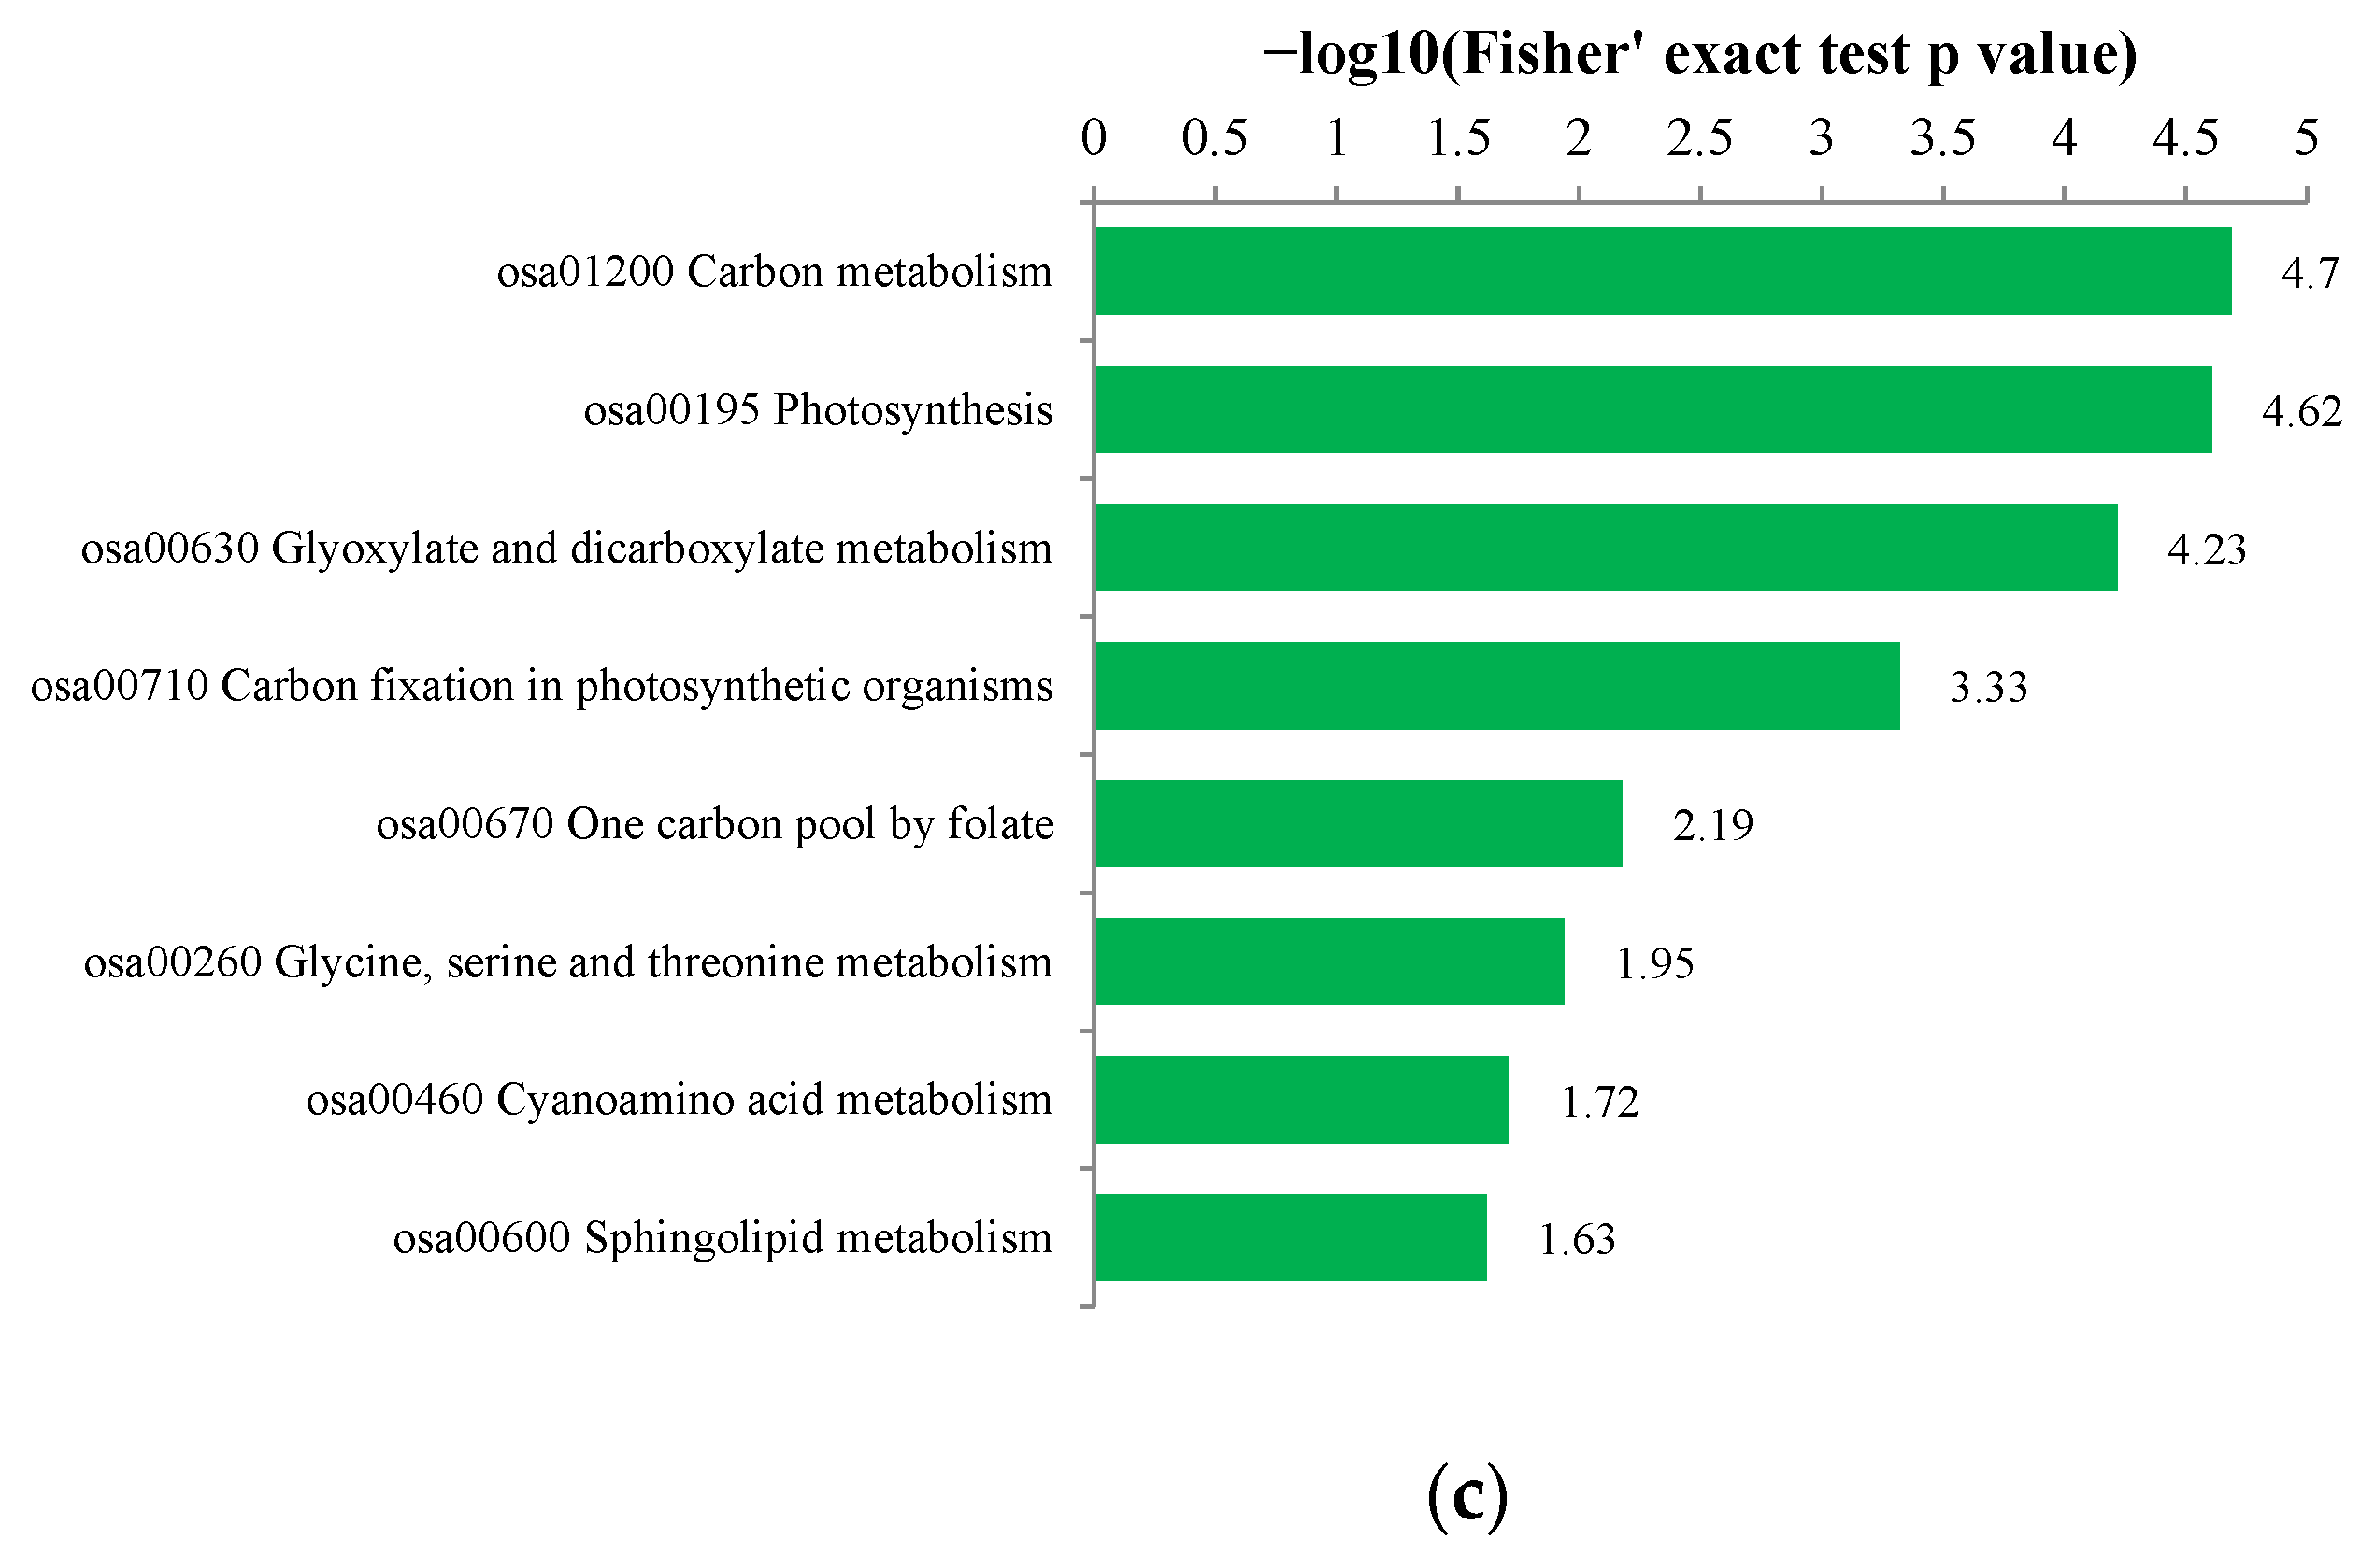
3.5.3. KEGG Analysis

The KEGG information network includes known molecular interactions, such as metabolic pathways, complexes, and biochemical reactions. Based on KEGG pathway differential protein enrichment (Figure 6a), the most enriched protein metabolic pathway is carbon metabolism (osa01200), the second highest enriched metabolic pathway is the biosynthesis of amino acids (osa01230), followed by carbon fixation in photosynthetic organisms pathway (osa0710), and the glyoxylate and dicarboxylate metabolism pathway (osa00630), with thirty-eight, twenty-five, seventeen, and fourteen enriched proteins, respectively; all were enriched at a very significant level. The photosynthesis pathway (osa00195) was also significantly different, with eleven enriched proteins. The metabolic pathways associated with photosynthesis are carbon fixation in photosynthetic organisms (osa01200) and photosynthesis (osa00195). KEGG pathways of up-regulated and down-regulated proteins related to photosynthesis are shown in Figure 6b,c, respectively. Values on the horizontal axis are negative log-transformations of significant p-values (p < 0.05).
Differentially expressed genes and proteins were mapped to the “Photosynthesis” and “Carbon Fixation In Photosynthetic Organism” KEGG Pathways. In these pathways, nine genes involved in photosynthesis in rice leaves were selected for real-time PCR validation to determine if gene expression data would confirm the changes in protein abundance. The expression levels of these six genes (Os07g0147900, Os09g0315700, Os10g0390500, P0585H11.115, PetE, and Os05g0496200) were consistent with the proteomic data (Figure 7 and Table 3). Compared to C1, Os07g014790 (petH), Os09g0315700 (ppc), and Os10g0390500 (GPT) were more highly expressed in G164, and P0585H11.115 (GGAT), PetE, and Os05g0496200 (PGK), were expressed at a lower level in G164.

4. Discussion

As a C3 plant, the regulation of photosynthesis in rice involves a complex metabolic network involving stages of light and dark reactions. Photosynthesis occurs in the chloroplasts, an organelle specific to plant cells, and the light reactions of photosynthesis occur in the thylakoid membranes of the chloroplasts. The light reactions of photosynthesis include the absorption and conversion of light energy, water decomposition, electron transfer, reduction of NADP, formation of a proton gradient across the thylakoid membrane, and synthesis of ATP. The dark reaction, or Calvin cycle, occurs in the Ch stroma of the chloroplast cells, and mainly includes the assimilatory force of NADPH and CO2 carboxylation -. The improvement of photosynthesis requires the coordination of these two stages of physiological metabolism for balance of light energy absorption and utilization. Various strategies have been used to improve the photosynthetic capacity in crops, such as increasing the activity of Calvin cycle enzymes to increase the rate of carboxylation [11], increasing the rate of photosynthetic electron transfer across the Th membrane [12], modifying leaf anatomy to improve light energy capture rate and leaf pulp conductance [13], and introduce C4 photosynthetic pathway into C3 crops [14]. More than 80% of rice grain yield comes from the three functional leaves, of which the sword leaf contributes the greatest yield. Therefore, the sword leaves were selected for detailed analysis in this study.

4.1. Effect of Tissue Structure on Pn

The leaf structure provides the structural framework for photosynthesis and gas exchange [15]. Pn is significantly positively correlated with Gs and mesophyll conductance (Gm) [16], which is one of the largest limiting factors of Pn [17,18]. Gs is mainly influenced by stomatal size, density, distribution, and opening, and the higher the stomatal density, the lower the stomatal transmission resistance and the more favorable the improvement of light energy, CO2 utilization efficiency, and gas exchange capacity, thus increasing Pn and potential photosynthetic capacity [19]. In this study, the stomatal density, stomatal size, and the number of vascular bundles of C1 were significantly higher than those of G164, showing that under the same natural conditions, except Gs and Gm, vascular bundle size is not only responsible for the translocation of metabolites into leaf veins and providing structural support, but also had a significant effect on photosynthetic function. This is consistent with the findings of Huang and coworkers [20] suggesting the manipulation of vascular bundles can improve photosynthesis in rice plants. In this study, compared to C1, leaf thickness was greater in G164, though this difference was not significant. As an important leaf structural trait determining leaf photosynthesis, leaf thickness has usually been found to be positively related to Pn [21,22].
Photosynthesis occurs mainly in the chloroplasts of mesophyll cells, as observed from the chloroplast ultrastructure. C1 Mesophyll cells have more chloroplasts, regular thylakoid structure, and complete and orderly arranged lamellae. The high number of cystoid layers increases the contact area with light and enhances the light absorption of chloroplasts function transfer and transformation, which promote the formation and accumulation of photosynthetic products [23]. The neat and tight lamellae shorten the electron transfer distance and improve the ability to capture and absorb light energy and photosynthetic electron transfer rate. This may be an important structural basis for high light efficiency mechanism.

4.2. Effect of Photosynthetic Physiological Indicators on Pn

Photosynthesis in C3 plants can be affected by the activity of Rubisco, ribulose-1,5-bisphosphate (RuBP) regeneration, and release of phosphate during the metabolism of triose phosphate to either starch or sucrose [24]. Rubisco is a key enzyme in determining the photosynthetic capacity of C3 plants. The results of this study showed higher content and activity of Rubisco in C1 than in G164, with enzyme activity significantly different between the two varieties. The photosynthetic capacity of the upper leaves of super hybrid rice showed that Rubisco enzyme activity rather than C determines the photosynthetic capacity of rice leaves. Rubisco content was positively correlated with the photosynthetic rate during plant growth and senescence, and the Rubisco activity of the high yield potential rice variety was significantly higher than that of common varieties. Thus, the Rubisco enzyme activity increased with the increase in stomatal density, with a significant correlation between the two, indicating that increasing stomatal density can promote the activity of Rubisco to improve the potential photosynthetic capacity of rice. This is consistent with greater stomatal density and Rubisco enzyme activity in C1 compared to G164.
Chlorophyll fluorescence parameters not only reflect the absorption, transfer, and dissipation allocation of light by the plant leaf PS but also relate to CO2 fixation, electron transfer, and proton gradient establishment [25]. Fv/Fm reflects the maximum efficiency of using absorbed light energy for chemical reactions in PSII reactions, and can vary depending on pigmentation, cell structure, temperature and light conditions, and nutrient status. The qP value reflects the proportion of PSII pigment absorption for photochemical electron transfer and the level of photosynthetic activity; ΦPSII is often used to reflect electron transfer between PSII and PSI, with the larger the value, the faster the electron transfer efficiency [26]. NPQ reflects the portion of light energy absorbed by PSII antenna pigments that cannot be used for photosynthetic electron transfer so is dissipated in the form of heat; the smaller its value, the smaller the heat dissipation and the more favorable the yield accumulation. The electron transport rate (ETR) value can be used as an important indicator of photosynthesis and reflects the electron transfer efficiency under light conditions. ETR is related to limited RuBP regeneration. In this experiment, Fv/Fm, qP, ETR, and ΦPSII of C1 were higher than those of G164, and NPQ was higher in G164 than in C1, suggesting the physiological basis for the higher light absorption, higher transfer efficiency, fast conversion rate, and photosynthetic efficiency of C1 compared to G164.

4.3. Differential Proteins among High- and Low-Light-Efficiency Germplasm Resources

Identification of the proteins that play crucial roles in photosynthesis and carbon assimilation is required to develop plants with improved photosynthetic performance and enhanced nutritional value [27]. In this study, 27 photosynthesis-related differential proteins were identified by iTRAQ proteomic analysis of sword leaves at the heading and flowering stages (Table 3). Of the 27 proteins, 10 and 17 of the identified proteins are related to photosynthetic electron transport and carbon assimilation, respectively. Electron transport-related proteins include Fd, FNR, cytb6/f, PC, and oxygen release compound proteins (Psb27, Psb28, and PsbP). Under iron deficiency, PSI core, Cytb6/f, and Rubisco were most diminished, followed by OEC and LHCII, thereby further affecting the photosynthetic function of chloroplasts [28]. The down-regulated proteins are essential components of PSI, NDH, and the Cytb6f complex under spaceflight microgravity environmental stresses [29], indicating that photosynthetic function is hindered by compromised electron transport. In the oxygen emission center (OEC), Psb27 is involved in the photorecovery of PSII and promotes the assembly of manganese clusters to PSII. Psb28 is an exogenous protein of PSII that accelerates the photodamage repair of PSII under high temperature and intense light [30]. PsbP (23 kDa) is one of the three subunits of the PSII OEC and affects the assembly and stability of PSII. Enhanced abundance of the ferredoxin NADPH reductase, the 23 kDa polypeptide of photosystem II, and a FtsH-like protein therefore reflect an approach to attenuate aggrieving effects of Na1 on the photosynthetic machinery [31]. This study showed that proteins in the electron transport chain determine the electron transport of PSII to PSI, for improved light-efficiency in germplasm C1. Fan et al. [32] found increased light capture efficiency of PSII but decreased capacity from PSII transmitted to PSI in soybean leaves under shade condition, causing decreased photosynthetic capacity in shading [33]. Overall, the photosynthetic differences in rice germplasm resources mainly depend on light-responsive electron transfer and carbon assimilation in leaves rather than on the light-capture pathway; this result is consistent with that of a previous study by Feng [34].
An important regulatory mechanism of photosynthesis is the control of enzyme levels. Several differential proteins identified in this study act in the CO2 fixation pathway. This study found differences in the levels of enzymes and proteins in the two germplasm resources. The down-regulated differential proteins included phosphoslycerate kinase (PGK), triose phosphate isomera (TPI), glutamate-glyoxylate aminotransferase (GGAT), glyceraldehyde-3-phosphate dehydrogenase (GAPDH), and ribulose-bisphosphate carboxylase small chain (rbcS). These enzymes play a central role in the Calvin cycle, including catalysis, conversion, and carboxylation, and the down-regulation of these proteins resulted in impaired carbon assimilation and reduced photosynthetic efficiency. Interestingly, GGAT is a photorespiration enzyme and when down-regulated, preferentially catalyzes the conversion of glyoxylate to glycine [35]. When leaf stomata are closed or external CO2 concentration is low, the GGAT catalytic rate decreases, affecting carbon recovery in the C3 pathway and indirectly affecting CO2 assimilation.
Among the differential proteins related to carbon fixation, MDHs in chloroplasts (plMDH) were all down-regulated and cytoplasmic MDHs (cMDH) were all up-regulated. The differentially located MDHs have different functions. During carbon fixation, cMDH is involved in pyruvate metabolism, oxidizing malate in the mitochondrial matrix to oxaloacetate and then converting it to sucrose through the sugar xenobiotic pathway to accumulate starch, and plMDH is important for fixing CO2 and increasing photosynthetic yield.
In addition to Rubisco (rbcs), sedoheptulose-1,7-bisphosphatase (SBPase) and fructose-1,6-bisphosphatase (FBPase) were identified by the traditional kinetic parameter method as key enzymes of the Calvin cycle. PGK, TPI, GGAT, GAPDH, and cMDH also play crucial roles in these reactions.
Interestingly, C4 cycle key enzyme phosphoenolpyruvate carboxylase (PEPC) showed a higher level in G164 than in C1. Some experts have reported that the distinction between C3 and C4 plants may not be absolute, and suggested the possible presence of the C4 pathway in C3 plants [36]. Agarie et al. [37] and Fukayama et al. [38] reported that PEPC overexpression actually decreased the final net photosynthetic rate due to the increase in dark respiration rate. Ku et al. [39] transferred pepc and ppdk from maize into rice and found that the photosynthetic capacity of transgenic rice increased by 35%, due to an increase in stomatal CO2 transfer capacity and an increase in internal CO2 concentration. This may explain why the photosynthetic rate was not higher in G164 than in C1.

5. Conclusions

The results indicated that compared with the high Pn germplasm resource C1, the decrease in photosynthesis in the low-light-efficiency germplasm resource G164 is associated with the regulation of leaf structure, Ch ultrastructure, and the levels of proteins related to photosynthesis and the carbon cycle. These results suggest that (1) vascular bundle characteristics, stomata, and Th characteristics have a great influence on the photosynthetic rate; (2) most of the proteins involved in electron transfer from PS II to PSI and several proteins (PGK, TPI, GGAT, clMDH, and GADPH) related to carbon fixation in photosynthetic organisms are closely related to the photosynthetic rate, and increasing the levels of such proteins can effectively enhance Pn; (3) C1 can be used as a donor material for selection of high light efficiency varieties and in-depth photosynthesis studies.

Author Contributions

Conceptualization, T.L.; software, H.W. and R.L.; investigation, X.Z., M.T., Q.W. and L.C.; data curation, W.T. and L.C.; writing—original draft preparation, X.Z. and T.L.; writing—review and editing, H.W. and G.G.; funding acquisition, T.L., M.T. and X.Z. All authors have read and agreed to the published version of the manuscript.

Funding

This research was funded by Program on the Natural Science Foundation of Guangxi Province, grant number 2021GXNSFAA220026 and 2021GXNSFAA220093, National Modern Agricultural Technology System Guangxi Innovation Team, nycytxgxcxtd-2021-01-04, the Advantage Team Project of Guangxi Academy of Agricultural Sciences, 2021YT031, and The Open Fund of the Guangxi Key Laboratory of Rice Genetics and Breeding, 2022-36-Z01-KF09.

Data Availability Statement

The data presented in this study are available on request from the corresponding author.

Conflicts of Interest

The authors declare no conflict of interest.

References

  1. Murchie, E.H.; Pinto, M.; Horton, P. Agriculture and the new challenges for photosynthesis research. New Phytol. 2009, 181, 532–552. [Google Scholar] [CrossRef] [PubMed]
  2. Horton, P. Prospects for crop improvement through the genetic manipulation of photosynthesis: Morphological and biochemical aspects of light capture. J. Exp. Bot. 2000, 51, 475–485. [Google Scholar] [CrossRef] [PubMed]
  3. Long, S.P.; Marshall-Colon, A.; Zhu, X.-G. Meeting the Global Food Demand of the Future by Engineering Crop Photosynthesis and Yield Potential. Cell 2015, 161, 56–66. [Google Scholar] [CrossRef] [PubMed] [Green Version]
  4. Adachi, S.; Yamamoto, T.; Nakae, T.; Yamashita, M.; Uchida, M.; Karimata, R.; Ichihara, N.; Soda, K.; Ochiai, T.; Ao, R.; et al. Genetic architecture of leaf photosynthesis in rice revealed by different types of reciprocal mapping populations. J. Exp. Bot. 2019, 70, 5131–5144. [Google Scholar] [CrossRef] [PubMed] [Green Version]
  5. Ye, M.; Peng, S.; Li, Y. Intraspecific variation in photosynthetic nitrogen-use efficiency is positively related to photosynthetic rate in rice (Oryza sativa L.) plants. Photosynthetica 2019, 57, 311–319. [Google Scholar] [CrossRef] [Green Version]
  6. Xiong, D.; Liu, X.; Liu, L.; Douthe, C.; Li, Y.; Peng, S.; Huang, J. Rapid responses of mesophyll conductance to changes of CO2 concentration, temperature and irradiance are affected by N supplements in rice. Plant Cell Environ. 2015, 38, 2541–2550. [Google Scholar] [CrossRef]
  7. Teng, S.; Qian, Q.; Zeng, D.; Kunihiro, Y.; Fujimoto, K.; Huang, D.; Zhu, L. QTL analysis of leaf photosynthetic rate and related physiological traits in rice (Oryza sativa L.). Euphytica 2004, 135, 1–7. [Google Scholar] [CrossRef]
  8. Degl’Innocenti, E.; Guidi, L.; Soldatini, G.F. Effects of elevated ozone on chlorophyll a fluorescence in symptomatic and asymptomatic leaves of two tomato genotypes. Biol. Plant. 2007, 51, 313–321. [Google Scholar] [CrossRef]
  9. Li, H.S.; Sun, Q.; Zhao, S.J. Principles and Techniques of Plant Physiological and Biochemical Experiments; Higher Education Press: Beijing, China, 2000; pp. 167–169. [Google Scholar]
  10. Griffiths, H.; Weller, G.; Toy, L.; Dennis, R. You’re so vein: Bundle sheath physiology, phylogeny and evolution in C3 and C4 plants. Plant Cell Environ. 2013, 36, 249–261. [Google Scholar] [CrossRef]
  11. Long, S.; Zhu, X.; Naidu, S.; Ort, D. Can improvement in photosynthesis increase crop yield? Plant Cell Environ. 2006, 29, 315–330. [Google Scholar] [CrossRef]
  12. Rosenthal, D.M.; Locke, A.M.; Khozaei, M.; Raines, C.A.; Long, S.P.; Ort, D.R. Over-expressing the C3 photosynthesis cycle enzyme Sedoheptulose-1-7 Bisphosphatase improves photosynthetic carbon gain and yield under fully open air CO2 fumigation (FACE). BMC Plant Biol. 2011, 11, 123. [Google Scholar] [CrossRef] [Green Version]
  13. Takahara, K.; Kasajima, I.; Takahashi, H.; Hashida, S.-N.; Itami, T.; Onodera, H.; Toki, S.; Yanagisawa, S.; Kawai-Yamada, M.; Uchimiya, H. Metabolome and Photochemical Analysis of Rice Plants Overexpressing Arabidopsis NAD Kinase Gene. Plant Physiol. 2010, 152, 1863–1873. [Google Scholar] [CrossRef] [PubMed] [Green Version]
  14. Tholen, D.; Boom, C.; Zhu, X. Opinion: Prospects for improving photosynthesis by altering leaf anatomy. Plant Sci. 2012, 197, 92–101. [Google Scholar] [CrossRef] [PubMed]
  15. Coupe, S.; Palmer, B.; Lake, J.; Overy, S.; Oxborough, K.; Woodward, F.; Gray, J.; Quick, W. Systemic signalling of environmental cues in Arabidopsis leaves. J. Exp. Bot. 2006, 57, 329–341. [Google Scholar] [CrossRef] [Green Version]
  16. Giuliani, R.; Koteyeva, N.; Voznesenskaya, E.; Evans, M.A.; Cousins, A.B.; Edwards, G.E. Coordination of Leaf Photosynthesis, Transpiration, and Structural Traits in Rice and Wild Relatives (Genus Oryza). Plant Physiol. 2013, 162, 1632–1651. [Google Scholar] [CrossRef] [Green Version]
  17. Shunsuke, A.; Toru, N.; Masaki, U.; Kazuya, S.; Toshiyuki, T.; Takao, O.; Toshio, Y.; Taiichiro, O.; Hiroshi, M.; Masahiro, Y. The mesophyll anatomy enhancing CO2 diffusion is a key trait for improving rice photosynthesis. J. Exp. Bot. 2013, 64, 1061–1072. [Google Scholar]
  18. Xu, Z.; Zhou, G. Responses of leaf stomatal density to water status and its relationship with photosynthesis in a grass. J. Exp. Bot. 2008, 59, 3317–3325. [Google Scholar] [CrossRef] [Green Version]
  19. Ocheltree, T.W.; Nippert, J.; Prasad, P.V. Changes in stomatal conductance along grass blades reflect changes in leaf structure. Plant Cell Environ. 2012, 35, 1040–1049. [Google Scholar] [CrossRef] [PubMed]
  20. Huang, G.; Shu, Y.; Peng, S.; Li, Y. Leaf photosynthesis is positively correlated with xylem and phloem areas in leaf veins in rice (Oryza sativa) plants. Ann. Bot. 2022, 129, 619–631. [Google Scholar] [CrossRef]
  21. Xiong, D.; Yu, T.; Zhang, T.; Li, Y.; Peng, S.; Huang, J. Leaf hydraulic conductance is coordinated with leaf morpho-anatomical traits and nitrogen status in the genus Oryza. J. Exp. Bot. 2015, 66, 741–748. [Google Scholar] [CrossRef] [Green Version]
  22. Han, J.; Zhang, Y.; Lei, Z.; Zhang, W. The higher area-based photosynthesis in Gossypium hirsutum L. is mostly attributed to higher leaf thickness. Photosynthetica 2019, 57, 420–427. [Google Scholar] [CrossRef]
  23. Deng, Y.M.; Li, C.; Shao, Q.; Ye, X.; She, J. Differential responses of double petal and multi petal jasmine to shading: I. Photosynthetic characteristics and chloroplast ultrastructure. Plant Physiol. Biochem. 2012, 55, 93–102. [Google Scholar] [CrossRef] [PubMed]
  24. Wang, X.; Wang, W.; Huang, J.; Peng, S.; Xiong, D. Diffusional conductance to CO2 is the key limitation to photosynthesis in salt-stressed leaves of rice (Oryza sativa). Physiol. Plant. 2017, 163, 45–58. [Google Scholar] [CrossRef] [PubMed] [Green Version]
  25. Huang, D.; Wu, L.; Chen, J.; Dong, L. Morphological plasticity, photosynthesis and chlorophyll fluorescence of Athyrium pachyphlebium at different shade levels. Photosynthetica 2011, 49, 611–618. [Google Scholar] [CrossRef]
  26. Maxwell, K.; Johnson, G. Chlorophyll fluorescence—A practical guide. J. Exp. Bot. 2000, 51, 659–668. [Google Scholar] [CrossRef]
  27. Lande, N.V.; Barua, P.; Gayen, D.; Kumar, S.; Chakraborty, S.; Chakraborty, N. Proteomic dissection of the chloroplast: Moving beyond photosynthesis. J. Proteom. 2019, 212, 103542. [Google Scholar] [CrossRef] [PubMed]
  28. Wang, Y.; Xu, C.; Li, K.; Cai, X.; Wu, M.; Chen, G. Fe deficiency induced changes in rice (Oryza sativa L.) thylakoids. Environ. Sci. Pollut. Res. 2017, 24, 1380–1388. [Google Scholar] [CrossRef] [PubMed]
  29. Chen, B.; Wang, Y. Proteomic and Physiological Studies Provide Insight into Photosynthetic Response of Rice (Oryza sativa L.) Seedlings to Microgravity. Photochem. Photobiol. 2016, 92, 561–570. [Google Scholar] [CrossRef]
  30. Sakataa, S.; Mizusawaa, N.; Kawaib, H.; Sakuraia, I.; Wada, H. Psb28 is involved in recovery of photosystem II at high temperature in Synechocystis sp. PCC 6803. Biochim. Biophys. Acta (BBA)-Bioenerg. 2013, 1827, 50–59. [Google Scholar] [CrossRef] [Green Version]
  31. Zörb, C.; Herbst, R.; Forreiter, C.; Schubert, S. Short-term effects of salt exposure on the maize chloroplast protein pattern. Proteomics 2009, 9, 4209–4220. [Google Scholar] [CrossRef]
  32. Fan, Y.; Chen, J.; Wang, Z.; Tan, T.; Li, S.; Li, J.; Wang, B.; Zhang, J.; Cheng, Y.; Wu, X.; et al. Soybean (Glycine max L. Merr.) seedlings response to shading: Leaf structure, photosynthesis and proteomic analysis. BMC Plant Biol. 2019, 19, 34. [Google Scholar] [CrossRef] [PubMed]
  33. He, L.; Li, M.; Qiu, Z.; Chen, D.; Zhang, G.; Wang, X.; Chen, G.; Hu, J.; Gao, Z.; Dong, G.; et al. Primary leaf-type ferredoxin 1 participates in photosynthetic electron transport and carbon assimilation in rice. Plant J. 2020, 104, 44–58. [Google Scholar] [CrossRef] [PubMed]
  34. Feng, D. Photosynthetic Characteristics and Quantitative Proteomics Analysis of Maize and Rice Leaves. Ph.D. Thesis, Chinese Academy of Agricultural Sciences, Beijing, China, 2007. [Google Scholar]
  35. Zhang, Z.; Mao, X.; Ou, J.; Ye, N.; Zhang, J.; Peng, X. Distinct photo respiratory reactions are preferentially catalyzed by glutamate: Glyoxylate and serine: Glyoxylate aminotransferases in rice. J. Photochem. Photobiol. B Biol. 2015, 142, 110–117. [Google Scholar] [CrossRef] [PubMed]
  36. Imaizumi, N.; Samejima, M.; Ishihara, K. Characteristics of photosynthetic carbon metabolism of spikelets in rice. Photosynth. Res. 1997, 52, 75–82. [Google Scholar] [CrossRef]
  37. Agarie, S.; Miura, A.; Sumikura, R.; Tsukamoto, S.; Nose, A.; Arima, S.; Matsuoka, M.; Miyao-Tokutomi, M. Overexpression of C4 PEPC caused O2-insensitive photosynthesis intransgenic rice plant. Plant Sci. 2002, 162, 257–265. [Google Scholar] [CrossRef]
  38. Fukayama, H.; Hatch, M.D.; Tamai, T.; Tsuchida, H.; Sudoh, S.; Furbank, R.T.; Miyao, M. Activity regulation and physiological impacts of maize C4-specific phosphoenolpyruvate carboxylase overproduced intransgenic rice plants. Photosyn Res. 2003, 77, 227–239. [Google Scholar] [CrossRef]
  39. Ku, M.S.; Agarie, S.; Nomura, M.; Fukayama, H.; Tsuchida, H.; Ono, K.; Hirose, S.; Toki, S.; Miyao, M.; Matsuoka, M. High-level expression of maize phosphoenolpyruvate carboxylase in transgenic rice plants. Nat. Biotechnol. 1999, 17, 76–80. [Google Scholar] [CrossRef]
Figure 1. Leaf tissue structure of C1 and G164 rice germplasm resources. Note: (a,c) represent C1; (b,d) represent G164; BCB: big vascular bundle; SCB: small vascular bundle; LT: leaf thickness; V: vessel; MC: mesophyll cell; S: stomata.
Agronomy 12 03207 g001
Figure 2. Chloroplast ultrastructure of leaves of C1 and G164 rice varieties. Note: (a,b) represent C1; (c,d) represent G164; Ch: chloroplast; CW: cell wall; Th: thylakoid; OS: osmiophilic granule.
Agronomy 12 03207 g002
Figure 3. Photosynthetic rate and chlorophyll value of high- and low-light efficiency germplasm resources. Note: Data are means of three replicates. The uppercase and lowercase letters represent 1% and 5% level of significance of difference, respectively.
Agronomy 12 03207 g003
Figure 4. Distribution of differentially expressed proteins by second-level GO annotation.
Agronomy 12 03207 g004
Figure 5. Subcellular structure localization and distribution of up-regulated and down-regulated proteins in G164 compared to C1.Note: Location and number of up- regulated and down-regulated proteins in the subcellular (a), and Location and ratio of differential proteins in the subcellular (b).
Agronomy 12 03207 g005
Figure 6. KEGG pathway enrichment of photosynthetic enzymes; all proteins (a), up-regulated proteins (b), and down-regulated proteins (c). Note:Values on the horizontal axis are negative log-transformations of significant p-values (p < 0.05).
Agronomy 12 03207 g006aAgronomy 12 03207 g006b
Figure 7. Expression analysis of nine genes in leaves of C1 and G164 using real-time PCR. Note: Os07g0147900: ferredoxin—NADP+ reductase (petH); Os09g0315700: phosphoenolpyruvate carboxylase (ppc); Os10g0390500: alanine transaminase (GPT); P0585H11.115: glutamate-glyoxylate aminotransferase (GGAT); PetE: plastocyanin (petE); Os05g0496200: phosphoglycerate kinase (PGK).
Agronomy 12 03207 g007
Table 1. Differences in leaf tissue structure of rice germplasm resources of different photosynthetic efficiencies.
NameStomatal Density (pcs)Stomatal Size (mm)LT
(mm)
No. of BCB (pcs)No. of SCB (pcs)BCB Area (mm2)SCB Area (mm2)V Diameter (mm)MC Size (mm2)
G1643.667 a0.001 a0.100 a 9 a46 a0.016 a0.0029 a0.0435 a2.4 × 10−5 b
C16.000 b0.004 b0.098 a20 b61 b0.015 a0.0028 a0.0345 b1.9 × 10−5 a
Note: Data are means of three replicates. Different letters in rows represent significant (p < 0.05) differences between rice germplasm resources.
Table 2. Chlorophyll fluorescence parameters and enzyme characteristic of Rubisco in the sword leaves of high- and low-light efficiency germplasm resources C1 and G164.
VarietiesFv/FmqPNPQETRΦPSⅡRubisco Activity (nmol/s/g)Rubisco Content (ng/L)
C10.813 ± 0.006 a0.911 ± 0.011 a0.160 ± 0.055 a30.429 ± 0.432 a0.691 ± 0.009 a5.311 ± 9.74 b148.933 ± 2.95 a
G1640.806 ± 0.002 a0.874 ± 0.023 a0.177 ± 0.042 a28.954 ± 0.887 a0.660 ± 0.019 a5.037 ± 2.43 a138.073 ± 4.28 a
Note: Data are means of three replicates. Different letters in rows represent significant (p < 0.05) differences between rice germplasm resources.
Table 3. Differential proteins associated with photosynthesis.
KEGG PathwayProtein
Accession
Protein DescriptionCoverage [%]Fold ChangeDirection of ChangeSubcellular Localization
PhotosynthesisO23877petH; ferredoxin—NADP+ reductase [EC:1.18.1.2]10.11.645 **upchloroplast
P0C389petA; apocytochrome f46.20.764 **downnucleus
P12123petB; cytochrome b616.30.690 *downcytoplasm
Q0DFC9petE; plastocyanin20.80.810 **downchloroplast
Q0J8M2petF; ferredoxin40.30.790 **downchloroplast
Q0JG75psb28; PSII 13kDa protein16.10.710 **downchloroplast
Q109L0psbP; photosystem II oxygen-evolving enhancer protein 217.70.645 **downchloroplast
Q10LV7psb27; photosystem II Psb27 protein34.50.745 **downchloroplast
Q69S39petC; cytochrome b6-f complex iron-sulfur subunit [EC:1.10.9.1]49.80.720 **downchloroplast
Q6ZFJ3petH; ferredoxin--NADP+ reductase [EC:1.18.1.2]56.30.770 **downchloroplast
Carbon fixation in photosynthetic organismA0A0P0WP33PGK; phosphoglycerate kinase [EC:2.7.2.3]63.60.800 **downchloroplast
A0A0P0XLG164PEPC; phosphoenolpyruvate carboxylase [EC:4.1.1.31]20.31.635 *upcytoplasm
A0A0P0XUE4GPT; alanine transaminase [EC:2.6.1.2]22.41.425 *upcytoplasm
Q0JJQ7E1.1.1.40; malate dehydrogenase (oxaloacetate-decarboxylating) (NADP+) [EC:1.1.1.40]29.11.500 **upchloroplast
Q2QTJ1rbcS; ribulose-bisphosphate carboxylase small chain [EC:4.1.1.39]53.10.790 **downchloroplast
Q42972MDH2; malate dehydrogenase [EC:1.1.1.37]15.71.465 **upcytoplasm
Q655Y9FBP; fructose-1,6-bisphosphatase I [EC:3.1.3.11]27.71.315 **upchloroplast
Q69K00TPI; triosephosphate isomerase (TIM) [EC:5.3.1.1]530.745 **downchloroplast
Q69UU3GGAT; glutamate--glyoxylate aminotransferase [EC:2.6.1.4 2.6.1.2 2.6.1.44]58.40.815 **downperoxisome
Q6H6C7PGK; phosphoglycerate kinase [EC:2.7.2.3]55.71.300 **upchloroplast
Q6YYW3E1.1.1.82; malate dehydrogenase (NADP+) [EC:1.1.1.82]47.80.795 **downchloroplast
Q7X8A1GAPA; glyceraldehyde-3-phosphate dehydrogenase (NADP+) (phosphorylating) [EC:1.2.1.13]510.775 **downchloroplast
Q7XDC8MDH1; malate dehydrogenase [EC:1.1.1.37]31.61.225 **upcytoplasm
Q7XZW5MDH2; malate dehydrogenase [EC:1.1.1.37]57.90.750 **downchloroplast
Q8H4V1pepc; phosphoenolpyruvate carboxylase [EC:4.1.1.31]35.71.310 **upcytoplasm
Q9SNK3GAPA; glyceraldehyde-3-phosphate dehydrogenase (NADP+) (phosphorylating) [EC:1.2.1.13]550.815 **downchloroplast
Q0J8A4GAPDH; glyceraldehyde 3-phosphate dehydrogenase [EC:1.2.1.12]64.11.390 **upcytoplasm
Note: Data are means of three replicates. ** and * represent 1% and 5% level of significance of difference respectively.
Publisher’s Note: MDPI stays neutral with regard to jurisdictional claims in published maps and institutional affiliations.

