
Multilocation Evaluation of Virginia and Runner -Type Peanut Cultivars for Yield and Grade in Virginia–Carolina Region
Abstract
:1. Introduction
2. Materials and Methods
2.1. Plant Material and Experimental Design
2.2. Statistical Analysis
3. Results and Discussion
4. Conclusions
Supplementary Materials
Author Contributions
Funding
Institutional Review Board Statement
Informed Consent Statement
Data Availability Statement
Acknowledgments
Conflicts of Interest
References
- Basinger, N.; Randell, T.; Prostko, E. Peanut Response to Flumioxazin and S-Metolachlor under High Moisture Conditions. Peanut Sci. 2021, 48, 113–117. [Google Scholar] [CrossRef]
- Jordan, D.; Swann, C.; Spears, J.; Brandenburg, R.; Bailey, J.; Tucker, M. Comparison of virginia and runner market-type peanut (Arachis hypogaea) grown in the Virginia-Carolina production region. Peanut Sci. 2000, 27, 71–77. [Google Scholar] [CrossRef]
- Gaines, T.; Parker, M.; Walker, M. Limestone and gypsum effects on calcium nutrition of ‘Florunner’and ‘NC-7’Peanuts. Commun. Soil Sci. Plant Anal. 1991, 22, 117–135. [Google Scholar] [CrossRef]
- Pallas, J., Jr.; Stansell, J.; Bruce, R. Peanut Seed Germination as Related to Soil Water Regime during Pod Development 1. Agron. J. 1977, 69, 381–383. [Google Scholar] [CrossRef]
- Balota, M.; Cahoon, C.; Mehl, H.; Shortridge, J.; Taylor, S.V. Virginia Peanut Production Guide; Virginia Peanut Growers Association: Franklin, VA, USA, 2018. [Google Scholar]
- Reddy, T.; Reddy, V.; Anbumozhi, V. Physiological responses of groundnut (Arachis hypogea L.) to drought stress and its amelioration: A critical review. Plant Growth Regul. 2003, 41, 75–88. [Google Scholar] [CrossRef]
- Williams, J.H.; Phillips, T.D.; Jolly, P.E.; Stiles, J.K.; Jolly, C.M.; Aggarwal, D. Human aflatoxicosis in developing countries: A review of toxicology, exposure, potential health consequences, and interventions. Am. J. Clin. Nutr. 2004, 80, 1106–1122. [Google Scholar] [CrossRef] [Green Version]
- Guo, B.; Chen, Z.Y.; Lee, R.D.; Scully, B.T. Drought stress and preharvest aflatoxin contamination in agricultural commodity: Genetics, genomics and proteomics. J. Integr. Plant Biol. 2008, 50, 1281–1291. [Google Scholar] [CrossRef]
- Holbrook, C.; Kvien, C.; Rucker, K.; Wilson, D.; Hook, J.; Matheron, M. Preharvest aflatoxin contamination in drought-tolerant and drought-intolerant peanut genotypes. Peanut Sci. 2000, 27, 45–48. [Google Scholar] [CrossRef] [Green Version]
- Arunyanark, A.; Jogloy, S.; Wongkaew, S.; Akkasaeng, C.; Vorasoot, N.; Wright, G.; Rachaputi, R.C.; Patanothai, A. Association between aflatoxin contamination and drought tolerance traits in peanut. Field Crops Res. 2009, 114, 14–22. [Google Scholar] [CrossRef]
- David Jordan, B.B.; Roberson, G.; Brandenburg, R. 2022 Peanut Information—NC state Extension Publication; North Carolina State University: Raleigh, NC, USA, 2022. [Google Scholar]
- Balota, M.; Jordan, D.; Mehl, H.; Shortridge, J.; Taylor, S. Virginia Peanut Production Guide; Virginia Cooperative Extension: Blacksburg, VA, USA, 2020. [Google Scholar]
- Turner, N.C.; Blum, A.; Cakir, M.; Steduto, P.; Tuberosa, R.; Young, N. Strategies to increase the yield and yield stability of crops under drought–are we making progress? Funct. Plant Biol. 2014, 41, 1199–1206. [Google Scholar] [CrossRef]
- Padovan, G.; Martre, P.; Semenov, M.A.; Masoni, A.; Bregaglio, S.; Ventrella, D.; Lorite, I.J.; Santos, C.; Bindi, M.; Ferrise, R. Understanding effects of genotype× environment× sowing window interactions for durum wheat in the Mediterranean basin. Field Crops Res. 2020, 259, 107969. [Google Scholar] [CrossRef]
- Zhang, A.; Hochman, Z.; Horan, H.; Navarro, J.G.; Das, B.T.; Waldner, F. Socio-psychological and management drivers explain farm level wheat yield gaps in Australia. Agron. Sustain. Dev. 2019, 39, 1–13. [Google Scholar] [CrossRef] [Green Version]
- Kang, M.S. Breeding: Genotype-by-environment interaction. Encycl. Plant Crop Sci. 2004, 218–221. [Google Scholar]
- Pour-Aboughadareh, A.; Khalili, M.; Poczai, P.; Olivoto, T. Stability Indices to Deciphering the Genotype-by-Environment Interaction (GEI) Effect: An Applicable Review for Use in Plant Breeding Programs. Plants 2022, 11, 414. [Google Scholar] [CrossRef] [PubMed]
- Farshadfar, E.; Sabaghpour, S.H.; Zali, H. Comparison of parametric and non-parametric stability statistics for selecting stable chickpea (Cicer arietinum L.) genotypes under diverse environments. Aust. J. Crop Sci. 2012, 6, 514–524. [Google Scholar]
- Farshadfar, E.; Romena, H.; Safari, H. Evaluation of variability and genetic parameters in agro-physiological traits of wheat under rain-fed condition. Int. J. Agric. Crop. Sci. 2013, 5, 1015. [Google Scholar]
- Farshadfar, E.; Sadeghi, M. GGE biplot analysis of genotype× environment interaction in wheat-agropyron disomic addition lines. Agric. Commun. 2014, 2, 1–7. [Google Scholar]
- Farshadfar, E.; Hatami, N. Evaluation of genotype× environment interaction in wheat substitution lines. Agric. Commun. 2015, 3, 1–7. [Google Scholar]
- Vaezi, B.; Pour-Aboughadareh, A.; Mehraban, A.; Hossein-Pour, T.; Mohammadi, R.; Armion, M.; Dorri, M. The use of parametric and non-parametric measures for selecting stable and adapted barley lines. Arch. Agron. Soil Sci. 2018, 64, 597–611. [Google Scholar] [CrossRef]
- Wricke, G. Evaluation method for recording ecological differences in field trials. Z. Pflanz. 1962, 47, 92–96. [Google Scholar]
- Shukla, G. Some statistical aspects of partitioning genotype-environmental components of variability. Heredity 1972, 29, 237–245. [Google Scholar] [CrossRef] [PubMed]
- Lin, C.-S.; Binns, M.R. A superiority measure of cultivar performance for cultivar× location data. Can. J. Plant Sci. 1988, 68, 193–198. [Google Scholar] [CrossRef]
- Finlay, K.W.; Wilkinson, G. The analysis of adaptation in a plant-breeding programme. Aust. J. Agric. Res. 1963, 14, 742–754. [Google Scholar] [CrossRef] [Green Version]
- Happ, M.M.; Graef, G.L.; Wang, H.; Howard, R.; Posadas, L.; Hyten, D.L. Comparing a mixed model approach to traditional stability estimators for mapping genotype by environment interactions and yield stability in soybean [Glycine max (L.) Merr.]. Front. Plant Sci. 2021, 12, 630175. [Google Scholar] [CrossRef] [PubMed]
- Isleib, T.G.; Milla-Lewis, S.R.; Pattee, H.E.; Copeland, S.C.; Zuleta, M.C.; Shew, B.B.; Hollowell, J.E.; Sanders, T.H.; Dean, L.O.; Hendrix, K.W. Registration of ‘Bailey’peanut. J. Plant Regist. 2011, 5, 27–39. [Google Scholar] [CrossRef]
- Balota, M.; Isleib, T. Registration of GP-VT NC 01 peanut germplasm. J. Plant Regist. 2020, 14, 172–178. [Google Scholar] [CrossRef]
- Tillman, B.; Gorbet, D. Registration of ‘FloRun ‘107’’peanut. J. Plant Regist. 2015, 9, 162–167. [Google Scholar] [CrossRef]
- Tillman, B.L. Registration of ‘TUFRunner ‘297’’peanut. J. Plant Regist. 2018, 12, 31–34. [Google Scholar] [CrossRef]
- Boote, K. Growth stages of peanut (Arachis hypogaea L.). Peanut Sci. 1982, 9, 35–40. [Google Scholar] [CrossRef]
- Agricultural Marketing Service U.S. Department of Agricultural. Agricultural Marketing Service; U.S. Government Printing Office: Washington, DC, USA, 2019.
- Balota, M.; Phipps, P. Comparison of Virginia and Runner-type peanut cultivars for development, disease, yield potential, and grade factors in eastern Virginia. Peanut Sci. 2013, 40, 15–23. [Google Scholar] [CrossRef] [Green Version]
- van Rossum, B.-J.; van Eeuwijk, F.; Boer, M.; Malosetti, M. Package ‘statgenGxE’. CRAN. 2021. Available online: https://cran.r-project.org/web/packages/statgenGxE/index.html (accessed on 14 December 2021).
- Gauch, H.G., Jr. A simple protocol for AMMI analysis of yield trials. Crop Sci. 2013, 53, 1860–1869. [Google Scholar] [CrossRef]
- Olivoto, T.; Lúcio, A.D.C. metan: An R package for multi-environment trial analysis. Methods Ecol. Evol. 2020, 11, 783–789. [Google Scholar] [CrossRef] [Green Version]
- Wickham, H. Getting started with qplot. In ggplot2; Springer: Berlin/Heidelberg, Germany, 2009; pp. 9–26. [Google Scholar]
- Agricultural Marketing Service U.S. Department of Agricultural. National Agricultural Statistics Service. Agricultural Statistics; U.S. Government Printing Office: Washington, DC, USA, 2022.
- Pallas, J.E., Jr.; Samish, Y. Photosynthetic Response of Peanut 1. Crop Sci. 1974, 14, 478–482. [Google Scholar] [CrossRef]
- Ramsey, A.F.; Tack, J.B.; Balota, M. Double or Nothing: Impacts of Warming on Crop Quantity, Quality, and Revenue. J. Agric. Resour. Econ. 2020, 47, 1–22. [Google Scholar]
- Geethalakshmi, V.; Lourduraj, A. Effect of gypsum application on yield and economics of groundnut. Legume Res. 1998, 21, 13–16. [Google Scholar]
- Nautiyal, P.; Rachaputi, N.R.; Joshi, Y. Moisture-deficit-induced changes in leaf-water content, leaf carbon exchange rate and biomass production in groundnut cultivars differing in specific leaf area. Field Crops Res. 2002, 74, 67–79. [Google Scholar] [CrossRef]
- Ramakrishna, A.; Tam, H.M.; Wani, S.P.; Long, T.D. Effect of mulch on soil temperature, moisture, weed infestation and yield of groundnut in northern Vietnam. Field Crops Res. 2006, 95, 115–125. [Google Scholar] [CrossRef] [Green Version]
- Anco, D.J.; Balota, M.; Dunne, J.C.; Brown, N. Sound Splits as Influenced by Seed Size for Runner and Virginia Market Type Peanut Shelled on a Reciprocating Sheller. Agronomy 2021, 11, 1869. [Google Scholar] [CrossRef]
- Cotton, D. Virginia Tech Extension Specialist. Peanut, Cotton Growers Hope for Dryer Weather. Personal Communication. 2014. Available online: https://www.lancasterfarming.com/peanut--cotton-growers-hope-for-dryer-weather/ (accessed on 14 December 2021).
- Erickson, P.; Ketring, D. Evaluation of Peanut Genotypes for Resistance to Water Stress In Situ 1. Crop Sci. 1985, 25, 870–876. [Google Scholar] [CrossRef]
- Wricke, G.; Weber, W. Erweiterte analyse von wechselwirkungen in versuchsserien. In Biometrie—Heute und Morgen; Springer: Berlin/Heidelberg, Germany, 1980; pp. 87–95. [Google Scholar]
- Gabriel, K.R. The biplot graphic display of matrices with application to principal component analysis. Biometrika 1971, 58, 453–467. [Google Scholar] [CrossRef]


| Name | Genotype | Type | Use | Year /Location of Use in Test | Reason | References |
|---|---|---|---|---|---|---|
| FloRun ‘107’ | G02 | Runner | Cultivar | 2016, Din; 2017, Cap, RM and Suf; 2020: Suf | High yield | [30] |
| TUFRunner ‘297’ | G04 | Runner | Cultivar | 2016, Din; 2017 Cap, RM and Suf; 2018 RM and Suf; 2020: Suf | High oleic/high yield | [31] |
| Bailey | G01 | Virginia | Cultivar | 2016, Din; 2017 Cap, RM and Suf; 2018 RM and Suf; 2020: Suf | Widely grown/High yield | [28] |
| Sullivan | G03 | Virginia | Cultivar | 2016, Din; 2017 Cap, RM and Suf; 2018 RM and Suf; 2020: Suf | High oleic/TSWV resistant | [29] |
| Wynne | G05 | Virginia | Cultivar | 2016, Din; 2017 Cap, RM and Suf; 2018 RM and Suf; 2020: Suf | High oleic/large kernels | [29] |
| Season | Environment | ENV | Location | Regime | Soil Type |
|---|---|---|---|---|---|
| 2016 | Dwd16RfIR | E04 | Dinwiddie, VA | Rainfed and Irrigated | Helena sandy loam |
| Dwd16Rf | E03 | Dinwiddie, VA | Rainfed | Helena sandy loam | |
| 2017 | Cap17RfIR | E02 | Capron, VA | Rainfed and Irrigated | Nansemond |
| Cap17Rf | E01 | Capron, VA | Rainfed | Nansemond | |
| Rkm17RfIR | E06 | Rocky Mount, NC | Rainfed and Irrigated | Goldsboro sandy loam | |
| Rkm17Rf | E05 | Rocky Mount, NC | Rainfed | Goldsboro sandy loam | |
| Suf17Rf | E09 | Suffolk, VA | Rainfed | Eunola–Kenansville | |
| 2018 | Rkm18RfIR | E08 | Rocky Mount, NC | Rainfed and Irrigated | Goldsboro sandy loam |
| Rkm18Rf | E07 | Rocky Mount, NC | Rainfed | Goldsboro sandy loam | |
| Suf18RfIR | E11 | Suffolk, VA | Rainfed and Irrigated | Eunola–Kenansville | |
| Suf18Rf | E10 | Suffolk, VA | Rainfed | Eunola–Kenansville | |
| 2020 | Suf20RfIR | E13 | Suffolk, VA | Rainfed and Irrigated | Eunola–Kenansville |
| Suf20Rf | E12 | Suffolk, VA | Rainfed | Eunola–Kenansville |
| Location | Dinwiddie (VA) | Capron (VA) | Rocky Mount (NC) | Suffolk (VA) | |||
|---|---|---|---|---|---|---|---|
| Year | 2016 | 2017 | 2017 | 2018 | 2017 | 2018 | 2020 |
| MAX temp (°C) | |||||||
| May | 23 | 25 | 26 | 28 | 26 | 28 | 25 |
| June | 29 | 29 | 30 | 31 | 32 | 31 | 29 |
| July | 32 | 32 | 32 | 31 | 33 | 31 | 34 |
| Aug | 32 | 29 | 30 | 31 | 31 | 32 | 32 |
| Sep | 28 | 27 | 28 | 31 | 28 | 31 | 26 |
| Oct | 23 | 25 | 25 | 30 | 27 | 25 | 24 |
| MIN temp (°C) | |||||||
| May | 13 | 14 | 15 | 18 | 14 | 18 | 16 |
| June | 17 | 18 | 19 | 21 | 21 | 19 | 19 |
| July | 21 | 21 | 22 | 21 | 22 | 20 | 22 |
| Aug | 20 | 20 | 21 | 21 | 19 | 21 | 22 |
| Sep | 19 | 16 | 17 | 21 | 16 | 20 | 17 |
| Oct | 14 | 14 | 12 | 18 | 16 | 13 | 11 |
| Monthly cumulative GDD13.3 (°C) | |||||||
| May | 141 | 188 | 219 | 291 | 195 | 285 | 144 |
| June | 298 | 308 | 321 | 366 | 318 | 357 | 300 |
| July | 401 | 414 | 425 | 388 | 415 | 371 | 442 |
| Aug | 401 | 342 | 365 | 393 | 354 | 402 | 417 |
| Sep | 303 | 251 | 268 | 368 | 268 | 363 | 258 |
| Oct | 51 | 65 | 70 | 108 | 74 | 106 | 39 |
| Rainfall (mm) | |||||||
| May | 219 | 137 | 125 | 165 | 119 | 104 | 74 |
| June | 128 | 105 | 122 | 74 | 89 | 104 | 97 |
| July | 123 | 133 | 150 | 180 | 61 | 208 | 53 |
| Aug | 51 | 204 | 175 | 94 | 185 | 150 | 216 |
| Sep | 159 | 40 | 76 | 130 | 94 | 112 | 259 |
| Oct | 120 | 6 | 86 | 3 | 58 | 58 | 20 |
| Source | DF | SS | MS | F-Value | p-Value |
|---|---|---|---|---|---|
| Environment (E) | 12 | 95,555,434 | 7,962,953 | 26.57969 | *** |
| Rep (E) | 39 | 19,263,173 | 493,927.5 | 1.64869 | 0.015 |
| Genotype (G) | 4 | 16,411,368 | 4,102,842 | 13.69496 | *** |
| G × E | 48 | 29,139,325 | 607,069.3 | 2.026348 | *** |
| Residuals | 182 | 54,524,984 | 299,587.8 | ||
| CV (%) | 9.88 |
| Genotype | GEN | Yield (kg/ha) | Lin & Binn’s | Shukla’s | Wricke’s | FW | Average Rank |
|---|---|---|---|---|---|---|---|
| Sullivan | G03 | 5511 (3) * | (3) | (1) | (1) | (1) | 1.5 |
| Bailey | G01 | 5796 (1) | (1) | (2) | (3) | (2) | 2.0 |
| TUFRunner297 | G04 | 5622 (2) | (2) | (3) | (4) | (3) | 3.0 |
| FloRun107 | G02 | 5262 (5) | (4) | (4) | (2) | (4) | 3.5 |
| Wynne | G05 | 5344 (4) | (5) | (5) | (5) | (5) | 5.0 |
| Source | DF | SS | MS | F-Value | p-Value | Variation Explained (%) |
|---|---|---|---|---|---|---|
| Environment € | 12 | 95,555,434 | 7,962,953 | 26.57969 | *** | |
| R€(E) | 39 | 19,263,173 | 493,927.5 | 1.64869 | 0.015 | |
| Genotype (G) | 4 | 16,411,368 | 4,102,842 | 13.69496 | *** | |
| G × E | 48 | 29,139,325 | 607,069.3 | 2.026348 | *** | |
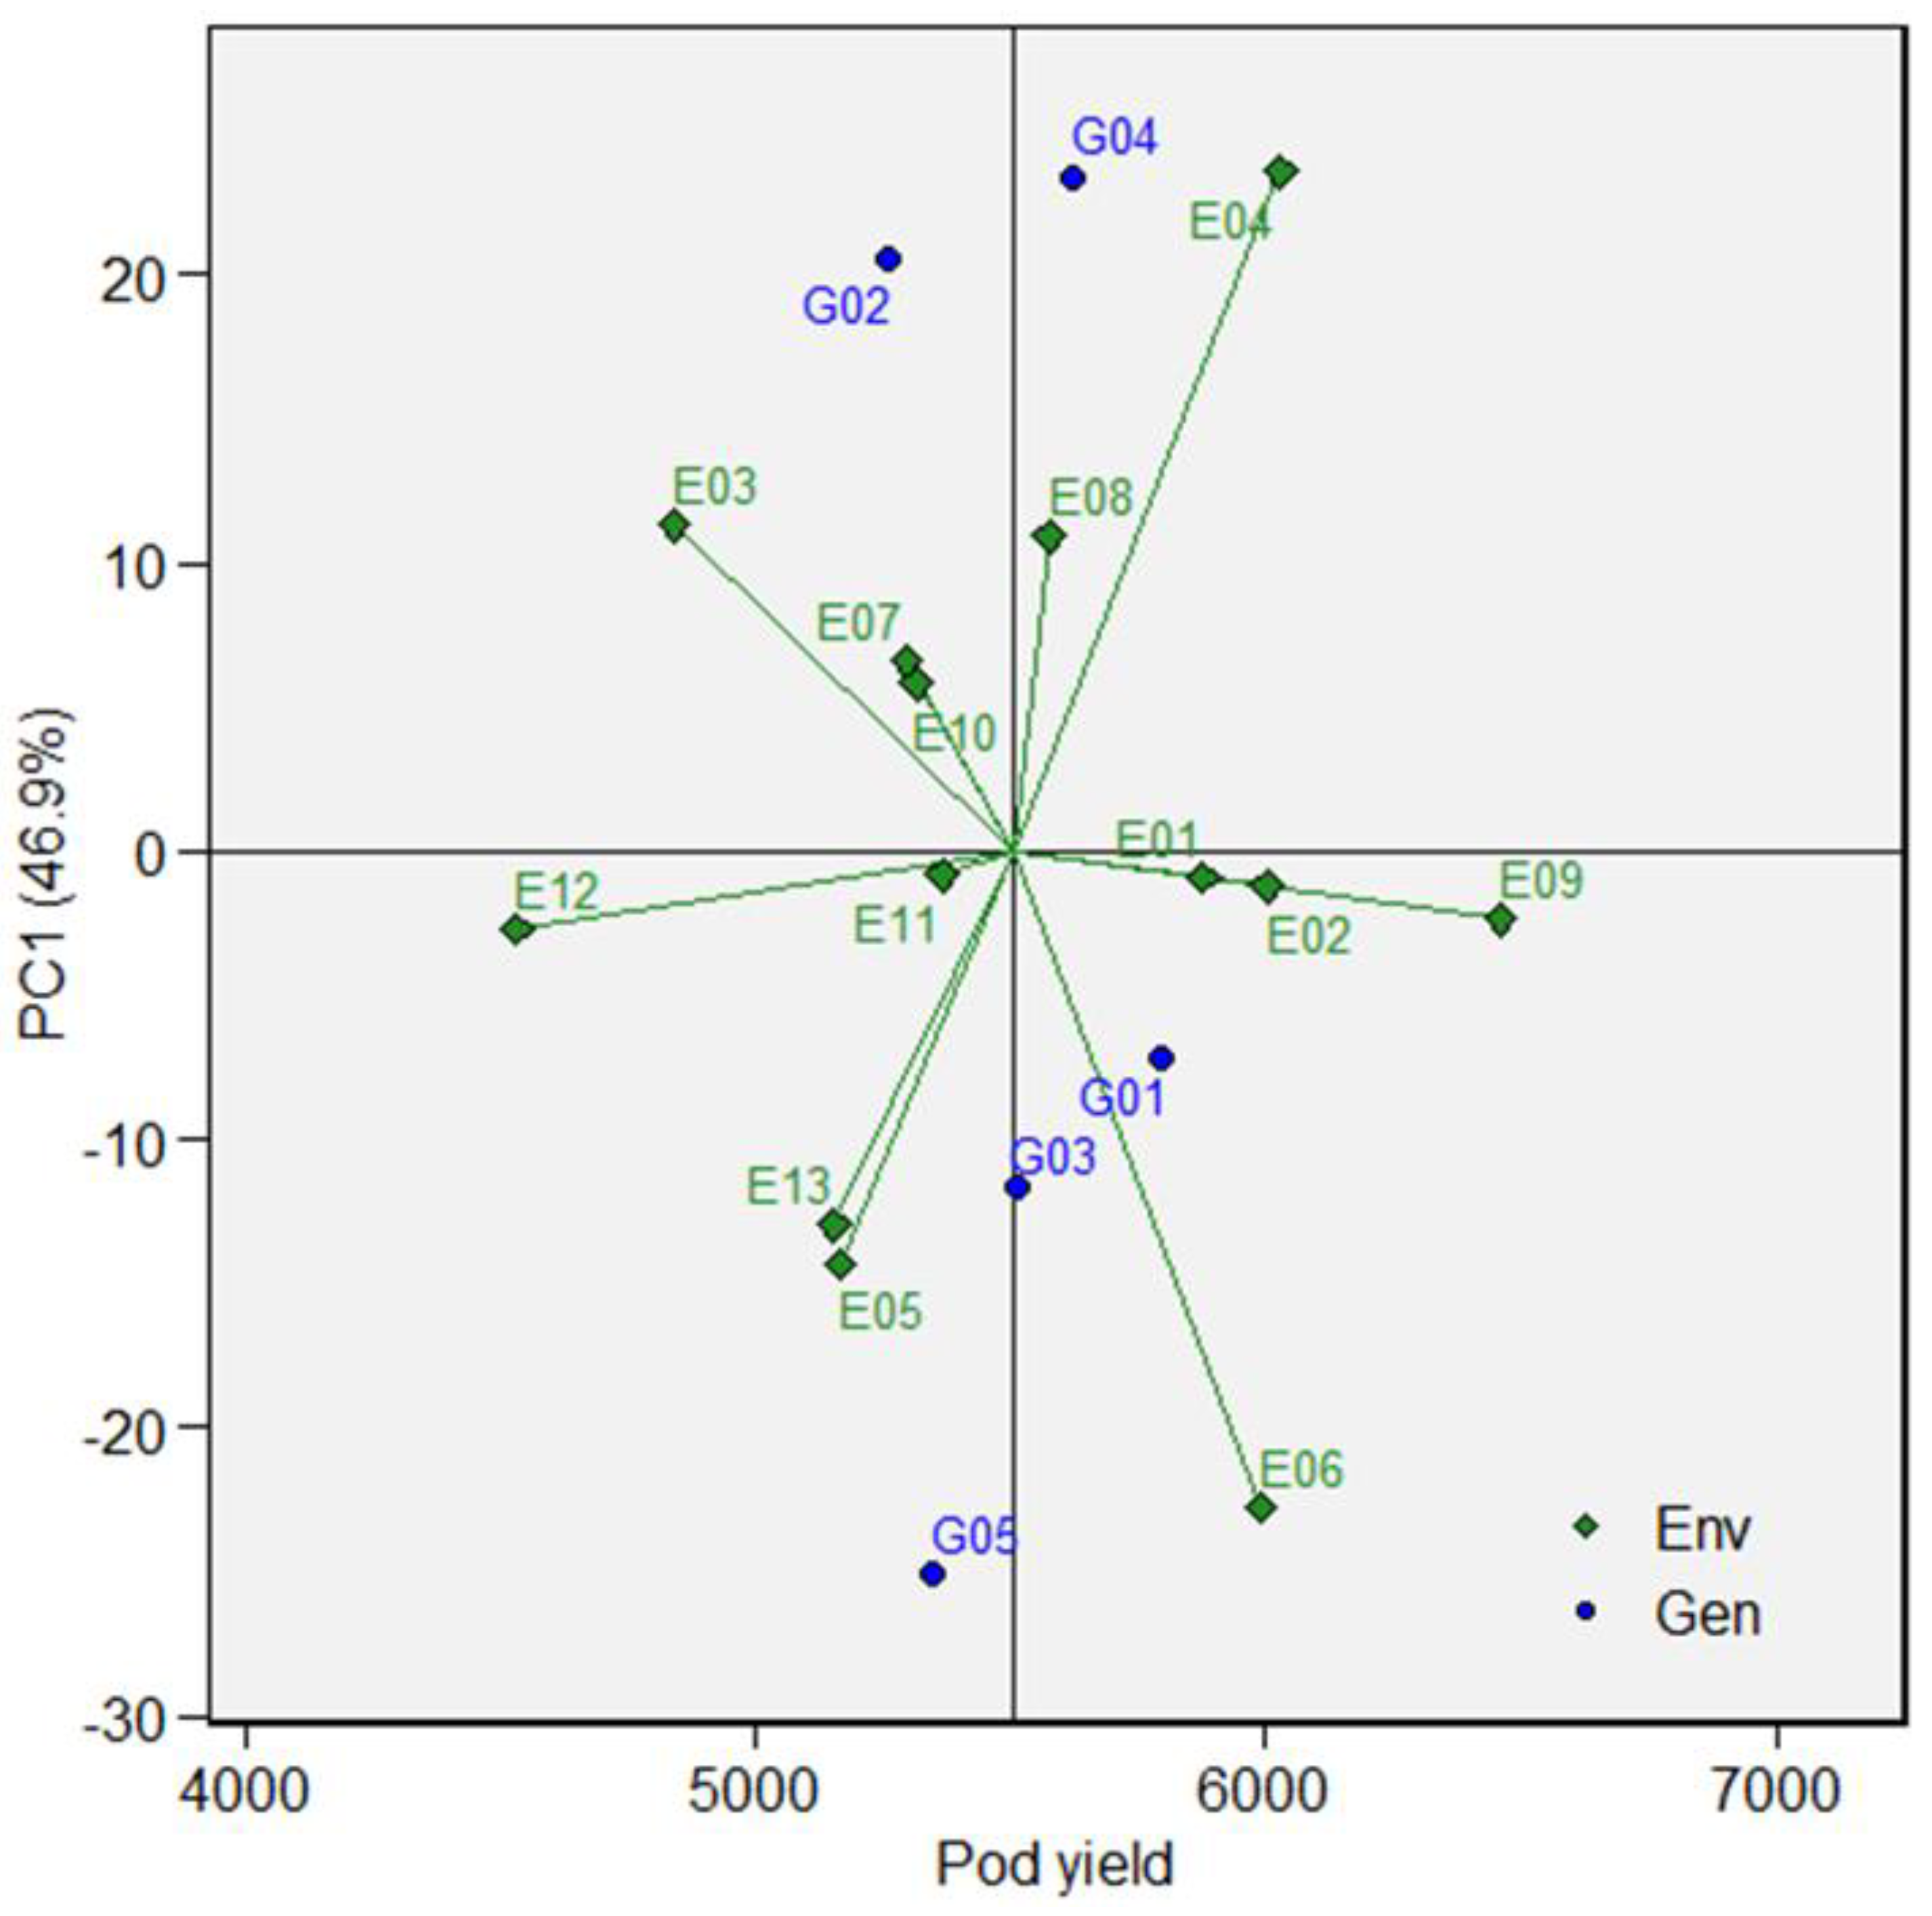
| PC1 | 15 | 12,765,739 | 851,049.3 | 2.84 | *** | 46.9 |
| PC2 | 13 | 6,723,011 | 517,154.7 | 1.73 | * | 24.7 |
| PC3 | 11 | 5,845,645 | 531,422.3 | 1.77 | 21.5 | |
| PC4 | 9 | 1,885,576 | 209,508.5 | 0.7 | 6.9 | |
| Residuals | 182 | 54,524,984 | 299,587.8 | |||
| Total | 333 |
Disclaimer/Publisher’s Note: The statements, opinions and data contained in all publications are solely those of the individual author(s) and contributor(s) and not of MDPI and/or the editor(s). MDPI and/or the editor(s) disclaim responsibility for any injury to people or property resulting from any ideas, methods, instructions or products referred to in the content. |
© 2022 by the authors. Licensee MDPI, Basel, Switzerland. This article is an open access article distributed under the terms and conditions of the Creative Commons Attribution (CC BY) license (https://creativecommons.org/licenses/by/4.0/).
Share and Cite
Kumar, N.; Haak, D.C.; Dunne, J.C.; Balota, M. Multilocation Evaluation of Virginia and Runner -Type Peanut Cultivars for Yield and Grade in Virginia–Carolina Region. Agronomy 2022, 12, 3206. https://doi.org/10.3390/agronomy12123206
Kumar N, Haak DC, Dunne JC, Balota M. Multilocation Evaluation of Virginia and Runner -Type Peanut Cultivars for Yield and Grade in Virginia–Carolina Region. Agronomy. 2022; 12(12):3206. https://doi.org/10.3390/agronomy12123206
Chicago/Turabian StyleKumar, Naveen, David C. Haak, Jeffrey C. Dunne, and Maria Balota. 2022. "Multilocation Evaluation of Virginia and Runner -Type Peanut Cultivars for Yield and Grade in Virginia–Carolina Region" Agronomy 12, no. 12: 3206. https://doi.org/10.3390/agronomy12123206