

Enhancement of Rose Scented Geranium Plant Growth, Secondary Metabolites, and Essential Oil Components through Foliar Applications of Iron (Nano, Sulfur and Chelate) in Alkaline Soils
 , ,
, ,
Abstract
:1. Introduction
2. Materials and Methods
2.1. Assimilation of Fe-NPs
2.2. Characterization of Fe-NPs
2.3. Experimental Location, Climate Data, and Soil Properties
2.4. Experimental Layout
2.5. Measurements and Data Collection
2.6. Determination of Essential Oil
2.7. Ion Concentration
2.8. Photosynthetic Pigment
2.9. Total Carbohydrates
2.10. Total Phenolic Compounds, Total Flavonoids, and Total Anthocyanin
2.11. Statistical Analysis
3. Results
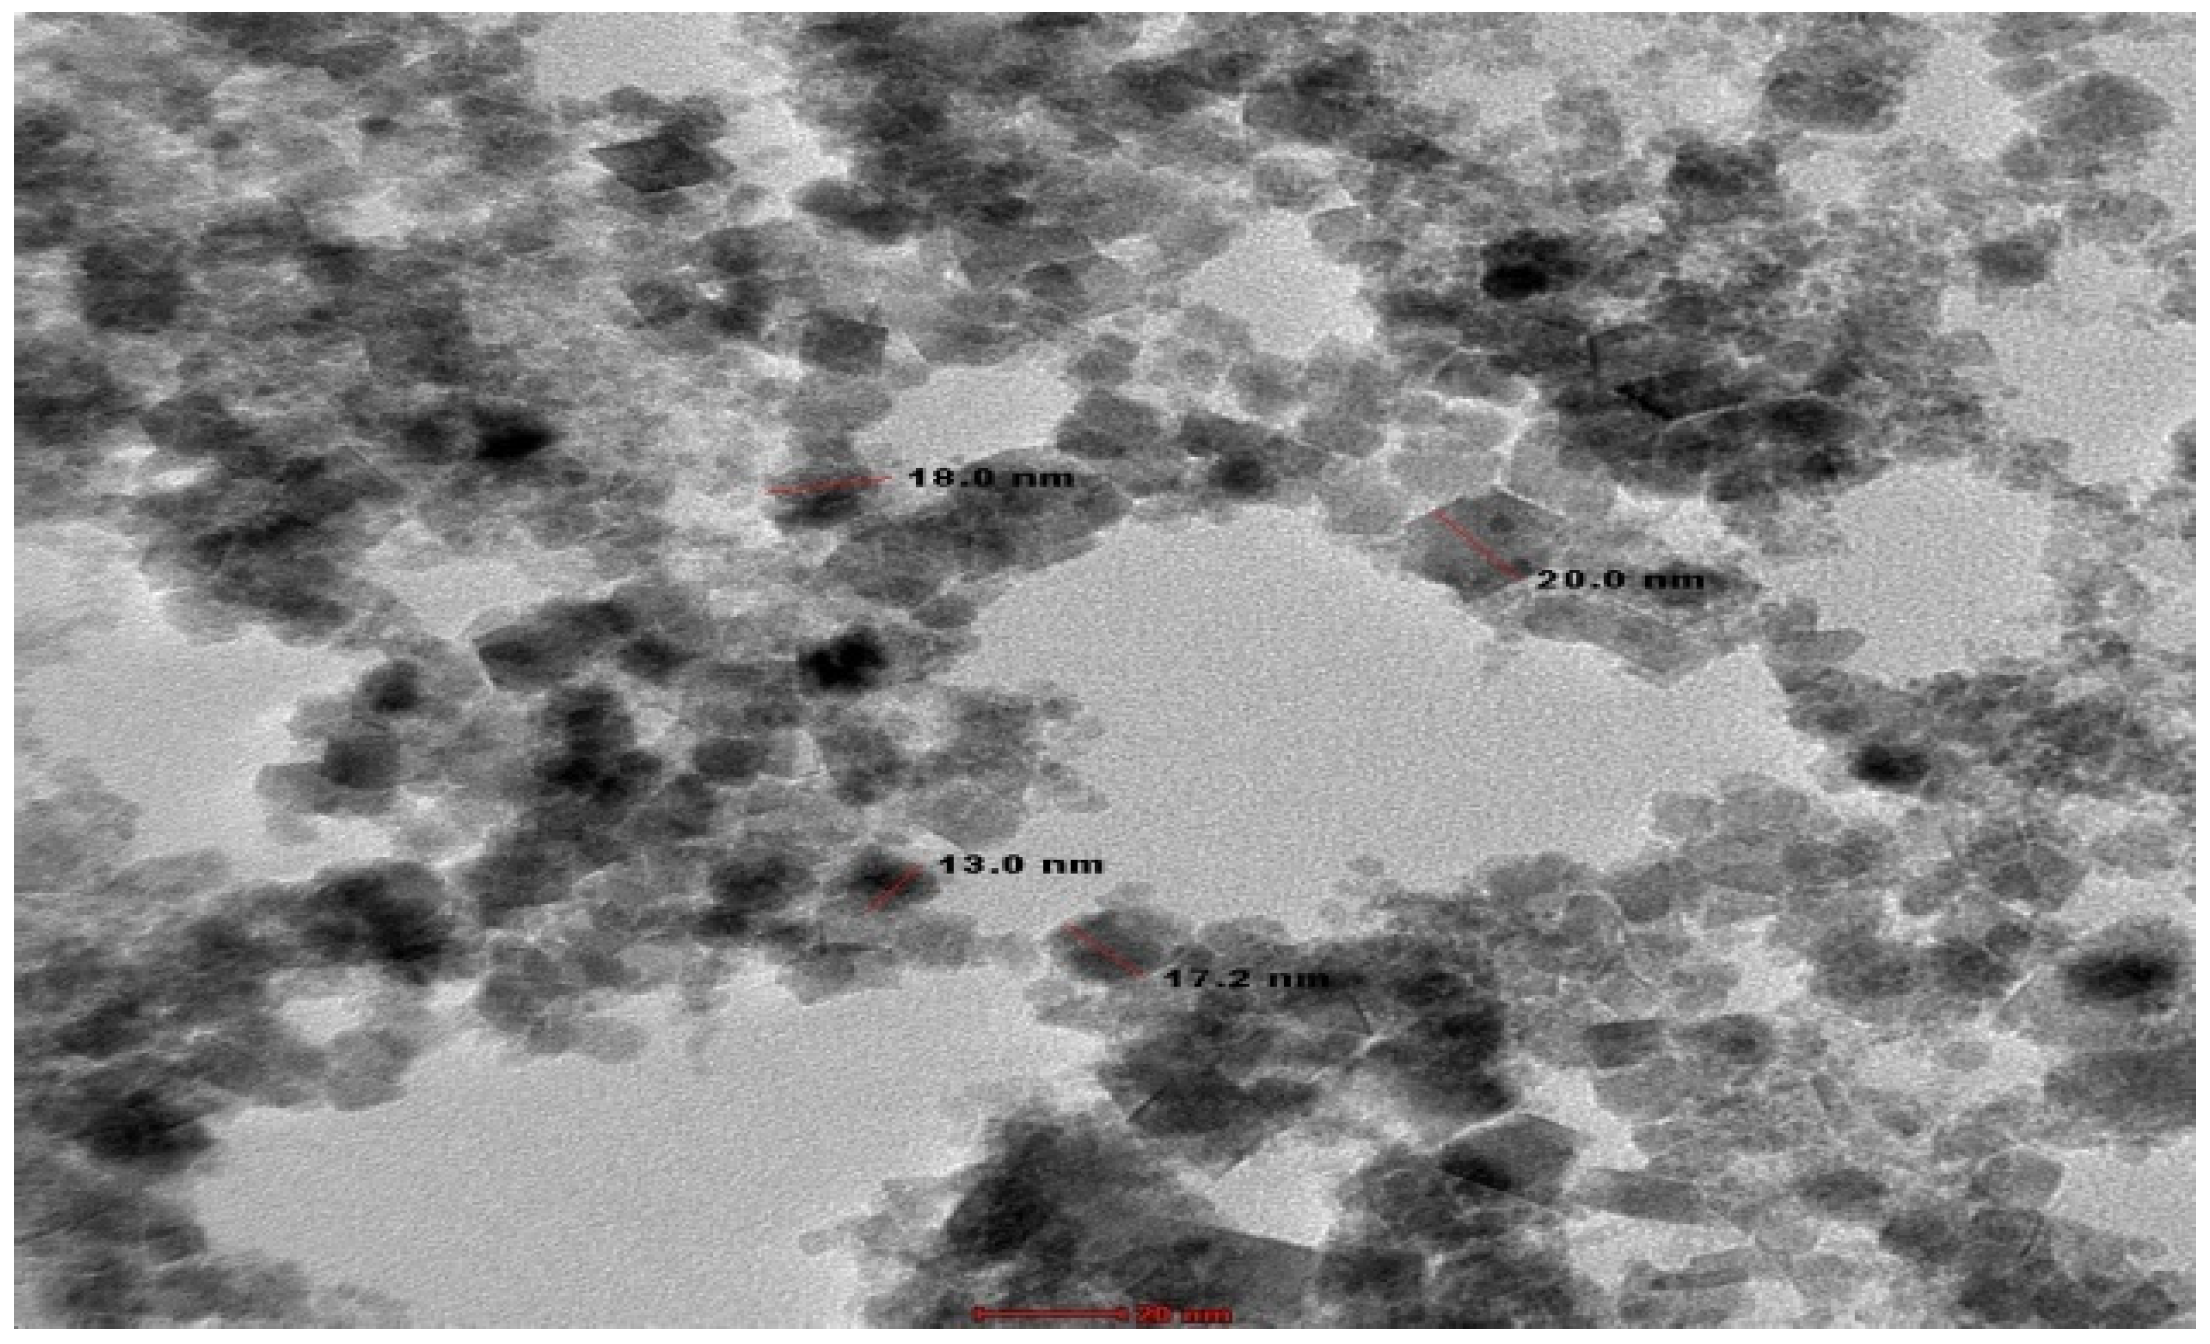
3.1. Magnetite Nanoparticles Characterization
3.2. Morphological Characterization
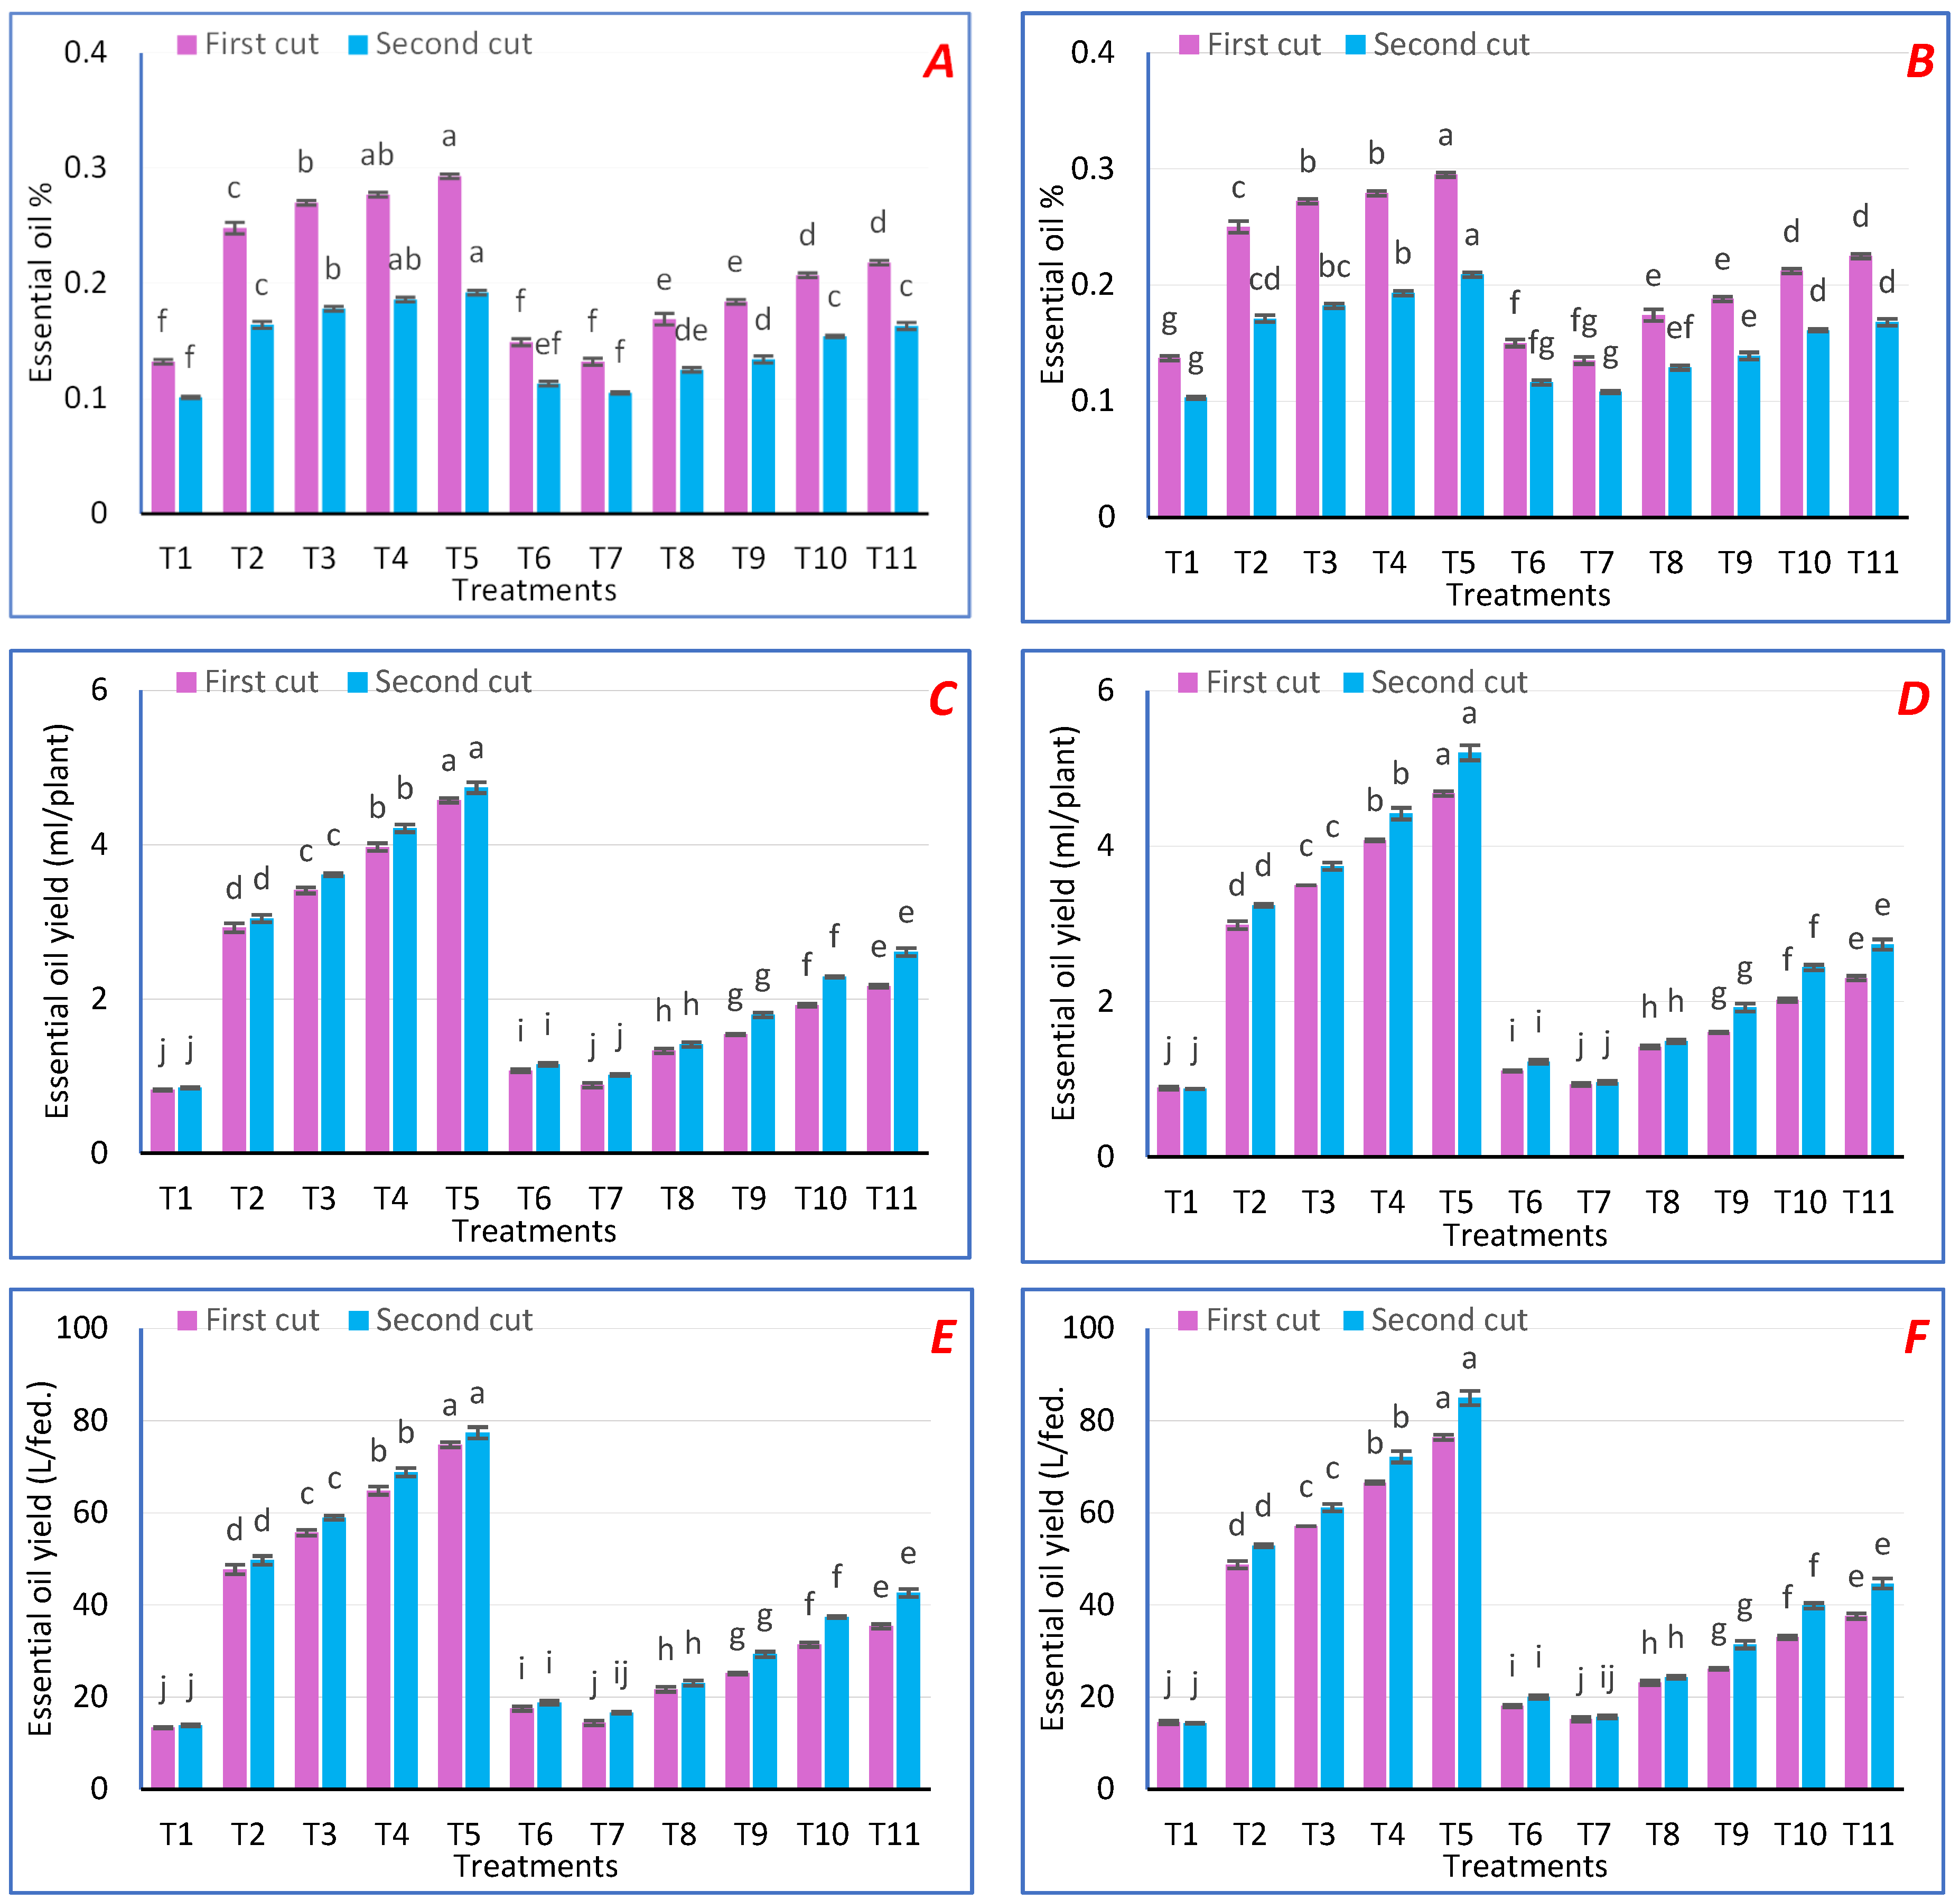
3.3. Essential Oil Yield
3.4. Chemical Composition of Essential Oils
3.5. Measurement of Chlorophyll and Its Assimilation and Chlorophyll Precursor
3.6. Measurement of Ion Levels
3.7. Total Carbohydrate
3.8. Phytopharmaceuticals
4. Discussion
5. Conclusions
Supplementary Materials
Author Contributions
Funding
Data Availability Statement
Acknowledgments
Conflicts of Interest
References
- Kumar, D.; Padalia, R.C.; Suryavanshi, P.; Chauhan, A.; Pratap, P.; Verma, S.; Venkatesha, K.T.; Kumar, R.; Singh, S.; Tiwari, A.K. Essential oil yield, composition and quality at different harvesting times in three prevalent cultivars of rose-scented geranium. J. Appl. Hortic. 2021, 23, 19–23. [Google Scholar] [CrossRef]
- Pandey, P.; Upadhyay, R.K.; Singh, V.R.; Padalia, R.C.; Kumar, R.; Venkatesha, K.T.; Tiwari, A.K.; Singh, S.; Tewari, S.K. Pelargonium graveolens L. (Rose-scented geranium): New hope for doubling Indian farmers’ income. Environ. Conserv. J. 2020, 21, 141–146. [Google Scholar] [CrossRef]
- Blerot, B.; Baudino, S.; Prunier, C.; Demarne, F.; Toulemonde, B.; Caissard, J.C. Botany, agronomy and biotechnology of Pelargonium used for essential oil production. Phytochem. Rev. 2015, 26, 807–816. [Google Scholar] [CrossRef]
- Androutsopoulou, C.; Christopoulou, S.D.; Hahalis, P.; Kotsalou, C.; Lamari, F.N.; Vantarakis, A. Evaluation of essential oils and extracts of rose geranium and rose petals as natural preservatives in terms of toxicity, antimicrobial, and antiviral activity. Pathogens 2021, 10, 494. [Google Scholar] [CrossRef]
- Mosta, N.M.; Soundy, P.; Steyn, J.M.; Learmonth, R.A.; Mojela, N.; Teubes, C. Plant shoot age and temperature effects on essential oil yield and oil composition of rose-scented geranium (Pelargonium sp.) grown in South Africa. J. Essent. Oil Res. 2006, 18, 106–110. [Google Scholar]
- Asgarpanah, J.; Ramezanloo, F. An overview on phytopharmacology of Pelargonium graveolens L. Indian J. Tradit. Knowl. 2015, 14, 558–563. [Google Scholar]
- Abou-Sreea, A.I.B.; Yassen, A.A.A.A.; El-Kazzaz, A.A.A. Effects of iron (ii) sulfate and potassium humate on growth and chemical composition of Coriandrum sativum L. Int. J. Agric. Res. 2017, 12, 136–145. [Google Scholar] [CrossRef]
- El-Khateeb, M.A.; El-Attar, A.B.; Abo-Bakr, Z.A.M. Effect of nano-microlements on growth, yield and essential oil production of sweet marjoram (Origanum majorana) plants. Plant Arch. 2020, 20, 8315–8324. [Google Scholar]
- Filiz, E.; Akbudak, M.A. Investigation of PIC1 (permease in chloroplasts 1) gene’s role in iron homeostasis: Bioinformatics and expression analyses in tomato and sorghum. BioMetals 2020, 33, 29–44. [Google Scholar] [CrossRef]
- Gao, F.; Dubos, C. Transcriptional integration of plant responses to iron availability. J. Exp. Bot. 2020, 72, 2056–2070. [Google Scholar] [CrossRef]
- Jeong, J.; Guerinot, M.L. Homing in on iron homeostasis in plants. Trend Plant Sci. 2009, 14, 280–285. [Google Scholar] [CrossRef]
- Wang, Y.; Kang, Y.; Zhong, M.; Zhang, L.; Chai, X.; Jiang, X.; Yang, X. Effects of iron deficiency stress on plant growth and quality in flowering chinese cabbage and its adaptive response. Agronomy 2022, 12, 875. [Google Scholar] [CrossRef]
- Tripathi, D.K.; Singh, S.; Gaur, S.; Singh, S.W.; Yadav, V.; Liu, S.; Singh, V.P.; Sharma, S.; Srivastava, P.; Prasad, S.M.; et al. Acquisition and homeostasis of iron in higher plants and their probable role in abiotic stress tolerance. Front. Environ. Sci. 2018, 5, 86. [Google Scholar] [CrossRef] [Green Version]
- Li, J.; Cao, X.; Jia, X.; Liu, L.; Cao, H.; Qin, W.; Li, M. Iron deficiency leads to chlorosis through impacting chlorophyll synthesis and nitrogen metabolism in Areca catechu L. Front. Plant Sci. 2021, 12. [Google Scholar] [CrossRef] [PubMed]
- Bindraban, P.S.; Dimkpa, C.; Nagarajan, L.; Roy, A.; Rabbinge, R. Revisiting fertilisers and fertilisation strategies for improved nutrient uptake by plants. Biol. Fertil. Soils 2015, 51, 897–911. [Google Scholar] [CrossRef]
- Balk, J.; von Wirén, N.; Thomine, S. The iron will of the research community: Advances in iron nutrition and interactions in lockdown times. J. Exp. Bot. 2021, 72, 2011–2013. [Google Scholar] [CrossRef]
- EU Directive. Regulation (EC) No 2003/2003 of the European parliament and of the Council of 13 October 2003 relating to fertilizers. Off. J. Eur. Union 2003. [Google Scholar]
- Gutierrez-Ruelas, N.J.; Palacio-Marquez, A.; Sanchez, E.; Munoz-Marquez, E.; Chavez-Mendoza, C.; Ojeda-Barrios, D.L.; Flores-Cordova, M.A. Impact of the foliar application of nanoparticles, sulfate and iron chelate on the growth, yield and nitrogen assimilation in green beans. Not. Bot. Horti Agrobot. 2021, 49, 12437. [Google Scholar] [CrossRef]
- Schonherr, J.; Fernandez, V.; Schreiber, L. Rates of cuticular penetration of chelated FeIII, Role of humidity, concentration, adjuvants, temperature and type of chelate. J. Agric. Food Chem. 2005, 53, 4484–4492. [Google Scholar] [CrossRef]
- Farajzadeh, M.T.; Yarnia, E.M.; Khorshidi, M.B.; Ahmadzadeh, V. Effect of micronutrients and their application method on yield, crop growth rate and net assimilation rate of corn cv. Jeta. J. Food Agric. Environ. 2009, 7, 611–615. [Google Scholar]
- Šramek, F.; Dubsky, M. Occurrence and correction of chlorosis in young petunia plants. HortScience 2009, 36, 147–153. [Google Scholar] [CrossRef]
- Hyvönen, H.; Orama, M.; Saarinen, H.; Aksela, R. Studies on biodegradable chelating agents: Complexation of iminodisuccinic acid (ISA) with Cu(II), Zn(II), Mn(II) and Fe(III) ions in aqueous solution. Green Chem. 2003, 5, 410–414. [Google Scholar] [CrossRef]
- Asadi-Kavan, Z.; Khavari-Nejad, R.A.; Iranbakhsh, A.; Najafi, F. Cooperative effects of iron oxide nanoparticle (α-Fe2O3) and citrate on germination and oxidative system of evening primrose (Oenthera biennis L.). J. Plant Interact. 2020, 15, 166–179. [Google Scholar] [CrossRef]
- El-Sonbaty, A.E. Application of potassium humate and magnetite iron nanoparticles to enhance growth and yield quality of onion plants grown on salt affected soil. Plant Cell Biotechnol. Mol. Biol. 2021, 22, 56–68. [Google Scholar]
- Nejad, A.R.; Izadi, Z.; Sepahvand, K.; Mumivand, H.; Mousavi-Far, S. Changes in total phenol and some enzymatic and non-enzymatic antioxidant activities of rose-scented geranium (Pelargonium graveolens) in response to exogenous ascorbic acid and iron nutrition. J. Ornam. Plants 2020, 10, 27–36. [Google Scholar]
- Peng, L.; Qin, P.; Lei, M.; Zeng, Q.; Song, H.; Yang, J.; Shao, J.; Liaoa, B.; Gu, J. Modifying Fe3O4 nanoparticles with humic acid for removal of Rhodamine B in water. J. Hazard. Mater. 2012, 209, 193–198. [Google Scholar] [CrossRef]
- Black, C.A.; Evans, D.O.; Ensminger, L.E.; White, J.L.; Clark, F.E.; Dinauer, R.C. Methods of soil analysis. Part 2. In Chemical and Microbiological Properties, 2nd ed.; Soil Science Society of America, Inc.; American Society of Agronomy, Inc.: Madison, WI, USA, 1982. [Google Scholar]
- Abouelatta, A.M.; Keratum, A.Y.; Ahmed, S.I.; El-Zun, H.M. The effect of air-drying and extraction methods on the yield and chemical composition of Geranium (Pelargonium graveolens L. ’Hér) essential oils. Am. J. Appl. Ind. Chem. 2021, 5, 17–21. [Google Scholar] [CrossRef]
- Adams, P.R. Identification of Essential Oil Components by Gas Chromatography/Mass Spectrometry; Allured Publishing Corporation: Carol Stream, IL, USA, 2007. [Google Scholar]
- Motsara, M.R.; Roy, R.N. Guide to Laboratory Establishment for Plant Nutrient Analysis; FAO Fertilizer and Plant Nutrition Bulletin: Rome, Italy, 2008. [Google Scholar]
- Cooper, T.G. The Tools of Biochemistry; A Wiley-Interscience Pub. Wiley: New York, NY, USA, 1977. [Google Scholar]
- Bettinelli, M.; Beone, G.M.; Spezia, S.; Baffi, C. Determination of heavy metals in soils and sediments by microwave-assisted digestion and inductively coupled plasma oprical emission spectrometetry analysis. Anal. Chim. Acta 2000, 424, 289–296. [Google Scholar] [CrossRef]
- Lichtenthaler, H.K.; Wellburn, A.R. Determination of total carotenoids and chlorophylls A and B of leaf in different solvents. Bio. Soc. Trans. 1985, 11, 591–592. [Google Scholar] [CrossRef]
- Radojevic, M.; Bashkin, V.N. Practical Environmental Analysis, 2nd ed.; RSC Publishing: Cambridge, UK, 2006. [Google Scholar]
- Harpaz-Saad, S.; Azoulay, T.; Arazi, T.; Ben-Yaakov, E.; Mett, A.; Shiboleth, Y.M.; Hortensteiner, S.; Gidoni, D.; Gal-On, A.; Goldschmidt, E.E.; et al. Chlorophyllase is a rate-limiting enzyme in chlorophyll catabolism and is post translationally regulated. Plant Cell 2007, 19, 1007–1022. [Google Scholar] [CrossRef]
- Sarropoulou, V.; Dimassi-Theriou, K.; Therios, I.; Koukourikou-Petridou, M. Melatonin enhances root regeneration, photosynthetic pigments, biomass, total carbohydrates and proline content in the cherry rootstock PHL-C (Prunus avium × Prunus cerasus). Plant Physiol. Biochem. 2012, 61, 162–168. [Google Scholar] [CrossRef] [PubMed]
- Zhang, B.; Zheng, L.P.; Wang, J.W. Nitric oxide elicitation for secondary metabolite production in cultured plant cells. Appl. Microbiol. Biotechnol. 2012, 93, 455–466. [Google Scholar] [CrossRef] [PubMed]
- Meda, A.; Lamien, C.E.; Romito, M.; Millogo, J.; Nacoulma, O.G. Determination of the total phenolic, flavonoid and praline contents in Burkina Fasan honey, as well as their radical scavenging activity. Food Chem. 2005, 91, 571–577. [Google Scholar] [CrossRef]
- Abdel-Aal, E.S.M.; Hucl, P. A rapid method for quantifying total anthocyanin in blue aleurone and purple pericarp wheat. Cereal Chem. 1999, 76, 350–354. [Google Scholar] [CrossRef]
- Kah, M.; Kookana, R.S.; Gogos, A.; Bucheli, T.D. A critical evaluation of nanopesticides and nanofertilizers against their conventional analogues. Nat. Nanotechnol. 2018, 13, 677–684. [Google Scholar] [CrossRef] [PubMed]
- Ghormade, V.; Deshpande, M.V.; Paknikar, K.M. Perspectives for nano-biotechnology enabled protection and nutrition of plants. Biotechnol. Adv. 2011, 29, 792–803. [Google Scholar] [CrossRef]
- Aslani, F.; Bagheri, S.; Julkapli, N.M.; Juraimi, A.; Farahnaz, F.S.; Hashemi, S.; Baghdadi, A. Effects of engineered nanomaterials on plants growth: An Overview. Sci. World J. 2014, 2014, 1–28. [Google Scholar] [CrossRef] [Green Version]
- ElFeky, S.A.; Mohammed, M.A.; Khater, M.S.; Osman, Y.A.H.; Elsherbini, E. Effect of magnetite Nano-Fertilizer on Growth and yield of Ocimum basilicum L. Int. J. Indig. Med. Plants 2013, 46, 1286–1293. [Google Scholar]
- Wang, H.; Kou, X.; Pei, Z.; Xiao, J.Q.; Shan, X.; Xing, B. Physiological effects of magnetite (Fe3O4) nanoparticles on perennial ryegrass (Lolium perenne L.) and pumpkin (Cucurbita mixta) plants. Nanotoxicology 2011, 5, 30–42. [Google Scholar] [CrossRef]
- Zahra, Z.; Arshad, M.; Rafique, R.; Mahmood, A.; Habib, A.; Qazi, I.A.; Khan, S.A. Metallic nanoparticle (TiO2 and Fe3O4) application modifies rhizosphere phosphorus availability and uptake by Lactuca sativa. J. Agric. Food Chem. 2015, 63, 6876–6882. [Google Scholar] [CrossRef]
- Jia, M.S.H.; Mateen, A.K.; Sohani Das, S.; William, C.M.; Elizabeth, C.T.; Dixie, J.G. Fe2+ binds iron responsive element-RNA, selectively changing protein-binding affinities and regulating mRNA repression and activation. Proc. Natl. Acad. Sci. USA 2012, 109, 8417–8422. [Google Scholar]
- Kokina, I.; Plaksenkova, I.; Jermaļonoka, M.; Petrova, A. Impact of iron oxide nanoparticles on yellow medick (Medicago falcata L.) plants. J. Plant Interact. 2020, 15, 1–7. [Google Scholar] [CrossRef]
- Markus Lange, B.; Wildung, M.R.; Stauber, E.J.; Christopher, S.; Derek, P.; Rodney, C. Probing essential oil biosynthesis and secretion by functional evaluation of expressed sequence tags from mint glandular trichomes. Proc. Natl. Acad. Sci. USA 2000, 97, 2934–2939. [Google Scholar] [CrossRef]
- Abdel Wahab, M.M.; Taha, S.S. Main sulphur content in essential oil of Eruca sativa as affected by nano iron and nano zinc mixed with organic manure. Agriculture 2018, 64, 65–79. [Google Scholar] [CrossRef]
- Sharopov, F.S.; Zhang, H.; Setzer, W.N. Composition of geranium (Pelargonium graveolens) essential oil from Tajikistan. Am. J. Essent. Oils Nat. Prod. 2014, 2, 13–16. [Google Scholar]
- Askary, M.; Talebi, S.; Amini, F.; Bangan, A. Effects of iron nano-particles on Mentha piperita L. under salinity stress. Biologia 2017, 63, 65–75. [Google Scholar]
- Verma, R.S.; Verma, R.K.; Yadav, A.K.; Chauhan, A. Changes in the essential oil composition of rose-scented geranium (Pelargonium graveolens L’Her ex Ait.) due to date of transplanting under hill conditions of Uttarakhand. Indian J. Nat. Prod. Resour. 2010, 1, 367–370. [Google Scholar]
- Weiss, E.A. Essential Oil Crops; Centre for Agriculture and Biosciences (CAB) International: New York, NY, USA, 1997. [Google Scholar]
- Peterson, A.; Machmudah, S.; Roy, B.C.; Goto, M.; Sasaki, M.; Hirose, T. Extraction of essential oil from geranium (Pelargonium graveolens) with supercritical carbon dioxide. J. Chem. Tech. Biotechnol. 2006, 81, 167–172. [Google Scholar] [CrossRef]
- Rao, R.B.R.; Kaul, P.N.; Mallavarapu, G.R.; Ramesh, S. Effect of seasonal climatic changes on biomass yield and terpenoid composition of rose-scented geranium (Pelargonium species). Biochem. Sys. Ecol. 1996, 24, 627–635. [Google Scholar] [CrossRef]
- Mohammadi, H.; Hatami, M.; Feghezadeh, K.; Ghorbanpour, M. Mitigating effect of nano-zerovalent iron, iron sulfate and EDTA against oxidative stress induced by chromium in Helianthus annuus L. Acta Physiol. Plant. 2018, 40, 69. [Google Scholar] [CrossRef]
- Kroh, G.E.; Pilon, M. Regulation of iron homeostasis and use in chloroplasts. Int. J. Mol. Sci. 2020, 21, 3395. [Google Scholar] [CrossRef] [PubMed]
- Barhoumi, L.; Oukarroum, A.; Taher, L.B.; Smiri, L.S.; Abdelmelek, H.; Dewez, D. Effects of superparamagnetic iron oxide nanoparticles on photosynthesis and growth of the aquatic plant Lemna gibba. Arch. Environ. Contam. Toxicol. 2015, 68, 510–520. [Google Scholar] [CrossRef]
- Vleck, L.M.; Gasman, M.L. Reversal of α, α’-dipyridyl-induced porphyrin synthesis in etiolated and greening red kidney bean leaves. Plant Physiol. 1979, 64, 393–397. [Google Scholar]
- Chereskin, B.M.; Castelfranco, P.A. Effects of iron and oxygen on chlorophyll biosynthesis. II Observations on the biosynthetic pathway of isolated etiochloroplasts. Plant Physiol. 1982, 69, 112–116. [Google Scholar] [CrossRef]
- Tombuloglu, H.; Slimani, Y.; Tombuloglu, G.; Korkmaz, A.D.; Baykal, A.; Almessiere, M.; Ercan, I. Impact of superparamagnetic iron oxide nanoparticles (SPIONs) and ionic iron on the physiology of summer squash (Cucurbita pepo): A comparative study. Plant Physiol. Biochem. 2019, 139, 56–65. [Google Scholar] [CrossRef] [PubMed]
- Yeshi, K.; Wangchuk, P. Essential oils and their bioactive molecules in healthcare. Herb. Biomol. Healthc. Appl. 2022, 215–237. [Google Scholar] [CrossRef]
- Bienfait, H.; Der Mark, F.V. Phytoferritin and its role in iron metabolism. In Metals and Micronutrients: Uptake and Utilization by Plants; Robb, D.A., Pierpoint, W.S., Eds.; Academic Press: New York, NY, USA, 1983. [Google Scholar]
- Giraldo, J.; Landry, M.; Faltermeier, S.; Nicholas, M.; Iverson, N.; Boghossian, A.; Reuel, N.; Hilmer, A.; Sen, F.; Brew, J.; et al. Plant nanobionics approach to augment photosynthesis and biochemical sensing. Nat. Mater. 2014, 13, 400–408. [Google Scholar] [CrossRef] [PubMed]
- Erdale, I. Effect of foliar iron applications at different growth stages on iron and some nutrient concentrations in strawberry cultivars. Turk. J. Agric. For. 2004, 28, 421–427. [Google Scholar]
- Tavallali, V. Effects of iron nano-complex and Fe-EDDHA on bioactive compounds and nutrient status of purslane plants. Int. Agrophys. 2018, 32, 411–419. [Google Scholar] [CrossRef]
- Sahua, M.P.; Singha, H.G. Effect of sulphur on prevention of iron chlorosis and plant composition of groundnut on alkaline calcareous soils. J. Agric. Sci. 1987, 109, 73–77. [Google Scholar] [CrossRef]
- Moghadam, A.; Vattani, H.; Baghaei, N.; Keshavarz, N. Effect of different levels of fertilizer nano-iron chelates on growth and yield characteristics of two varieties of Spinach (Spinacia oleracea L.). Res. J. Appl. Sci. Eng. Technol. 2012, 4, 4813–4818. [Google Scholar]
- Pliankong, P.; Padungsak, S.A.; Wannakrairoj, S. Chitosan elicitation for enhancing of vincristine and vinblastine accumulation in cell culture of Catharanthus roseus (L.) G. Don. J. Agric. Sci. 2018, 10, 287–293. [Google Scholar] [CrossRef]
- Gupta, S.; Chaturvedi, P.; Kulkarni, M.G.; Van Staden, J. A critical review on exploiting the pharmaceutical potential of plant endophytic fungi. Biotechnol. Adv. 2020, 39, 107462. [Google Scholar] [CrossRef]
- Bakalova, R.; Zhelev, Z.; Miller, T.; Aoki, I.; Higashi, T. Vitamin C versus cancer: Ascorbic acid radical and impairment of mitochondrial respiration? Hindawi Oxidative Med. Cell Longev. 2020, 2020, 1504048. [Google Scholar] [CrossRef]
- Dai, J.; Mumper, R. Plant phenolics: Extraction, analysis and their antioxidant and anticancer properties. Molecules 2010, 15, 7313–7352. [Google Scholar] [CrossRef] [PubMed]
- Ismail, B.B.; Yusuf, H.L.; Pu, Y.; Zhao, H.; Guo, M.; Liu, D. Ultrasound-assisted adsorption/desorption for the enrichment and purification of flavonoids from baobab (Adansonia digitata) fruit pulp. Ultrason. Sonochem. 2020, 65, 104980. [Google Scholar] [CrossRef]
- Matsuda, H.; Morikawa, T.; Ando, S.; Toguchida, I.; Yoshikawa, M. Structural requirements of flavonoids for nitric oxide production inhibitory activity and mechanism of action. Bioorg. Med. Chem. 2003, 11, 1995–2000. [Google Scholar] [CrossRef]
- Ghasemzadeh, A.; Jaafar, H.Z.E. Anticancer and antioxidant activities of Malaysian young ginger (Zingiber officinale Roscoe) varieties grown under different CO2 concentration. J. Med. Plant Res. 2011, 5, 3247–3255. [Google Scholar]
- Basli, A.; Belkacem, N.; Amrani, I. Health Benefits of Phenolic Compounds against Cancers; IntechOpen: London, UK, 2017; ISBN 978-953-51-2960-8. [Google Scholar] [CrossRef]
- Miguel-Chávez, R.S. Phenolic Antioxidant Capacity: A Review of the State of the Art, Phenolic Compounds-Biological Activity; Soto-Hernandez, M., Palma-Tenango, M., Garcia-Mateos, M.R., Eds.; IntechOpen: London, UK, 2017; Available online: https://www.intechopen.com/books/phenolic-compounds-biological-activity/phenolic-antioxidant-capacity-a-review-of-the-state-of-the-art (accessed on 6 March 2022).
- Halliwell, B.; Gutteridge, J.M. Protection against oxidants in biological system: The superoxide theory of oxygen toxicity. In Free Radicals in Biology and Medicine; Halliwell, B., Gutteridge, J.M., Eds.; Clarendon Press: Oxford, UK, 1989; pp. 86–123. [Google Scholar]
- Fimognari, C.; Berti, F.; Nusse, M.; Cantelli Forti, G.; Hrelia, P. In vitro antitumor activity of cyanidin-3-O-glucopyranoside. Chemotherapy 2005, 51, 332–335. [Google Scholar] [CrossRef]


| Soil Properties | Values | ||
|---|---|---|---|
| 1st Season | 2nd Season | ||
| Particle size distribution (%) | Sand (%) | 21.00 | 21.19 |
| Silt (%) | 35.92 | 34.82 | |
| Clay (%) | 43.08 | 44.08 | |
| Some physical and chemical trials | Electrical conductivity (dSm−1) | 4.070 | 4.060 |
| pH (soil paste) | 7.630 | 7.700 | |
| Calcium carbonate (%) | 3.730 | 3.810 | |
| Nitrogen (mg kg−1 soil) | 20.32 | 21.03 | |
| Phosphorus (mg kg−1 soil) | 16.72 | 17.63 | |
| Cations (meq 100 g−1 soil) | Calcium | 2.000 | 4.000 |
| Magnesium | 11.33 | 12.12 | |
| Sodium | 2.740 | 2.720 | |
| potassium | 2.060 | 2.090 | |
| Anions (meq 100 g−1 soil) | Carbonate | 0.000 | 0.000 |
| Bicarbonate | 0.370 | 0.360 | |
| Chloride | 4.690 | 4.650 | |
| sulfate | 5.630 | 5.690 | |
| No. | Treatments | Abbreviation |
|---|---|---|
| 1 | Control (Spraying with tap water) | T1 |
| 2 | Spraying with 5 mg L−1 Fe-NPs | T2 |
| 3 | Spraying with 10 mg L−1 Fe-NPs | T3 |
| 4 | Spraying with 5 mg L−1 Fe-NPs with humic (Fe-NPs-HA) | T4 |
| 5 | Spraying with 10 mg L−1 Fe-NPs with humic (Fe-NPs-HA) | T5 |
| 6 | Spraying with 100 mg L−1 ferric sulfate | T6 |
| 7 | Spraying with 200 mg L−1 ferric sulfate | T7 |
| 8 | Spraying with 100 mg L−1 EDDHA | T8 |
| 9 | Spraying with 200 mg L−1 EDDHA | T9 |
| 10 | Spraying with 100 mg L−1 EDTA | T10 |
| 11 | Spraying with 200 mg L−1 EDTA | T11 |
| First Season | ||||||||
| Treatments | Cut 1 | Cut 2 | ||||||
| Plant Height (cm) | Branches No/Plant | Shoot Fresh Weight (g) | Shoot Dry Weight (g) | Plant Height (cm) | Branches No/Plant | Shoot Fresh Weight (g) | Shoot Dry Weight (g) | |
| T1 | 34.6 ± 0.88 h | 13.0 ± 0.57 h | 617.6 ± 5.48 k | 108.5 ± 0.94 k | 43.3 ± 0.88 h | 18.0 ± 0.57 g | 838.3 ± 6.64 k | 164.0 ± 1.36 k |
| T2 | 66.3 ± 0.88 c | 30.6 ± 0.88 c | 1179 ± 8.50 d | 238.5 ± 1.72 d | 75.6 ± 1.20 c | 43.0 ± 1.15 c | 1852 ± 7.53 d | 438.61.78 d |
| T3 | 71.3 ± 0.88 b | 33.3 ± 0.88 bc | 1261 ± 4.61 c | 258.1 ± 0.94 c | 81.0 ± 1.15 b | 46.0 ± 0.57 bc | 2024 ± 7.83 c | 483.6 ± 1.87 c |
| T4 | 75.0 ± 0.57 ab | 35.0 ± 0.57 ab | 1433 ± 8.14 b | 303.6 ± 1.72 b | 84.3 ± 1.20 ab | 48.0 ± 1.15 ab | 2262 ± 8.14 b | 545.5 ± 1.96 b |
| T5 | 78.3 ± 0.88 a | 38.0 ± 0.57 a | 1560 ± 6.35 a | 341.1 ± 1.39 a | 89.0 ± 1.15 a | 51.3 ± 0.88 a | 2469 ± 6.08 a | 616.0 ± 1.51 a |
| T6 | 42.6 ± 0.88 fg | 17.0 ± 0.57 fg | 719.3 ± 7.51 i | 125.2 ± 1.30 i | 49.6 ± 0.88 fg | 20.6 ± 0.88 fg | 1020 ± 7.83 i | 217.5 ± 1.67 i |
| T7 | 39.6 ± 0.88 g | 15.0 ± 0.57 gh | 665.0 ± 6.08 j | 116.5 ± 0.68 j | 45.6 ± 0.88 gh | 19.0 ± 0.57 fg | 965.0 ± 4.72 j | 198.5 ± 1.00 j |
| T8 | 46.3 ± 0.88 f | 20.0 ± 0.57 ef | 783.6 ± 6.93 h | 137.6 ± 1.21 gh | 53.6 ± 0.88 ef | 23.0 ± 0.57 f | 1123 ± 6.11 h | 243.2 ± 1.32 h |
| T9 | 51.3 ± 0.88 e | 23.0 ± 0.57 de | 834.3 ± 6.11 g | 148.3 ± 1.08 g | 58.3 ± 0.88 e | 28.6 ± 0.88 e | 1332 ± 11.4 g | 291.2 ± 2.49 g |
| T10 | 57.6 ± 0.88 d | 24.0 ± 0.57 d | 928.3 ± 5.78 f | 174.1 ± 1.08 f | 65.60.88 d | 32.3 ± 0.88 de | 1483 ± 7.93 f | 336.2 ± 1.79 f |
| T11 | 61.3 ± 0.88 d | 26.0 ± 0.57 d | 990.3 ± 4.33 e | 187.2 ± 0.81 e | 72.0 ± 1.15 c | 36.0 ± 0.57 d | 1597 ± 7.05 e | 365.8 ± 1.61 e |
| ANOVA p | *** | *** | *** | *** | *** | *** | *** | *** |
| Second season | ||||||||
| Treatments | Cut 1 | Cut2 | ||||||
| Plant Height (cm) | Branches No/plant | Shoot fresh weight (g) | Shoot dry weight (g) | Plant Height (cm) | Branches No/plant | Shoot fresh weight (g) | Shoot dry weight (g) | |
| T1 | 36.6 ± 0.88 h | 15.0 ± 0.57 f | 648.6 ± 5.23 k | 114.0 ± 0.90 k | 44.6 ± 0.88 g | 19.0 ± 0.57 f | 851.3 ± 4.94 k | 166.8 ± 1.00 k |
| T2 | 67.6 ± 0.88 c | 32.6 ± 0.88 b | 1192 ± 4.33 d | 241.4 ± 0.87 d | 77.0 ± 0.57 c | 44.6 ± 0.88 b | 1886 ± 6.93 d | 447.3 ± 1.64 d |
| T3 | 72.3 ± 0.88 b | 34.3 ± 0.88 ab | 1283 ± 3.60 c | 263.0 ± 0.73 c | 82.3 ± 0.88 b | 47.6 ± 0.88 ab | 2052 ± 6.38 c | 491.0 ± 1.52 c |
| T4 | 75.6 ± 0.88 b | 37.0 ± 1.15 ab | 1457 ± 3.84 b | 309.1 ± 0.812 b | 86.6 ± 0.88 ab | 50.0 ± 1.15 a | 2282 ± 6.08 b | 551.3 ± 1.46 b |
| T5 | 81.3 ± 0.88 a | 39.0 ± 1.15 a | 1583 ± 4.05 a | 346.6 ± 0.88 a | 91.0 ± 1.15 a | 51.6 ± 1.20 a | 2489 ± 6.42 a | 621.7 ± 1.60 a |
| T6 | 44.6 ± 0.88 fg | 18.6 ± 1.20 ef | 734.6 ± 4.91 e | 128.0 ± 0.85 i | 52.6 ± 0.88 f | 23.0 ± 0.57 ef | 1055 ± 6.80 i | 225.2 ± 1.45 i |
| T7 | 41.6 ± 0.88 g | 16.0 ± 0.57 ef | 688.0 ± 3.78 j | 120.3 ± 0.66 j | 47.6 ± 0.88 g | 20.0 ± 0.57 f | 890.3 ± 4.97 j | 186.2 ± 1.06 j |
| T8 | 47.3 ± 0.88 f | 20.3 ± 1.20 de | 810.0 ± 4.35 h | 142.5 ± 0.76 h | 55.6 ± 0.88 f | 25.3 ± 0.88 e | 1154 ± 4.35 h | 250.1 ± 0.94 h |
| T9 | 52.3 ± 0.88 e | 24.0 ± 1.15 cd | 849.3 ± 6.11 g | 151.3 ± 1.09 g | 61.3 ± 0.88 e | 31.0 ± 1.15 d | 1377 ± 7.00 g | 301.4 ± 1.53 g |
| T10 | 60.3 ± 0.88 d | 25.3 ± 0.88 c | 952.0 ± 5.50 f | 178.8 ± 1.03 f | 67.6 ± 0.88 d | 34.3 ± 0.88 cd | 1509 ± 5.50 f | 342.4 ± 1.24 f |
| T11 | 63.3 ± 0.88 cd | 27.6 ± 0.88 c | 1019 ± 4.91 e | 193.0 ± 0.93 e | 72.6 ± 0.88 c | 37.6 ± 0.88 c | 1624 ± 6.35 e | 372.3 ± 1.45 e |
| ANOVA p | *** | *** | *** | *** | *** | *** | *** | *** |
| Treatments | α–Pinene | Myrcene | Isomenthone | Linalool | Citronelyl Formate | Geranyl Formate | Citronelol | Geraniol | Geranyl Butrate | Eugenol | β- Caryophyllene | Unknown Constituents | C/G Ratio | |||||||||||
|---|---|---|---|---|---|---|---|---|---|---|---|---|---|---|---|---|---|---|---|---|---|---|---|---|
| RT | Area% | RT | Area% | RT | Area% | RT | Area% | RT | Area% | RT | Area% | RT | Area% | RT | Area% | RT | Area% | RT | Area% | RT | Area% | Area% | ||
| T1 | 2.10 | 0.36 | 3.81 | 1.46 | 5.12 | 4.29 | 5.34 | 4.21 | 6.06 | 7.92 | 6.83 | 8.00 | 7.48 | 21.43 | 8.22 | 21.02 | 8.50 | 1.66 | 10.50 | 13.23 | 11.43 | 2.46 | 13.96 | 0.933 |
| T2 | 2.03 | 0.35 | 3.72 | 0.82 | 5.01 | 3.99 | 5.25 | 5.98 | 5.93 | 5.91 | 6.70 | 5.33 | 7.33 | 22.42 | 8.07 | 19.09 | 8.35 | 9.23 | 10.31 | 8.26 | 10.95 | 4.20 | 14.42 | 0.817 |
| T3 | 2.18 | 0.54 | 3.89 | 0.73 | 5.20 | 5.99 | 5.41 | 5.21 | 6.12 | 8.75 | 6.87 | 7.78 | 7.50 | 25.29 | 8.23 | 23.79 | 8.50 | 1.75 | 10.48 | 10.51 | 11.09 | 1.38 | 8.28 | 1.005 |
| T4 | 1.80 | 0.53 | 3.45 | 1.04 | 4.71 | 6.60 | 4.95 | 8.01 | 5.62 | 9.11 | 6.37 | 7.04 | 6.98 | 25.58 | 7.71 | 23.05 | 7.98 | 1.15 | 9.90 | 6.21 | 10.33 | 1.49 | 10.19 | 1.107 |
| T5 | 2.77 | 1.37 | 4.20 | 1.28 | 5.36 | 4.00 | 5.57 | 5.09 | 6.29 | 5.59 | 7.07 | 7.41 | 7.71 | 24.93 | 8.47 | 27.58 | 8.98 | 1.70 | 10.70 | 10.01 | 11.30 | 2.25 | 3.48 | 0.814 |
| T6 | 2.24 | 0.87 | 3.99 | 0.36 | 5.33 | 4.72 | 5.55 | 6.38 | 6.25 | 5.58 | 7.03 | 5.48 | 7.63 | 18.29 | 8.42 | 30.21 | 8.67 | 2.57 | 10.69 | 8.61 | 11.32 | 2.75 | 14.18 | 0.621 |
| T7 | 2.24 | 0.59 | 4.19 | 0.54 | 5.32 | 4.20 | 5.54 | 6.01 | 6.26 | 6.15 | 7.04 | 7.55 | 7.64 | 19.15 | 8.41 | 26.66 | 8.68 | 3.07 | 10.70 | 11.56 | 11.33 | 5.01 | 9.51 | 0.678 |
| T8 | 2.13 | 0.13 | 3.53 | 0.60 | 4.62 | 5.50 | 4.88 | 5.41 | 5.58 | 8.72 | 6.34 | 7.54 | 7.00 | 22.53 | 7.75 | 26.87 | 7.99 | 1.53 | 9.91 | 8.67 | 10.52 | 2.58 | 9.92 | 0.882 |
| T9 | 1.73 | 0.50 | 3.34 | 0.45 | 4.64 | 4.94 | 4.90 | 5.94 | 5.60 | 7.87 | 6.36 | 5.88 | 7.02 | 20.54 | 7.80 | 29.54 | 8.03 | 1.64 | 9.93 | 9.79 | 10.50 | 1.99 | 10.92 | 0.766 |
| T10 | 2.06 | 0.30 | 3.83 | 0.12 | 5.16 | 3.36 | 5.41 | 6.03 | 6.15 | 7.09 | 6.93 | 9.14 | 7.59 | 23.89 | 8.37 | 27.73 | 8.87 | 2.35 | 10.61 | 10.82 | 11.55 | 1.90 | 7.27 | 0.787 |
| T11 | 2.05 | 0.72 | 3.49 | 0.19 | 5.12 | 4.90 | 5.36 | 6.55 | 6.06 | 5.43 | 6.84 | 6.17 | 7.46 | 21.71 | 8.25 | 36.88 | 8.74 | 0.43 | 10.47 | 6.47 | 11.08 | 1.43 | 9.12 | 0.624 |
| Treatments | α–Pinene | Myrcene | Isomenthone | Linalool | Citronelyl Formate | Geranyl Formate | Citronelol | Geraniol | Geranyl Butrate | Eugenol | β- Caryophyllene | Unknown Constituents | C/G Ratio | |||||||||||
|---|---|---|---|---|---|---|---|---|---|---|---|---|---|---|---|---|---|---|---|---|---|---|---|---|
| RT | Area % | RT | Area % | RT | Area % | RT | Area % | RT | Area % | RT | Area % | RT | Area % | RT | Area % | RT | Area % | RT | Area % | RT | Area % | Area % | ||
| T1 | 2.06 | 0.62 | 3.80 | 1.09 | 5.19 | 6.20 | 5.40 | 5.11 | 6.15 | 9.35 | 6.87 | 4.34 | 7.63 | 35.55 | 8.30 | 17.28 | 8.79 | 0.85 | 10.52 | 8.36 | 11.08 | 2.85 | 8.45 | 2.029 |
| T2 | 2.11 | 0.48 | 3.88 | 0.77 | 5.22 | 6.66 | 5.44 | 6.31 | 6.16 | 8.75 | 6.91 | 6.27 | 7.55 | 26.07 | 8.28 | 24.41 | 8.54 | 1.83 | 10.50 | 5.25 | 11.11 | 0.76 | 12.44 | 1.071 |
| T3 | 2.05 | 0.38 | 3.75 | 0.35 | 4.93 | 4.33 | 5.19 | 12.78 | 5.86 | 6.99 | 6.63 | 2.76 | 7.27 | 28.93 | 8.02 | 22.63 | 8.51 | 2.02 | 10.22 | 5.20 | 10.86 | 1.17 | 12.46 | 1.307 |
| T4 | 2.03 | 0.34 | 4.12 | 0.73 | 5.52 | 5.36 | 5.72 | 5.53 | 6.46 | 8.56 | 7.23 | 5.63 | 7.92 | 34.46 | 8.63 | 17.55 | 8.92 | 2.81 | 10.95 | 9.63 | 11.60 | 3.27 | 6.13 | 2.809 |
| T5 | 2.27 | 1.31 | 4.07 | 1.22 | 5.48 | 5.59 | 5.67 | 3.47 | 6.44 | 8.53 | 7.20 | 3.19 | 7.93 | 32.19 | 8.62 | 14.06 | 8.91 | 2.15 | 10.97 | 10.24 | 11.61 | 2.92 | 15.13 | 2.098 |
| T6 | 2.26 | 0.42 | 3.99 | 1.03 | 5.39 | 4.20 | 5.56 | 2.69 | 6.35 | 7.31 | 7.07 | 3.09 | 7.86 | 32.94 | 8.51 | 12.50 | 8.81 | 3.61 | 10.85 | 13.33 | 11.43 | 2.46 | 16.42 | 2.096 |
| T7 | 2.35 | 0.32 | 4.08 | 0.95 | 5.42 | 4.53 | 5.58 | 3.33 | 6.37 | 8.51 | 7.04 | 3.55 | 7.81 | 36.27 | 8.47 | 14.96 | 8.75 | 2.56 | 10.72 | 11.41 | 11.28 | 3.30 | 10.31 | 2.125 |
| T8 | 2.15 | 0.30 | 3.87 | 0.79 | 5.22 | 4.98 | 5.39 | 2.48 | 6.14 | 7.63 | 6.85 | 3.22 | 7.61 | 34.50 | 8.23 | 11.28 | 8.54 | 2.95 | 10.53 | 13.23 | 11.44 | 4.23 | 14.41 | 2.478 |
| T9 | 2.16 | 0.68 | 3.88 | 1.31 | 5.21 | 5.71 | 5.40 | 3.09 | 6.12 | 7.69 | 6.86 | 3.18 | 7.53 | 31.44 | 8.21 | 15.28 | 8.51 | 2.13 | 10.50 | 12.21 | 11.09 | 4.48 | 12.8 | 1.896 |
| T10 | 2.04 | 1.07 | 3.47 | 1.41 | 4.62 | 6.98 | 4.86 | 2.76 | 5.55 | 8.04 | 6.29 | 4.91 | 6.96 | 36.97 | 7.63 | 11.89 | 7.92 | 1.88 | 9.85 | 7.78 | 10.80 | 2.49 | 13.82 | 2.409 |
| T11 | 2.17 | 0.52 | 3.81 | 0.43 | 5.10 | 4.51 | 5.30 | 3.87 | 6.02 | 7.69 | 6.73 | 4.50 | 7.42 | 26.53 | 8.14 | 22.78 | 8.39 | 2.66 | 10.31 | 10.64 | 11.17 | 2.56 | 13.31 | 1.142 |
| Treatments | First Cut | ||||||||
| Total Chlorophyll (mg g−1 FW) | Total Carotenoids (mg g−1 FW) | Chl A (mg g−1 FW) | Pheo A (mg g−1 FW) | Chl a/Child | Chl b/Child | Mg Proto (μg g−1 FW) | Proto (μg g−1 FW) | Pchilde (mg g−1 FW) | |
| T1 | 0.862 ± 0.031 g | 0.190 ± 0.006 f | 0.530 ± 0.079 e | 0.317 ± 0.014 b | 0.940 ± 0.023 f | 0.895 ± 0.036 c | 0.274 ± 0.015 a | 0.461 ± 0.004 a | 0.977 ± 0.005 a |
| T2 | 1.679 ± 0.038 cd | 0.313 ± 0.010 a–c | 1.148 ± 0.027 ab | 0.476 ± 0.034 a | 1.926 ± 0.062 c | 1.677 ± 0.066 b | 0.209 ± 0.001 bc | 0.293 ± 0.001 f | 0.542 ± 0.033 e |
| T3 | 1.810 ± 0.052 bc | 0.317 ± 0.008 ab | 1.204 ± 0.022 a | 0.481 ± 0.004 a | 2.281 ± 0.020 b | 2.226 ± 0.092 a | 0.188 ± 0.002 cd | 0.265 ± 0.001 g | 0.538 ± 0.009 e |
| T4 | 1.955 ± 0.055 ab | 0.319 ± 0.008 ab | 1.217 ± 0.075 a | 0.508 ± 0.021 a | 2.428 ± 0.039 ab | 2.328 ± 0.127 a | 0.175 ± 0.002 cd | 0.244 ± 0.001 h | 0.530 ± 0.008 e |
| T5 | 2.038 ± 0.008 a | 0.323 ± 0.001 a | 1.248 ± 0.091 a | 0.538 ± 0.016 a | 2.577 ± 0.014 a | 2.355 ± 0.068 a | 0.160 ± 0.001 e | 0.226 ± 0.001 i | 0.503 ± 0.018 e |
| T6 | 1.116 ± 0.008 f | 0.237 ± 0.031 d–f | 0.830 ± 0.016 cd | 0.436 ± 0.035 ab | 0.987 ± 0.026 ef | 0.923 ± 0.041 c | 0.223 ± 0.002 b | 0.314 ± 0.001 c | 0.785 ± 0.027 bc |
| T7 | 0.957 ± 0.005 g | 0.214 ± 0.005 ef | 0.767 ± 0.010 de | 0.429 ± 0.035 ab | 0.975 ± 0.035 f | 0.878 ± 0.082 c | 0.253 ± 0.002 a | 0.354 ± 0.001 b | 0.815 ± 0.035 b |
| T8 | 1.256 ± 0.025 f | 0.255 ± 0.011 c–e | 0.892 ± 0.053 b–d | 0.435 ± 0.017 ab | 1.157 ± 0.037 e | 1.028 ± 0.045 c | 0.217 ± 0.001 b | 0.303 ± 0.001 de | 0.686 ± 0.028 cd |
| T9 | 1.261 ± 0.015 f | 0.263 ± 0.004 be | 0.936 ± 0.010 b–d | 0.453 ± 0.032 a | 1.698 ± 0.037 d | 1.544 ± 0.046 b | 0.216 ± 0.002 b | 0.305 ± 0.001 d | 0.580 ± 0.036 de |
| T10 | 1.448 ± 0.003 e | 0.288 ± 0.005 a–d | 1.017 ± 0.055 a–d | 0.476 ± 0.018 a | 1.725 ± 0.028 d | 1.552 ± 0.051 b | 0.213 ± 0.002 bc | 0.299 ± 0.001 d–f | 0.562 ± 0.011 e |
| T11 | 1.562 ± 0.007 de | 0.298 ± 0.004 a–c | 1.086 ± 0.032 a–d | 0.469 ± 0.030 a | 1.773 ± 0.024 cd | 1.618 ± 0.054 b | 0.211 ± 0.002 bc | 0.296 ± 0.001 ef | 0.556 ± 0.007 e |
| ANOVA p | *** | *** | *** | *** | *** | *** | *** | *** | *** |
| Second Cut | |||||||||
| Treatments | Total Chlorophyll (mg g−1 FW) | Total Carotenoids (mg g−1 FW) | Chl A (mg g−1 FW) | Pheo A (mg g−1 FW) | Chl a/Child | Chl b/Child | Mg Proto (μg g−1 FW) | Proto (μg g−1 FW) | Pchilde (mg g−1 FW) |
| T1 | 0.883 ± 0.011 h | 0.144 ± 0.002 g | 0.430 ± 0.000 f | 0.333 ± 0.011 f | 0.706 ± 0.019 g | 0.645 ± 0.026 h | 0.298 ± 0.002 a | 0.415 ± 0.001 a | 0.913 ± 0.019 a |
| T2 | 1.650 ± 0.008 c | 0.263 ± 0.004 ab | 1.054 ± 0.053 ab | 0.561 ± 0.026 bc | 2.213 ± 0.065 c | 2.032 ± 0.085 cd | 0.198 ± 0.002 d | 0.278 ± 0.001 e | 0.567 ± 0.018 c |
| T3 | 1.813 ± 0.030 b | 0.274 ± 0.004 ab | 1.148 ± 0.043 a | 0.573 ± 0.025 ab | 2.404 ± 0.057 bc | 2.237 ± 0.106 bc | 0.193 ± 0.001 d | 0.269 ± 0.001 f | 0.562 ± 0.011 c |
| T4 | 1.802 ± 0.010 b | 0.283 ± 0.001 a | 1.167 ± 0.022 a | 0.676 ± 0.021 a | 2.526 ± 0.002 b | 2.400 ± 0.054 b | 0.149 ± 0.001 e | 0.209 ± 0.001 g | 0.426 ± 0.017 d |
| T5 | 1.933 ± 0.010 a | 0.286 ± 0.001 a | 1.210 ± 0.068 a | 0.676 ± 0.018 a | 3.671 ± 0.069 a | 3.399 ± 0.126 a | 0.100 ± 0.001 f | 0.140 ± 0.001 h | 0.424 ± 0.004 d |
| T6 | 1.132 ± 0.024 g | 0.179 ± 0.005 f | 0.674 ± 0.032 e | 0.444 ± 0.033 e | 1.087 ± 0.038 ef | 1.012 ± 0.052 fg | 0.248 ± 0.003 b | 0.349 ± 0.001 b | 0.749 ± 0.009 b |
| T7 | 1.096 ± 0.013 g | 0.163 ± 0.012 fg | 0.667 ± 0.016 e | 0.437 ± 0.018 ef | 0.917 ± 0.022 fg | 0.845 ± 0.037 gh | 0.250 ± 0.002 b | 0.348 ± 0.001 b | 0.887 ± 0.004 a |
| T8 | 1.272 ± 0.012 f | 0.193 ± 0.001 ef | 0.767 ± 0.010 de | 0.455 ± 0.009 de | 1.142 ± 0.034 ef | 1.032 ± 0.037 fg | 0.248 ± 0.002 b | 0.346 ± 0.001 b | 0.624 ± 0.015 c |
| T9 | 1.398 ± 0.040 e | 0.210 ± 0.008 de | 0.861 ± 0.043 cd | 0.458 ± 0.024 c–e | 1.302 ± 0.021 e | 1.214 ± 0.039 ef | 0.243 ± 0.001 b | 0.338 ± 0.001 c | 0.606 ± 0.005 c |
| T10 | 1.495 ± 0.023 de | 0.230 ± 0.004 cd | 0.955 ± 0.010 bc | 0.556 ± 0.018 b–d | 1.560 ± 0.046 d | 1.399 ± 0.060 e | 0.219 ± 0.001 c | 0.309 ± 0.001 d | 0.575 ± 0.005 c |
| T11 | 1.539 ± 0.006 d | 0.249 ± 0.007 bc | 1.086 ± 0.032 ab | 0.569 ± 0.002 b | 2.186 ± 0.067 c | 1.852 ± 0.071 d | 0.202 ± 0.002 d | 0.280 ± 0.001 e | 0.573 ± 0.014 c |
| ANOVA p | *** | *** | *** | *** | *** | *** | *** | *** | *** |
| Treatments | Cut 1 | Cut2 | ||||||||||
|---|---|---|---|---|---|---|---|---|---|---|---|---|
| N% | P% | K% | Fe (mg L−1) | Mn (mg L−1) | Zn (mg L−1) | N% | P% | K% | Fe (mg L−1) | Mn (mg L−1) | Zn (mg L−1) | |
| T1 | 1.98 ± 0.026 e | 0.150 ± 0.001 g | 1.13 ± 0.014 g | 144 ± 0.352 k | 21.7 ± 0.161 k | 21.0 ± 0.282 k | 2.35 ± 0.014 f | 0.150 ± 0.001 g | 1.59 ± 0.011 e | 152 ± 1.00 k | 17.5 ± 0.178 i | 35.6 ± 0.294 i |
| T2 | 2.83 ± 0.017 b | 0.179 ± 0.001 c | 1.65 ± 0.017 c | 275 ± 0.889 d | 43.0 ± 0.280 d | 41.7 ± 0.115 d | 3.37 ± 0.011 b | 0.179 ± 0.001 c | 2.28 ± 0.015 b | 451 ± 0.542 d | 25.4 ± 0.121 d | 52.3 ± 0.161 d |
| T3 | 2.87 ± 0.017 b | 0.180 ± 0.001 c | 1.72 ± 0.014 b | 400 ± 1.39 c | 48.5 ± 0.060 c | 47.1 ± 0.282 c | 3.42 ± 0.014 b | 0.180 ± 0.001 c | 2.43 ± 0.011 a | 458 ± 0.069 c | 28.6 ± 0.103 c | 58.9 ± 0.219 c |
| T4 | 2.89 ± 0.026 b | 0.205 ± 0.001 b | 2.03 ± 0.012 a | 411 ± 0.987 b | 77.5 ± 0.092 b | 75.3 ± 0.057 b | 3.43 ± 0.014 b | 0.205 ± 0.001 b | 2.44 ± 0.020 a | 524 ± 0.744 b | 36.7 ± 0.127 b | 75.9 ± 0.173 b |
| T5 | 3.33 ± 0.014 a | 0.222 ± 0.001 a | 2.07 ± 0.014 a | 443 ± 1.40 a | 89.7 ± 0.083 a | 87.0 ± 0.271 a | 3.97 ± 0.017 a | 0.222 ± 0.001 a | 2.45 ± 0.014 a | 534 ± 0.600 a | 43.0 ± 0.196 a | 89.7 ± 0.132 a |
| T6 | 2.18 ± 0.020 d | 0.168 ± 0.001 e | 1.22 ± 0.014 f | 184 ± 0.606 i | 26.0 ± 0.190 i | 25.3 ± 0.127 i | 2.60 ± 0.011 de | 0.168 ± 0.001 e | 2.04 ± 0.014 c | 176 ± 0.519 i | 19.4 ± 0.063 h | 39.6 ± 0.132 h |
| T7 | 2.14 ± 0.017 d | 0.161 ± 0.001 f | 1.19 ± 0.011 fg | 157 ± 0.467 j | 23.2 ± 0.176 j | 22.5 ± 0.161 j | 2.54 ± 0.020 e | 0.161 ± 0.001 f | 1.78 ± 0.018 d | 161 ± 0.404 j | 17.8 ± 0.109 i | 36.6 ± 0.225 i |
| T8 | 2.20 ± 0.023 d | 0.172 ± 0.001 de | 1.23 ± 0.011 f | 191 ± 0.623 h | 28.2 ± 0.242 h | 27.4 ± 0.167 h | 2.62 ± 0.014 de | 0.172 ± 0.001 de | 2.06 ± 0.020 c | 198 ± 0.877 h | 20.3 ± 0.161 g | 41.7 ± 0.305 g |
| T9 | 2.23 ± 0.017 d | 0.173 ± 0.001 de | 1.24 ± 0.011 f | 222 ± 0.207 g | 30.6 ± 0.383 g | 29.7 ± 0.063 g | 2.64 ± 0.020 d | 0.173 ± 0.001 de | 2.08 ± 0.068 c | 229 ± 0.831 g | 21.9 ± 0.167 f | 45.2 ± 0.254 f |
| T10 | 2.43 ± 0.014 c | 0.177 ± 0.001 cd | 1.35 ± 0.014 e | 253 ± 0.900 f | 33.5 ± 0.228 f | 32.5 ± 0.242 f | 2.90 ± 0.017 c | 0.177 ± 0.001 cd | 2.11 ± 0.014 c | 388 ± 0.906 f | 24.5 ± 0.225 e | 50.6 ± 0.155 e |
| T11 | 2.49 ± 0.023 c | 0.178 ± 0.001 c | 1.49 ± 0.012 d | 268 ± 1.03 e | 40.5 ± 0.167 e | 39.3 ± 0.150 e | 2.97 ± 0.020 c | 0.178 ± 0.001 c | 2.26 ± 0.014 b | 444 ± 0.456 e | 24.7 ± 0.103 de | 50.8 ± 0.069 e |
| ANOVA p | *** | *** | *** | *** | *** | *** | *** | *** | *** | *** | *** | *** |
| Treatments | Carbohydrates (mg g−1 FW) | Phenol (mg gallic acid g−1 DW) | Flavonoids (mg quercetine g−1 DW) | Anthocyanin (mg 100 g−1 FW) | ||||
|---|---|---|---|---|---|---|---|---|
| Cut 1 | Cut 2 | Cut 1 | Cut 2 | Cut 1 | Cut 2 | Cut 1 | Cut 2 | |
| T1 | 3.041 ± 0.439 b | 3.295 ± 0.124 e | 8.084 ± 0.157 g | 10.91 ± 0.199 d | 0.989 ± 0.007 d | 0.998 ± 0.008 g | 2.156 ± 0.028 c | 2.167 ± 0.012 f |
| T2 | 5.091 ± 0.143 a | 5.143 ± 0.081 a–c | 12.99 ± 0.199 a–c | 13.82 ± 0.124 ab | 2.690 ± 0.067 a | 2.719 ± 0.054 b–d | 3.815 ± 0.047 ab | 3.959 ± 0.009 b–d |
| T3 | 5.424 ± 0.097 a | 5.532 ± 0.016 ab | 13.73 ± 0.264 ab | 13.98 ± 0.356 ab | 2.690 ± 0.044 a | 2.787 ± 0.040 bc | 4.114 ± 0.053 a | 4.339 ± 0.049 a–c |
| T4 | 5.557 ± 0.025 a | 5.604 ± 0.047 ab | 13.98 ± 0.242 a | 14.43 ± 0.227 a | 2.736 ± 0.033 a | 2.851 ± 0.041 ab | 4.146 ± 0.024 a | 4.828 ± 0.115 ab |
| T5 | 5.965 ± 0.416 a | 5.971 ± 0.020 a | 14.27 ± 0.264 a | 14.83 ± 0.530 a | 2.762 ± 0.047 a | 3.007 ± 0.012 a | 4.238 ± 0.224 a | 5.183 ± 0.023 a |
| T6 | 4.369 ± 0.136 ab | 4.104 ± 0.261 de | 10.95 ± 0.318 ef | 12.61 ± 0.264 bc | 1.658 ± 0.073 b | 2.478 ± 0.022 e | 3.318 ± 0.113 b | 2.954 ± 0.026 ef |
| T7 | 4.315 ± 0.063 ab | 3.978 ± 0.060 de | 10.37 ± 0.446 f | 11.89 ± 0.448 cd | 1.425 ± 0.042 c | 1.429 ± 0.040 f | 3.250 ± 0.018 b | 2.786 ± 0.032 ef |
| T8 | 4.529 ± 0.079 ab | 4.184 ± 0.052 c–e | 11.31 ± 0.246 d–f | 12.70 ± 0.338 bc | 1.840 ± 0.038 b | 2.559 ± 0.023 de | 3.361 ± 0.292 b | 3.249 ± 0.079 de |
| T9 | 4.645 ± 0.929 ab | 4.441 ± 0.351 cd | 11.60 ± 0.369 d–f | 13.33 ± 0.136 a–c | 2.550 ± 0.007 a | 2.584 ± 0.011 de | 3.557 ± 0.248 ab | 3.475 ± 0.263 c–e |
| T10 | 4.749 ± 0.073 ab | 4.737 ± 0.356 b–d | 11.96 ± 0.102 c–e | 13.66 ± 0.408 ab | 2.593 ± 0.025 a | 2.669 ± 0.042 cd | 3.674 ± 0.008 ab | 3.462 ± 0.044 c–e |
| T11 | 4.883 ± 0.033 a | 4.785 ± 0.323 b–d | 12.59 ± 0.213 b–d | 13.69 ± 0.220 ab | 2.609 ± 0.015 a | 2.703 ± 0.038 b–d | 3.704 ± 0.063 ab | 3.655 ± 0.539 c–e |
| ANOVA p | *** | *** | *** | *** | *** | *** | *** | |
Publisher’s Note: MDPI stays neutral with regard to jurisdictional claims in published maps and institutional affiliations. |
© 2022 by the authors. Licensee MDPI, Basel, Switzerland. This article is an open access article distributed under the terms and conditions of the Creative Commons Attribution (CC BY) license (https://creativecommons.org/licenses/by/4.0/).
Share and Cite
El-Sonbaty, A.E.; Farouk, S.; Al-Yasi, H.M.; Ali, E.F.; Abdel-Kader, A.A.S.; El-Gamal, S.M.A. Enhancement of Rose Scented Geranium Plant Growth, Secondary Metabolites, and Essential Oil Components through Foliar Applications of Iron (Nano, Sulfur and Chelate) in Alkaline Soils. Agronomy 2022, 12, 2164. https://doi.org/10.3390/agronomy12092164
El-Sonbaty AE, Farouk S, Al-Yasi HM, Ali EF, Abdel-Kader AAS, El-Gamal SMA. Enhancement of Rose Scented Geranium Plant Growth, Secondary Metabolites, and Essential Oil Components through Foliar Applications of Iron (Nano, Sulfur and Chelate) in Alkaline Soils. Agronomy. 2022; 12(9):2164. https://doi.org/10.3390/agronomy12092164
Chicago/Turabian StyleEl-Sonbaty, Amany E., Saad Farouk, Hatim M. Al-Yasi, Esmat F. Ali, Atef A. S. Abdel-Kader, and Seham M. A. El-Gamal. 2022. "Enhancement of Rose Scented Geranium Plant Growth, Secondary Metabolites, and Essential Oil Components through Foliar Applications of Iron (Nano, Sulfur and Chelate) in Alkaline Soils" Agronomy 12, no. 9: 2164. https://doi.org/10.3390/agronomy12092164