Article

Improving Nutrients Uptake and Productivity of Stressed Olive Trees with Mono-Ammonium Phosphate and Urea Phosphate Application

by
Hamdy A. Z. Hussein
1,
Ahmed A. M. Awad
2,* and
Hamada R. Beheiry
1
1
Horticulture Department, Faculty of Agriculture, Fayoum University, Fayoum 63514, Egypt
2
Soils and Natural Resources, Faculty of Agriculture and Natural Resources, Aswan University, Aswan 81528, Egypt
*
Author to whom correspondence should be addressed.
Agronomy 2022, 12(10), 2390; https://doi.org/10.3390/agronomy12102390
Submission received: 29 August 2022 / Revised: 28 September 2022 / Accepted: 29 September 2022 / Published: 2 October 2022

Abstract

:
Nutritional status improvement is a surrogate approach to overcoming undesirable soil conditions. This study was performed in sandy clay loam soil that was characterized by certain undesirable parameters (ECe = 6.4 vs. 7.2 dS m−1, CaCO3 = 8.8 vs. 9.2%, and pH = 7.78 vs. 7.89) on olive (Olea europaea, Arbequina cv.) in the 2020 and 2021 seasons to investigate the influence of two highly soluble phosphorus fertilizers, mono-ammonium phosphate (MAP) and urea phosphate (UP). The treatments included 0.336, 0.445, and 0.555 kg tree−1 for MAP1, MAP2, and MAP3 and 0.465, 0.616, and 0.770 kg tree−1 for UP1, UP2, and UP3, respectively, in comparison to granular calcium super-phosphate (GCSP) at the recommended rate (0.272 kg P2O5 equal 1.75 kg tree−1). This experiment was established according to a randomized complete block design. Generally, our results indicated that both MAP and UP applications surpassed GCSP for all studied parameters except leaf copper uptake in the 2021 season. Moreover, among the HSPFs applied, it was found that applying the maximum levels gave the best results. However, MAP3 gave the maximum values for shoot length, SPAD reading, and dry fruit matter. Moreover, UP3 produced the best results for the leaf area, olive tree yield, total olive yield, total fresh weight, flesh weight (FlW), fruit length (FrL), and leaf Fe content in both seasons.

1. Introduction

Abiotic stresses (ABSs), including salinity, calcification, and high soil pH, are major constraints affecting the agricultural sector in many parts of the world. However, calcareous soils are characterized by high calcium carbonate (CaCO3) content, which, in turn, affects soil properties—for example, causing a low cation exchange capacity (CEC), high pH, and decreased availability of most essential nutrients, in addition to low content of soil organic matter (SOM) and loss of nutrients through deep percolation, causing a nutritional imbalance among different nutrients [1,2]. According to [3], most calcareous soils exist in arid and semi-arid regions and cover more than 30% of the Earth’s surface. Thus, soil salinity is no less important than calcareous soil; however, approximately 4 × 10⁴ ha becomes unsuitable for cultivation every year owing to salinization [4]. Based on reports published by specialized agencies of the United Nations, it was revealed that approximately half of the irrigated area is either salinized or has the possibility of developing salinity in the future. Soil salinity occurs owing to soluble salt accumulation in the root zone, resulting in abnormal plant growth and development, which, in turn, affects productivity. Generally, saline soil is identified by the electrical conductivity (ECe) of the saturated soil paste in the root zone exceeding 4 dsm−1 at 25 °C and an exchangeable sodium percentage (ESP) ≥ 15% [5]. The total cultivated area in arid and semi-arid regions is estimated at around 831 million ha across the world, and it is expected that more than 50% of arable land will be saline by 2050 [6,7]. Given the aforementioned information, this issue requires more attention and further efforts among researchers to overcome these undesirable characteristics that hinder nutrient uptake, causing the abnormal growth and development of plants, which, in turn, influences crop productivity.
Balanced fertilization is the best agronomic practice for soil management in plants under stressed conditions. Among the essential macronutrients, phosphorus (P) is one of the most important, along with nitrogen (N) and potassium (K), as it is considered the most influential for root development and thus increases the plant’s ability to absorb water and nutrients from the soil. Moreover, it has a crucial role in several metabolic processes, including protein synthesis, cell division and elongation, respiration, the consumption of energy-rich compounds (adenosine tri-, di-, and monophosphate, ATP, ADP, and AMP), the photosynthesis process and nutrients’ movement within plants [8,9,10]. Furthermore, P is an essential integrated element of nucleic acids and phospholipids and plays a central role in sugar assimilation [11,12]. Besides these vital roles, P plays a fundamental role in phosphoprotein and fat metabolism, sulfur metabolism, biological oxidation, and several other metabolisms dependent on the application of P [13]; however, both saline and calcareous soils suffer from the unavailability of P and other micronutrients as a result of high pH, in addition to chemical reactions that affect these nutrients, whether by loss or fixation, due to the reaction of P anions with calcium (Ca) and magnesium (Mg) to form insoluble phosphate complex compounds with limited solubility, besides decreasing the organic matter below the critical level [14,15,16]. Generally speaking, P is absorbed in the form of H2PO4 and HPO4−− through root hairs and root tips; although the total amount of P may be high, the majority is often restricted [17], in addition to the loss of P from the soil due to its negative charge. However, more than 80% of added P converts into an unavailable form due to its fixation and adsorption processes [18,19]. As is well known, either a deficiency or excess of P in the soil can negatively affect plant performance. P causes stunted plants and root diameter decrease [20,21], as well as disturbances to chlorophyll pigment production and the accumulation of anthocyanins, resulting in purple discoloration [22,23,24]. On the other hand, the overapplication of P at levels that exceed crop demands could increase P losses to the subsurface and groundwater [9] and decrease the absorption of zinc (Zn), manganese (Mn), copper (Cu), and iron (Fe); consequently, the symptoms of their deficiency appear on the crop, which, in turn, affects the productivity [25].
Recently, attention has turned towards applying highly soluble phosphorus fertilizers (HSPF) including mono-ammonium phosphate (MAP), urea phosphate (UP), and mono-potassium phosphate (MKP) as an alternative surrogate to overcome the fixing and retaining of phosphate ions. Both MAP and UP are acidic phosphorus fertilizers that markedly enhance phosphorus use efficiency (PUE) by lowering soil pH in saline and calcareous soils with high pH values. However, a decreasing pH enhances micronutrients’ availability, thus improving the solubility of calcium and preventing its association with P [26,27]. UP is an amino-structured complex and a highly acidic fertilizer produced by the reaction of phosphoric acid (H3PO4) with urea CO(NH2)2, and its chemical structure is H3PO4.CO(NH2)2 [28,29]. Moreover, MAP is an acidic fertilizer, but is manufactured via the reaction of H3PO4 with ammonia (NH3), and its chemical structure is NH4H2PO4. Despite the little information available about HSPF, its positive influences were an important factor for the generalization of its application instead of traditional fertilizers such as calcium super-phosphate. The authors of [30] reported that spraying P in different forms, such as MAP, UP, and MKP, increased nitrogen and potassium accumulation. Similarly, the results of [31] indicated that applying MAP, UP, and MKP as foliar treatment improved the flowering, fruit set, yield, and oil content of picual and kalamata cultivars. These results were confirmed by [32,33], which stated that the increases obtained with N and P application could be due to increases in hermaphrodite flowers, thus improving the flowering set, fruiting, fruit quality, and yield. Some studies [34,35] stated that MAP application was the best treatment to improve P availability compared with traditional P fertilizers such as calcium super-phosphate. These results have been confirmed by [36,37]; however, they indicated that the application of MAP improved the chemical constituents and productivity of potatoes.
By 2018, olive (Olea europaea L.) cultivation had reached approximately 11 million ha throughout the world, with more than 90% concentrated in Mediterranean countries [38]. Olive trees are cultivated to produce oil and table olives. In Egypt, olive cultivation is considered among the most important commercial cultivation practices, and it ranks fourth in Africa after citrus, mango, and table grapes [39]. Egypt is responsible for more than 13% of the world’s production; however, the total cultivation area reached 101,326 ha, with total production reaching 874,748 tons, in 2017, according to the Ministry of Agriculture. However, the majority is cultivated in newly reclaimed lands; most of these lands are sandy soils that suffer from some negative characteristics. P fertilization is one of the most important factors in its annual growth cycle; however, P is essential to enhance flower formation, cell division and elongation, the development of new growth tissues, and the photosynthesis process and root growth, which in turn increase the productivity [40,41]. However, P is the most important basic nutrient determining the oil yield and its components; moreover, the quality parameters of oil can be altered due to the influence of P on phospholipid formation. Despite all the positive effects of P fertilizer, some previous studies indicated that P did not cause any increases in the yield or its attributes [42,43]. Under these ABSs, some types of phosphorus fertilizers, such as mono-ammonium phosphate (MAP) and urea phosphate (UP), are applied instead of calcium super-phosphate (CSP), whereas both MAP and UP may be more effective and easier to apply via fertigation and foliar spray.
The main objective of this research was to evaluate the potential performance of two types of highly soluble phosphorus fertilizers, namely MAP and UP, with low pH (<7.0), due to the nature of Egyptian soils with high soil pH. To do so, three levels of P2O5—0.205, 0.272, and 0.339 tree−1—were applied with both fertilizers in a comparative study with one level (0.272 P2O5 tree−1) of granular calcium super-phosphate (GCSP), with a high pH (>7.0), in an attempt to improve the nutrient uptake of olive trees (Arbequina cv.) grown under multi-stress conditions, which in turn affects the growth and productivity characteristics.

2. Materials and Methods

2.1. Study Location, Weather Conditions, and Plant Materials

This study was accomplished through the Egyptian–Spanish Project in Kawm Ushim district (29°55′ N; 30°88′ E), located on Cairo–Fayoum Desert Road, Egypt, during the seasons of 2020 and 2021. It was performed on olive (Olea europaea L. Arbequina cv.) trees grown on sandy clay loam soil to investigate the influence of two types of highly soluble phosphorus fertilizers, mono-ammonium phosphate (MAP) and urea phosphate (UP), which were applied five times, in comparison with granular calcium superphosphate (GCSP) with chemical structure Ca(H2PO4)2 as a control treatment.
The trees were around 15 years old, propagated by leaf cutting, and planted at a distance of 5 × 8 m2 from one another under a drip irrigation system, and the selected trees were visually free from diseases. The arbequina olive cultivar was chosen for its characteristics of self-pollination, an abundant yield, and a strong ability to resist drought and high temperatures. Accordingly, it is considered the most suitable for the Mediterranean countries; its olives are distributed as food products or used to produce oils rich in antioxidants. All horticultural practices, including irrigation and weed, pest, and disease control, were applied according to the recommendations of the Egyptian Ministry of Agriculture and Soil Reclamation. The selected trees were as uniform in shape and size as possible, and similar in vigor and growth. The weather data of the study region are presented in Table 1.

2.2. Treatment and Experimental Design

According to technical bulletin No. 2 of 2016, issued by the General Administration of Agriculture, the recommended fertilization program for olive trees aged over 6 years is 394, 500, 810, and 400 g of N, P2O5, K2O, and MgO, respectively. Both experiments included three levels of P, namely 0.205, 0.272, and 0.339, which were calculated as P2O5% from two highly soluble phosphorus fertilizers (HSPFs) (MAP at total MAP1= 0.336, MAP2= 0.445, and MAP3 = 0.555 kg tree−1 in five equal doses at rate 67.2, 89.0, and 111.0 g tree−1) and (UP at rate UP1 = 0.465, UP2 = 0.616, and UP3 = 0.770 kg tree−1 in five equal doses at rate 93.0, 123.2, and 154.0 g tree−1) in comparison with the recommended level of P2O5 (0.272) at GCSP, 1.75 kg tree−1.
The experimental plots were colonized and identified by the three levels of MAP and three levels of UP in addition to one level of GCSP, which were allocated in 7 treatments, and each treatment was repeated five times in the middle of March, April, May, June, and July in both growing seasons as a soil application in four plots, as described in Table 2. Each treatment consisted of three trees.
Both fertilizers applied, MAP and UP, were purchased from the ICL and SQM companies via their distributors in Egypt. Meanwhile, GCSP was produced by the Suez company that produces fertilizers in Egypt. The field experiment was established according to a randomized complete block design (RCBD). The chemical analysis of the applied PFs in this study is shown in Table 3.

2.3. Soil sampling and Determination

Soil samples were randomly taken from the surface layer at a depth of 0–25 cm, before the application of treatments, and transferred to the Soil, Water, and Plant Analysis Laboratory (SWPAL) at the Faculty of Agriculture and Natural Resources, Aswan University, to determine some soil chemical and physical properties (Table 4) Particle size distribution was evaluated using the hydrometer method [44], soil pH was measured in soil paste using a pH meter [45], electrical conductivity (EC) was measured in soil paste extract using an EC meter, and calcium carbonate content (CaCO3%) was determined using a calcimeter, as described by [46].
In addition, soil organic matter (SOM) was determined according to the Walkley–Black method [47]. Regarding the determination of soluble ions, the soluble cations, sodium (Na+), potassium (K+), calcium (Ca++), and magnesium (Mg++) were extracted with 1N NH4AC; however, Na+ and K+ were determined with a flame photometer [48], whereas Ca++ and Mg++ were measured with the EDTA titration method. Soluble anions, carbonate (CO3−−), bicarbonate (HCO3), chloride (Cl), and sulfate (SO4−−) were determined with the titration method [45]. Nitrogen (N), phosphorus (P), and potassium (K) extracted were determined by the modified micro Kjeldahl method, as in [49,50,51], respectively.
Some available micronutrients, including iron (Fe), manganese (Mn), zinc (Zn), and copper (Cu), were extracted with DTPA [52] and determined using inductively coupled plasma–optical emission spectrometry (ICP-EOS, PerkinElmer OPTIMA 2001 DV, Norwalk, CT, USA), as described in [53].

2.4. Physiological and Growth Parameters

Twenty shoots at one year old were randomly selected on each side of the ten olive orchard trees in mid-September (after growth cycle) and spotted for every replicate to measure some attributes, including shoot length (ShL), which was measured in cm; number of leaves per shoot (NLSh); average number of leaves per meter and leaf area (LA, cm²) of the third and fourth leaves from the top of new spring shoots, which were estimated using a digital planimeter device (Planx 7 Tamaya). Relative chlorophyll content (SPAD) was determined using a SPAD-502 m device (Minolta, Osaka, Japan).

2.5. Leaf Nutrient Measurements

Leaf samples were collected from the twenty selected shoots from ten trees, washed with distilled water, oven-dried at 70 °C for 72 h, and crushed to determine N, P, K, Ca, Mg, and Na according to the method described in [50]. Micronutrients (Fe, Mn, Zn, and Cu) were determined using inductively coupled plasma–optical emission spectrometry (ICP-EOS, PerkinElmer OPTIMA 2001 DV, Norwalk, CT, USA) as described in [53].

2.6. Total Olive Yield (kg tree−1)

In mid-October (harvesting time) in 2020 and 2021, the average yield was recorded (in kg tree−1) for each tree under each treatment, and the total olive yield (TOY) per hectare was calculated based on the number of trees in a hectare.

2.7. Fruits’ Physical and Chemical Characteristics

Samples of 100 fruits from each treated tree were randomly picked in both seasons, and we examined shoots from each replicate to study their physical and chemical characteristics, namely fruit length (FrL, cm), fruit diameter (FrD, cm), fruit shape index (LD), flesh weight (FlW), fruit weight (TFrW, g), and flesh/fruit ratio, according to [54]. Fruit oil percentage as a dry weight was determined according to [55] by extracting the oil from the dried flesh samples using a Soxhlet fat extraction apparatus and petroleum ether of (60–80 °C) boiling point as a solvent, and the percentage of oil was determined on a dry weight basis. Regarding the determination of dry weight and moisture content (%), a sample of 50 fruits was dried at 70 °C in an electric oven until a constant weight was reached. The average dry weight was determined and the percentage of moisture per fruit was calculated.

2.8. Statistical Analysis

Analysis of variance (ANOVA) and Duncan’s test were performed on three replicates for nutrient determinations and five replicates for physiological and growth parameters and yield and its attributes using the InfoStat statistical package, version 2011 (InfoStat Microsoft) [56]; here, the replicate was considered the random variable, whereas the treatment was the fixed variable. The standard of error (±SE) was calculated for each treatment. A stepwise regression test was performed to identify the extent of the relationships between the olive tree yield (OTY, kg) and olive oil content (OOC, %) with the nutrients, growth, physiological parameters, and yield attributes under multi-abiotic stresses.

3. Results

3.1. Leaf Nutrient Contents

As presented in Table 5, we found that the application of 0.770 kg tree−1 of urea phosphate (UP3) was the superior treatment; it recorded the highest values (0.23 and 1.67%) for phosphorus (LPU) and calcium uptake (LCaU), respectively, in the 2020 season, and (0.72%) for leaf potassium uptake (LKU) in the 2021 season. Moreover, the trees fertilized by UP with 0.616 (UP2) and 0.465 kg tree−1 (UP1) displayed the maximum leaf magnesium uptake (LMgU) in the first season and leaf sodium uptake (LNaU) in the second season, respectively. On the other hand, the influence of the applied MAP was no less important than that of UP, whereas the trees treated with 0.336 kg tree−1 of MAP (MAP1) produced the greatest values (2.92 and 0.72%) for LNU and LKU in the first growing season, as well as 0.26 for LPU and 1.19% for LMgU in the second season, whereas applying UP at 0.465 kg (UP1) and MAP at 0.445 kg tree−1 (MAP2) gave the best values (2.27 and 1.48%) for LNU and LCaU, respectively, in the second season. It can be seen in Table 5 that the percentage increases of the greatest and lowest values were 66.91 vs. 149.58 for N, 76.92 vs. 85.71 for P, 18.03 vs. 22.03 for K, 96.47 vs. 74.00 for Ca, 72.50 vs. 41.67 for Mg, and 85.37 vs. 103.03 for Na in the two growing seasons, respectively.
The obtained data listed in Table 5 showed that the application of two different HSPFs, MAP and UP, irrespective of their applied levels, appreciably outperformed the traditional phosphorus fertilizer, GCSP, in improving the olive leaf nutrient content.
The results of the ANOVA indicated that all treatments had significant effects (at p ≤ 0.01) on the LNU, LPU, LMgU, and LNaU in both seasons; in addition, LKU in the first season and LCaU in the second season experienced significant effects, whereas there was a significant impact (at p ≤ 0.05) on LKU in 2020 and no significant influence on LCaU in 2021.
The influence of MAP and UP application on leaf micronutrient content in the 2020 and 2021 seasons are illustrated in Table 6. However, the highest values (234.42 vs. 239.00) for leaf iron uptake (LFeU) in both seasons and (22.00 mgkg−1) for leaf manganese uptake (LMnU) in the first season were recorded with the application of UP3, whereas the highest values (28.42 vs. 4.02 mgkg−1) of LMnU and leaf copper uptake (LCuU) were achieved via UP1.
Concerning MAP impacts, our results showed that MAP1 gave the maximum values (49.86 vs. 49.36 mgkg−1) for leaf zinc uptake (LZnU) in the 2020 and 2021 seasons, respectively. Moreover, LCuU recorded the greatest values (3.50 mgkg−1) in trees treated with MAP3. In contrast, dissimilar data were obtained regarding the lowest values. The UP2 treatment was the least effective, as it recorded the lowest values (169.51 mgkg−1) for LFeU in the first season and (24.49 vs. 28.99 mgkg−1) for LCuC in the two growing seasons, respectively. Meanwhile, the lowest LFeU was obtained with UP1. Similar data were observed for LMnU and LCuU, however, with the lowest values (21.09 vs. 2.50 mgkg−1) in fertilized trees with GCSP in the second season, whereas MAP3 was the least effective on LMnU in the first season, which reached 15.92 mgkg−1. Based on the comparison between the highest and lowest values, the percentages of increase reached 44.48 vs. 41.24% for Fe, 38.19 vs. 34.76 for Mn, 103.59 vs. 70.27% for Zn, and 109.58 vs. 60.80% for Cu in the 2020 and 2021 seasons, respectively.
The general trend of the data presented in Table 6 indicated that UP application was slightly more beneficial than MAP. Analysis of variance showed that the treatments had a significant influence (at p ≤ 0.01) on all studied micronutrient uptake in both seasons.

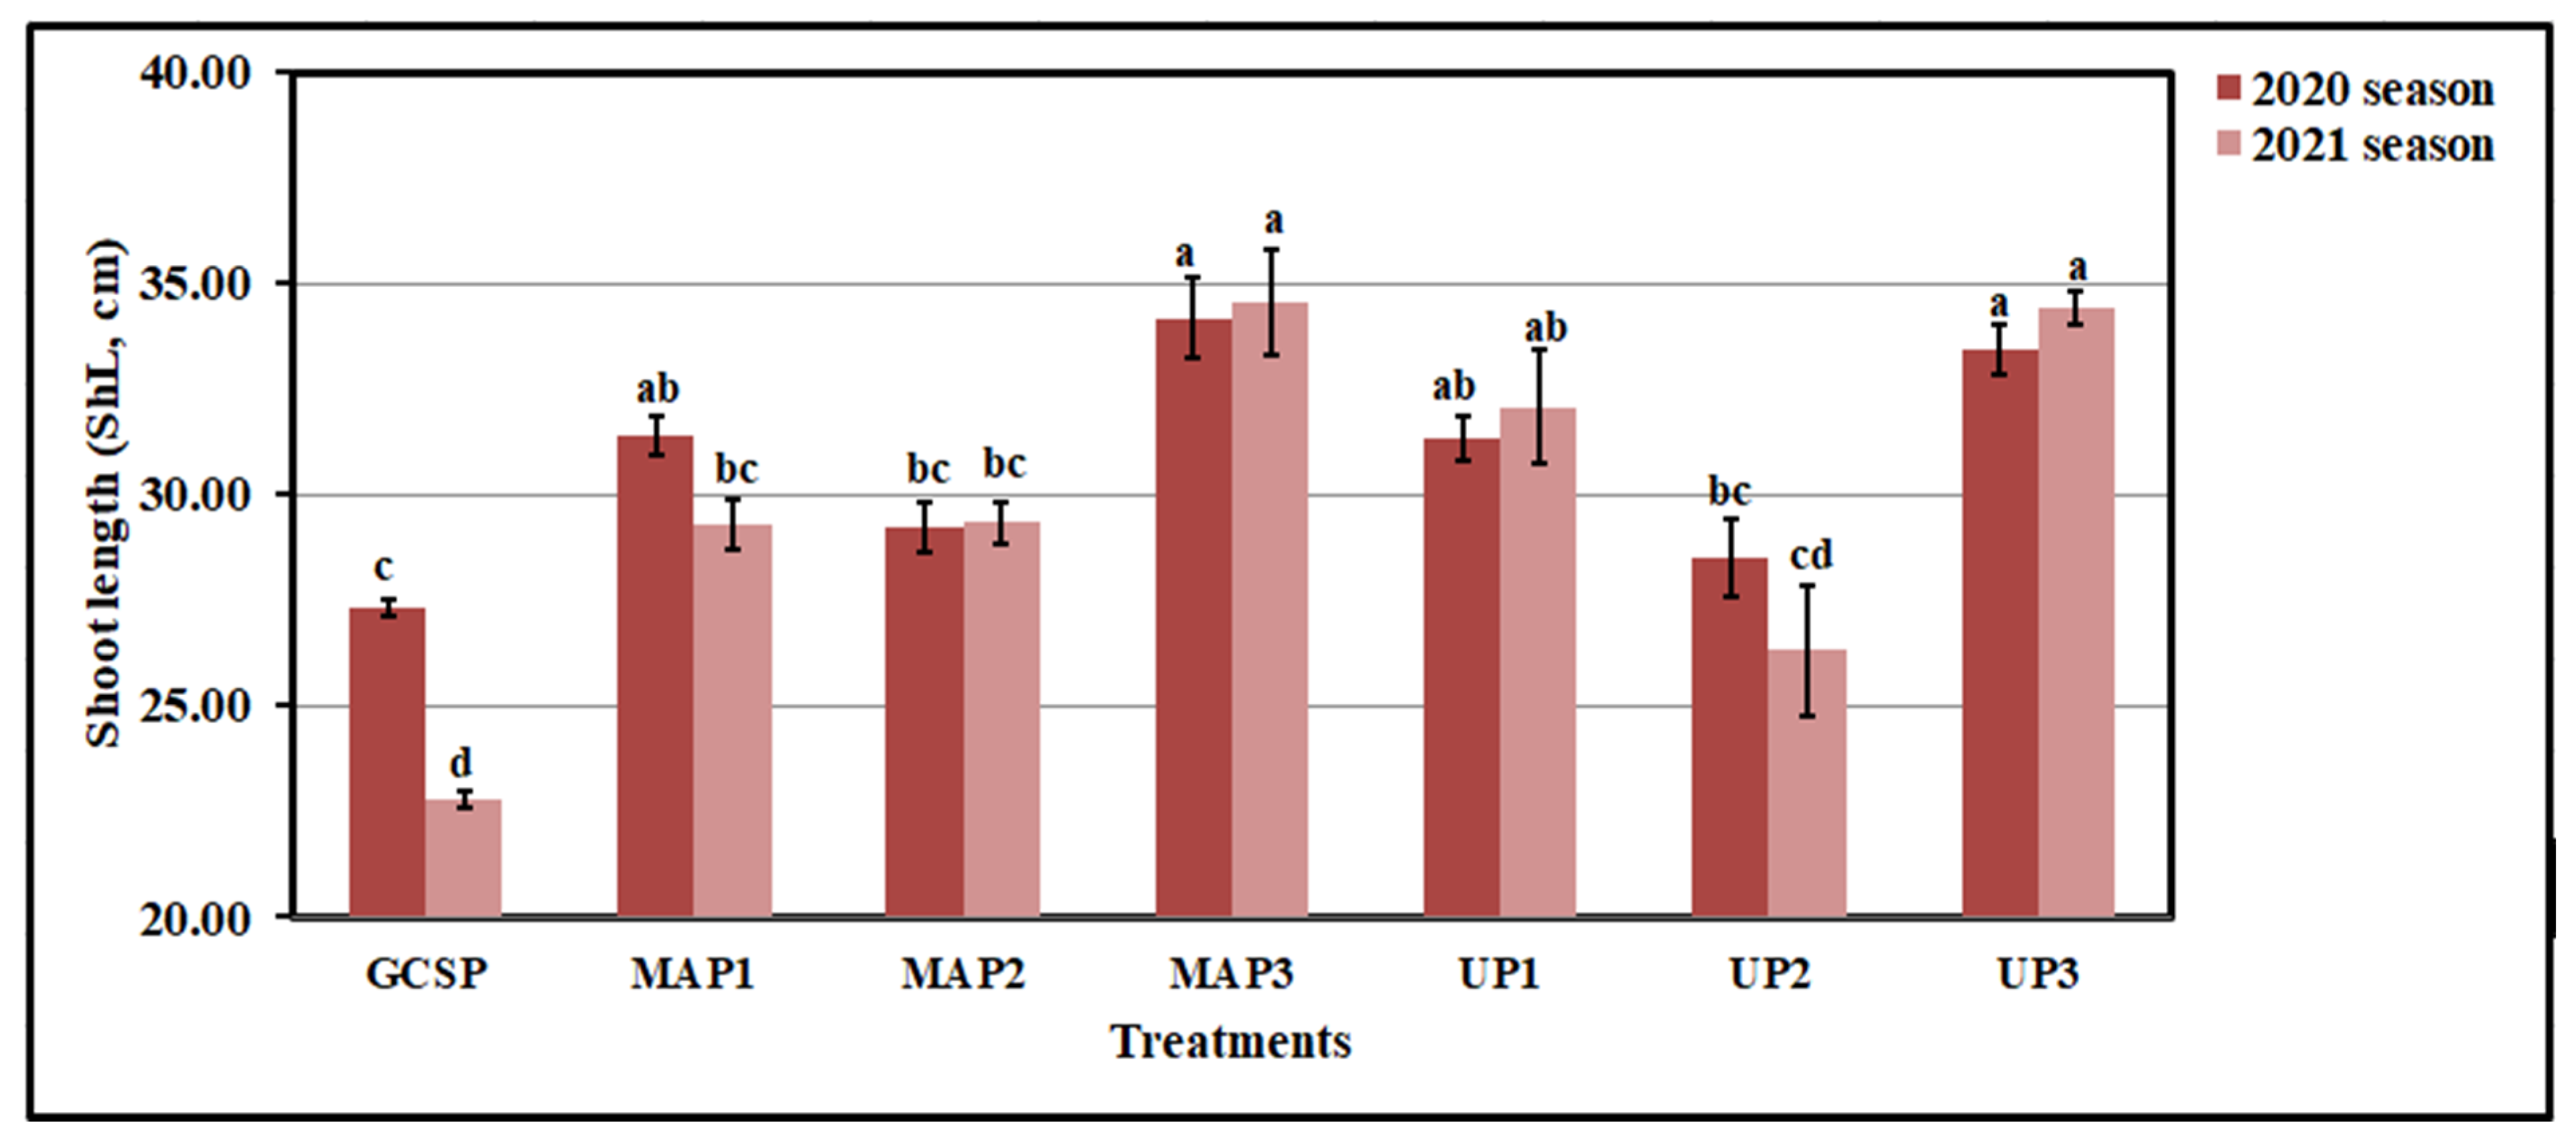
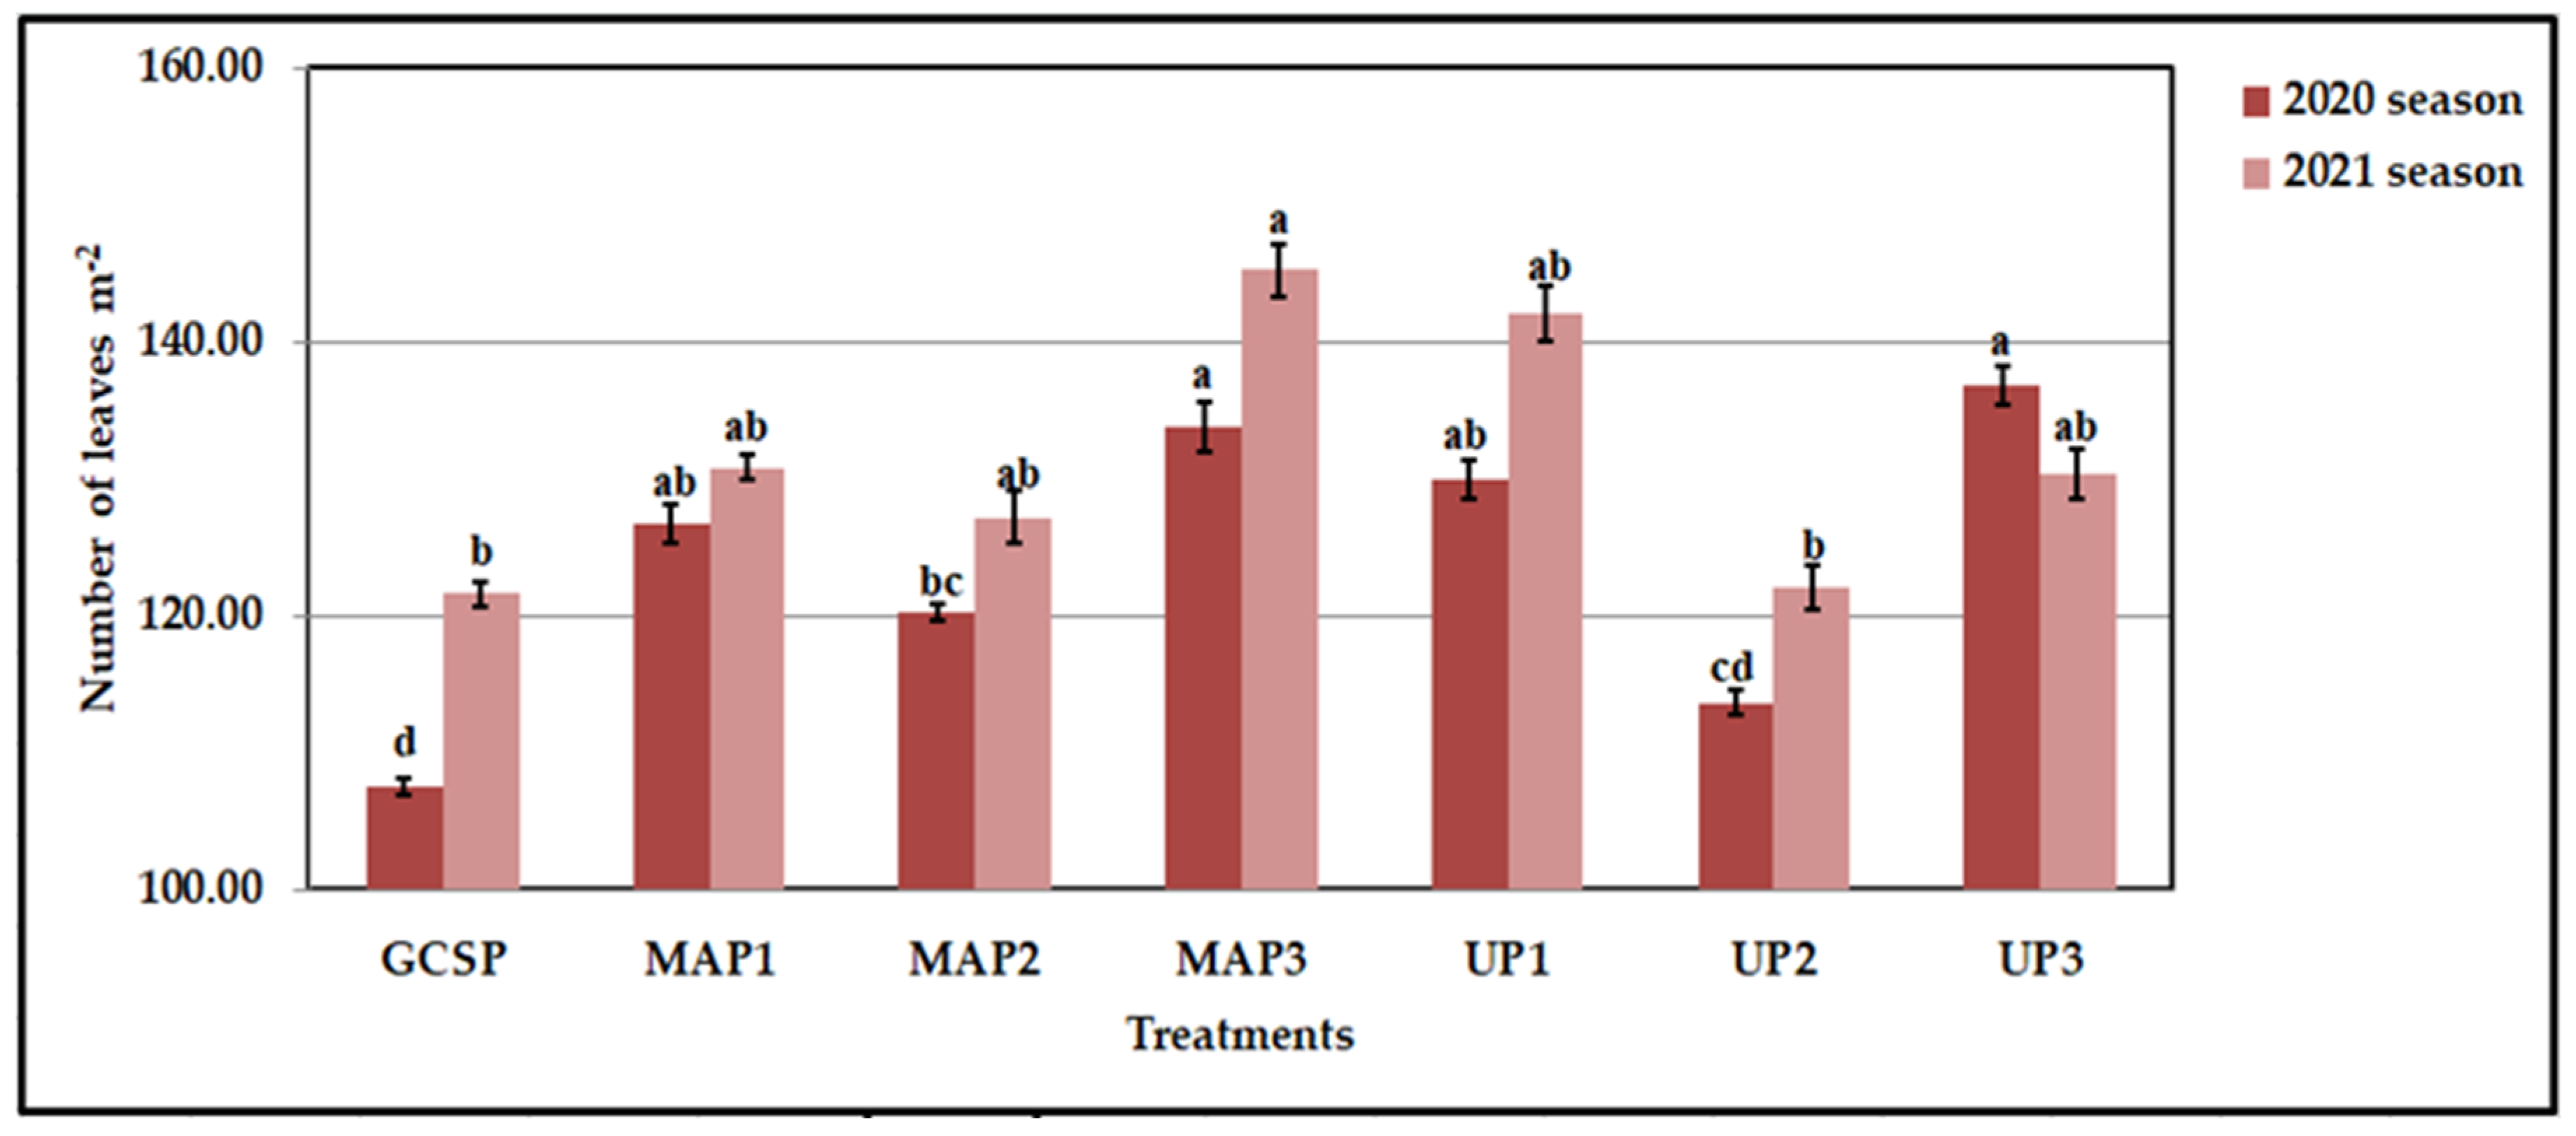
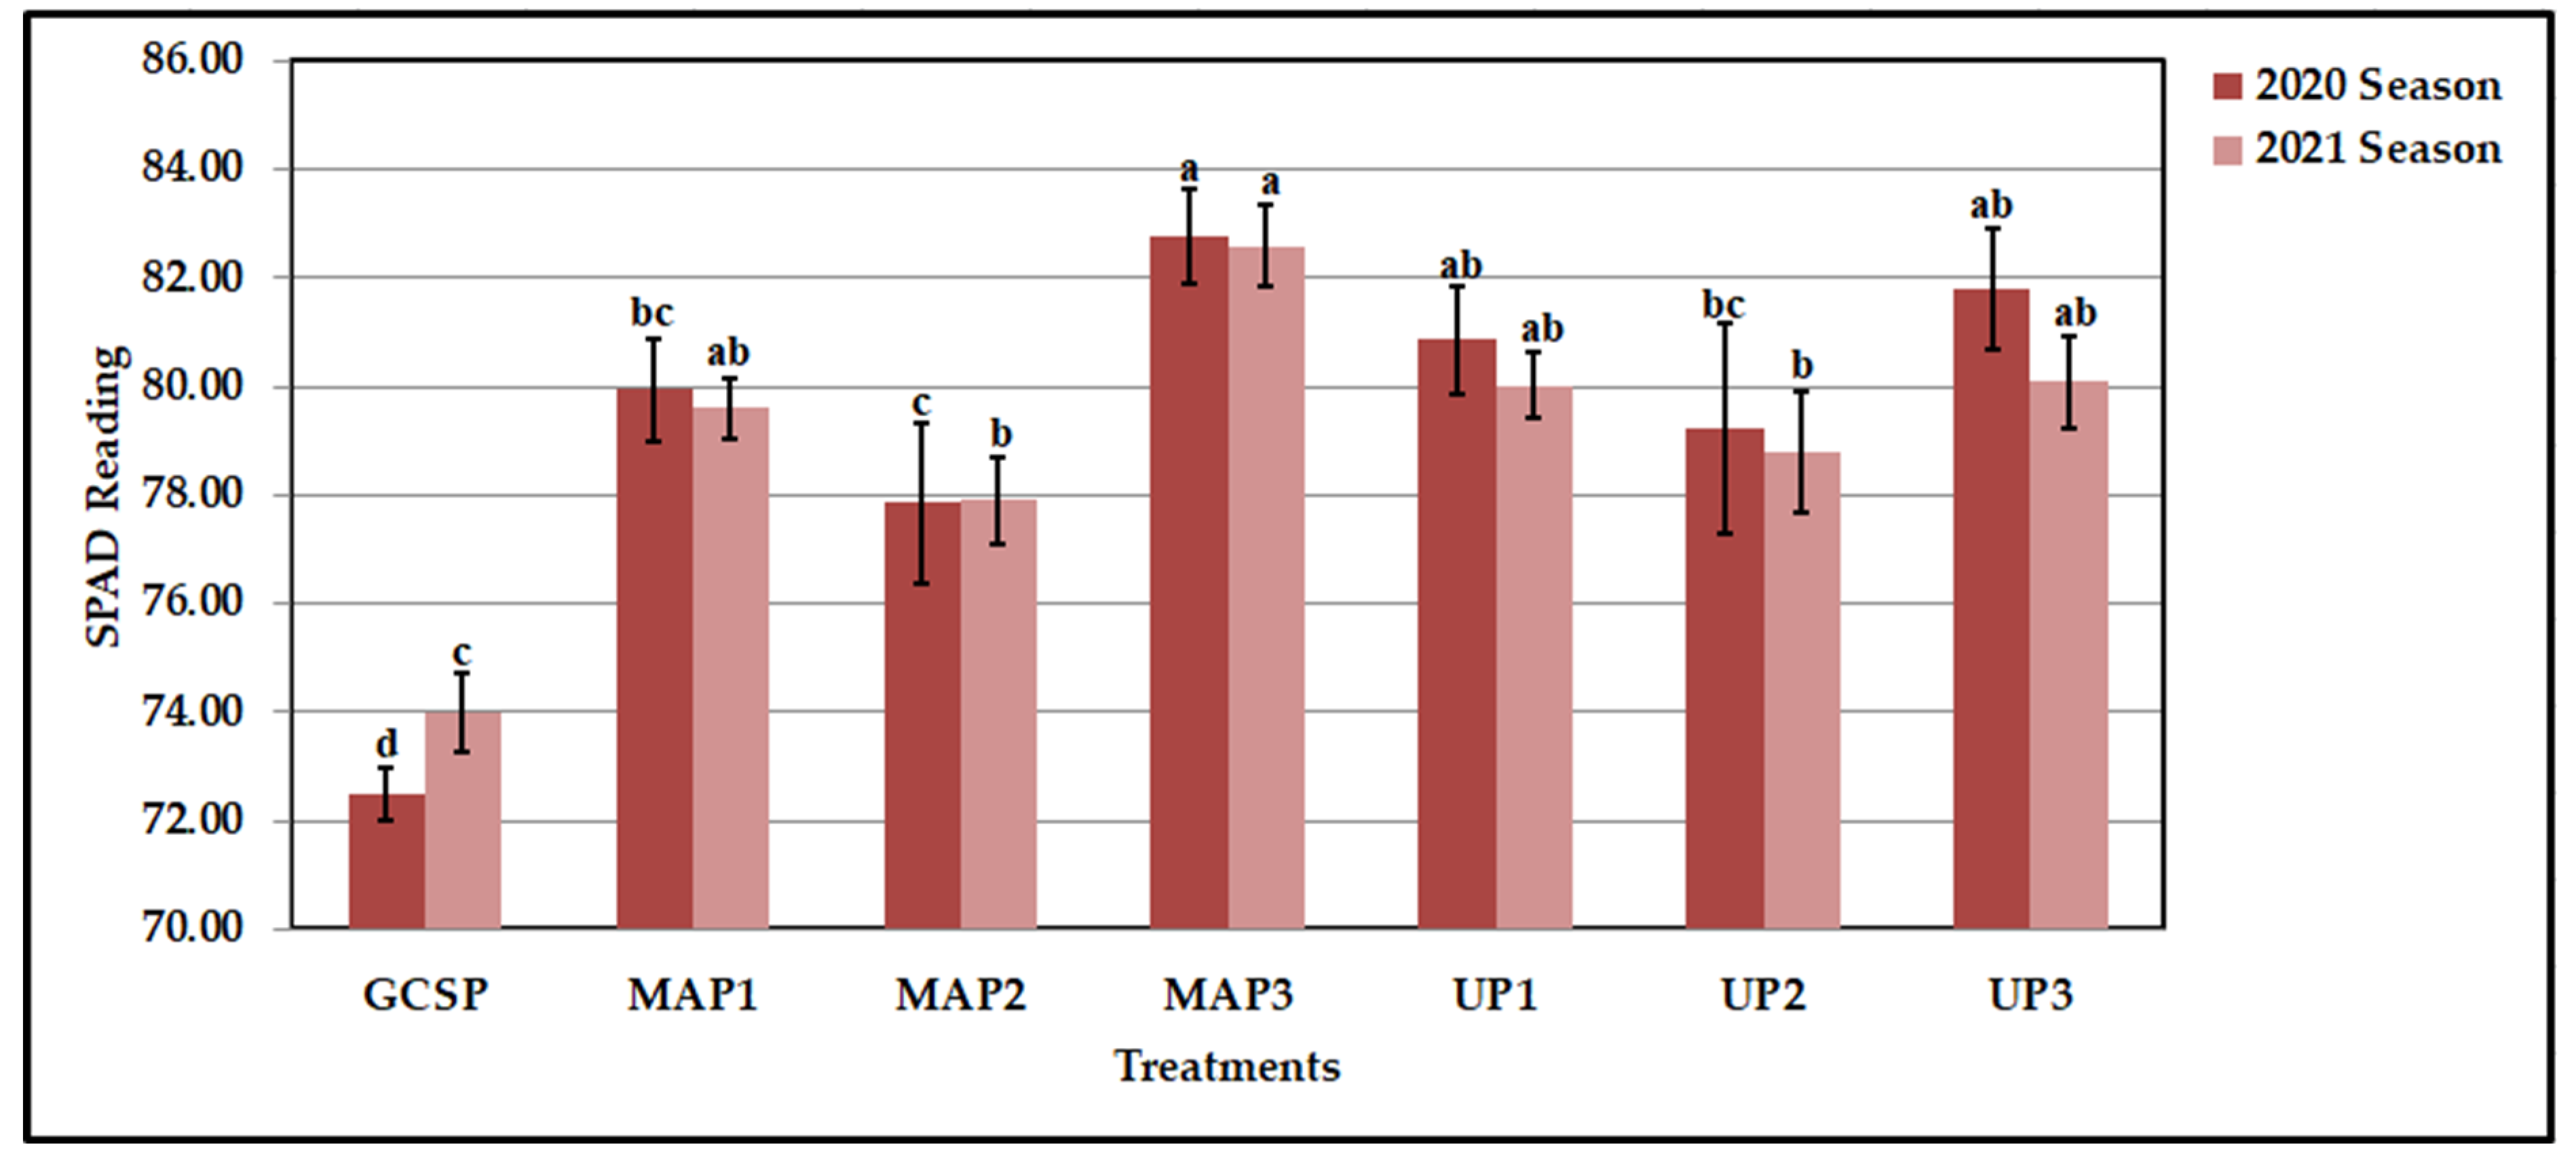
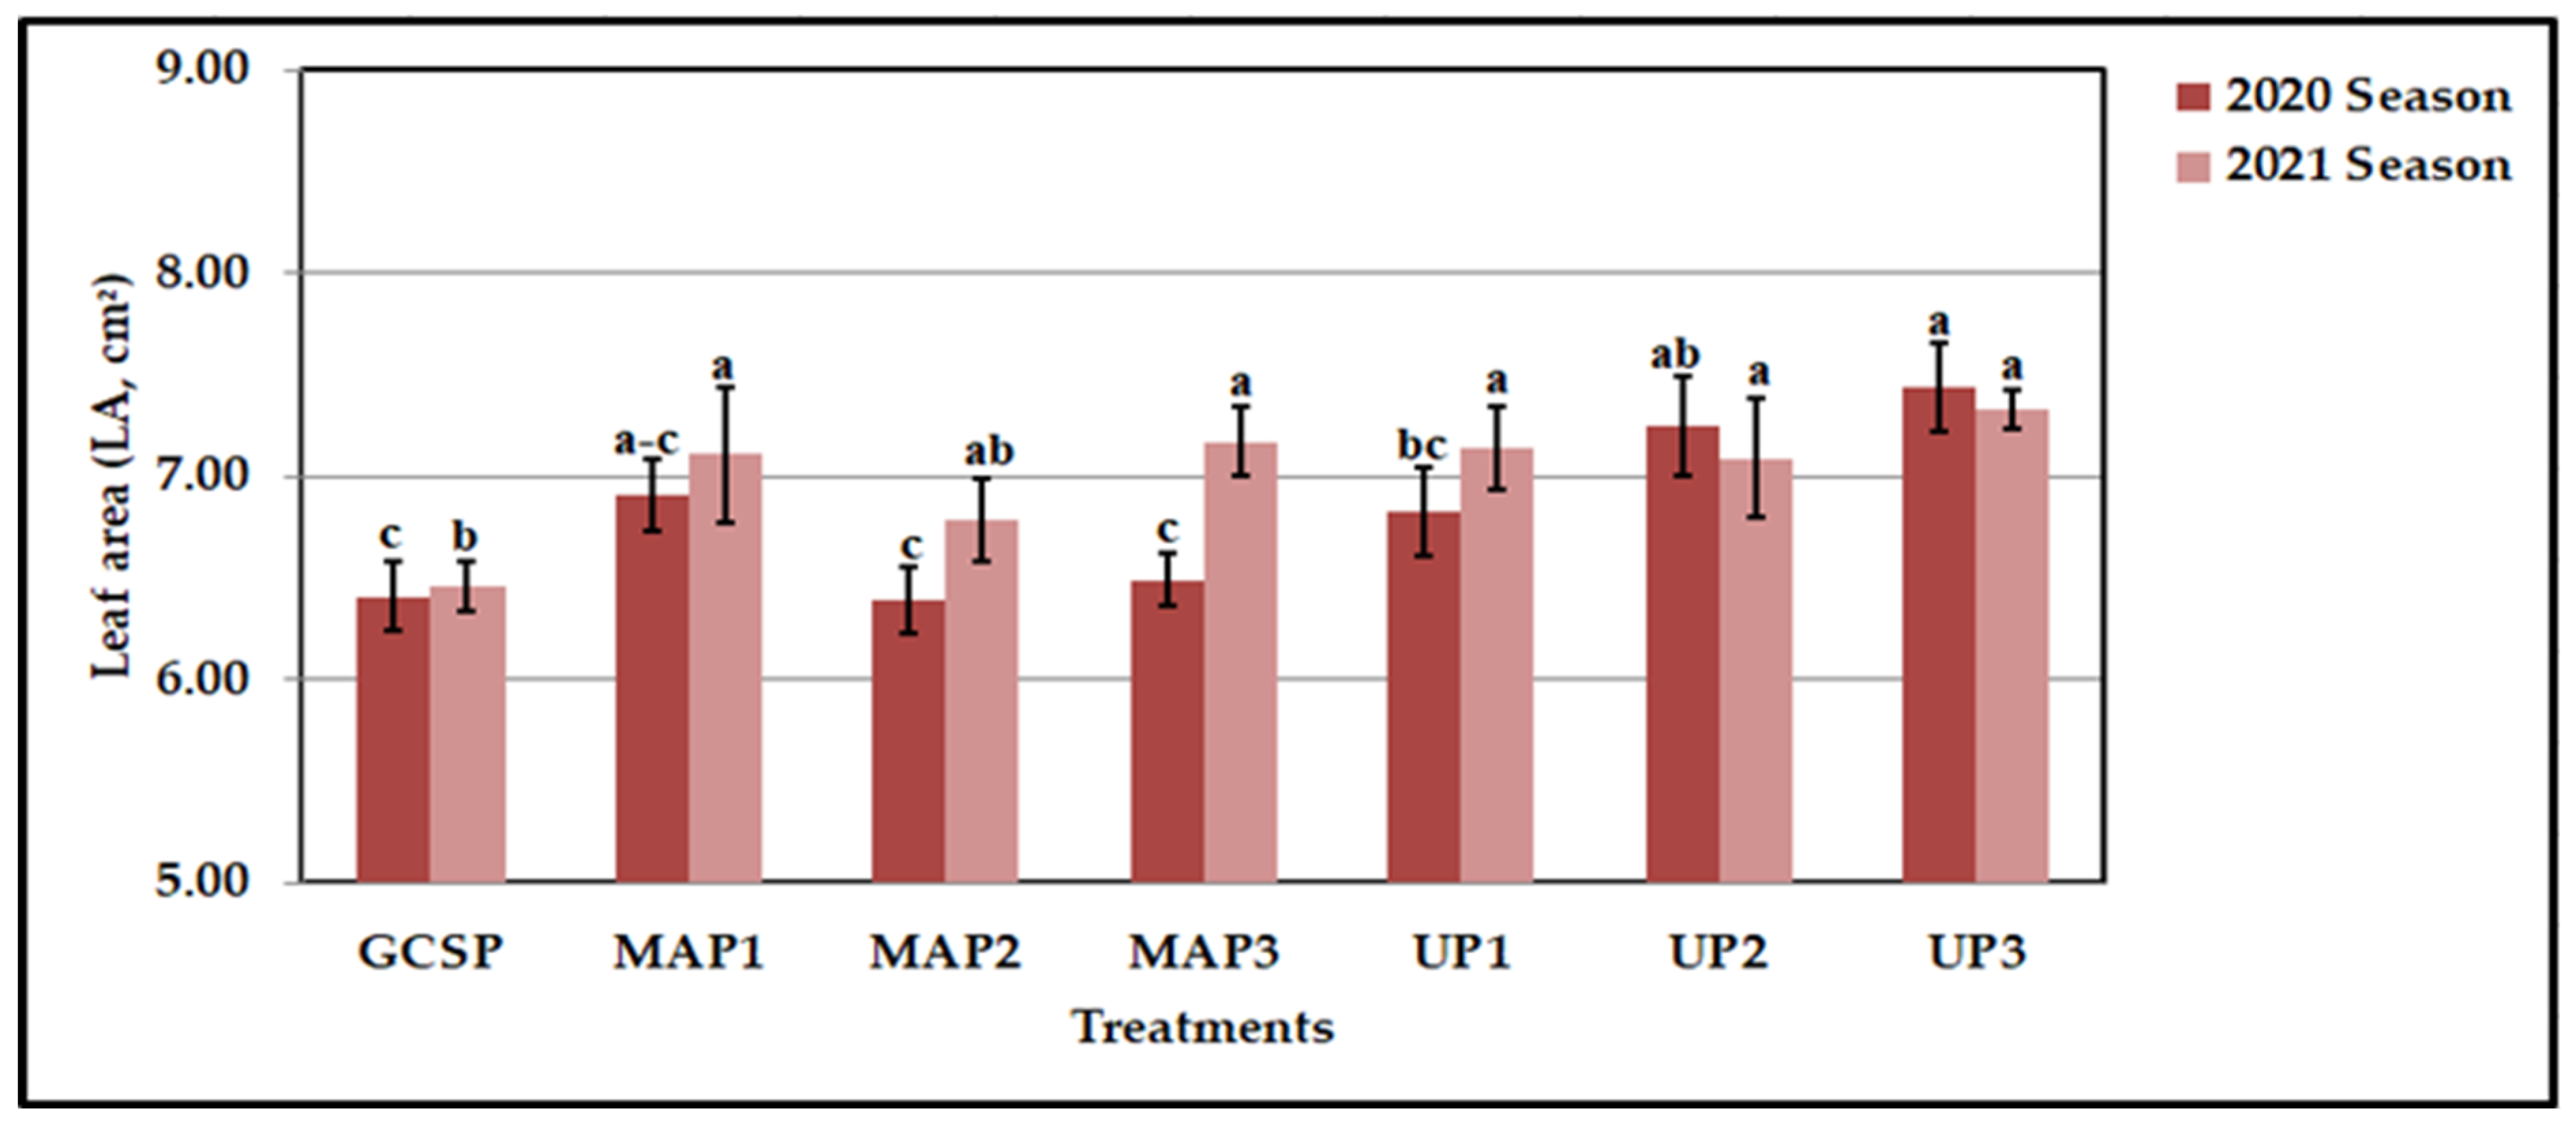
3.2. Physiological and Growth Attributes

The results pertaining to the influence of both phosphorus fertilizers applied, namely MAP and UP, in comparison with GCSP as a soil application on some physiological and growth parameters of olive trees grown under multi-abiotic stresses in the 2020 and 2021 seasons are graphically illustrated in Figure 1, Figure 2, Figure 3 and Figure 4. The obtained results indicated marked improvements for all studied physiological and growth parameters in both seasons; however, the highest values for shoot length (ShL) and leaf area (LA) were obtained via the applying of UP3 treatment in the two growing seasons.
Meanwhile, olive trees fertilized with 0.555 kg tree−1 of MAP (MAP3) showed the highest number of leaves (in area unit m2) and SPAD reading in both seasons, whereas the values reached 136.77 vs. 145.31 and 82.76 vs. 82.58 for both aforementioned attributes in the two growing seasons. On the other hand, we noted that the minimum values for all aforementioned parameters, with the exception of LA in the second season, were recorded in trees fertilized with the recommended level of GCSP (1.75 kg tree−1) in both seasons, whereas the lowest values of LA in the first season were recorded with MAP2 treatment. According to the comparison between the maximum and minimum values, the percentages of increase reached 22.37 vs. 51.19 for ShL, 27.17 vs. 19.54 for NLf, 14.18 vs. 11.64 for SPAD reading, and 16.43 vs. 13.47 for LA in the first and second seasons, respectively. The results of the ANOVA indicated that all treatments had significant effects (at p ≤ 0.01) for all aforementioned parameters except ShL in both seasons. However, there were significant (at p ≤ 0.05) and non-significant impacts for ShL in the 2020 and 2021 seasons, respectively.

3.3. Olive Fruit Quality

The results presented in Table 7 indicated that the olive trees fertilized with UP3 gave the maximum values (1.63 vs. 1.65 g) for total fruit weight (TFrW) and (1.32 vs. 1.31 g) for flesh weight (FlW) in the 2020 and 2021 seasons, respectively. Dissimilar results were obtained for seed weight (SeW), where the trees fertilized with GCSP gave the best values (0.29 g) in the first season, and trees treated with MAP1 and UP1 in the second season, since both of them gave the same value (0.30 g). As shown in Table 7, based on the obtained values for TFrW, SeW, and FlW, we found that the maximum values (81.26 vs. 4.35 and 81.32 vs. 4.36) for both fruit flesh weight (FrFlW%) and flesh/pit ratio (FPR), respectively, were achieved by applying UP3 in the growing season of 2020 and MAP1 in the growing season of 2021.
Despite the improvements achieved with MAP and UP, MAP2 treatment was the least influential on the TFrW in both seasons, with values of 1.63 vs. 1.65 g, and on FlW, recording 1.05 in the first season. Meanwhile, UP2 treatment had the weakest influence on SeW, FrFlW%, and FPR, recording values of 0.44, 70.75, and 2.43 in the first season. Accordingly, the lowest values (1.10, 73.35, and 2.77) for FlW, FrFlW, and FPR, respectively, were obtained in trees fertilized with GCSP in the second season. The obtained data indicated that the increment rates were 19.85 vs. 10.74 for TFrW, 25.71 vs. 19.09 for FlW, 14.86 vs. 10.87% for FrFlW, and 79.01 vs. 57.40% for FPR. Meanwhile, the rate of decline reached 34.09 vs. 25% for SeW in the two growing seasons, respectively. Analysis of variance indicated that the treatments had a significant impact (at P ≤ 0.01) on all studied attributes.
It is clear from Table 7 that UP3 and MAP3 led to appreciable improvements in fruit length (FrL) and fruit diameter (FrD), which in turn impacted the fruit shape index (LD). Our obtained results showed that the trees fertilized with UP3 achieved the highest values (15.11 vs. 16.08 mm) for FrL in both seasons, with 12.86 mm for FrD in the second season. Meanwhile, the greatest value (12.14 mm) for FrD was produced in trees treated with MAP3 in the first season. Based on the obtained values for FrL and FrD, the highest values (1.24 vs. 1.29) for LD were determined as a result of applying UP3 and MAP3 in the two growing seasons, respectively. On the contrary, trees fertilized with the MAP2 treatment yielded the minimum values of 13.17 vs. 13.79 mm for FrL and 11.28 vs. 11.47 mm for FrD in the 2020 and 2021 seasons, respectively. Meanwhile, the lowest values of 1.14 vs. 1.17 for LD were produced via UP2 treatment in both seasons, respectively. The obtained results in Table 7 show that the percentages of increase were 14.73 vs. 16.61, 7.62 vs. 12.12, and 8.77 vs. 10.26 for FrL, FrD, and LD in the growing seasons of 2020 and 2021, respectively. As displayed in Table 7, some parameters related to the flesh and seeds of olive fruits were significantly improved due to the application of the phosphorus fertilizers (MAP and UP) in comparison with GCSP. In our investigation, UP3 was the superior treatment for these fruit quality parameters. Although the improvements in the studied attributes were slight, the statistical analysis indicated that all treatments had significant effects (at p ≤ 0.01) on all studied parameters in the 2020 and 2021 seasons, respectively. Meanwhile, LD had a significant influence (at p ≤ 0.05) in the growing season of 2020.

3.4. Table and Oil Olive Yield

The impacts of different levels of MAP and UP in comparison with GCSP on fruit dry matter (FrDrM%), total olive yield (TOY, tree−1, and ha−1), and olive oil content (OOC, %) in the 2020 and 2021 seasons are presented in Table 8. The UP application was more effective compared with MAP treatment. The trees fertilized with UP3 produced the maximum total yield values, (42.67 vs. 42.83kg tree−1), and (10.75 vs. 10.79 ton ha−1), in the 2020 and 2021 seasons. Moreover, it was the best treatment for FrDrM% and OOC% in the second season, which reached 31.39 and 42.71%, respectively. Meanwhile, the trees treated with MAP3 recorded the highest values (32.99%) for FrDr% and (41.18%) for OOC in the first season, respectively.
Regarding the lowest values, the general trends indicated that the olive trees fertilized with GCSP recorded the minimum values (38.67 vs. 37.67 kg) for OTY and (35.92 vs. 35.45%) for OOC% in both seasons, respectively, as well as (29.22%) for FrDrM in the second season. In addition, the minimum values (9.66 vs. 9.41 ton ha−1) for TOY in the 2020 and 2021 seasons, respectively, and (29.22%) for FrDrM% in the second season were produced using 0.445 kg tree−1 (MAP2). The overall trends of our study showed that the trees fertilized with either MAP or UP outperformed their counterparts fertilized with GCSP.
As presented in Table 8, the percentage increases amounted to 12.90 vs. 7.43% for FrDrM%, 10.34 vs. 13.70% for OTY, 11.28 vs. 14.67% for TOY, and 14.64 vs. 20.48% for OOC in the growing seasons of 2020 and 2021, respectively. The results obtained from the statistical analysis revealed significant differences (at p ≤ 0.01) between treatments for all studied parameters in the first and second seasons, respectively.

3.5. Regression and Stepwise Analysis

The results obtained from the stepwise regression, shown in Table 9, indicate the relationship of the olive tree yield (OTY, kg) and olive oil content (OOC, %) with the leaf nutrient content, growth parameters, and yield attributes under multi-abiotic stresses in the 2020 and 2021 growing seasons. In both seasons, these factors made highly significant contributions to the OTY and OOC. In our results, the adjusted R2 values were 0.637 and 0.840 (r = 0.821 and 0.934) for OTY and 0.909 and 0.388 (r = 0.960 and 0.647) for OOC in the two seasons, respectively. The fitted equation then obtained demonstrated that the variation in OTY was explained by the variation in attributes such as FrL and LNC in 2020 and FrL, FrDrM%, FrFlW, and LD in 2021. Meanwhile, FrL, FrDrM%, and LMgC in 2020 and FrL in 2021 contributed to the OOC variation.

4. Discussion

This manuscript describes work that was carried out under multi-abiotic stresses through the application of two highly soluble phosphorus fertilizers (HSPFs) differing in their content of nitrogen (N%) and phosphorus (P2O5%), namely, MAP and UP, compared with GCSP as one of the most widely used phosphate fertilizers in Egypt, in an attempt to overcome the problem of P fixation and the unavailability of micronutrients under some abiotic stresses in olive trees (Oleaeuropaea L. arbequina cv.). As shown in Table 4, the tested soil suffered from more than one undesirable property, such as CaCO3 = 8.8 vs. 9.2%, ECe = 6.4 vs. 7.2 dS m−1, and pH = 7.78 vs. 7.89, in the two growing seasons of 2020 and 2021, respectively, which hindered the optimal growth of the olive trees. All these undesirable characteristics combined to negatively affect the absorption of nutrients and thus lead to different physiological and growth attributes, which in turn affect the table and olive oil yield and its components. Generally speaking, the obtained results revealed that the applied HSPFs, either MAP or UP, irrespective of their applied levels, significantly affected all studied nutrients. Our obtained data indicated that LPU, LFeU, and LMnU in both seasons; LNU, LCaU, and LMgU in the first season; and LKU in the second season were significantly increased with the UP application, irrespective of the use level. Additionally, LKU and LNaU in the 2020 season, in addition to LNU, LCaU, and LMgU in the 2021 season and LZnU in both growing seasons, were obtained in plants fertilized with MAP, regardless of the applied levels. In this context, the influences of MAP and UP were somewhat similar in terms of the availability of nutrients compared with GCSP. Furthermore, the remarkable superiority of the application of UP over MAP was demonstrated. These results may be attributed to the improved effects of MAP and UP in reducing soil pH; however, the mean pH values of MAP and UP were 4.5 and 1.8, in comparison with GCSP, whose pH was 7.5, as presented in Table 3. This pH value can improve the availability of nutrients and make them more soluble for uptake by olive tree roots. Very recently, some results were reported by [57]; they mentioned the positive impact of phosphoric acid (H3PO4) in reducing soil pH. The obtained results are in accordance with the results of [58,59,60]. In this regard, similar results reported that the simulative influence of MAP and UP may be due to their vital role in reducing soil pH, which in turn markedly influences nutrient availability and plays a fundamental role in fixing atmospheric nitrogen, which is beneficial to enhancing LNU [61,62]. The notable declines in LNU, as shown in the MAP1, MAP3, and UP1 treatments, could be due to the translocation of N from leaves to fruit during the pollination stage. As shown in Table 3, irrespective of the applied level, applying ammonium sulfate with GCSP under a high soil pH encouraged the occurrence of mineralization in both 2020 and 2021. Then, the ammonium (NH4+) ions were converted into nitrate (NO3) ions, which were lost by leaching; this could be due to the negative charge and increased water requirements, regardless of the nature of the dry climate. Although these results are not in agreement with the findings of [63,64], in which decreases in LNU were proposed to be due to the translocation of N to form young shoots, these results were in accordance with those obtained by [63,65]. They were not in line with [64], especially regarding LNU, wherein the recorded lower values may be due to the high CaCO3 content in the tested soil, in addition to the prevalent climatic conditions related to the ARH and AP, as presented in Table 1. In other words, both MAP and UP enhanced the root hair system, thus increasing the absorption efficiency of roots in the growing olive trees. These results were further explained based on the soil’s chemical and physical properties; HPO4−− and H2PO4 ions from both MAP and UP were absorbed quickly by root trees compared to GCSP. These ions were fixed in soil due to the high pH of dicalcium phosphate (CaHPO4) and tricalcium phosphate [Ca3(PO4)2], and their solubility was limited according to the following equation: Ca(H2PO4) + 2Ca+2 Ca3(PO4)2 + 4H+. The precipitation of HPO4 on the surface of CaCO3 can be expressed by the following equation: Ca(H2PO4) + 2CaCO3 Ca3(PO4)2 + 2CO2 + 2H2O. Moreover, HPO4−− ions are fixed by an absorption reaction with Fe, Zn, and Mn. The only exception was that the highest LCuU was produced in plants treated with GCSP in the 2020 season. Similar results were reported by [66], who observed that using GCSP as a foliar application on eggplants in a high dose (2%) enhanced plant growth, which in turn affected nutrient uptake; alternatively, the result may have been due to an antagonistic effect between Cu and Fe, Mn, and Zn. In other words, the results could indicate that applying MAP or UP is better than applying GCSP, due to the fact that the presence of N and P in one chemical structure is better for the absorption of both nutrients compared to adding them individually with GCSP treatment. In summary, nutritional status is the basis upon which to evaluate physiological and growth parameters. It could be noticed that the maximum values were produced when applying the maximum level of the applied HSPF, irrespective of its type. However, the ShL values and SPAD readings were obtained with the MAP3 treatment in both seasons, in addition to the number of leaves per m2 (NLfm2) in the second season. Meanwhile, the maximum values of LA were produced in trees fertilized with UP3 in both seasons. These results also explain that the P reaction products differ from each other in their solubility. This confirms that the different sources of phosphate fertilizers are not equally effective, due to the presence of NH4+ ions in MAP and their conversion into NO3 ions. Similarly, the presence of amide groups (-NH2) in UP and their conversion into NH4+ ions and then into NO3 ions lead to a lowered soil pH in the rhizosphere zone [67]; in addition, the absorption of NO3 enhanced the dissolution of precipitated Ca-P compounds and P availability [68,69]. These results could be attributed to the vital role of MAP and UP in reducing soil pH and increasing the levels of available P, which, in turn, markedly affect several metabolic and physiological processes, such as protein synthesis [9] and phosphorprotein, fat, and sulfur metabolism [13]. In addition, it is an essential element in energy-rich compounds such as ATP, ADP, and AMP and in the photosynthesis process [8]; in turn, it significantly influences cell division and elongation. To confirm the role of soil pH in nutrient availability, some studies have been reported [70,71] regarding the influence of organic manure on reducing soil pH, which in turn positively impacted nutrient availability in Jerusalem artichoke plants. On the other hand, applying GCSP yielded the lowest values for all of the studied attributes. This is clear evidence of the difference in the solubility of H2PO4 and HPO4−− ions in the three studied phosphorus fertilizers, and thus their different behaviors in the soil. These results indicated that the P utilization from MAP and UP was higher than P in GCSP in the vegetative growth stage [72,73,74]. However, under high CaCO3 content conditions, the P in GCSP fertilizer converts from available to unavailable forms such as Ca2-P, Ca8-P, and Ca10-P.
The beneficial effects of P in MAP and UP, which, in turn, were reflected in the total olive yield and its attributes, are presented in Table 8; however, they could be a result of nutritional status improvement. These results are in agreement with the results of [58,61], who reported that absorbed N, P, and K act as cofactors to increase the total carbohydrates and their assimilation, which causes an increase in the assimilation products, which is consequently reflected in the studied yield attributes, such as TFrW, FlW, FrL, FrD, and FrDrM. In other words, these enhancements may be due to the improved impact of MAP and UP on the leaf K and Zn content [75,76,77,78]. Regarding the maximum OTY and TOY, it could be observed from our results that the maximum values of OTY and TOY were recorded for trees fertilized with the UP3 treatment, followed by the MAP3 treatment, in both seasons. It is evident that the TOY depends on the high level of the applied highly soluble phosphorus fertilizer. These results could be due to P and its synergistic effects on the translocation of different nutrients’ availability. Additionally, the increases in P application might cause improvements in the root system [79], consequently enabling plants to absorb more water and nutrients from the depths of the soil. Furthermore, the N present within the chemical structure of both MAP and UP played a cooperative role with P in enhancing the plant growth and the ability to increase flowering due to their direct influence on growth and on the promotion the chlorophyll formation [10]. These obtained results are in line with the previous results of [80,81].

5. Conclusions

Under saline calcareous alkaline soils, phosphorus and other micronutrients are fixed in unavailable forms. This work was conducted on olive (Olea europaea, Arbequina cv.) trees grown in sandy clay loam soil characterized by multiple undesirable properties (CaCO3 = 8.8 vs. 9.2%, ECe = 6.4 vs. 7.2 dS m−1, and pH = 7.78 vs. 7.89) in the 2020 and 2021 seasons, respectively, under a drip irrigation system. Generally speaking, from our results, three main points could be concluded: (1) The application of highly soluble phosphorus fertilizers (HSPFs), mono-ammonium phosphate (MAP), and urea phosphate (UP), irrespective of the use level, was the most influential compared with granular calcium super-phosphate (GCSP) for all studied characteristics except leaf copper uptake. (2) Regardless of the applied level, plants subjected to the application of UP yielded superior results to their counterparts fertilized with MAP. (3) The application of the maximum level of either MAP (0.555 kg tree−1) or UP (0.770 kg tree−1) gave the best results for most of the studied traits. However, the trees fertilized with MAP3 gave the maximum values for shoot length, SPAD reading, and dry fruit matter. Meanwhile, the plants fertilized with UP3 produced the best results for the leaf area, olive tree yield, total olive yield, total fresh weight, flesh weight (FlW), fruit length (FrL), and leaf Fe content in both seasons. In short, the application of HSPFs under these conditions might be an alternative surrogate to improve nutrient efficiency and thus improve productivity.

Author Contributions

Conceptualization, H.A.Z.H. and H.R.B.; data curation, A.A.M.A., H.A.Z.H. and H.R.B.; formal analysis, A.A.M.A. and H.A.Z.H.; investigation, H.A.Z.H., A.A.M.A. and H.R.B.; methodology, A.A.M.A. and H.A.Z.H.; resources, H.A.Z.H. and H.R.B.; software A.A.M.A. and H.R.B.; writing—original draft, A.A.M.A.; writing—review and editing, A.A.M.A. and H.A.Z.H. All authors have read and agreed to the published version of the manuscript.

Funding

This research received no external funding.

Institutional Review Board Statement

Not appreciable.

Informed Consent Statement

Not appreciable.

Data Availability Statement

The data presented in this study are available upon request from the corresponding author.

Conflicts of Interest

The authors declare no conflict of interest.

References

  1. Aboukila, E.F.; Nassar, I.N.; Rashad, M.; Hafez, M.; Norton, J.B. Reclamation of calcareous soil and improvement of squash growth using brewers’ spent grain and compost. J. Saudi Soc. Agric. Sci. 2018, 17, 390–397. [Google Scholar] [CrossRef] [Green Version]
  2. Wahba, M.M.; Labib, F.; Zaghloul, A. Management of calcareous soils in arid region. Int. J. Environ. Pollut. Environ. Model. 2019, 2, 248–258. [Google Scholar]
  3. FAO. Soils Portal: Management of Calcareous Soils; Food and Agriculture Organization of United Nations: Rome, Italy, 2016; Available online: http://www.fao.org/soils-portal/soilmanagement/managementof-someproblem-soils/calcareous-soils/ar/ (accessed on 1 April 2016).
  4. Saad El-Dein, A.A.; Galal, M.E. Prediction of Reclamation Processes in Some Saline Soils of Egypt. Egypt. J. Soil Sci. 2017, 57, 293–301. [Google Scholar]
  5. Agbna, G.H.M.; Ali, A.B.; Bashir, A.K.; Eltoum, F.; Hassan, M.M. Influence of biochar amendment on soil water characteristics and crop growth enhancement under salinity stress. Int. J. Eng. Works 2017, 4, 49–53. [Google Scholar]
  6. Sun, J.; Yang, R.; Li, W.; Pan, Y.; Zheng, M.; Zhang, Z. Effect of biochar amendment on water infiltration in a coastal saline soil. J. Soil Sediment 2018, 18, 3271–3279. [Google Scholar] [CrossRef]
  7. Jamil, A.; Riaz, S.; Ashraf, M.; Foolad, M.R. Gene expression profiling of plants under salt stress. Crit. Rev. Plant Sci. 2011, 30, 435–458. [Google Scholar] [CrossRef]
  8. Vance, C.P.; Uhde-Stone, C.; Allan, D.L. Phosphorus acquisition and use: Critical adaptations by plants for securing a nonrenewable resource. New Phytol. 2003, 157, 423–447. [Google Scholar] [CrossRef] [PubMed] [Green Version]
  9. Von Wandruszka, R. Phosphorus retention in calcareous soils and the effect of organic matter on its mobility. Geochem. Trans. 2006, 7, 6–14. [Google Scholar] [CrossRef] [Green Version]
  10. Taiz, L.; Zeiger, E.; Møller, I.M.; Murphy, A. Plant Physiology and Development, 6th ed.; Sinauer Associates: Sunderland, MA, USA, 2015. [Google Scholar]
  11. Barłóg, P.; Grzebisz, W.; Feć, M.; Łukowiak, R.; Szczepaniak, W. Row method of sugar beet (Beta vulgaris L.) fertilization with multicomponent fertilizer based on urea-ammonium nitrate solution as a way to increase nitrogen efficiency. J. Cent. Eur. Agric. 2010, 11, 225–234. [Google Scholar]
  12. Salimpour, S.; Khavazi, K.; Nadian, H.; Besharati, H.; Miransari, M. Enhancing phosphorous availability to canola (Brassica napus L.) using P solubilizing and sulfur oxidizing bacteria. Aust. J. Crop Sci. 2010, 4, 330–334. [Google Scholar]
  13. Uygar, V.; Şen, M. The effect of phosphorus application on nutrient uptake and translocation in wheat cultivars. Int. J. Agric. For. Life Sci. 2018, 2, 171–179. [Google Scholar]
  14. Faye, I.; Diouf, O.; Guisse, A.; Sene, M.; Diallo, N. Characterizing root responses to low phosphorus in pearl millet [Pennisetum glaucum (L.) R. Br.]. Agron. J. 2006, 98, 1187–1194. [Google Scholar] [CrossRef]
  15. Awad, A.A.M.; Sweed, A.A.A. Influence of organic manures on soil characteristics and yield of Jerusalem artichoke. Commun. Soil Sci. Plant Anal. 2020, 51, 1101–1113. [Google Scholar] [CrossRef]
  16. Farrag, H.M.; Bakr, A.A.A. Biological reclamation of a calcareous sandy soil with improving wheat growth using farmyard manure, acid producing bacteria and yeast. Int. J. Agric. Sci. 2021, 3, 53–71. [Google Scholar] [CrossRef]
  17. Ringeval, B.; Augusto, L.; Monod, H.; van Apeldoorn, D.; Bouwman, L.; Yang, X.; Achat, D.L.; Chini, L.P.; Van Oost, K.; Guenet, B.; et al. Phosphorus in agricultural soils: Drivers of its distribution at the global scale. Glob. Chang. Biol. 2017, 23, 3418–3432. [Google Scholar] [CrossRef] [PubMed] [Green Version]
  18. Lopez-Bucio, J.; Vega, O.M.; Guevara-García, A.; Herrera-Estrella, L. Enhanced phosphorus uptake in transgenic tobacco plants that overproduce citrate. Nat. Biotechnol. 2000, 18, 450–453. [Google Scholar] [CrossRef]
  19. Adesemoye, A.; Kloepper, J. Plant–microbes interactions in enhanced fertilizer use efficiency. Appl. Microbiol. Biotechnol. 2009, 85, 1–12. [Google Scholar] [CrossRef] [Green Version]
  20. Fageria, N.K.; Moreira, A.; and Castro, C. Response of soybean to phosphorus fertilization in Brazilian Oxisol. Commun. Soil Sci. Plant Anal. 2011, 42, 2716–2723. [Google Scholar] [CrossRef]
  21. Bargaz, A.; Noyce, G.L.; Fulthorpe, R.; Carlsson, G.; Furze, J.R.; Jensen, E.S.; Dhiba, D.; Isaac, M.E. Species interactions enhance root allocation, microbial diversity and P acquisition in intercropped wheat and soybean under P deficiency. Appl. Soil Ecol. 2017, 120, 179–188. [Google Scholar] [CrossRef]
  22. Osborne, S.L.; Schepers, J.S.; Francis, D.D.; Schlemmer, M.R. Detection of phosphorus and nitrogen deficiencies in corn using spectral radiance measurements. Agron. J. 2002, 94, 1215. [Google Scholar] [CrossRef] [Green Version]
  23. Choi, J.M.; Lee, C.W. Influence of elevated phosphorus levels in nutrient solution on micronutrient uptake and deficiency symptom development in strawberry cultured with fertigation system. J. Plant Nutr. 2012, 35, 1349–1358. [Google Scholar] [CrossRef]
  24. Viégas, I.J.M.; Cordeiro, R.A.M.; Almeida, G.M.; Silva, D.A.S.; De Silva, B.C.; Okumura, R.S.; Junior, M.L.S.; De Silva, S.P.; De Freitas, J.M.N. Growth and visual symptoms of nutrients deficiency in Mangosteens (Garcinia mangostana L.). Am. J. Plant Sci. 2018, 9, 1014–1028. [Google Scholar] [CrossRef] [Green Version]
  25. Bagayoko, M.; George, E.; Romheld, V.; Buerkert, A.B. Effects of mycorrhizae and phosphorus on growth and nutrient uptake of millet, cowpea and sorghum on a west African soil. J. Agric. Sci. 2000, 135, 399407. [Google Scholar] [CrossRef]
  26. Tang, J.W.; Mu, R.Z.; Zhang, B.L.; Fan, X.S. Solubility of urea phosphate in water + phosphoric acid from (277.00 to 354.50) K. J. Chem. Eng. Data 2007, 52, 1179–1181. [Google Scholar] [CrossRef]
  27. Navizaga, C.; Boecker, J.; Sviklas, A.M.; Galeckiene, J.; Baltrusaitis, J. Adjustable N:P2O5 ratio urea phosphate fertilizers for sustainable phosphorus and nitrogen use: Liquid phase equilibria via solubility measurements and raman Spectroscopy. ACS Sustain. Chem. Eng. 2017, 5, 1747–1754. [Google Scholar] [CrossRef]
  28. Kucharski, J.; Wyszkowska, J.; Borowik, A. Biological effects produced by urea phosphate in soil. J. Res. Appl. Agric. Eng. 2013, 58, 25–28. [Google Scholar]
  29. Zhang, H.Y.; Huang, Z.H.; Wang, J.; Zhang, J.; Meng, C.R.; Wei, C.Z. Effects of different acidifiers on pH and phosphorus availability in calcareous soil. Soils Fert. Sci. China 2019, 1, 145–150. [Google Scholar]
  30. Diego, B.; Ercan, H.; Munoz, C.; Arquero, O. Factors influencing the efficiency of mono-potassium phosphate in the olive. Intl. J. Plant Prod. 2010, 4, 235–240. [Google Scholar]
  31. Shaheen, A.A. Effect of Using Some Sources of Phosphorus on Flowering, Fruiting and Productivity of Olive Trees. World J. Agric. Sci. 2019, 15, 103–113. [Google Scholar]
  32. Barone, E.; Mantia, M.; La-Marchese, A.; Marra, F.P. Improvement in yield and fruit size and quality of table olive cvs. Sci. Agric. 2014, 71, 52–57. [Google Scholar] [CrossRef]
  33. Ran, E.U.; Yasuor, H.C.; Schwartz, D.A.; Gal1, A.B.; Dag, A. Phosphorous nutritional level, carbohydrate reserves and flower quality in olives. J. Plant Sci. Genet. Isr. 2016, 16, 1–19. [Google Scholar]
  34. Hopkins, B.G. Russet Burbank potato phosphorus fertilization with dicarboxylic acid copolymer additive (AVAIL®). J. Plant Nutr. 2011, 33, 1422–1434. [Google Scholar] [CrossRef]
  35. Rosen, C.J.; Kelling, A.K.; Stark, J.C.; Gregory, A.P. Optimizing Phosphorus Fertilizer Management in Potato Production. Am. J. Potato Res. 2014, 91, 145–160. [Google Scholar] [CrossRef]
  36. Carl, J.R.; Mcnearney, M.; Peter, B. Effect of liquid fertilizer sources and avail on potato yield and quality. In Proceedings of the Idaho Potato Conference, Poccatelo, ID, USA, 19–20 January 2011. [Google Scholar]
  37. Abdel-Razzak, H.S.; Moussa, A.G.; Abd El-Fattah, M.A.; El-Morabet, G.A. Response of sweet potato to integrated effect of chemical and natural phosphorus fertilizer and their levels in combination with mycorrhizal Inoculation. J. Biol. Sci. 2013, 13, 112–122. [Google Scholar] [CrossRef] [Green Version]
  38. FAO. FAOSTAT; Food and Agriculture Organization of the United Nations: Rome, Italy, 2017; Available online: http://www.fao.org/faostat/en/ (accessed on 10 December 2019).
  39. Mahmoud, T.M.; Emam, S.; Mohamed, A.; El-Sharony, T.F. Influence of foliar application with potassium and magnesium on growth, yield and oil quality of “Koroneiki” olive trees. Am. J. Food Technol 2017, 12, 209–220. [Google Scholar] [CrossRef] [Green Version]
  40. Stan, K.; David, H. Producing Table Olives; Land links Press: Collingwood, Australia, 2007; p. 3066. [Google Scholar]
  41. Abo Arab, D.E.A.A. Effects of Bio and Mineral Phosphorus Fertilization on the Quality and Yield of Melon (Cantaloupe). M.Sc. Thesis, High Institute of Public Health, Alexandia University, Alexandria, Egypt, 2014. [Google Scholar]
  42. Gregoriou, C.; El-Kholy, M. Fertilization. In Olive GAP Manual: Good Agricultural Practices for the Near East & North Africa Countries; FAO: Rome, Italy, 2010. [Google Scholar]
  43. Fernandez-Escobar, R. Fertilization. In El Cultivo del Olive, 7th ed.; Barranco, D., Fernandez-Escobar, R., Rallo, I., Eds.; Mundi-Prensa: Madrid, Spain, 2017; pp. 419–460. [Google Scholar]
  44. Bouyoucos, C.J. Hydrometer method improved for making particle size analysis of soil. Soil Sci. Soc. Proc. 1981, 26, 446–465. [Google Scholar]
  45. McLean, E.O. Soil pH and lime requirement. In Methods of Soil Analysis. Part 2. Chemical and Microbiological Properties; Page, A.L., Ed.; American Society of Agronomy: Madison, WI, USA, 1982; pp. 199–224. [Google Scholar]
  46. Page, A.L.; Miller, R.H.; Keeney, D.R. Method of Soil Analysis. Part 2. Chemical and Microbiological Methods; American Society of Agronomy: Madison, WI, USA, 1982; pp. 225–246. [Google Scholar]
  47. Allison, L.E. Organic carbon. In Methods of Soil Analysis. Part II; Dans, C., Black, A., Eds.; American Society of Agronomy: Madison, WI, USA, 1965; Chapter 90; pp. 1372–1376. [Google Scholar]
  48. Jackson, M.L. Soil Chemical Analysis; Constable and Co. Ltd.: London, UK, 1962. [Google Scholar]
  49. Pregl, F. Quantitative Organic Micro-Analysis, 4th ed.; Churchill, A., Ed.; P. Blakiston’s Son & Company: London, UK, 1945; pp. 126–129. [Google Scholar]
  50. Olsen, S.R.; Cole, C.V.; Watanabe, F.S.; Dean, L.A. Estimation of Available Phosphorus in Soils by Extraction with Bicarbonate; Department of Agriculture: Washington, DC, USA, 1954. [Google Scholar]
  51. Chapman, H.D. Cation-exchange capacity. In Methods of Soil Analysis. Part II; Dans, C., Black, A., Eds.; American Society of Agronomy Inc.: Madison, WI, USA, 1965; Chapter 57–58; pp. 891–903. [Google Scholar]
  52. Lindsay, W.L.; Norvell, W.A. Development of ADTPA-Soil test for zinc, iron, manganese and cooper. Soil Sci. Soc. Am. J. 1978, 42, 421–428. [Google Scholar] [CrossRef]
  53. Baird, R.B.; Eaton, E.D.; Rice, E.W. Standard Methods for the Examination of Water and Waste Water, 23rd ed.; American Public Health Association: Washington, DC, USA, 2017. [Google Scholar]
  54. Fouad, M.M.; Omima, A.K.; El-Said, M. Comparative studies on flowering fruit set and yield of some olive cultivars under Giza conditions. Egypt J. Appl. Sci. 1992, 7, 630–644. [Google Scholar]
  55. A.O.A.C. Association of Agriculture Chemicals. Official Methods of Analysis of Association of Official Analytical Chemicals, 17th ed.; Association of Agriculture Chemicals: Washington, DC, USA, 2000. [Google Scholar]
  56. Di Rienzo, J.A.; Casanoves, F.; Balzarini, M.G.; Gonzalez, L.; Tablada, M.; Robledo, C.W. InfoStat versiόn. Group InfoStat, FCA, Universidad Nacional de Cόrdoba, Argentina. 2011. Available online: http://www.infostat.com.ar (accessed on 29 September 2020).
  57. Zaki, M.E.; Mohamed, M.H.M.; Abd El-Wanis, M.M.; Glala, A.A.A.; Hamoda, A.H.M.; Shams, A.S. Implications of applied P-Sources with calcium super phosphate, phosphoric acid and rock phosphate, and phosphate dissolving bacteria on snap bean grown under greenhouses conditions. In Proceedings of the 5th International Conference on Biotechnology Applications in Agriculture (ICBAA), Benha University, Benha, Egypt, 8 April 2021. [Google Scholar]
  58. El-zeiny, O.A.H. Effect of bio-fertilizers and root exudates of two weeds as a source of natural growth regulators on growth and productivity of bean plants (phaseolus vulgaris L.). J. Agric. Biol. Sci. 2007, 3, 440–446. [Google Scholar]
  59. Gharib, A.A.; Shahen, M.M.; Ragab, A.A. Influence of rhizobium inoculation combined with Azotobacter chrococcum and Bacillus megaterium var phosphaticum on growth, nodulation, yield and quality of two snap bean (Phasealus vulgaris, L.) Cultivers. In Proceedings of the 4th Conference on Recent Technologies in Agriculture, Giza, Egypt, 3–5 November 2009; pp. 650–660. [Google Scholar]
  60. Massoud, O.N.; Morsy, E.M.; Nadia, H.E. Field response of snap bean (Phaseolus vulgaris L.) to N2-fixers bacillus circulans and arbuscular mycorrhizal fungi inoculation through accelerating rock phosphate and feldspar weathering. Aust. J. Basic Appl. Sci. 2009, 3, 844–852. [Google Scholar]
  61. Ahmed, A.M.; Gheeth, R.H.M.; Galal, R.M. Influence of organic manures and rock phosphate combined with feldspar on growth, yield and yield components of bean (Phaseolus vulgaris L.). Assiut J. Agric. Sci. 2013, 44, 71–89. [Google Scholar]
  62. Sabry, M.Y.; Gamal, S.R.; Salama, A.A. Effect of phosphorus sources and arbuscular mycorrhizal inoculation on growth and productivity of snap bean (Phaseolus vulgaris L.). Gesunde Pflanzen. 2017, 69, 139–148. [Google Scholar]
  63. Bouhafa, K.; Moughli, L.; Bouabid, R.; Douaik, A.; Taarabt, Y. Dynamics of macronutrients in olive leaves. J. Plant Nutr. 2018, 41, 956–968. [Google Scholar] [CrossRef]
  64. Gimenez, M.; Nieves, M.; Gimeno, H.; Martinez, J.; Martinez-Nicola, J.J. Nutritional diagnosis norms for three olive tree cultivars in superhigh density orchards. Int. J. Agric. Nat. Resour. 2021, 48, 34–44. [Google Scholar] [CrossRef]
  65. Zipori, I.; Yermiyahu, U.; Ben-Gal, A.; Dag, A. Sustainable Management of Olive Orchard Nutrition: A Review. Agriculture 2020, 10, 11. [Google Scholar] [CrossRef] [Green Version]
  66. El-Tohamy, W.A.; Ghoname, A.A.; Abou-Hussein, S.D. Improvement of pepper growth and productivity in sandy soil by different fertilization treatments under protected cultivation. J. Appl. Sci. Res. 2006, 2, 8–12. [Google Scholar]
  67. Nardi, S.; Tosoni, M.; Pizzeghello, D.; Provenzano, M.R.; Cilenti, A.; Sturaro, R.; Vianello, A. A comparison between humic substances extracted by root exudates and alkaline solution. Soil Sci. Soc. Am. J. 2005, 69, 2012–2019. [Google Scholar] [CrossRef] [Green Version]
  68. Chien, S.H.; Prochnow, L.I.; Tu, S.; Snyder, C.S. Agronomic and environmental aspects of phosphate fertilizers varying in source and solubility: An update review. Nutr. Cycl. Agroecosyst. 2011, 89, 229–255. [Google Scholar] [CrossRef]
  69. Leytem, A.B.; Dungan, R.S.; Moore, A. Nutrient availability to corn from dairy manures and fertilizer in a calcareous soil. Soil Sci. 2011, 176, 426–434. [Google Scholar] [CrossRef] [Green Version]
  70. Awad, A.A.M.; Ahmed, H.M.H. Impact of organic manure combinations on performance and rot infection of stressed-Jerusalem artichoke plants. Egypt J. Soil Sci. 2018, 58, 417–433. [Google Scholar] [CrossRef]
  71. Awad, A.A.M.; Ahmed, H.M.H. Response of Jerusalem artichoke plants grown under saline calcareous soil to application of different combined organic manures. Egypt J. Soil Sci. 2019, 59, 117–130. [Google Scholar] [CrossRef]
  72. Pramanik, K.; Bera, A.K. Effect of seedling age and nitrogen fertilizer on growth, chlorophyll content, yield and economics of hybrid rice. Intl. J. Agron. Plant Prod. 2013, 4, 34893499. [Google Scholar]
  73. Tari, D.B.; Daneshian, J.; Amiri, E.; Rad, A.H.S.; Moumeni, A. Investigation chlorophyll condition at different nitrogen fertilization methods in rice by applied mathematics relations. J. Sci. Res. 2013, 14, 1056–1058. [Google Scholar]
  74. Pradhan, P.P.; Dash, A.K.; Panda, N.; Samant, P.K.; Mishra, A.P. Effect of graded doses of neem coated urea on productivity of low land rice. ORYZA Int. J. Rice 2019, 56, 68–74. [Google Scholar] [CrossRef]
  75. Awad, A.A.M.; Ahmed, A.I.; Abd Elazem, A.H.; Sweed, A.A.A. Mitigation of CaCO3 influence on Ipomoea batatas plants using Bacillus megaterium DSM 2894. Agronomy 2022, 12, 1571. [Google Scholar] [CrossRef]
  76. Sarrwy, S.M.A.; Enas, A.M.; Hassan, H.S.A. Effect of Foliar Sprays with Potassium Nitrate and Mono-potassium Phosphate on leaf mineral contents, fruit set, yield and fruit quality of picual olive trees grown under sandy soil conditions. Am. Eurasian J. Agric. Environ. Sci. 2010, 8, 420–430. [Google Scholar]
  77. Ben Mimoun, M.; Loumi, O.; Ghrab, M.; Latiri, K.; Hellali, R. Foliar potassium application on olive tree. In Proceedings of the Regional Workshop on Potassium and Fertigation Development in West Asia and North Africa, Rabat, Morocco, 24–28 November 2004. [Google Scholar]
  78. Ramezani, S.; Shekafandeh, A. Role of gibberellic acid and zinesulphate in increasing size and weight of olive fruit. Afr. J. Biotechnol. 2009, 8, 6791–6794. [Google Scholar]
  79. Gobarah, M.E.; Mohamed, M.H.; Tawfik, M.M. Effect of phosphorus fertilizer and foliar spraying with zinc on growth, yield and quality of groundnut under reclaimed sandy soils. J. Appl. Sci. Res. 2006, 2, 491496. [Google Scholar]
  80. El-Habbasha, S.F.; Kandil, A.A.; Abu-Hagaza, N.S.; Abdel-Haleem, A.K.; Khalafallah, M.A.; Behiary, T.G. Effect of phosphorus levels and some biofertilizers on dry matter, yield and yield attributes of groundnut. Bull. Fac. Agric. Cairo Univ. 2005, 56, 237–252. [Google Scholar]
  81. Kumar, S.; Dhar, S.; Kumar, A.; Kumar, D. Yield and nutrient uptake of maize (Zea mays)–wheat (Triticum aestivum) cropping system as influenced by integrated potassium management. Indian J. Agron. 2015, 60, 511–515. [Google Scholar]
Figure 1. Influence of two phosphorus fertilizers; mono-ammonium phosphate (MAP) and urea-phosphate (UP) in comparison with granular calcium phosphate (GCSP) applied to shoot length (ShL, cm) of olive (arbequina cv.) trees grown in sandy loam clay soil under multi-abiotic stresses (CaCO3 = 8.8 vs. 9.2%, ECe = 6.4 vs. 7.2 dS m−1, and pH = 7.78 vs. 7.89) during 2020 and 2021 seasons. GSCP applied represents 1.75 kg tree−1, MAP1, MAP2, and MAP3 represent MAP applied at 0.336, 0.445, and 0.555 kg tree−1, and UP1, UP2, and UP3 represent UP applied at 0.465, 0.616, and 0.770 kg tree−1. Bars in the same years with a different letter indicate significant differences between treatments at p ≤ 0.01. According to Duncan’s multiple range test, bars sharing the same letter in each column are not significantly different.
Agronomy 12 02390 g001
Figure 2. Influence of phosphorus fertilizers; mono-ammonium phosphate (MAP) and urea phosphate (UP) applied to number of leaves m−2 of olive (arbequina cv.) trees grown in sandy loam clay soil under multi-abiotic stresses (CaCO3 = 8.8 vs. 9.2%, ECe = 6.4 vs. 7.2 dS m−1, and pH = 7.78 vs. 7.89) during 2020 and 2021 seasons. GSCP applied represents 1.75 kg tree−1, MAP1, MAP2, and MAP3 represent MAP applied at 0.336, 0.445, and 0.555 kg tree−1, and UP1, UP2, and UP3 represent UP applied at 0.465, 0.616, and 0.770 kg tree−1. Bars in the same years with a different letter indicate significant differences between treatments at p ≤ 0.01. According to Duncan’s multiple range test, bars sharing the same letter in each column are not significantly different.
Agronomy 12 02390 g002
Figure 3. Influence of phosphorus fertilizers; mono-ammonium phosphate (MAP and urea phosphate (UP) applied to SPAD reading of olive (arbequina cv.) trees grown in sandy loam clay soil under multi-abiotic stresses (CaCO3 = 8.8 vs. 9.2%, ECe = 6.4 vs. 7.2 dS m−1, and pH = 7.78 vs. 7.89) during 2020 and 2021 seasons. GSCP applied represents 1.75 kg tree−1, MAP1, MAP2, and MAP3 represent MAP applied at 0.336, 0.445, and 0.555 kg tree−1, and UP1, UP2, and UP3 represent UP applied at 0.465, 0.616, and 0.770 kg tree−1. Bars in the same years with a different letter indicate significant differences between treatments at p ≤ 0.01. According to Duncan’s multiple range test, bars sharing the same letter in each column are not significantly different.
Agronomy 12 02390 g003
Figure 4. Influence of phosphorus fertilizers; mono-ammonium phosphate (MAP and urea phosphate (UP) applied to leaf area (LA, cm2) of olive (arbequina cv.) trees grown in sandy loam clay soil under multi-abiotic stresses (CaCO3 = 8.8 vs. 9.2%, ECe = 6.4 vs. 7.2 dS m−1, and pH = 7.78 vs. 7.89) during 2020 and 2021 seasons. GSCP applied represents 1.75 kg tree−1, MAP1, MAP2, and MAP3 represent MAP applied at 0.336, 0.445, and 0.555 kg tree−1, and UP1, UP2, and UP3 represent UP applied at 0.465, respectively. 0.616 and 0.770 kg tree−1. Bars in the same years with a different letter indicate significant differences between treatments at p ≤ 0.01. According to Duncan’s multiple range test, bars sharing the same letter in each column are not significantly different.
Agronomy 12 02390 g004
Table 1. Average climate data for Kawm Ushim region (29°55′ N; 30°88′ E), Fayoum, Egypt in 2020 and 2021 growing seasons.
MonthADANARHAWSAM-PEC-AAP
(°C)(%)(ms−1)(mmd−1)(mm d−1)
January25.042.9461.812.443.430.08
February26.743.8760.632.354.320.96
March32.585.0055.562.815.040.46
April37.457.4845.133.265.580.04
May43.8613.8935.223.546.870.00
June41.9216.8435.603.787.560.00
July42.1519.6837.033.426.880.00
August41.3220.8338.843.306.780.00
September42.3218.8445.353.648.640.00
October37.3015.5250.853.256.610.02
November30.4710.2258.602.364.630.28
December25.225.7561.722.303.490.15
AD °C = Average day temperature, AN °C = Average night temperature, ARH = average relative humidity, AWS = average wind speed, AM-PEC-A = average measured pan evaporation class A and AP = average precipitation. Source: https://power.larc.nasa.gov/index.php, accessed on 22 August 2022.
Table 2. Details of the treatments applied in this study: phosphorus fertilizers applied, composition of treatments, replications, and application times on olive trees (Olea europaea L. arbequina cv.) in 2020 and 2021.
SymbolPhosphorus Fertilizer AppliedComposition Treatment (kg tree−1)ReplicationApplying Time
GCSPGranular calcium super-phosphate5.0 kg of AS + 1.75 kg GCSP + 1.5 kg K2SO4 + 0.4kg MgSO4.7H2OThese quantities are equally added five times in four plotsAll treatments were performed five times in the middle of March, April, May, June, and July
MAP1Mono-ammonium phosphate4.81 kg of AS + 0.336 kg MAP + 1.5 kg K2SO4 + 0.4kg MgSO4.7H2O
MAP24.74 kg of AS + 0.445 kg MAP + 1.5 kg K2SO4 + 0.4kg MgSO4.7H2O
MAP34.67 kg of AS + 0.555 kg MAP + 1.5 kg K2SO4 + 0.4kg MgSO4.7H2O
UP1Urea phosphate4.60 kg of AS + 0.465 kg UP + 1.5 kg K2SO4 + 0.4kg MgSO4.7H2O
UP24.47 kg of AS + 0.616 UP + 1.5 kg K2SO4 + 0.4kg MgSO4.7H2O
UP34.34 kg of AS + 0.770 UP + 1.5 kg K2SO4 + 0.4kg MgSO4.7H2O
GSCP = granular calcium super-phosphate, Ca(H2PO4)2 ≈ 15.5%P2O5, MAP = mono-ammonium phosphate NH4H2PO4 ≈ 61%P2O5, UP = urea-phosphate H2N-C = NH2.H2PO4 44%P2O5, AS = ammonium sulfate (NH4)2SO4 ≈ 20.6%N.
Table 3. Chemical analysis of phosphorus fertilizers applied in this study.
PropertiesGCSPMAPUP
Chemical formulaCa(H2PO4)2NH4H2PO4CO(NH2)2.H3PO4
pH (1% solution)7.54.51.8
N (%)0.012.0017.72
P2O5 (%)15.561.0044.00
Table 4. Some soil chemical and physical properties.
Soil Property20202021
Particle size distribution (%)
Sand47.3248.49
Silt19.5620.20
Clay33.1231.31
Soil textureSandy clay loamSandy clay loam
pH (in soil paste)7.787.89
ECe (dS m−1)6.47.2
Organic matter (%)0.630.52
CaCO3 (%)8.89.2
Soluble ions (mmol L−1)
CO3−−--
HCO32.83.7
Cl53.455.3
SO4−−19.321.1
Ca++39.641.2
Mg++7.88.4
Na+22.424.3
K+5.76.2
Macronutrients (mg kg−1)
Total N414640
Extractible P NaHCO3 pH = 8.545204830
Extractible K NH4OAC pH = 7.013371415
DTPA Extractible micronutrients (mg kg−1)
Fe10.711.2
Mn4.56.3
Zn0.150.14
Cu0.480.38
Table 5. Influence of different levels of MAP and UP in a comparison with the recommended GCSP level on leaf macronutrient uptakes of olive (Olea europaea L. arbequina cv.) trees grown in sandy loam clay soil under multi-abiotic stresses (CaCO3 = 8.8 vs. 9.2%, ECe = 6.4 vs. 7.2 dS m−1, and pH = 7.78 vs. 7.89) during 2020 and 2021 seasons.
TreatmentLNULPULKULCaULMgULNaU
(%, in DM of Leaves)
2020 Season
GCSP1.63d ± 0.030.13e ± 0.030.66bc ± 0.010.85b ± 0.200.47cd ± 0.010.41f ± 0.01
MAP11.36d ± 0.050.14f ± 0.060.72a ± 0.031.41ab ± 0.010.63b ± 0.010.45e ± 0.01
MAP22.04ab ± 0.030.17d ± 0.160.71ab ± 0.041.39ab ± 0.010.41e ± 0.010.66c ± 0.01
MAP31.53e ± 0.030.19c ± 0.120.70ab ± 0.021.18ab ± 0.010.52c ± 0.030.76a ± 0.01
UP12.27a ± 0.030.17d ± 0.030.61c ± 0.011.42ab ± 0.240.43de ± 0.030.73b ± 0.01
UP21.55e ± 0.030.21b ± 0.030.71ab ± 0.011.12ab ± 0.010.69a ± 0.010.56d ± 0.01
UP31.76c ± 0.040.23a ± 0.060.63c ± 0.011.67a ± 0.170.40e ± 0.010.64c ± 0.01
2021 season
GCSP2.04d ± 0.090.14f ± 0.050.69b ± 0.040.74f ± 0.010.84f ± 0.020.39e ± 0.01
MAP12.66b ± 0.050.26b ± 0.060.64c ± 0.090.95e ± 0.011.19a ± 0.010.37f ± 0.01
MAP21.19e ± 0.060.21de ± 0.060.61c ± 0.091.48a ± 0.030.91e ± 0.010.47d ± 0.01
MAP32.97a ± 0.40.20e ± 0.090.65bc ± 0.070.96de ± 0.050.80g ± 0.010.62b ± 0.01
UP11.98b ± 0.070.22cd ± 0.120.71a ± 0.091.38b ± 0.011.06c ± 0.010.67a ± 0.01
UP22.23c ± 0.050.31a ± 0.080.71a ± 0.071.06c ± 0.011.13b ± 0.010.33g ± 0.01
UP32.55b ± 0.060.24bc ± 0.060.72a ± 0.061.03cd ± 0.020.94d ± 0.020.51c ± 0.02
Mean values (±SE) with different letters in each column are significant (at p ≤ 0.05). GCSP represents granular calcium super-phosphate applied at 1.75 kg tree−1, MAP = mono-ammonium phosphate, MAP1, MAP2, and MAP3 represent MAP applied at 0.336, 0.445, and 0.555 kg tree−1, UP = urea phosphate, UP1, UP2, and UP3 represent UP applied at 0.465, 0.616, and 0.770 kg tree−1, all treatments were applied as a soil application. According to Duncan’s multiple range test, Means sharing the same letter in each column are not significantly different.
Table 6. Influence of different levels of MAP and UP in comparison with the recommended GCSP level on leaf micronutrient uptakes of olive (Olea europaea L. arbequina cv.) trees grown in sandy loam clay soil under multi-abiotic stresses (CaCO3 = 8.8 vs. 9.2%, ECe = 6.4 vs. 7.2 dS m−1, and pH = 7.78 vs. 7.89) during 2020 and 2021 seasons.
2020 Season
TreatmentLFeULMnULZnULCuU
Leaves (mgkg−1)
GCSP195.00c ± 2.8919.59cd ± 0.6337.10b ± 0.626.33a ± 0.03
MAP1168.84e ± 1.5918.34d ± 0.7249.86a ± 0.161.67d ± 0.07
MAP2208.83b ± 2.1720.42b–d ± 0.3831.48c ± 0.252.34c ± 0.10
MAP3177.42d ± 2.5515.92e ± 0.5831.78c ± 0.133.50b ± 0.02
UP1162.25e ± 1.0623.58a ± 0.7730.81cd ± 0.433.42b ± 0.04
UP2165.75e ± 2.0221.17bc ± 0.8224.49e ± 0.292.34c ± 0.02
UP3234.42a ± 4.2822.00ab ± 0.0529.90d ± 0.683.34b ± 0.14
2021 season
GCSP196.00c ± 1.4421.09d ± 0.6338.10b ± 0.532.50d ± 0.29
MAP1184.34d ± 2.5022.34d ± 0.7749.36a ± 0.153.09b–d ± 0.24
MAP2218.77b ± 2.0825.77bc ± 0.8234.48c ± 0.582.84cd ± 0.10
MAP3188.92d ± 8.9021.28d ± 0.3434.78c ± 1.834.00a ± 0.29
UP1176.50e ± 2.8928.42a ± 0.7232.81c ± 1.004.02a ± 0.24
UP2169.509a ± 0.7224.57c ± 0.6728.99d ± 1.123.34a–c ± 0.67
UP3239.42a ± 3.9927.50ab ± 0.8733.06c ± 0.423.67ab ± 0.10
Mean values (±SE) with different letters in each column are significant (at p ≤ 0.05). GCSP = granular calcium super phosphate, MAP = mono-ammonium phosphate, UP = urea phosphate, MAP1, MAP2, and MAP3 represent MAP applied as a soil application at 0.336, 0.445, and 0.555 kg tree−1, UP1, UP2, and UP3 represent UP applied as a soil application at 0.465, 0.616, and 0.770 kg tree−1, control represent GCSP applied as a soil application at 1.75 kg tree−1. According to Duncan’s multiple range test, Means sharing the same letter in each column are not significantly different.
Table 7. Influence of different levels of MAP and UP in comparison with the recommended GCSP level on some fruit quality of olive (Olea europaea L. arbequina cv.) trees grown in sandy loam clay soil under multi-abiotic stresses (CaCO3 = 8.8 vs. 9.2%, ECe = 6.4 vs. 7.2 dS m−1, and pH = 7.78 vs. 7.89) during 2020 and 2021 seasons.
TreatmentTFrWSeWFlWFrFlWFPRFrLFrDLD
(g)(%)(mm)
2020 Season
GCSP1.47b ± 0.010.29c ± 0.011.18b ± 0.0180.39ab ± 0.704.11ab ± 0.1813.33cd ± 0.0711.55cd ± 0.191.16cd ± 0.02
MAP11.52b ± 0.030.32bc ± 0.011.20b ± 0.0378.99ab ± 0.753.77ab ± 0.1714.24b ± 0.1611.62b–d ± 0.191.23ab ± 0.01
MAP21.36c ± 0.010.31bc ± 0.021.05c ± 0.0277.14b ± 0.933.40b ± 0.2313.17d ± 0.0611.28d ± 0.121.19a–d ± 0.01
MAP31.55b ± 0.060.35b ± 0.011.20b ± 0.0677.47b ± 0.893.45b ± 0.1715.02a ± 0.2412.14a ± 0.181.21a–c ± 0.03
UP11.52b ± 0.020.32bc ± 0.041.20b ± 0.0478.85ab ± 0.713.84ab ± 0.4914.16b ± 0.0811.91a–c ± 0.141.17b–d ± 0.02
UP21.52b ± 0.030.44a ± 0.021.07c ± 0.0270.75c ± 0.852.43c ± 0.1013.68c ± 0.1812.00a–c ± 0.121.14d ± 0.01
UP31.63a ± 0.060.30bc ± 0.011.32a ± 0.0181.26a ± 0.654.35a ± 0.1915.11a ± 0.1012.13ab ± 0.371.24a ± 0.03
2021 season
GCSP1.50c ± 0.030.40a ± 0.011.10b ± 0.0473.35d ± 0.822.77c ± 0.1714.09d ± 0.0611.90b–d ± 0.251.19bc ± 0.03
MAP11.61a ± 0.040.30d ± 0.011.31a ± 0.0381.32a ± 0.294.36a ± 0.0815.05bc ± 0.1012.35a–c ± 0.181.22a–c ± 0.02
MAP21.49c ± 0.020.35bc ± 0.011.14b ± 0.0676.40c ± 0.333.24bc ± 0.0613.79d ± 0.0611.47d ± 0.211.21a–c ± 0.03
MAP31.61a ± 0.030.36b ± 0.021.25a ± 0.0377.73bc ± 0.563.50b ± 0.1215.43b ± 0.1512.20a–d ± 0.431.29a ± 0.05
UP11.53bc ± 0.010.30d ± 0.021.24a ± 0.0380.63ab ± 0.874.24a ± 0.4214.63c ± 0.1611.62cd ± 0.271.26ab ± 0.02
UP21.58ab ± 0.010.33b–d ± 0.011.25a ± 0.0279.01a–c ± 0.943.78ab ± 0.2214.76c ± 0.3112.58ab ± 0.171.17c ± 0.01
UP31.65a ± 0.010.32cd ± 0.011.31a ± 0.0180.65ab ± 0.544.17a ± 0.0116.08a ± 0.1512.86a ± 0.331.25a–c ± 0.03
Mean values (±SE) with different letters in each column are significant (at p ≤ 0.05). GCSP represents granular calcium super-phosphate applied at 1.75 kg tree−1, MAP = mono-ammonium phosphate, MAP1, MAP2, and MAP3 represent MAP applied at 0.336, 0.445, and 0.555 kg tree−1, UP = urea phosphate, UP1, UP2, and UP3 represent UP applied at 0.465, 0.616, and 0.770 kg tree−1. TFrW = total fruit weight, SeW = seed weight, FlW = flesh weight, FrFlW = TFrW/FlW, FPR = flesh/pit ratio, FrL = fruit length, FrD = fruit diameter, and LD = fruit shape index. All treatments were applied as soil applications. According to Duncan’s multiple range test, Means sharing the same letter in each column are not significantly different.
Table 8. Influence of different levels of MAP and UP in comparison with the recommended GCSP level on fresh matter %, total olive yield (both tree and ha), and olive oil content of olive (Olea europaea L. arbequina cv.) trees grown in sandy loam clay soil under multi-abiotic stresses (CaCO3 = 8.8 vs. 9.2%, ECe = 6.4 vs. 7.2 dS m−1, and pH = 7.78 vs. 7.89) during 2020 and 2021 seasons.
TreatmentFrDrMOTYTOYOOC
(%)(kg tree−1)(ton ha−1)(%, DM)
2020 Season
GCSP29.84e ± 0.4538.67b ± 0.679.74b ± 0.1335.92d ± 0.24
MAP130.88d ± 0.8539.33b ± 0.679.91b ± 0.1437.43cd ± 0.36
MAP229.22e ± 0.3838.33d ± 0.889.66b ± 0.1436.15cd ± 0.31
MAP332.99a ± 0.2642.33a ± 0.5810.67a ± 0.1241.18a ± 0.47
UP132.49ab ± 0.4641.67a ± 0.6710.50a ± 0.1238.99b ± 0.50
UP231.98bc ± 0.5739.00b ± 0.589.83b ± 0.1337.46c ± 0.42
UP331.39cd ± 0.5142.67a ± 0.5810.75a ± 0.1340.72a ± 0.28
2021 season
GCSP29.22e ± 0.3037.67d ± 0.679.49d ± 0.1435.45d ± 0.62
MAP130.88de ± 0.1138.33cd ± 0.589.66cd ± 0.1136.01cd ± 0.22
MAP229.84de ± 0.2737.33d ± 0.679.41d ± 0.1137.96bc ± 0.44
MAP332.99cd ± 0.3941.67a ± 0.3310.50a ± 0.1341.42a ± 0.26
UP132.49bc ± 0.7039.33bc ± 0.679.91bc ± 0.1437.10b–d ± 0.89
UP231.98ab ± 0.4639.67b ± 0.5810.00b ± 0.1438.87b ± 0.26
UP331.39a ± 0.2642.83a ± 0.3310.79a ± 0.1442.71a ± 0.23
Mean values (±SE) with different letters in each column are significant (at p ≤ 0.05). GCSP represent granular calcium super-phosphate applied at 1.75 kg tree−1, MAP = mono-ammonium phosphate, MAP1, MAP2, and MAP3 represent MAP applied at 0.336, 0.445, and 0.555 kg tree−1, UP = urea phosphate, UP1, UP2, and UP3 represent UP applied at 0.465, 0.616, and 0.770 kg tree−1, all treatments were applied as a soil application. According to Duncan’s multiple range test, Means sharing the same letter in each column are not significantly different.
Table 9. Proportional contribution in predicting olive tree yield (TOY, kg) and olive oil content (OOC, %) using stepwise multiple linear regression for multi-stressed olive trees fertilized by mono-ammonium phosphate (MAP) and urea phosphate (UP) in three levels in comparison with the recommended granular calcium super phosphate (GCSP) level in 2020 and 2021 seasons.
rR2Adjusted R2SEESignificance Fitted Equation
2020 season
0.8210.6730.6371.192***OTY = 8.008+2.172FrL + 16.209LNC
0.9600.9220.9090.626***OOC = −8.245 + 2.237FrL + 0.443FrDrM% + 2.906LMgC
2021 season
0.9340.8720.8400.810***OTY = 0.298 + 1.838FrL + 0.642FrDrM% − 0.203FrFlW + 8.541LD
0.6470.4190.3882.197***OOC = 3.758 + 2.343FrL
Publisher’s Note: MDPI stays neutral with regard to jurisdictional claims in published maps and institutional affiliations.

