Article

Spatial Changes in Glomalin-Related Soil Protein and Their Correlation with Soil Properties in the Black Soil Region of Northeast China

1
Anhui Provincial Key Laboratory of the Conservation and Exploitation of Biological Resources, College of Life Sciences, Anhui Normal University, Wuhu 241000, China
2
Jilin Academy of Agricultural Sciences, Changchun 130033, China
3
Northeast Institute of Geography and Agroecology, Chinese Academy of Sciences, Changchun 130102, China
*
Author to whom correspondence should be addressed.
Agronomy 2022, 12(9), 2165; https://doi.org/10.3390/agronomy12092165
Submission received: 23 August 2022 / Revised: 9 September 2022 / Accepted: 9 September 2022 / Published: 12 September 2022

Abstract

:
Glomalin-related soil protein (GRSP), soil nutrients, and soil enzyme activities are closely related to soil fertility and land productivity, which play an important role in indicating soil quality. Little is known about the spatial variation in GRSP and its relationship with edaphic factors. Here, the spatial distribution of GRSP, soil chemical properties, and the soil enzyme activities of 0–20 cm depth farmland soil in the black soil region of northeast China were investigated, and the relationships among edaphic factors were analyzed collected from 41 sampling sites. The results indicate that GRSP, soil organic matter, total nitrogen, and acid phosphatase activities showed significant patterns of spatial variation, generally decreasing from north to south along a latitudinal gradient. Principal component analysis revealed that total GRSP (by 80.19%) and soil organic matter content (by 80.15%) were the greatest contributing factors accounting for the variations. Edaphic factors such as soil organic matter, total nitrogen, total phosphorus, and acid phosphatase were significantly positively correlated with GRSP, while urease was negatively correlated with GRSP. Mantel tests also showed that soil organic matter, total nitrogen, urease, and acid phosphatase were positively correlated with GRSP. The results reflect the soil fertility characteristics of the black soil region of northeast China and reveal the relationship among edaphic factors. These findings could be used to inform agricultural production and provide new insight into the role of GRSP in soil quality.

1. Introduction

Soil is fundamental for supporting terrestrial life as well as the survival and development of human beings. The establishment and stabilization of agroecosystems are based on soil and are closely related to soil nutrients [1]. Soil microorganisms influence biogeochemical cycles in terrestrial ecosystems via the formation and decomposition of soil organic matter and provide important ecosystem services such as soil fertility, carbon sequestration, and plant productivity and health [2]. Arbuscular mycorrhizal fungi (AMF) are ancient soil microorganisms that can form mutualistic symbioses with most terrestrial plants via the roots. These symbioses play an important role in plant growth, soil stability, and ecosystem balance [3]. Glomalin, a glycoprotein containing iron ions, is a metabolic substance that is produced and secreted by the hyphae of AMF [4] and is retained in soil following the death of hyphae [5]. Glomalin in soil cannot be completely extracted and is far from pure, as there are other fractions not produced by AMF. Consequently, the term glomalin-related soil protein (GRSP) has been proposed to quantify glomalin in soil [6]. GRSP is poorly water-soluble, resistant to decomposition, slow in its turnover, and stable in its native state [6,7]. Generally, GRSP can promote the accumulation of soil organic carbon (SOC) and maintain the stability of the soil carbon pool [8]. GRSP is closely correlated with the stability of soil water-stable aggregates [9,10], which can promote the formation of soil aggregates to improve soil structure [11]. Therefore, GRSP can play an important role in the improvement of degraded soil.
In the agricultural ecosystem, SOC, nitrogen, and phosphorus are important indicators for evaluating soil quality and fertility and are closely tied to soil productivity [12,13]. SOC is an extremely valuable natural resource and is considered the largest terrestrial carbon pool, which plays an important role in global carbon dynamics [14]. Increasing SOC stocks can increase crop yields [15]. The application of nitrogen and phosphate fertilizer accounts for an important proportion of agricultural production [13]. In addition, soil enzymes catalyze biogeochemical processes in soil, such as urease and phosphatase participating in nitrogen and phosphorus cycles, respectively [16]. Soil enzyme activity plays a crucial role in nutrient cycling, organic matter decomposition, and the supply of plant nutrients, which can detect soil quality and health [17,18]. The distribution of edaphic factors in soil is not uniform, and spatial heterogeneity exists in various edaphic factors [19,20]. Therefore, knowledge of the status of soil nutrients and enzyme activities as well as their spatial distribution is of great significance for evaluating the current or potential productivity of the soil, balancing fertilization, determining the improvement of degraded soils, and protecting the agricultural environment [12,13]. Moreover, GRSP production was affected by soil properties such as soil pH, soil structure, soil nutrient status, and water conditions [21,22]. Šarapatka et al. [23] showed that GRSP content was increased with the increases in SOC, total N, and available P and K in the erosion-threatened areas of Southern Moravia, Czechia.
Black soils (Chinese soil taxonomy), also known as mollisols (the USA’s soil taxonomy), are productive and fertile soils. The black soil area of northeast China, a core crop cultivation area for maize and soybean, is an important commodity grain base in China, which guarantees national grain security [24]. However, the long-term excessive cultivation and unreasonable management of this region have resulted in the serious degradation of the quality and quantity of the black soil [3,24]. Due to the effects of GRSP on the promotion of degraded soil, understanding the GRSP variation of farmland in the black soil region of northeast China is needed, while understanding the possible coupling relationship between GRSP and soil properties also provides a new perspective for soil protection and improvement [25]. Here, 41 farmland soil sampling sites along a latitudinal gradient in the black soil region of northeast China were studied. The objectives of this study were to examine GRSP, soil chemical properties, and enzyme activities to answer the following questions: (1) What is the soil fertility of the surface soil (0–20 cm depth) of farmland in the black soil region of northeast China? (2) Are there spatial differences in soil chemical properties, enzyme activities, and GRSP? (3) What are the relationships between GRSP and edaphic factors? We hypothesized that soil fertility would decrease from north to south and that the content of GRSP was related to some edaphic factors.

2. Materials and Methods

2.1. Site Description and Soil Sampling

The 41 farmland soil sampling sites were established along a latitudinal gradient from the north (Nenjiang) to the south (Changtu) (42°50′ N–49°10′ N, 124°8′ E–127°29′ E) in the black soil region of northeast China in September 2019 (Figure 1). The climate in this region is a north temperate continental monsoon climate with an average annual precipitation of 300–600 mm. Information for the selected sites is shown in Table S1. Twenty soil cores (5.5 cm in diameter and 20 cm in depth) were collected randomly at each site within an area of approximately 100 m2, and 5 cores were homogenized to form only one single sample, resulting in 4 replicates per site. Each soil sample was sieved through a 2 mm mesh screen to remove roots, small stones, and impurities. Each soil sample was mixed uniformly and air-dried for the subsequent characterization of edaphic factors.

2.2. Soil Chemical Property Measurement

Soil pH was measured in a 1:5 soil:water slurry using a calibrated pH meter (MettlerToledo FE 20, Greifensee, Switzerland). The contents of total nitrogen (N) and SOC (contains carbonate) were determined with the Elemental Analyzer (Flash EA 1112 N, Thermo Fisher, Waltham, MA, USA). Total phosphorus (P) content was measured using a continuous flow analyzer (San++, Skalar, Breda, The Netherlands).

2.3. Soil Enzyme Activity Measurement

Soil enzyme activities were measured based on the method described by Guan [26]. Urease activity was determined as follows. Five grams of soil was placed in a conical flask (50 mL), followed by the addition of 1 mL of toluene. After 15 min, 10 mL of 10% urea solution and 20 mL of citrate buffer solution (pH 6.7) were added, shaken, and incubated in an incubator at 37 °C for 24 h. One milliliter of filtrate was then injected into a 50 mL volumetric flask after filtration, followed by the addition of distilled water until a volume of 20 mL was attained. Next, 4 mL of Na-phenolate solution and 3 mL of sodium hypochlorite (NaClO) solution were added, and the solution was shaken until a color developed. The volume was then adjusted to 50 mL by adding distilled water. The absorbance was read at a wavelength of 578 nm within 1 h with a UV–Vis spectrophotometer (UV2450, Shimadzu, Kyoto, Japan). Finally, soil urease activity was expressed as milligrams of amino-N released from 1 g soil after 24 h.
Determination methods for acid phosphatase (ACP) activity were similar. Briefly, 5 g of soil was placed in a 50 mL conical flask, and 1 mL of toluene was added. After 15 min, 5 mL of 0.675% phenyl phosphate disodium solution and 5 mL of acetate buffer solution (pH 5.0) were added, shaken, and then incubated in an incubator at 37 °C for 12 h. One milliliter of filtrate was injected into a 50 mL volumetric flask after filtration, followed by the addition of 5 mL of borate buffer solution (pH 9.0), 3 mL of 2.5% potassium ferricyanide solution, and 3 mL of 0.5% 4-aminoantipyrine solution and shaking. Once color developed, the volume was adjusted to 50 mL using distilled water. The absorbance was read at a wavelength of 570 nm after 30 min with a UV–Vis spectrophotometer. Finally, soil ACP activity was expressed as milligrams of phenol released from 1 g soil after 12 h.

2.4. Glomalin-Related Soil Protein Measurement

GRSP was measured following the method of Wu et al. [27]. Briefly, 1 g of soil was added with 8 mL of 20 mM sodium citrate solution (pH 7.0), autoclaved at 121°C for 30 min, and centrifuged at 10,000 g for 3 min; the supernatant was then used to measure easily extractable GRSP (EE-GRSP). The remaining precipitation was added with 8 mL of 50 mM sodium citrate solution (pH 8.0), autoclaved at 121 °C for 60 min, and centrifuged at 10,000 g for 3 min; the supernatant was used to measure difficult-to-extract GRSP (DE-GRSP). The resultant supernatant was analyzed using the Bradford assay [28]. After extraction of 1 mL of the supernatant, 5 mL of Coomassie brilliant blue G-250 reagent was added with shaking. The absorbance was then read at a wavelength of 595 nm after two minutes, and the protein content (mg g−1) was calculated according to the standard curve. Total GRSP (T-GRSP) was the sum of the EE-GRSP and DE-GRSP. The contribution of GRSP to SOC was calculated by the ratio of GRSP-C to SOC content, where GRSP-C was calculated by GRSP content multiplied by 0.45.

2.5. Data Analysis

The normal distribution of all data was performed before statistical processing using SPSS Statistics v23 (SPSS Inc., Armonk, NY, USA). Descriptive statistical parameters, including the maximum, minimum, mean, standard deviation, and coefficient of variation (CV) of every variable, were calculated using SPSS. One-way analysis of variance (ANOVA) was used to determine whether the edaphic factors differed significantly in spatial distribution using SPSS. The significance of differences among means was tested using Turkey’s test at a 5% level. Pearson correlation coefficients were used to characterize the relationships between edaphic factors and longitude, latitude, altitude, and different edaphic factors. Linear regression was used to further quantify these relationships. Ordinary kriging interpolation was applied to produce the spatial distribution maps of edaphic factors with ArcGIS v10.4.1 (ESRI Inc., Redlands, CA, USA). Principal component analysis (PCA) was conducted on the correlation matrix to explore the soil properties and GRSP with the “FactoMineR” package in R v3.4.1 [29]. Mantel tests were used to examine Pearson’s rank correlation between edaphic factors and the spatial distance matrix using Bray–Curtis distance matrices with 999 permutations in the “vegan” package in R [30].

3. Results

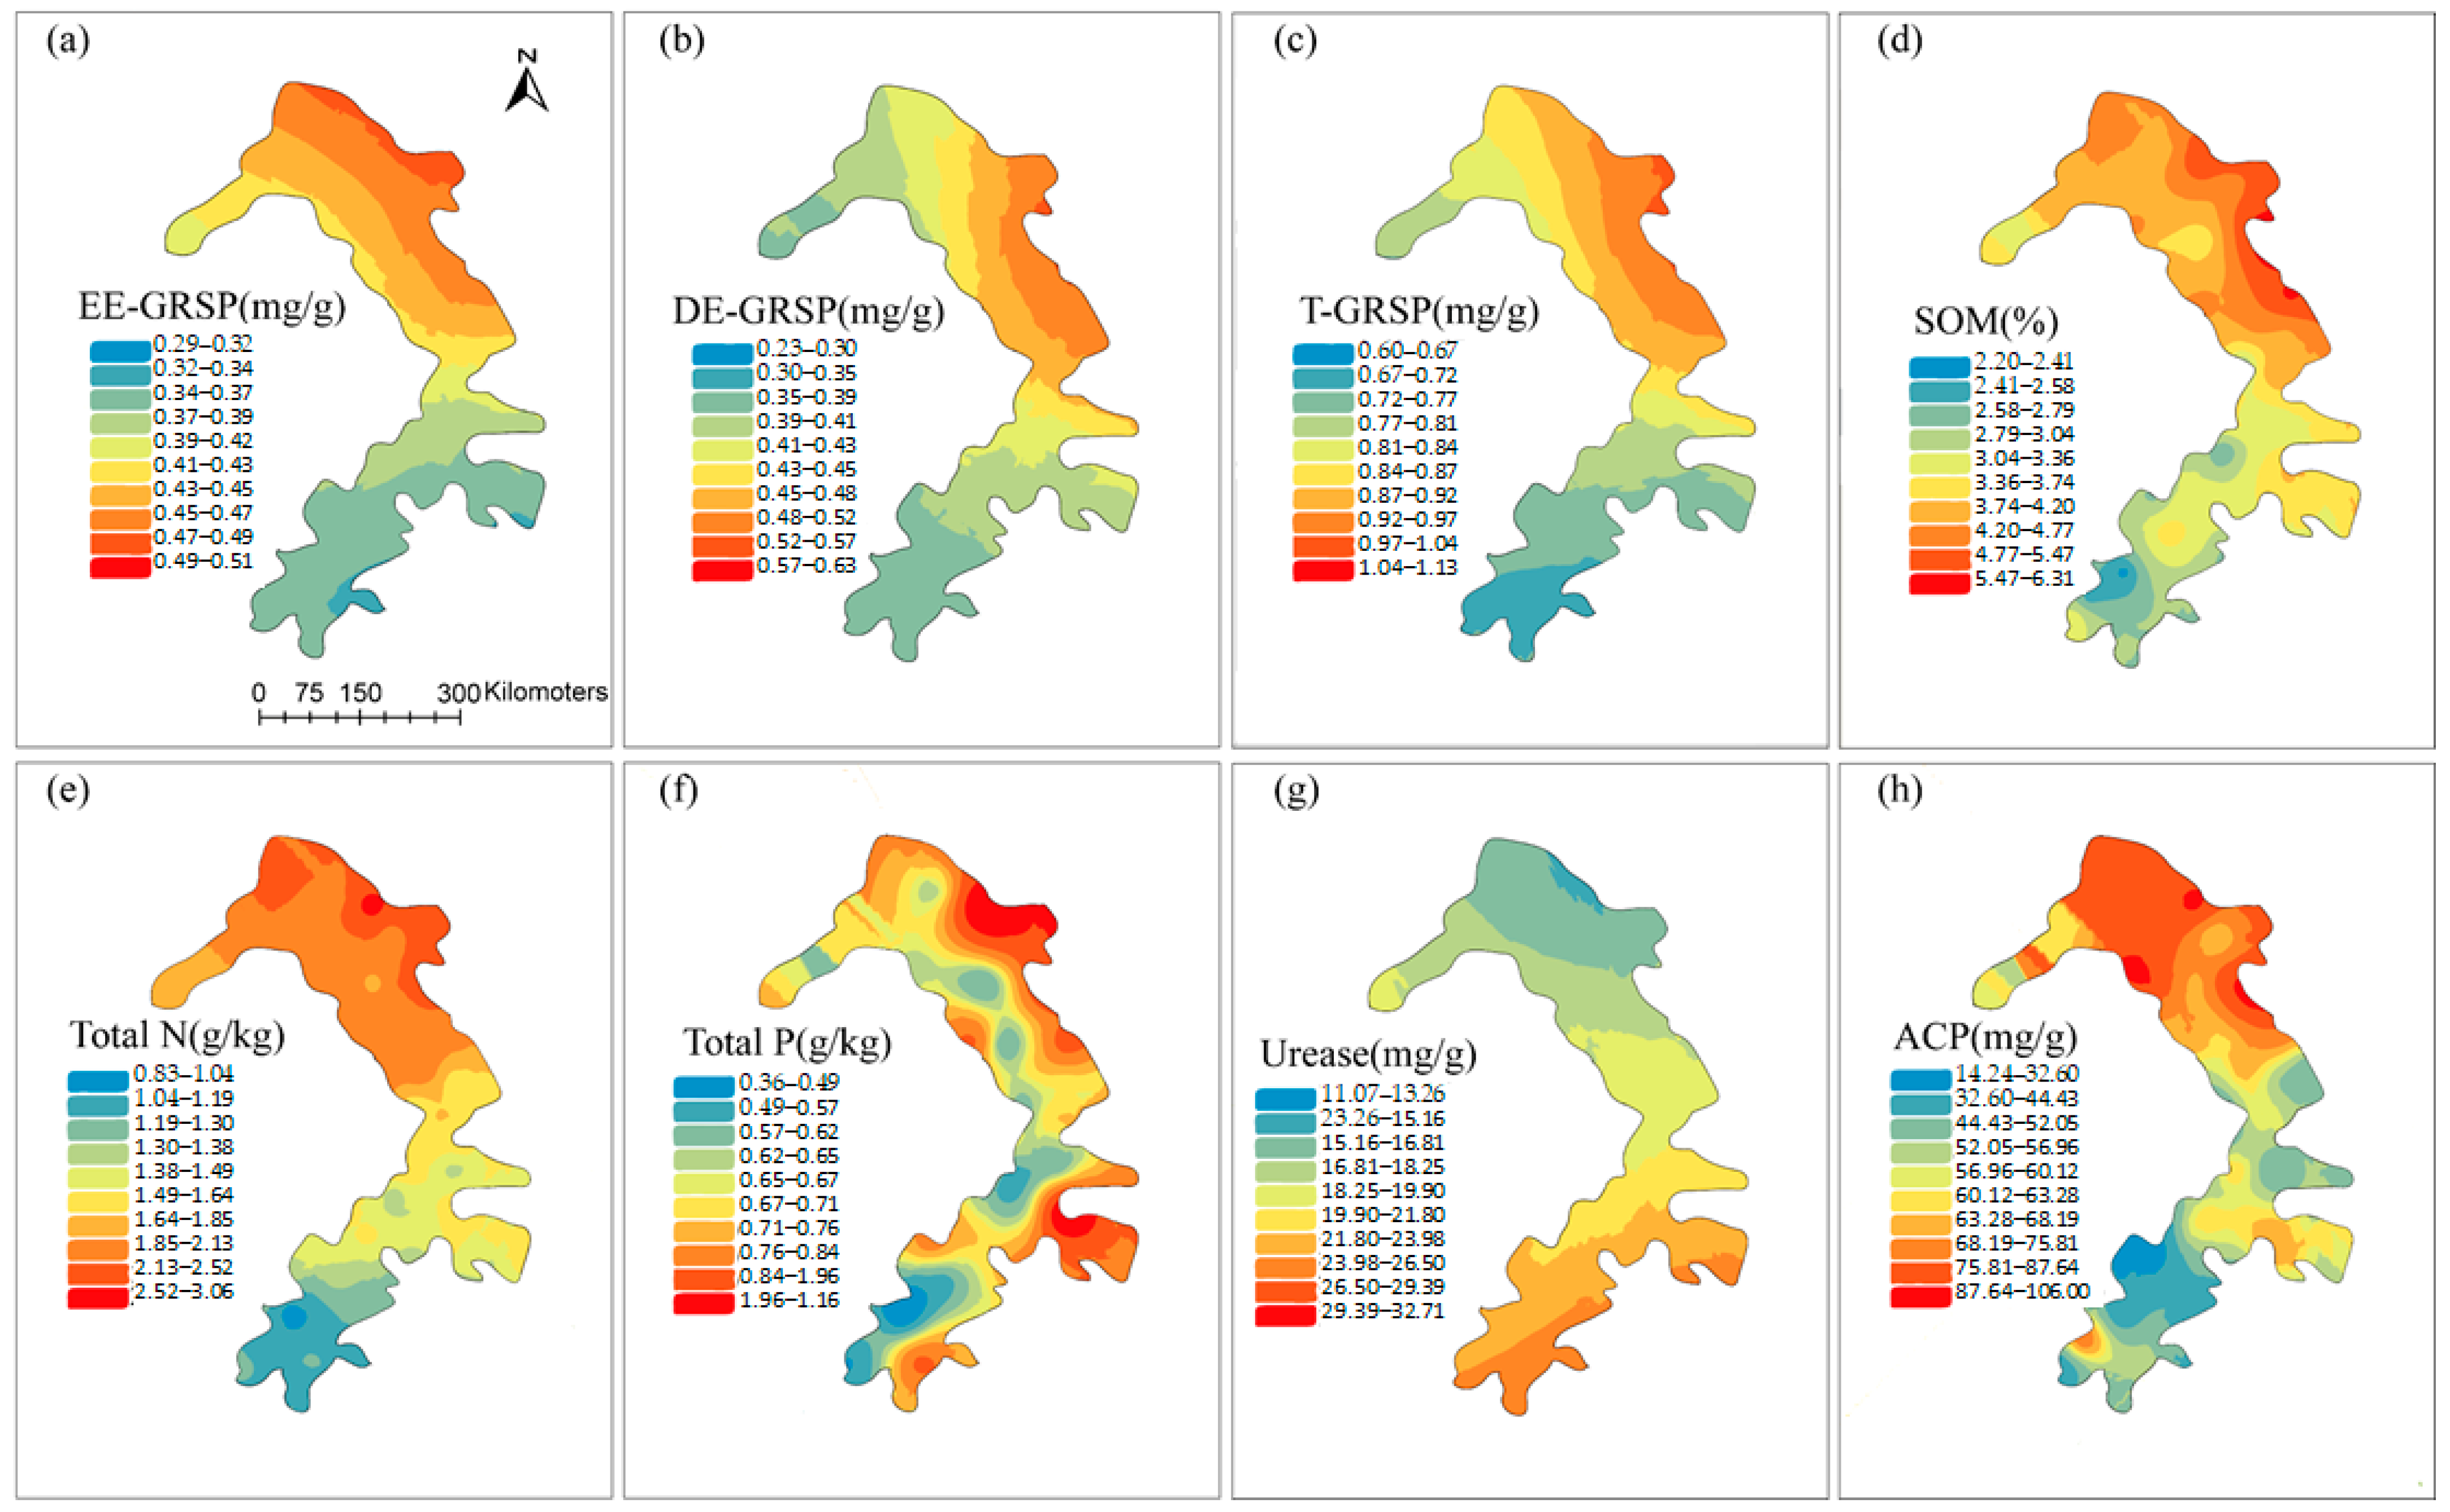
3.1. Spatial Variation in GRSP, Soil Chemical Properties, and Soil Enzyme Activities

Descriptive statistical parameters, including the maximum, minimum, mean, standard deviation, and CV of every variable, are shown in Table S2. The concentrations of EE-GRSP, DE-GRSP, and T-GRSP ranged from 0.22 to 0.55 mg g−1, 0.22 to 0.65 mg g−1, and 0.57 to 1.17 mg g−1, respectively, and varied approximately 2.5-fold, 3-fold, and 2-fold, respectively, across all sampling sites. Pearson correlations were used to characterize the relationships between GRSP and longitude, latitude, and altitude (Figure 2). EE-GRSP, DE-GRSP, and T-GRSP contents were significantly correlated with longitude (r = 0.258, p = 0.001; r = 0.466, p < 0.001; r = 0.431, p < 0.001, respectively) and latitude (r = 0.661, p < 0.001; r = 0.419, p < 0.001; r = 0.601, p < 0.001, respectively). EE-GRSP and T-GRSP contents were significantly correlated with altitude (r = 0.207, p = 0.008; r = 0.175, p = 0.025, respectively); however, there was no correlation between DE-GRSP content and altitude (r = 0.111, p = 0.158).
Soil pH ranged from 4.92 to 8.2, and the content of SOM, total N, and total P ranged from 1.75 to 6.67%, 0.68 to 3.12 g kg−1, and 0.29 to 1.29 g kg−1, respectively (Table S2). The average SOM, total P, and total N contents varied approximately three-fold across the 41 sampling sites. Pearson correlations revealed that latitude was significantly positively correlated with soil pH (r = 0.195, p = 0.013), whereas altitude was significantly negatively correlated with soil pH (r = −0.221, p = 0.005). In other words, soil pH increased with latitude and decreased with altitude. However, no significant difference was observed between pH and longitude. Other soil chemical properties, including SOM, total N, and total P, showed significant positive correlations with longitude, latitude, and altitude. For example, SOM content was significantly positively associated with longitude (r = 0.397, p < 0.001), latitude (r = 0.666, p < 0.001), and altitude (r = 0.245, p = 0.002; Figure 2).
Urease activity ranged from 6.96 to 39.43 mg g−1, and ACP activity ranged from 11.77 to 114.63 mg g−1 (Table S2). Average activities of urease and ACP within the sites varied approximately three-fold and greater than seven-fold, respectively, across all sampling sites. Urease activity was only negatively correlated with latitude (r = −0.500, p < 0.001), whereas ACP activity was positively correlated with both latitude (r = 0.532, p < 0.001) and altitude (r = 0.370, p < 0.001). In addition, the activities of urease and ACP did not significantly correlate with longitude (r = −0.125, p = 0.111; r = 0.04, p = 0.611, respectively; Figure 2).
The spatial distribution maps of GRSP and edaphic factors are presented in Figure 3. Except for urease and total P, the content of all other edaphic factors, including EE-GRSP, DE-GRSP, and T-GRSP, SOM, total N, and ACP, was decreased from north to south in the black soil region of northeast China and had significant spatial variability. Urease activity tends to increase from north to south, and the trend of total P content was more obvious from west to east.

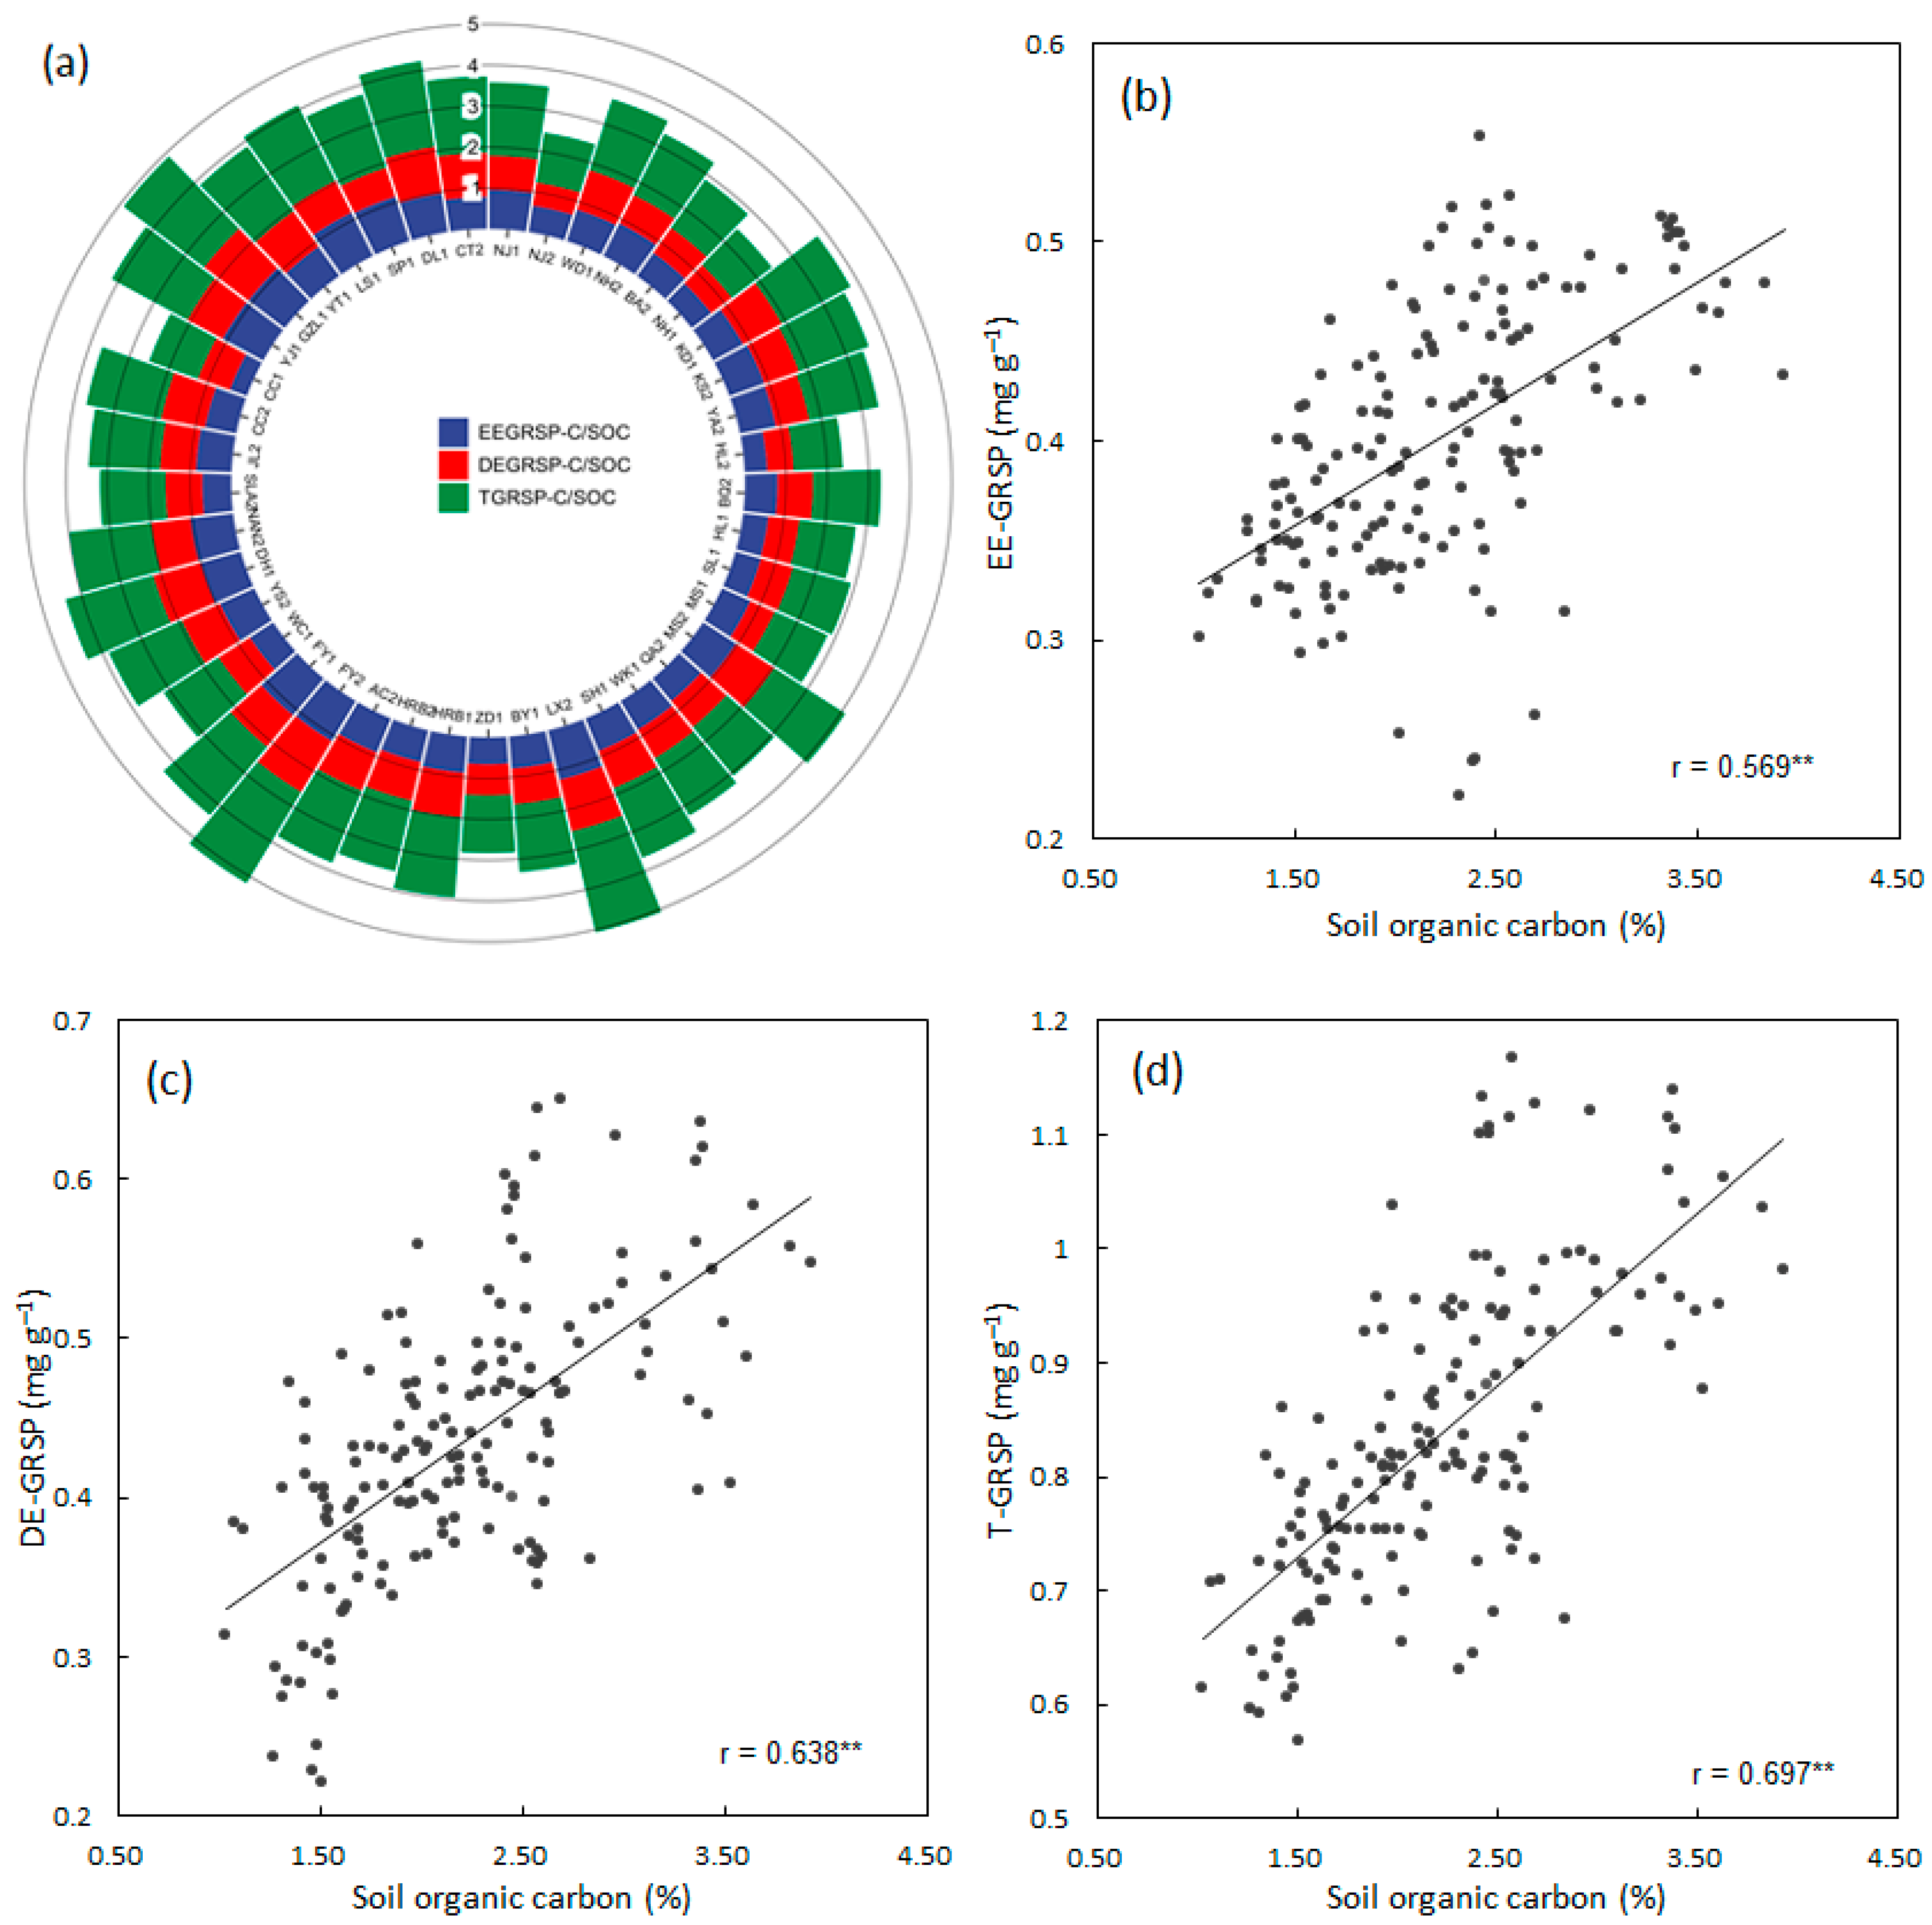
3.2. Contribution of GRSP to SOC

The contribution of GRSP to SOC was calculated according to the ratio of GRSP-C to SOC content (Figure 4a). The proportion of EEGRSP-C/SOC, DEGRSP-C/SOC, and TGRSP-C/SOC ranged from 0.43 to 1.35%, 0.52 to 1.61%, and 1.07 to 2.97%, respectively. The mean contribution ratio was 0.86, 0.93, and 1.79%, respectively. Moreover, SOC content was significantly positively associated with EE-GRSP (r = 0.569, p < 0.001), DE-GRSP (r = 0.637, p < 0.001), and T-GRSP (r = 0.697, p < 0.001) (Figure 4b–d).

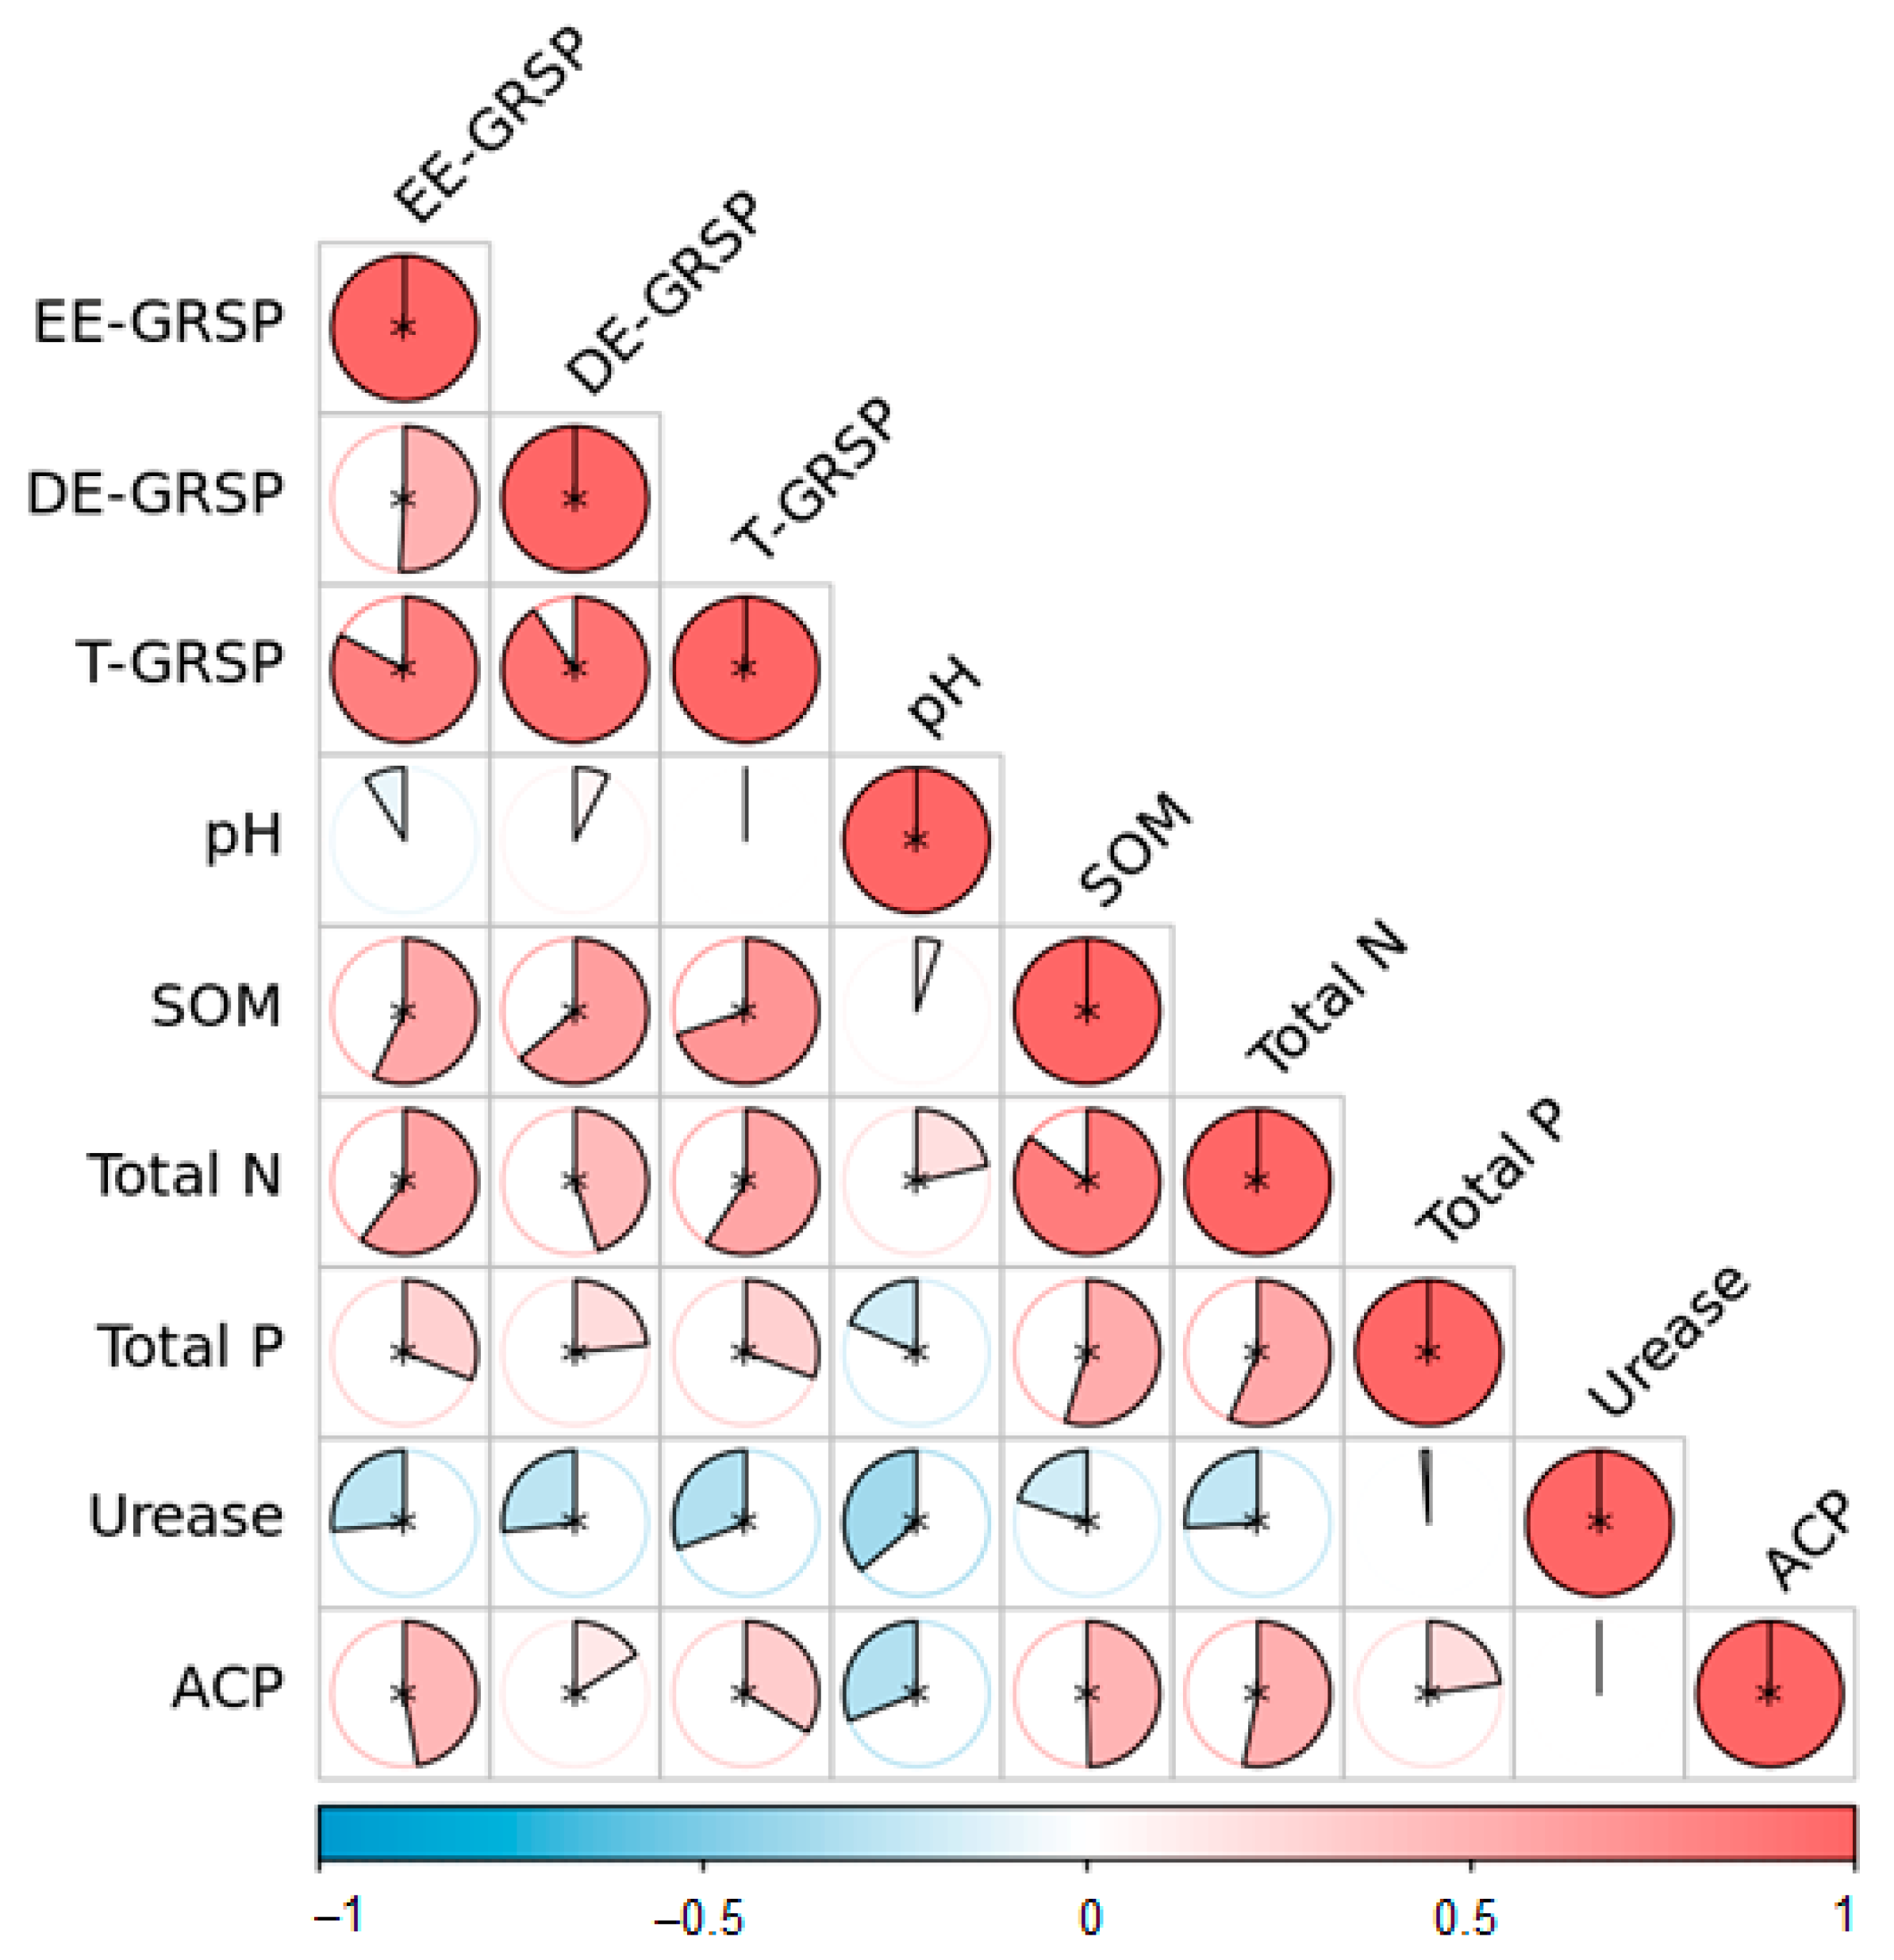
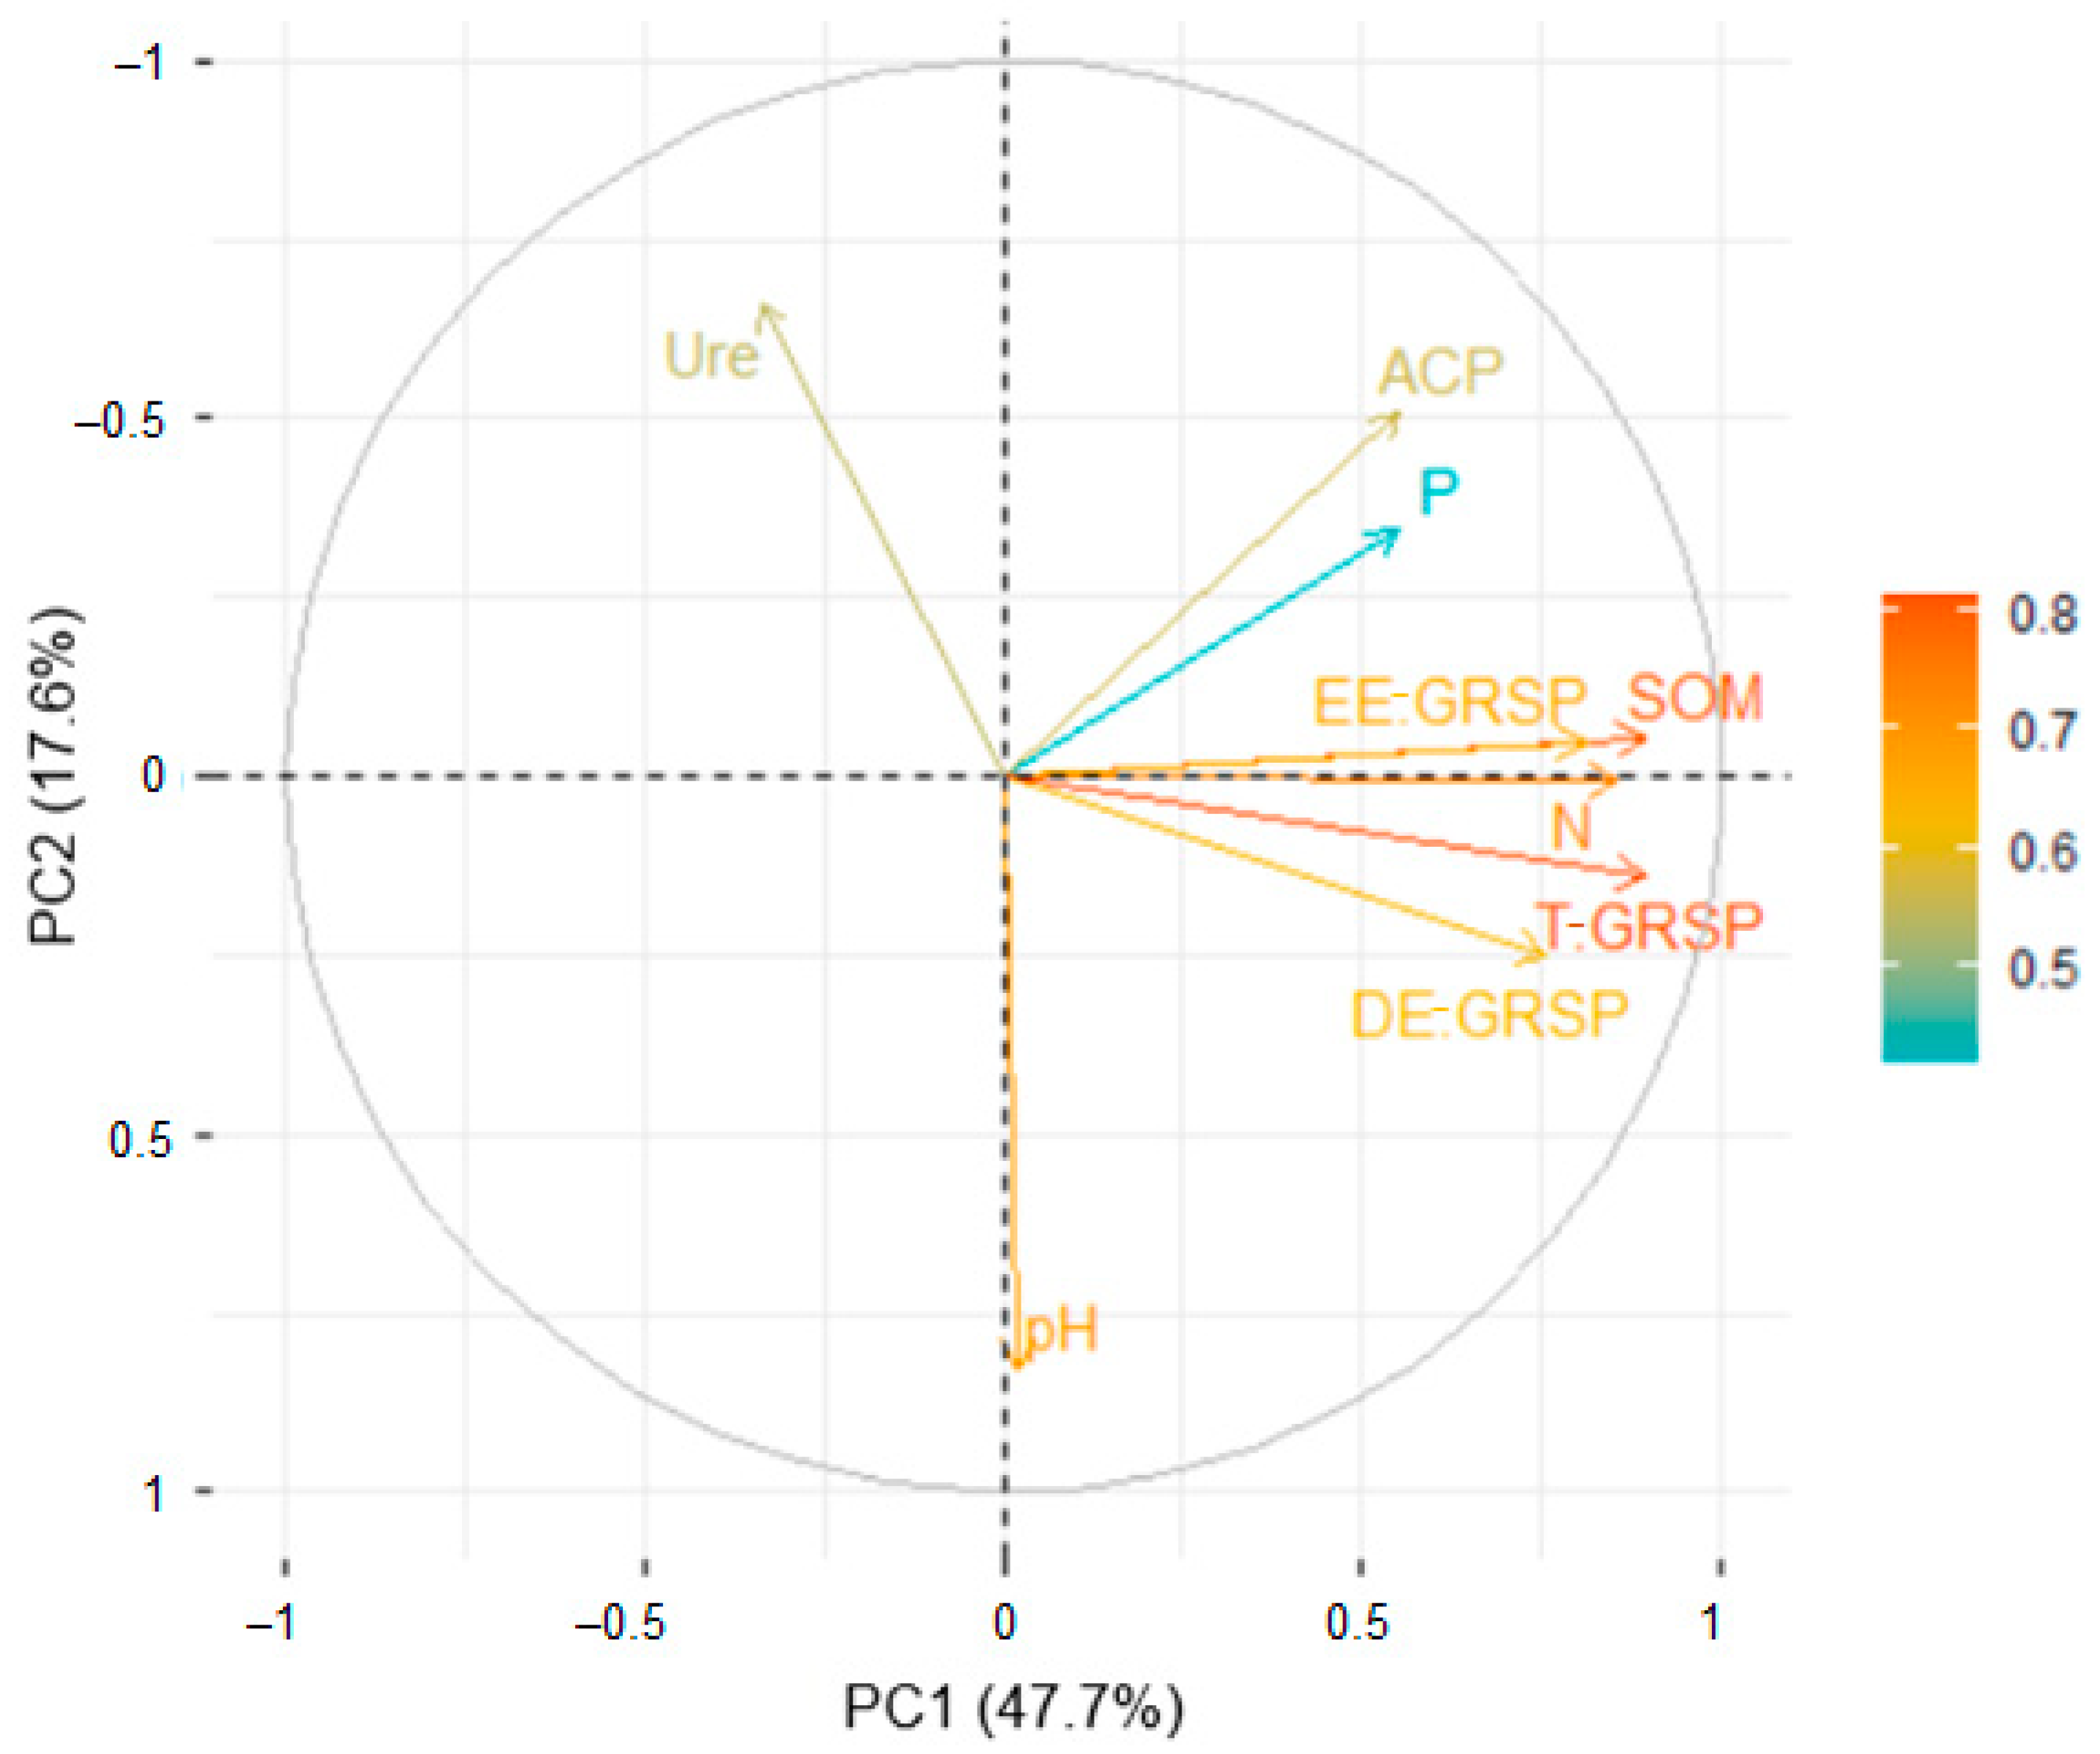
3.3. Relationship between GRSP and Soil Properties

SOM, total N, total P, urease, and ACP activity were significantly correlated with EE-GRSP, DE-GRSP, and T-GRSP concentration, respectively (Figure 5; Table S3). Pearson correlation coefficients between GRSP and different soil chemical properties were generally significantly positive with the exception of pH, which was not significantly correlated with GRSP. GRSP was positively associated with ACP activity and negatively associated with urease activity. Furthermore, the Mantel tests showed that EE-GRSP was significantly positively correlated with SOM, total N, and ACP; DE-GRSP was significantly positively correlated with SOM, total N, and urease; and T-GRSP was significantly positively correlated with SOM, total N, urease, and ACP (Table 1).

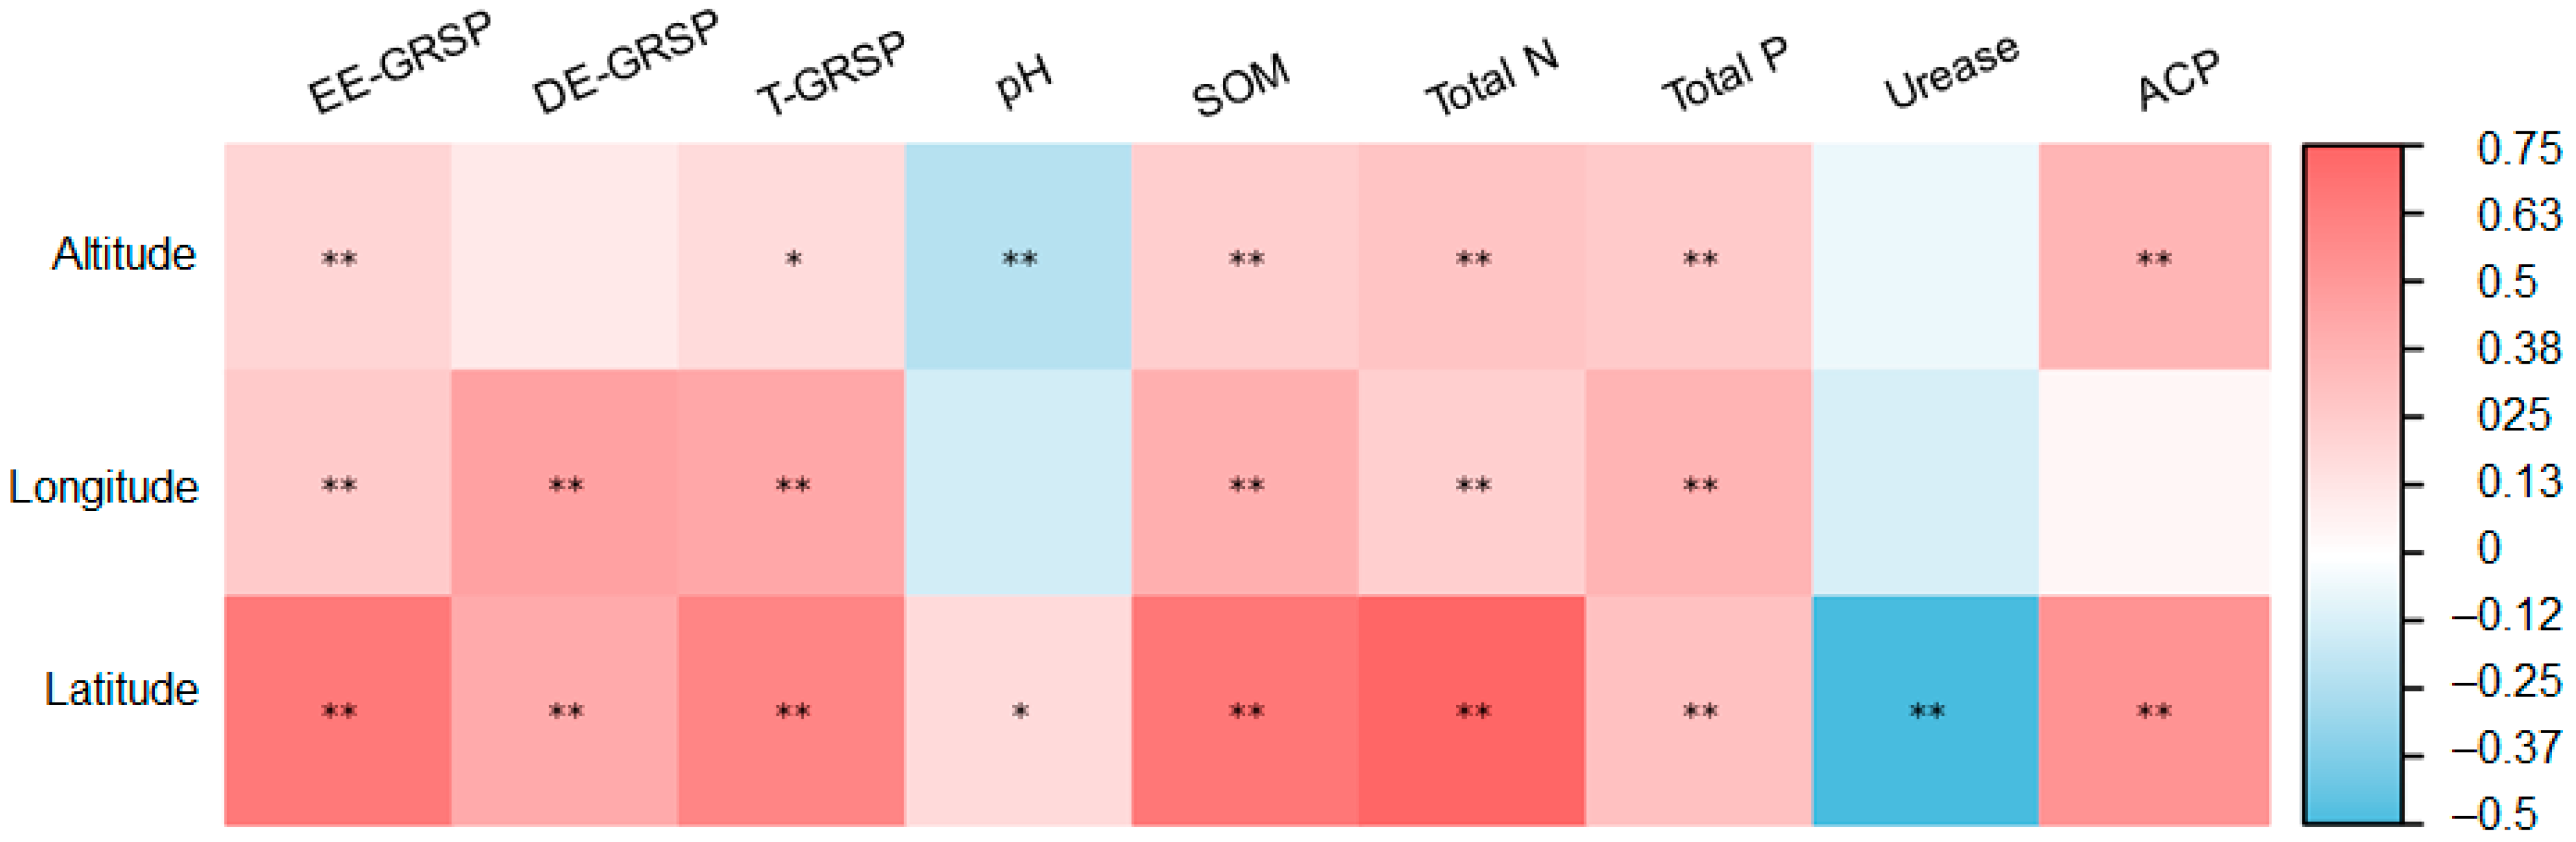
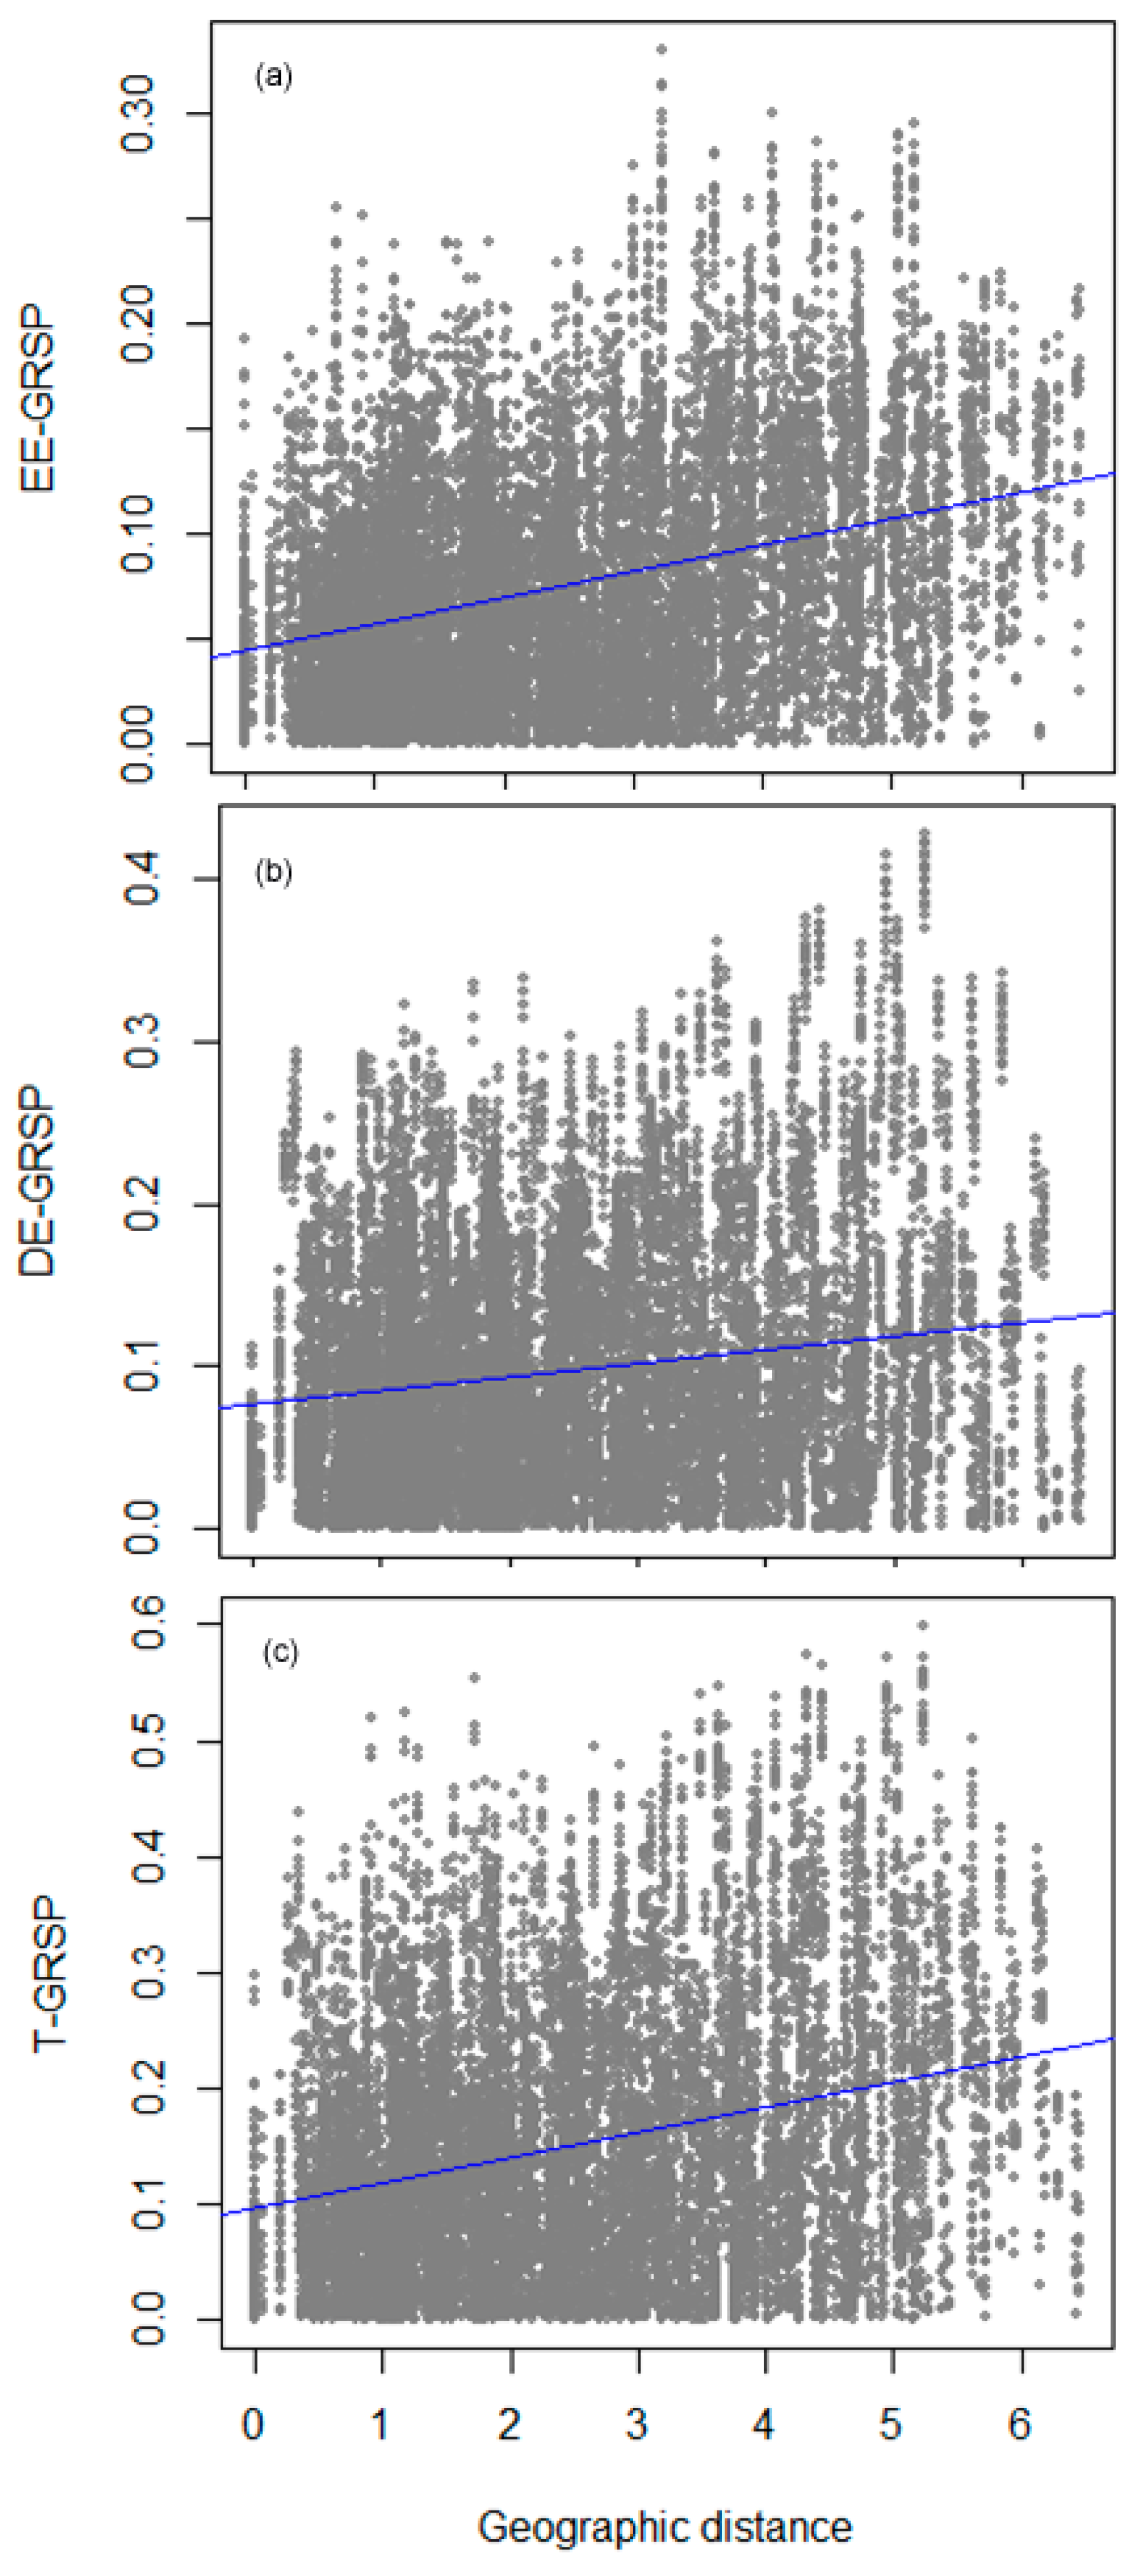
3.4. Spatial Variability Analysis of Edaphic Factors

The CV can reflect the degree of variability in the studied variables. The CV <10% was classified as low variability, 10–90% was classified as moderate variability, and > 90% was classified as high variability [31]. Thus, longitude, latitude, and pH showed low variability in this study. However, other variables, including altitude, EE-GRSP, DE-GRSP, T-GRSP, SOM, total N, total P, urease, and ACP, showed moderate variability (Table S2). PCA, a dimensionality reduction technique, was performed on the edaphic factors; the first principal component (PC1) explained 47.7% of the variation, and the second principal component (PC2) explained 17.6% of the variation (Figure 6). PC1 and PC2 accounted for 65.3% of the total variability in edaphic factors and thus captured most of the variation in edaphic factors. T-GRSP and SOM showed the greatest contributions to them. The contribution rate of total GRSP and soil organic matter content to the variations was 80.19% and 80.15% respectively. The plots of geographical distance versus GRSP by Mantel tests revealed that EE-GRSP (r = 0.340, p < 0.001), DE-GRSP (r = 0.170, p < 0.001), and T-GRSP (r = 0.286, p < 0.001) were significantly positively correlated with geographic distance (Figure 7).

4. Discussion

GRSP, a protein produced by AMF hyphae, is related to soil fertility and plays a role in regulating soil quality [7,8]. The content and spatial variation in GRSP, soil chemical properties, and soil enzyme activities in surface soil in the black soil region of northeast China were evaluated in this study. Within the range of the sample sites (across hundreds of kilometers), longitude varied by approximately three degrees, latitude varied by approximately seven degrees, and altitude varied by 185 m.
GRSP has been found in the agricultural, forest, grassland, and desert ecosystems. In the present study, the average contents of EE-GRSP and T-GRSP were 0.40 and 0.84 g kg−1, respectively, in the black soil region of northeast China, which indicates that the production of GRSP was low in this area. Singh et al. [32] summarized the contents of GRSP in the agricultural, boreal forest, temperate forest, tropical rainforest, temperate grassland, and desert biomes with the ranges of 0.32–0.71, 1.10, 0.60–5.80, 2.60–13.5, 0.23–2.50, and 0.003–0.13 g kg−1, respectively, which indicates the GRSP content in the agricultural soils was lower compared with forest and grassland soils. However, Wang and Wang [33] summarized that the average contents of EE-GRSP and T-GRSP were 1.89 and 3.54 g kg−1, respectively, in the agricultural ecosystem and higher than those in the grassland ecosystem. Low GRSP production in the black soil region of northeast China may be due to three reasons. Firstly, climate such as temperature and precipitation influence GRSP accumulation. The low temperature and rainfall in this area could decrease the C allocation to AMF by the hosts and inhibit AMF hyphal growth, and subsequently decrease the AMF biomass and GRSP contents. Secondly, high-fertility soils decrease GRSP content. Black soil is famous for its high soil fertility and quality in the world [3]. Our previous study showed that the relative abundance of AMF was low in the black soils [34], which indicates that AMF diversity is low in this high-fertility area. High fertility could decrease AMF colonization and growth, reduce GRSP production per AMF unit, and accelerate GRSP decomposition [7]. Finally, agricultural activities decrease GRSP production. Agricultural practices such as tillage, fertilization, and land use disturbed AMF growth and proliferation and decreased GRSP levels in agricultural soils related to native forests or undisturbed grasslands [7,32]. Moreover, three GRSP fractions showed moderate variability in this study, and the content changes were consistent with Zhong et al. [25]. The GRSP content increases from south to north along the latitude gradient, and the correlation between GRSP and geographic distance was detected, showing the distribution pattern of GRSP in the black soil region.
In this study, the content of SOM belonged to high nutrient content according to the soil nutrient content classification table, while nitrogen and phosphorus belong to medium and high nutrient content, which indicated that the fertility status of the black soil area was good and rich. However, the soil nutrient status of farmland was also affected by the difference in nitrogen and phosphorus fertilizer application [35]. Here, the contents of SOM, total N, and total p increased from south to north in the black soil region of northeast China. These results are consistent with those of previous studies [36,37]. These spatial patterns may be the influence of climatic conditions [38,39], as spatial variation leads to variation in a variety of climatic conditions, such as rainfall, temperature, and humidity, which can then lead to alterations in soil properties [40]. The areas with high latitudes tend to have lower temperatures, and this leads to the weakening of microbial metabolic activity, inhibition of organic matter decomposition, and accumulation of humus [41]. The present study showed the soil nutrient status in the black soil region through the content determination of soil properties and spatial distribution analysis, indicating that the soil status was better in the north.
GRSP, an important compound in SOM, has a very large contribution to C sequestration [7,23]. GRSP typically accounts for up to 3% of total C in the upper 0–10 cm depth soil [42]. In the present study, the contribution of GRSP to SOC was 1.79% in the black soil region. Rillig et al. [43] found that GRSP accounted for 4–5% of total C in Hawaiian forest soils, and the contribution of GRSP to total C was larger than microbial biomass C, which indicates the slow turnover rate of GRSP and its ability to accumulate in soils [32]. He et al. [44] studied the spatial distribution of GRSP and its association with soil factors in the rhizosphere of Hippophae rhamnoides L in a farming-pastoral zone between Inner Mongolia and Hebei province and found that the ratio of GRSP to SOC was 15.0–27.9%. These results indicate that the contribution of GRSP to soil organic C pools was related to soil type, land use, vegetable type, AMF growth, and so on [7].
The accumulation of GRSP in the soil was related to various edaphic factors, such as SOC, nitrogen, phosphorus, and phosphatase activity [17], and our findings are consistent with that. The strong positive relationship between GRSP content and SOM content has been confirmed by several studies [11,45,46]. GRSP can form a stable carbon pool in soils after long periods of turnover and can promote the formation of SOC [47]. Zhu et al. [48] showed that the correlation between T-GRSP and SOC was stronger than that with EE-GRSP, which was due to the poor stability and ease of decomposition of EE-GRSP. EE-GRSP is newly produced and deposited in the soil over short periods, while DE-GRSP can be deposited in the soil over long periods and is thus more stable. T-GRSP reflected the level of accumulated GRSP in soil and maintained the stability of the soil carbon pool [27,49,50].
EE-GRSP, DE-GRSP, and T-GRSP were all significantly correlated with total N and total P content, indicating that GRSP might increase the accumulation of soil N and P nutrients and improve soil quality [51]. SOC could directly regulate the accumulation of GRSP, and soil N and P could indirectly affect GRSP via their close relations with SOC [25]. Urease catalyzes the breakdown of urea and other nitrogen fertilizers in the soil, and phosphatase catalyzes organophosphorus and leads to the release of phosphorus [26], which is involved in the N-cycle and P-cycle. Thus, urease and phosphatase may indirectly influence the GRSP content via nitrogen and phosphorus. The content of GRSP was related to soil carbon, nitrogen, phosphorus, and enzyme activities, which further demonstrated the important role of GRSP in the carbon cycle and soil fertility restoration as well as agricultural yield and productivity [51,52].
In addition, previous studies have shown that soil pH had a significant correlation with GRSP [7,25,45]. However, no relationship between pH and GRSP was detected in the present study, which was in agreement with the results of Li et al. [51]. The reason might be that pH has a greater impact on GRSP in deep soils, while SOC has a strong influence on GRSP in surface soils [53], and thus the effect of pH was hindered by other edaphic factors such as SOC, N, P, and enzyme activity [51]. Another possible explanation is that most soil pH values were approximate in the study area.

5. Conclusions

In sum, this study examined spatial variation in GRSP, soil chemical properties, and soil enzyme activities in surface soil in the black soil region of northeast China as well as the relationship among these edaphic factors. Most of the edaphic factors, including EE-GRSP, DE-GRSP, T-GRSP, SOM, total N, and ACP, showed a decreasing trend from north to south along the latitude gradient. The three distinct GRSP fractions were related to soil carbon, nitrogen, phosphorus, and enzyme activities, indicating that GRSP might increase the accumulation of soil nutrients and improve soil quality. The results could also be used to further understand the role of GRSP in soil monitoring. These findings elucidate the soil fertility characteristics and soil health in the black soil region of northeast China and could be used to inform agricultural production.

Supplementary Materials

The following supporting information can be downloaded at: https://www.mdpi.com/article/10.3390/agronomy12092165/s1, Table S1: Sampling site location information and edaphic factors; Table S2: Descriptive statistical parameters of different variables from 164 samples in black soil of northeast China; Table S3: Pearson’s correlation coefficients among different edaphic variables. Pearson’s correlation was calculated from 164 samples at 41 sampling sites.

Author Contributions

Conceptualization, Q.C. and X.Z.; methodology, X.W.; software, W.Y.; validation, X.W., W.Y. and X.Z.; investigation, X.W., W.Y. and X.Z.; data curation, Q.C. and X.Z.; writing—original draft preparation, X.W., W.Y. and X.Z.; writing—review and editing, Q.C. and X.Z.; supervision, Q.C. and X.Z.; project administration, X.Z.; funding acquisition, X.Z. All authors have read and agreed to the published version of the manuscript.

Funding

This research was funded by the Program of Anhui Provincial Key Laboratory of the Conservation and Exploitation of Biological Resources, grant number swzy202001.

Data Availability Statement

Not applicable.

Conflicts of Interest

The authors declare no conflict of interest.

References

  1. Coleman, D.C.; Callaham, M.A.; Crossley, D.A. Fundamentals of Soil Ecology, 3rd ed.; Academic Press: London, UK, 2017. [Google Scholar]
  2. Sokol, N.W.; Slessarev, E.; Marschmann, G.L.; Nicolas, A.; Blazewicz, S.J.; Brodie, E.L.; Firestone, M.K.; Foley, M.M.; Hestrin, R.; Hungate, B.A.; et al. Life and death in the soil microbiome: How ecological processes influence biogeochemistry. Nat. Rev. Microbiol. 2022, 20, 415–430. [Google Scholar] [CrossRef] [PubMed]
  3. Yang, W.; Li, S.; Wang, X.; Liu, F.; Li, X.; Zhu, X. Soil properties and geography shape arbuscular mycorrhizal fungal communities in black land of China. Appl. Soil Ecol. 2021, 167, 104109. [Google Scholar] [CrossRef]
  4. Wright, S.F.; Upadhyaya, A. A survey of soils for aggregate stability and glomalin, a glycoprotein produced by hyphae of arbuscular mycorrhizal fungi. Plant Soil 1998, 198, 97–107. [Google Scholar] [CrossRef]
  5. Driver, J.D.; Holben, W.E.; Rillig, M.C. Characterization of glomalin as a hyphal wall component of arbuscular mycorrhizal fungi. Soil Biol. Biochem. 2005, 37, 101–106. [Google Scholar] [CrossRef]
  6. Rillig, M.C. Arbuscular mycorrhizae, glomalin, and soil aggregation. Can. J. Soil Sci. 2004, 84, 355–363. [Google Scholar] [CrossRef]
  7. Agnihotri, R.; Sharma, M.P.; Prakash, A.; Ramesh, A.; Bhattacharjya, S.; Patra, A.K.; Manna, M.C.; Kurganova, I.; Kuzyakov, Y. Glycoproteins of arbuscular mycorrhiza for soil carbon sequestration: Review of mechanisms and controls. Sci. Total Environ. 2022, 806, 150571. [Google Scholar] [CrossRef]
  8. Irving, T.B.; Alptekin, B.; Kleven, B.; Ané, J. A critical review of 25 years of glomalin research: A better mechanical understanding and robust quantification techniques are required. New Phytol. 2021, 232, 1572–1581. [Google Scholar] [CrossRef]
  9. Fokom, R.; Adamou, S.; Teugwa, M.C.; Boyogueno, A.D.B.; Nana, W.L.; Ngonkeu, M.E.L.; Tchameni, N.S.; Nwaga, D.; Ndzomo, G.T.; Zollo, P.H.A. Glomalin related soil protein, carbon, nitrogen and soil aggregate stability as affected by land use variation in the humid forest zone of south Cameroon. Soil Tillage Res. 2012, 120, 69–75. [Google Scholar] [CrossRef]
  10. Li, Y.; Xu, J.; Hu, J.; Zhang, T.; Wu, X.; Yang, Y. Arbuscular mycorrhizal fungi and glomalin play a crucial role in soil aggregate stability in Pb-contaminated soil. Int. J. Environ. Res. Public Health 2022, 19, 5029. [Google Scholar] [CrossRef]
  11. Liu, H.; Wang, X.; Liang, C.; Ai, Z.; Wu, Y.; Xu, H.; Xue, S.; Liu, G. Glomalin-related soil protein affects soil aggregation and recovery of soil nutrient following natural revegetation on the Loess Plateau. Geoderma 2020, 357, 113921. [Google Scholar] [CrossRef]
  12. Duan, L.; Li, Z.; Xie, H.; Li, Z.; Zhang, L.; Zhou, Q. Large-scale spatial variability of eight soil chemical properties within paddy fields. Catena 2020, 188, 104350. [Google Scholar] [CrossRef]
  13. Wang, Y.; Zhang, X.; Huang, C. Spatial variability of soil total nitrogen and soil total phosphorus under different land uses in a small watershed on the Loess Plateau, China. Geoderma 2009, 150, 141–149. [Google Scholar] [CrossRef]
  14. Dai, W.; Zhao, K.; Fu, W.; Jiang, P.; Li, Y.; Zhang, C.; Gielen, G.; Gong, X.; Li, Y.; Wang, H.; et al. Spatial variation of organic carbon density in topsoils of a typical subtropical forest, southeastern China. Catena 2018, 167, 181–189. [Google Scholar] [CrossRef]
  15. Lal, R. Soil carbon sequestration impacts on global climate change and food security. Science 2004, 304, 1623–1627. [Google Scholar] [CrossRef]
  16. Li, Z.; Cui, J.; Mi, Z.; Tian, D.; Wang, J.; Ma, Z.; Wang, B.; Chen, H.Y.H.; Niu, S. Responses of soil enzymatic activities to transgenic Bacillus thuringiensis (Bt) crops—A global meta-analysis. Sci. Total Environ. 2019, 651, 1830–1838. [Google Scholar] [CrossRef]
  17. Bai, C.; He, X.; Tang, H.; Shan, B.; Zhao, L. Spatial distribution of arbuscular mycorrhizal fungi, glomalin and soil enzymes under the canopy of Astragalus adsurgens Pall. in the Mu Us sandland, China. Soil Biol. Biochem. 2009, 41, 941–947. [Google Scholar] [CrossRef]
  18. Yan, B.; Wang, X.; Sun, Y.; Fan, B.; Shi, L.; Liu, G. Vegetation rehabilitation increases soil enzyme activities in degraded land via carbon supply and nitrogen retention. Euro. J. Soil Biol. 2020, 98, 103186. [Google Scholar] [CrossRef]
  19. Andivia, E.; Fernández, M.; Alejano, R.; Vázquez-Piqué, J. Tree patch distribution drives spatial heterogeneity of soil traits in cork oak woodlands. Ann. For. Sci. 2015, 72, 549–559. [Google Scholar] [CrossRef]
  20. Liu, C.; Song, X.; Wang, L.; Wang, D.; Zhou, X.; Liu, J.; Zhao, X.; Li, J.; Lin, H. Effects of grazing on soil nitrogen spatial heterogeneity depend on herbivore assemblage and pre-grazing plant diversity. J. Appl. Ecol. 2016, 53, 242–250. [Google Scholar] [CrossRef]
  21. Guo, Z.; Liu, J.; Wu, J.; Yang, D.; Mei, K.; Li, H.; Lu, H.; Yan, C. Spatial heterogeneity in chemical composition and stability of glomalin-related soil protein in the coastal wetlands. Sci. Total Environ. 2022, 835, 155351. [Google Scholar] [CrossRef]
  22. Holátko, J.; Brtnický, M.; Kučerík, J.; Kotianová, M.; Elbl, J.; Kintl, A.; Kynický, J.; Benada, O.; Datta, R.; Jansa, J. Glomalin—Truths, myths, and the future of this elusive soil glycoprotein. Soil Biol. Biochem. 2021, 153, 108116. [Google Scholar] [CrossRef]
  23. Šarapatka, B.; Alvarado-Solano, D.P.; Čižmár, D. Can glomalin content be used as an indicator for erosion damage to soil and related changes in organic matter characteristics and nutrients? Catena 2019, 181, 104078. [Google Scholar] [CrossRef]
  24. Liu, X.; Burras, C.L.; Kravchenko, Y.S.; Duran, A.; Huffman, T.; Morras, H.; Studdert, G.; Zhang, X.; Cruse, R.M.; Yuan, X. Overview of mollisols in the world: Distribution, land use and management. Can. J. Soil Sci. 2012, 92, 383–402. [Google Scholar] [CrossRef]
  25. Zhong, Z.; Wang, W.; Wang, Q.; Wu, Y.; Wang, H.; Pei, Z. Glomalin amount and compositional variation, and their associations with soil properties in farmland, northeastern China. J. Plant. Nutr. Soil Sci. 2017, 180, 563–575. [Google Scholar] [CrossRef]
  26. Guan, S.Y. Soil Enzymes Activities and Research Methods; Agricultural Press: Beijing, China, 1986. [Google Scholar]
  27. Wu, Q.S.; Cao, M.Q.; Zou, Y.N.; He, X.H. Direct and indirect effects of glomalin, mycorrhizal hyphae, and roots on aggregate stability in rhizosphere of trifoliate orange. Sci. Rep. 2014, 4, 5823. [Google Scholar] [CrossRef]
  28. Bradford, M.M. A rapid and sensitive method for the quantitation of microgram quantities of protein utilizing the principle of protein-dye binding. Anal. Biochem. 1976, 72, 248–254. [Google Scholar] [CrossRef]
  29. Oksanen, J.; Blanchet, F.G.; Friendly, M.; Kindt, R.; Legendre, P.; McGlinn, D.; Minchin, P.R.; O’Hara, R.B.; Simpson, G.L.; Solymos, P.; et al. Vegan: Community Ecology Package. 2017. Available online: https://cran.r-project.org/package=vegan (accessed on 1 June 2020).
  30. Lê, S.; Josse, J.; Husson, F. FactoMineR: An R package for multivariate analysis. J. Stat. Softw. 2008, 25, 1–18. [Google Scholar] [CrossRef]
  31. Fang, X.; Xue, Z.; Li, B.; An, S. Soil organic carbon distribution in relation to land use and its storage in a small watershed of the Loess Plateau, China. Catena 2012, 88, 6–13. [Google Scholar] [CrossRef]
  32. Singh, P.K.; Singh, M.; Tripathi, B.N. Glomalin: An arbuscular mycorrhizal fungal soil protein. Protoplasma 2013, 250, 663–669. [Google Scholar] [CrossRef]
  33. Wang, Q.; Wang, W.J. GRSP amount and compositions: Importance for soil functional regulation. In Fulvic and Humic Acids: Chemical Composition, Soil Applications and Ecological Effects; Barrett, K.D., Ed.; Nova Science Publishers: Hauppauge, NY, USA, 2015; pp. 39–71. [Google Scholar]
  34. Zhu, X.; Sun, L.; Song, F.; Liu, S.; Liu, F.; Li, X. Soil microbial community and activity are affected by integrated agricultural practices in China. Eur. J. Soil Sci. 2018, 69, 924–935. [Google Scholar] [CrossRef]
  35. Tang, H.; Li, C.; Xiao, X.; Pan, X.; Cheng, K.; Shi, L.; Li, W.; Wen, L.; Wang, K. Effects of long-term fertiliser regime on soil organic carbon and its labile fractions under double cropping rice system of southern China. Acta Agric. Scand. Sect. B—Soil Plant Sci. 2020, 70, 409–418. [Google Scholar] [CrossRef]
  36. Zhang, X.; Sui, Y.; Zhang, X.; Meng, K.; Herbert, S.J. Spatial variability of nutrient properties in black soil of Northeast China. Pedosphere 2007, 17, 19–29. [Google Scholar] [CrossRef]
  37. Liu, X.M.; Li, Q.; Liang, W.J.; Jiang, Y. Distribution of soil enzyme activities and microbial biomass along a latitudinal gradient in farmlands of Songliao Plain, Northeast China. Pedosphere 2008, 18, 431–440. [Google Scholar] [CrossRef]
  38. Fissore, C.; Dalzell, B.J.; Berhe, A.A.; Voegtle, M.; Evans, M.; Wu, A. Influence of topography on soil organic carbon dynamics in a Southern California grassland. Catena 2017, 149, 140–149. [Google Scholar] [CrossRef]
  39. Lin, J.S.; Shi, X.Z.; Lu, X.X.; Yu, D.S.; Wang, H.J.; Zhao, Y.C.; Sun, W.X. Storage and spatial variation of phosphorus in paddy soils of China. Pedosphere 2009, 19, 790–798. [Google Scholar] [CrossRef]
  40. Olaya-Abril, A.; Parras-Alcántara, L.; Lozano-García, B.; Obregón-Romero, R. Soil organic carbon distribution in Mediterranean areas under a climate change scenario via multiple linear regression analysis. Sci. Total Environ. 2017, 592, 134–143. [Google Scholar] [CrossRef]
  41. Leifeld, J.; Bassin, S.; Fuhrer, J. Carbon stocks in Swiss agricultural soils predicted by land-use, soil characteristics, and altitude. Agric. Ecosyst. Environ. 2005, 105, 255–266. [Google Scholar] [CrossRef]
  42. Lovelock, C.E.; Wright, S.F.; Clark, D.A.; Ruess, R.W. Soil stocks of glomalin produced by arbuscular mycorrhizal fungi across a tropical rain forest landscape. J. Ecol. 2004, 92, 278–287. [Google Scholar] [CrossRef]
  43. Rillig, M.C.; Wright, S.F.; Nichols, K.A.; Schmidt, W.F.; Torn, M.S. Large contribution of arbuscular mycorrhizal fungi to soil carbon pools in tropical forest soils. Plant. Soil 2001, 233, 167–177. [Google Scholar] [CrossRef]
  44. He, X.; Chen, C.; He, B. Spatial distribution of arbuscular mycorrhizal fungi and glomalin of Hippophae rhamnoides L. in farming-pastoral zone from the two northern provinces of China. Acta Ecol. Sin. 2011, 31, 1653–1661. [Google Scholar]
  45. Kumar, S.; Singh, A.K.; Ghosh, P. Distribution of soil organic carbon and glomalin related soil protein in reclaimed coal mine- land chronosequence under tropical condition. Sci. Total Environ. 2018, 625, 1341–1350. [Google Scholar] [CrossRef] [PubMed]
  46. Wang, Q.; Li, J.; Chen, J.; Hong, H.; Lu, H.; Liu, J.; Dong, Y.; Yan, C. Glomalin-related soil protein deposition and carbon sequestration in the Old Yellow River delta. Sci. Total Environ. 2018, 625, 619–626. [Google Scholar] [CrossRef] [PubMed]
  47. Zhang, J.; Tang, X.; Zhong, S.; Yin, G.; Gao, Y.; He, X. Recalcitrant carbon components in glomalin-related soil protein facilitate soil organic carbon preservation in tropical forests. Sci. Rep. 2017, 7, 2391. [Google Scholar] [CrossRef]
  48. Zhu, R.; Zheng, Z.; Li, T.; He, S.; Zhang, X.; Wang, Y.; Liu, T. Effect of tea plantation age on the distribution of glomalin-related soil protein in soil water-stable aggregates in southwestern China. Environ. Sci. Pollut. Res. 2019, 26, 1973–1982. [Google Scholar] [CrossRef]
  49. Koide, R.T.; Peoples, M.S. Behavior of Bradford-reactive substances is consistent with predictions for glomalin. Appl. Soil Ecol. 2013, 63, 8–14. [Google Scholar] [CrossRef]
  50. Miguel, D.L.; da Silva, E.M.R.; da Silva, C.F.; Pereira, M.G.; Leite, L.F.C. Soil microbiological properties and enzyme activity in agroforestry systems compared with monoculture, natural regeneration, and native caatinga. Biosci. J. 2020, 36, 1–16. [Google Scholar] [CrossRef]
  51. Li, X.; Han, S.; Luo, X.; Chen, W.; Huang, Q. Arbuscular mycorrhizal-like fungi and glomalin-related soil protein drive the distributions of carbon and nitrogen in a large scale. J. Soils Sediments 2020, 202, 963–972. [Google Scholar] [CrossRef]
  52. Vasconcellos, R.L.F.; Bonfim, J.A.; Baretta, D.; Cardoso, E.J.B.N. Arbuscular mycorrhizal fungi and glomalin-related soil protein as potential indicators of soil quality in a recuperation gradient of the atlantic forest in Brazil. Land Degrad. Dev. 2016, 27, 325–334. [Google Scholar] [CrossRef]
  53. Wang, W.; Zhong, Z.; Wang, Q.; Wang, H.; Fu, Y.; He, X. Glomalin contributed more to carbon, nutrients in deeper soils, and differently associated with climates and soil properties in vertical profiles. Sci. Rep. 2017, 7, 13003. [Google Scholar] [CrossRef] [Green Version]
Figure 1. Location of the study area and distribution of 41 sampling sites. The gray region indicates the representative black soil region of northeast China. The black circles represent the sampling sites.
Agronomy 12 02165 g001
Figure 2. Relationship between edaphic factors and longitude, latitude, and altitude. EE-GRSP, DE-GRSP, T-GRSP, SOM, and ACP represent easily extractable glomalin-related soil protein, difficult-to-extract GRSP, total GRSP, soil organic matter, and acid phosphatase, respectively. The value on the right of the color bar represents the Pearson correlation coefficient. * p < 0.05; ** p < 0.01.
Agronomy 12 02165 g002
Figure 3. Spatial distribution maps of EE-GRSP (easily extractable glomalin-related soil protein, a), DE-GRSP (difficult-to-extract GRSP, b), T-GRSP (total GRSP, c), SOM (soil organic matter, d), total N (e), total P (f), urease (g), and ACP (acid phosphatase, h).
Agronomy 12 02165 g003
Figure 4. Contribution rate of GRSP to soil organic carbon (a) and relationship between GRSP and soil organic carbon (bd) of the sampling sites. EE-GRSP, DE-GRSP, and T-GRSP represent easily extractable glomalin-related soil protein, difficult-to-extract GRSP, and total GRSP, respectively. ** p < 0.01.
Agronomy 12 02165 g004
Figure 5. Relationship among GRSP and soil chemical properties of the sampling sites. EE-GRSP, DE-GRSP, T-GRSP, SOM, and ACP represent easily extractable glomalin-related soil protein, difficult-to-extract GRSP, total GRSP, soil organic matter, and acid phosphatase, respectively. * p < 0.05.
Agronomy 12 02165 g005
Figure 6. Principal component analysis (PCA) of edaphic factors at the sampling sites. Ure, ACP, SOM, EE-GRSP, DE-GRSP, and T-GRSP represent urease, acid phosphatase, soil organic matter, easily extractable glomalin-related soil protein, difficult-to-extract GRSP, and total GRSP, respectively.
Agronomy 12 02165 g006
Figure 7. Relationship between EE-GRSP (easily extractable glomalin-related soil protein, a), DE-GRSP (difficult-to-extract GRSP, b), and T-GRSP (total GRSP, c) and geographic distances among sites.
Agronomy 12 02165 g007
Table 1. The correlation (r) and significance (p) values of Mantel test between glomalin–related soil protein and soil properties.
VariableEE-GRSPDE-GRSPT-GRSP
rprprp
pH0.0390.1620.0550.1210.0370.155
SOM0.224<0.0010.326<0.0010.422<0.001
Total N0.259<0.0010.1450.0050.283<0.001
Total P0.0550.061−0.0390.8410.0130.350
Urease0.0320.1810.222<0.0010.173<0.001
ACP0.198<0.0010.0300.2240.109<0.001
EE-GRSP, easily extractable glomalin-related soil protein; DE-GRSP, difficult-to-extract GRSP; T-GRSP, total GRSP; SOM, soil organic matter; ACP, acid phosphatase.
Publisher’s Note: MDPI stays neutral with regard to jurisdictional claims in published maps and institutional affiliations.

