1. Introduction
Transportation is one of the fastest-growing sources of greenhouse gas emissions, accounting for 78% of the rise in emissions from 1990 to 2019 [
1]. In 2020, transportation emissions declined by 14% solely due to the COVID-19 pandemic but witnessed a swift 12% increase in 2021 [
2] following the relaxation of lockdown measures. Meanwhile, the European Union and governments worldwide have implemented various regulations and measures aimed at reducing transportation emissions on a global scale [
3,
4,
5,
6,
7]. For instance, on 19 April 2023, the European Union and the Council modified Regulation (EU) 2019/631 to Regulation (EU) 2023/851 to enhance the CO
2 emission performance criteria for new passenger cars and new light commercial vehicles, aligning them with the heightened climate goals of the European Union. Notably, this amendment bolsters the emission targets and establishes a goal of 100% emission reduction for both cars and vans starting in 2035 [
8].
Replacing internal combustion engine (ICE) vehicles with electric vehicles (EV) is a step in the right direction towards reducing emissions and supporting climate targets; however, this action alone is not enough to solve the entire problem. Additional efforts such as integrating clean energy sources, optimizing powertrains based on vehicles’ missions, promoting shared vehicle usage, battery reusing, and interoperable charging technology [
9] are required.
Light electric vehicles (LEVs) are particularly suitable for urban and suburban environments, where high speed and long range are not the main priorities. LEVs have lower energy consumption and higher vehicle weight-to-payload ratios, and they require fewer resources for production compared to other EVs [
10]. This makes them more efficient and affordable, especially for large-scale production and shared mobility scenarios.
Table 1 provides an overview of the specifications of some L7e-C category EVs available on the market. All the vehicles listed in this table meet the European regulations outlined in (EU) No 168/2013 [
11], which specify that L7e-C vehicles must have a maximum continuous rated power of no more than 15 kW and a maximum speed of no more than 90 km/h.
The design of a powertrain starts by defining various quantities such as power, torque, speed, voltage, battery capacity, and range of the vehicle. The power and torque requirements of an electric traction motor depend on the vehicle’s desired performance characteristics, size, and weight. An accurate definition of the performance characteristics and, therefore, a reduction in the vehicle’s energy consumption require knowledge of the vehicle’s actual driving cycles and mission. As an example, Lindh et al. [
12] used an actual driving cycle of a bus route in Lappeenranta to investigate the speed and torque requirements for a heavy-duty vehicle. Based on these requirements, the authors proposed a permanent magnet traction motor design suitable for hybrid buses. However, the literature on LEV powertrain design rarely considers the associated driving missions. Instead, the powertrain is first parametrized and settled, and then, an ex-post-performance assessment is conducted using various driving cycles [
13,
14,
15,
16].
Different battery technologies for EVs are reviewed and compared in [
17]. Lithium-ion (Li-ion) batteries are the most frequently utilized battery type in EVs due to their significantly higher energy density (Wh/kg) compared to other alternatives. The two most used Li-ion chemistries are NMC (nickel–manganese–cobalt) and LFP (lithium–iron–phosphate). NMC cells provide a higher energy density and have a better charging performance at low temperatures, whereas LFP cells are more affordable and have a longer cycle life. The high energy density of NMC is vital for providing sufficient ranges for everyday electric driving, especially for LEVs, in which the mass and physical dimensions of the battery have strict limitations. On the other hand, the price range of LFP would better fit with LEVs. However, if an LEV is to be charged at a reasonable speed in cold-climate environments, expensive and heavy thermal management systems would be required in the case of LFP batteries. Hence, optimal cell chemistry is a compromise of price, energy density, and cold-climate performance. The battery capacity is determined based on various factors, such as the vehicle’s energy consumption, the expected driving conditions, the desired driving range, the weight of the vehicle, and the efficiency of the electrical motor. Battery cost is a significant factor contributing to the price of EVs. The cost breakdown of batteries can be classified into four primary segments: materials, labor, assembly, and overhead. Materials constitute the largest portion, representing approximately 60% of the total battery cost. Anticipated reductions in battery cell and pack costs are expected to occur gradually due to advancements in battery material chemistry, improvements in battery cell design, and a decrease in assembly expenses resulting from increased production volumes and learning. For instance, it is predicted that the global price per kWh of a battery pack will decrease by approximately 64% in 2050 compared to 2019 [
9]. Nevertheless, the current high cost of batteries makes small LEVs a more cost-effective choice compared to larger EVs, given their smaller battery size.
The voltage levels of LEVs available on the market typically range from 48 to 80 V. The specific voltage level of an LEV is determined during the design stage, considering several factors such as the power and torque requirements of the motor, the desired range of the vehicle, and the weight and cost constraints of the battery pack. Using higher voltages in electric vehicles can be more cost-effective for energy distribution as lower currents require smaller cable cross-sections and connectors. In addition, higher voltage levels offer greater powertrain scalability towards higher vehicle categories with superior performance characteristics, such as increased torque, power, and vehicle speed.
In this paper, we present the design of a modular and scalable electric powertrain for L7e-C category EVs with multipurpose usages (transporting people and goods), with a focus on the motor, battery, and charging requirements. The modularity and scalability of the proposed electric powertrain allow one to modify each component according to the vehicle’s mission, without affecting the overall powertrain concept. This approach facilitates the adaptation of the powertrain for use in higher classes of vehicles, such as M1. To ensure that the powertrain components are rightly sized according to the vehicle’s mission, the associated driving missions and operational patterns are considered in the design from the very first stages.
This research has been presented at the EVS36 Symposium in Sacramento, USA, in June 2023.
2. Materials and Methods
2.1. Vehicle Requirements and Specifications
The first step in powertrain design involves setting the base specifications and requirements of the vehicle. As mentioned previously, this paper focuses on L7e light four-wheel EVs. To comply with European regulations, the vehicle properties and specifications were defined based on regulation (EU) No 168/2013 [
11], as follows: a mass in running order of up to 600 kg (without the battery and payload), a top speed of 90 km/h, and a maximum continuous power of 15 kW. The total gross weight of the vehicle is assumed to be 1200 kg (150 kg of which is the battery and 450 kg of which is the payload). The 1-D vehicle model was described using basic parameters with the following values: wheel’s radius
Rw = 0.31 m, vehicle’s front area
Av = 2.17 m
2, wind drag coefficient
Cx = 0.3, tires’ pressure
pt = 3 bar, mass density of air
ρ = 1.2 kg/m
3, and rolling resistance coefficient
Cr, which is a function of vehicle speed and whose value varies between 0.0083 and 0.011.
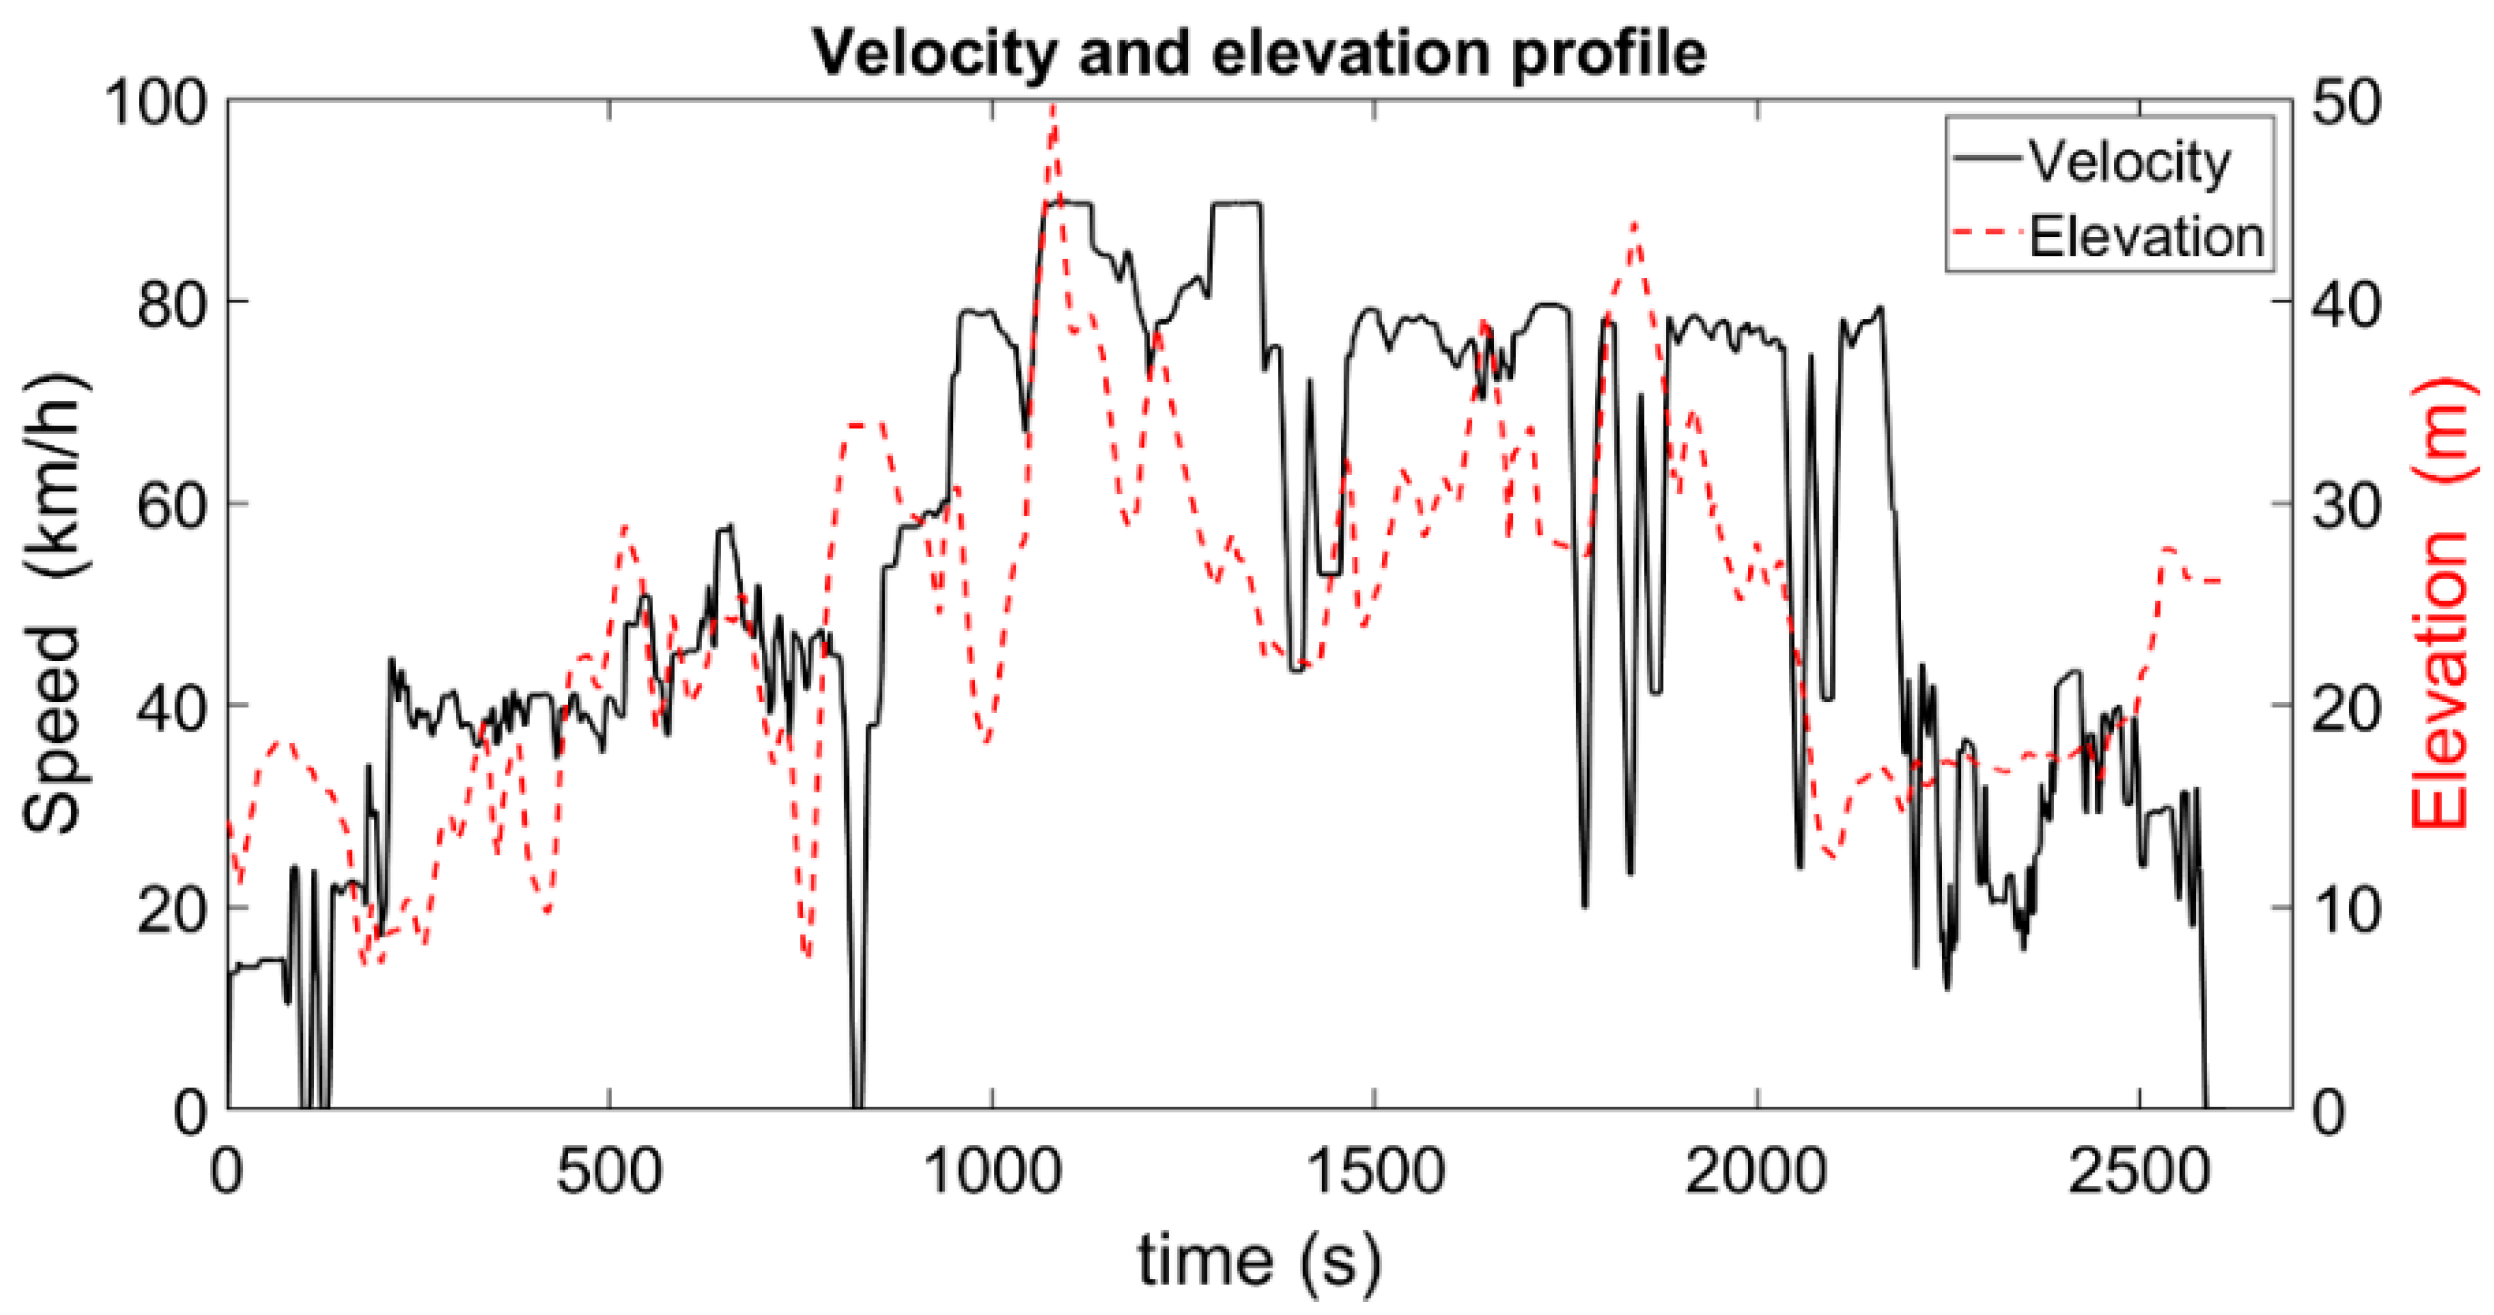
Other basic properties required for the powertrain design include the vehicle’s driving range and its torque and power profiles. To ensure that the powertrain components are appropriately sized according to the vehicle’s mission, the associated driving missions and operational patterns should be considered from the very first stages of design. For this purpose, we used a driving cycle generated based on typical trips in a European city, Helsinki, to study the vehicle’s driving range, torque–speed profile, and power requirements. This driving cycle was dynamically created using an in-house simulation tool [
18] taking into account the speed limits, traffic lights, road curvature, historical traffic data, and predefined limits for acceleration and deceleration. The specific driving cycle was chosen from a large set of routes and their corresponding driving cycles to represent a typical trip in the Helsinki region, with a mix of urban and suburban driving conditions. It is worth noting that the presented driving cycle also included terrain shape in the form of road elevation changes during the velocity profile. The speed and elevation profiles of this driving cycle are illustrated in
Figure 1.
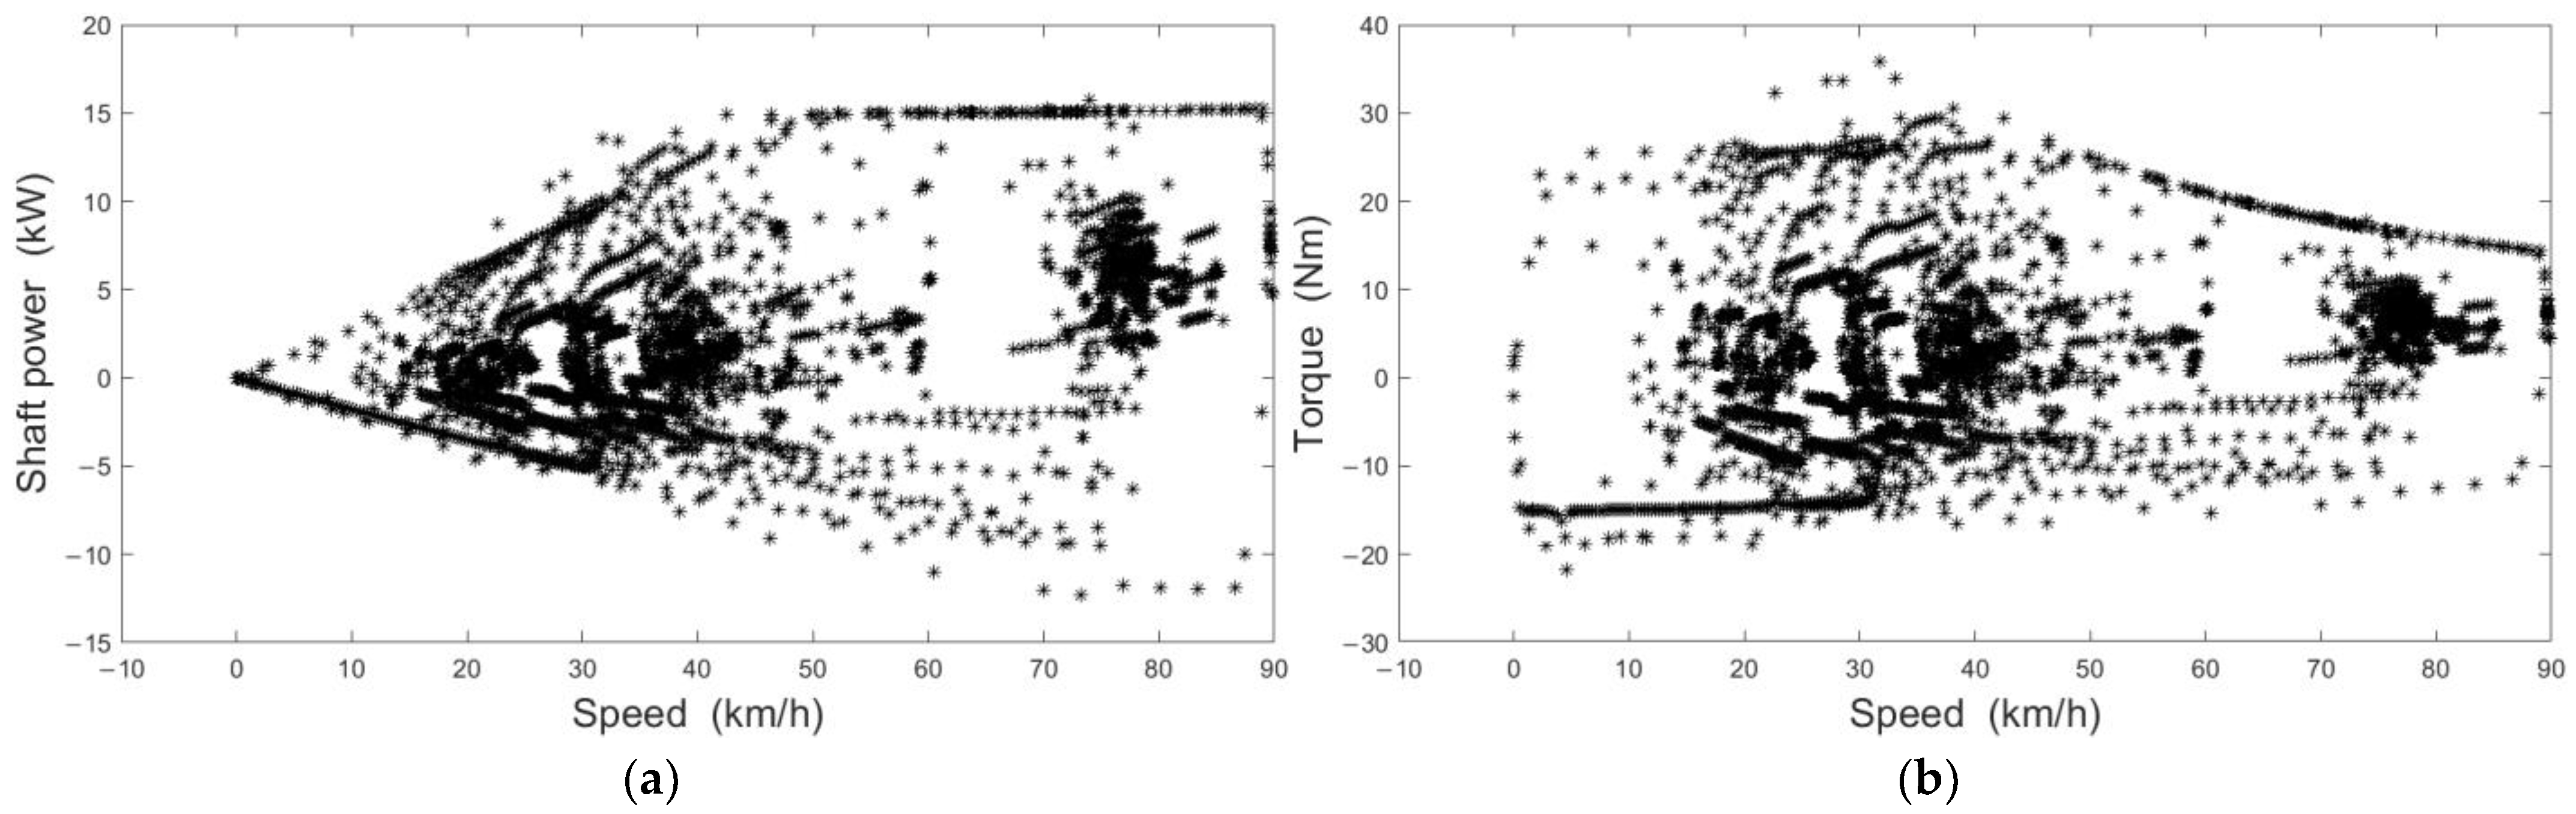
According to the highest allowable vehicle speed (90 km/h), a wheel radius of 0.31 m (R15), and the maximum electric motor rotational speed (10,000 rpm), we defined a gear ratio of 12:1 with a mean efficiency of 95%. Applying the identified Helsinki driving cycle and incorporating the upper boundary conditions, we calculated the vehicle’s needed torque and shaft power requirements.
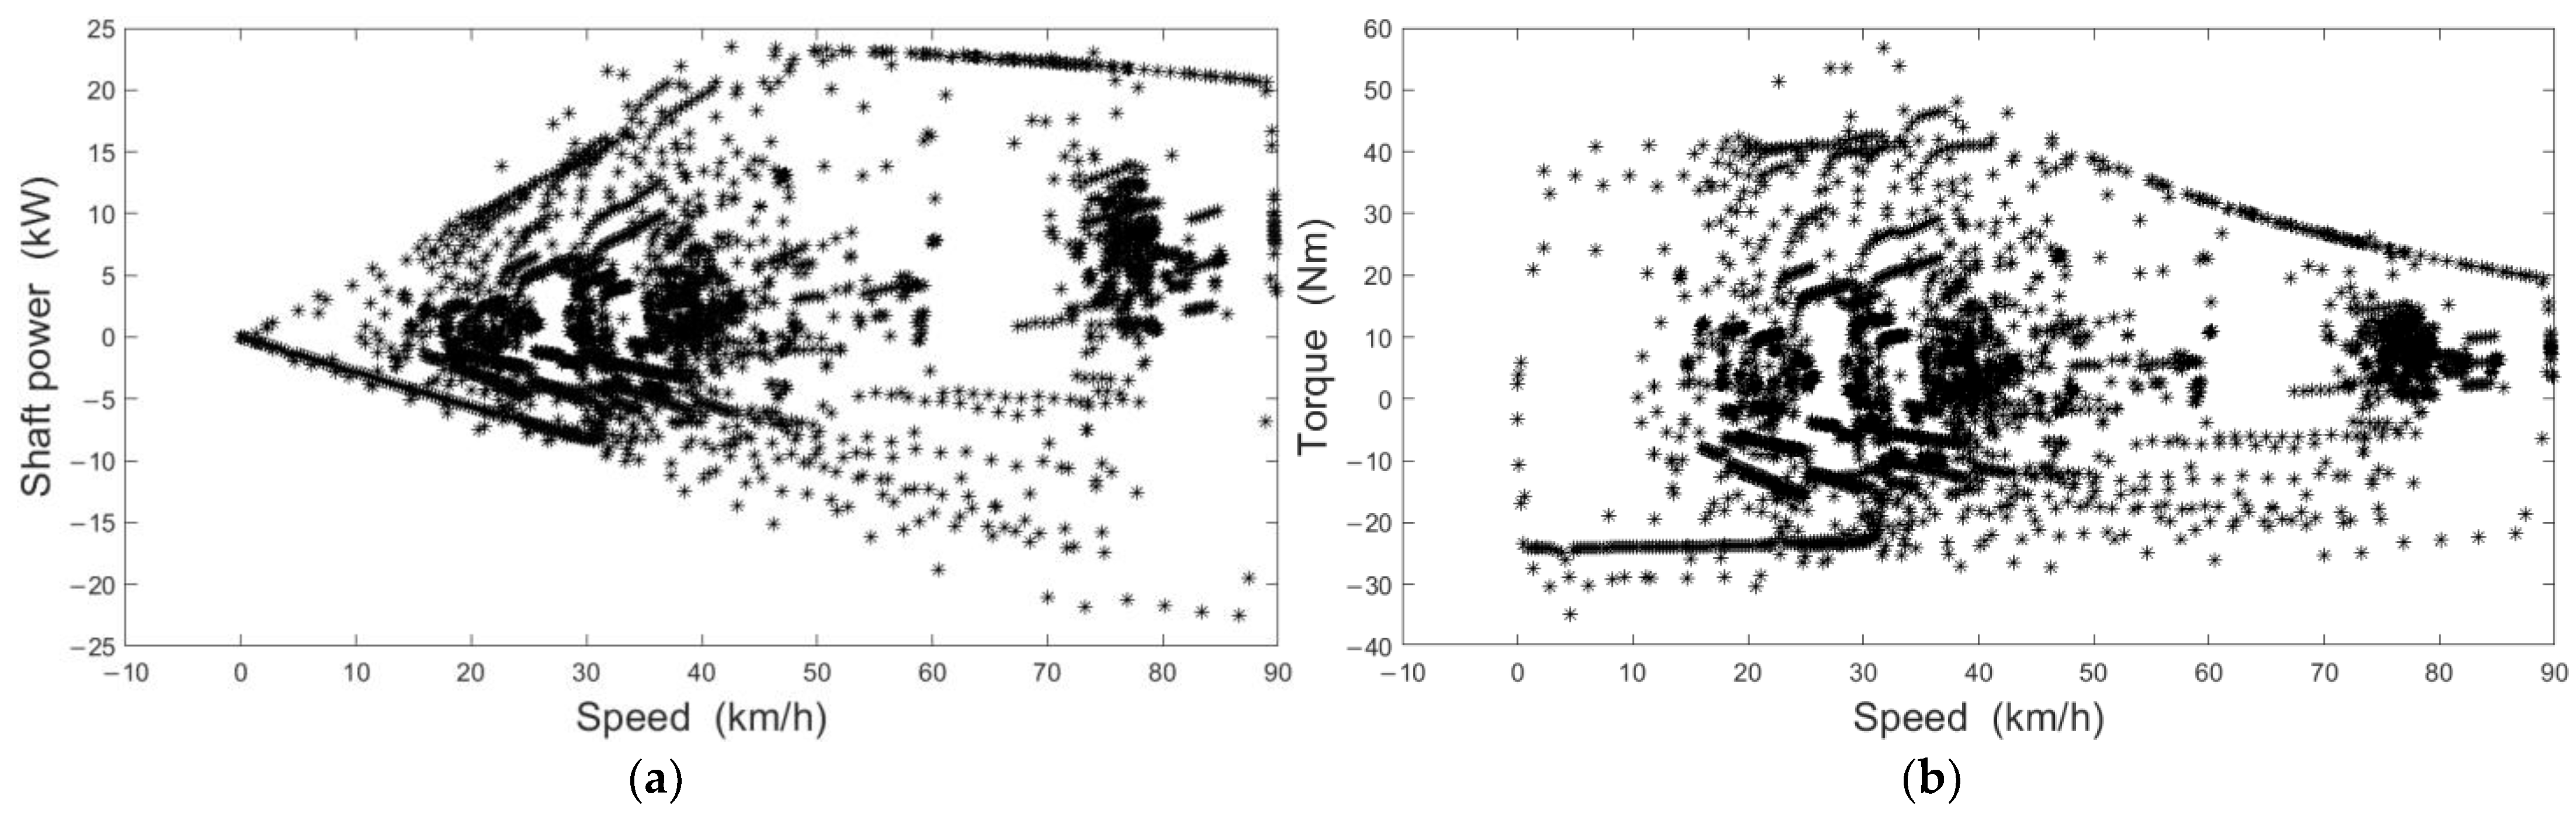
Figure 2 and
Figure 3 present the power and torque profiles of an electrical machine for the Helsinki driving cycle, without and with considering a 450 kg payload in the vehicle’s weight, respectively.
Further, the energy consumption at each driving point and the cumulative needed energy within one cycle were calculated. The overall energy consumed in the case of an unloaded vehicle in one driving cycle (38.2 km), including the road profile in the form of elevation (
Figure 1), is 2.73 kWh. In the case of a fully loaded vehicle (with a payload of 450 kg), the consumed energy is 3.56 kWh. To achieve a range of approximately 100 km and enable shorter charging times even with standard three-phase home charging facilities, the battery must provide enough energy to allow the vehicle to complete at least three Helsinki driving cycles, covering a total distance of 114.6 km. For such a distance, the electric energy consumed by the battery ranges between 8.16 kWh and 10.68 kWh. If we assume a 30% battery safety margin, the battery should have an energy capacity in the range of 15 kWh.
Based on the calculated torque and power profiles (
Figure 2 and
Figure 3), the following electro-mechanical requirements were established for the design of the electrical machine:
The electrical machine should be capable of delivering a shaft power of 15 kW in the constant power operational region, with this region extending up to a speed of 90 km/h corresponding to a motor speed of 9240 rpm (
Figure 2a).
The machine should have a nominal torque of approximately 40 Nm (
Figure 2b) in the case of an unloaded vehicle. Meanwhile, the maximum power and maximum torque should reach up to 23 kW and 60 Nm, respectively, due to the vehicle’s full payload (
Figure 3).
The electric machine’s torque–speed curve should have a corner point between 35 and 50 km/h, corresponding to a motor speed of around 3600–5100 rpm, to ensure that the torque demands remain within the region of highest efficiency for the electric machine.
The variation of the torque between 40 Nm and 60 Nm should depend on the vehicle’s payload and the driving cycle’s starting condition.
2.2. Traction Motor Design
Induction motors (IMs) and permanent magnet synchronous motors (PMSMs) are the most used electric traction motors in EVs. IMs are robust, reliable, and cost-effective, and their torque characteristics are proportional to the current. PMSMs, on the other hand, have higher efficiency, power density, and torque density than IMs. PMSMs perform better at high speeds and can produce high torque at low speeds, but they are more complex and expensive to produce due to the use of critical raw materials.
The type of traction motor chosen for an EV depends on the specific requirements. PMSMs are often used for high-performance EVs, while IMs are preferred for low-cost EVs. In this work, we chose an IM for the traction motor due to its robustness and to avoid the use of rare earth materials.
The electromagnetic field of an induction machine is governed by
where
μ is the permeability;
A is the magnetic vector potential; and
J is the current density. In a 2D analysis,
A and
J have components only in the axial direction. The right-hand side of (1) equals zero in the air gap and in the laminated iron of an electrical machine as the current density is zero or close to zero in those areas. Considering eddy currents induced in the rotor’s winding, one can present the field equation of the rotor bars as
σ being the rotor bar’s electrical conductivity, ∆vm being the voltage drop between the ends of the mth bar, l being the total length of the bar, and ez being the unit vector in the axial direction.
The traction motor was simulated using the 2D transient magnetic finite element method in the Altair Flux software. The end-region elements (end-winding and end-ring resistances and leakage inductance) were analytically calculated and added as lumped elements to the external electrical circuit. The boundary conditions and requirements for designing the motor were selected for the gear ratio 12:1 as follows:
A continuous power of 15 kW through the whole speed range (
Figure 2a) and a peak power of 23 kW (
Figure 3a).
A maximum torque of 70 Nm at zero speed to overcome the curb (calculated based on the wheel’s size, the vehicle’s mass, and a curb height of 15 cm).
A nominal phase RMS voltage in the range of 125 V to 175 V, allowing lower electric currents and smaller electric power wires cross-sections.
The maximum rotational speed of the motor should be 10,000 rpm, due to the 90 km/h maximum vehicle speed limitation, wheel size, and gearbox ratio).
A maximum motor efficiency > 92%.
To minimize the motor’s size and maximize its overload operational capabilities, we selected a liquid cooling system instead of an air-cooling system. The liquid cooling system offers a higher heat removal capability, especially when the vehicle is heavily loaded at lower rotational speeds.
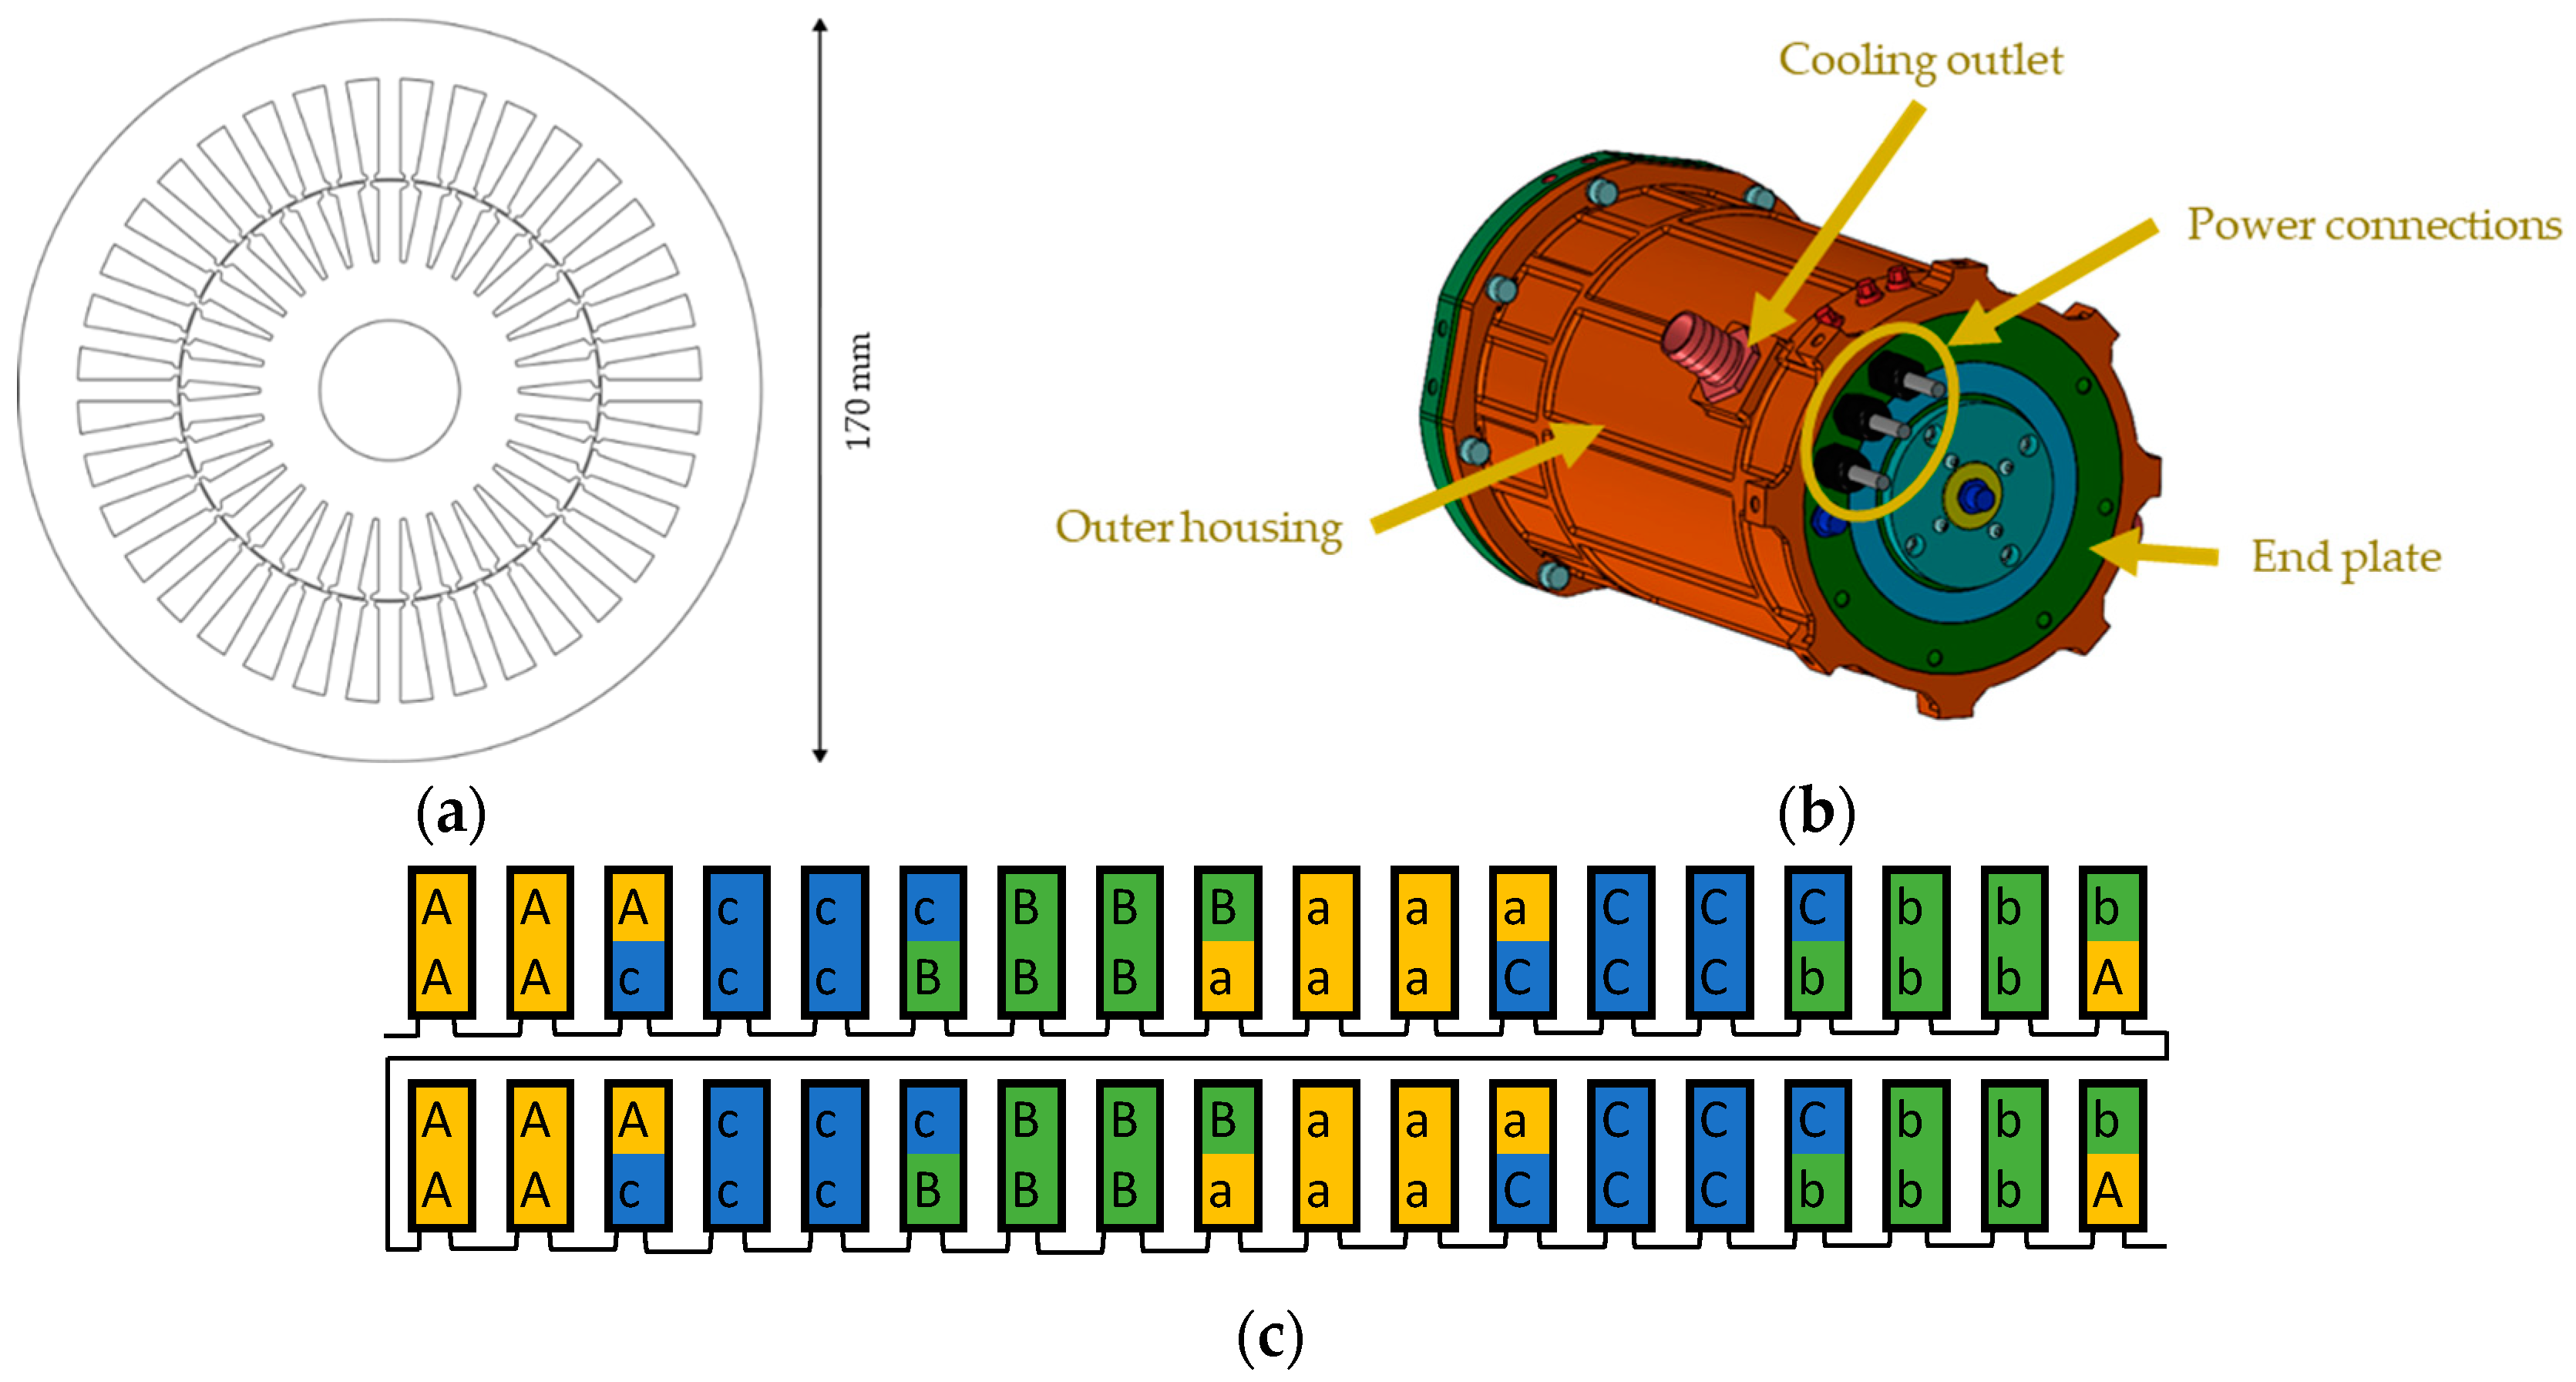
Considering these conditions and requirements, we simulated and studied various IM designs. A comprehensive analysis was conducted to determine the optimal number of stator slots and rotor bars to minimize the torque pulsations at the nominal operating point [
19,
20]. The analysis showed that the lowest torque pulsation occurred with 36 stator slots, 50 rotor bars, and 2 pole pairs. However, using 50 rotor bars would result in a thin rotor tooth. To ensure stable manufacturing and adequate rotor strength, the design with the second-lowest torque pulsations, namely, 30 rotor bars, was chosen. This decision aligns with our cost-effectiveness objectives, as the combination of 36 stator slots and 30 rotor bars can be produced using conventional methods and readily available electrical laminations. In addition, the shape of the rotor bars was chosen to enhance the critical torque value and reduce factors such as eddy current losses, magnetizing currents, and manufacturing complexity. The lamination design and 3D form of the proposed traction motor with liquid cooling are presented in
Figure 4a and
Figure 4b, respectively. The winding layout, shown in
Figure 4c, has a double-layer fractional slot winding with a coil span of eight slots and a winding factor of 0.945.
To reach a cost-effective scalability, the cross-sections of the stator and rotor lamination were fixed, and the axial length of the motor (with proper adjustment of the number of turns in the stator winding) was varied according to the voltage and power requirements. Different axial lengths were investigated to determine the optimized length for the motor.
Table 2 presents the main parameters of three of these designs. The results of these three designs, along with the analysis of the crossroad dynamics in the form of acceleration rates, will be presented in
Section 3.
2.3. Battery and Frequency Inverter
Based on the above-defined nominal phase RMS voltage level, the maximum allowable battery voltage could range from 340 V to 475 V. Another voltage limit was set by the off-the-shelf frequency inverter needed to drive the designed traction motor. We decided to use a SEVCON Gen4Size8 frequency inverter [
21] with a maximum voltage limit of 400 V. To achieve the maximum voltage level of 400 V, we used 96 Li-ion NMC battery cells from KOKAM (model: SLPB100216216H [
22]) connected in series, each having a capacity of 40 Ah. When using cells with an average voltage of 3.7 V, the battery stack delivers a maximum energy of 14 kWh. The proposed battery assembly provided sufficient energy to fulfill the defined range of the vehicle.
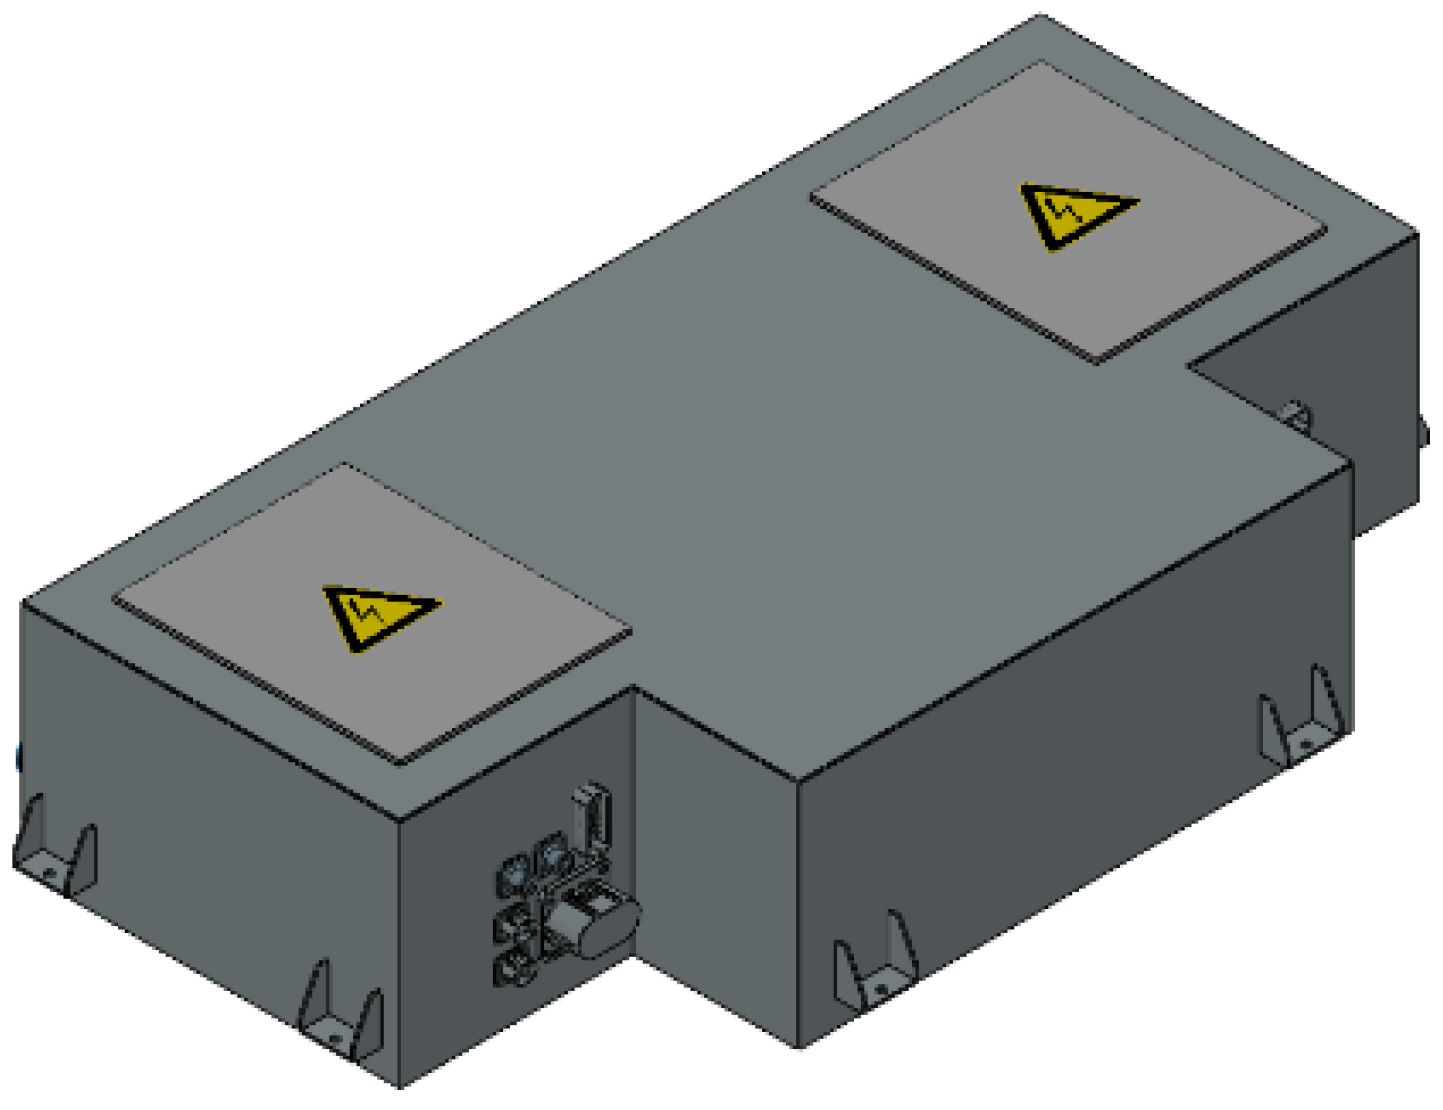
The battery designed for the vehicle had integrated BMS, contactors, fuses, DC/DC converter (400 V/12 V, 1.2 kW), and air-cooling fans in the battery box (
Figure 5). This battery design featured an energy storage system with an energy capacity of 14 kWh, fulfilling all the requirements regarding voltage, vehicle range, overload capability, fast charging, and safety concerns (battery’s structural integrity). Moreover, the battery was built modularly, so its energy capacity could be scaled up to 25 kWh, for example, for the M1 vehicle type just by substituting the battery cells with the ones that have a higher 60 Ah capacity, such as the KOKAM Model: KCL216060EN1 [
23].
2.4. Charging Requirements
A detailed analysis of the vehicle’s utilization was conducted to determine the required power of the charging system. In this work, vehicle utilization is referred to as duty cycles and encompasses the trips that a vehicle is expected to make during the day. The duty cycles are presented as schedule-format descriptions of the driven route’s origins and destinations, non-driving related activities (such as cargo loading and unloading), and breaks from all activities when the vehicle is not occupied. The cycle profiles can be generated via mesoscopic simulations such as activity-based transport modeling (ABTM) [
24]. We implemented the duty cycles into an in-house microscopic simulation tool [
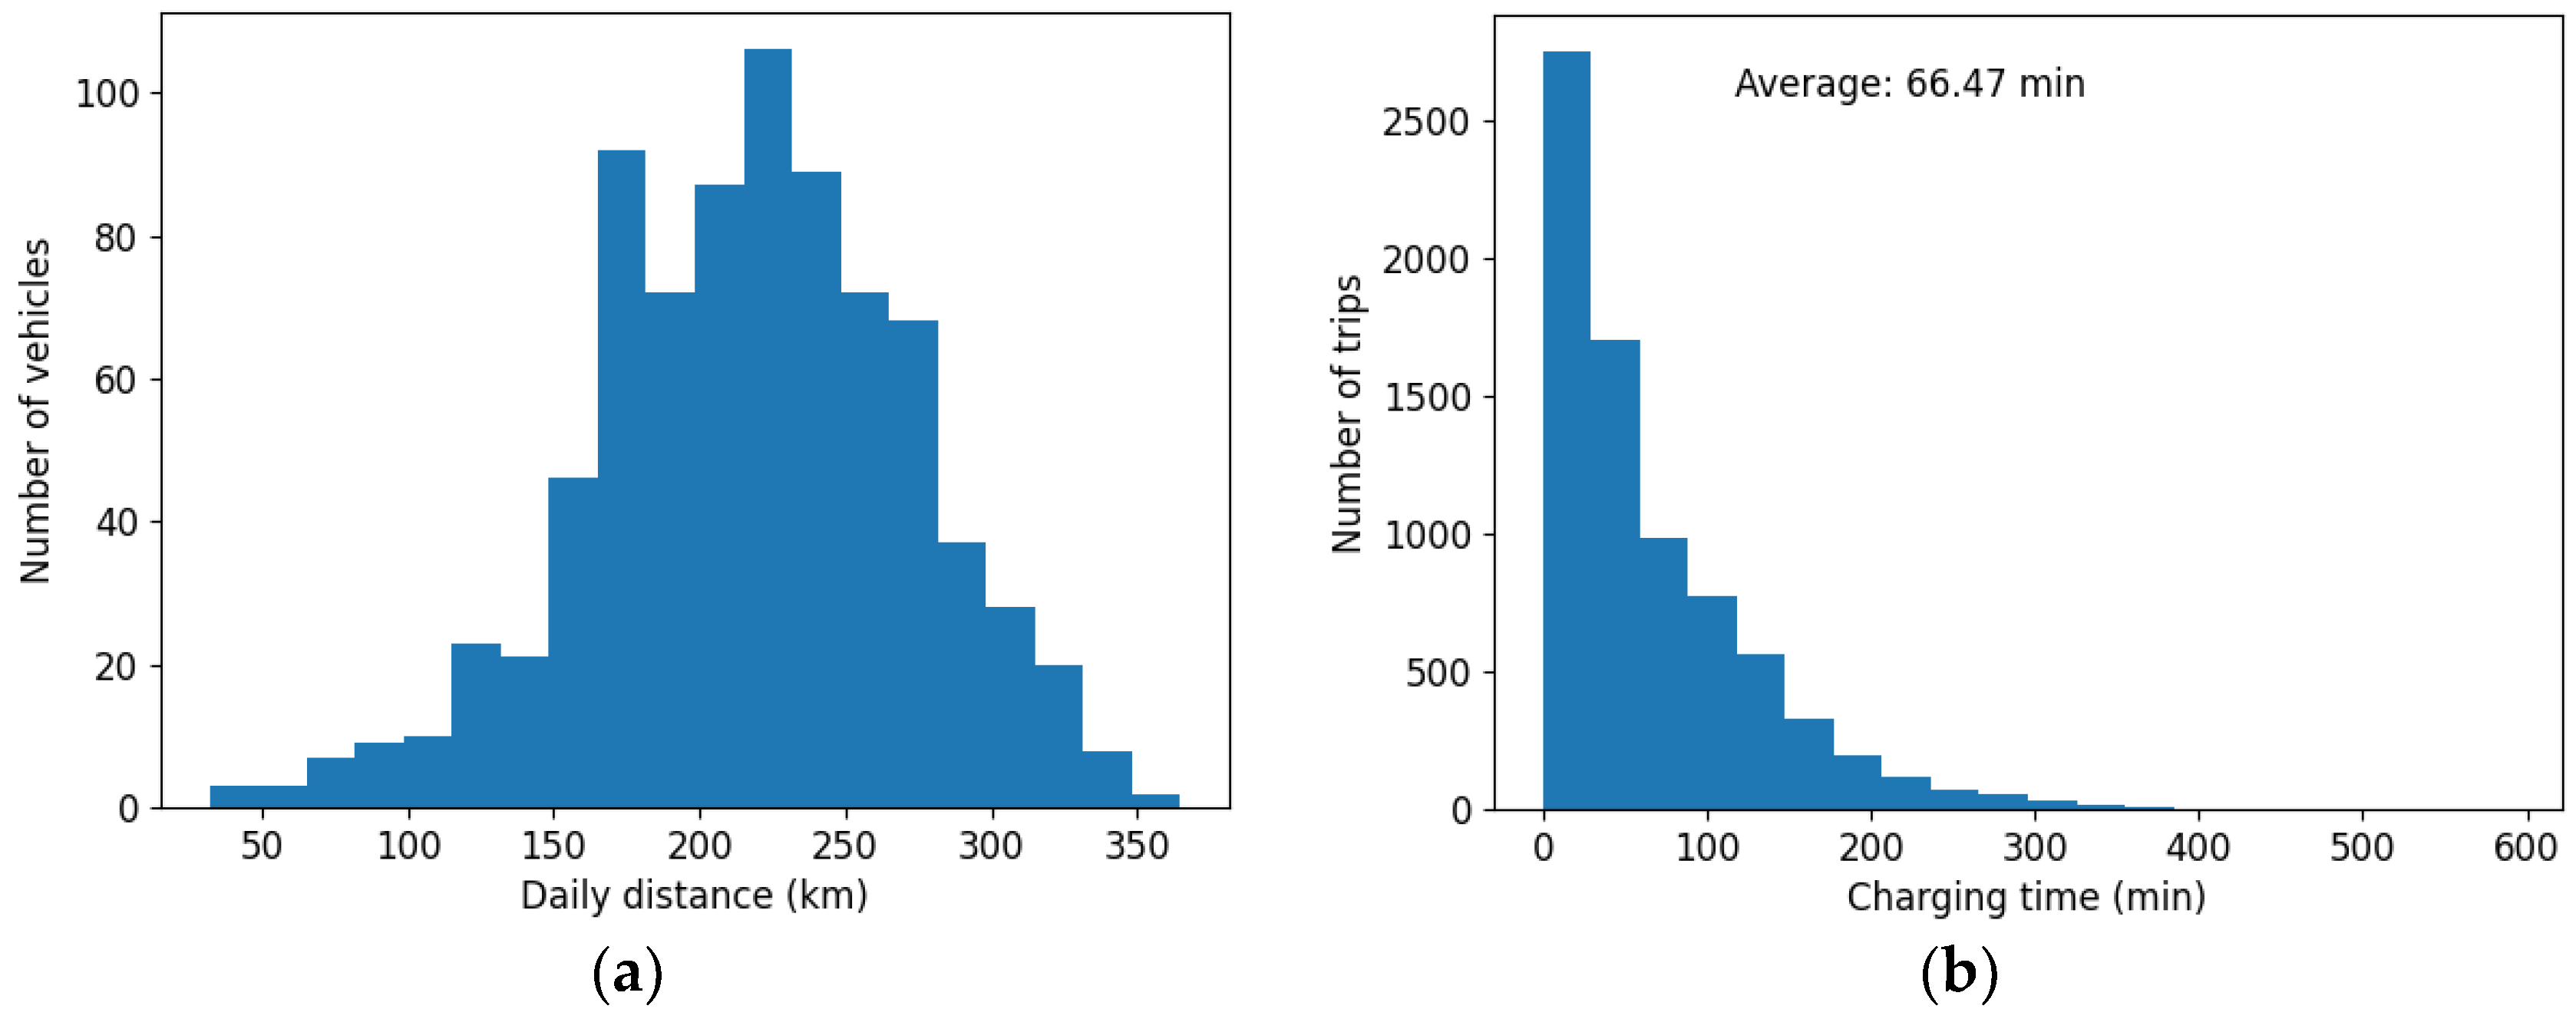
18] to study the charging requirements of the vehicle while considering the driving cycles, vehicle dynamics, and charging module. In the simulation, it was assumed that a fleet of about 28,000 vehicles with a utility rate of 50% had been distributed around the capital region of Helsinki (i.e., Helsinki, Espoo, Vantaa, and Kauniainen), providing a shared fleet for 24/7 transportation (e.g., people during the day and goods at night).
Figure 6a shows the simulated daily distance driven by each vehicle in the fleet. As shown in this Figure, the average distance exceeds 200 km, and some vehicles travel over 300 km per day.
Figure 6b displays the maximum available charging time between each trip, assuming that charging is feasible at all locations where the vehicles park.
To gain an understanding of the vehicle’s operation in a more realistic situation where charging is not always possible, the parking locations of the vehicles from the initial simulations were analyzed and the 100 most-often-used locations were set to be equipped with a charger, while the other parking locations were left without charging facilities. Out of the 100 charging locations, 20% were equipped with fast 7 kW chargers and the rest with slower 3.7 kW chargers. The results of these two charging scenarios are compared in
Section 3.
3. Results and Discussion
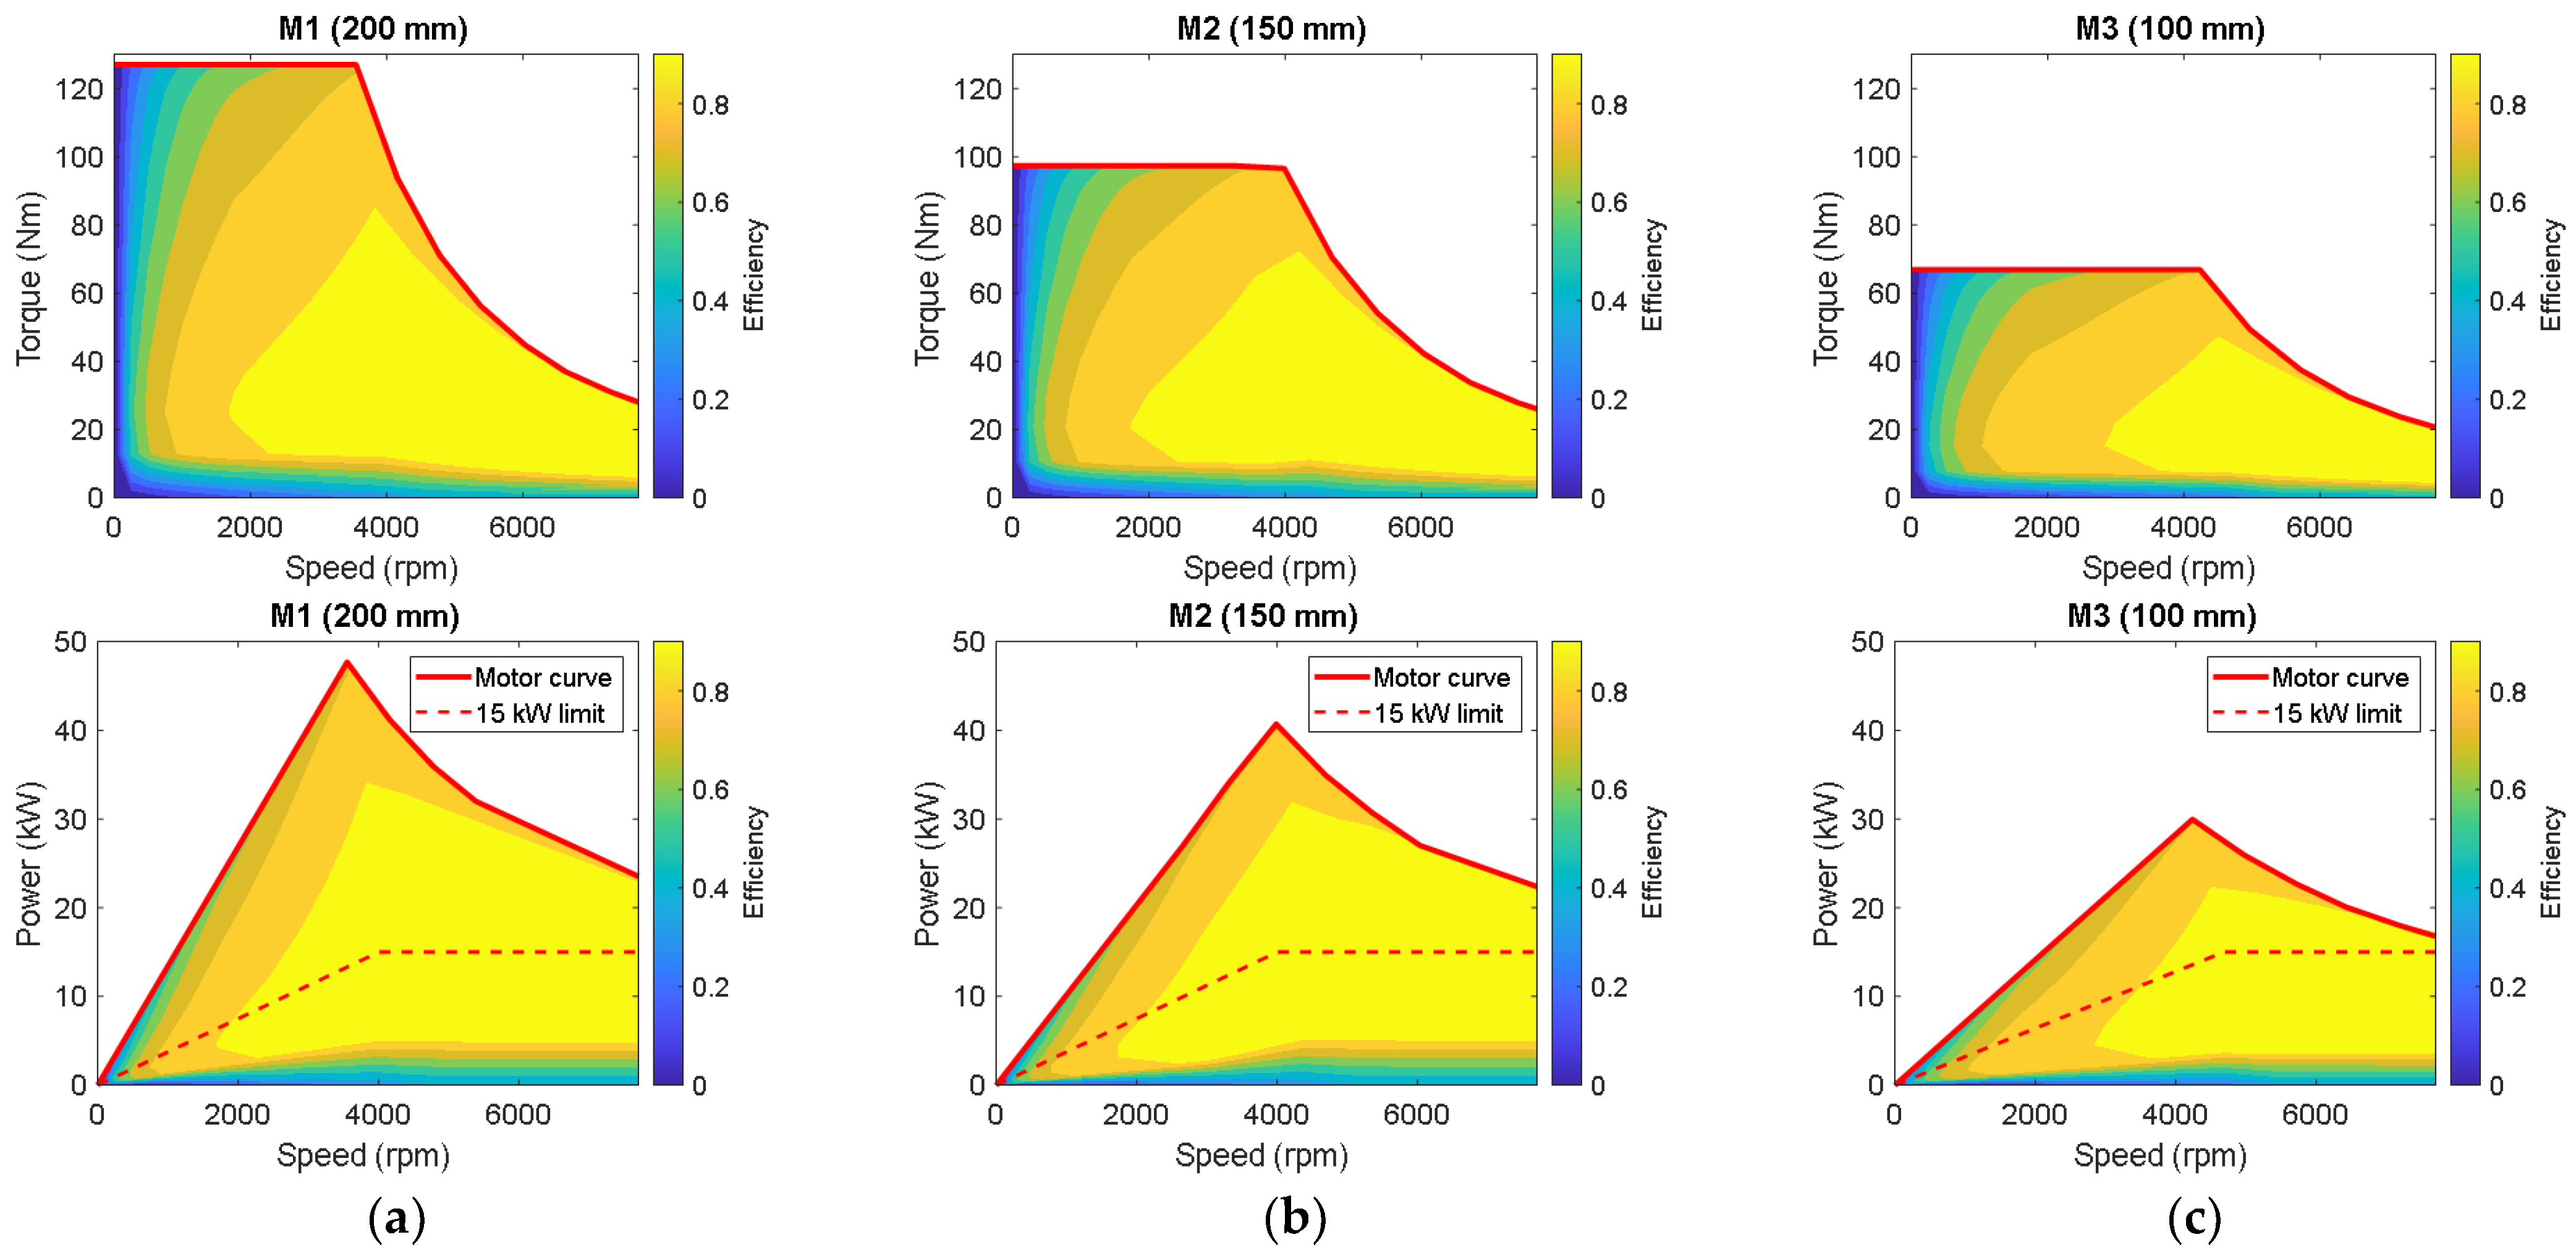
Figure 7 presents the efficiency maps of the three motor designs, which were calculated using the 2D finite element method. The efficiency maps show the maximum achievable power values without any electric current limitations. As can be seen from the efficiency maps, Motor 1, with a corner point at 4000 rpm, has the largest efficiency area in comparison to the other motors.
The vehicle’s dynamics were simulated with these three motor designs. In the simulation, the resistive forces acting on the vehicle (e.g., slope, friction, air drag) and the total inertia, scaled to the electrical motor, were considered. For the gearbox and differential, a constant efficiency level of 95% was assumed. The comparison of the motors was carried out on roads with slopes ranging from 0% to 26% (maximum road slope), in terms of the maximum achievable speed and acceleration times from 0 to 40 km/h. The acceleration test results are presented in
Table 3. According to these results, Motor 1 achieves the highest speeds on all the slopes and outperforms the other two motors in the acceleration tests.
The torque’s range was established by analyzing the driving cycles, as described in
Section 2.1. Nevertheless, to validate the torque requirements and to make any necessary adjustments, the real-world urban driving cycle acceleration time was considered as well. This will further permit the adjustment of the torque characteristics of the traction motor and gearbox ratio, if needed, to fulfill the high dynamics of an EV in urban driving conditions.
The acceleration time in the urban driving condition was measured by conducting an acceleration test on a vehicle with an ICE that had similar size and weight characteristics to the vehicle under investigation. The acceleration test resulted in a time of approximately 4 s to reach from 0 km/h to 40 km/h. The results of this test were then utilized to define the acceleration torque requirements by inputting the data into a MATLAB R2020b software program that was designed based on the vehicle’s equation of motion.
The developed MATLAB R2020b software allows for the simulation of changes in the dynamic performance of the EV powertrain, considering factors such as the torque–speed characteristic of the traction motor, the gearbox ratio, vehicle mass (1200 kg), vehicle shape (drag coefficient), wheel diameter, slope coefficient, and tire pressure. The output of the software is the calculated speed of the vehicle over time, from which the acceleration can be determined.
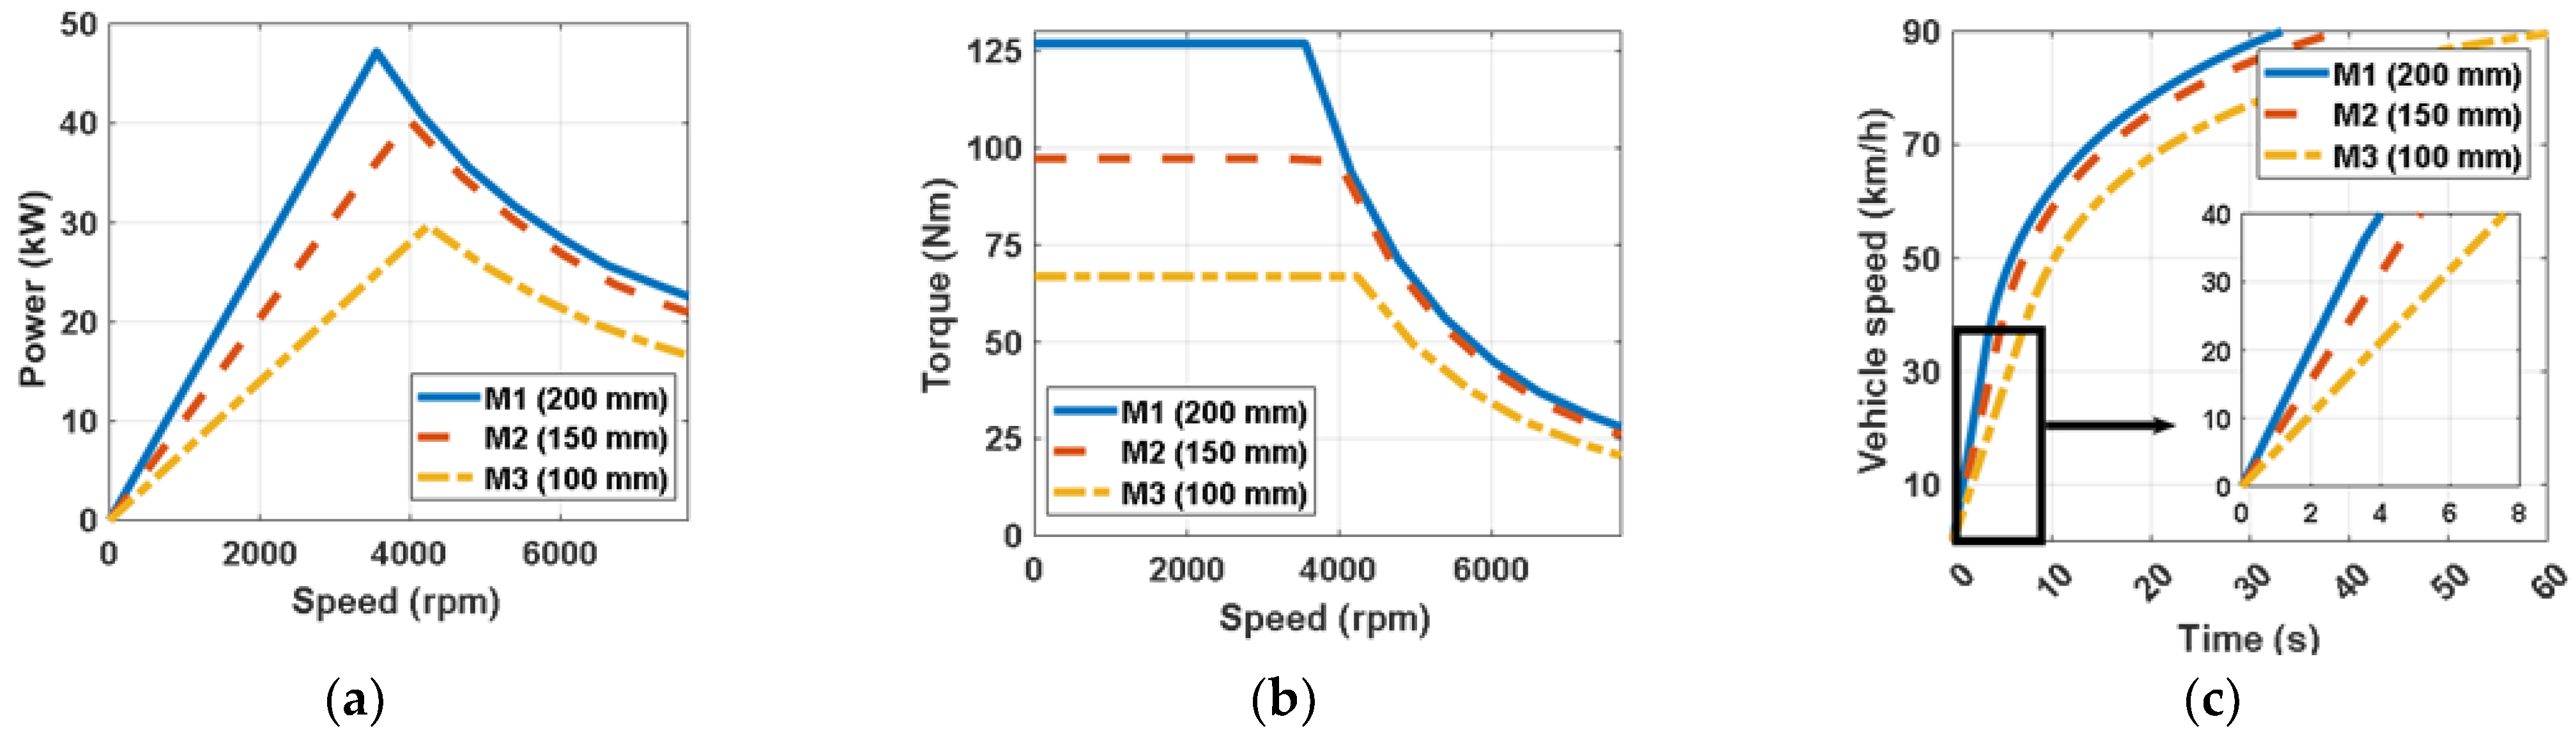
Figure 8 presents the power–speed and torque–speed curves, along with the transient acceleration behavior, of all three motors on the 0% slope, assuming a fully loaded vehicle with a total mass of 1200 kg. According to the results, the vehicle with Motor 1 fulfills the acceleration requirements from 0 to 40 km/h in 4 s and, therefore, is chosen as the traction motor of the proposed vehicle.
Table 4 summarizes the results of the following two charging scenarios: one with charging available at all parking locations and the other with charging available at only 100 locations. In the first scenario, all the scheduled trips were fulfilled without the battery state of charge (SOC) dropping below 35%. In the second scenario, some vehicles could not complete their trips due to the high daily distances. Nevertheless, on average, 92% of the daily target distance was covered, and the issues were mostly related to the very last trip of the day. It is worth noting that the simulations did not consider certain driver behaviors, such as selecting a vehicle with a higher SOC or choosing a parking spot with a charger instead of one without. Accounting for these factors would likely increase the likelihood of completing all the trips. Therefore, 7 kW was chosen as the maximum charging power of the vehicle. With such power, the battery could be charged from zero to 100% SOC in slightly more than 2 h.
In this paper, we highlight the importance of tailoring the powertrain of the vehicle according to its anticipated driving mission, resulting in optimized energy efficiency. While standard driving cycles can serve this purpose, they typically do not include complex and variable driving conditions such as traffic congestion, elevation changes, and weather conditions. By using real-world driving cycles, we can incorporate these variables when designing the powertrain. In cases where real-world driving cycles are not accessible, accurately simulated driving cycles, such as the one used in this paper, offer a suitable alternative. To illustrate the performance and advantages of our approach, we will prototype an LEV with the proposed powertrain and test its efficiency under various driving cycles, including the standard, real-world, and simulated scenarios.
While our research has primarily addressed the technical and operational aspects of the powertrain, it is important to acknowledge that cost considerations play a significant role in the real-world adoption of electric vehicles. Future studies should delve deeper into the economic aspects of electric vehicle development, exploring cost-effective strategies for component design, manufacturing, and charging infrastructure. This will help bridge the gap between the technical advancements presented in this paper and the practical affordability of electric vehicles, ultimately contributing to their wider adoption and sustainability.


 ,
, 


