Article

Evaluation of Electric Vehicle Charging Usage and Driver Activity

by
Justin Anthony Mahlberg
*,
Jairaj Desai
and
Darcy M. Bullock
Joint Transportation Research Program, Lyles School of Engineering, West Lafayette Campus, Purdue University, 207 S. Martin Jischke Drive Room 204, West Lafayette, IN 47907, USA
*
Author to whom correspondence should be addressed.
World Electr. Veh. J. 2023, 14(11), 308; https://doi.org/10.3390/wevj14110308
Submission received: 14 August 2023 / Revised: 2 November 2023 / Accepted: 3 November 2023 / Published: 8 November 2023

Abstract

:
As the country moves toward electric vehicles (EV), the United States is in the process of investing over USD 7.5 billion in EV charging stations, and Indiana has been allocated $100 million to invest in their EV charging network. In contrast to traditional “gas stations”, EV charging times, depending on the charger power delivery rating, can require considerably longer dwell times. As a result, drivers tend to pair charging with other activities. This study looks at two EV public charging locations and monitors driver activity while charging, charge time, and station utilization over a 2-month period in Lafayette, Indiana. Over 4000 charging sessions at stations with varying power levels (350 kW, 150 kW, and 50 kW) were monitored, and the median charge time was between 28 and 36 min. A large variation in station utilization was observed at Electrify America charging stations that had a range of stations with 350 kW, 150 kW, and 50 kW available. The highest utilization rates by hour of day on average were observed at 25% at the 150 kW Tesla station. Driver activity during charging influenced dwell times, with the average dwell time of drivers who waited in their vehicles to charge being 10 min shorter than those who would travel to the shops. Rain in the forecast also impacted the number of users per day. Although there are no published metrics for EV utilization and associated driver activities, we believe examining this relationship will produce best practices for planning future investments in EV charging infrastructure as public and private sector partners develop a nationwide charging network.

1. Introduction

The United States has established a target that two-thirds of new passenger cars will be all-electric by 2032 [1]. As the country moves toward electric vehicles (EV), the United States is in the process of investing over USD 7.5 billion in EV charging stations, and Indiana has been allocated $100 million to invest in their EV charging network through the National Electric Vehicle Infrastructure (NEVI) program [2,3]. Contrary to combustion vehicles with an average refuel time of approximately two minutes, EV charging can require considerably longer dwell times [4]. The contributing factors influencing dwell time for EVs widely vary from charger type and output, vehicle type/battery capacity, and charging connectors, among others [5,6,7]. For example, Tesla chargers can add up to 200 miles of range in 15 min [8]. As a result, drivers tend to pair charging with other activities.
Studies utilizing empirical charging station data around the world, including in Germany [9,10], the Netherlands [11], Switzerland [12], Canada [13], Australia [14], and the United States [15], have analyzed historical charging station data to observe temporal utilization characteristics, energy consumption, and idling time. A 2017 study of charging infrastructure requirements followed by a nearly 2.5-year study from 2019–2022 of about 3700 public charging stations, 39,000 ports, and 8 million charging sessions in the United States by the National Renewable Energy Laboratory reported on the relationship between utilization and local EV adoption. That study also reported on the size of the local charging network, charging power, as well as temporal and spatial trends in charging behavior based on time of day, day of week, and nearby points of interest [16,17]. These studies offer an insightful snapshot of charging station usage characteristics and help predict future usage. However, a more agile and continuous longitudinal monitoring solution to track charging station utilization would be of great value to stakeholders. Charge session data, while offering valuable insights into charging station utilization, charge times, and idle times, offers little detail into driver activity before, during, or after an active charging session. This contextual knowledge will be vital for transportation planners in site selection for future charging station deployment.

2. Electric Vehicle Charging Literature Review

Emerging sources of connected vehicle (CV) trajectory data from third-party commercial data providers have been recently utilized by researchers to monitor the usage of EVs and hybrid vehicles (HVs) in the vicinity of charging infrastructure [18,19] as well as to temporally track increasing EV adoption levels across the nation [20,21]. While CV trajectory data provides insights into proximity-based analysis of EVs or HVs near or around charging stations as well as travel preceding or succeeding a charging session, it does not have charge status information from onboard the vehicle during the charging session itself. This has resulted in researchers having to assume and estimate charging station utilization, charging sessions, and dwell times in the absence of data confirming active charging sessions. Furthermore, multiple studies have explored simulation and modeling methods to inform the planning of EV charging station placements with economic, environmental, social, and technological site selection parameters [22,23,24] in mind.
There is expansive literature on EV adoption, EV trip patterns, proposed charger placement methods, and station utilization, but there is a gap in the literature for actual charger data and what users do while charging. Chakraborty et al. used surveys to build a model to determine user behavior for charging at home, the workplace, or public locations and what factors impacted users choice of charging location. They found that at-home charging can be more desirable if the correct infrastructure and pricing scheme enable it [25]. Similarly, another study looked at the willingness of EV users to pay for charging and how much they are willing to pay at public stations [26]. González et al. utilized modeling to determine optimal charging locations for users based on cost and convenience and determined the most overloaded areas during peak hours [27]. These studies help inform policymakers about ensuring wise investments to achieve the greatest impacts. Lee et al. used surveys to document user preference on what types of chargers were used, including location (home, work, and public) and the level of charging (level 1, 2, or fast charging) [28]. A drawback of this study is that when it was administered, they captured at-home charging but did not collect information on what users did while charging at public chargers. This study intends to answer what activities are performed while EV charging, provide insight on charger utilization, and give insight on the weather impact on EV charging.

3. Research Need

Travel surveys and questionnaire studies have analyzed user preferences when evaluating potential sites for fast charging infrastructure [29,30,31]. A combination of all the aforementioned datasets, including charge session data, CV data, and user preferences, will be important information to assess utilization rates and estimate future utilization to inform infrastructure deployment.
As the national public charging station network grows over the next decade and charging station data is made publicly available under the terms of the NEVI formula funding guidance [32], systematic assessment methodologies are needed to derive performance measures that can present actionable insights to stakeholders and inform future deployments. This study aims to address this research gap by analyzing public charging station utilization and driver activity using video footage collected at two locations from different Electric Vehicle Supply Equipment (EVSE) providers in Lafayette, Indiana, which may serve as a potential scalable framework for any future evaluations of charging station infrastructure usage. Scaling this methodology and incorporating other data sources will enable this study to be expanded across all charging stations, EVSE providers, and a diverse range of surrounding land uses.

4. Research Objective and Scope

The objective of this study is twofold:
  • To develop protocols for monitoring and quantifying charging station utilization through fixed video camera footage.
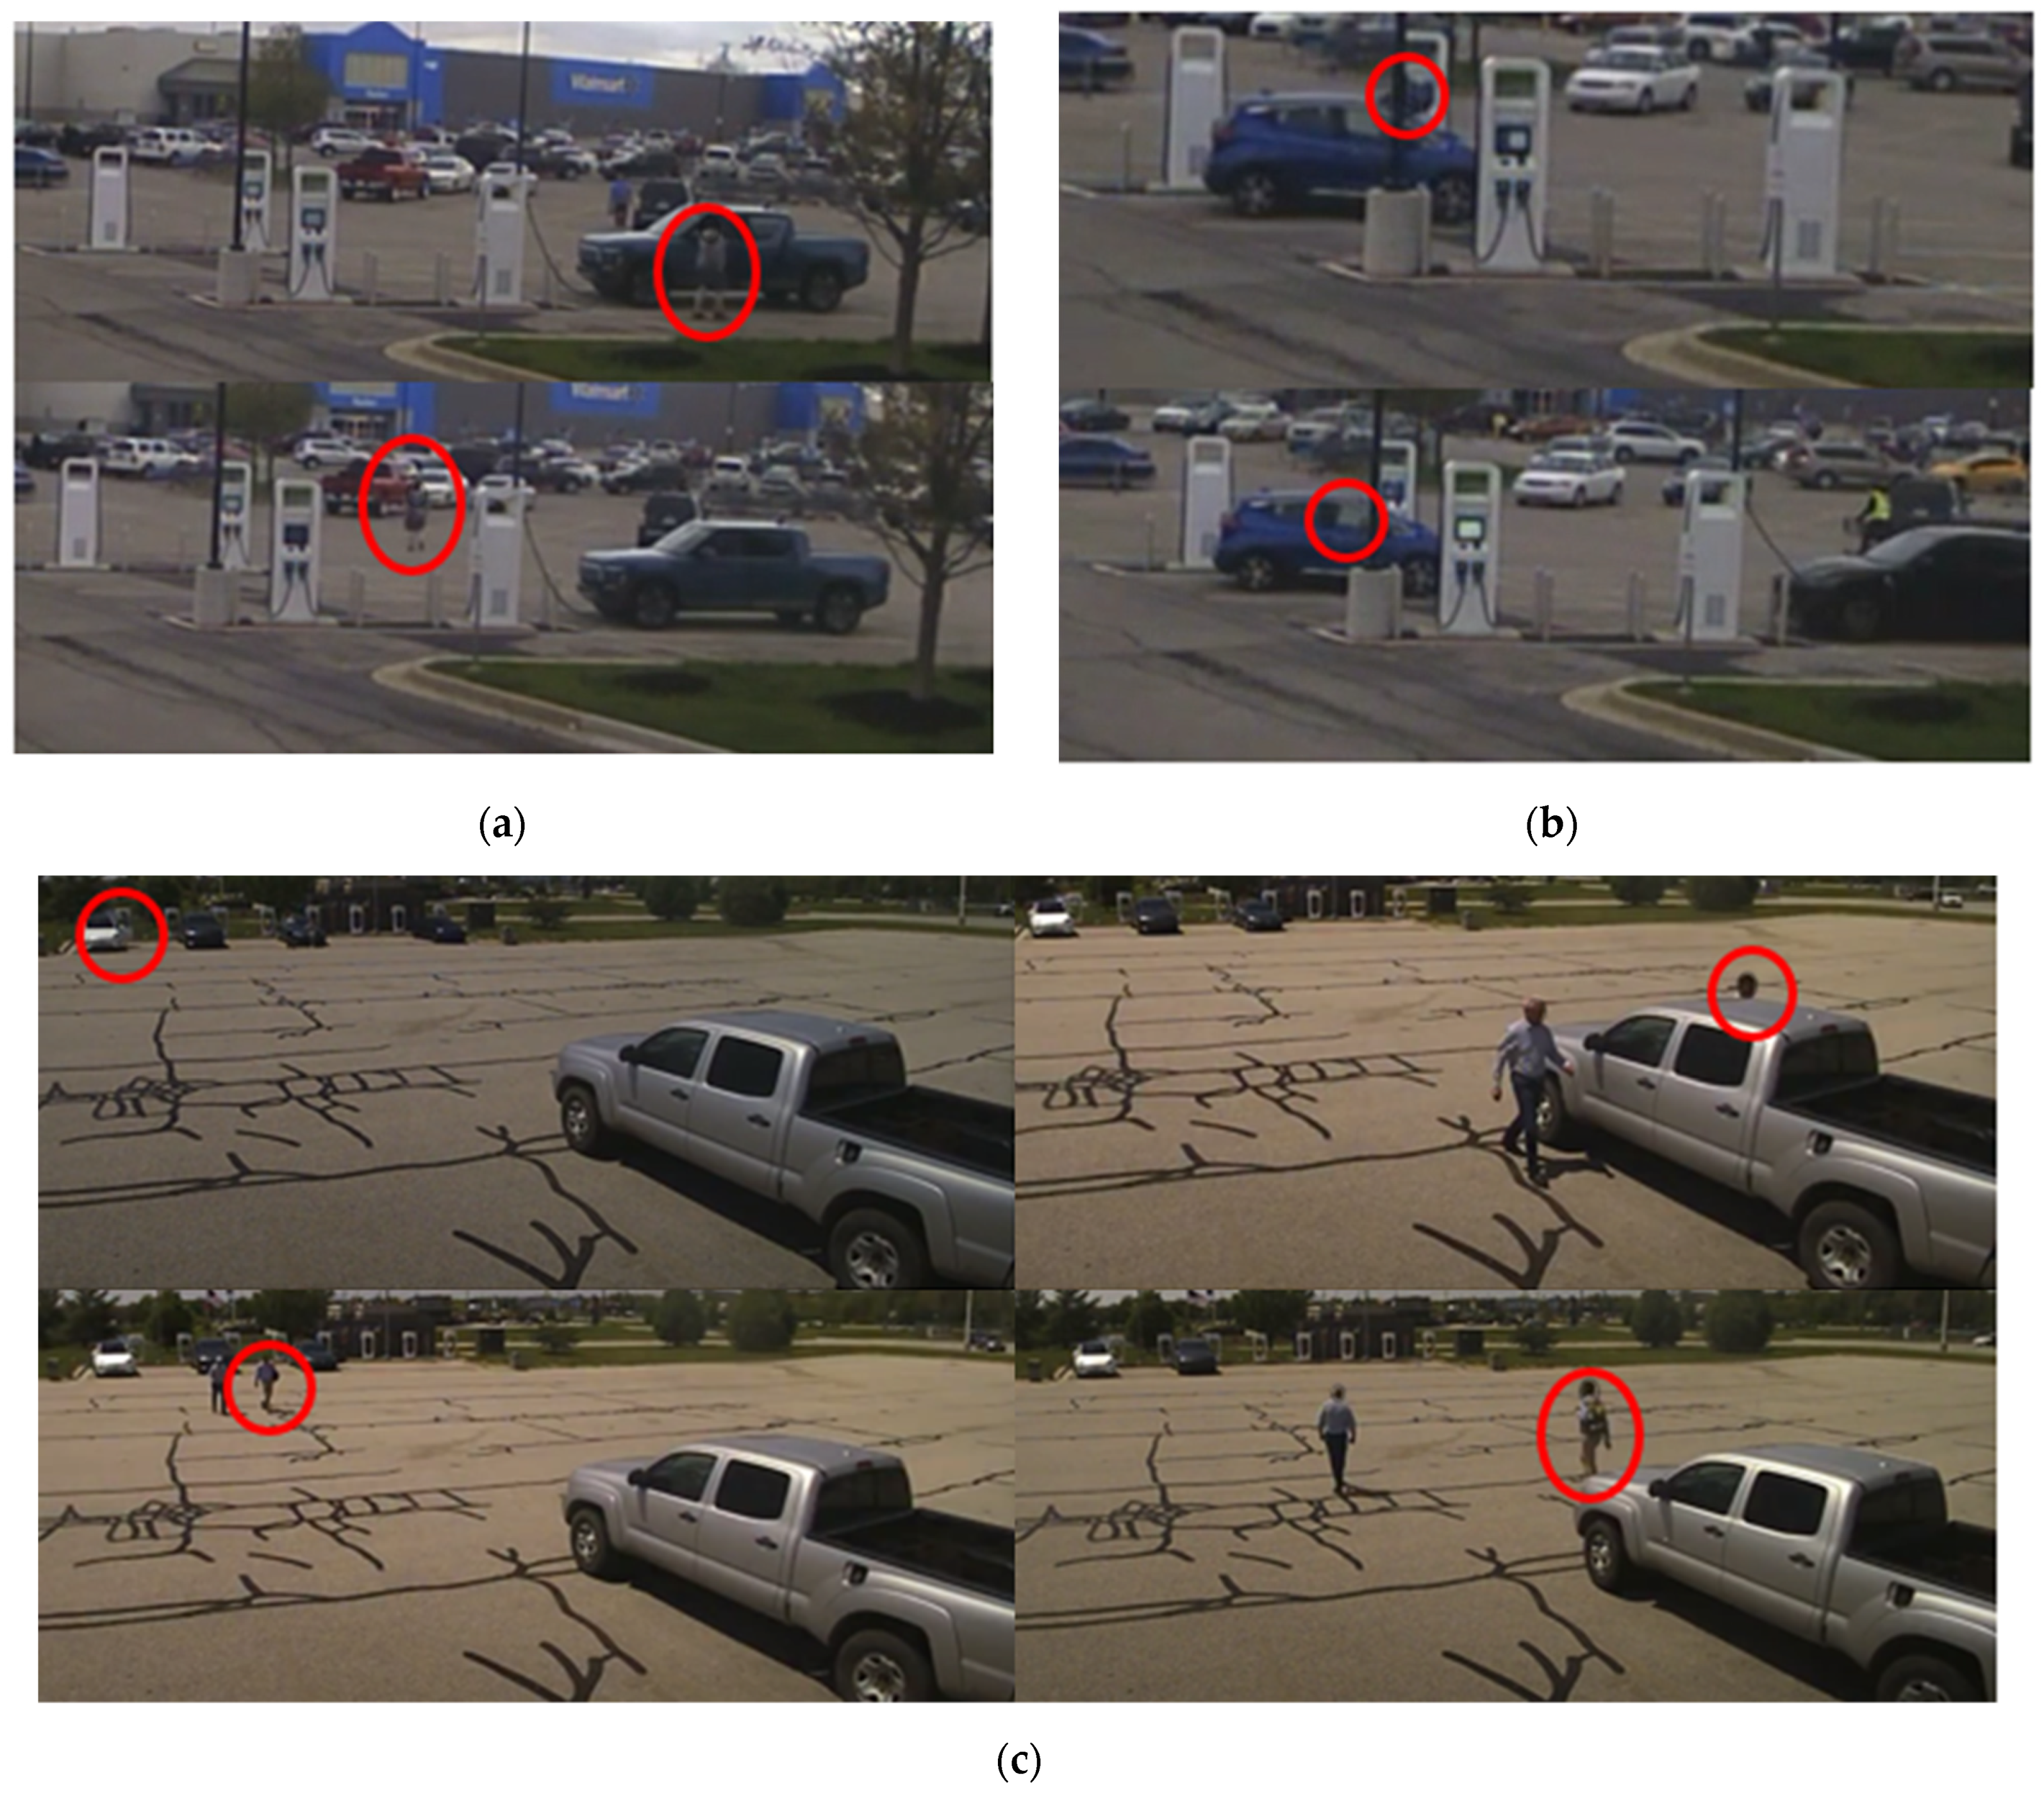
  • Documenting and measuring driver activity during active charging sessions.
The resulting analysis provides a systematic methodology to aid in future infrastructure investment planning, especially as stakeholders look to increase public–private partnerships to grow the national charging network.

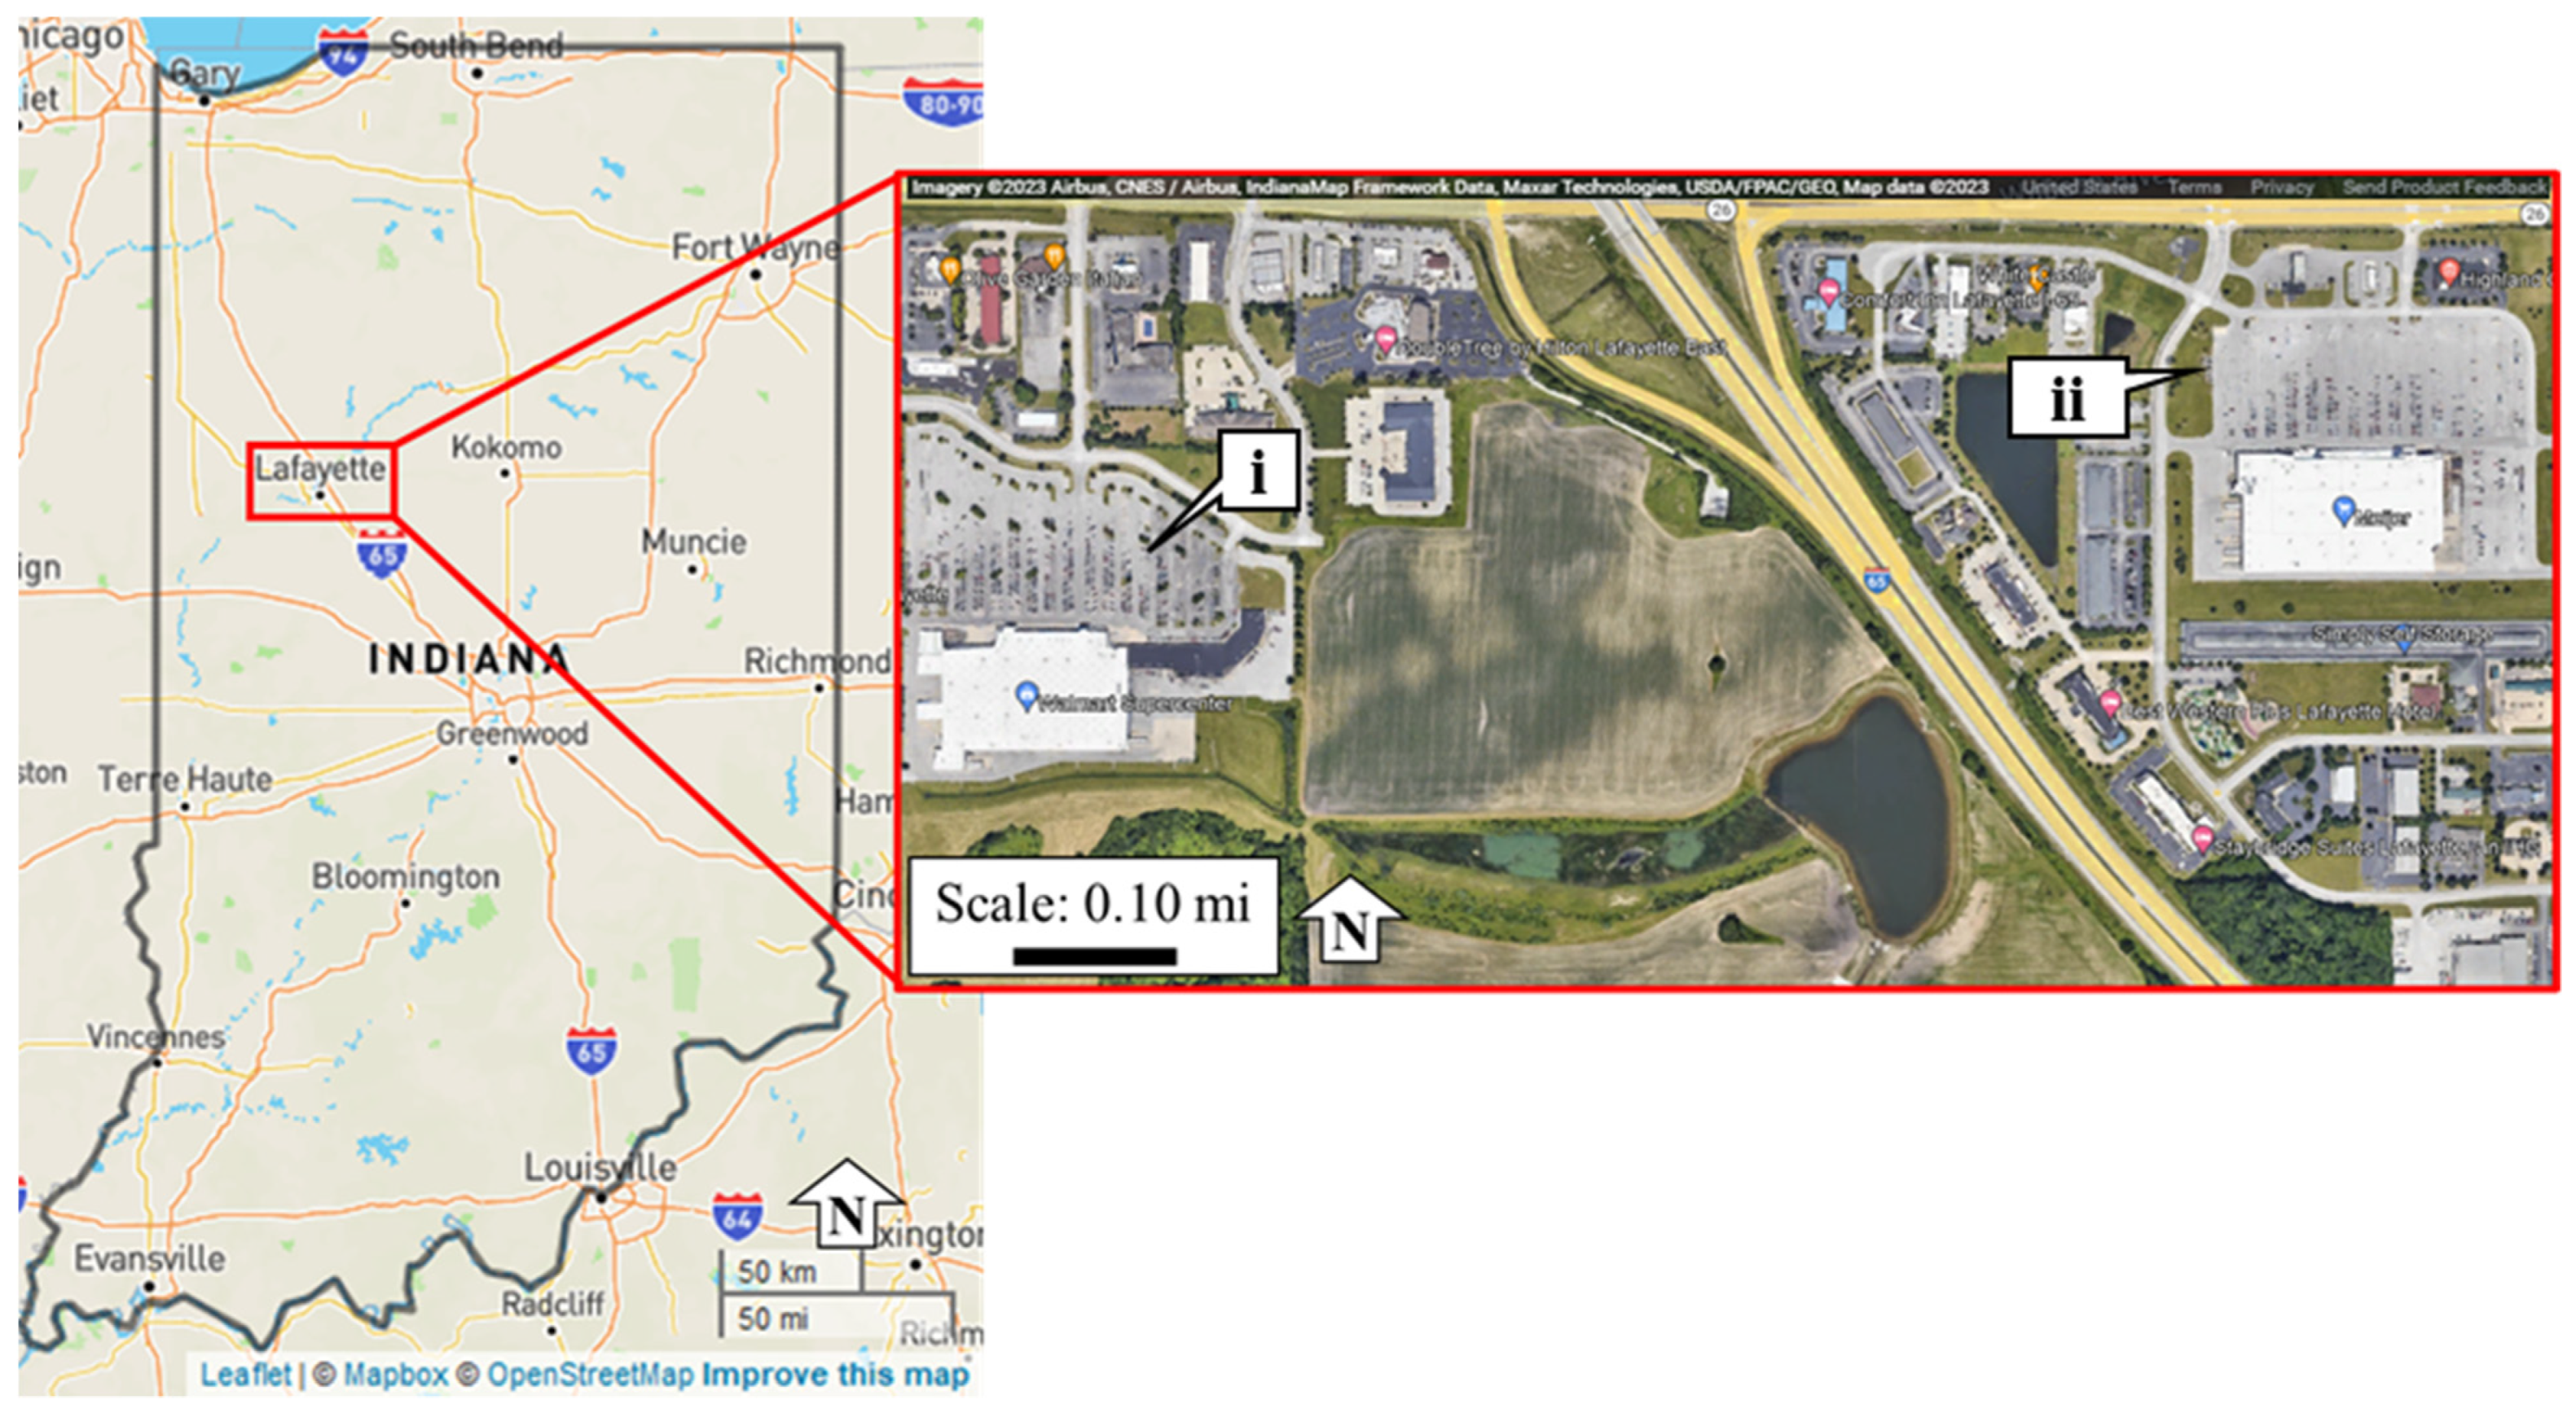
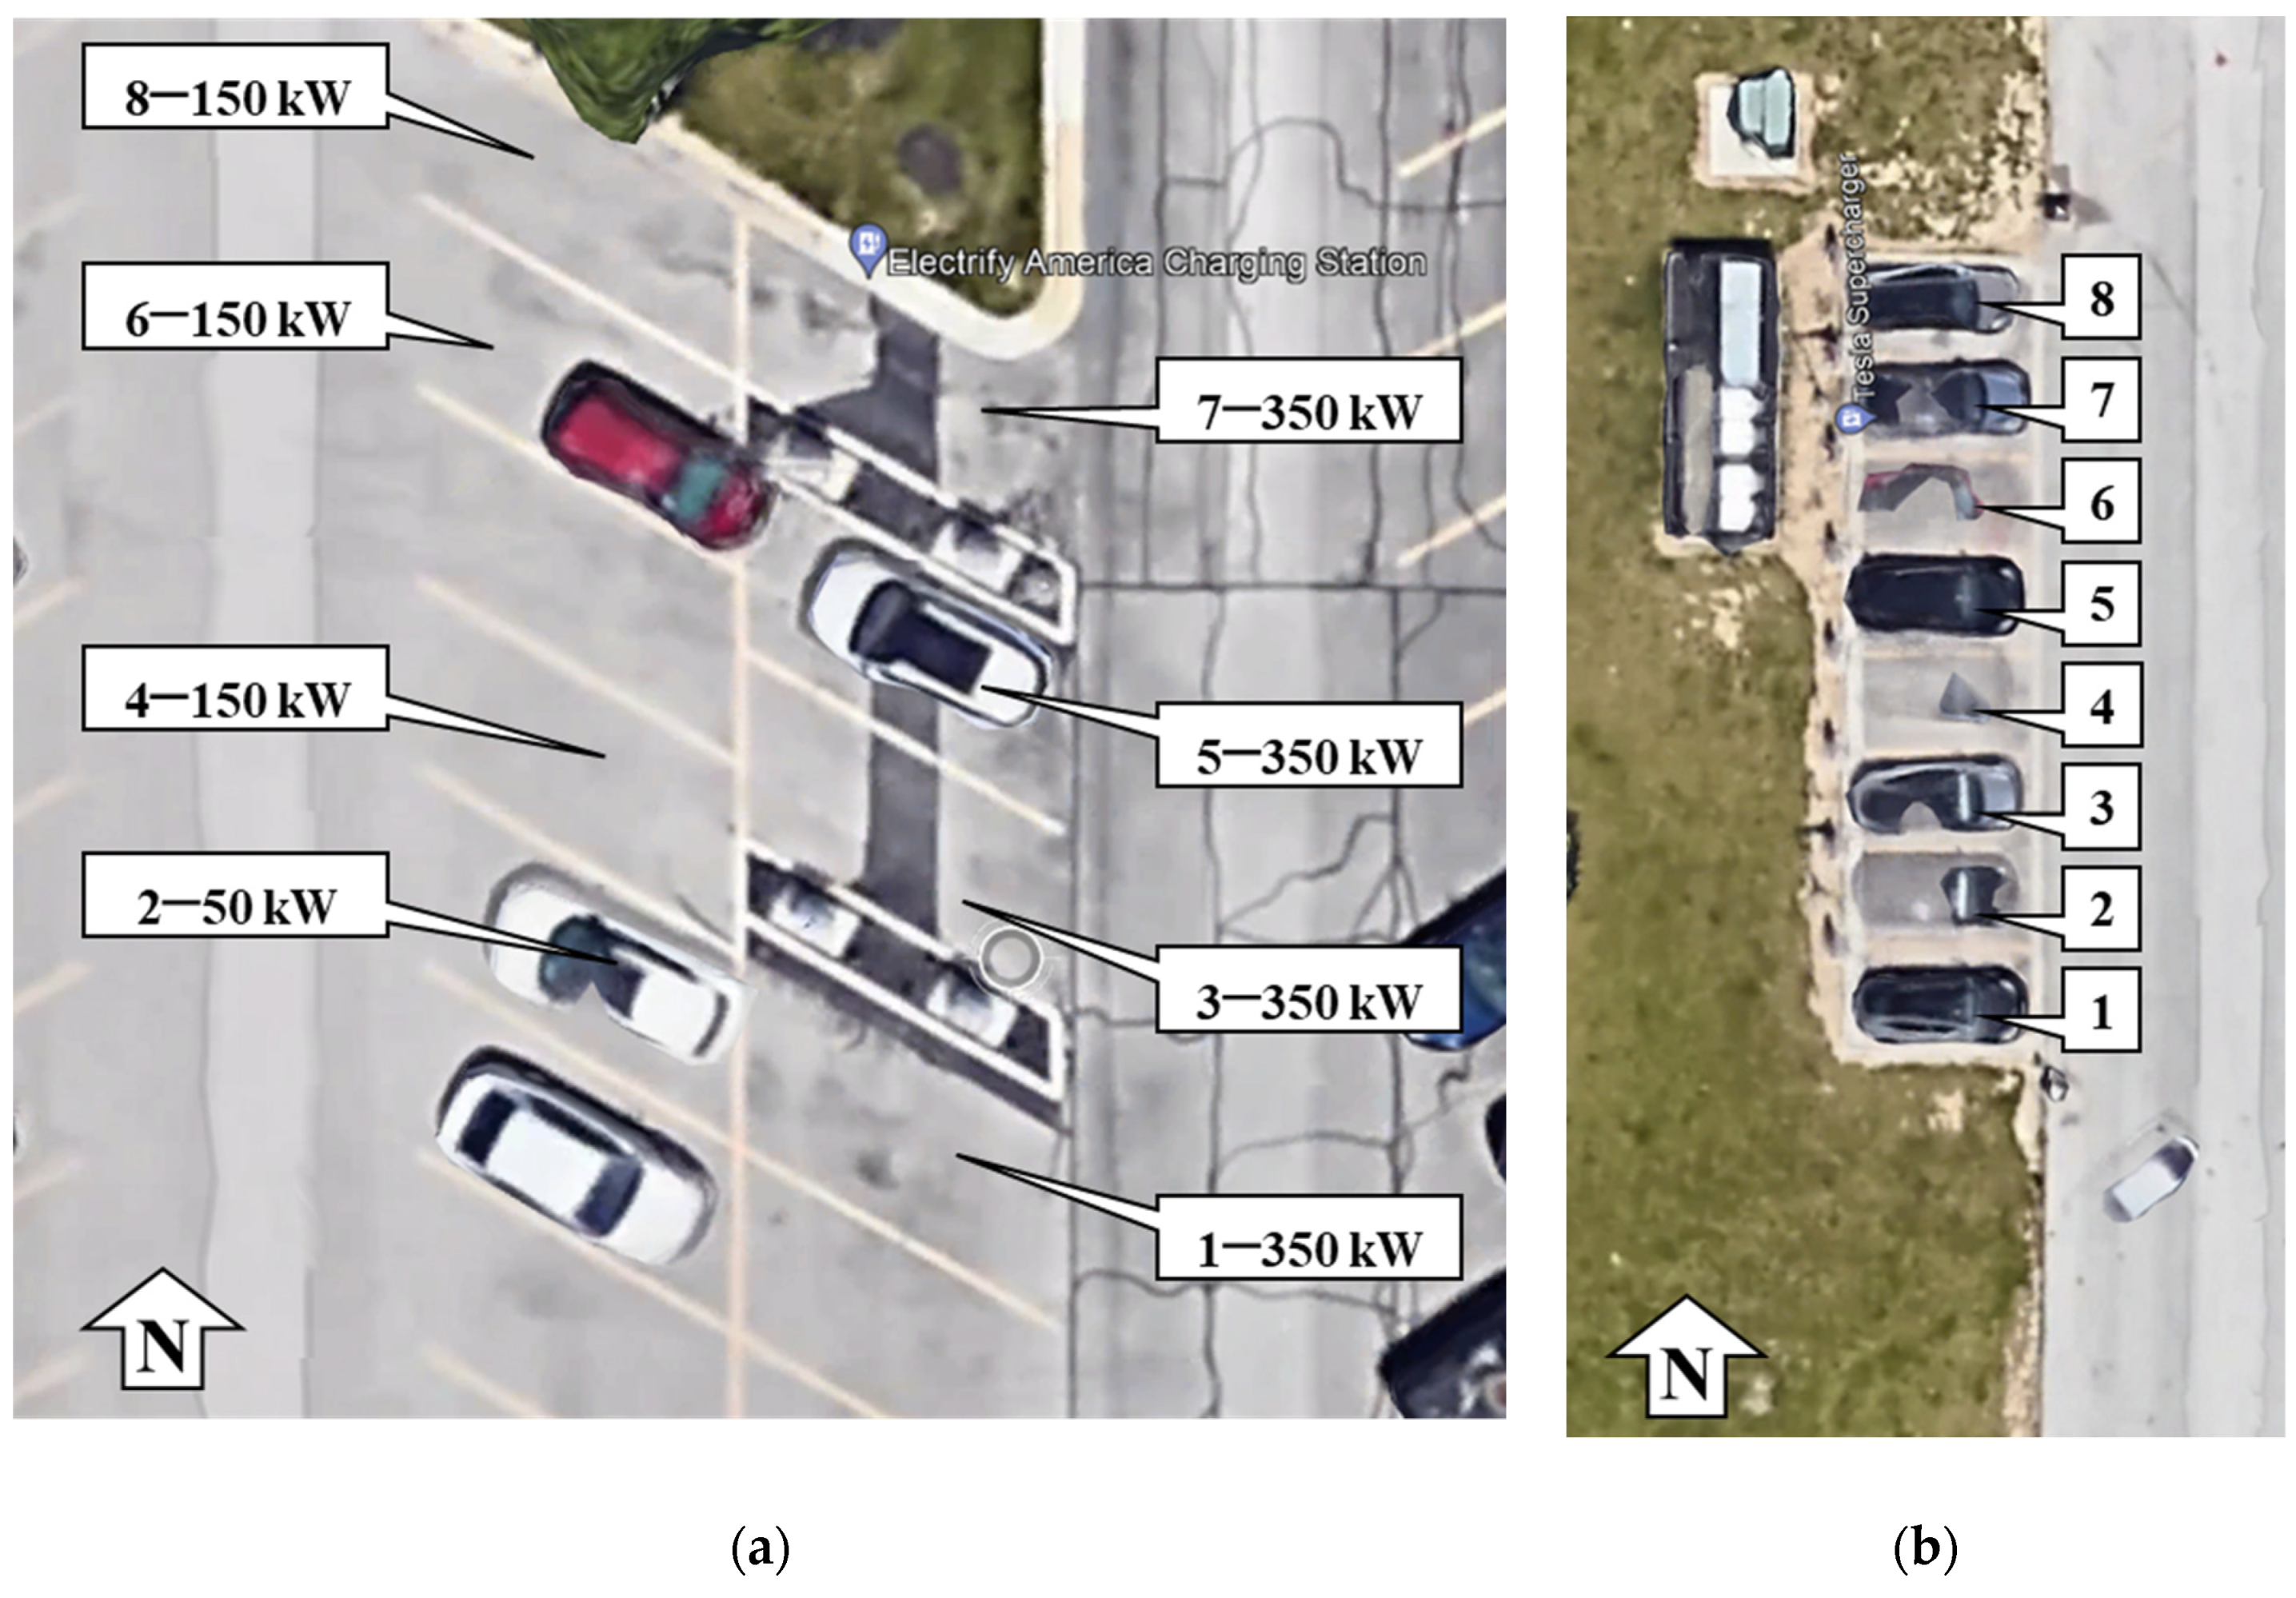
5. Data Collection and Study Location

Two groups of charging stations were analyzed adjacent to I-65, Exit 172, in Lafayette, Indiana. Figure 1 shows the location of the charging stations, with callout i being the Electrify America chargers located in the Walmart parking lot and callout ii being the Tesla chargers located in the Meijer parking lot, both of which have equal access to the on/off ramps of the interstate and are both retail supercenters.
Figure 2 shows the charging stations at each location and the respective numbers referenced during the analysis. There are a total of eight charging stations at each location. Figure 2a shows the Electrify America charging station numbering and the respective charging output, as there were three types of chargers at this location: 50, 150, and 350 kW. The Tesla charging stations all had the same output of 150 kW, as shown in Figure 2b.

6. Overview of Methodology

Data collection was accomplished using a timelapse camera positioned near the charging stations for the months of May, June, and a few days in July, including 1–5 July 2022. The camera used has a 118-degree field of view, captured images in HD 1080P, and collected still images every 10 s, which had a date and time printed on the photo. For this study, permissions were acquired from both parking lot owners to collect the data, and there was signage around the parking lot stating, “cameras in use”. For the purposes of this study, all still images were analyzed and used to determine where and when users were charging. One focus of the study was the activities performed by drivers while their vehicles were charging. Additional attributes gathered from the video footage include start charge time, end charge time, and station number. Selected examples of collected still images can be observed in Figure 3. Overall driver activity was classified into six unique activities, including traveling to local shops, which encompasses supermarkets, fast food, and retail centers (Figure 3a), waiting in the vehicle (Figure 3b), a combination of both traveling to shops and waiting in the vehicle, leaving the premises, which is defined as leaving the camera view in a vehicle other than the one they are charging in (Figure 3c), walking their pets, and an unknown category when it was difficult to determine what the driver was doing. The dataset provides an opportunity for agencies to validate station utilization and inform station installation based on actual driver usage and activities.

7. Results and Discussion

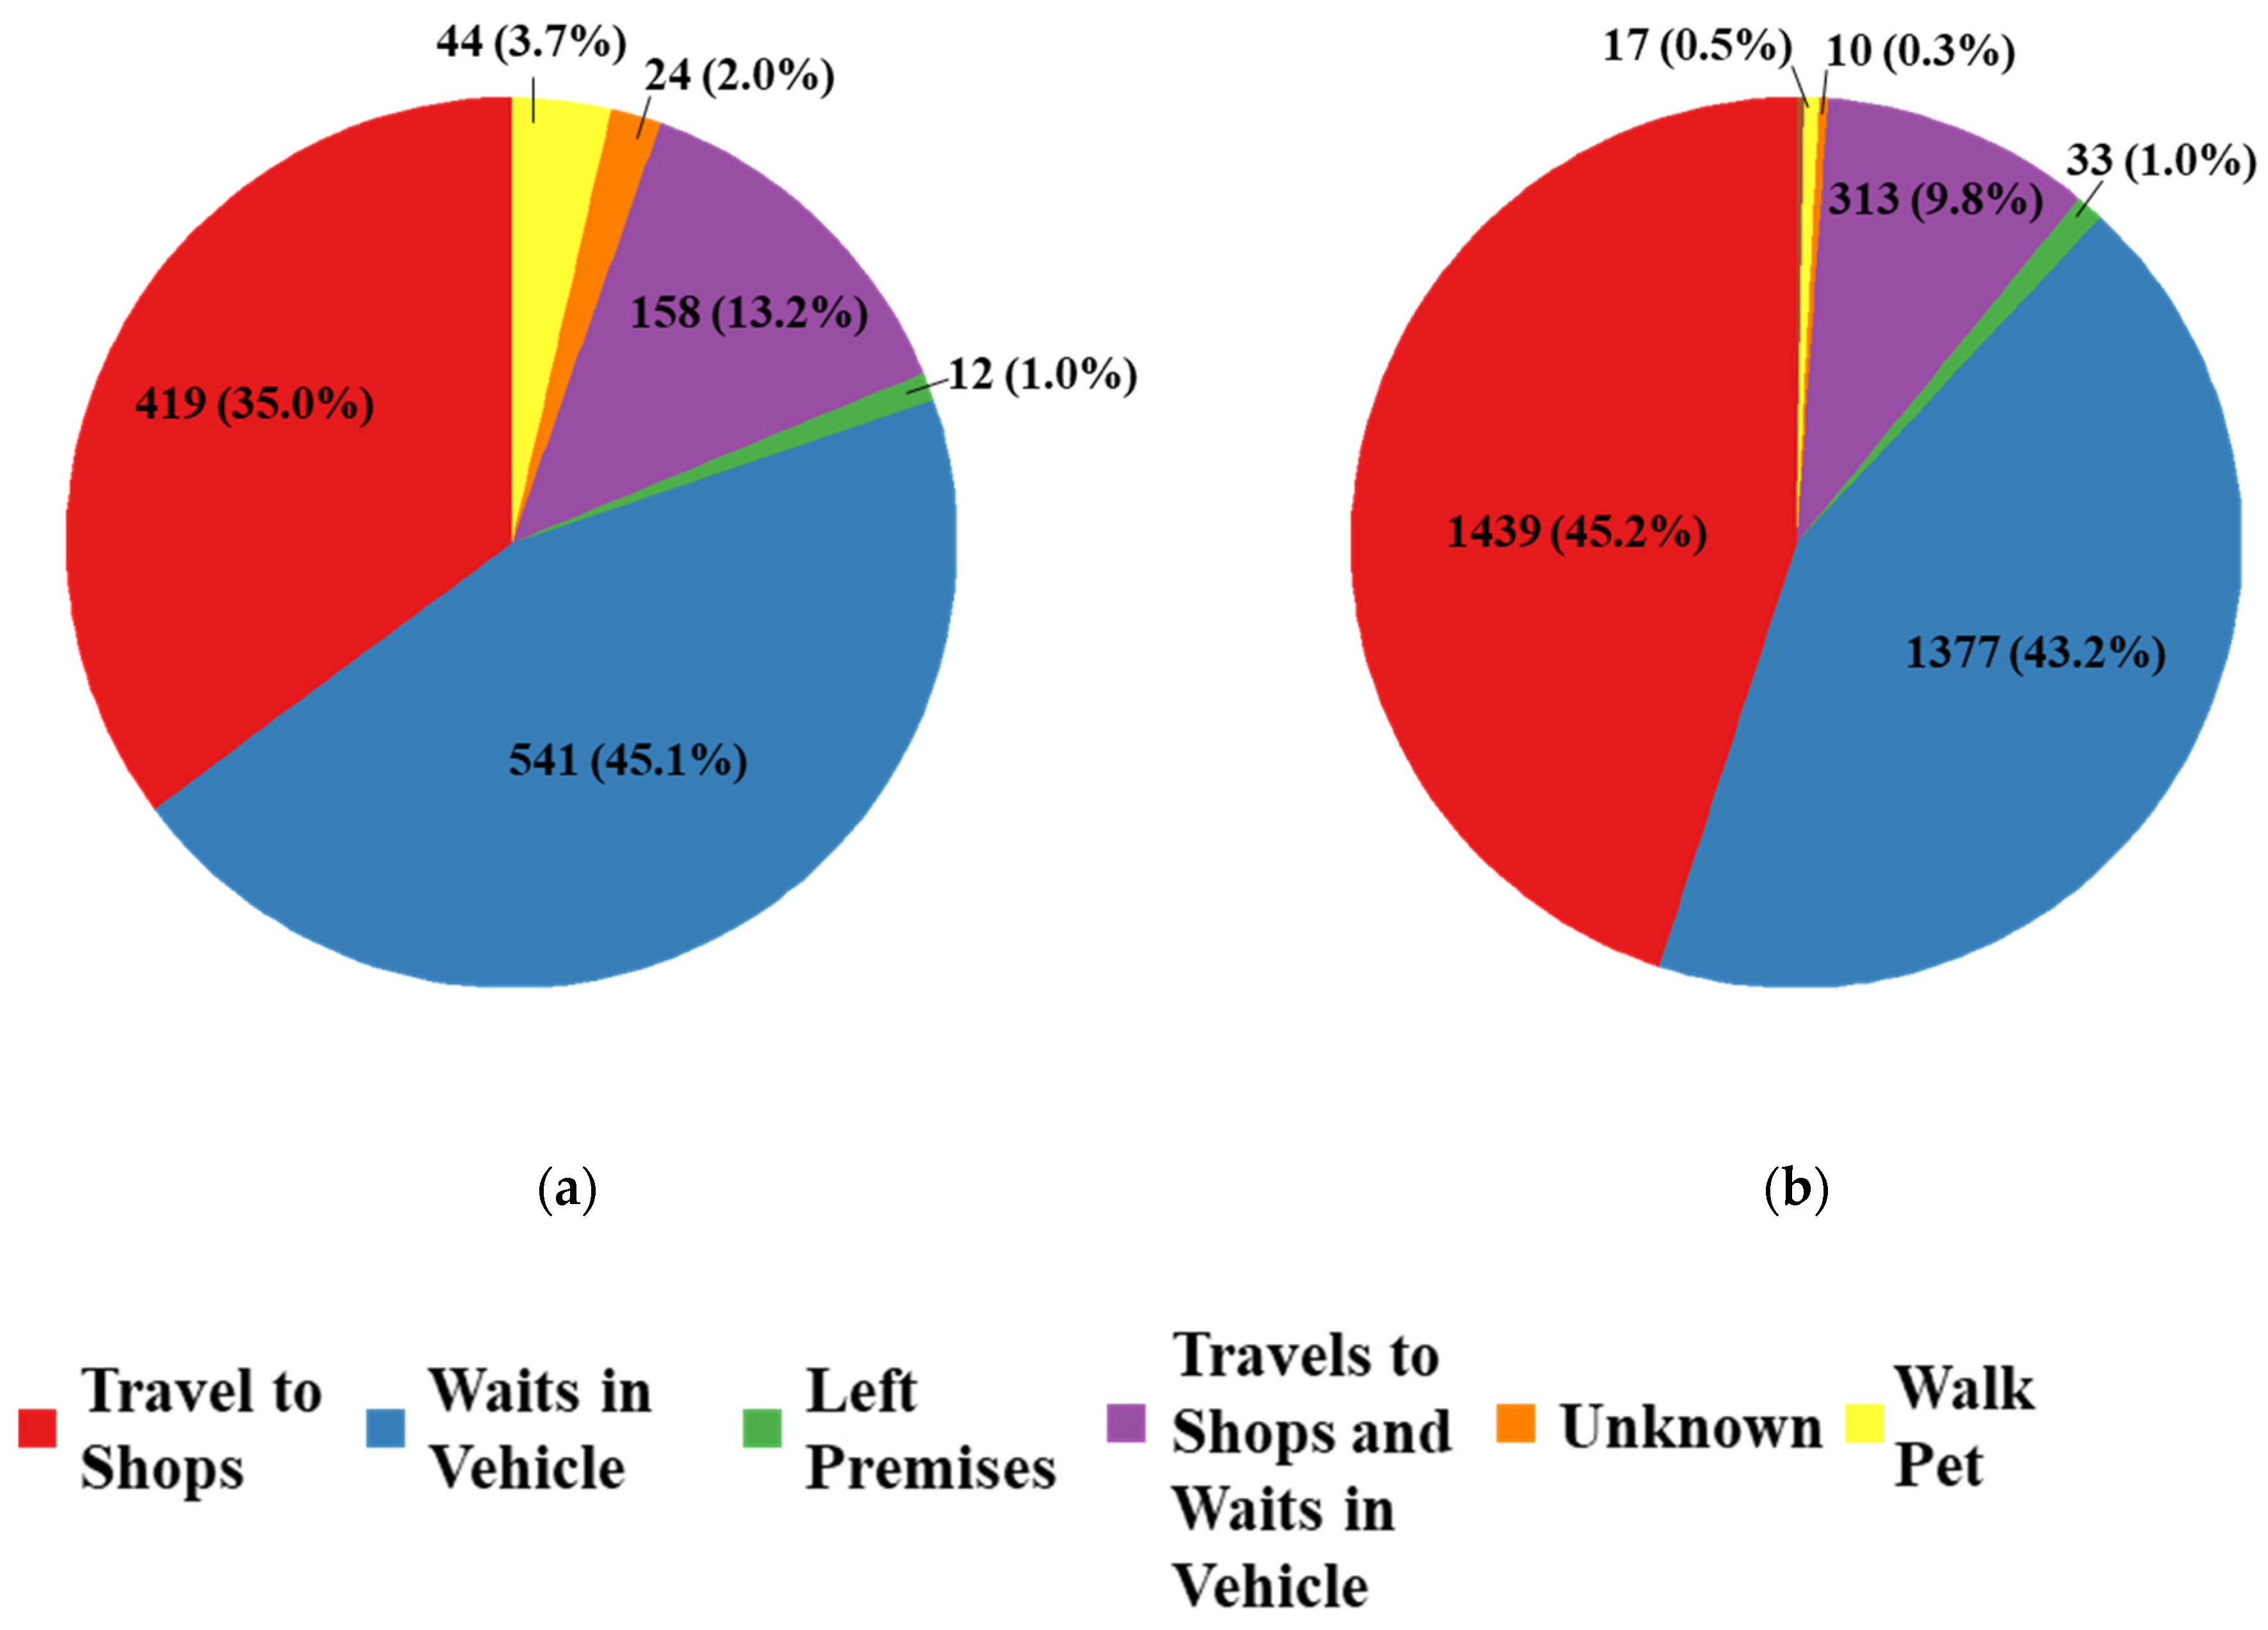
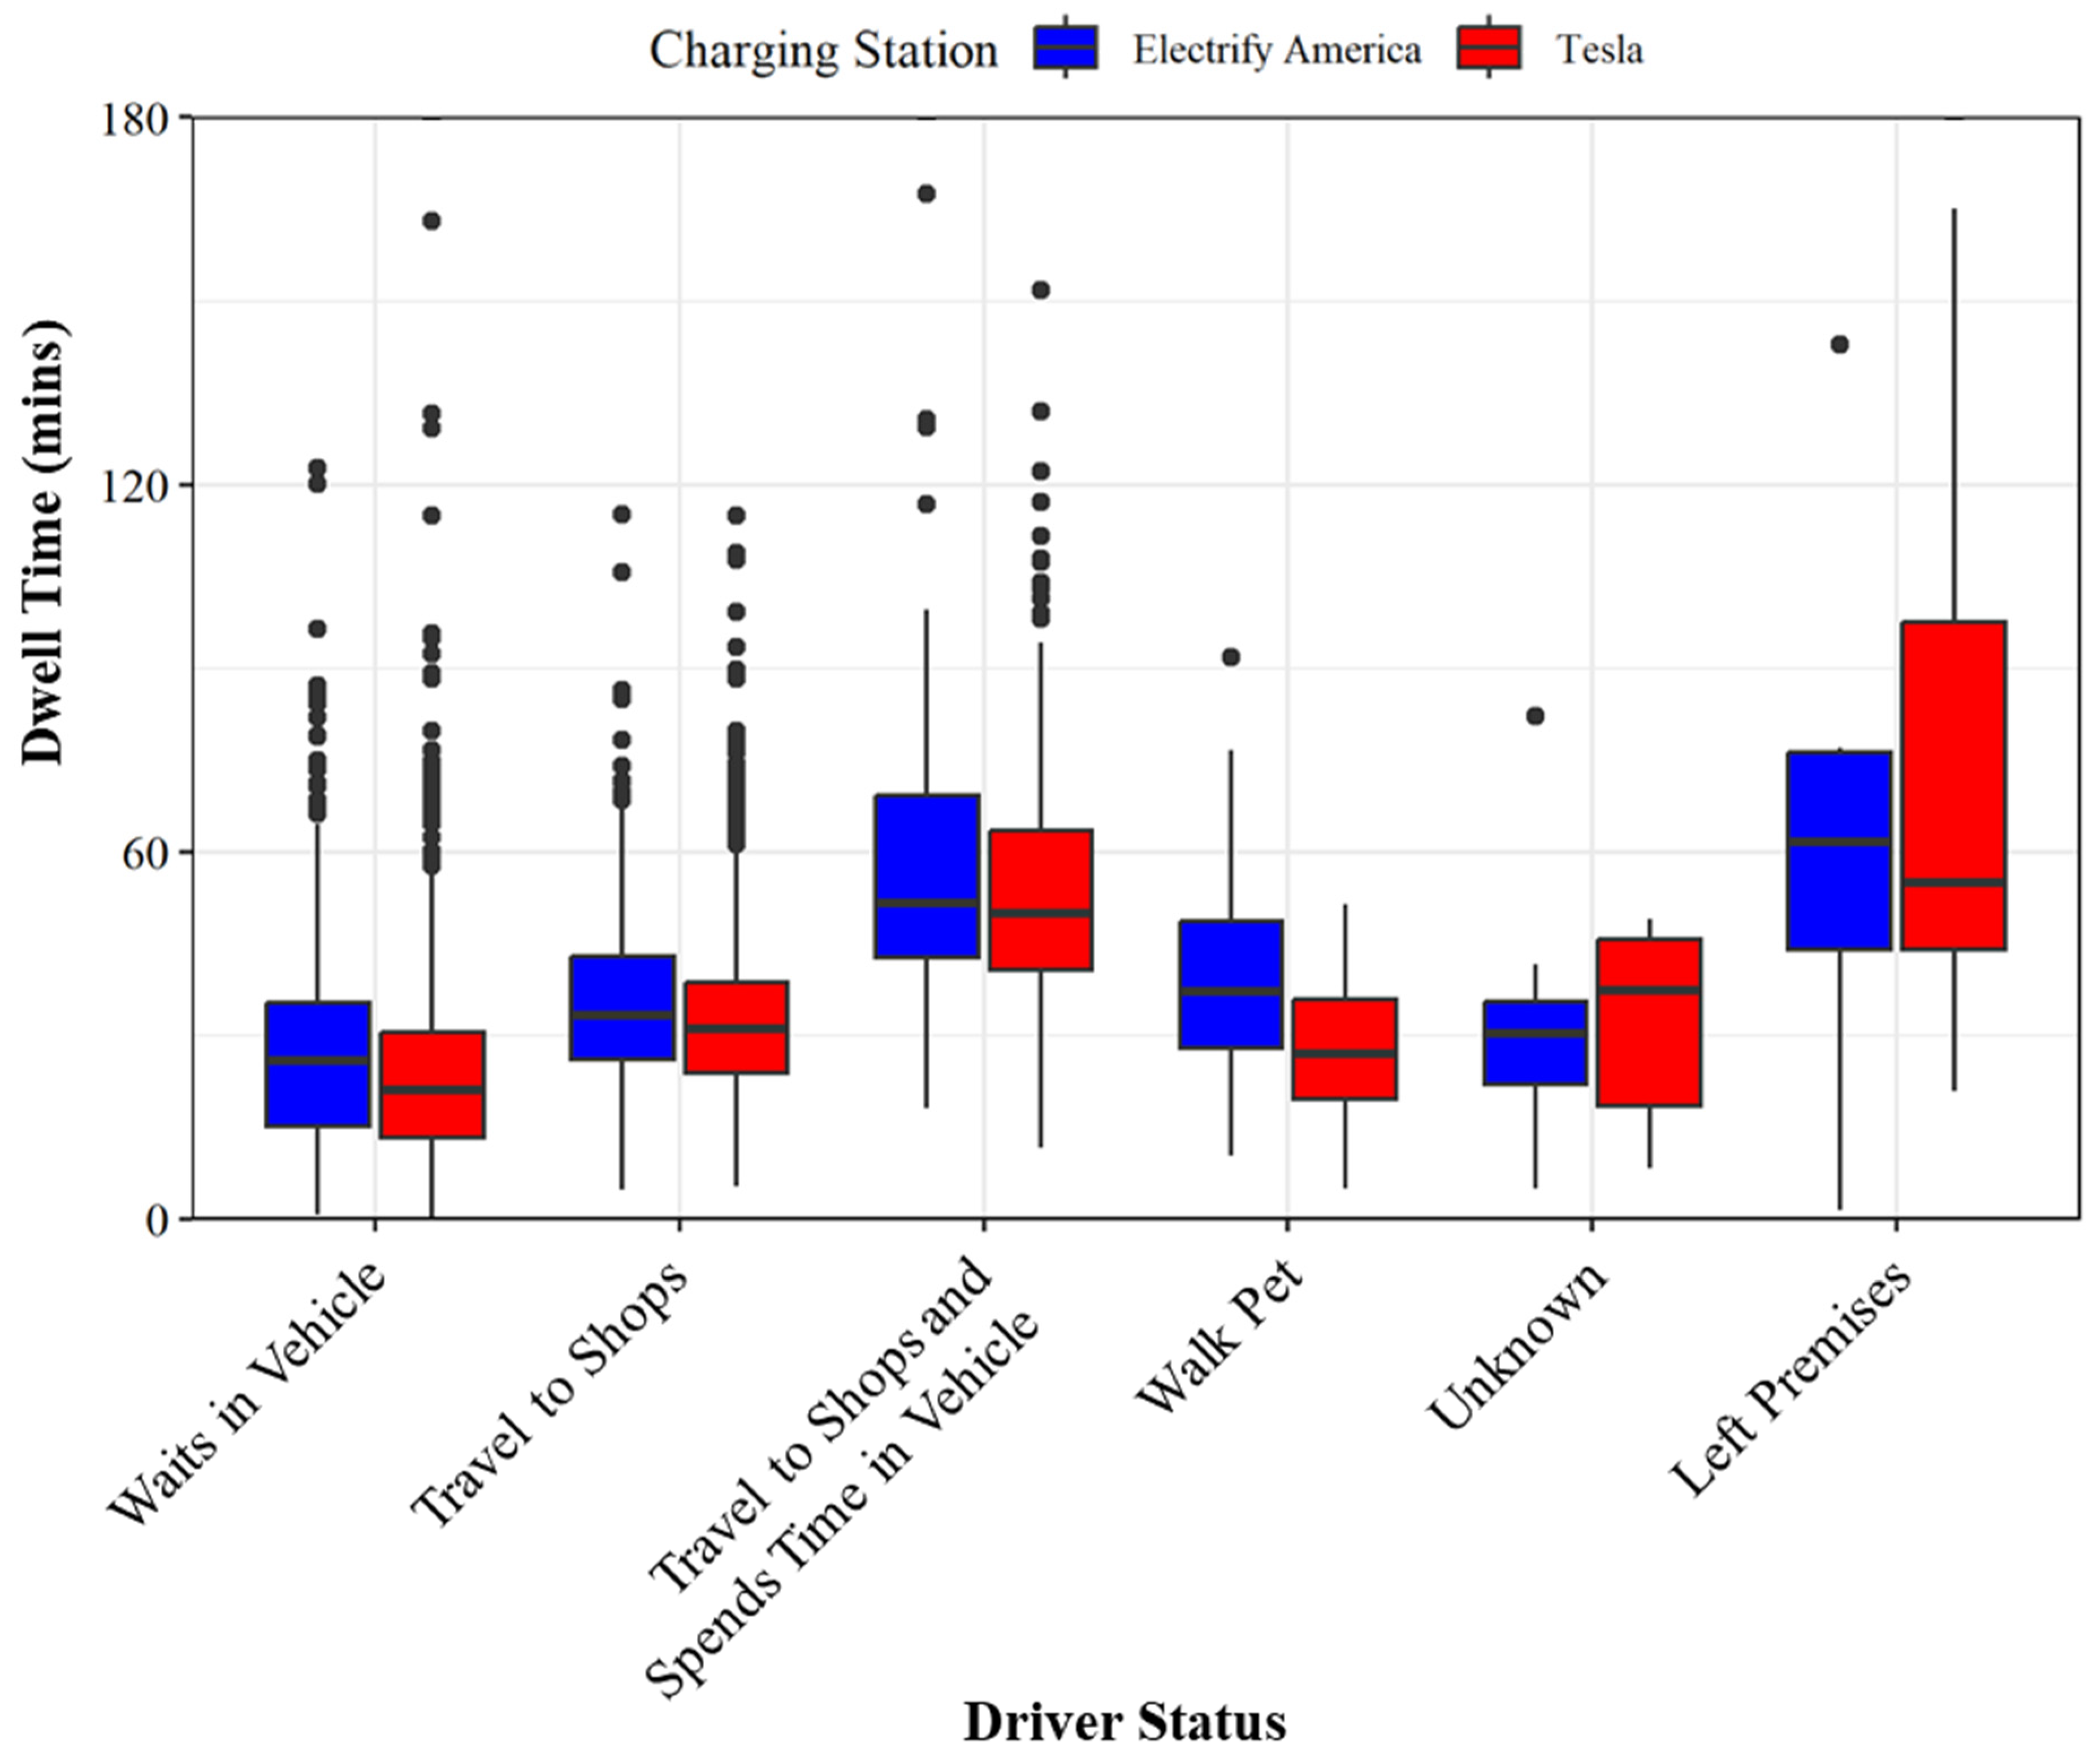
7.1. Analysis of Driver Activity While Charging

This study looked at over 4000 charging sessions at both Electrify America and Tesla charging stations. Figure 4 shows the distribution of driver activities by charging station. Figure 4a shows Electrify America chargers, where 45% of drivers were observed to be waiting in the vehicle while 35% of drivers would travel to local shops. Figure 4b shows the distribution of driver activities for Tesla chargers. Similar proportions can be observed, with 43% of drivers waiting in their vehicles and 45% traveling to local shops while their vehicles charge. The information is summarized in Table 1. Of particular note is that the Tesla chargers observed over three times the number of charging sessions as the Electrify America chargers, but the distribution of driver activities was quite similar.
Documenting driver activity while their vehicle is charging provides insights on what adjacent facilities/resources or points of interest might be important when considering future charging station placement. In general, over 43% of drivers stay in their vehicle while charging, suggesting the location of the station adjacent to high-volume traffic corridors is an important consideration. Approximately 42% of drivers traveling to local businesses implies agencies should consider station location near other attractions, groceries, restaurants, or short-term activities.
Although the distribution of drivers waiting in their vehicles is similar to that of those traveling to shops, the length of dwell time is impacted by the driver’s activity while charging. For the analysis presented in this study, dwell time refers to the total time duration for which a vehicle occupies a charging station spot. This is especially important in the context of rising EV adoption, as more and more charging station providers are billing customers for excess time spent at a charging station even after a vehicle is charged. Figure 5 shows the distribution of dwell times by driver activity. Drivers who travel to shops while charging dwell 8–10 min longer than those who wait in their vehicle. Drivers who travel to local shops and wait in their vehicles on average dwell at charging stations 30 min longer than those who only wait in their vehicles. Drivers who walk their pets tend to dwell at charge stations as long as those who travel to shops. Lastly, people who are leaving the premises have a large variation in dwell time, but dwell times were observed to be at least 30 min longer on average than those who wait in their vehicle.
This study is limited to capturing video footage of vehicles/drivers and could benefit from having vehicle characteristics such as state of charge or driver preference for their activity. If the state of charge of the vehicle was known for each user, a statistical analysis could be performed to see the correlation between the state of charge and driver activity while charging. Additionally, if drivers provided input into their activity while charging, it could aid in determining the activity they plan to do based on the charge time or the available chargers at each location. Furthermore, the activities performed by drivers at these locations may vary based on nearby service options, including food, stores, and entertainment. Expanding this study to more locations will benefit the EVSE community and EV drivers. Overall, the study provides value to stakeholders as well as charging providers that seek to balance reducing range anxiety and charging station utilization. Although these techniques are labor-intensive, they can be implemented immediately. Longer term, a combination of camera analytics, charging station data, connected vehicle data, and perhaps cell phone data will be important data sets, but those data sets are not readily available. A brief summary of these opportunities is provided below:
  • Ahmad et al. utilized smartphone data to identify the driver and passengers of a vehicle. This analysis combined cell phone inertial measurements and GPS to determine the person’s entry location in the vehicle and classify them as a driver or passenger, which would aid in determining if a user remained in their vehicle or traveled to shops during their charging session [33]. They can also reduce processing and increase accuracy by incorporating vehicle data or door signals/activations.
  • Connected vehicles currently provide information on GPS location, speed, heading, and other information to assess traffic signal performance [34], roadway mobility [35], and more recently have explored providing additional attributes for agency tracking, including lane keep assist data for pavement marking evaluation [36], and wheel sensor and drive train information for pavement quality [37]. This data can be used to provide insights on driver activity while charging through production vehicle sensors. Using CV data, such as air bag seat sensors, can help determine if the driver waits in their vehicle while charging or if they perform an activity outside of the vehicle [38,39].
  • Finally, video analytics may provide a reasonable substitute for manually observing the images. Fixed cameras are currently used by transportation agencies and research to aid in vehicle detection for counting, tracking, and understanding activity [40]. Further AI developments have helped detect pedestrians to determine pedestrian/vehicle conflicts [41], tracking [42], and distances between identified objects in video [43]. This tracking of objects in video has been expanded through AI solutions to aid in multi-camera tracking of vehicles, which, upon further development, can aid in the classification of driver activity at EV chargers [44].
Using any one of the methods or a combination of all would provide a scalable approach to determining driver activity while charging.

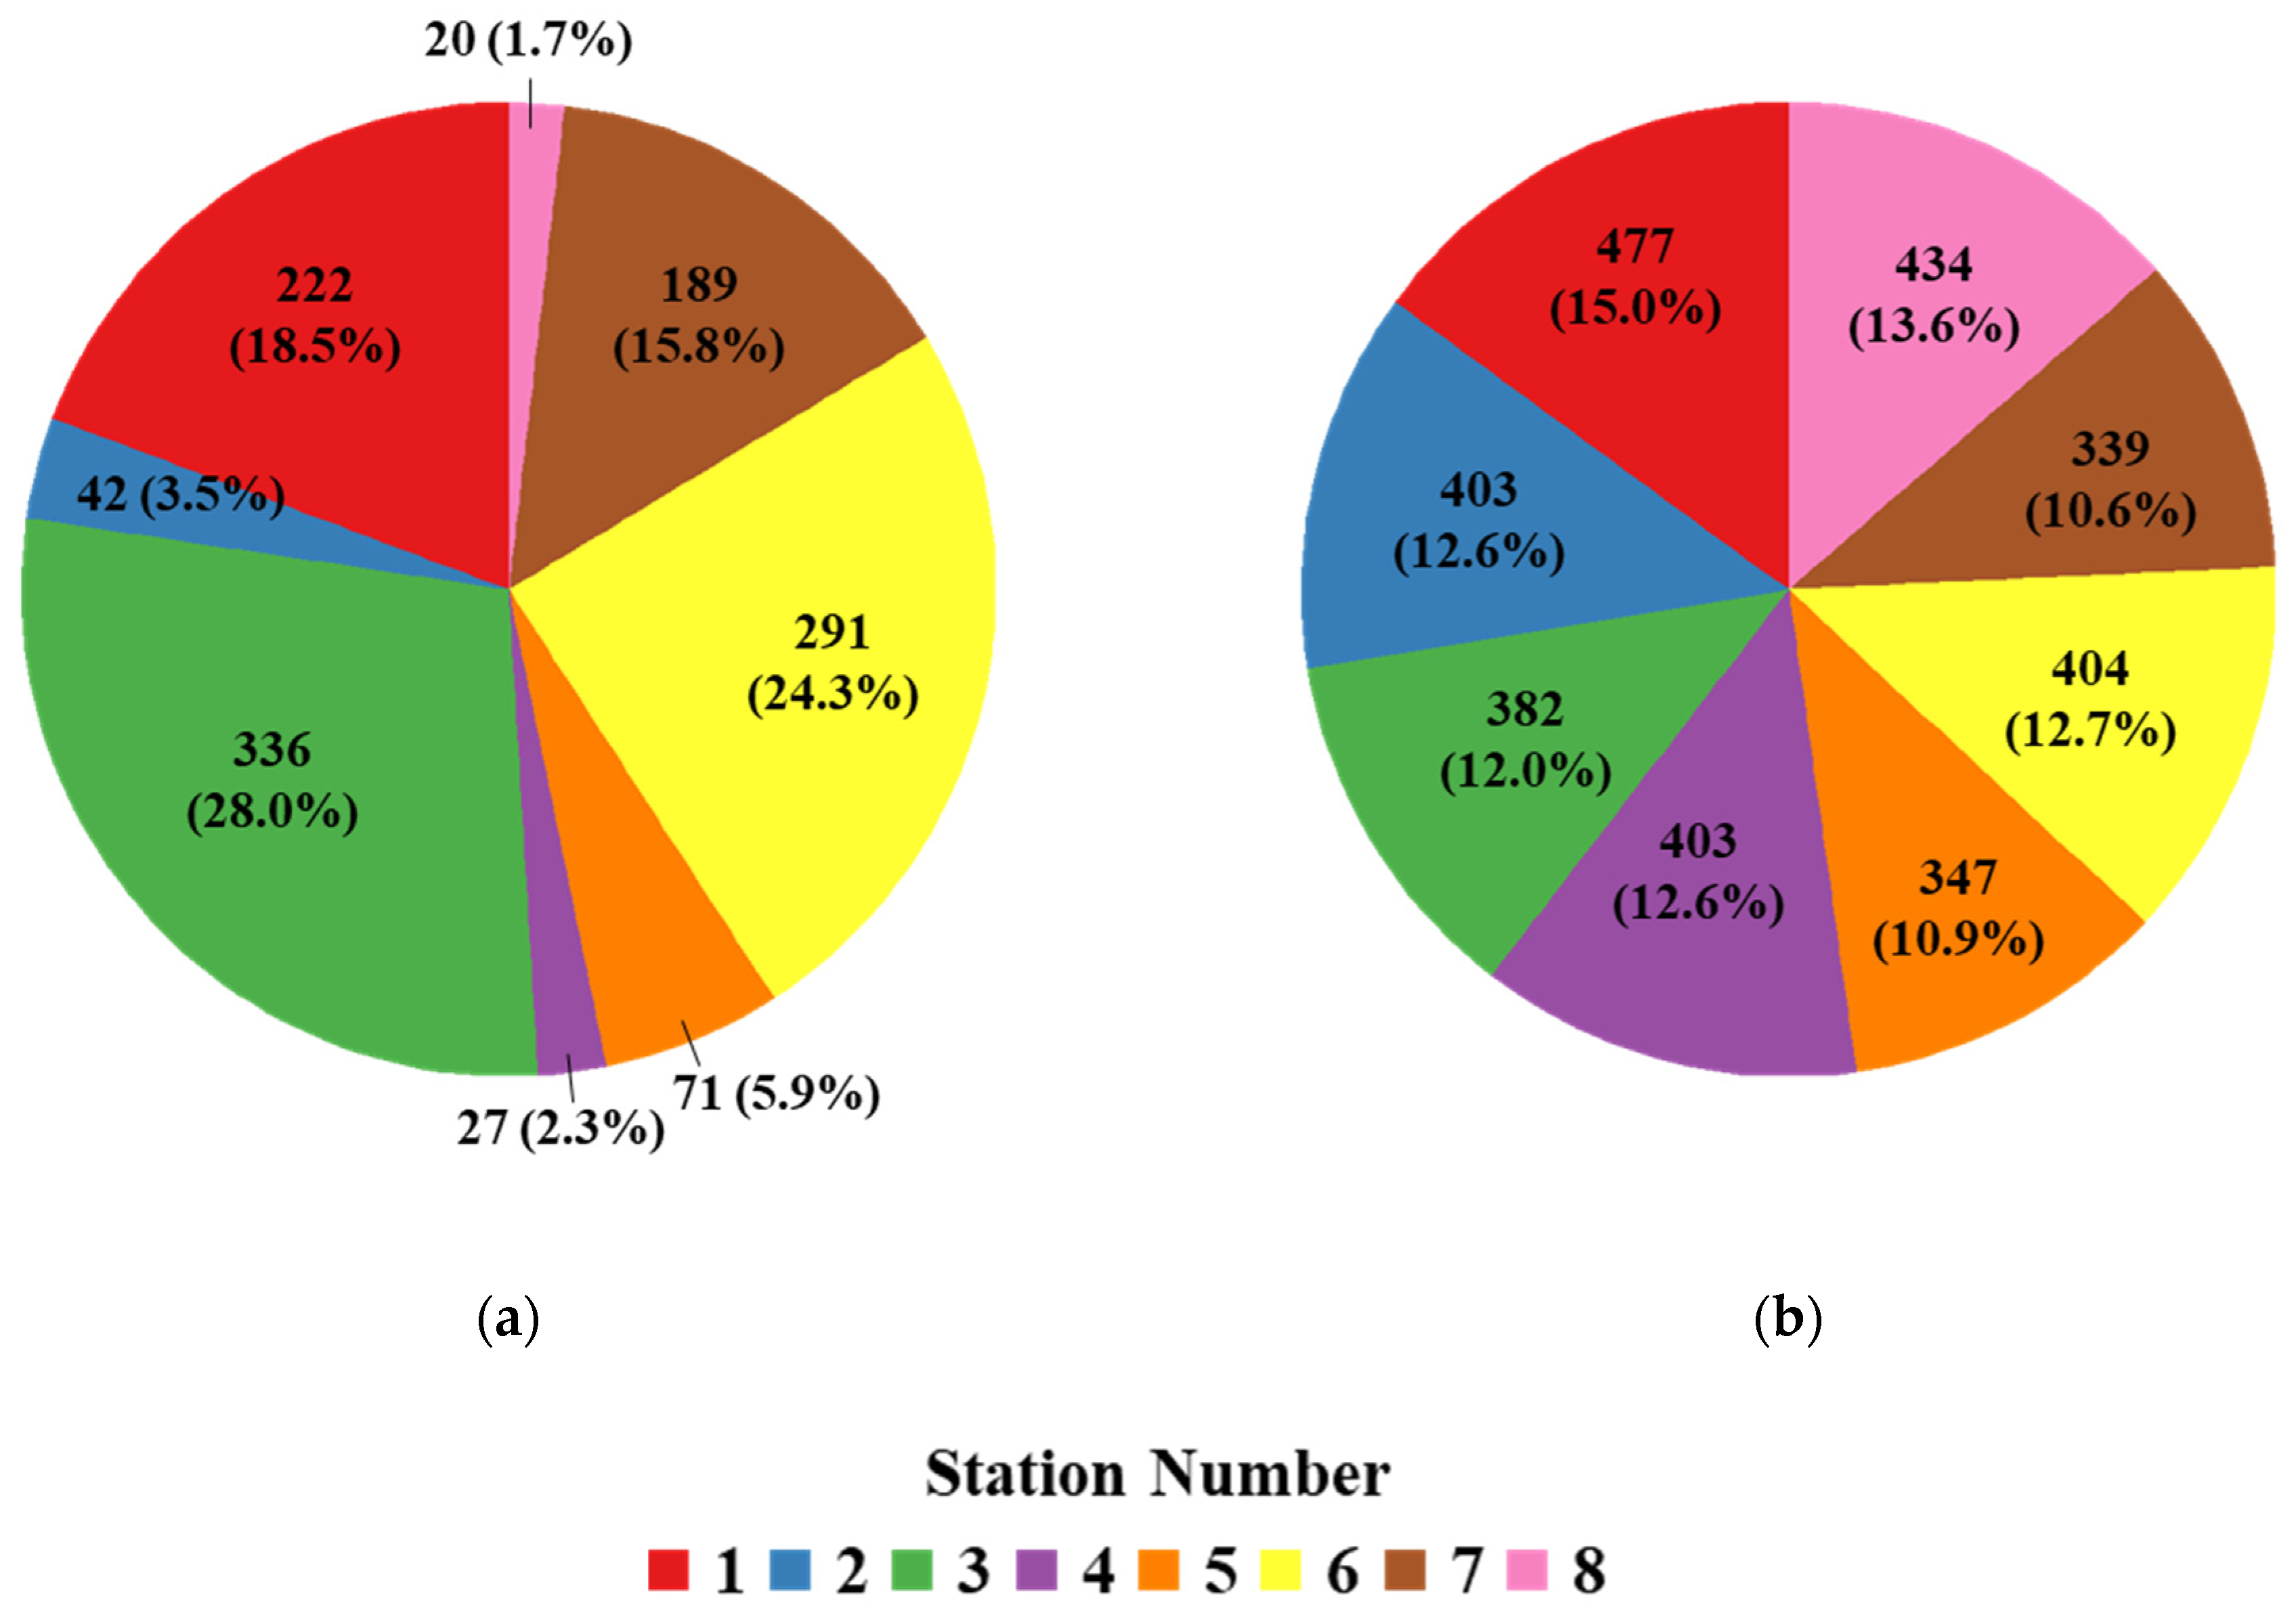
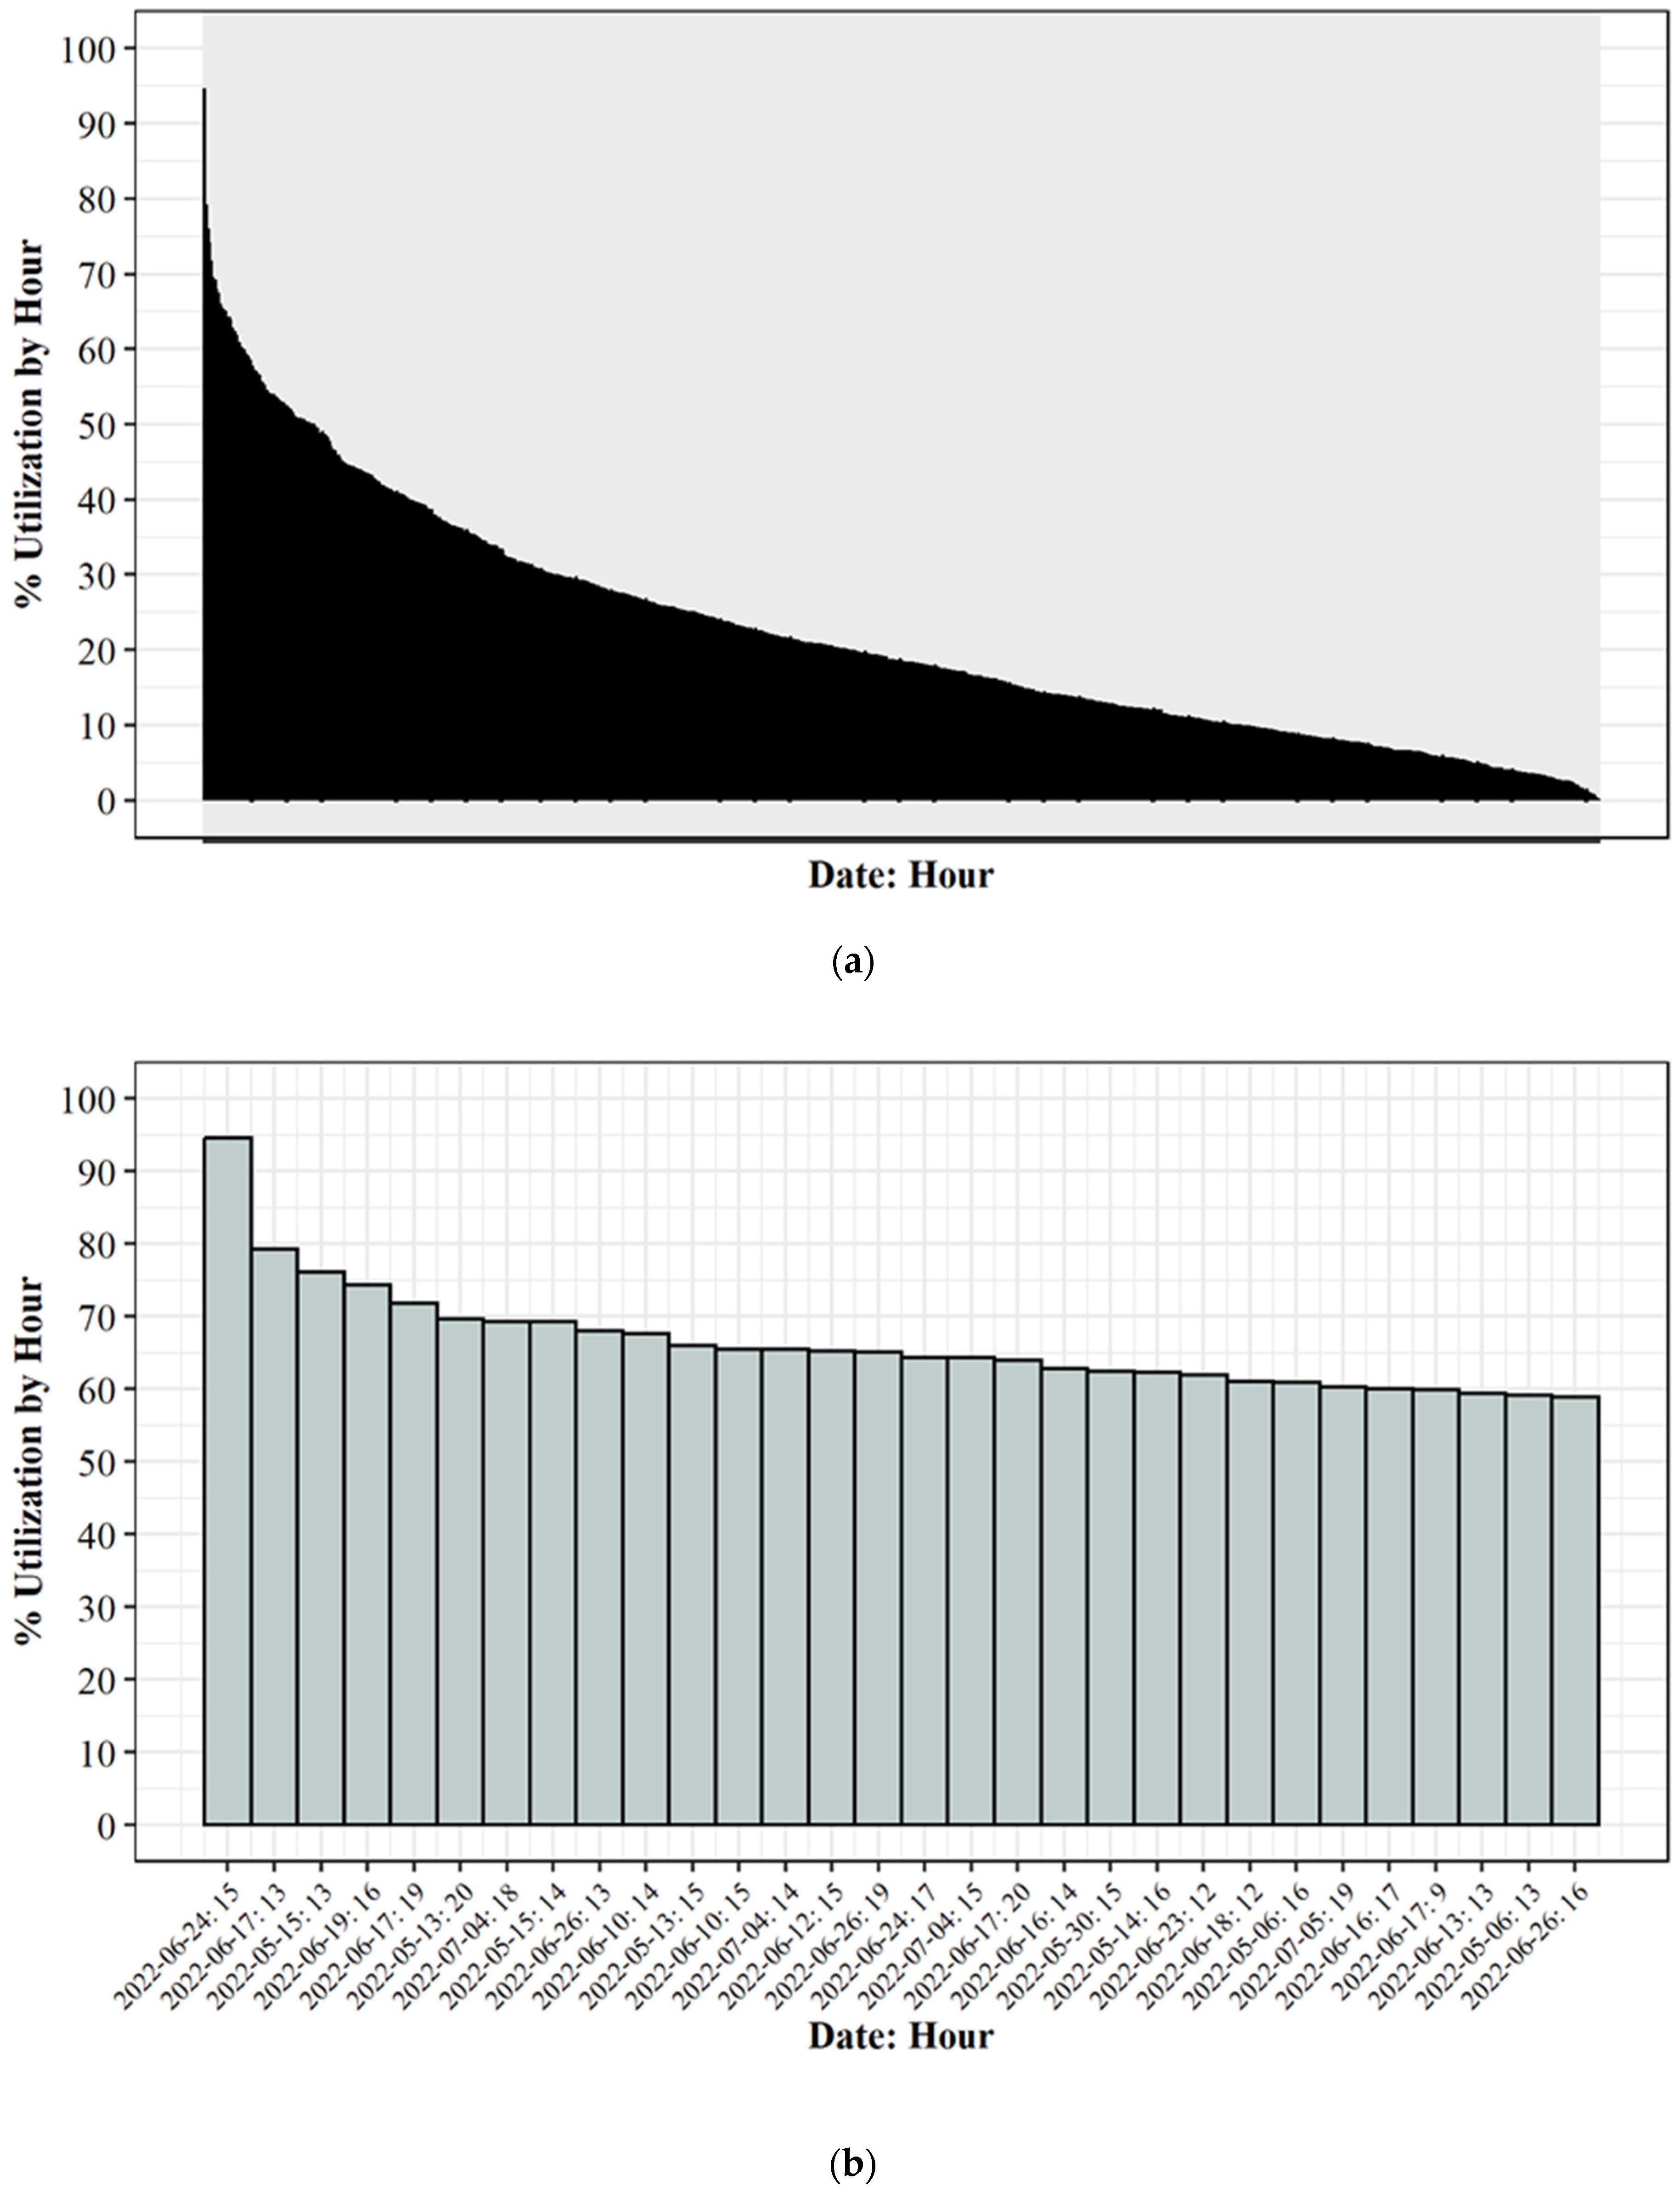
7.2. Analysis of Station Usage by Charger Capacity

Distributions of driver activity between Electrify America and Tesla were quite similar, but distributions of station utilization were dependent on charger type. The distribution of utilization between each charging station can be observed in Figure 6. Figure 6a shows observed utilization of the Electrify America chargers, whereas Figure 6b shows utilization at Tesla chargers. Electrify America (EA) chargers have three different charging outputs, as indicated in Figure 2. Stations 1, 3, 5, and 7 have a charging output of 350 kW; stations 4, 6, and 8 have an output of 150 kW; and station 2 has an output of 50 kW. All eight Tesla chargers have a similar output of 150 kW, and Figure 6b shows a near-equal distribution of use among those eight Tesla stations.
Table 2 summarizes the distribution plots in Figure 6. The charging outputs of each station are also reported in the table. For the EA location, the station with the least utilization is station 2, which is the 50 kW charger, and only 1.7% of the charge sessions were observed at this charging station. The highest distributions of charge sessions were seen in the 350 kW chargers, with 68.2% of charge sessions occurring there. The remaining 30.1% of charge sessions were observed at the 150 kW chargers. This distribution of charging is likely due to the output at each charging station, as the cost per kWh is the same at each station regardless of power supply. In contrast, Tesla chargers had a relatively equal distribution of usage, varying from 10–15% of total charge sessions by station.
An expansion of this study could be undertaken to include an analysis of the choice of charging station compared to the individual vehicle’s peak charging rate capability. Each electric vehicle model has a maximum charging uptake. For example, if the charging conditions are right, including state of charge, ambient temperature, etc., some EV models can only draw up to 55 kW. For this study, the least used charger was the 50 kW charger, meaning individuals that had this restriction may have been using the 150 or 350 kW charging ports, preventing other drivers from using the faster chargers even though their vehicles could not benefit from the higher kW charging ports. Conversely, drivers that have the capability to use the 350 kW chargers but stay at the charging location longer than required also cause underutilization of fast chargers. A further analysis may be performed to aid in determining when charging stations are used incorrectly to ensure correct funding and infrastructure investments are made that have the greatest impact on EV drivers.

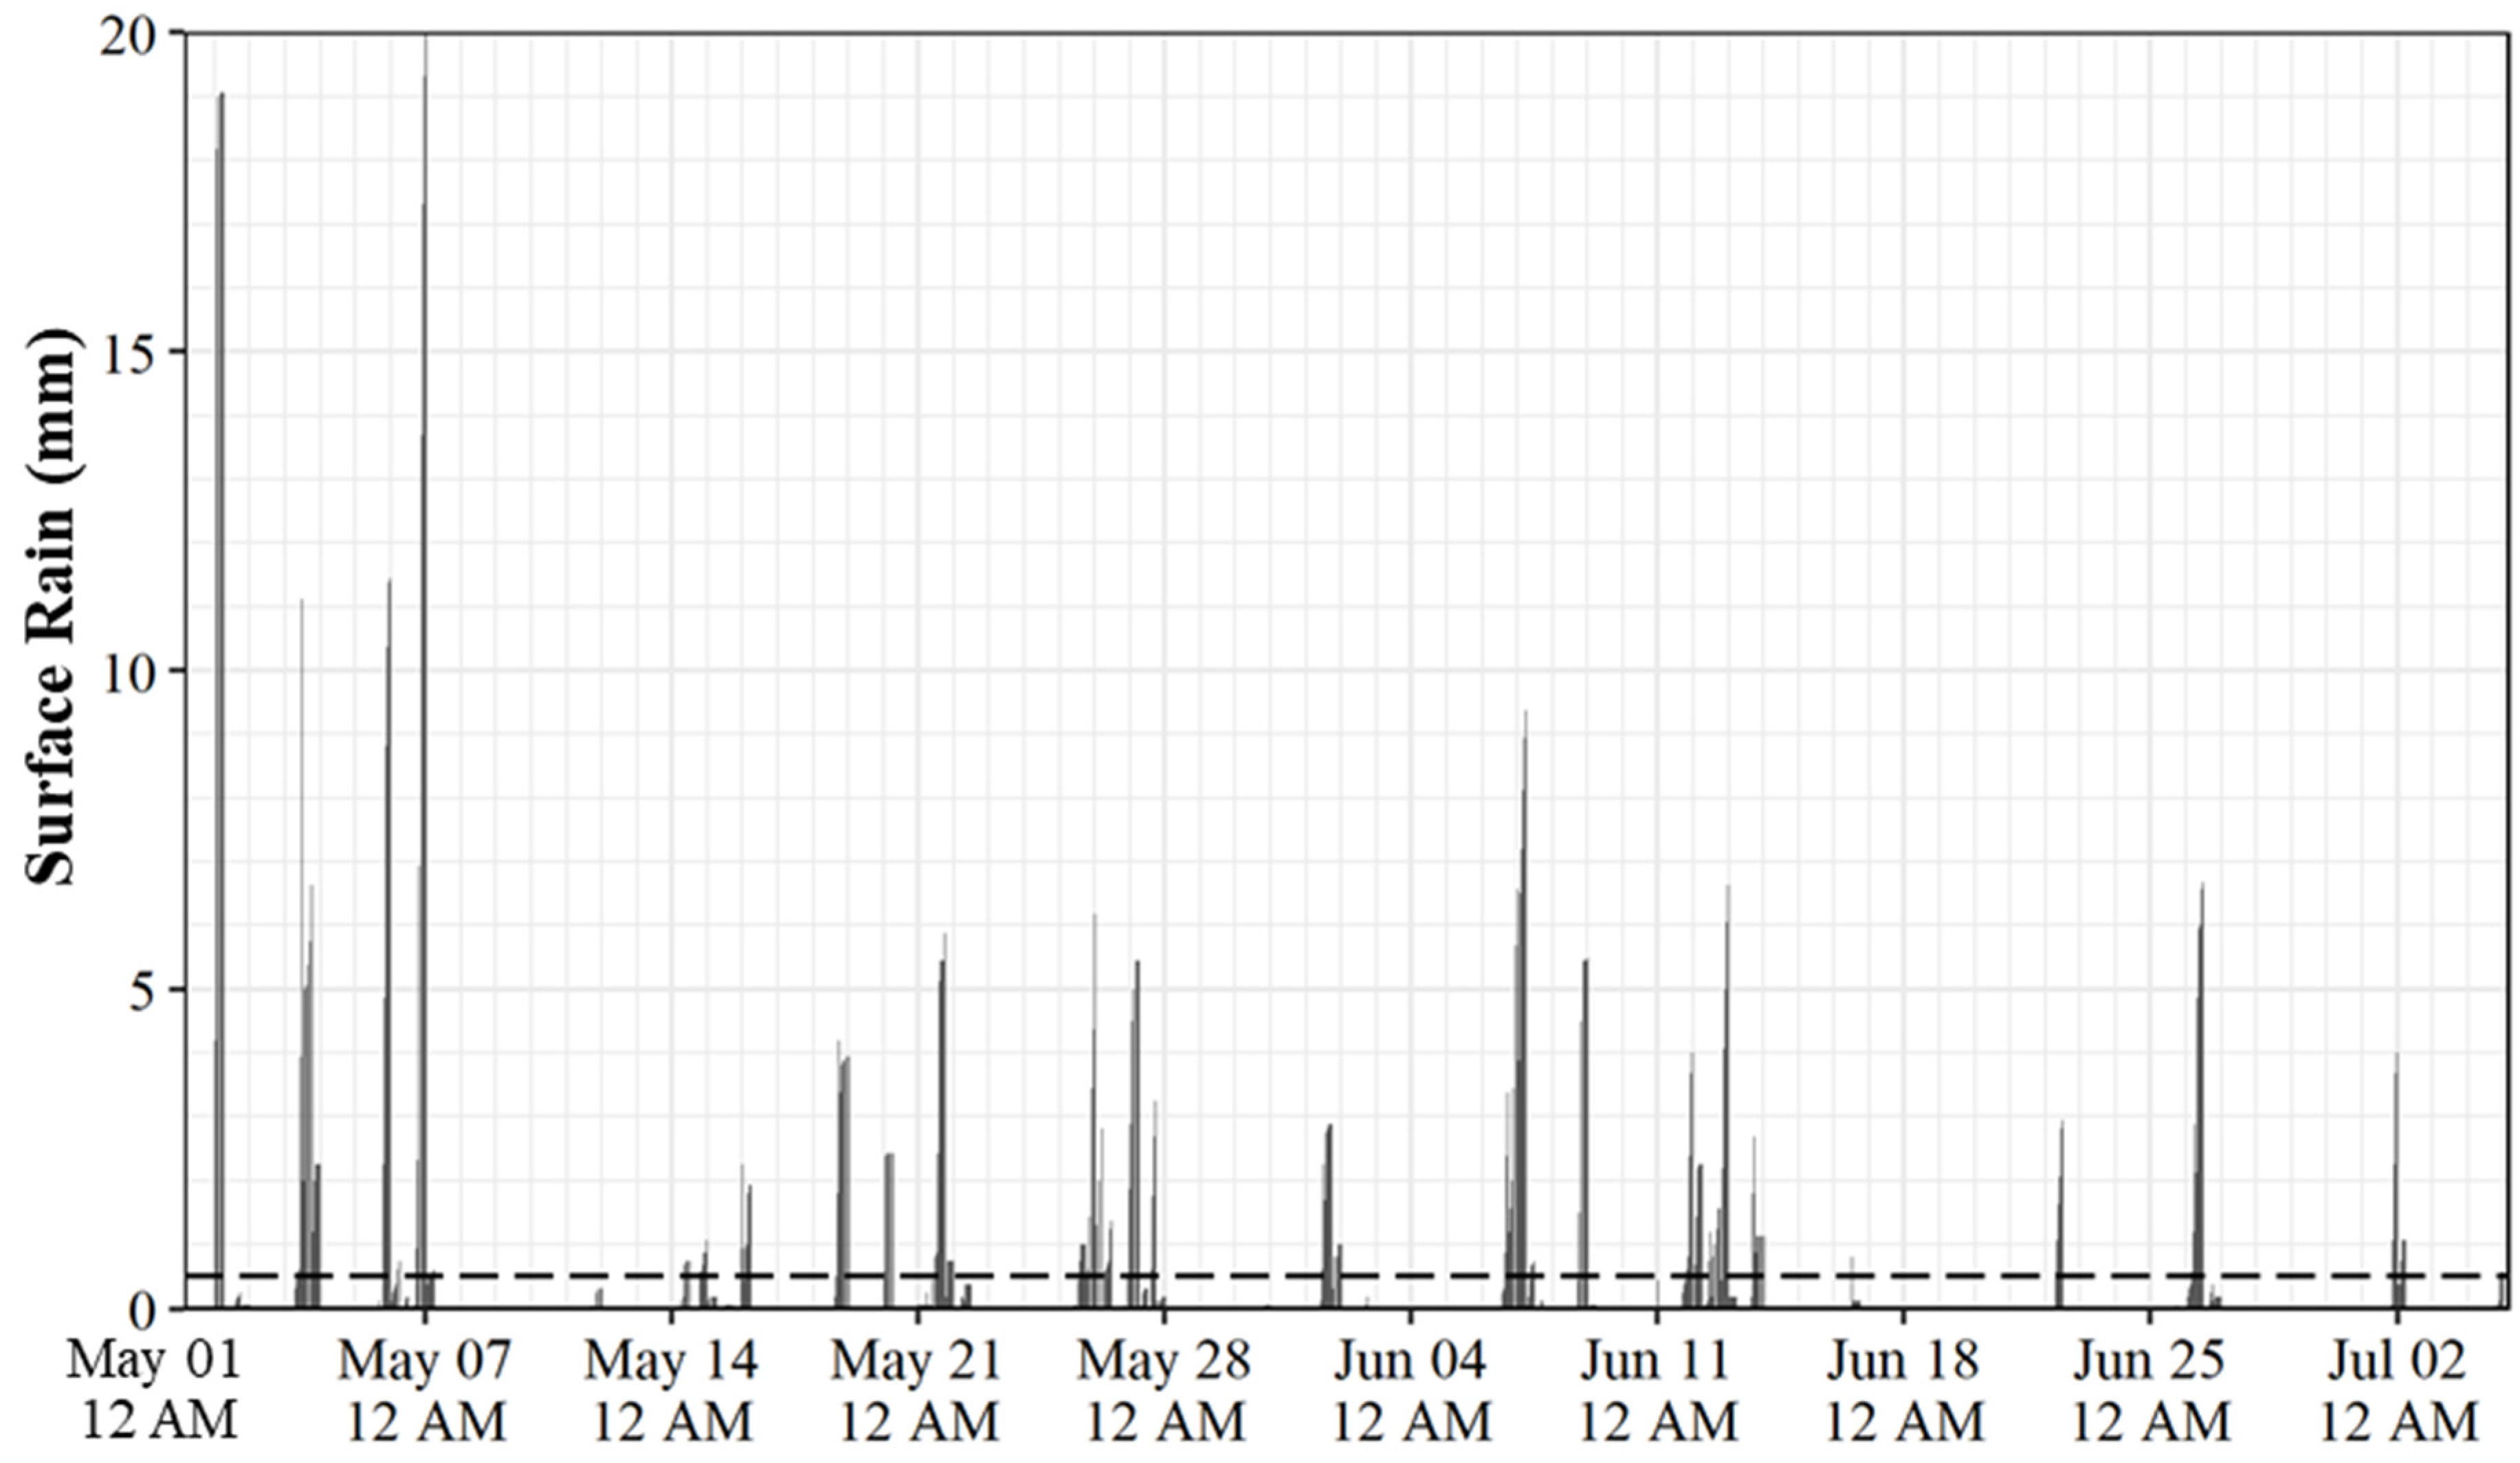
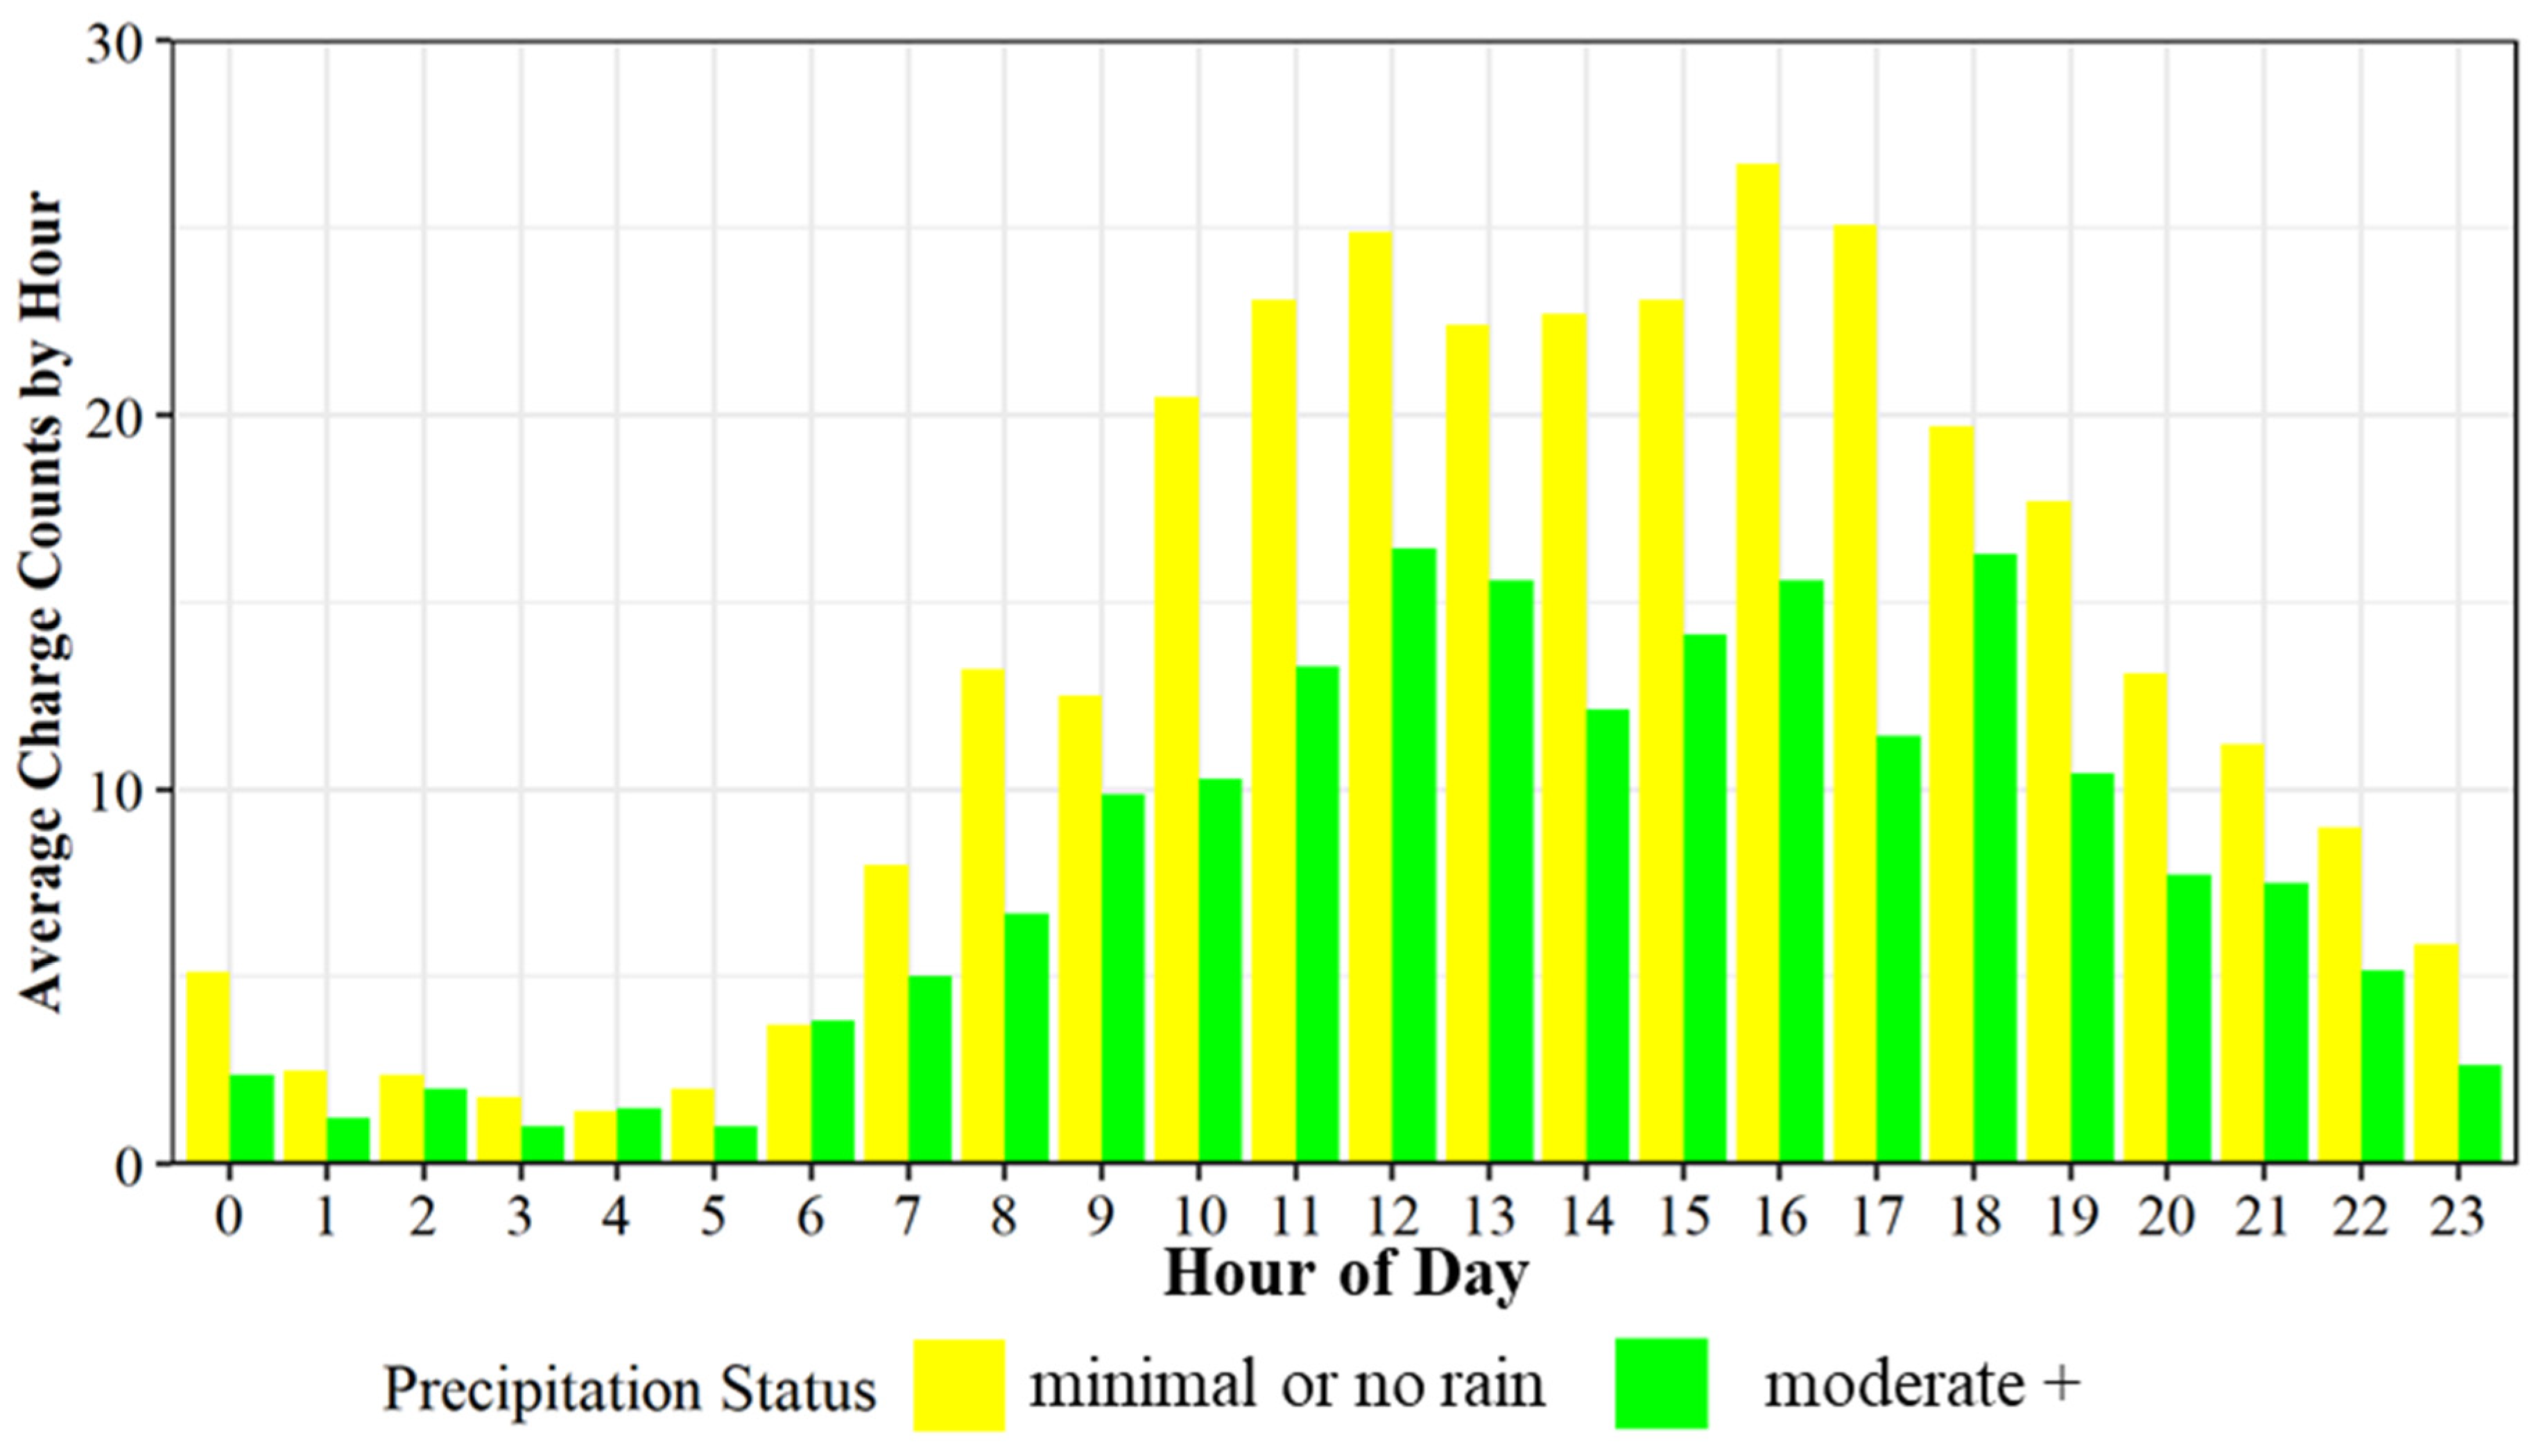
7.3. Analysis of Usage with the Impact of Rain

Studies have shown that weather has the potential to change travel patterns for multiple transportation modes, including transit [45], e-scooter or bikeshare [46], and passenger vehicles [47]. The impact of weather can also influence refueling behavior among internal combustion engine vehicle drivers, which is why many petroleum refuel stations have canopy structures to protect fuel pumps and users during inclement weather. Currently, many EV chargers lack a similar canopy, which may impact recharging. To analyze weather impact during charging, the public National Oceanic and Atmospheric Administration (NOAA) Global Forecast System (GFS) data was utilized by this study. This forecast data is provided four times a day at 00:00, 06:00, 12:00, and 18:00, with forecasts up to 16 days in advance [48]. For analysis purposes, the most recent forecast for each time period was used, with the oldest being 5 h in advance. During the study period, the temperature ranged from 43 to 93 degrees Fahrenheit, with an average of 68. Although this study period only spans one season, future studies should be expanded to observe cooler temperatures. Figure 7 shows the cumulative rain by hour of day across the study area over the near 10-week study period. The heaviest rain events occurred in the beginning of May 2022, with rates as high as 20 mm/h. For the purposes of this study, rain events were classified into two categories: minimal or no rain and moderate or greater. According to the United States Geological Survey (USGS), moderate rain is categorized by rates of at least 0.5 mm per hour, which is the dashed horizontal line indicated on the graph [49]. Any time a moderate or greater rain event occurred, the corresponding day was classified as a rainy day. This was carried out to reduce discrepancies in observed charging behavior for when the rain events were starting or ending, to account for the inaccuracies caused by the forecast, and to help distinguish behavioral changes on days that rain was forecasted. Using this method, 1295 (29.5%) of charge sessions were found to have occurred on a day with moderate and greater rain. Electrify America and Tesla observations are reported as a total here, as weather fronts moving through the study location would be assumed to have a similar impact on each charging location, irrespective of the EVSE provider.
The comparison between charging sessions by hour of day for days of minimal to no rain and moderate and greater can be seen in Figure 8 below. This graph shows the average number of charging sessions by time of day. It can be noticed that during days with moderate and greater rain in the forecast, the average number of charging sessions across all stations decreased by about five sessions per hour, with the maximum decrease observed during 5 p.m. to 6 p.m. with a difference of 13 charge sessions. A Welch two-sample t-test was performed to test the difference between the number of charge sessions on days of minimal to no rain and days with moderate and greater rain. A p-value of 0.019 suggests rejecting the null hypothesis that the number of charge sessions on days with rain versus no rain is similar. A similar analysis was performed for driver activity, where more drivers waited in their vehicles while charging during rain events, but the difference was not statistically significant. These results suggest that the weather has a discernible impact on EV charger usage, and further analysis should be performed to compare other weather patterns and charging activities.

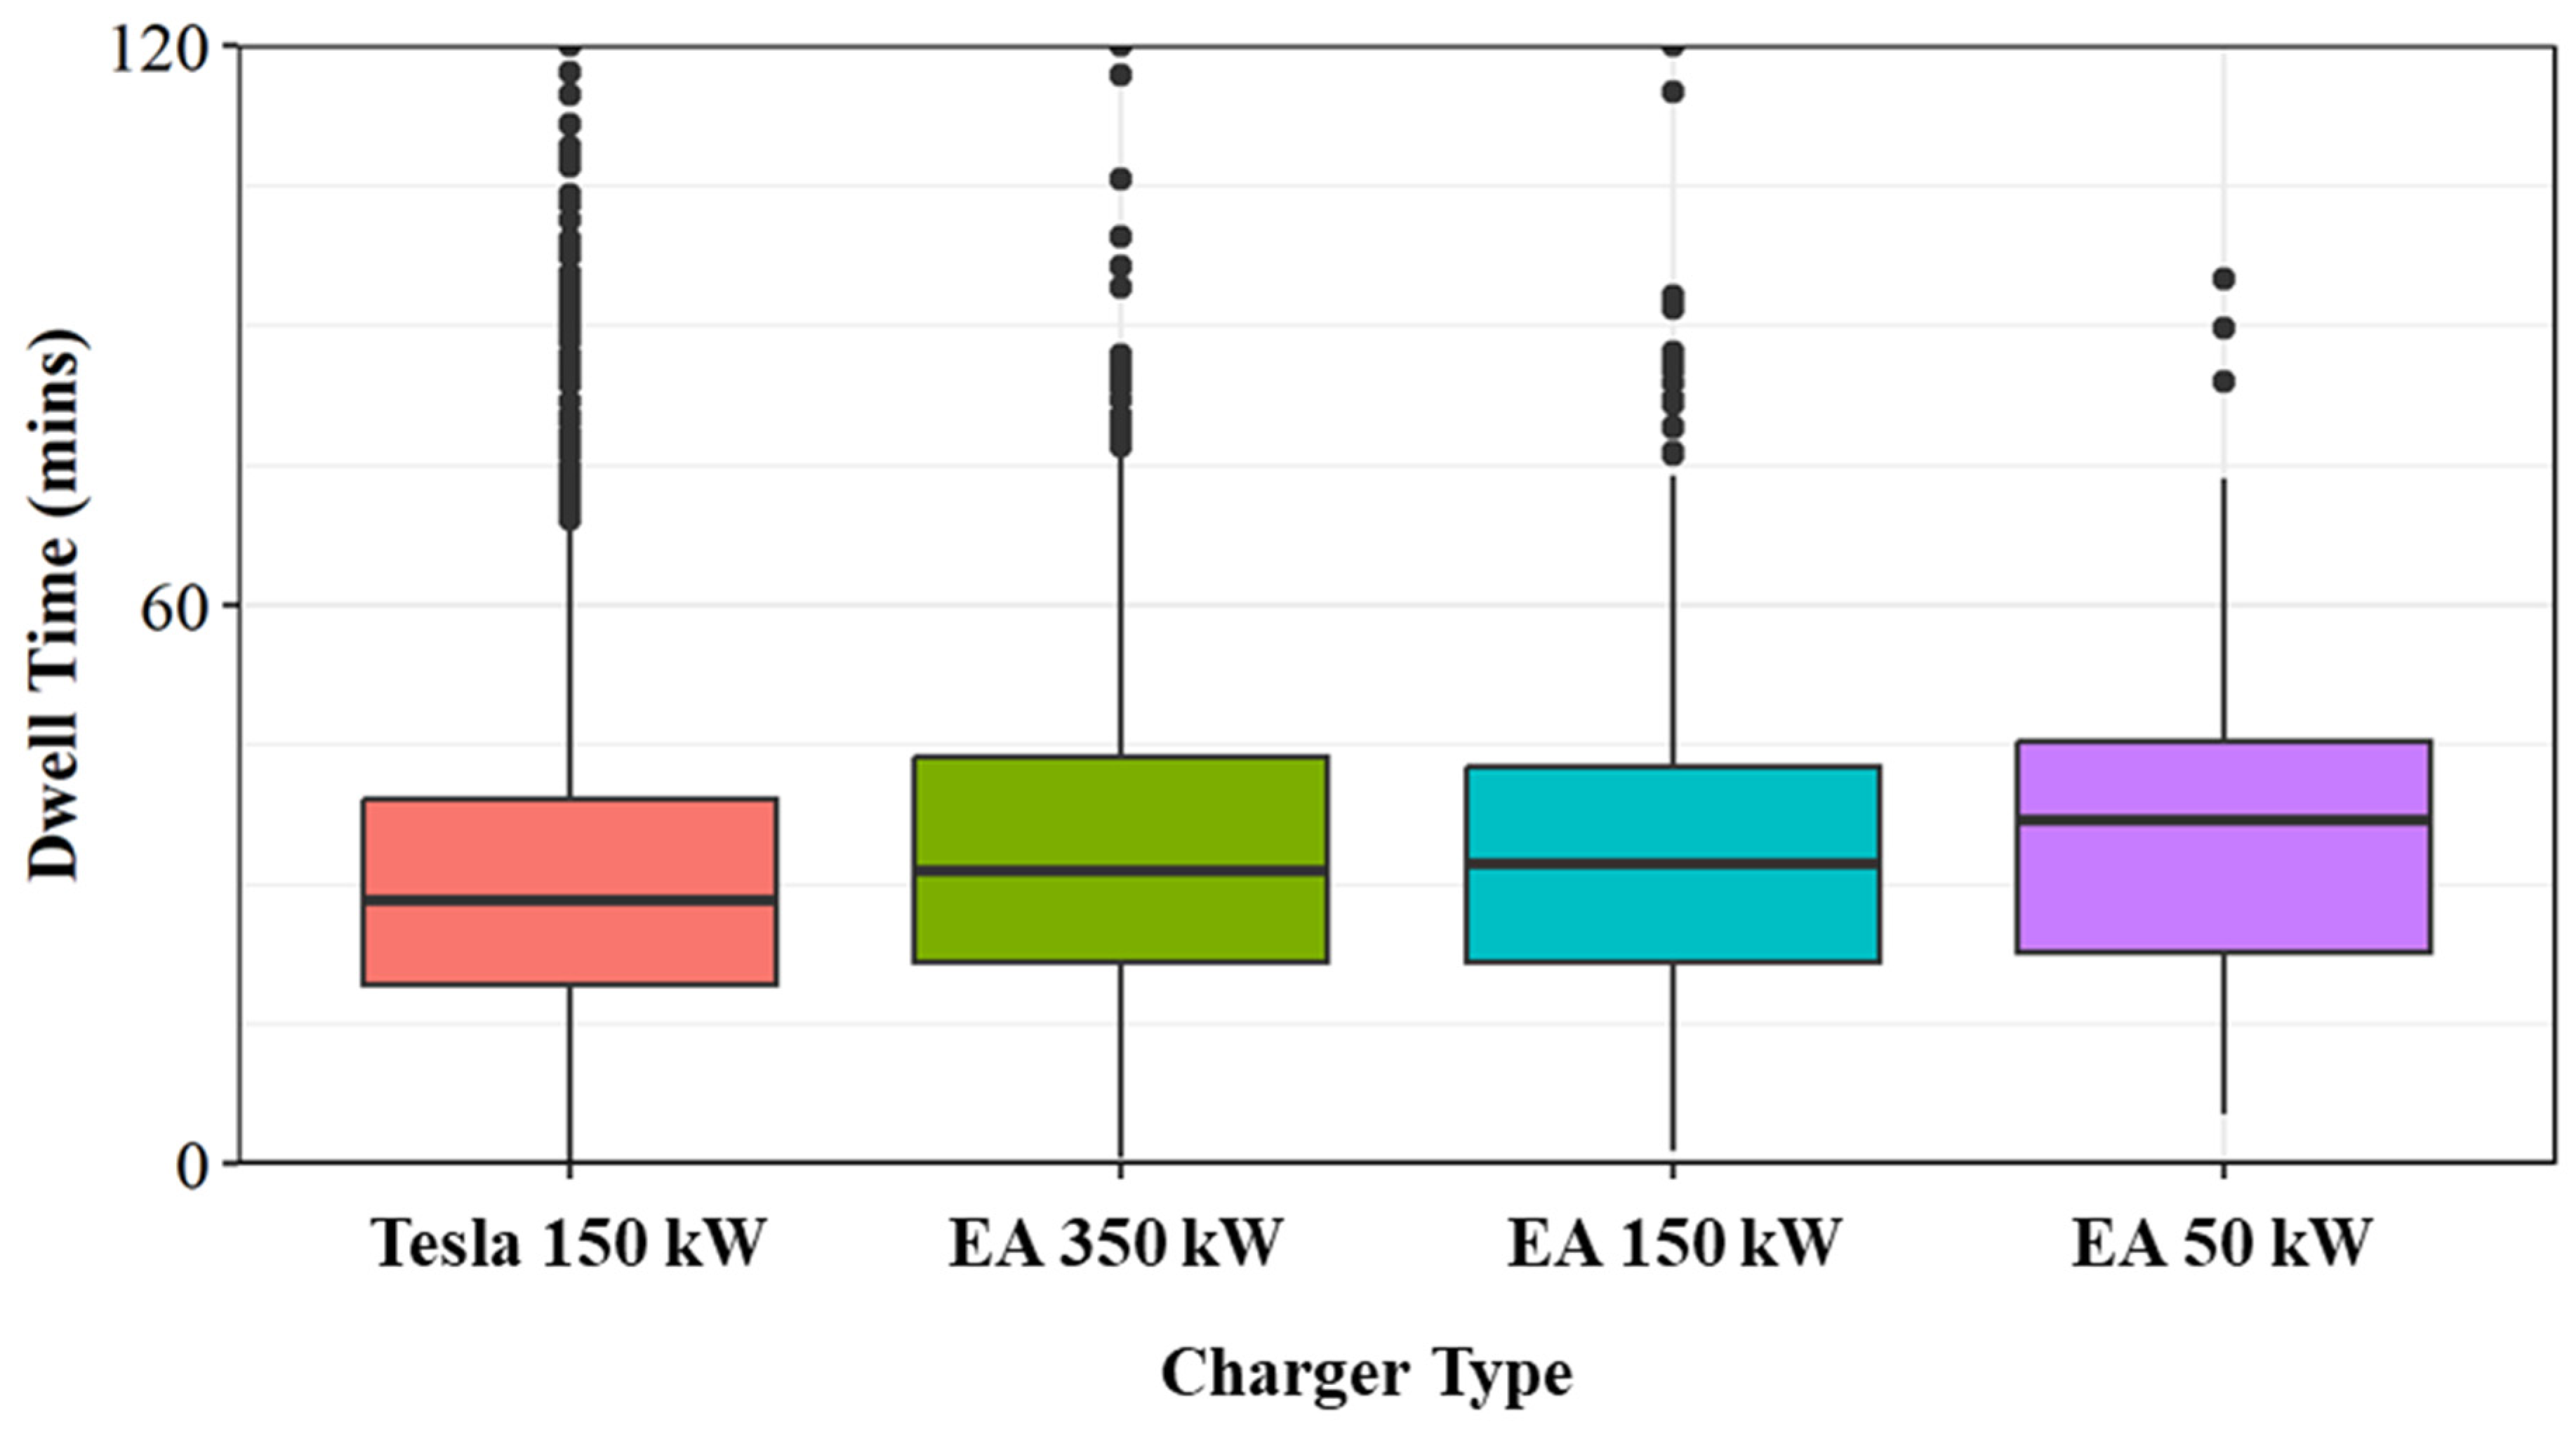
7.4. Analysis of Charging Usage Dwell Time

Figure 9 shows the dwell time at each station, by station type. Tesla chargers observed the lowest median dwell time of 28 min. Electrify America stations with the same 150 kW chargers had a median dwell time that was approximately 4 min longer (32 min). The EA 350 kW median dwell time was 31 min, and the EA 50 kW charger had a median dwell time of 37 min. The interquartile range of all four charging station types was very consistent and only varied between 20 and 22 min. This observed ranking is intuitive and aligns well with lower power outputs, resulting in drivers having to wait longer for a charging session to complete.

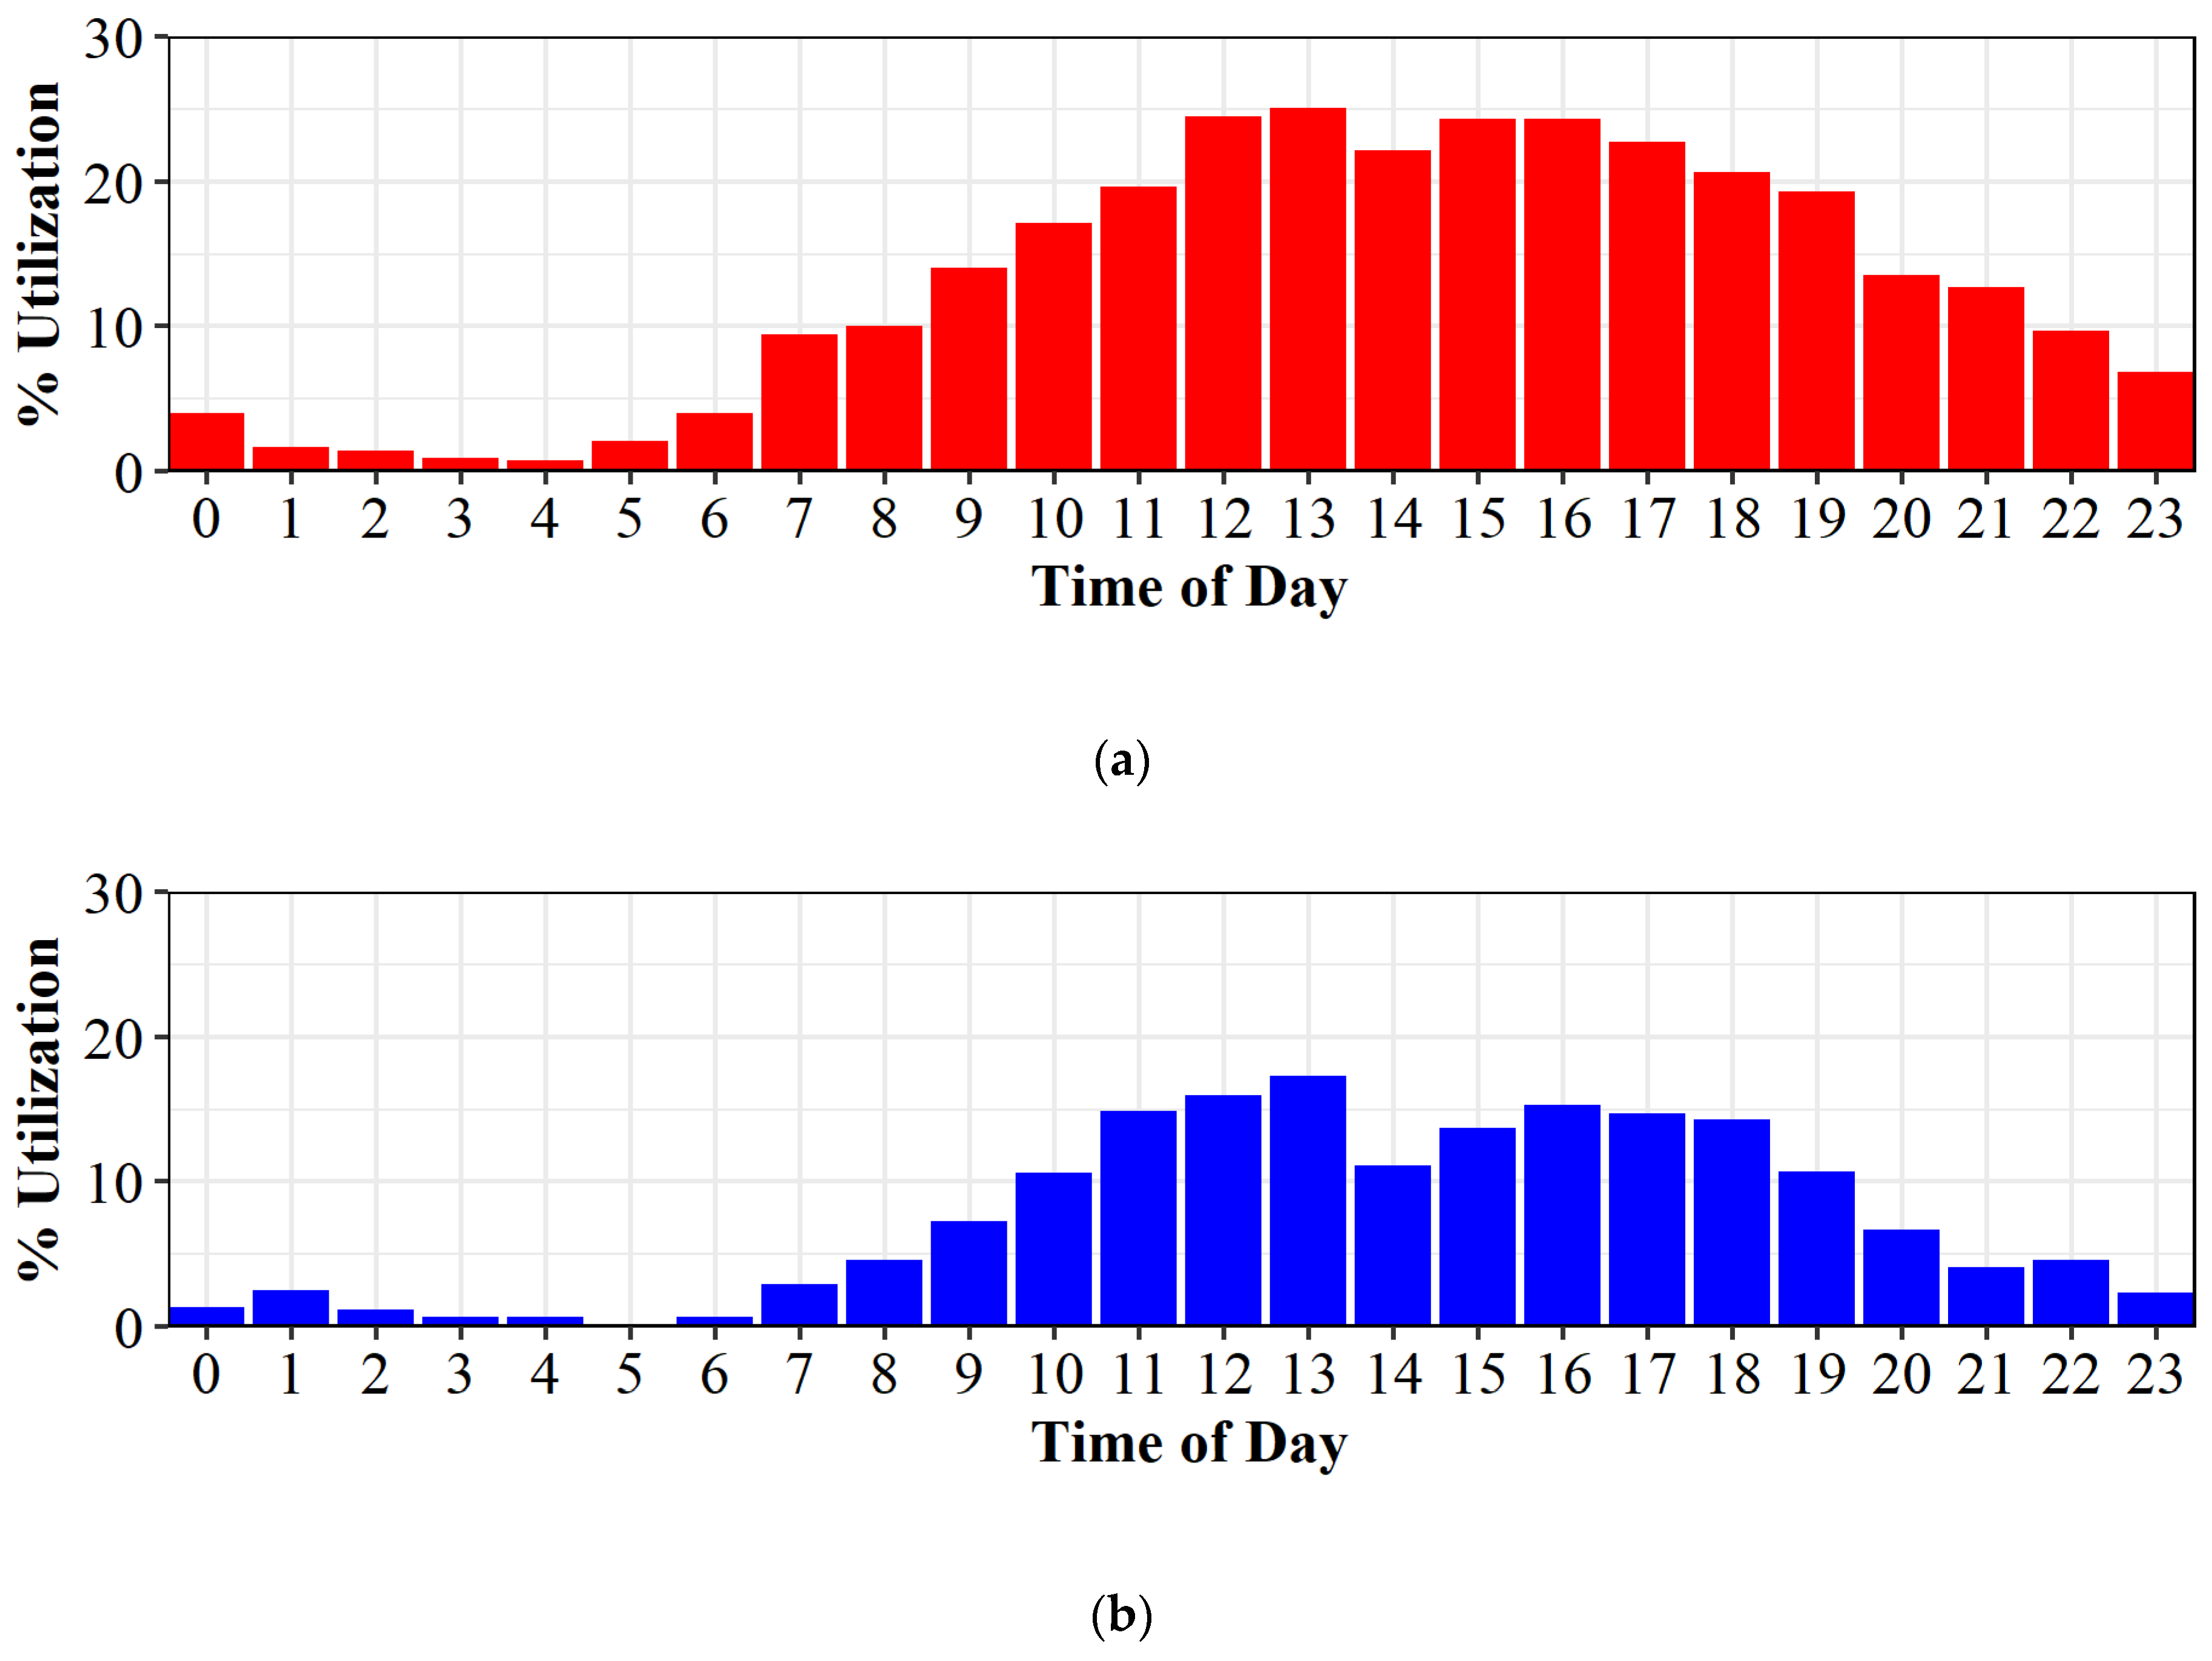
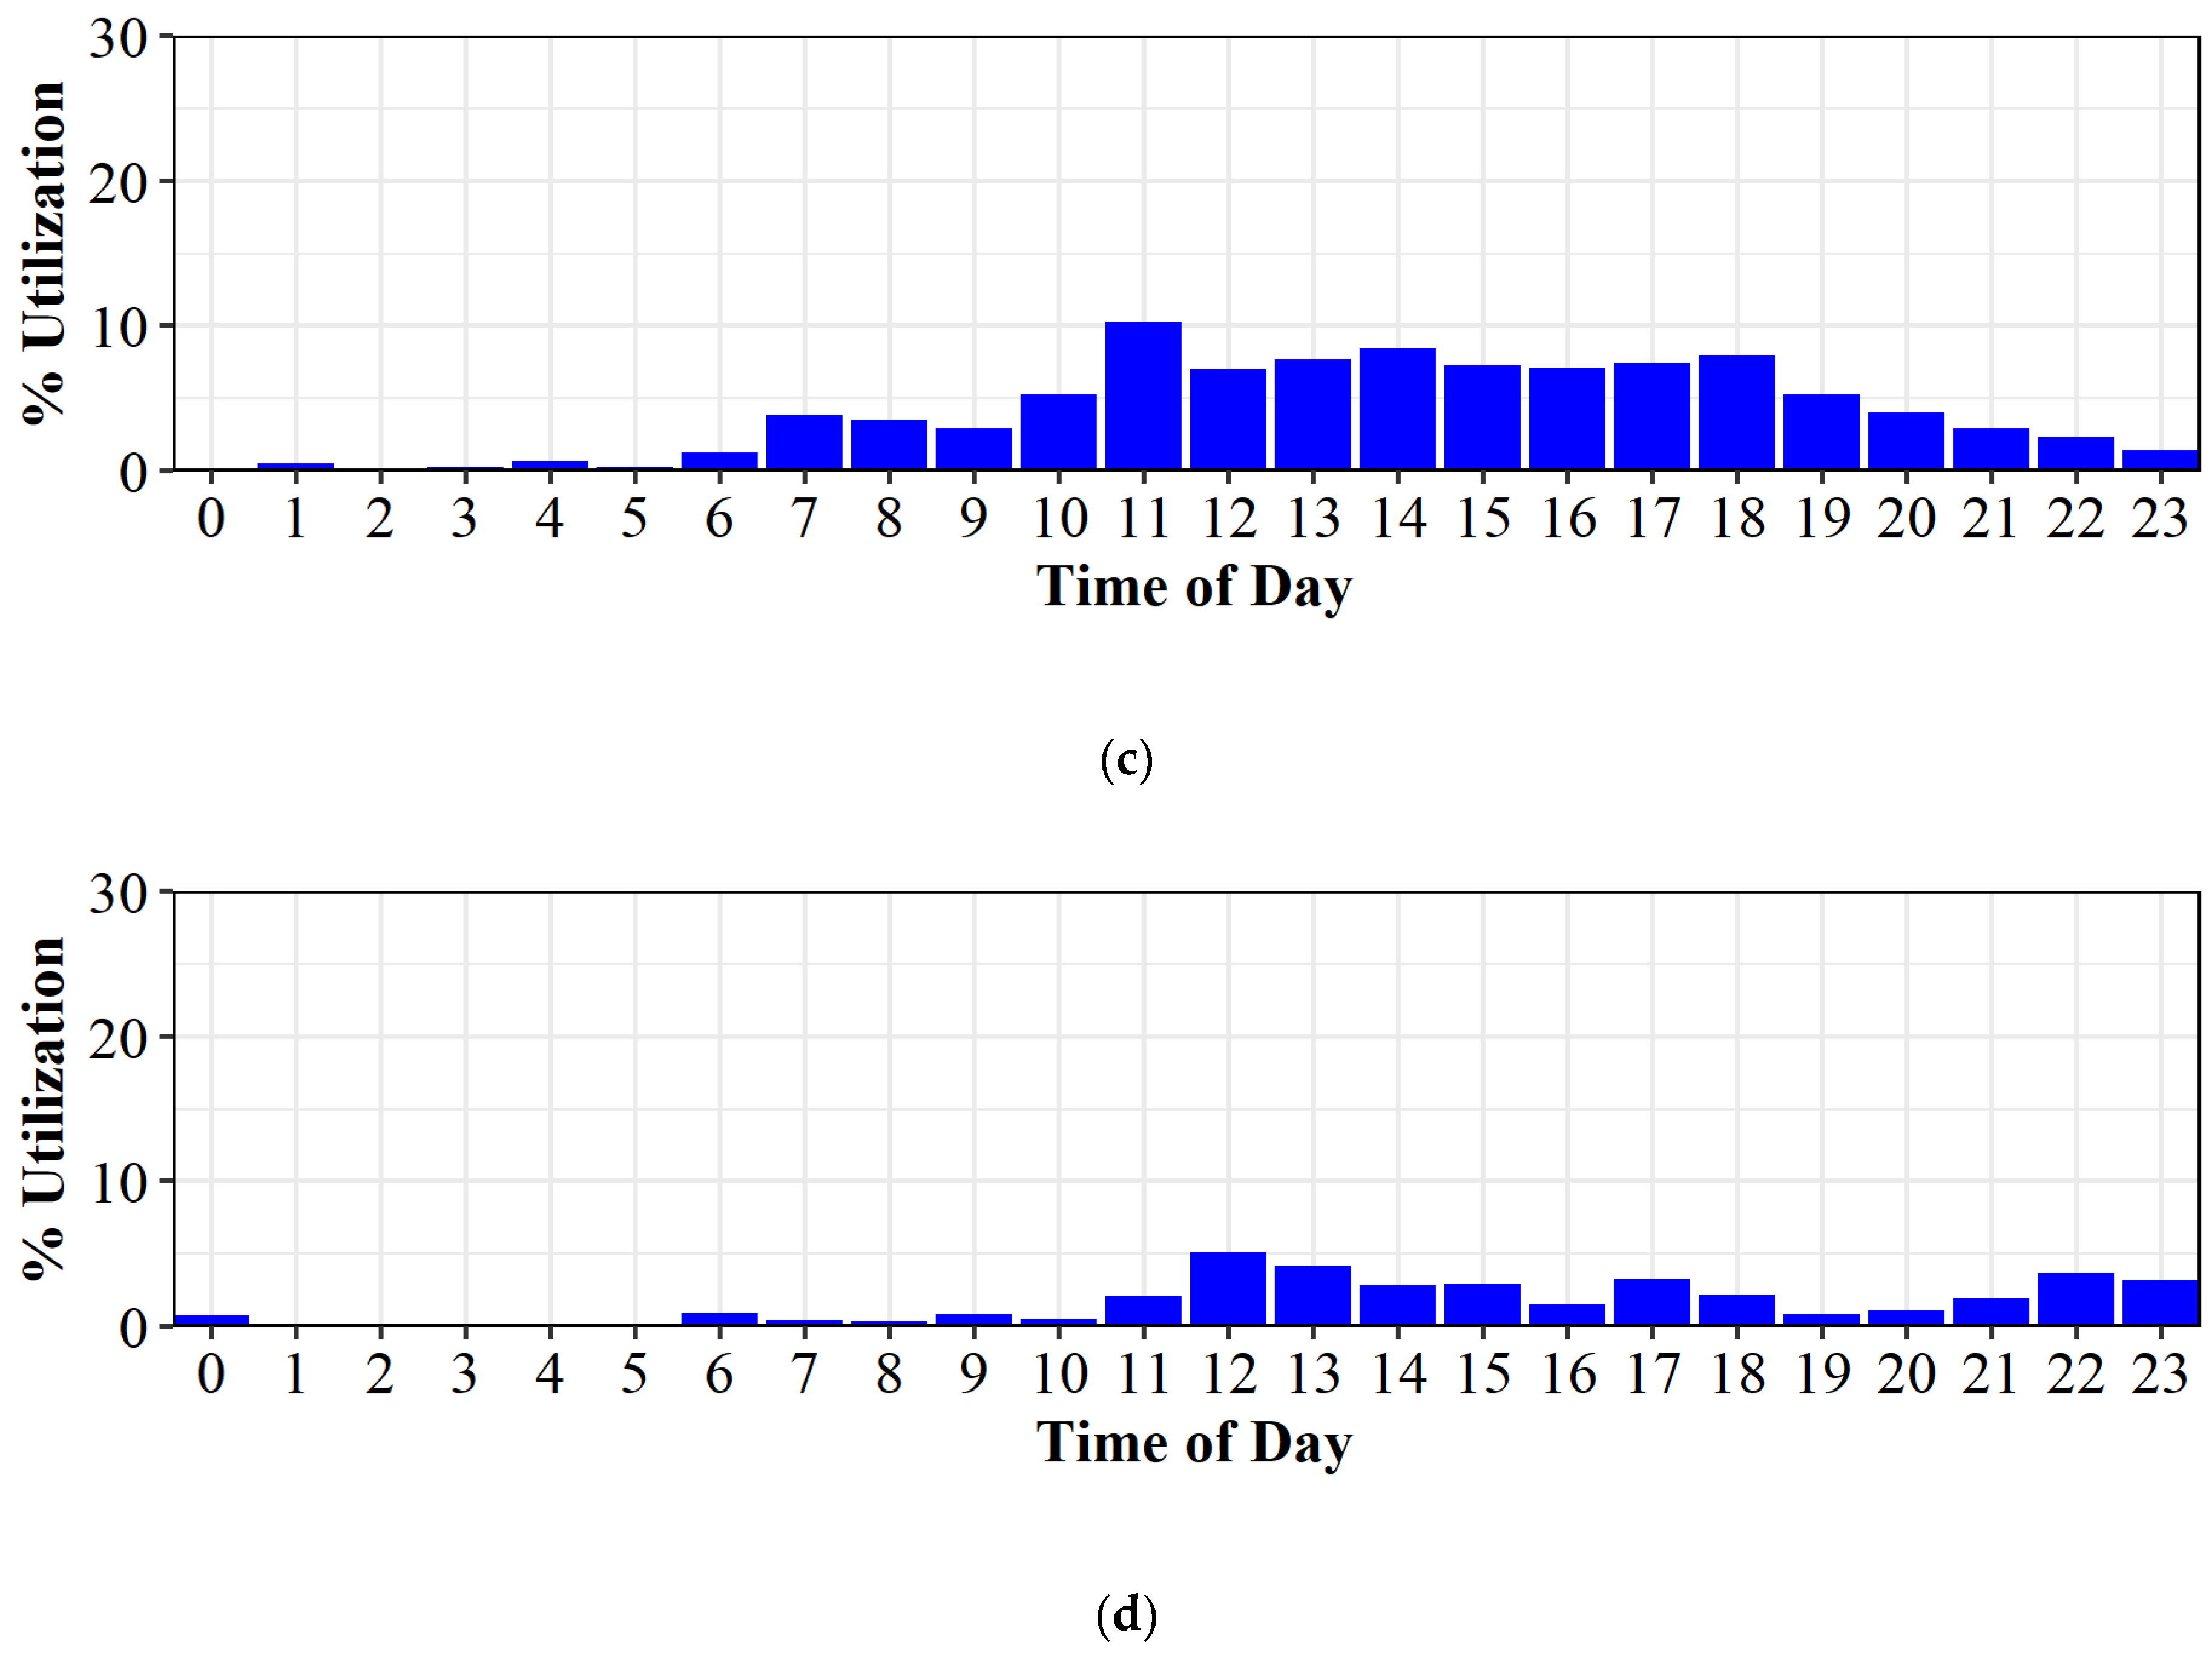
7.5. Analysis of Station Usage by Time of Day

Agencies want to ensure adequate charging capacity for travel demand and widespread use. Designing for peak utilization, however, is too costly, and if there are not enough charge stations, the site will be underutilized. Quantifying utilization by time of day can help agencies appropriately size charging stations to determine peak usage and can also provide important information for utilities for planning the temporal impact of EV charging on their grid.
Figure 10a shows the percentage of utilization by hour of day for Tesla 150 kW, Figure 10b shows EA 350 kW utilization, Figure 10c shows EA 150 kW utilization, and Figure 10d shows EA 50 kW utilization. These graphics show that peak utilization generally starts at 11 a.m. and begins to reduce around 6 p.m. Furthermore, Tesla chargers experienced peak utilization of all eight chargers during 1–2 p.m. in the day with a utilization rate of 25.0%. EA 350 kW chargers experienced peak utilization of four chargers at the same time, with a utilization of 17%. EA 50 kW saw the least utilization, with the average peak occurring at 12–1 p.m. at 5% for one charger.
Figure 11 shows peak percent utilization by day and hour for all Tesla charging sessions sorted by the most utilized time. For a one-hour period, all eight stations were never completely full, but Figure 11a shows all dates and hours of the utilization percent across the study period that were non-zero. Figure 11b shows the top 30 dates and hours by percent utilization. The top 30 periods with the highest utilization were found to be on weekends, with the exception of Monday, 4 July 2022 (American National Holiday); Monday, 30 May 2022 (American National Holiday); and Thursday, 16 June 2022. 29 of the top 30 peak hours were observed on weekends and holidays for Tesla chargers.

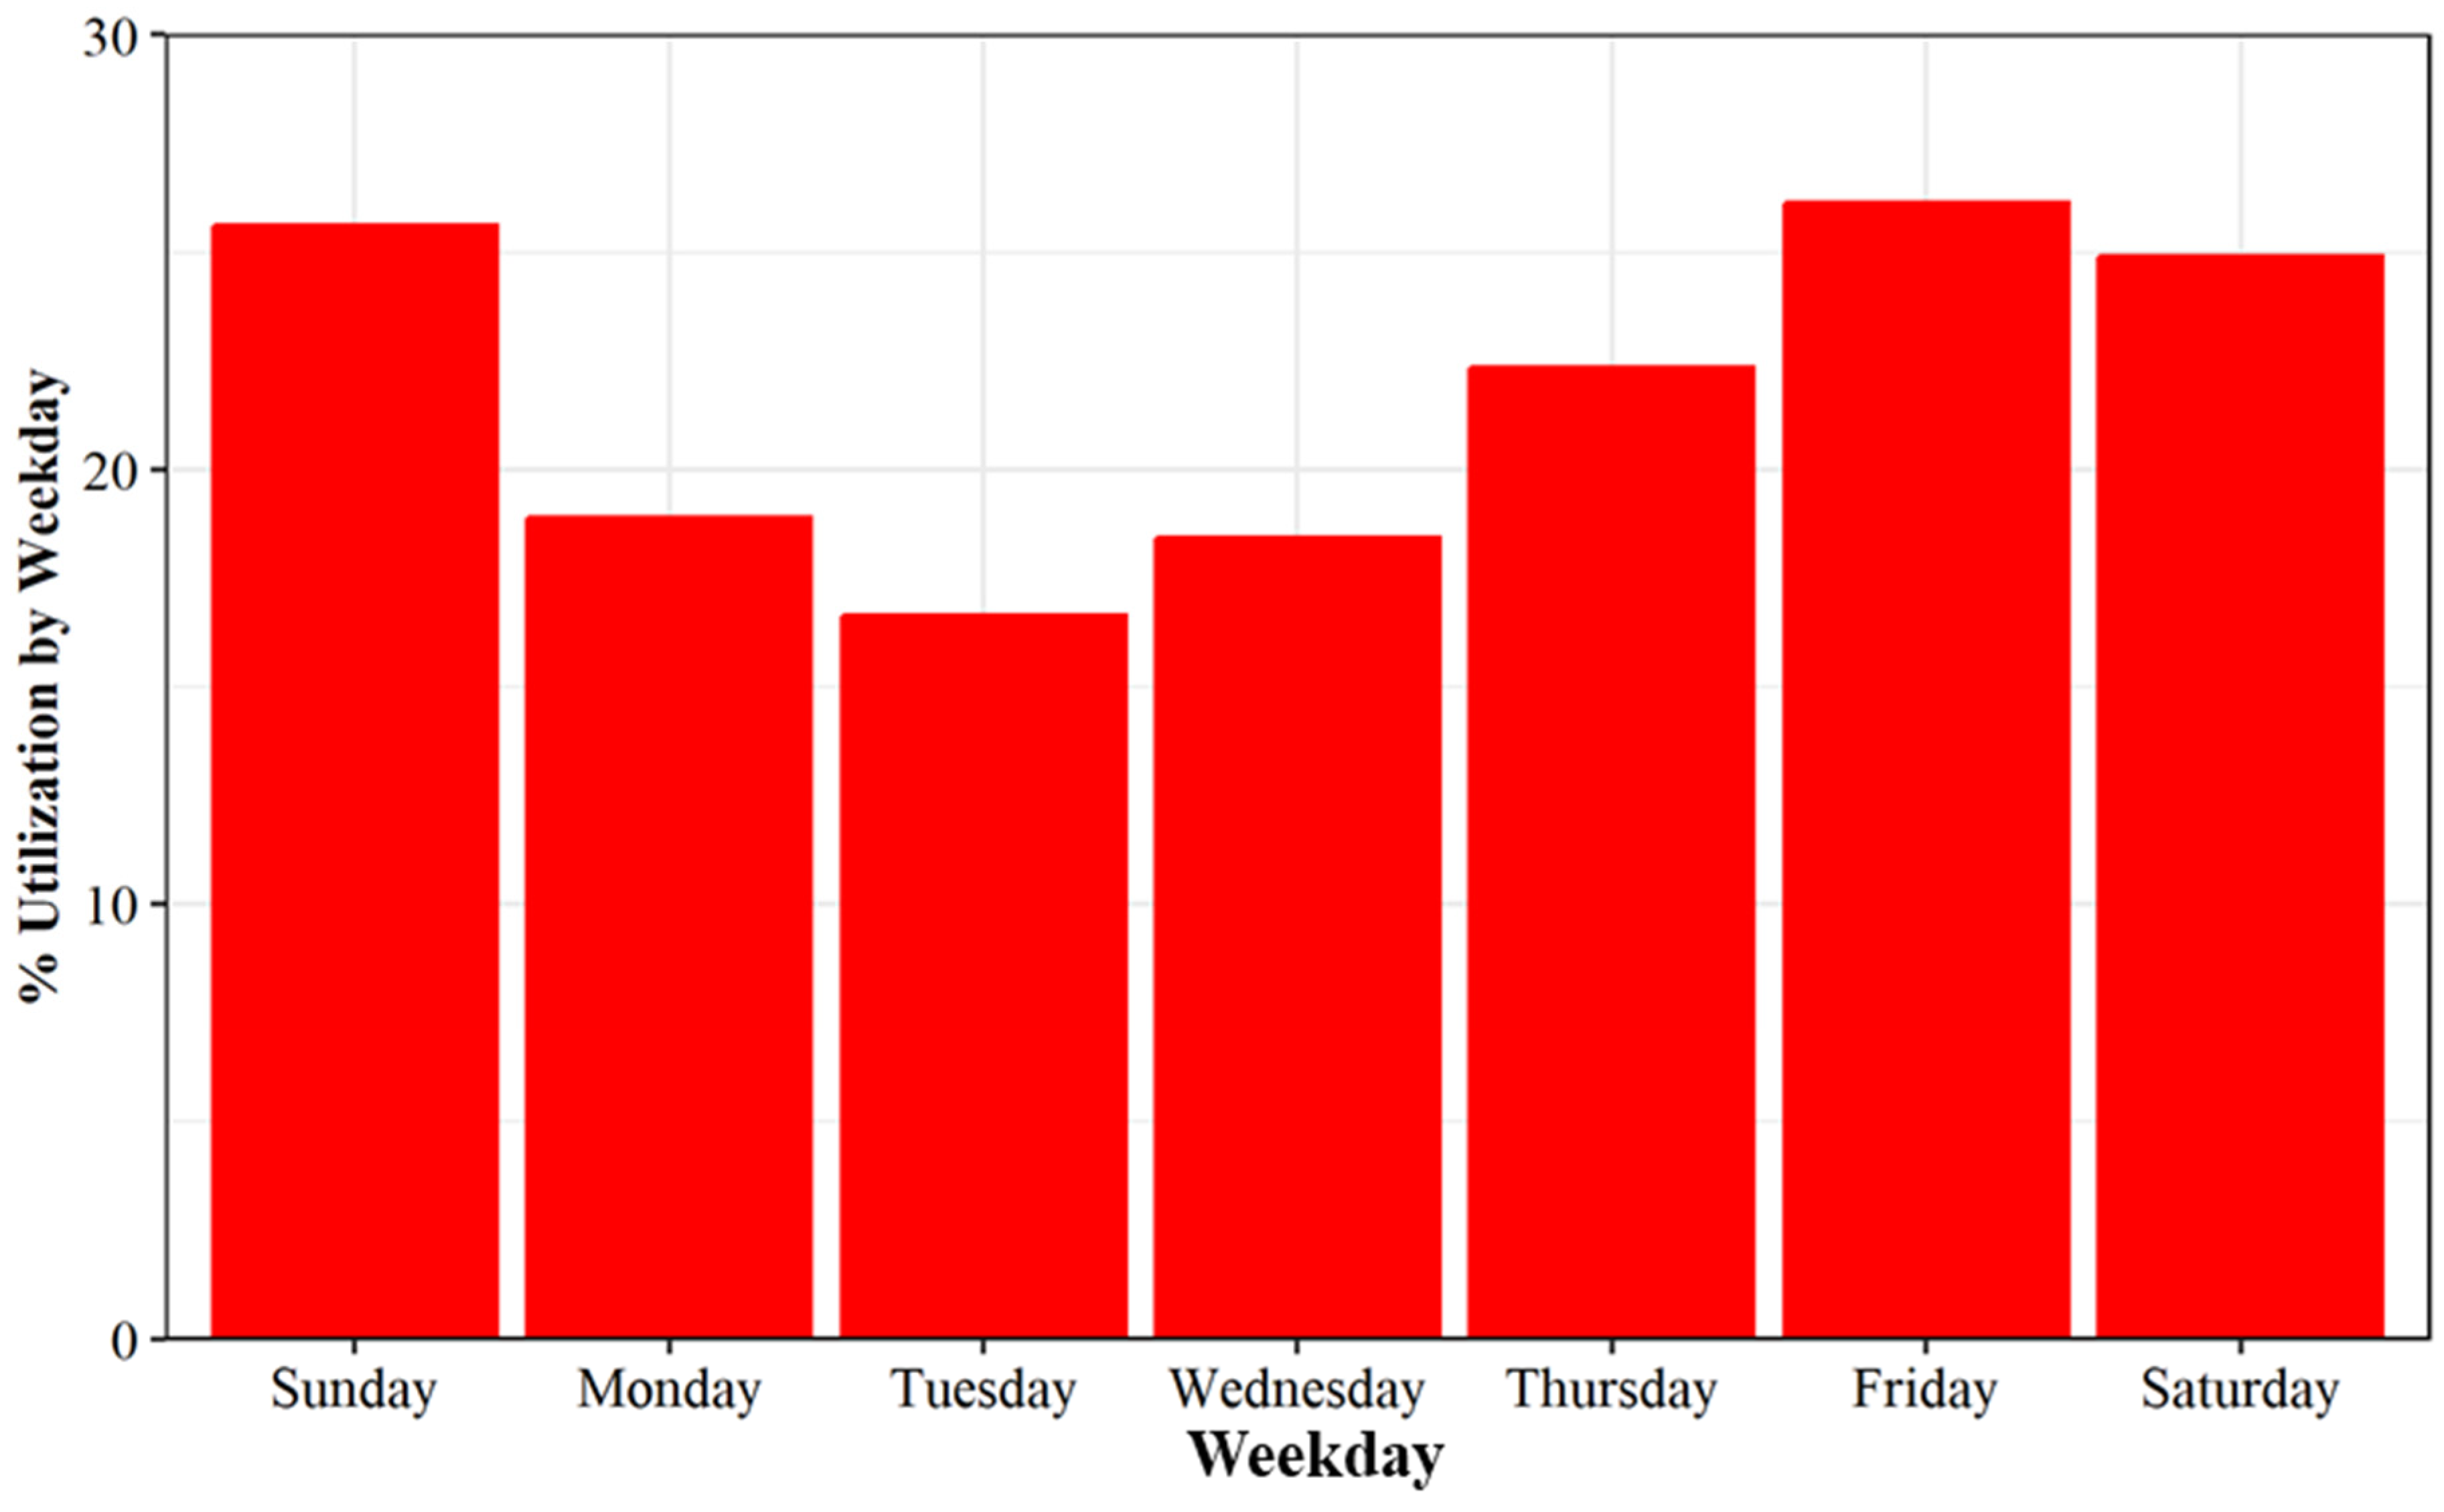
7.6. Analysis of Station Usage by Day of Week

In addition to observing the hour of day where peak utilization occurs, another valuable performance measure can be the observed utilization by day of week. Figure 12 shows the percent utilization by day of week for Tesla charging stations and validates the findings of Figure 11b, where the greatest usage of the chargers was on Friday, Saturday, and Sunday. Comparing these trends to those reported by the Bureau of Transportation Statistics, the usage pattern of charging stations is similar to trip trends, where Fridays account for the most daily trips versus the rest of the week [50]. Likewise, compared to the 2017 national household survey, the highest percentage of non-work trips occur on weekends, meaning a higher percent of drivers are traveling near and around the stations and may need to charge as the average trip length is longer on weekends than weekdays as well [51]. Similarly, this can provide stakeholders with actionable data to assess and determine if additional charging capacity is required to support peak charging periods.

8. Conclusions and Future Scope

Identifying optimal locations for EV charging stations across the nation is the highest priority for agency stakeholders. The use of federal funds to build out a national charging network is primarily aimed at filling gaps, better serving rural locations, and equitably increasing charging capacity nationwide. Due to innovation and continuous improvements in the EV charging domain, there is minimal data available for EV charger utilization and widely varying practices for EV charger location identification. This study and the methodologies proposed can be utilized by agencies to aid in identifying useful data from chargers and optimizing EV charger placement.
  • Over 4000 charging sessions across 16 charging stations were monitored for this analysis in the months of May, June, and part of July 2022 to monitor driver activity while charging, dwell time, and station utilization (Figure 2).
  • Charging patterns by time of day and day of week were comparable to similar studies, with the highest utilization being on the weekends and between the hours of 11 a.m. and 6 p.m.
  • Of the four charger types analyzed, the 50 kW charger was the least utilized, and the 150 kW Tesla charger had the highest usage.
  • Driver activity while charging was categorized among six activities, with each activity impacting the average dwell time at the charging station. Drivers that would leave the premises would have dwell times of 30–60 min longer than those that waited in their vehicles.
  • The weather impacted the use of public chargers, reducing the number of hourly charge sessions.
The methodologies, subsequent analysis, and visualizations presented by this study demonstrate the importance of considering charging/driver data for planning future infrastructure investment. While the dataset used is derived from video footage, the charger usage and dwell patterns found in it could very well be used as a surrogate for future EV charge trends, and as public EV charger data and connected vehicle data become more available, the analysis could be scalable nationwide. Future studies in this field may involve comparative analysis between dwell sessions at other rest stops, cities, and charger locations to define performance metrics that would allow stakeholders to strategically plan as well as quantify the impact of their investment in EV charging infrastructure. Additionally, observations recorded during different seasons and weather conditions could provide insights into their effects on both charging activity and driver activity. Coupling these metrics with EV charger placement decision-making frameworks will ensure the optimal placement and utilization of EV charging infrastructure.

Author Contributions

The authors confirm their contribution to the paper as follows: study conception and design, J.A.M. and D.M.B.; data collection, J.A.M.; analysis and interpretation of results, J.A.M., J.D. and D.M.B.; draft manuscript preparation, J.A.M., J.D. and D.M.B. All authors have read and agreed to the published version of the manuscript.

Funding

This study is based upon work supported by the ASPIRE award, an Engineering Research Center program by the National Science Foundation (NSF), grant no. EEC-1941524, and the Joint Transportation Research Program administered by the Indiana Department of Transportation and Purdue University.

Data Availability Statement

Not Applicable.

Acknowledgments

The authors would like to acknowledge Vincent Yanko’s efforts in data collection and processing. The contents of this paper reflect the views of the authors, who are responsible for the facts and accuracy of the data presented herein, and do not necessarily reflect the official views or policies of the sponsoring organizations or data vendors. These contents do not constitute a standard, specification, or regulation.

Conflicts of Interest

The authors declare no conflict of interest.

References

  1. Davenport, C.; Boudette, N.E. Biden Plans an Electric Vehicle Revolution. Now, the Hard Part. The New York Times, 13 April 2023. [Google Scholar]
  2. The White House. FACT SHEET: Biden-Harris Administration Announces New Standards and Major Progress for a Made-in-America National Network of Electric Vehicle Chargers. Available online: https://www.whitehouse.gov/briefing-room/statements-releases/2023/02/15/fact-sheet-biden-harris-administration-announces-new-standards-and-major-progress-for-a-made-in-america-national-network-of-electric-vehicle-chargers/ (accessed on 31 July 2023).
  3. Indiana Department of Transporation. Electric Vehicle Charging Infrastructure Network. Available online: https://www.in.gov/indot/current-programs/innovative-programs/electric-vehicle-charging-infrastructure-network/ (accessed on 31 July 2023).
  4. Staying Safe at the Pump. Available online: https://www.api.org/oil-and-natural-gas/consumer-information/consumer-resources/staying-safe-pump (accessed on 31 July 2023).
  5. From Zero to Charged: Understanding the Factors that Affect EV Charging Time. Energy5 Your Way. Available online: https://energy5.com/from-zero-to-charged-understanding-the-factors-that-affect-ev-charging-time (accessed on 31 July 2023).
  6. Ritchie, C. What Factors Affect EV Charging Speed? Save On Energy. Available online: https://www.saveonenergy.com/ev/charging-speed-tips/ (accessed on 31 July 2023).
  7. US Department of Transportation. Charger Types and Speeds. Available online: https://www.transportation.gov/rural/ev/toolkit/ev-basics/charging-speeds (accessed on 31 July 2023).
  8. TESLA. Charging Your Tesla. Available online: https://www.tesla.com/support/charging (accessed on 31 July 2023).
  9. Hecht, C.; Figgener, J.; Sauer, D.U. Analysis of Electric Vehicle Charging Station Usage and Profitability in Germany Based on Empirical Data. iScience 2022, 25, 105634. [Google Scholar] [CrossRef]
  10. Mortimer, B.J.; Hecht, C.; Goldbeck, R.; Sauer, D.U.; De Doncker, R.W. Electric Vehicle Public Charging Infrastructure Planning Using Real-World Charging Data. World Electr. Veh. J. 2022, 13, 94. [Google Scholar] [CrossRef]
  11. Pevec, D.; Babic, J.; Kayser, M.A.; Carvalho, A.; Ghiassi-Farrokhfal, Y.; Podobnik, V. A Data-Driven Statistical Approach for Extending Electric Vehicle Charging Infrastructure. Int. J. Energy Res. 2018, 42, 3102–3120. [Google Scholar] [CrossRef]
  12. Gellrich, M.; Block, A.; Leikert-Böhm, N. Spatial and Temporal Patterns of Electric Vehicle Charging Station Utilization: A Nationwide Case Study of Switzerland. Environ. Res. Infrastruct. Sustain. 2022, 2, 021003. [Google Scholar] [CrossRef]
  13. Jonas, T.; Daniels, N.; Macht, G. Electric Vehicle User Behavior: An Analysis of Charging Station Utilization in Canada. Energies 2023, 16, 1592. [Google Scholar] [CrossRef]
  14. Lim, K.L.; Speidel, S.; Bräunl, T. A Comparative Study of AC and DC Public Electric Vehicle Charging Station Usage in Western Australia. Renew. Sustain. Energy Transit. 2022, 2, 100021. [Google Scholar] [CrossRef]
  15. Chen, C.; Song, Y.; Hu, X.; Guardiola, I.G. Analysis of Electric Vehicle Charging Behavior Patterns with Function Principal Component Analysis Approach. J. Adv. Transp. 2020, 2020, 8850654. [Google Scholar] [CrossRef]
  16. Borlaug, B.; Yang, F.; Pritchard, E.; Wood, E.; Gonder, J. Public Electric Vehicle Charging Station Utilization in the United States. Transp. Res. Part D Transp. Environ. 2023, 114, 103564. [Google Scholar] [CrossRef]
  17. Wood, E.; Rames, C.; Muratori, M.; Raghavan, S.; Melaina, M. National Plug-In Electric Vehicle Infrastructure Analysis; National Renewable Energy Lab. (NREL): Golden, CO, USA, 2017.
  18. Desai, J.; Mathew, J.K.; Li, H.; Bullock, D.M. Analysis of Electric and Hybrid Vehicle Usage in Proximity to Charging Infrastructure in Indiana. J. Transp. Technol. 2021, 11, 577–596. [Google Scholar] [CrossRef]
  19. Desai, J.; Mathew, J.K.; Li, H.; Bullock, D.M. Using Connected Vehicle Data for Assessing Electric Vehicle Charging Infrastructure Usage and Investment Opportunities. Inst. Transp. Eng. ITE J. 2022, 92, 22–31. [Google Scholar]
  20. Desai, J.; Mathew, J.K.; Li, H.; Bullock, D.M. Leveraging Connected Vehicle Data to Assess Interstate Exit Utilization and Identify Charging Infrastructure Investment Allocation Opportunities. World Electr. Veh. J. 2022, 13, 167. [Google Scholar] [CrossRef]
  21. Ucer, E.; Koyuncu, I.; Kisacikoglu, M.C.; Yavuz, M.; Meintz, A.; Rames, C. Modeling and Analysis of a Fast Charging Station and Evaluation of Service Quality for Electric Vehicles. IEEE Trans. Transp. Electrif. 2019, 5, 215–225. [Google Scholar] [CrossRef]
  22. Guo, S.; Zhao, H. Optimal Site Selection of Electric Vehicle Charging Station by Using Fuzzy TOPSIS Based on Sustainability Perspective. Appl. Energy 2015, 158, 390–402. [Google Scholar] [CrossRef]
  23. Hosseini, S.; Sarder, M. Development of a Bayesian Network Model for Optimal Site Selection of Electric Vehicle Charging Station. Int. J. Electr. Power Energy Syst. 2019, 105, 110–122. [Google Scholar] [CrossRef]
  24. Ju, Y.; Ju, D.; Santibanez Gonzalez, E.D.R.; Giannakis, M.; Wang, A. Study of Site Selection of Electric Vehicle Charging Station Based on Extended GRP Method under Picture Fuzzy Environment. Comput. Ind. Eng. 2019, 135, 1271–1285. [Google Scholar] [CrossRef]
  25. Chakraborty, D.; Bunch, D.S.; Lee, J.H.; Tal, G. Demand Drivers for Charging Infrastructure-Charging Behavior of Plug-in Electric Vehicle Commuters. Transp. Res. Part D Transp. Environ. 2019, 76, 255–272. [Google Scholar] [CrossRef]
  26. Visaria, A.A.; Jensen, A.F.; Thorhauge, M.; Mabit, S.E. User Preferences for EV Charging, Pricing Schemes, and Charging Infrastructure. Transp. Res. Part A Policy Pract. 2022, 165, 120–143. [Google Scholar] [CrossRef]
  27. González, J.; Alvaro, R.; Gamallo, C.; Fuentes, M.; Fraile-Ardanuy, J.; Knapen, L.; Janssens, D. Determining Electric Vehicle Charging Point Locations Considering Drivers’ Daily Activities. Procedia Comput. Sci. 2014, 32, 647–654. [Google Scholar] [CrossRef]
  28. Lee, J.H.; Chakraborty, D.; Hardman, S.J.; Tal, G. Exploring Electric Vehicle Charging Patterns: Mixed Usage of Charging Infrastructure. Transp. Res. Part D Transp. Environ. 2020, 79, 102249. [Google Scholar] [CrossRef]
  29. Brooker, R.P.; Qin, N. Identification of Potential Locations of Electric Vehicle Supply Equipment. J. Power Sources 2015, 299, 76–84. [Google Scholar] [CrossRef]
  30. Philipsen, R.; Schmidt, T.; van Heek, J.; Ziefle, M. Fast-Charging Station Here, Please! User Criteria for Electric Vehicle Fast-charging Locations. Transp. Res. Part F Traffic Psychol. Behav. 2016, 40, 119–129. [Google Scholar] [CrossRef]
  31. Anderson, J.E.; Lehne, M.; Hardinghaus, M. What Electric Vehicle Users Want: Real-World Preferences for Public Charging Infrastructure. Int. J. Sustain. Transp. 2018, 12, 341–352. [Google Scholar] [CrossRef]
  32. Derrell Turner, National Electric Vehicle Infrastructure Formula Program Guidance (Update). Available online: https://www.fhwa.dot.gov/environment/nevi/formula_prog_guid/90d_nevi_formula_program_guidance.pdf (accessed on 2 June 2023).
  33. Ahmad, B.I.; Langdon, P.M.; Liang, J.; Godsill, S.J.; Delgado, M.; Popham, T. Driver and Passenger Identification From Smartphone Data. IEEE Trans. Intell. Transp. Syst. 2019, 20, 1278–1288. [Google Scholar] [CrossRef]
  34. Saldivar-Carranza, E.; Li, H.; Mathew, J.; Hunter, M.; Sturdevant, J.; Bullock, D.M. Deriving Operational Traffic Signal Performance Measures from Vehicle Trajectory Data. Transp. Res. Rec. 2021, 2675, 1250–1264. [Google Scholar] [CrossRef]
  35. Desai, J.; Mathew, J.K.; Li, H.; Sakhare, R.S.; Horton, D.; Bullock, D.M. National Mobility Analysis for All Interstate Routes in the United States: December 2022; Purdue University: West Lafayette, IN, USA, 2022. [Google Scholar] [CrossRef]
  36. Mahlberg, J.A.; Sakhare, R.S.; Li, H.; Mathew, J.K.; Bullock, D.M.; Surnilla, G.C. Prioritizing Roadway Pavement Marking Maintenance Using Lane Keep Assist Sensor Data. Sensors 2021, 21, 6014. [Google Scholar] [CrossRef] [PubMed]
  37. Mahlberg, J.A.; Li, H.; Zachrisson, B.; Leslie, D.K.; Bullock, D.M. Pavement Quality Evaluation Using Connected Vehicle Data. Sensors 2022, 22, 9109. [Google Scholar] [CrossRef] [PubMed]
  38. George, Patrick How Occupant Classification Systems Work. HowStuffWorks. Available online: https://auto.howstuffworks.com/car-driving-safety/safety-regulatory-devices/ocs.htm (accessed on 29 August 2023).
  39. Parra, M. How Does My Truck “Know” If There Is a Passenger Sitting in the Passenger Seat? Your Mechanic. Available online: https://www.yourmechanic.com/question/how-does-my-truck-know-if-there-is-a-passenger-sitting-in-the-passenger-seat (accessed on 29 August 2023).
  40. Tsihrintzis, G.A.; Virvou, M.; Evangelos, S.; Jain, L.C. (Eds.) Learning and Analytics in Intelligent Systems; Springer International Publishing: Cham, Switzerland, 2019; Volume 1, ISBN 978-3-030-15627-5. [Google Scholar]
  41. Zhang, Y.; Fricker, J.D. Incorporating Conflict Risks in Pedestrian-Motorist Interactions: A Game Theoretical Approach. Accid. Anal. Prev. 2021, 159, 106254. [Google Scholar] [CrossRef]
  42. Tran, D.N.-N.; Pham, L.H.; Jeon, H.-J.; Nguyen, H.-H.; Jeon, H.-M.; Tran, T.H.-P.; Jeon, J. A Robust Traffic-Aware City-Scale Multi-Camera Vehicle Tracking of Vehicles. In Proceedings of the 2022 IEEE/CVF Conference on Computer Vision and Pattern Recognition Workshops (CVPRW), New Orleans, LA, USA, 19–20 June 2022. [Google Scholar]
  43. Cao, X.-B.; Qiao, H.; Keane, J. A Low-Cost Pedestrian-Detection System With a Single Optical Camera. IEEE Trans. Intell. Transp. Syst. 2008, 9, 58–67. [Google Scholar] [CrossRef]
  44. McGuckin, N.; Fucci, A. Summary of Travel Trends: 2017 National Household Travel Survey; Publication FHWA-PL-18-019; United States Department of Transportation, Federal Highway Administration: Washington, DC, USA, 2018; pp. 1–148.
  45. Singhal, A.; Kamga, C.; Yazici, A. Impact of weather on urban transit ridership. Transp. Res. Part A Policy Pract. 2014, 69, 379–391. [Google Scholar] [CrossRef]
  46. Hosseinzadeh, A.; Karimpour, A.; Kluger, R. Factors Influencing Shared Micromobility Services: An Analysis of E-Scooters and Bikeshare. Transp. Res. Part D Transp. Environ. 2021, 100, 103047. [Google Scholar] [CrossRef]
  47. Sakhare, R.S.; Zhang, Y.; Li, H.; Bullock, D.M. Impact of Rain Intensity on Interstate Traffic Speeds Using Connected Vehicle Data. Vehicles 2023, 5, 133–155. [Google Scholar] [CrossRef]
  48. National Oceanic and Atmospheric Administration. GFS. Available online: https://www.emc.ncep.noaa.gov/emc/pages/numerical_forecast_systems/gfs.php (accessed on 1 November 2023).
  49. USGS Water Science School. Rainfall Calculator, Metric-How Much Water Falls during a Storm? Available online: https://water.usgs.gov/edu/activity-howmuchrain-metric.html (accessed on 1 November 2023).
  50. Bureau of Transportation Statistics. National Household Travel Survey Daily Travel Quick Facts. Available online: https://www.bts.gov/statistical-products/surveys/national-household-travel-survey-daily-travel-quick-facts (accessed on 6 October 2023).
  51. U.S. Department of Transportation, Washington, DC. Federal Highway Administration 2017 National Household Travel Survey. Available online: https://nhts.ornl.gov/ (accessed on 28 July 2023).
Figure 1. Charging station study location. Callout i is the Electrify America charging stations, callout ii is the Tesla charging stations. (The left map is produced with Leaflet; The right map is updated with the Google Map Attribution.)
Wevj 14 00308 g001
Figure 2. Charging station layout and charging output. (a) Electrify America charging stations; (b) Tesla charging stations (150 kW).
Wevj 14 00308 g002
Figure 3. Monitoring of different driver activities, the red circle marks the EV driver. (a) Driver entering shop; (b) driver remaining in vehicle; (c) driver picked up and leaving premises.
Wevj 14 00308 g003
Figure 4. Driver activity while charging the vehicle. (a) Electrify America; (b) Tesla.
Wevj 14 00308 g004
Figure 5. Boxplot of dwell times by driver activity.
Wevj 14 00308 g005
Figure 6. Station utilization. (a) Electrify America; (b) Tesla.
Wevj 14 00308 g006
Figure 7. Surface rain accumulations around charging stations.
Wevj 14 00308 g007
Figure 8. Average charge counts by time of day, comparing moderate to greater and minimal to no rain days.
Wevj 14 00308 g008
Figure 9. Boxplot of dwell time by station type.
Wevj 14 00308 g009
Figure 10. Electric vehicle charging utilization by time of day. (a) Tesla, 150 kW; (b) Electrify America, 350 kW; (c) Electrify America, 150 kW; (d) Electrify America, 50 kW.
Wevj 14 00308 g010aWevj 14 00308 g010b
Figure 11. Peak utilization of Tesla 150 kW charging stations sorted in rank order. (a) All Tesla 150 kW percent utilization by date and hour; (b) top 30 Tesla 150 kW percent utilization by date and hour.
Wevj 14 00308 g011
Figure 12. Average utilization of a Tesla 150 kW charging station by weekday.
Wevj 14 00308 g012
Table 1. Driver activity while charging the vehicles.
Driver ActivityNumber of Electrify America ObservationsElectrify America Percent (%)Number of Tesla ObservationsTesla
Percent (%)
Waits in Vehicle54145.1%137743.2%
Travels to Shops41935.0%143945.2%
Travels to Shops and Waits in Vehicle15813.2%3139.8%
Walks Pet443.7%170.5%
Unknown242.0%100.3%
Left the Premises121.0%331.0%
Table 2. Station utilization by vehicle counts.
StationElectrify America ObservationsElectrify America PercentStationTesla ObservationsTesla
Percent
Station 1
(350 kW)
22218.5%Station 1
(150 kW)
47715.0%
Station 2
(50 kW)
423.5%Station 2
(150 kW)
40312.6%
Station 3
(350 kW)
33628.0%Station 3
(150 kW)
38212.0%
Station 4
(150 kW)
272.3%Station 4
(150 kW)
40312.6%
Station 5
(350 kW)
715.9%Station 5
(150 kW)
34710.9%
Station 6
(150 kW)
29124.3%Station 6
(150 kW)
40412.7%
Station 7
(350 kW)
18915.8%Station 7
(150 kW)
33910.6%
Station 8
(150 kW)
201.7%Station 8
(150 kW)
43413.6%
Disclaimer/Publisher’s Note: The statements, opinions and data contained in all publications are solely those of the individual author(s) and contributor(s) and not of MDPI and/or the editor(s). MDPI and/or the editor(s) disclaim responsibility for any injury to people or property resulting from any ideas, methods, instructions or products referred to in the content.

