Article

Polarity Directed Appraisal of Pharmacological Potential and HPLC-DAD Based Phytochemical Profiling of Polygonum glabrum Willd

1
Department of Pharmacy, Faculty of Biological Sciences, Quaid-i-Azam University, Islamabad 45320, Pakistan
2
Shifa College of Pharmaceutical Sciences, Shifa Tameer-e-Millat University, Islamabad 44000, Pakistan
3
Department of Biological Sciences, National University of Medical Sciences, Rawalpindi 43600, Pakistan
4
Botany and Microbiology Department, College of Science, King Saud University, Riyadh 11451, Saudi Arabia
5
Department of Food Sciences and Nutrition, College of Food and Agriculture Sciences, King Saud University, Riyadh 11451, Saudi Arabia
6
Integrated Molecular Plant Physiology Research, Department of Biology, University of Antwerp, 2020 Antwerpen, Belgium
*
Authors to whom correspondence should be addressed.
Molecules 2022, 27(2), 474; https://doi.org/10.3390/molecules27020474
Submission received: 19 November 2021 / Revised: 30 December 2021 / Accepted: 1 January 2022 / Published: 12 January 2022

Abstract

:
The present study was designed to evaluate polarity-dependent extraction efficiency and pharmacological profiling of Polygonum glabrum Willd. Crude extracts of leaves, roots, stems, and seeds, prepared from solvents of varying polarities, were subjected to phytochemical, antioxidant, antibacterial, antifungal, antidiabetic, and cytotoxicity assays. Maximum extraction yield (20.0% w/w) was observed in the case of an acetone:methanol (AC:M) root extract. Distilled water:methanol (W:M) leaves extract showed maximum phenolic contents. Maximum flavonoid content and free radical scavenging potential were found in methanolic (M) seed extract. HPLC-DAD quantification displayed the manifestation of substantial quantities of quercetin, rutin, gallic acid, quercetin, catechin, and kaempferol in various extracts. The highest ascorbic acid equivalent total antioxidant capacity and reducing power potential was found in distilled water roots and W:M leaf extracts, respectively. Chloroform (C) seeds extract produced a maximum zone of inhibition against Salmonella typhimurium. Promising protein kinase inhibition and antifungal activity against Mucor sp. were demonstrated by C leaf extract. AC:M leaves extract exhibited significant cytotoxic capability against brine shrimp larvae and α-amylase inhibition. Present results suggest that the nature of pharmacological responses depends upon the polarity of extraction solvents and parts of the plant used. P. glabrum can be considered as a potential candidate for the isolation of bioactive compounds with profound therapeutic importance.

Graphical Abstract

1. Introduction

Plant extracts are being used to cure various ailments since antiquity. According to estimates, more than 70% of people in the world still rely on traditional medicinal plants for their primary health care needs. Plants being an unremitting source of lead compounds have been exploited for the identification and isolation of significant secondary metabolites which have been included in modern therapeutic regimens, including quinine, artemisinin, vincristine, vinblastine, paclitaxel, etc. [1]. The herbal extracts that are usually originated and used by the indigenous communities have continuously been monitored over generations by their efficacy and side effects [2]. However, systematic scientific data on the efficacy, mode of action, and active constituents are still under development. Recent times have seen a growing interest in such investigations of the plant kingdom to ascertain the activity of the extracts and categorize active compounds [3].
Polygonum glabrum belongs to the family Polygonaceae. This family consists of nearly 50 genera with 1120 species, including herbs (both monoecious and dioecious), shrubs, and small trees [4]. The genus Polygonum L. has almost 300 species around the world in temperate climates [5]. This genus is well known for producing a wide variety of bioactive compounds, e.g., tannins, triterpenoids, anthraquinones, coumarins, phenylpropanoids, lignans, and flavonoids, as the dominating group of constituents [5,6,7,8,9]. P. glabrum is mostly found on the river banks, marshy areas, and streamside in the form of clumps. In traditional practice, its roots are used in piles, debility, consumption, and jaundice. P. glabrum is reported to have good activity against Micrococcus pyrogens and Diplococcus pyrogens [8,10]. The screening of the chloroform extract indicated the presence of some alkaloids, carbohydrates, and flavonoids [11]. However, a comprehensive review of the literature suggests that a colossal effort to ascertain the curative perspective of individual parts of P. glabrum by using an extensive array of bioassays is yet to be placed.
The current study has exploited a wide variety of extraction solvents having varying polarities to observe their effects on extraction productivity and bioactivity. Furthermore, our interest was to explore the correlation between different phytochemicals and antioxidant, antimicrobial, cytotoxic, as well as antidiabetic behavior of stem, seeds, leaves, and roots of P. glabrum. To the best of our knowledge, polarity-dependent extensive study along with protein kinase and α-amylase inhibition potential has been done and reported for the first time on this plant.

2. Material and Method

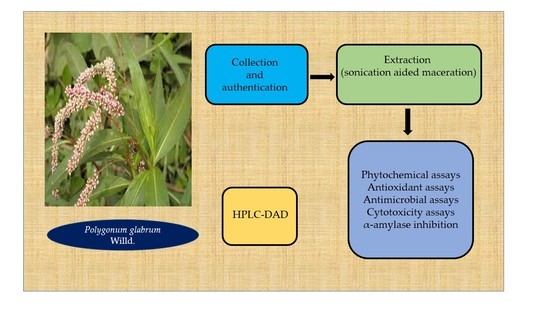
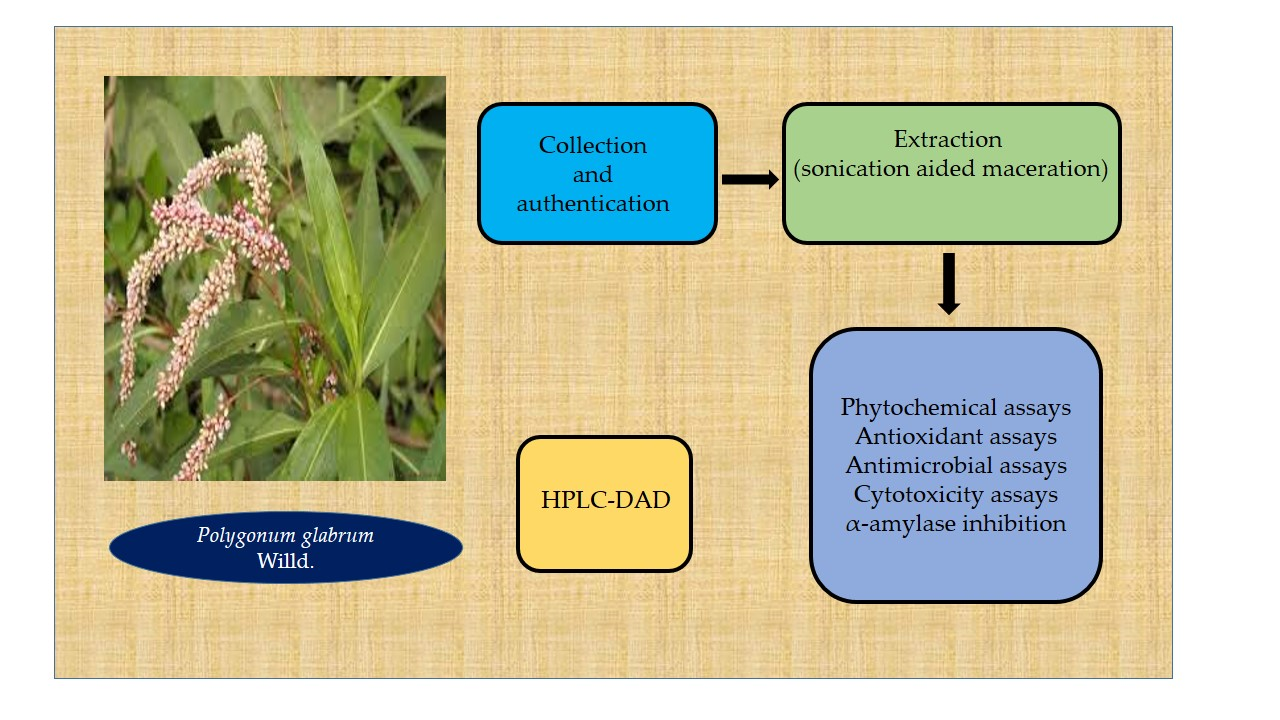
2.1. Preparation of Crude Extracts

After collection of the plant from Quaid-i-Azam University, Islamabad, Pakistan, in October 2019, identification was carried out, and the plant specimen was documented by the herbarium number PHM-488 in the herbarium of medicinal plants, Quaid-i-Azam University, Islamabad, Pakistan.
For the preparation of test extracts, different plant parts (leaves, stems, roots, and seeds) were separately washed under running tap water to eliminate waste products such as dust, etc., shade dried for 6 weeks and ground afterward. The finely powdered material of all parts was soaked using the maceration process with continuous sonication separately in 14 solvent systems, including n-hexane (NH), chloroform (CH), Ethyl acetate (EA), Acetone (AC), Methanol (M), Ethanol (ET), Distilled water (W), n-hexane:Ethyl acetate (NH:EA), n-hexane:Ethanol (NH:ET), Chloroform:Methanol (CH:M), Ethyl acetate:Methanol (EA:M), Acetone:Methanol (AC:M), Distilled water:acetone (W:AC), and Distilled water:Methanol (W:M). Sixty grams of powdered material was macerated in 250 mL of each solvent system followed by ultrasonication 3–5 times a day at room temperature for 5 min. This procedure was repeated three times by combining all the resulting filtrates, followed by drying using a rotary evaporator. It was then placed under a vacuum at 45 °C for the removal of residual traces of solvents. The crude extracts, ready for final use, were then stored at −20 °C till further usage. Dried crude extracts were weighed using weighing balance, and percent extract recovery was calculated using the following formula:
Percent   extract   recovery = We Wp × 100
where Wp = Weight of dried powder and We = Weight of the crude extract.

2.2. Phytochemical Analysis

2.2.1. Total Phenolic Content (TPC)

Previously described protocol was followed to assess total phenolic content [12]. Gallic acid was used as a positive control, while DMSO was used as a negative control. For each run, the reaction mixture comprising an aliquot of 20 μL test sample (4 mg/mL in DMSO), 90 μL of Folin-Ciocalteu reagent (10 times diluted), and 90 μL of Na2CO3 (6% w/v) was incubated for 30 min, and absorbance was taken at 630 nm. Different concentrations of Gallic acid (50, 25, 12.5, and 6.25 µg/mL) were used to develop calibration curve (y = 0.639x + 0.556; R2 = 0.9717) to calculate µg Gallic acid equivalents (GAE). The assay was run three times under the same experimental conditions, and the results were expressed as average µg GAE/mg extract.

2.2.2. Total Flavonoid Content (TFC)

To determine the total flavonoid contents, a previously described protocol was followed [12]. The reaction mixture contained an aliquot of 20 μL of the test sample (4 mg/mL), 10 μL of 1 M CH3COOK, 10 μL of AlCl3 solution (10% w/v), and 160 μL of distilled water. It was incubated for 30 min at room temperature, after which the absorption was measured at 415 nm. A calibration curve (y = 0.117x + 0.0687, R2 = 0.993) was developed using varying concentrations (6.25–50 μg/mL) of quercetin to calculate quercetin equivalents (QE) in the reaction mixture. The assay was run three times under the same experimental conditions, and the flavonoid contents were expressed as average μg QE/mg extract.

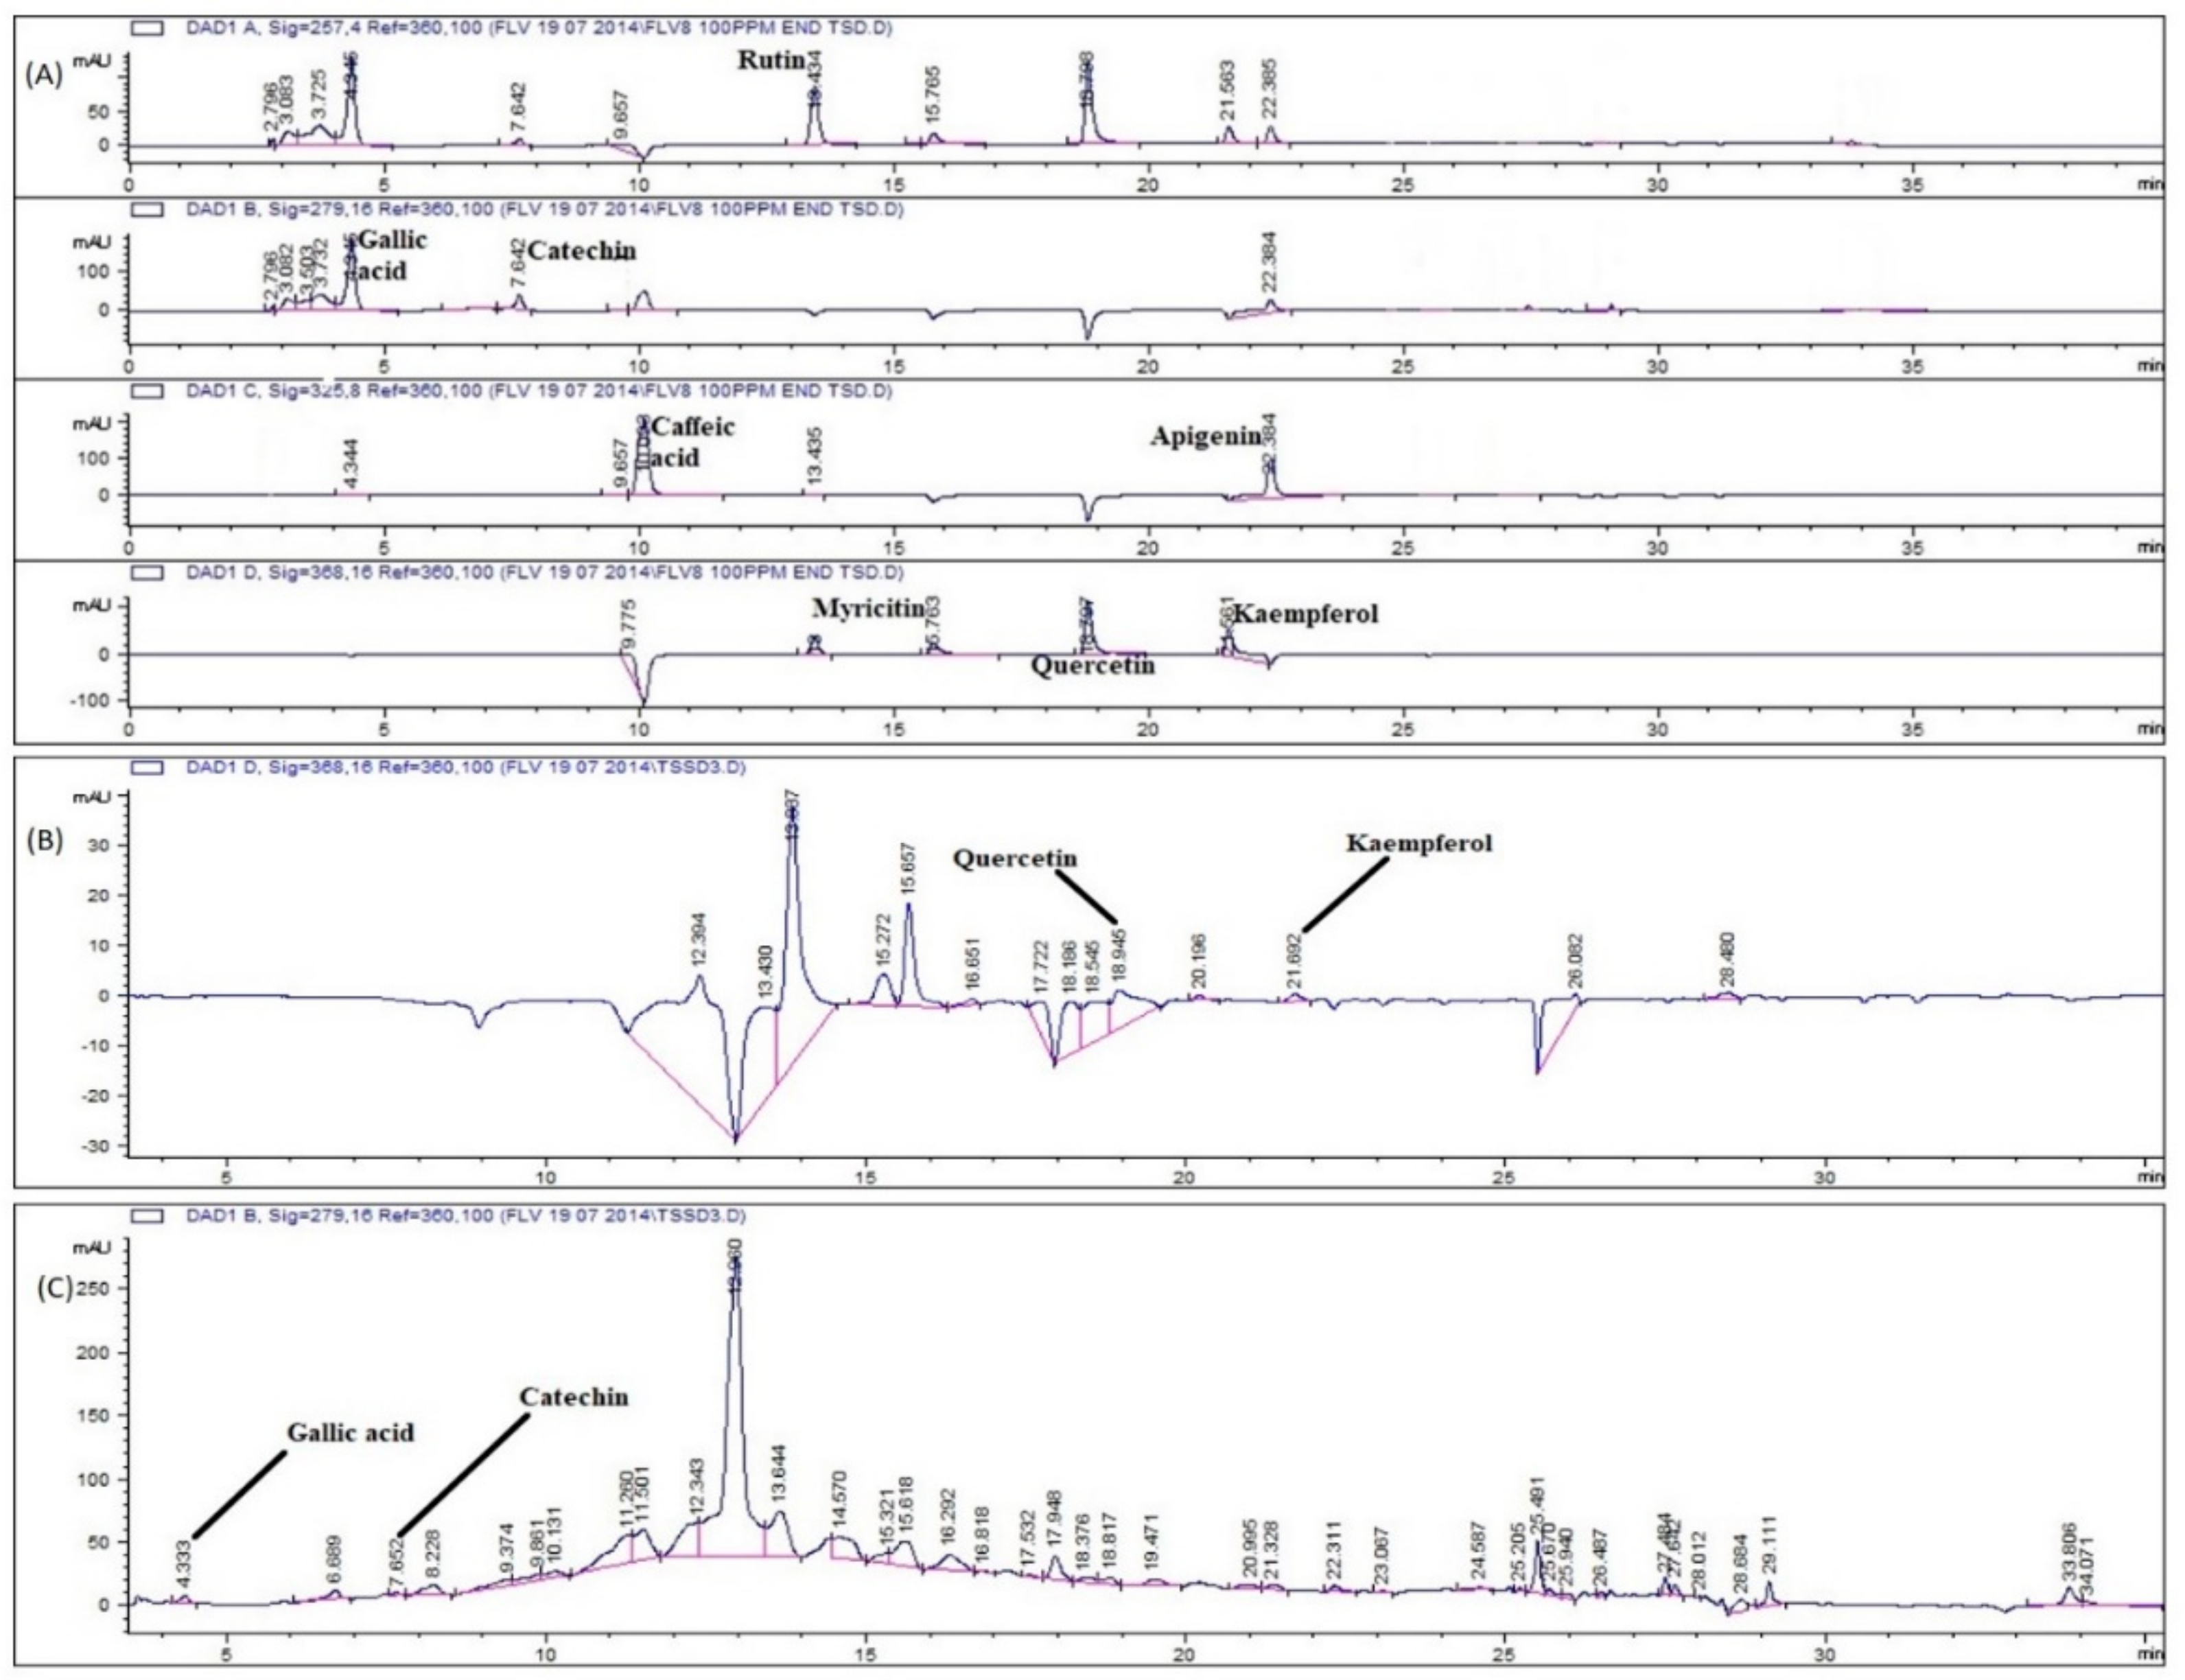
2.2.3. Quantitative Analysis by HPLC-DAD

The previously reported protocol was followed for the HPLC-DAD analysis [13]. HPLC (Agilent 1200 series with binary gradient pump) equipped with C8 analytical column and DAD (Agilent technologies, 156 Germany) was used. Stock solutions of 8 standards were prepared with methanol to obtain the final concentration of 50 µg/mL each. Methanol was used for the preparation of test samples (10 mg/mL). The test samples were first dissolved in methanol, followed by sonication for 5 min. Finally, the test solutions were filtered through 0.2 μm sartolon polyamide membrane filter to remove any impurity left. The solutions were freshly set just before analysis and were kept at 4 °C till further analysis. Two mobile phases were used for the identification and quantification of polyphenols, i.e., mobile phase ‘A’ contained Acetonitrile:methanol:water:acetic acid in a ratio of 5:10:85:1 while mobile phase ‘B’ contained acetonitrile:methanol:acetic acid in a ratio of 40:60:1. The flow rate was kept at 1 mL/min. Aliquots of 20 μL of each sample solution were injected through the injector into the column. The column was reconditioned 10 min before running each sample. The gradient volume of mobile phase B was 0–50% in 0–20 min, 50–100% in 20–25 min finally 100% from 25 to 30 min. The standard compounds were employed in the preparation of stock solutions and subsequent dilutions of varying concentrations, i.e., 12.5, 25, 50, and 100 μg/mL. The calibration curves of each standard were prepared using the data of peak area and concentrations. Subsequently, the same data was utilized to carry out the regression analysis and for the calculations of the limit of detection (LOD) and limit of quantification (LOQ) values. The absorbance of test samples was taken at respective wavelengths, i.e., 257 nm for rutin and gallic acid, 279 nm for catechin, 325 nm for caffeic acid and apigenin, 368 nm for kaempferol, myricetin, and quercetin.

2.3. Pharmacological Evaluation

2.3.1. Antioxidant Assays

DPPH Radical Scavenging Assay

Free radical scavenging activity was performed by following the previously described procedure [12]. Briefly, 10 μL of each test solution with different dilutions was mixed with 190 μL of DPPH solution (9.2 mg/100 mL in methanol) in each well of 96 well plates so that to have final concentrations of 200, 66.66, 22.22, and 7.41 µg/mL. The reaction mixture was incubated at 37 °C for 1 h in a dark area, and the absorbance was taken at 515 nm. The same protocol was followed for the positive control (ascorbic acid at final concentrations of 20, 6.66, 2.22, and 0.74 μg/mL) and negative control (DMSO). Percent DPPH free radical scavenging activity (%FRSA) was determined by the following formula:
% FRSA = 1 As Ac × 100
where As is the absorbance of the sample while Ac is the absorbance of the negative control. The assay was run three times. IC50 values were also calculated for the test samples, which reported radical scavenging activity of greater than 50%.

Total Reducing Power (TRP) Determination

The reducing potential of test samples of P. glabrum was assessed by a previously described protocol [12]. The reaction mixture containing aliquots of 200 μL of samples (4 mg/mL DMSO), 400 μL of each phosphate buffer (0.2 mol/L, pH 6.6) and potassium ferricyanide (1% w/v) was incubated at 50 °C for 20–30 min followed by the addition of 400 µL of trichloroacetic acid (10% w/v). It was then centrifuged for 10 min at 3000 rpm at room temperature. Distilled water (500 µL) and FeCl3 solution (100 µL, 0.1% w/v) was added to the upper layer of centrifuged solution. The absorbance of the plate was taken at 630 nm. A calibration curve (y = 0.388x + 0.19, R2 = 0.9868) of ascorbic acid was obtained at different concentrations (100, 50, 25, 12.5, and 6.25 µg/mL) and the resultant reducing power of each sample was expressed as µg AAE/mg extract. The experiment was done three times under the same experimental conditions.

Total Antioxidant Capacity (TAC) Determination

To evaluate the samples for total antioxidant capacity, a previously described phosphomolybdenum based protocol was followed [12]. The reaction mixture was set by adding aliquots of 100 μL of test extract (4 mg/mL), 900 μL of reagent solution containing 28 mM NaH2PO4, 4 mM ammonium molybdate, and 0.6 M H2SO4. The reaction mixture was incubated at 95 °C for 90 min followed by cooling at ambient temperature. The absorbance of the reaction mixture was taken at 630 nm. Ascorbic acid was employed as a positive control, while DMSO was used as a negative control. Different final concentrations of ascorbic acid (100, 50, 25, and 12.5 μg/mL) were utilized to develop a standard curve (y = 0.51x + 0.61; R2 = 0.995). The experiment was done three times. The final results were expressed as μg AAE/mg extract.

2.3.2. Antimicrobial Assays

Antibacterial Assay

Standard agar disc diffusion method was followed for in vitro antibacterial potential evaluation [13] against four bacterial strains, including Micrococcus luteus, Staphylococcus aureus, Salmonella typhimurium, and Klebsiella pneumoniae. Turbidity of 24 h refreshed microbial culture was standardized as per 0.5 McFarland turbidity standard. To grow bacterial lawn on the sterile nutrient agar plates, the refreshed bacterial culture (50 μL) of 1 × 10⁶ CFU/mL seeding density was poured onto the solidified agar plates and swabbed by using a sterile cotton bud. Sterile filter paper discs (6 mm diameter) permeated with sample (5 μL of 20 mg/mL), a positive control (5 μL of 4 mg/mL cefixime and ciprofloxacin), and a negative control (DMSO) were placed on agar plates followed by incubation for a time period of 24 h at 37 °C. After incubation, a zone of growth inhibition around each disc was observed and measured. Each sample was tested in triplicate.
Samples were also subjected to minimum inhibitory concentration (MIC) determination by the broth microdilution method [13]. Briefly, bacterial inoculum (190 µL) at a density of 5 × 10² CFU/mL, in nutrient broth was incubated with samples (final concentrations of 200, 66.6, 22.2 and 7.4 µg/mL), at 37 °C for 30 min. Afterward, absorbance was measured at 600 nm at day 0, followed by the incubation and re-measurement of the absorbance after 24 h. Results were calculated using the following formula:
% Inhibition   of   growth = 1 Ts Tc × 100
where Ts and Tc represent the turbidity of the sample and control, respectively.

Antifungal Assay

Antifungal potential of the test extracts was assessed using the standard agar disc diffusion method [13] against five fungal strains, i.e., Fusarium solani, Aspergillus fumigatus, Aspergillus niger, Aspergillus flavus, and Mucor sp. An aliquot of 100 μL of freshly prepared standardized spore suspension harvested in 0.02% v/v Tween 20 solution was poured and swabbed on the sterile Sabraud dextrose agar plates. Then 5 μL of sample was loaded on the sterile disc (6 mm) and mounted on the seeded plate. Similarly, clotrimazole (5 μL of 4 mg/mL) was used as positive control, while DMSO was used as a negative control. All the plates were kept for incubation at 28 °C for 24–48 h. The zone of inhibitions around each disc was observed and measured. Each sample was tested in triplicates. Samples having significant activity were further exploited in an assay for MIC determination.

2.3.3. Enzyme Inhibition Assay

α-Amylase Inhibition Assay

α-amylase inhibition potential of test samples was evaluated by following the previously reported standard protocol [12] with minor modifications. Briefly, 15 µL phosphate buffer (pH 6.8), 25 µL alpha amylase enzyme (0.14 U/mL), 10 µL of the test sample (4 mg/mL in DMSO) and 40 µL starch (2 mg/mL in phosphate buffer) was added to the wells of 96-well plates to prepare a reaction mixture. After incubation at 50 °C for 30 min, an aliquot of 20 μL of 1 M HCl was added to halt the reaction, followed by the addition of 90 μL of iodine solution (5 mM iodine and 5 mM potassium iodide) to each well. A blank (containing buffer solution, starch, and DMSO), a negative and positive control containing DMSO and acarbose (250 µM), respectively, instead of sample, were included in the assay. Absorbance measurements were carried out at 540 nm, and the results were expressed as % α-amylase inhibition/mg extract. The following formula was used for the calculation of percent α-amylase inhibition:
%   α amylase   inhibition = OD   of   sample OD   of   negative   control OD   of   blank   OD   of   negative   control × 100

2.3.4. Cytotoxicity Assays

Brine Shrimp Lethality Assay

A 24 h lethality test was performed against brine shrimp (Artemia salina) larvae in accordance with a previously described protocol [12]. Brine shrimps were hatched in simulated seawater (38 g/L supplemented with 6 mg/L dried yeast) by incubating A. salina eggs (Ocean 90, USA) for 24–48 h in a two-compartment plastic tray under light, providing direct illumination and heat (30–32 °C). Pasteur pipette was used for the harvesting of the mature nauplii, and 10 nauplii were transmitted to each well of the 96 well plate. Test samples were initially tested at two-fold concentrations, i.e., 500, 250, 125, 63, and 32 µg/mL, by transferring the equivalent volume of each test solution into the wells containing seawater and nauplii. Doxorubicin (at final concentrations 50, 25, 12.5, 6.25, and 3.125 µg/mL) was used as a positive control while DMSO was used as a negative control. It was kept for incubation for 24 h followed by the counting of the surviving nauplii. The percentage of deaths for each well was determined against each dose and control. The experiment was run three times.

Protein Kinase Inhibition (PKI) Assay

Assessment of test samples against Streptomyces 85E test strain was done by following the previously described protocol [14]. Stremtomyces 85E spores were refreshed using sterile tryptone soya broth (TSB) by incubating at 28 °C for 24 h. The refreshed culture (100 μL) was seeded on the sterile plates containing sterile ISP4 medium (prepared in the lab) and swabbed by using a sterile cotton bud. The sterile filter paper discs (6 mm) were permeated with 5 μL test solution (20 mg/mL in DMSO) and mounted on a freshly seeded media plate. Surfactin (5 μL from 4 mg/mL solution) loaded disc was maintained as positive control while DMSO loaded disc was used as a negative control. Petri plates were kept for incubation at 28 °C for 72–96 h to allow the hyphae development. After the incubation period, the plates were observed for a zone of inhibitions around the impregnated discs. Bald zone represented the inhibition of phosphorylation as spore or hyphae formation was halted in the absence of phosphorylation, while a clear zone of inhibition represented the potential killing effect of sample extract on test strain.

2.4. Data Analysis

All the assays were repeated in triplicate and presented as mean standard deviation. One way ANOVA and post-hoc Turkey HSD (Honest significant difference) test was employed for the comparison of mean values of results. SPSS (IBM SPSS Statistic 20) was used to determine the significance at p < 0.05 (95% confidence interval). Spearman correlation was found among phytochemicals and antioxidant activities. LC50 and IC50 values were calculated using table curve 2D version 4 software.

3. Results

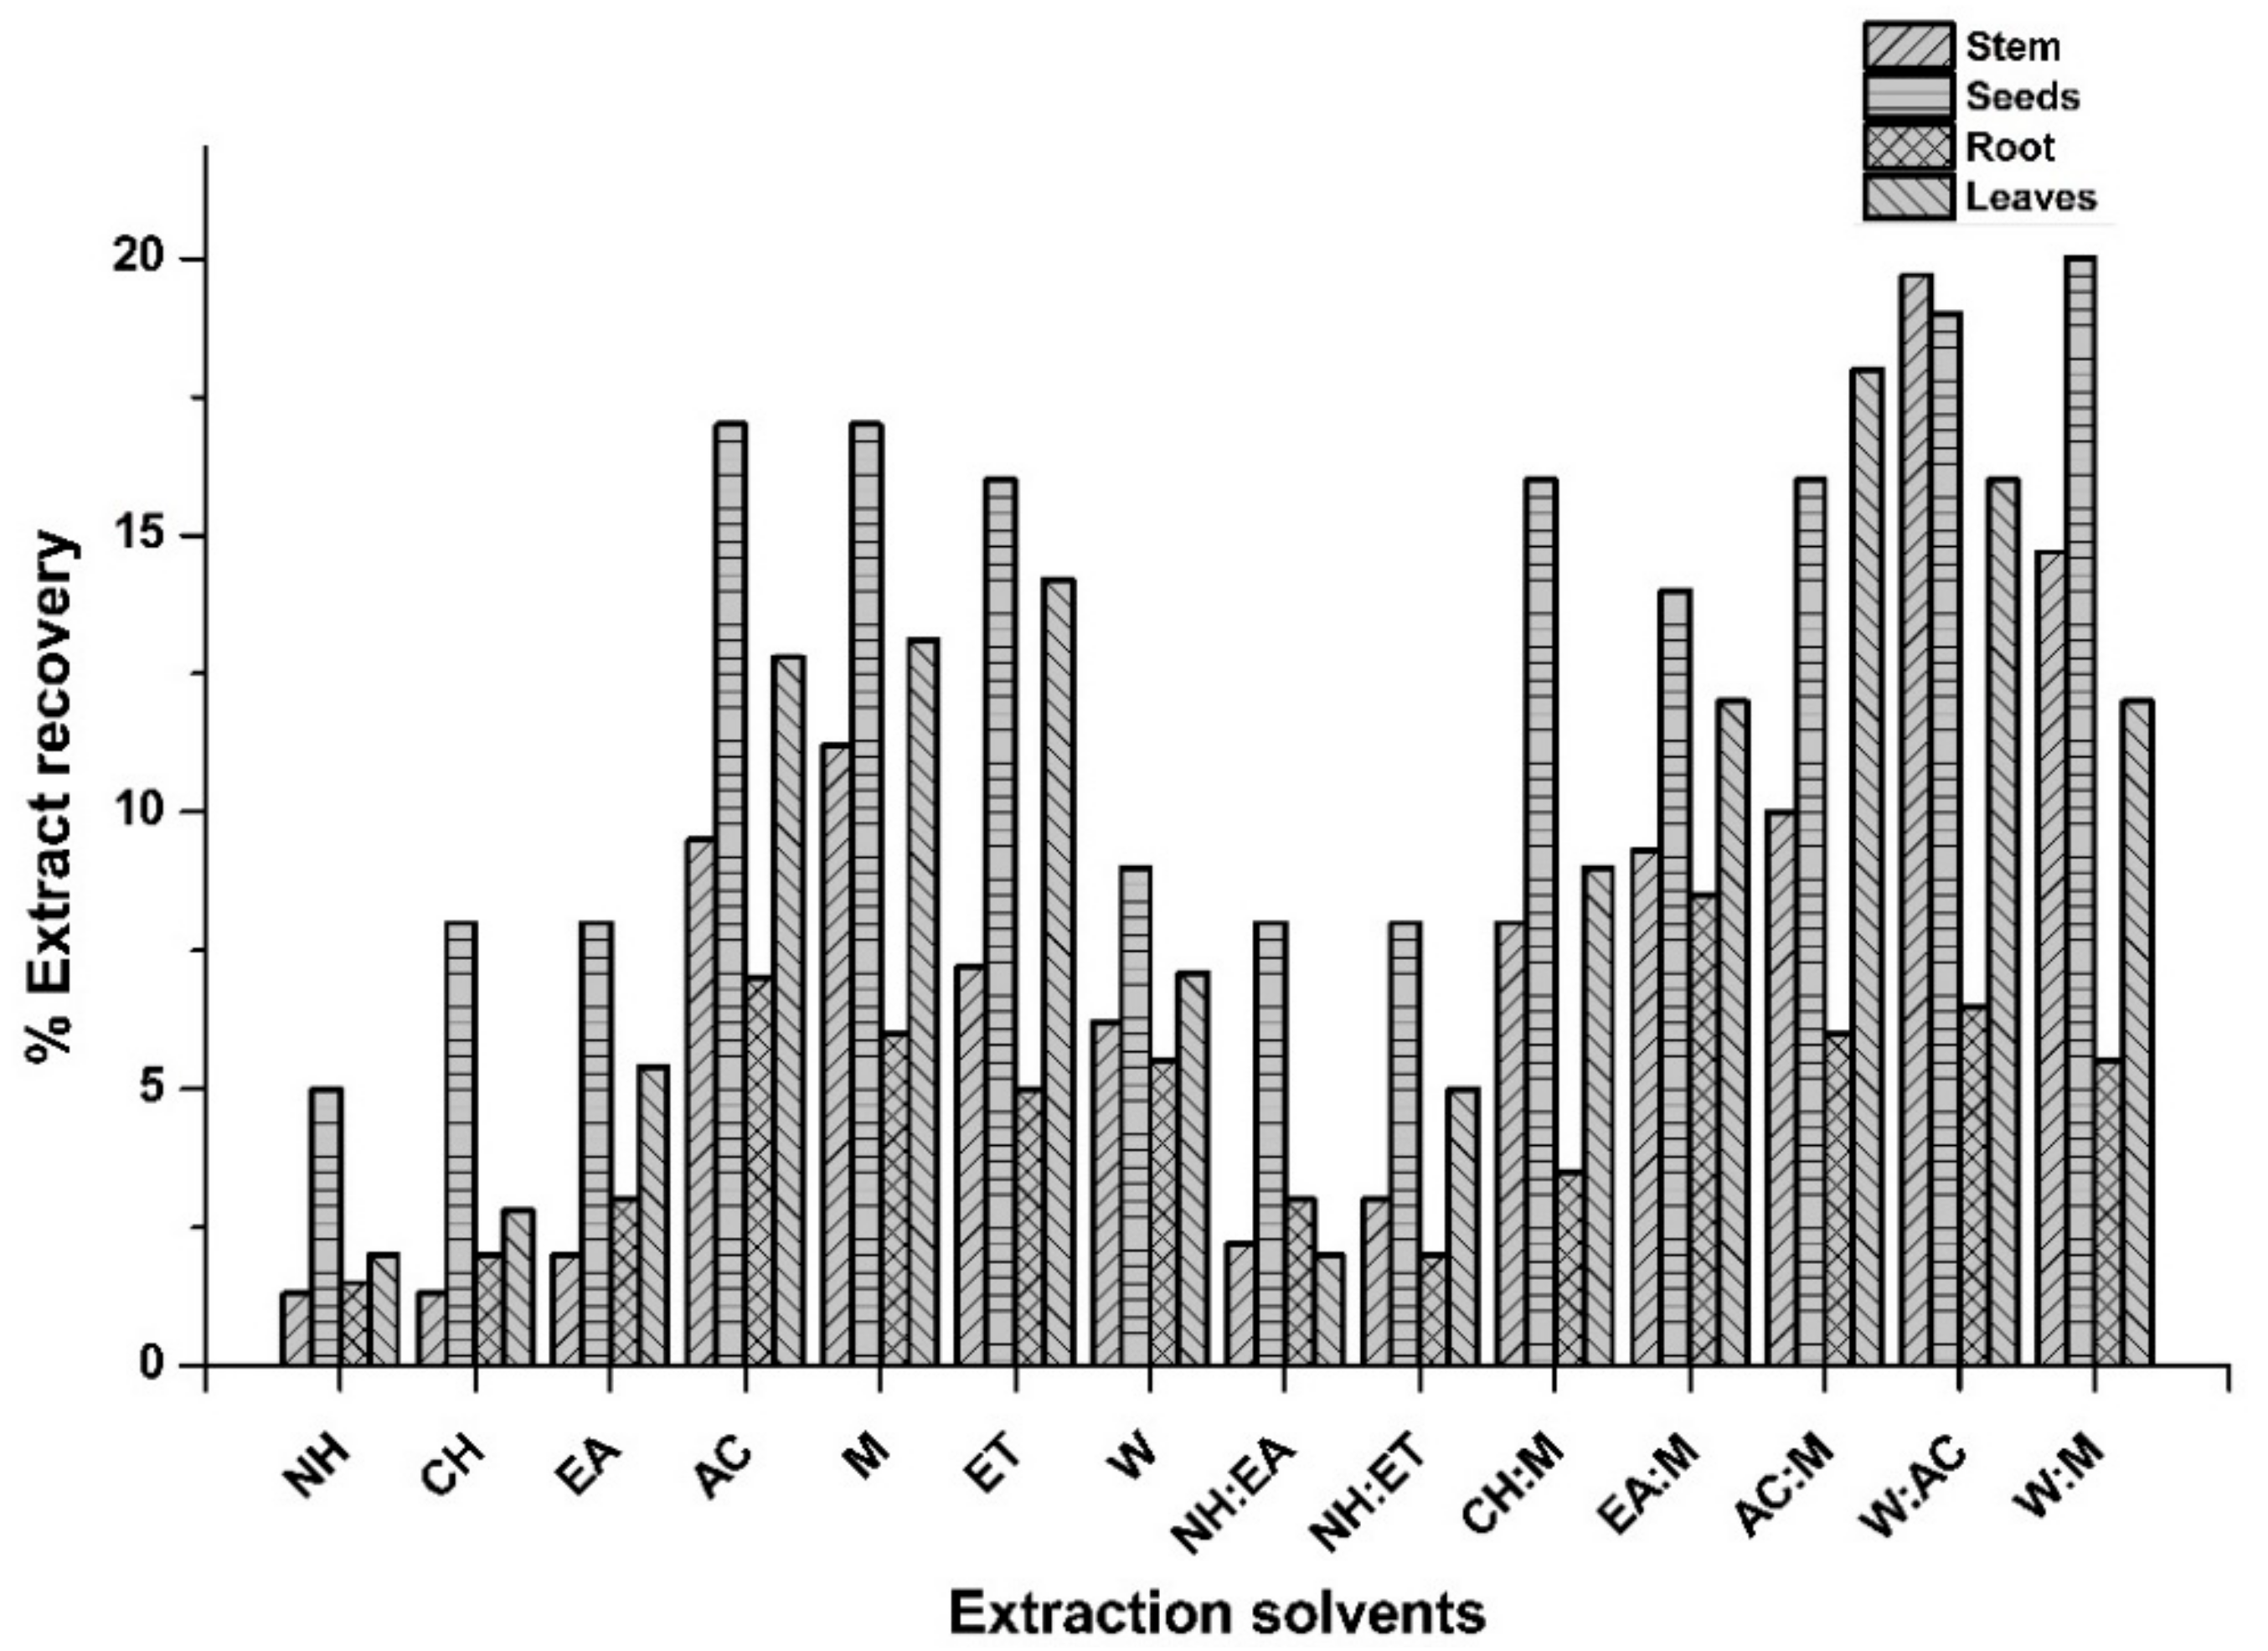
3.1. Percent Extract Recovery

Extraction is the first crucial step towards natural product drug discovery and involves the separation of active constituents from undesired inactive residues. A diversified range of solvent systems as well as sonication-aided maceration was used in order to achieve this target. Total 56 extracts of stem, roots, seeds, and leaves of P. glabrum were prepared in different solvent systems by the process of maceration and were then analyzed to explore various bioactive phytochemicals as well as biological activities. The maximum yield of extract was obtained by W:AC in stem, W:M in root, EA:M in seeds, and AC:M in leaves, i.e., 19.7%, 20.0%, 8.5%, and 18.0% w/w, respectively (Figure 1). The current assessment of extraction yield utilizing various solvents signifies that the solvent and sample composition are the most vital parameters that effect the extraction yield under constant conditions. A decreasing pattern was observed between the polarity of employed solvents and extraction yield as the yield was obtained with polar solvents systems, i.e., W:M and W:AC. The difference in extract recovery might be attributed to the varying polarity of solvents employed, which facilitated the extraction of secondary metabolites having diversified chemical composition [15]. Current findings were in agreement with the previous work where maximum extract yield was obtained when W:M was utilized as the extraction solvent [16].

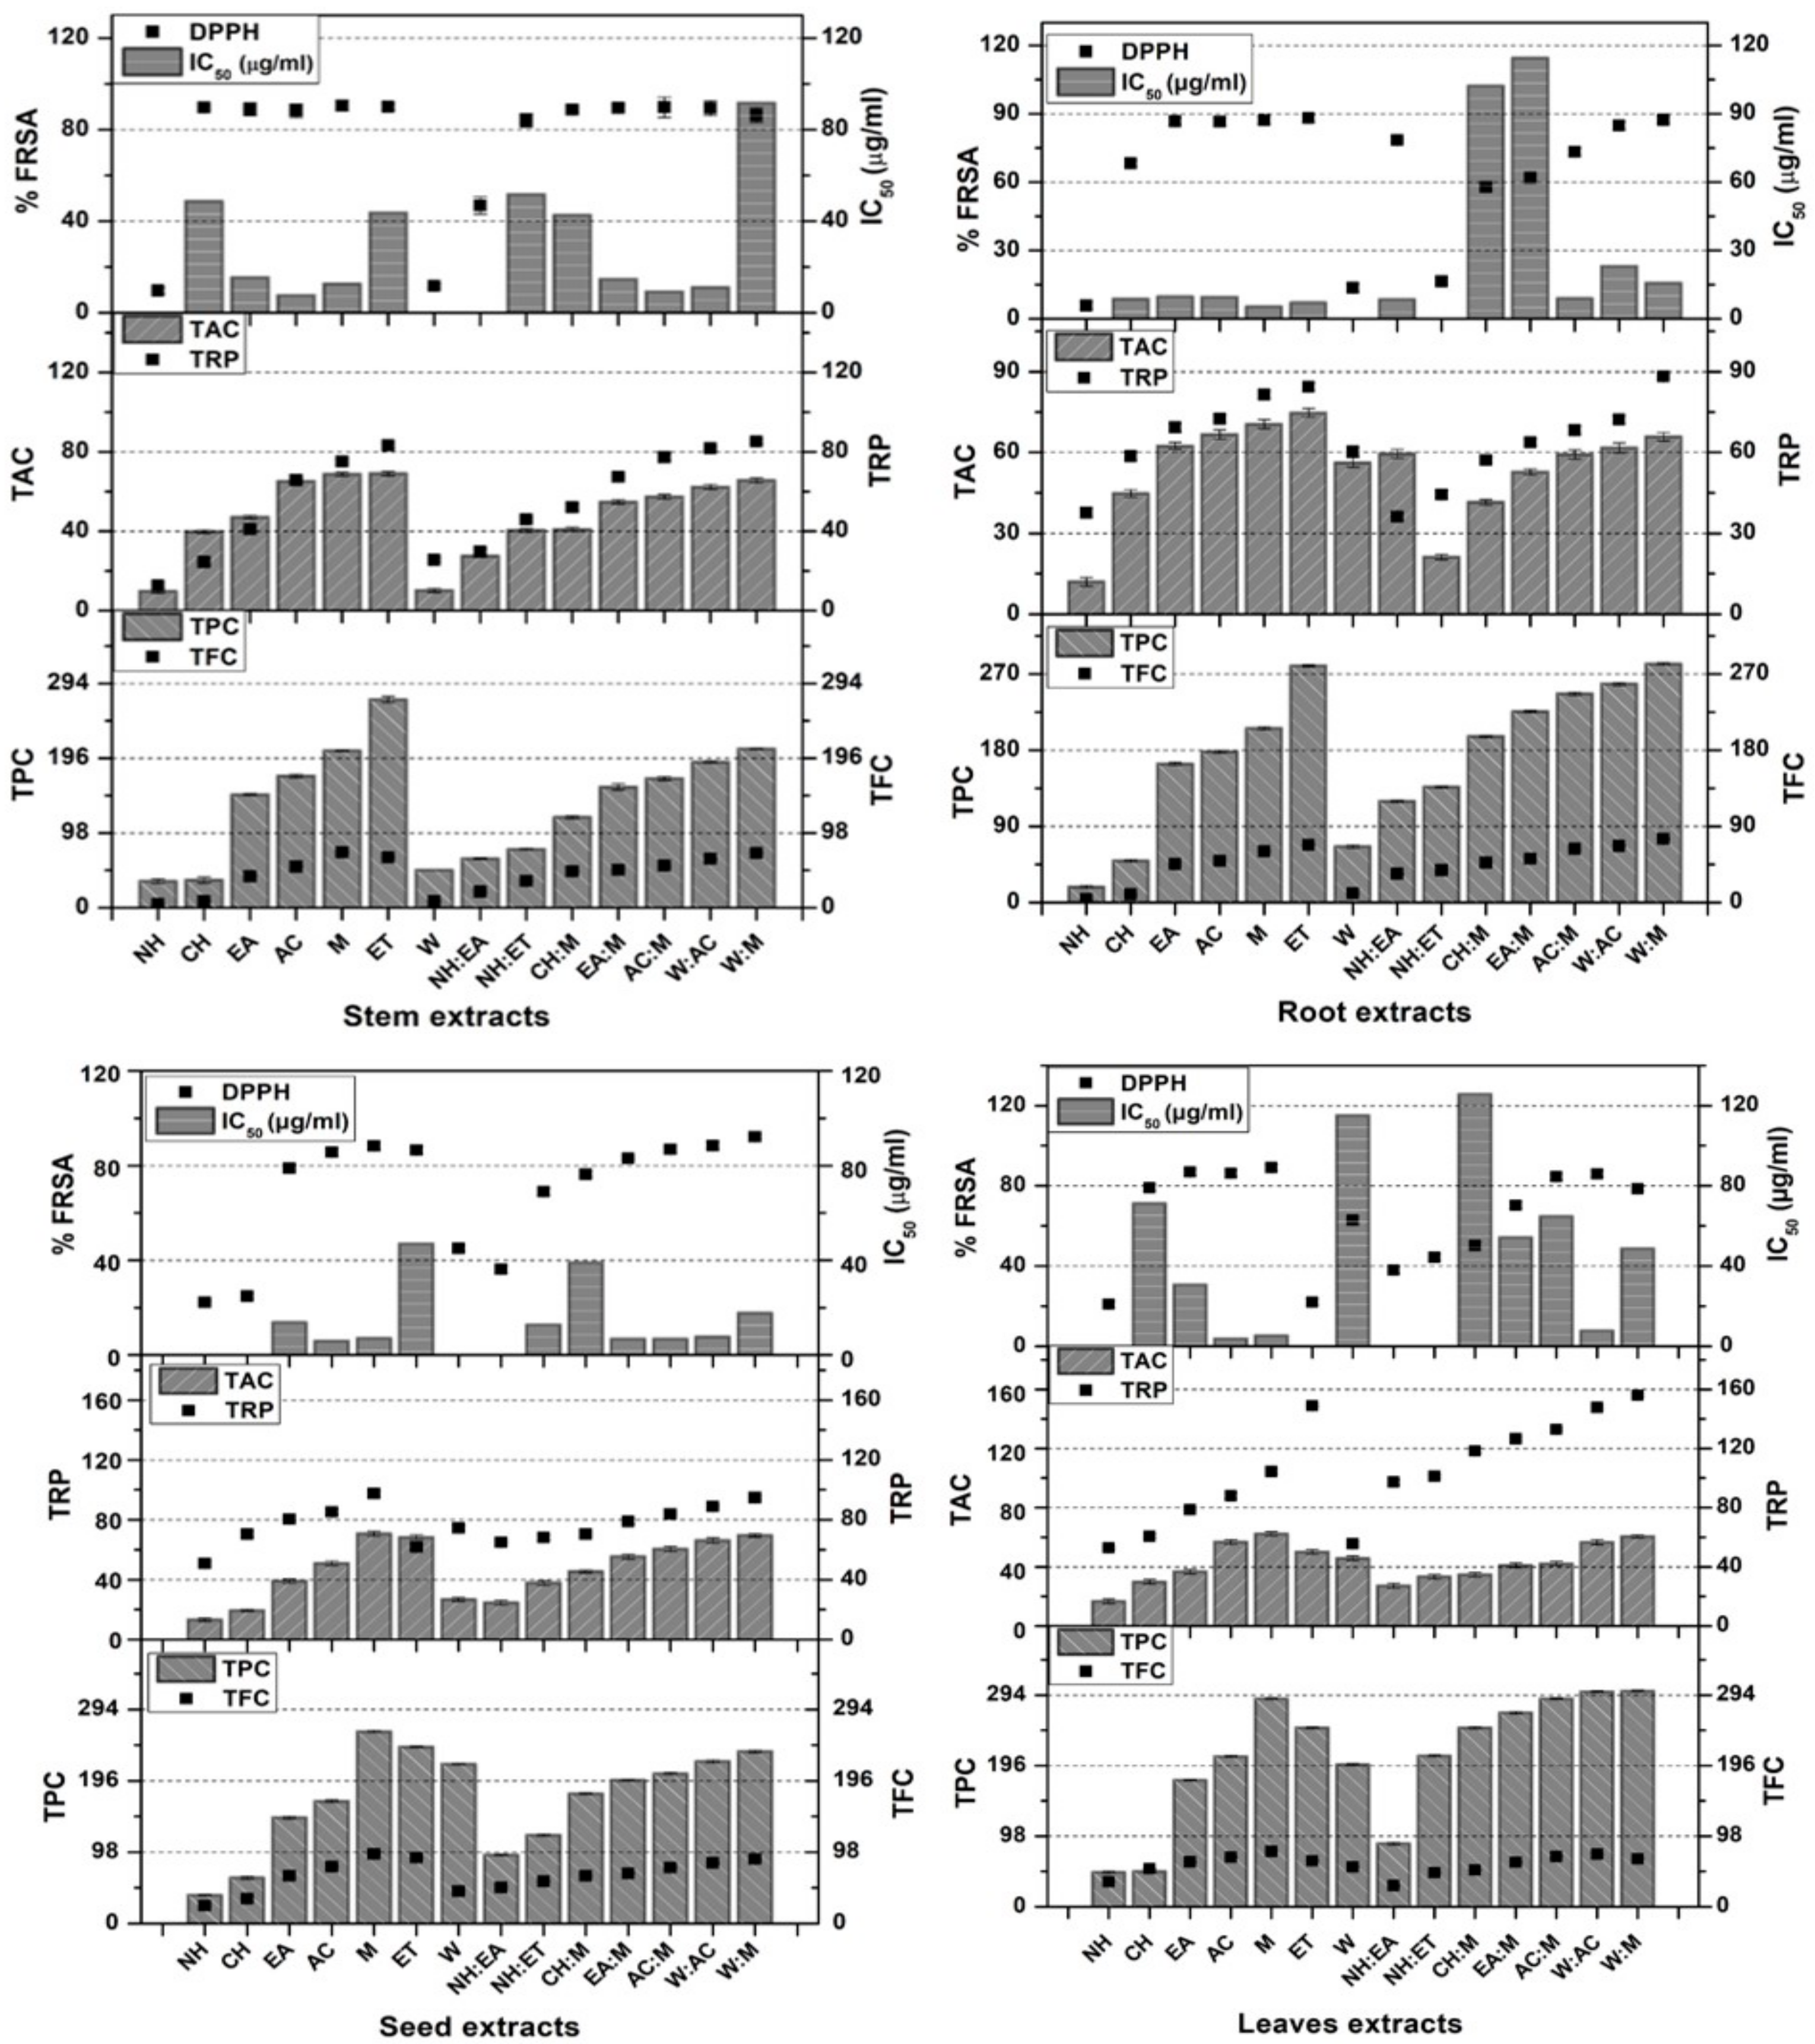
3.2. Phytochemical Analysis

Phenolics and flavonoids are known for their antioxidant activity in biological systems due to their nascent oxygen and free radical quenching ability [17,18]. The methoxy, hydroxyl, and ketonic functional groups present in these compounds might contribute towards the antioxidant potential [19]. Lipid peroxidation inhibition and free radical scavenging are the most considerable traits which make these compounds pharmacologically active. Comparative analysis of results showed maximum phenolic contents in terms of gallic acid equivalents (µg GAE/mg extract) in W:M leaves extracts, i.e., 299.78 ± 0.89 µg GAE/mg extract. While a minimum of the TPC were quantified in NH root extracts 18.34 ± 1.63 µg GAE/mg extract (Figure 2). On the other hand, the results of TFC quantified in P. glabrum revealed that the highest TFC were found in seeds M extracts (95.66 ± 1.39 µg QE/mg extract), while the lowest flavonoid contents were quantified in NH roots extracts (4.25 ± 1.64 µg QE/mg extract) (Figure 2). A significant antioxidant activity of P. glabrum might be attributed to the presence of polyphenols and flavonoids or any other natural antioxidants. These results strongly correlate with the previous findings where phenolic substances were reported to have stupendous antioxidant activity [20].
HPLC-DAD fingerprinting of P. glabrum extracts in the different solvent systems was compared with the retention times and UV absorption spectra of various reference polyphenols, i.e., rutin, caffeic acid, gallic acid, quercetin, apigenin, kaempferol, catechin, and myricetin. The calibration curve equations of used standards along with the significance, LOD, and LOQ values are presented in Table 1. Based upon these parameters, samples were analyzed for the presence of respective polyphenols.
Significant polyphenols were detected in different parts of P. glabrum (Table 2). Different types of polyphenols, i.e., rutin, kaempferol, gallic acid, quercetin, apigenin, and catechin, were detected in most of the samples, as depicted in AC:M seed extract chromatogram (Figure 3). The results of polyphenol can be positively correlated with the phytochemical analysis and antioxidant activities. Our predicted correlation was also in agreement with the previous studies, where quercetin [21] and gallic acid [22] were found to have antioxidant potentials. In addition to these activities, the polyphenols also possess antimicrobial [22], anticancer [23], antidiabetic and antiadipogenic activities [24]. So it can also be depicted from the given data that antioxidant, antimicrobial and cytotoxic activities of P. glabrum may be due to the presence of these polyphenols, as it is evident that plant phenols are capable of inhibiting or attenuating the initiation, progression, and metastasis of cancer cells.
Solubility of polyphenols is mainly dependent upon the nature of the solvent used, degree of polymerization of polyphenols, as well as conjugation with other secondary metabolites, and formation of insoluble complexes [24]. The current study significantly highlights the impact of solvent variable polarities and plant parts on polyphenols content. Detection of apigenin in stem and leaves parts as well as rutin in EA and EA:M leaves extracts elaborate on the previous findings in which rutin and apigenin had been confirmed in M extract of whole P. glabrum plant by means of HPTLC analysis [25]. Therefore present results considerably show the presence of important polyphenols in individual plant parts to select the best plant part candidate for advanced exploration of pharmacological perspective.

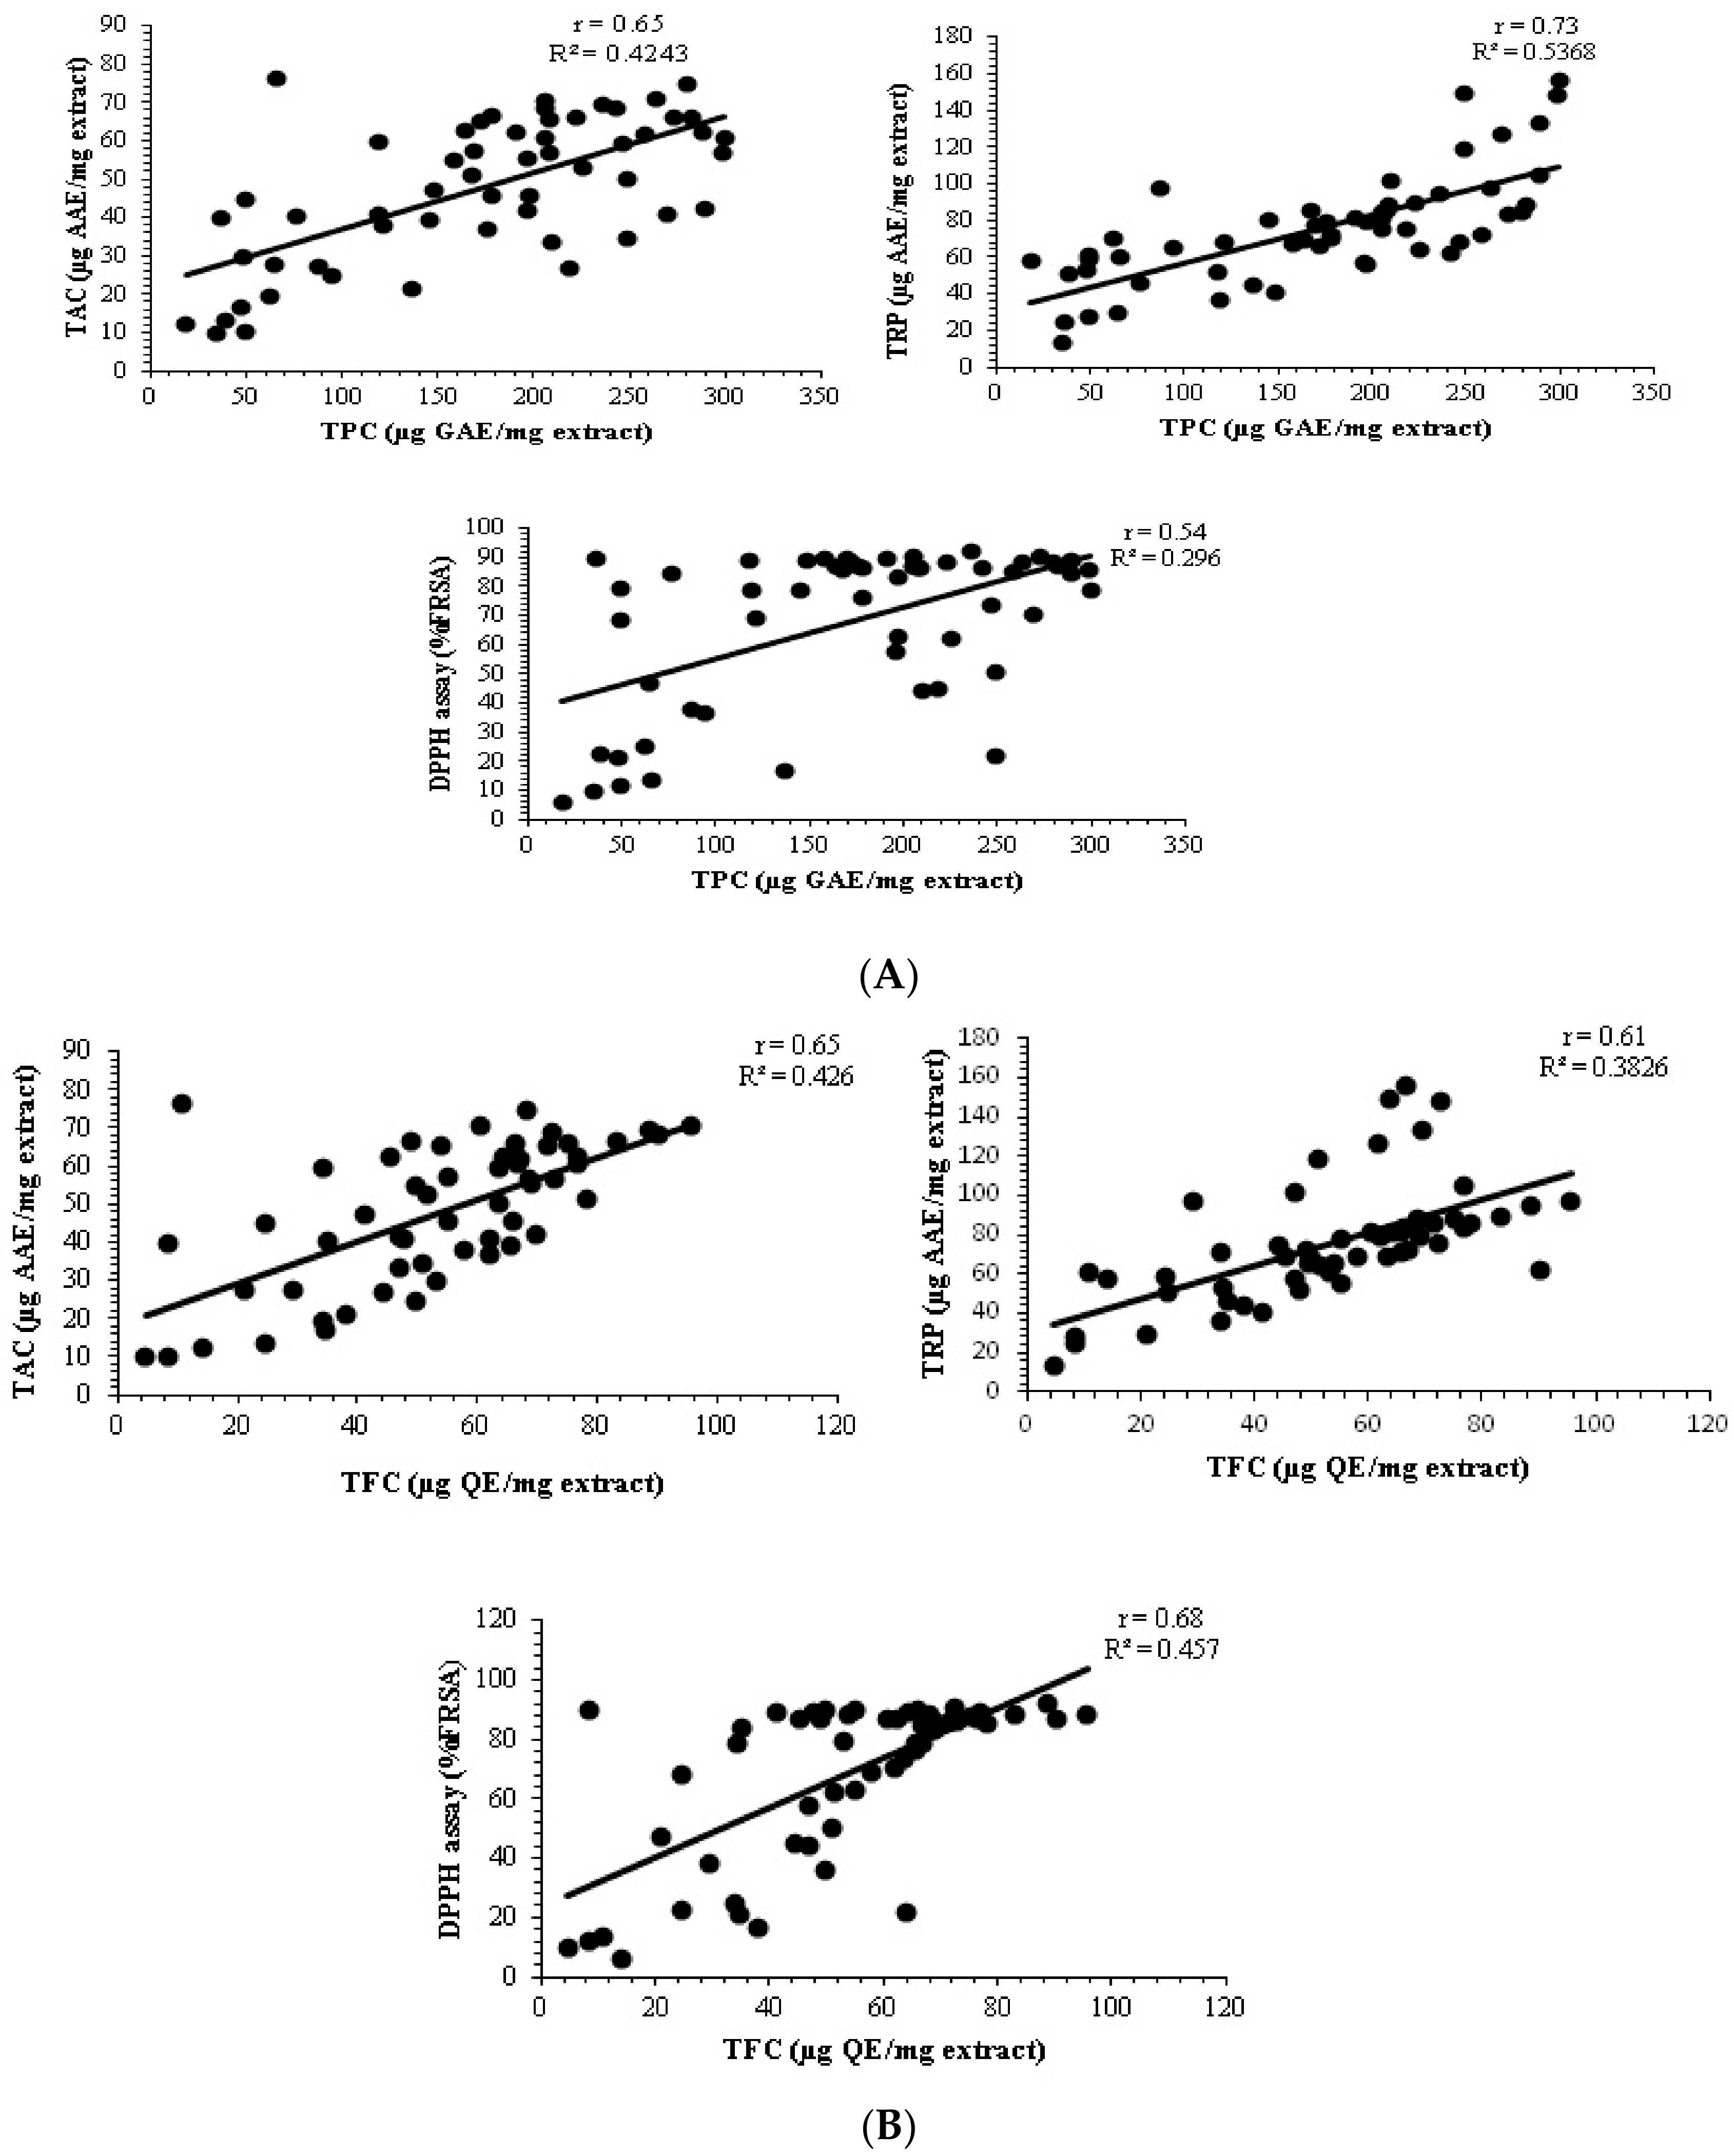
3.3. Antioxidant Potential

The results of DPPH assay showed that the highest %FRSA was observed in M stem, ET root, W:M seeds, and M leaves extracts, i.e., IC50 values 12.75, <7.4, 17.75, and <7.4 µg/mL, respectively. (Figure 2). Twenty-nine out of 56 samples exhibited ≥80% FRSA with IC50 < 7.4 µg/mL suggesting that the plant has strong antioxidant potential. Our results of the antioxidant capabilities of the subject plant were comparable to the results of ascorbic acid (IC50 14.56 µg/mL), which predicts that the plant has strong antioxidant potential.
Results of total antioxidant capacity assay of test samples of P. glabrum revealed that the highest TAC was observed in ET extracts of stem and root (69.01 ± 0.97 and 74.71 ± 1.76 µg AAE/mg) as well as M extracts of seeds and leaves (70.77 ± 1.63 and 62.31 ± 1.48 µg AAE/mg, respectively) (Figure 2).
The reducing power potential of P. glabrum crude extracts was expressed as µg AAE/mg extract. Highest TRP among all extracts was measured in W:M extracts of stem, roots, leaves (85.14 ± 1.13, 88.19 ± 0.67, and 156.00 ± 0.89 µg AAE/mg extract, respectively) and M extract of seeds (97.58 ± 1.67 µg AAE/mg extract) (Figure 2). Maximum antioxidant potentials were observed in M, ET, and aqueous organic solvent extracts (W:M and W:AC). Positive correlation (Spearman correlation) was observed between phytochemicals and antioxidant activities i.e., Spearman correlation coefficient (r) for TPC/TAC = 0.65, TPC/TRP = 0.73, TPC/DPPH = 0.54, TFC/TAC = 0.65, TFC/TRP = 0.61, and TFC/DPPH = 0.68 (Figure 4A,B). Specific determination of antioxidant capacity according to extraction solvent and plant parts suggests that polar leaves and seeds extracts of P. glabrum have maximum antioxidant potential, possibly due to the presence of polyphenols. Correlation analysis among phytochemicals and antioxidants with positive results indicates that the antioxidant activities enhance with an increase in phenolic and flavonoid contents. Thus, mechanism-based information was obtained from this study that phenols and flavonoids might exert their antioxidant effects by three methods, i.e., free radical scavenging, chelate formation, and complex formation. Our results positively correlate with the previous findings where the antioxidant potential of polyphenols was considered to be due to the same effects and mechanisms [24,26]. Natural antioxidants are helpful in preventing disease by quenching free radicals and blocking oxidation. They are also involved in ROS generation inhibition and adjustment of intracellular redox potential. It is also stated that there is an indirect link between antioxidant intake and the occurrence of human disease. The current study also emphasizes that increasing polarity increases the antioxidant activity, so ET and M, along with the aqueous organic extracts (W:M and W:AC), might be the best candidates for isolation of antioxidant compounds and can also be used in herbal therapeutic preparations.

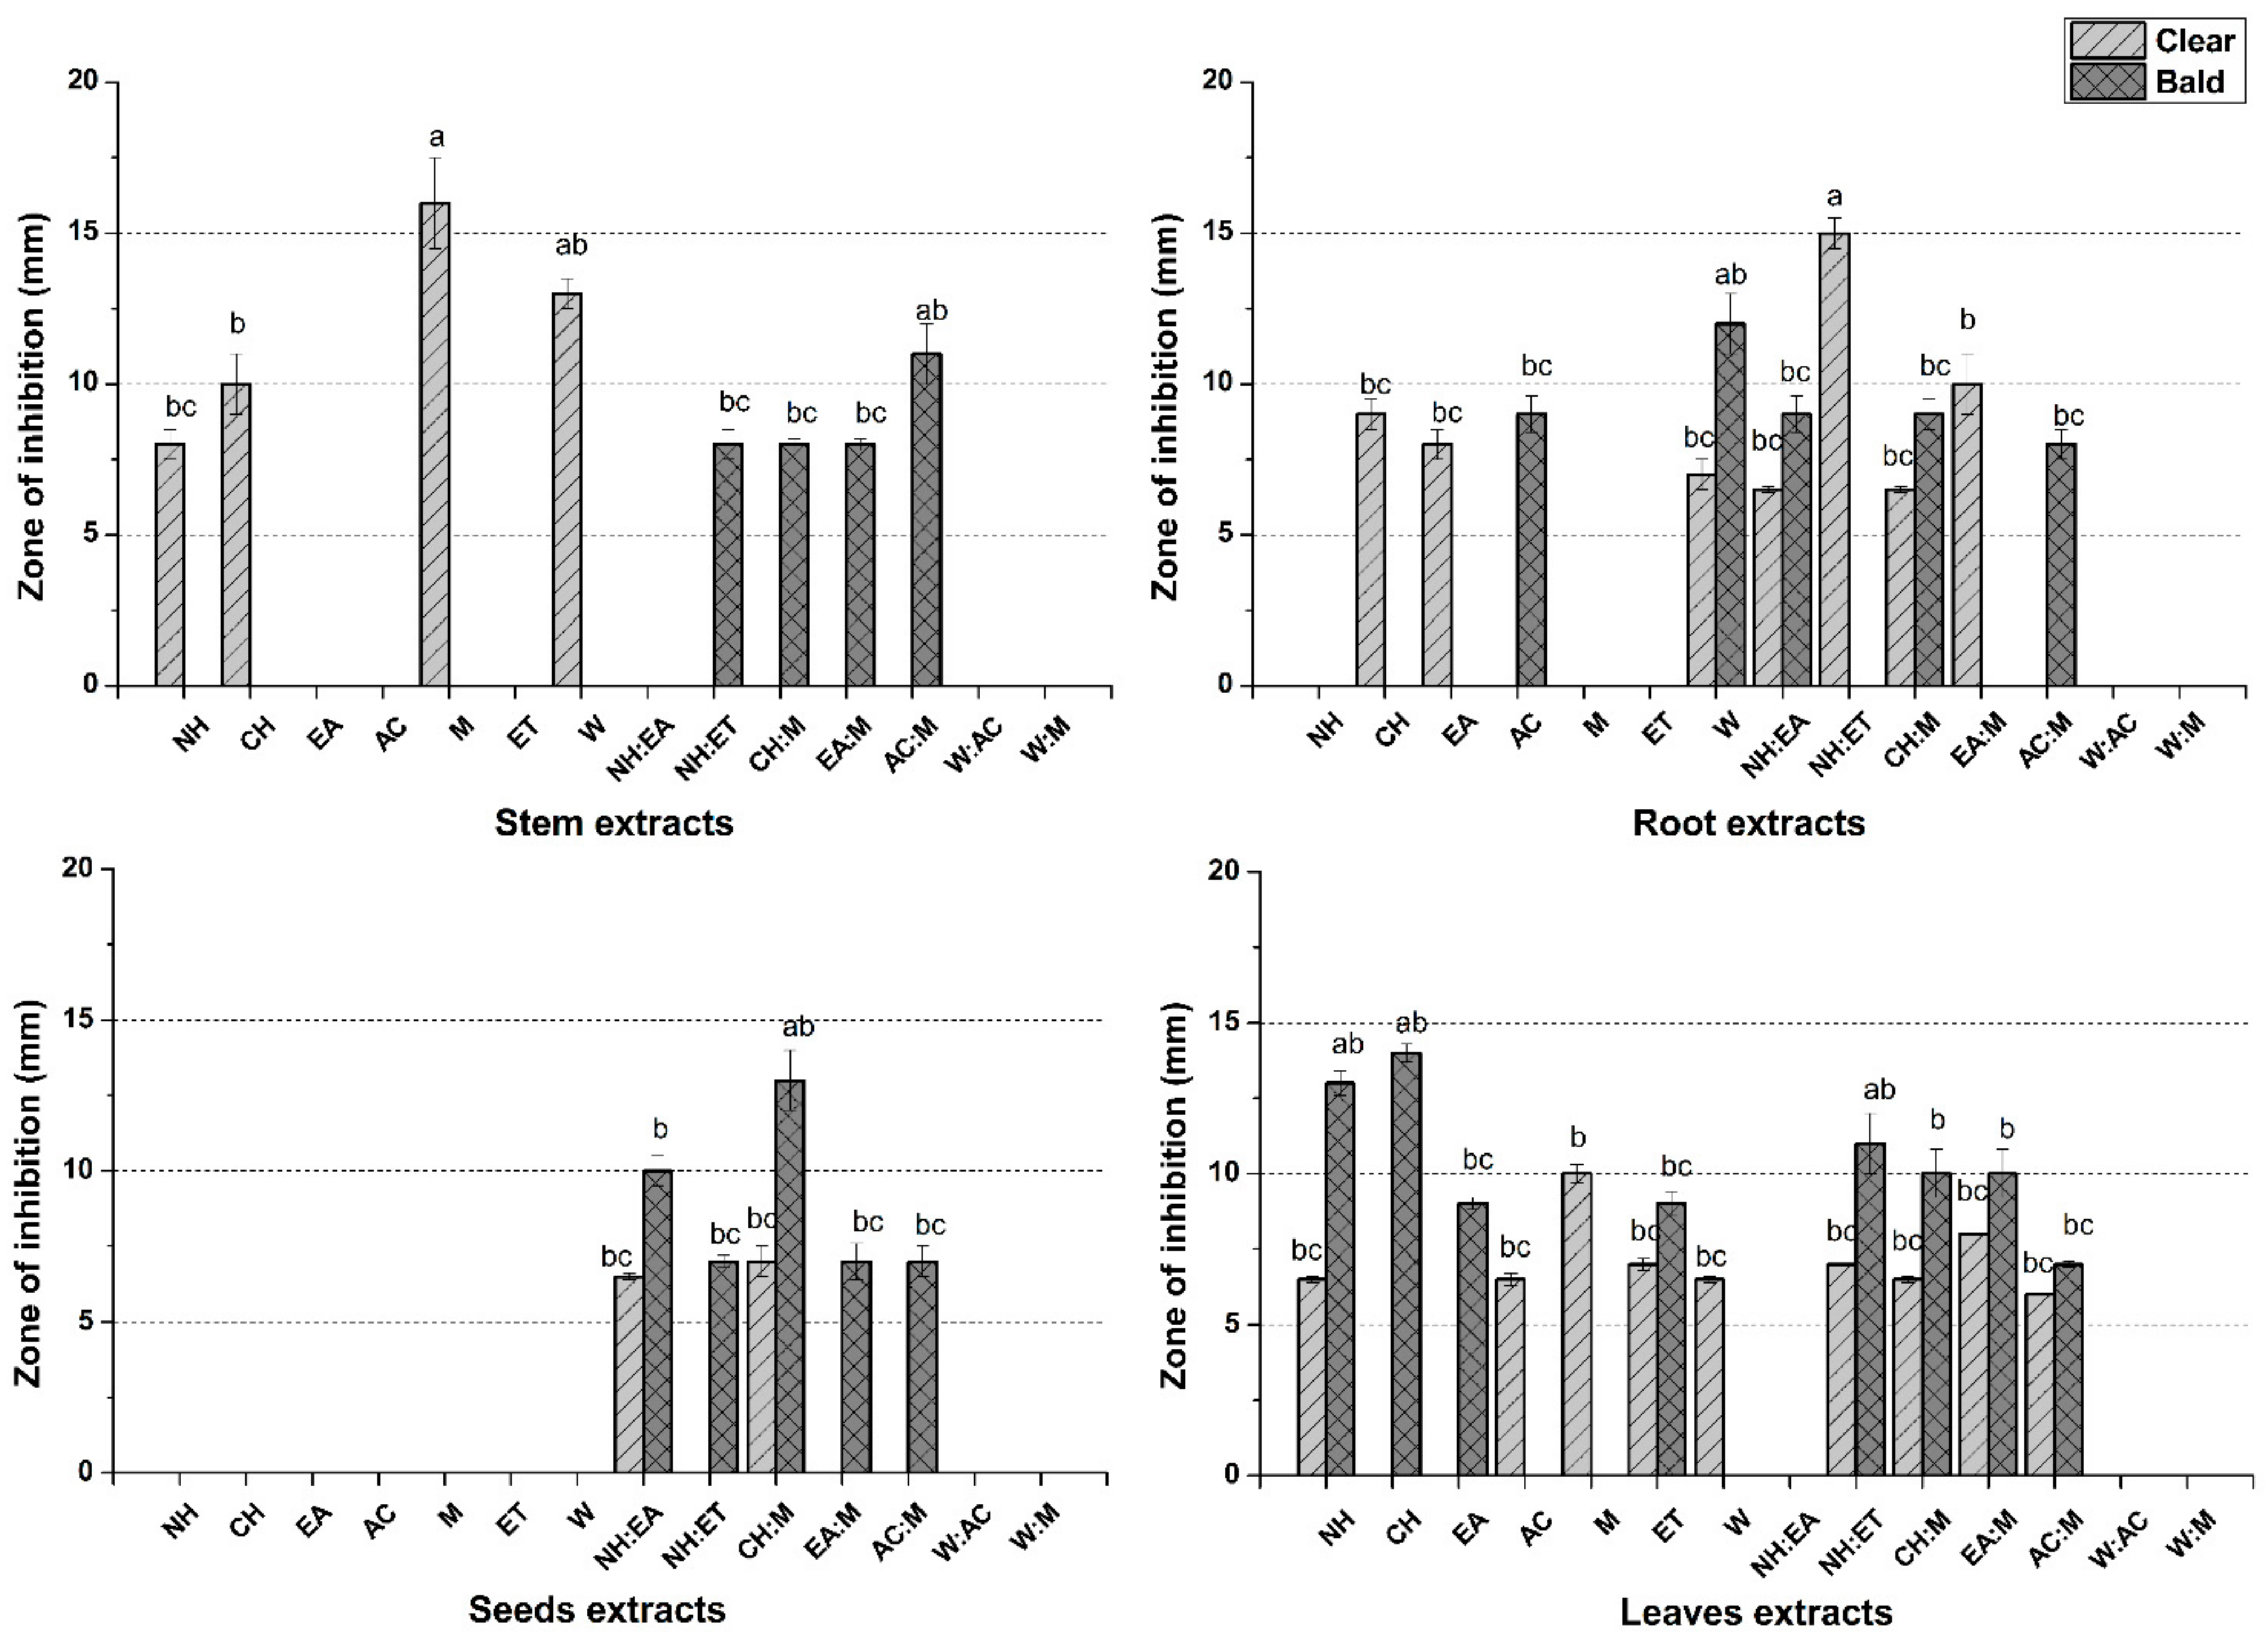
3.4. Antimicrobial Assays

P. glabrum has also traditionally been used as an antimicrobial remedy against infectious diseases [27]. In natural extracts, antimicrobial activity may vary due to synergistic and antagonistic effects of the phytochemicals, as has previously been reported [22]. Both polar and nonpolar leaves and seeds extracts, i.e., EA, M, AC:M, EA, AC, CH:M, CH, and NH exhibited significant antibacterial activities against the tested strains. Maximum zones of inhibition were observed in the case of AC:M seeds and roots extracts against S. typhimurium. While in the case of roots, the maximum zone was observed for AC:M against S. typhimurium and M. luteus. Leaves extracts also exhibited varying degrees of antibacterial activity with a maximum zone of inhibition observed was by NH:EA against S. typhimurium (Table 3).
Extracts with significant results (zone of inhibition ≥ 10 mm) were further tested for MIC determination, and among all the samples, CH extract of seeds exhibited the least MIC value (3.7 µg/mL) against S. typhimurium. These results support the previous findings in which ethyl acetate and methanol fractions of leaves of P. glabrum showed moderate activity against B. subtilis and P. vulgaris [28]. Both results show a parallel relationship with each other in terms of solvent effect and plant part.
A varying, polarity-independent antifungal activity was also observed by the different extracts. Among all samples, leaves extracts were significantly effective against the tested antibacterial strains. In the case of stem, the maximum zone of inhibition was observed by NH:EA and NH against F. solani and A. fumigatus strains, respectively. No significant activity was observed against Mucor sp. In the case of root extracts, the highest inhibition potential was observed by W:M against A. flavus, A. niger, and A. fumigatus. Seed extracts did not exhibit significant antifungal activity demonstrating only NH extract to be moderately active against A. flavus (10 ± 1.00 mm). Maximum zone of inhibition against A. niger was observed for W, NH, and CH:M, while extracts were least effective against A. fumigatus, Mucor sp., and F. solani. In the case of leaves, maximum zone of inhibition was observed by AC:M, CH:M, NH:EA, and W, AC and CH against A. flavus, A. niger, F. solani, A. fumigatus, and Mucor sp., respectively (Table 4). Our work on the antifungal activity of P. glabrum is supported by another report in which the subject plant showed good activity against Colletotrichum truncatum [29]. Our results are contradicted to findings of another study involving different species of the same genus, in which methanol, hexane, aqueous, and petroleum ether extracts of whole Polygonum equisetiforme did not show any activity against ten bacterial strains and four fungal test species [30].

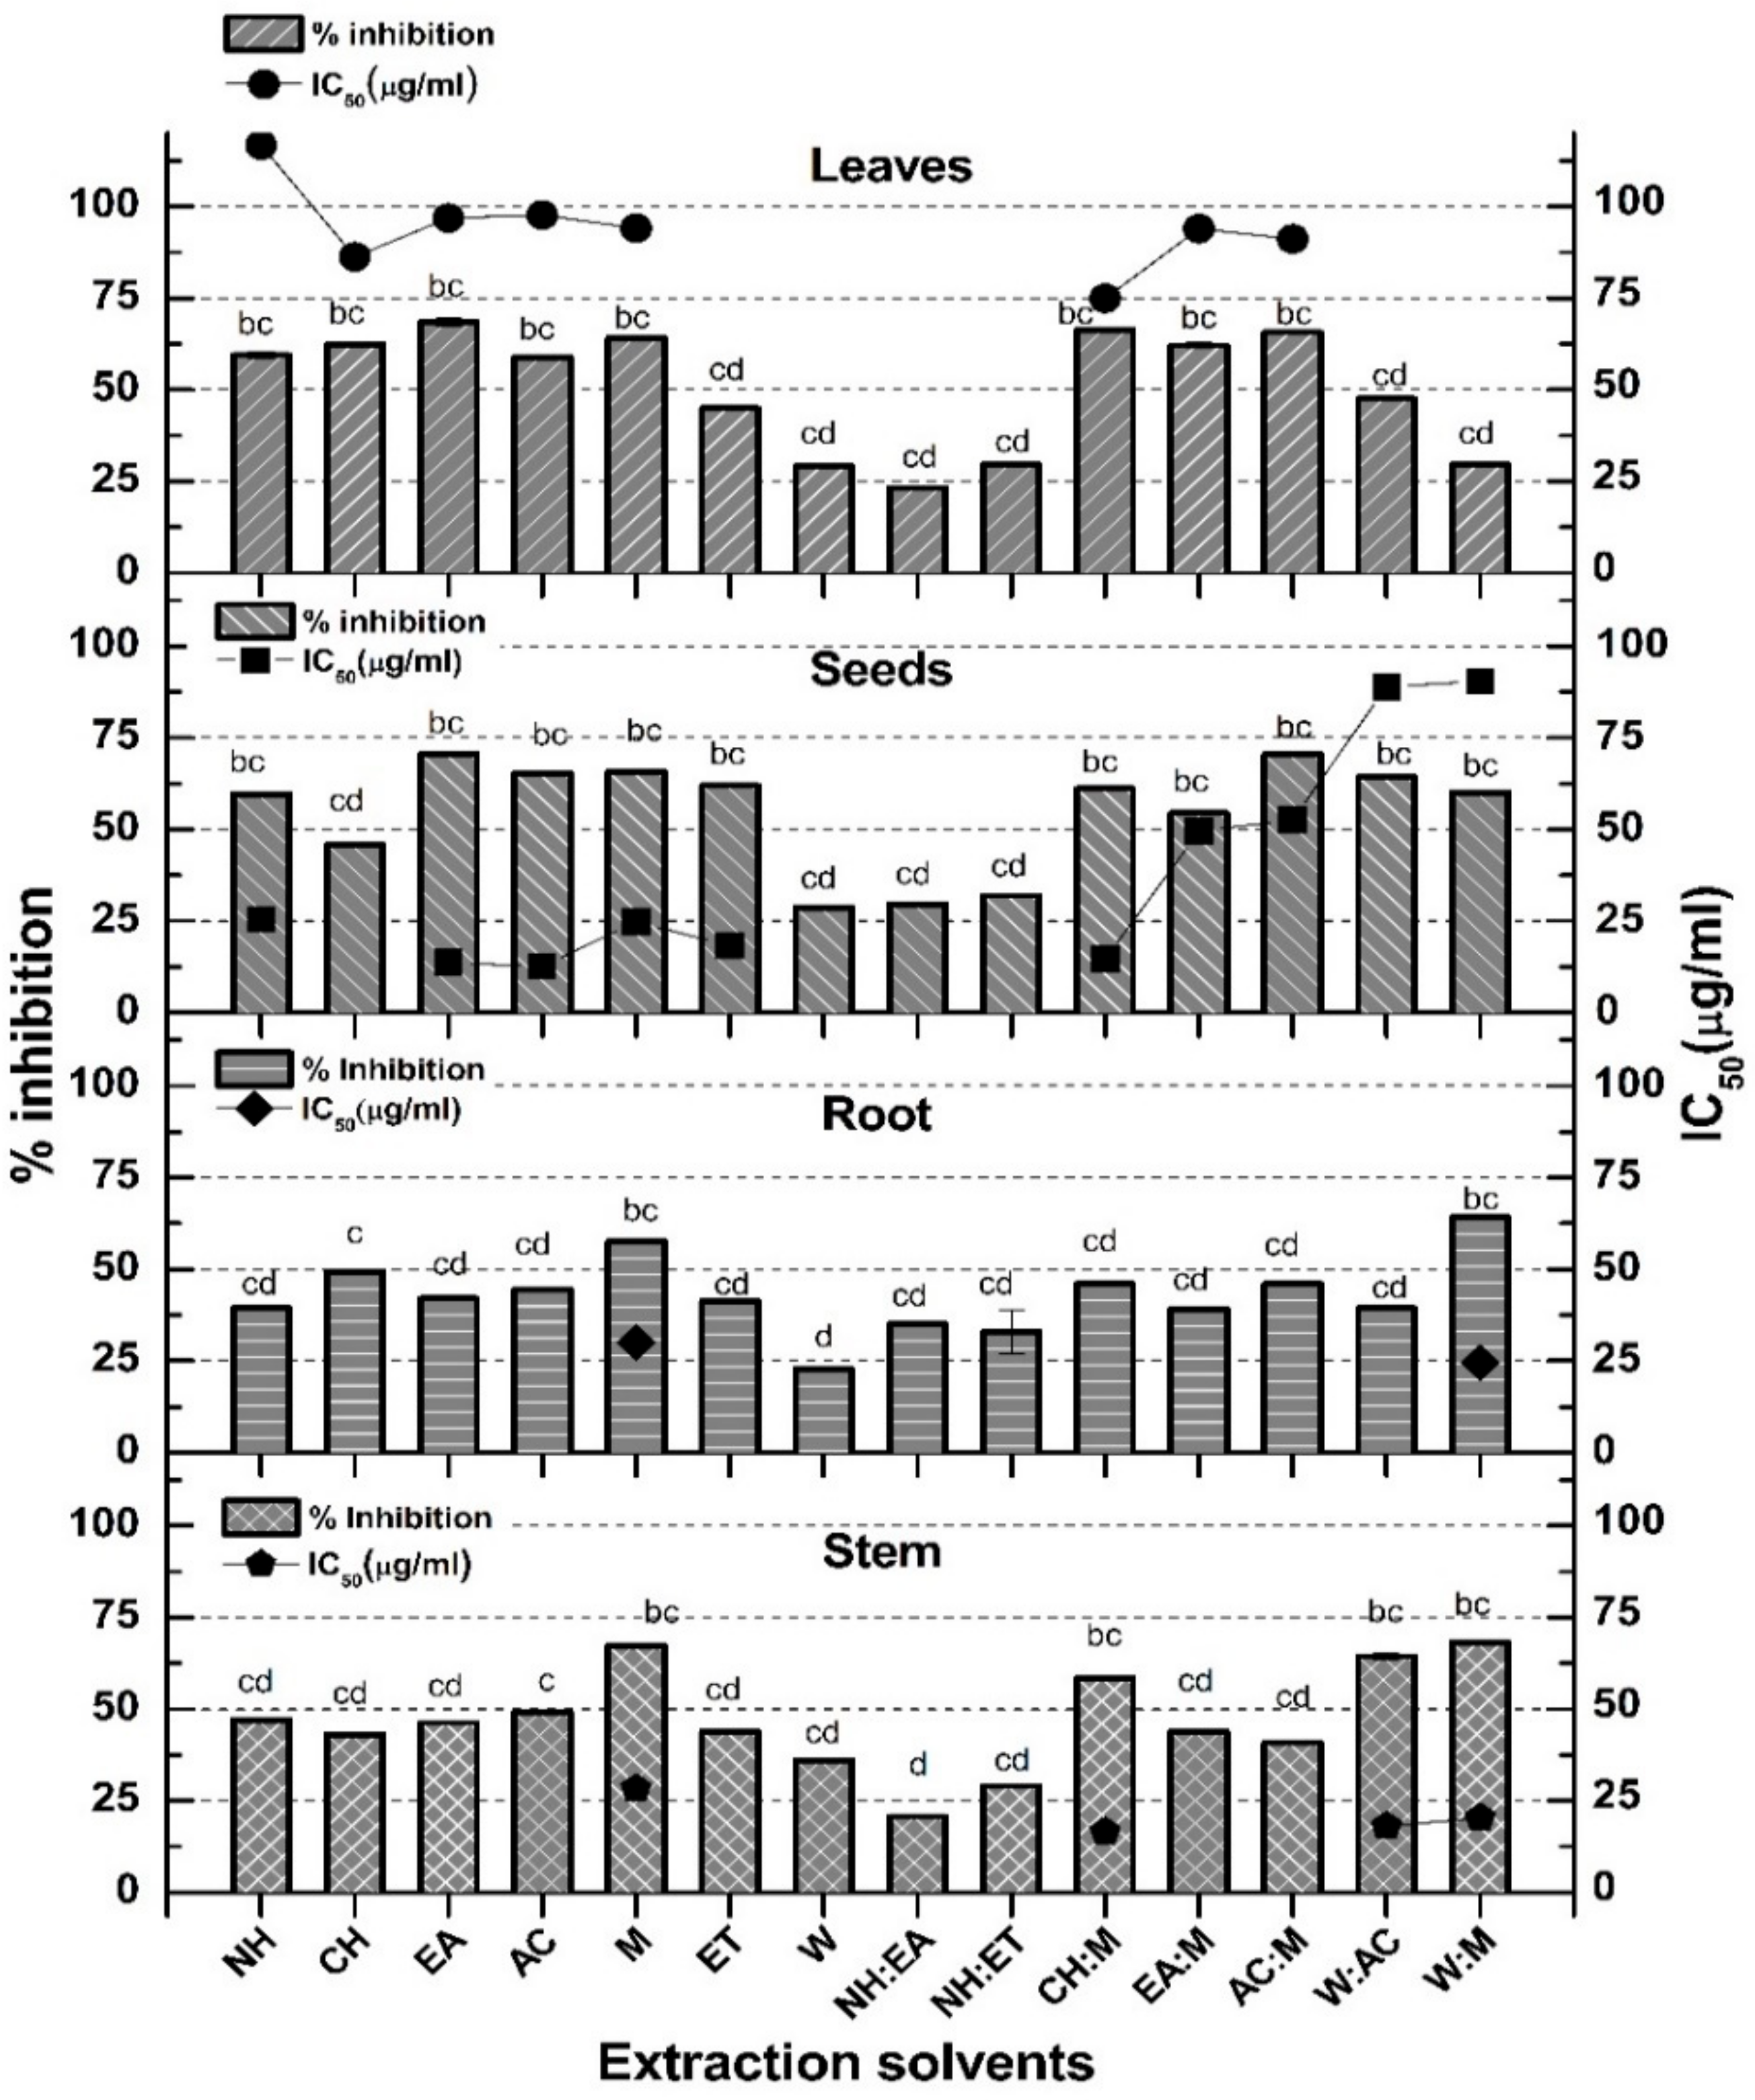
3.5. Enzyme Inhibition Assay

The antidiabetic potential of the test extracts was assessed by α-amylase inhibition assay. The inhibitory enzyme activities in terms of %inhibition of different parts of P. glabrum are presented in Figure 5. Maximum enzyme inhibition was observed by W:M stem (66.36% ± 0.06%, IC50 20.34 µg/mL) as well as root extract (64.11% ± 0.12%, IC50 24.59 µg/mL), EA seeds (70.66% ± 0.19%, IC50 13.66 µg/mL) and leaves extract (68.45% ± 0.1%, IC50 96.88 µg/mL). The least activity was observed in the case of NH test samples of all parts (Figure 5). A positive correlation (r = 0.592 at p = 0.01) was observed between flavonoid contents and α-amylase inhibiting activity. The α-amylase inhibition activity showed a mild positive correlation with the flavonoids (r = 0.5934). In the current report, the α-amylase inhibition method was used for the determination of in vitro antidiabetic potential, as it is considered to be an effective tool to keep glucose levels in the permissible range. The α-amylase enzyme catalyzes the hydrolysis of starch, glycogen, and various oligosaccharides at α-1,4-glycosidic linkages by converting them into disaccharides which are further simplified into simpler sugars by α-glucosidase, making it readily available for the intestinal absorption. So enzymatic control at the intestinal level is an important strategy to diminish the absorption of glucose for the control of diabetes [31]. Therefore, a long-awaited effort is in the process of searching for effective and nontoxic inhibitors of α-glucosidase and α-amylase. The results displayed that M, AC:M, and W:M exhibited the highest inhibitory activity while it was moderate in nonpolar extracts (AC, EA and their combinations with M). The correlation value between flavonoids and α-amylase inhibition was less significant (r = 0.5934), which contradicts the previous findings where flavonoids were found to be responsible for α-amylase inhibition [32].

3.6. Cytotoxicity Assays

In protein kinase inhibition assay, significant bald zones were observed by AC:M stem extract (11 ± 1.15 mm), W root extract (12 ± 1.20 mm), CH:M seeds extract (13 ± 0.58 mm), and CH leaves extract (14 ± 1.13 mm). Whereas NH:ET root, M stem, and leaves extracts showed noteworthy clear zones, i.e., 15 ± 1.53, 16 ± 1.53, and 10 ± 1.00 mm. No significant clear zone was observed by seed extracts (Figure 6). Remarkable results by W:AC of stem, W of root, and NH:EA of seed, and most prominently CH of leaves proposed that these extracts would be appropriate for the isolation of bioactive constituents of P. glabrum that may assist in developing a promising kinase inhibitory drug. No polarity-based activity trend of protein kinase inhibition potential was observed in P. glabrum crude extracts while plant part-dependent activity was observed. In the past few decades, there has been a noteworthy need for the development of safe and cost-effective protein kinase inhibitors from plants [33]. Phosphorylation at tyrosine and serine/threonine residues of cells regulates major important cascades involved in various biological processes ranging from cell proliferation to apoptosis [33]. Deregulated or uncontrolled phosphorylation by protein kinases at serine/threonine and tyrosine residues by genetic modifications in cells leads to the onset of cancer. So, targeting those cascades of kinases has developed to be a remarkable objective for the isolation of anticancer compounds [34]. So far, 500 kinases have been identified in the human genome, and the allosteric binding of extracts with one of these active or inactive kinases will be vital in the identification and development of anticancer compounds [35]. The kinases are employed by the Streptomyces species for the development of the aerial hyphae; thus, the inhibition is considered as a marker of protein kinase inhibitory potential [13]. This requirement had been utilized in the current study to determine the kinase inhibitory profile of the given crude samples of P. glabrum in a bio prospective manner so that their anticancer potential could be evaluated. Positive results might be attributed to the presence of gallic acid (W:AC of stem) and/or apigenin (W of root) according to a previous finding in which gallic acids and other polyphenols led to inhibition of phosphorylation of protein kinases [36].
The cytotoxicity potential of the investigational plant P. glabrum test samples was also evaluated by brine shrimp lethality activity. This assay has long been used as a valuable biological probe for determining cytotoxic profiles of test extracts [37]. Brine shrimps (Artemia salina) larvae have been considered as a simple and efficient tool for screening of antitumor, insecticidal, antimicrobial, and antimalarial activities of samples [38,39]. It is suggested that the shrimp larvae behave like the mammalian carcinoma cells, and the anticancer effects of tested samples (crude extracts) might well elucidate their antitumor and cytotoxic activity [38]. Most significant cytotoxicity was seen in nonpolar extracts, i.e., CH, NH, NH:EA, while crude extracts of polar solvents were comparatively less cytotoxic, having higher LC50 values. The activity was found to be concentration-dependent, i.e., decreasing test sample concentration decreased %mortality (Table 5). The results are in strong agreement with previously published reports against brine shrimps [13]. The LC50 of most of the samples was less than 250 µg/mL, which signifies a noticeable cytotoxic profile of test extracts. The acquired cytotoxic potential of the plant might be attributed to the presence of a high quantity of secondary metabolites, e.g., phenols, flavonoids, alkaloids, etc. [39]. Furthermore, a previous study also claimed that P. glabrum roots extracts were nontoxic and safe at a dose of 2 g/Kg in rat models of acute and chronic toxicity [40]. Screening of the crude test samples with minimum LC50 values and higher safety profiles might offer valuable cytotoxic and/or antitumor secondary metabolites. Thus, this pilot study results would offer an ideal pathway for further screening and isolation of potentially important secondary metabolites.

4. Conclusions

In the current report, various phytochemical, antioxidant, antimicrobial, antidiabetic, and cytotoxic assays have been performed on stem, roots, seeds, and leaves of P. glabrum to corroborate its folklore utilization via modern scientific intervention. A wide range of polarity solvents led to the formation of extracts with varied pharmacological profiling. The current study proposes that extracts in the polar solvents showed superior antioxidant, moderately polar extracts gave better antimicrobial activity while lesser polar solvents led to the extracts with significant cytotoxicity profile. Thorough screening suggests that polarity of solvent and part of the plant used to decide the fate of biological efficacy, nature of the pharmacological response, and extraction efficiency. It also highlights the need for expansion of our pilot study results and critical evaluation to initiate bioactivity guided isolation from this stupendous medicinal plant.

Author Contributions

Conceptualization, I.-u.-H.; methodology, I.-u.-H. and M.A.; formal analysis, N.A. and M.A.; investigation, T.S.; resources, I.-u.-H.; writing—original draft preparation, T.S. and M.A.; writing—review and editing, M.A., M.K.O. and N.A.; visualization, A.A.-H.; supervision, H.A.; project administration, W.H.A.-Q. and M.K.O.; funding acquisition, M.K.O., A.A.-H., W.H.A.-Q. and H.A. All authors have read and agreed to the published version of the manuscript.

Funding

This research was funded by King Saud University, Riyadh, Saudi Arabia under Researchers Support Project number (RSP-2021/374).

Institutional Review Board Statement

Not applicable.

Informed Consent Statement

Not applicable.

Data Availability Statement

Data sharing not applicable.

Acknowledgments

The authors are thankful to the Researchers Supporting Project number (RSP-2021/374) King Saud University, Riyadh, Saudi Arabia. The authors extend their appreciation to the Rizwana Aleem Qureshi, Department of Plant Sciences, Faculty of Biological Sciences, Quaid-i-Azam University Islamabad, Pakistan, for taxonomical identification of the plant sample.

Conflicts of Interest

The authors declare no conflict of interest.

Sample Availability

The crude extracts prepared for the current study are available from the authors.

References

  1. Hamdan, I.; Afifi, F. Studies on the in vitro and in vivo hypoglycemic activities of some medicinal plants used in treatment of diabetes in Jordanian traditional medicine. J. Ethnopharmacol. 2004, 93, 117–121. [Google Scholar] [CrossRef] [PubMed]
  2. Cars, O.; Hedin, A.; Heddini, A. The global need for effective antibiotics—Moving towards concerted action. Drug Resist. Updates 2011, 14, 68–69. [Google Scholar] [CrossRef] [PubMed]
  3. Galappathie, S.; Palombo, E.A.; Yeo, T.C.; Ley, D.L.S.; Tu, C.L.; Malherbe, F.M.; Mahon, P.J. Comparative antimicrobial activity of South East Asian plants used in Bornean folkloric medicine. J. Herb. Med. 2014, 4, 96–105. [Google Scholar] [CrossRef]
  4. Brandbyge, J. Polygonaceae, in Flowering Plants·Dicotyledons; Springer: Berlin/Heidelberg, Germany, 1993; pp. 531–544. [Google Scholar]
  5. Granica, S.; Czerwińska, M.E.; Żyżyńska-Granica, B.; Kiss, A.K. Antioxidant and anti-inflammatory flavonol glucuronides from Polygonum aviculare L. Fitoterapia 2013, 91, 180–188. [Google Scholar] [CrossRef]
  6. Duwiejua, M.; Zeitlin, I.J.; Gray, A.I.; Waterman, P.G. The anti-inflammatory compounds of Polygonum bistorta: Isolation and characterisation. Planta Med. 1999, 65, 371–374. [Google Scholar] [CrossRef] [PubMed]
  7. Zhang, H.; Zhang, Q.W.; Wang, L.; Zhang, X.Q.; Ye, W.C.; Wang, Y.T. Two new anthraquinone malonylglucosides from Polygonum cuspidatum. Nat. Prod. Res. 2012, 26, 1323–1327. [Google Scholar] [CrossRef] [PubMed]
  8. Narasimhulu, G.; Reddy, K.K.; Mohamed, J. The genus Polygonum (Polygonaceae): An ethnopharmacological and phytochemical perspectives: Review. Int. J. Pharm. Pharm. Sci. 2014, 6, 21–45. [Google Scholar]
  9. Seimandi, G.; Álvarez, N.; Stegmayer, M.I.; Fernández, L.; Ruiz, V.; Favaro, M.A.; Derita, M. An Update on Phytochemicals and Pharmacological Activities of the Genus Persicaria and Polygonum. Molecules 2021, 26, 5956. [Google Scholar] [CrossRef]
  10. Gautam, D. Ethnopharmacology, phytochemistry, and pharmacology of Polygonum glabrum Willd. Int. J. Green Pharm. (IJGP) 2017, 11, 248–255. [Google Scholar]
  11. Sivakumar, P.; Senthilkumar, K.; Varma, J.P. Phytochemical studies on Polygonum glabrum (WILLD). Int. J. Pharma Bio Sci. 2011, 2, 169–175. [Google Scholar]
  12. Ahmed, M.; Ahmed, M.; Fatima, H.; Qasim, M.; Gul, B. Polarity directed optimization of phytochemical and in vitro biological potential of an indigenous folklore: Quercus dilatata Lindl. ex Royle. BMC Complement. Altern. Med. 2017, 17, 386. [Google Scholar] [CrossRef] [PubMed]
  13. Fatima, H.; Khan, K.; Zia, M.; Ur-Rehman, T.; Mirza, B.; Haq, I.U. Extraction optimization of medicinally important metabolites from Datura innoxia Mill.: An in vitro biological and phytochemical investigation. BMC Complement. Altern. Med. 2015, 15, 376. [Google Scholar] [CrossRef] [PubMed] [Green Version]
  14. Yao, G.; Sebisubi, F.M.; Voo, L.Y.C.; Ho, C.C.; Tan, G.T.; Chang, L.C. Citrinin derivatives from the soil filamentous fungus Penicillium sp. H9318. J. Braz. Chem. Soc. 2011, 22, 1125–1129. [Google Scholar] [CrossRef] [Green Version]
  15. Hsu, B.; Coupar, I.M.; Ng, K. Antioxidant activity of hot water extract from the fruit of the Doum palm, Hyphaene thebaica. Food Chem. 2006, 98, 317–328. [Google Scholar] [CrossRef]
  16. Sultana, B.; Anwar, F.; Ashraf, M. Effect of extraction solvent/technique on the antioxidant activity of selected medicinal plant extracts. Molecules 2009, 14, 2167–2180. [Google Scholar] [CrossRef]
  17. Kim, H.J.; Chen, F.; Wang, X.; Choi, J.H. Effect of methyl jasmonate on phenolics, isothiocyanate, and metabolic enzymes in radish sprout (Raphanus sativus L.). J. Agric. Food Chem. 2006, 54, 7263–7269. [Google Scholar] [CrossRef]
  18. Devasagayam, T.P.A.; Tilak, J.C.; Boloor, K.K.; Sane, K.S.; Ghaskadbi, S.S.; Lele, R.D. Free radicals and antioxidants in human health: Current status and future prospects. JAPI 2004, 52, 4. [Google Scholar]
  19. Afshar, F.H.; Delazar, A.; Nazemiyeh, H.; Esnaashari, S.; Moghadam, S.B. Comparison of the total phenol, flavonoid contents and antioxidant activity of methanolic extracts of Artemisia spicigera and A. splendens growing in Iran. Pharm. Sci. 2012, 18, 165–170. [Google Scholar]
  20. Soong, Y.-Y.; Barlow, P.J. Quantification of gallic acid and ellagic acid from longan (Dimocarpus longan Lour.) seed and mango (Mangifera indica L.) kernel and their effects on antioxidant activity. Food Chem. 2006, 97, 524–530. [Google Scholar] [CrossRef]
  21. Vellosa, J.C.R.; Regasini, L.O.; Khalil, N.M.; Bolzani, V.D.S.; Khalil, O.A.; Manente, F.A.; Pasquini Netto, H.; Oliveira, O.M. Antioxidant and cytotoxic studies for kaempferol, quercetin and isoquercitrin. Eclética Quim. 2011, 36, 7–20. [Google Scholar] [CrossRef]
  22. Hendra, R.; Ahmad, S.; Sukari, A.; Shukor, M.Y.; Oskoueian, E. Flavonoid analyses and antimicrobial activity of various parts of Phaleria macrocarpa (Scheff.) Boerl fruit. Int. J. Mol. Sci. 2011, 12, 3422–3431. [Google Scholar] [CrossRef] [Green Version]
  23. Lupaşcus, D.; Tuchiluş, C.; Profire, L. Physico-chemical and antimicrobial properties of novel rutin derivatives with 6-aminopenicillanic acid. Farmacia 2010, 56, 501–506. [Google Scholar]
  24. Nijveldt, R.J.; Van Nood, E.L.S.; Van Hoorn, D.E.; Boelens, P.G.; Van Norren, K.; Van Leeuwen, P.A. Flavonoids: A review of probable mechanisms of action and potential applications. Am. J. Clin. Nutr. 2001, 74, 418–425. [Google Scholar] [CrossRef] [PubMed]
  25. Ezhilan, B.; Neelamegam, R. HPTLC analysis of flavonoid compound profile in the whole-plant methanol extract of Polygonum species. Int. J. Adv. Res. Biol. Sci. 2015, 2, 26–33. [Google Scholar]
  26. Krishnaraju, A.V.; Rao, T.V.; Sundararaju, D.; Vanisree, M.; Tsay, H.S.; Subbaraju, G.V. Biological screening of medicinal plants collected from Eastern Ghats of India using Artemia salina (brine shrimp test). Int. J. Appl. Sci. Eng. 2006, 4, 115–125. [Google Scholar]
  27. Jadhav, N.; Kulkarni, S.; Mane, A.; Kulkarni, R.; Palshetker, A.; Singh, K.; Joshi, S.; Risbud, A.; Kulkarni, S. Antimicrobial activity of plant extracts against sexually transmitted pathogens. Nat. Prod. Res. 2015, 29, 1562–1566. [Google Scholar] [CrossRef] [PubMed]
  28. Jani, M.; Shah, S.; Prajapati, S. Antibacterial screening and qualitative phytochemical estimation of selected aquatic plants. Int. J. Res. Pharm. Sci. 2011, 2, 648–652. [Google Scholar]
  29. Charu, A.; Kaushik, R. Fungicidal activity of plants extracts from Uttaranchal hills against soybean fungal pathogens. Allelopath. J. 2003, 11, 217–228. [Google Scholar]
  30. Ghazal, S.; Abuzarqa, M.; Mahasneh, A. Antimicrobial activity of Polygonum equisetiforme extracts and flavonoids. Phytother. Res. 1992, 6, 265–269. [Google Scholar] [CrossRef]
  31. Ali, H.; Houghton, P.; Soumyanath, A. α-Amylase inhibitory activity of some Malaysian plants used to treat diabetes; with particular reference to Phyllanthus amarus. J. Ethnopharmacol. 2006, 107, 449–455. [Google Scholar] [CrossRef]
  32. Etxeberria, U.; de la Garza, A.L.; Campión, J.; Martínez, J.A.; Milagro, F.I. Antidiabetic effects of natural plant extracts via inhibition of carbohydrate hydrolysis enzymes with emphasis on pancreatic alpha amylase. Expert Opin. Ther. Targets 2012, 16, 269–297. [Google Scholar] [CrossRef] [Green Version]
  33. Smyth, L.A.; Collins, I. Measuring and interpreting the selectivity of protein kinase inhibitors. J. Chem. Biol. 2009, 2, 131–151. [Google Scholar] [CrossRef] [Green Version]
  34. Aggarwal, B.B.; Shishodia, S. Molecular targets of dietary agents for prevention and therapy of cancer. Biochem. Pharmacol. 2006, 71, 1397–1421. [Google Scholar] [CrossRef]
  35. Edwards, A.M.; Isserlin, R.; Bader, G.D.; Frye, S.V.; Willson, T.M.; Frank, H.Y. Too many roads not taken. Nature 2011, 470, 163–165. [Google Scholar] [CrossRef] [PubMed] [Green Version]
  36. Khan, I.; Yasinzai, M.M.; Mehmood, Z.; Ilahi, I.; Khan, J.; Khalil, A.; Saqib, M.S.; Rahman, W.U. Comparative study of green fruit extract of Melia azedarach Linn. with its ripe fruit extract for antileishmanial, larvicidal, antioxidant and cytotoxic activity. Am. J. Phytomed Clin. Ther. 2014, 2, 442–454. [Google Scholar]
  37. Ramamoorthy, P.K.T.; LakshmanaShetty, R.H.; Devidas, S.; Mudduraj, V.T.; Vinayaka, K.S. Antifungal and cytotoxic activity of Everniastrum cirrhatum (Fr.) Hale. Chiang Mai. J. Sci. 2012, 39, 76–83. [Google Scholar]
  38. Ullah, R.; Ibrar, M.; Shah, S.; Hameed, I. Phytotoxic, cytotoxic and insecticidal activities of Calendula arvensis L. J. Biotechnol. Pharm. Res. 2012, 3, 104–111. [Google Scholar]
  39. Aziz, M.A.; Shawn, M.M.A.K.; Rahman, S.; Islam, T.; Mita, M.; Faruque, A.; Rana, M.S. Secondary metabolites, antimicrobial, brine shrimp lethality & 4th instar Culex quinquefasciatus mosquito larvicidal screening of organic & inorganic root extracts of Microcos paniculata. IOSR J. Pharm. Biol. Sci. 2013, 8, 58–65. [Google Scholar]
  40. Saravanakumar, A.; Gandhimathi, R. Acute and chronic toxicity studies on Polygonum glabrum in experimental animals. Int. J. Pharmacomet. Integr. Biosci. 2018, 3, 7–10. [Google Scholar] [CrossRef]
Figure 1. Percent extract recovery of stem, root, seeds, and leaves of P. glabrum using various individual solvents and their combination (1:1) for extraction. NH: n-hexane; CH: Chloroform; AC: Acetone; EA: Ethyl acetate; M: Methanol; ET: Ethanol; W: Distilled water; NH:EA: n-hexane + Ethyl acetate; NH:ET: n-hexane + Ethanol; CH:M: Chloroform + Methanol; EA:M: Ethyl acetate + Methanol; AC:M: Acetone + Methanol; W:AC: Distilled water + Acetone; W:M: Distilled water + Methanol.
Molecules 27 00474 g001
Figure 2. TPC (µg GAE/mg extract), TFC (µg QE/mg extract), TAC (µg AAE/mg extract), TRP (µg AAE/mg extract) and %FRSA (DPPH assay) of stem, root, seeds, and leaves of P. glabrum employing various solvents and their combinations. Values are presented as mean ± SD from triplicate investigations.
Molecules 27 00474 g002
Figure 3. HPLC chromatograms of (A) standard polyphenols, (B,C) AC:M seeds extract of P. glabrum.
Molecules 27 00474 g003
Figure 4. (A). Correlation between total phenolic content and different antioxidant assays. (B). Correlation between total flavonoid content and different antioxidant assays.
Molecules 27 00474 g004
Figure 5. α-amylase inhibition by various solvent extracts of stem, root, seeds, and leaves of P. glabrum. The IC50 of acarbose (positive control) was 33.73 ± 0.12 µg/mL. The experiment was performed in triplicate, and values are presented as mean ± standard deviation. a−d means the difference is highly significant, slightly significant, and significant at p < 0.05.
Molecules 27 00474 g005
Figure 6. Protein kinase inhibitory activities of various solvent extracts of stem, seeds, leaves, and roots of P. glabrum. Positive control (surfactin at 20 µg/disc) gave 33 ± 1.10 mm bald zone of inhibition. Values (mean ± SD) are the average of triplicate investigations. a−d means the difference is highly significant, slightly significant, and significant at p < 0.05.
Molecules 27 00474 g006
Table 1. Calibration curve equations, retention times, correlation coefficient, LOD, and LOQ values of all the standards.
S. No.StandardsRetention Time-RT (min)Calibration Curve EquationCorrelation Coefficient (r2)LOD (μg/mL)LOQ (μg/mL)
1Gallic acid4.34y = 24.857x − 45.1740.99797.221.9
2Catechin7.64y = 7.985x − 17.5650.99953.510.7
3Caffeic acid10.09y = 26.097x + 95.4350.992413.741.4
4Rutin13.43y = 8.336x + 22.2170.99669.927.8
5Myricetin15.76y = 5.227x − 6.3040.99885.416.3
6Quercetin18.80y = 12.210x − 20.3480.99787.322.2
7Kaempferol21.56y = 9.994x + 15.2610.99982.37.0
8Apigenin22.38y = 18.111x + 25.5650.9975.015.2
Table 2. Polyphenols identified in various solvent extracts of stem, root, seeds, and leaves of P. glabrum by HPLC-DAD analysis.
ExtractPolyphenols (µg/mg Extract)
Gallic AcidRutinCatechinApigeninQuercetinKaempferol
Stem
EA0.43 ± 0.01 **--0.10 ± 0.00 ***--
AC---0.07 ± 0.00--
M0.22 ± 0.01 ***--0.09 ± 0.00--
ET0.46 ± 0.01**--0.11 ± 0.01 ***--
W0.12 ± 0.03 ***-----
EA:M0.26 ± 0.01 ***--1.26 ± 0.02 *--
AC:M0.44 ± 0.03 **-----
W:AC0.07 ± 0.00--1.10 ± 0.02 *--
W:M0.10 ± 0.02 ***-----
Root
EA0.40 ± 0.03 **-----
M0.44 ± 0.02 **-----
ET0.51 ± 0.01-----
W0.2 ± 0.03 ***-----
EA:M0.46 ± 0.02 **-----
AC:M0.16 ± 0.01 ***-----
W:AC0.09 ± 0.00-----
W:M0.13 ± 0.05 *** ----
Seed
EA--0.98 ± 0.10 *---
AC--0.93 ± 0.30 *---
M0.40 ± 0.10 **-0.81 ± 0.21 *-1.30 ± 0.50 *0.59 ± 0.05 **
ET0.46 ± 0.10 **-2.06 ± 0.32 *---
W0.18 ± 0.05 ***-----
EA:M0.19 ± 0.03 ***-1.87 ± 0.1 1*-3.28 ± 0.10 *0.52 ± 0.30 **
AC:M0.42 ± 0.05 **-2.55 ± 0.10 *-3.10 ± 0.11 *0.76 ± 0.10 **
W:AC0.10 ± 0.00-1.02 ± 0.10 *-0.7 ± 0.05 **0.09 ± 0.00
W:M0.21 ± 0.02 ***-----
Leaves
EA0.09 ± 0.000.21 ± 0.03 ***-0.8 ± 0.05 *0.5 ± 0.02 **1.6 ± 0.04 *
AC0.06 ± 0.01----1.21 ± 0.05 *
M0.09 ± 0.00----0.5 ± 0.05 **
ET0.25 ± 0.02 ***----1.36 ± 0.10 *
W------
EA:M0.43 ± 0.10 **0.15 ± 0.05 ***-1.45 ± 0.02 *0.39 ± 0.03 **2.71 ± 0.04 *
AC:M0.26 ± 0.05 ***--0.06 ± 0.000.27 ± 0.01 **2.29 ± 0.05 *
W:AC0.03 ± 0.00--0.92 ± 0.04 *--
W:M0.06 ± 0.01-----
- = Not detected; no polyphenol was detected in NH, CH, NH:EA, NH:ET, and CH:M of the given parts of P. glabrum. Myricetin and Caffeic acid were not identified in any of the samples. Means difference is highly significant (*), slightly significant (**), significant (***) at p < 0.05. Values are presented as mean ± standard deviation from triplicate investigations.
Table 3. Results of antibacterial activity of different solvent extracts of stem, root, seeds, and leaves of P. glabrum.
ExtractDiameter of Growth Inhibition Zone (mm ± SD) at 100 µg/disc, MIC (µg/mL)
Gram-NegativeGram-Positive
K. pneumoniaeMICS. typhimuriumMICM. luteusMICS. aureusMIC
Stem
NH10 ± 0.58 **1009 ± 0.00 **1007 ± 0.58>1009 ± 0.76 **>100
CH8 ± 0.58>1007 ± 0.58>1008 ± 0.58 ***>1008 ± 0.76>100
EA9 ± 0.58 **>1009 ± 0.00 **>10011 ± 0.00 **33.39 ± 0.50>100
AC9 ± 0.29 **>10010 ± 0.58 **33.311 ± 0.58 **100->100
M9 ± 0.58 **>1008 ± 0.58 ***1007 ± 0.58>10010 ± 0.58 **100
ET8 ± 0.58>1007 ± 1.00>10010 ± 0.58 **100->100
W8.5 ± 0.50 ***>1009 ± 0.58 **>1006 ± 0.001008 ± 0.58 ***>100
NH:EA10 ± 0.58 **10011 ± 0.58 **33.39 ± 0.58 **>1008 ± 0.58 ***>100
NH:ET10 ± 0.58 **10011 ± 1.00 **33.37 ± 0.00 ***>1009 ± 0.58 **>100
CH:M8 ± 0.58>100->1009 ± 0.58 **>1008 ± 1.00>100
EA:M11 ± 0.58 **33.313 ± 0.58 *33.38 ± 0.00>1008 ± 0.58>100
AC:M10 ± 0.58 **10014 ± 0.58 *11.18 ± 0.58 ***>1007 ± 0.58 ***>100
W:AC8 ± 0.58 ***10010 ± 0.58 **33.3->1008 ± 0.29>100
W:M8 ± 0.58 ***>10010 ± 1.15 **33.39 ± 0.58 **>1009 ± 0.00 **>100
Root
NH10 ± 0.58 **1009 ± 0.58>1007 ± 0.58>1008 ± 0.58 ***>100
CH10 ± 0.58 **10010 ± 0.58 **1009 ± 0.00 **>1007 ± 1.00>100
EA10 ± 0.58 **10011 ± 0.58 **33.39 ± 0.58 **>1008 ± 0.58 ***>100
AC10 ± 0.00 **33.311 ± 0.58 **33.39 ± 0.58 **>1006 ± 0.00>100
M11 ± 0.58 **33.313 ± 0.58 *33.39 ± 0.58 **>1007 ± 1.00 ***>100
ET12 ± 0.29 **10011 ± 0.58 **948 ± 0.00 ***>1009 ± 1.15 **>100
W7 ± 0.58>10010 ± 0.581007 ± 0.58>1007 ± 1.00>100
NH:EA7 ± 0.58 ***>10013 ± 0.58 *33.310 ± 0.58 **1008 ± 0.58 ***>100
NH:ET7 ± 0.58>10014 ± 0.58 *11.1->1008 ± 0.58>100
CH:M9 ± 1.73 **>10014 ± 0.58 *11.111 ± 0.00 **1008 ± 1.00 ***>100
EA:M8 ± 0.58 ***>10014 ± 1.00 *11.18 ± 0.58>1008 ± 0.58 ***>100
AC:M7 ± 0.58 ***>10014 ± 1.15*33.314 ± 0.58 *11.18 ± 0.58>100
W:AC7 ± 0.58 ***>10013 ± 0.58 *33.310 ± 0.58 **1009 ± 0.58 **>100
W:M7 ± 0.00>10010 ± 0.58 **10010 ± 0.58 **1008 ± 0.58 ***>100
Seeds
NH10 ± 0.5810013 ± 0.58 *11.19 ± 0.58>1009 ± 0.58>100
CH10 ± 0.58 **10020 ± 1.00 *3.79 ± 0.58 **>1009 ± 0.58 **>100
EA7 ± 0.58 ***>10014 ± 1.00 *4.710 ± 0.00 **1008 ± 1.00 ***>100
AC9 ± 0.58 **>1009 ± 1.00>10010 ± 0.58 **1006 ± 0.58 ***>100
M10 ± 0.5810016 ± 0.58 *3.77 ± 0.58>1009 ± 0.00 **>100
ET9 ± 0.58 **>10014 ± 0.58 *11.110 ± 0.58 **1008 ± 0.58>100
W10 ± 0.58 **1007 ± 0.58>1007 ± 0.00 ***>1007 ± 0.58>100
NH:EA12 ± 0.58 **33.310 ± 0.58 **1009 ± 0.58 **>1009 ± 0.58 **>100
NH:ET10 ± 0.58 **10012 ± 1.00 **33.38 ± 0.58>10010 ± 0.58 **100
CH:M9 ± 0.58 **>10015 ± 0.58 *3.79 ± 0.00 **>10010 ± 0.58 **100
EA:M11 ± 0.58 **10010 ± 0.58 **1008 ± 0.00>1009 ± 0.00 **>100
AC:M9 ± 0.55>10012 ± 0.58 **33.38 ± 0.58 ***>1008 ± 1.00>100
W:AC9 ± 1.15**>1009 ± 1.00 **>1007 ± 0.58>1009 ± 1.00 **>100
W:M9 ± 0.58 **>1008 ± 0.58>1009 ± 0.58 **>1008 ± 0.58>100
Leaves
NH9 ± 0.58 **>1009 ± 0.58>1009 ± 0.58 **>10010 ± 0.58 **100
CH8 ± 0.58>10015 ± 0.58 *3.79 ± 0.00>1008 ± 0.58>100
EA10 ± 0.58 **10010 ± 1.53**10010 ± 0.58 **1008 ± 0.58 ***>100
AC10 ± 0.58 **10012 ± 0.58 **33.3->10010 ± 0.58 **100
M10 ± 0.58 **10010 ± 0.581009 ± 0.58 **>1008 ± 0.58>100
ET9 ± 0.58>1008 ± 0.58 ***>1008 ± 0.58 ***>1008 ± 0.58 ***>100
W9 ± 0.58 **>10011 ± 0.58 **100->1008 ± 1.15 ***>100
NH:EA9 ± 0.58 **>10016 ± 0.58 *3.78 ± 0.58>1008 ± 0.58>100
NH:ET10 ± 0.58 **1008 ± 0.58>1008 ± 0.58 ***>1009 ± 1.00 **>100
CH:M8 ± 0.58>10010 ± 1.00 **1006 ± 0.00>1008 ± 0.58 ***>100
EA:M7 ± 0.58 ***>10010 ± 0.58 **10011 ± 0.58 **10010 ± 0.58 **100
AC:M8 ± 0.58>10010 ± 1.15**1007 ± 0.58 ***>1008 ± 0.58>100
W:AC12 ± 0.58 **33.310 ± 1.15**1006 ± 0.00>1008 ± 0.58>100
W:M10 ± 0.5810010 ± 0.58 **1007 ± 0.00 ***>1008 ± 0.58 ***>100
Standards
Ciprofloxacin17 ± 1.60.0610 ± 0.070.0624 ± 0.950.815 ± 0.850.125
Cefixime19.5 ± 1.30.221 ± 0.850.0224.6 ± 0.60.822.5 ± 0.110.25
Zones of inhibition include the diameter of disc (6 mm). Each sample concentration was 100 µg per disc (5 µL). Values (mean ± SD) are the average each plant extract analyzed individually in triplicate (n = 1 × 3). - = No activity in disc diffusion assay. Positive control (cefixime and ciprofloxacin) concentration was 20 µg/disc. Negative control (DMSO) was inactive against each bacterial strain. Means difference is highly significant (*), slightly significant (**), and significant (***) at p < 0.
Table 4. Results of antifungal activity of different solvent extracts of stem, root, seeds, and leaves of P. glabrum.
ExtractDiameter of Growth Inhibition Zone (mm) at 100 µg/disc, MIC (µg/disc)
A. flavusMICA. nigerMICF. solaniMICA. fumigatusMICMucor sp.MIC
Stem
NH9 ± 1.00 **-7 ± 0.00 ***-9 ± 0.00 **-13 ± 0.58 *1007 ± 0.58-
CH8 ± 0.58---10 ± 0.58 **-7 ± 0.00---
EA7 ± 0.58 ***-7 ± 0.58 ***---8 ± 0.58 ***---
AC--9 ± 0.58 **-8 ± 0.58 ***-13 ± 0.58 *100--
M------11 ± 0.58 **---
ET----8 ± 0.58-8 ± 1.00---
W10 ± 1.73 **-8 ± 0.58 ***-9 ± 0.58 **-13 ± 1.52 *1007 ± 1.00 ***-
NH:EA9 ± 1.73 **---13 ± 0.58 *100----
NH:ET--11 ± 0.00 **-12 ± 0.58 *1007 ± 0.58---
CH:M8 ± 0.00 ***---------
EA:M8 ± 1.15 ***---7 ± 0.00 ***-9 ± 1.15 **---
AC:M----8 ± 0.00-----
W:AC11 ± 1.00 **-----12 ± 1.00 *100--
W:M9 ± 0.58 **-----12 ± 1.52 *100--
Root
NH8.5 ± 0.5---6.5 ± 0.00-9 ± 1.73 **-6.5 ± 0.50-
CH8 ± 1.52 *** --7 ± 0.58 ***-7 ± 0.58 ***-8 ± 0.58 ***-
EA----8 ± 0.58-8 ± 1.15---
AC----8 ± 0.58 ***-9 ± 1.52 **-8 ± 0.58 ***-
M10 ± 0.58 **---8 ± 0.58 ***-----
ET----8 ± 0.00-10 ± 1.52 **---
W9 ± 0.58 **---6.5 ± 0.02-9 ± 0.58 **---
NH:EA10 ± 0.58 **-7 ± 0.58-9 ± 0.58 **-12 ± 0.58 *100--
NH:ET8 ± 1.15---8 ± 0.58 ***-6 ± 0.00---
CH:M9 ± 1.15 **-8 ± 0.58 ***-7 ± 0.58 ***-7 ± 0.58---
EA:M--7 ± 0.00 ***-7 ± 0.00-11 ± 0.58 **-12 ± 0.58 *100
AC:M--11 ± 0.58 **-8 ± 0.15 ***-12 ± 1.15 *100--
W:AC10 ± 1.15 **-9 ± 0.58-12 ± 0.58 *10012 ± 0.00 *10012 ± 0.58 *100
W:M13 ± 1.73 *10010 ± 0.58 **-8 ± 0.58 ***-13 ± 0.58 *10010 ± 1.15 **-
Seed
NH10 ± 1.00 **-11 ± 0.58 **-------
CH--9 ± 0.58 **-------
EA--8 ± 0.58-------
AC--8 ± 0.00 ***-------
M--9 ± 0.58 **-------
ET--8 ± 0.58-------
W--11 ± 1.67 **-------
NH:EA--9 ± 1.00 **---7 ± 0.58---
NH:ET--8 ± 0.00-------
CH:M--11 ± 0.58 **---7 ± 0.58 ***---
EA:M--8 ± 0.58-------
AC:M--7 ± 0.00 ***-------
W:AC--10 ± 0.58 **-------
W:M--11 ± 1.15-------
Leaves
NH8 ± 1.15 ***-10 ± 0.58 **-8 ± 0.58-10 ± 0.58 **-10 ± 1.52 **-
CH9 ± 0.58 **-9 ± 0.00 **-9 ± 0.58 **-11 ± 0.58 **-15 ± 1.00 *100
EA9 ± 1.73**-9 ± 0.00-8 ± 0.58 ***-10 ± 0.58-12 ± 0.58 *100
AC9 ± 0.58 **-7 ± 1.00-10 ± 0.00-9 ± 0.58 **-8 ± 0.58-
M8 ± 1.15-10 ± 1.53 **-9 ± 0.58 **-9 ± 0.58 **-9 ± 0.58 **-
ET10 ± 1.52 **-9 ± 0.00 **-9 ± 0.15 **-9 ± 0.58 **-11 ± 0.58-
W7 ± 0.58-7 ± 1.53-11 ± 0.58-9 ± 1.15**-9 ± 0.58 **-
NH:EA9 ± 0.58 **-10 ± 0.58 **-11 ± 0.58 **-9 ± 1.15-8 ± 0.58-
NH:ET9 ± 0.58-7 ± 0.58 ***-9 ± 0.58 **-10 ± 0.58 **-13 ± 0.58 *100
CH:M11 ± 0.58 **-7 ± 1.15-10 ± 0.58 **-9 ± 0.58 **-9 ± 0.58 **-
EA:M10 ± 0.58 **-8 ± 1.15***-11 ± 0.58---10 ± 1.53**-
AC:M9 ± 0.58 **-9 ± 0.58 **-11 ± 1.15 **---11 ± 0.58-
W:AC9 ± 0.00 **-10 ± 1.52 **-8 ± 0.58-7 ± 0.58-11 ± 0.58 **-
W:M7 ± 0.00-11 ± 1.52 **-8 ± 0.58 ***-9 ± 0.58 **-6.5 ± 0.50 ***-
Standard
Clotrimazole30 ± 0.581.1135 ± 2.301.1128 ± 0.001.1134 ± 0.581.1131 ± 1.001.11
Zones of inhibition include the diameter of disc (6 mm). Each sample concentration was 100 µg per disc (5 µL). Values (mean ± SD) are the average of each plant extract analyzed individually in triplicate (n = 1 × 3). - = No activity in disc diffusion assay. Positive control (clotrimazole) concentration was 20 µg/disc. Negative control (DMSO) was inactive against each fungal strain. Means difference is highly significant (*), slightly significant (**), and significant (***) at p < 0.
Table 5. Brine shrimp lethality assay of various solvent extracts of stem, root, seeds, and leaves of P. glabrum.
ExtractsPercent Mortality at Various Concentrations (µg/mL)
5002501256332LC50 (µg/mL)
Stem
NH53 ± 0.5834 ± 1.15---351
CH42 ± 0.5841 ± 1.00--->500
EA41 ± 0.5831 ± 1.15--->500
AC76 ± 1.5354 ± 1.7327 ± 1.5320 ± 1.5317 ± 1.15200
M69 ± 1.1540 ± 1.00---300
ET74 ± 1.1565 ± 1.5333 ± 1.5325 ± 2.524 ± 1.53248
W25 ± 0.5814 ± 1.00--->500
NH:EA20 ± 0.5820 ± 1.53--->500
NH:ET50 ± 0.0044 ± 0.58--->500
CH:M54 ± 1.5336 ± 0.53---405
EA:M69 ± 1.0061 ± 1.0055 ± 2.0040 ± 2.0030 ± 2.00100
AC:M62 ± 0.5855 ± 0.5860 ± 1.5331 ± 3.6113 ± 2.5281
W:AC31 ± 1.1511 ± 0.58--->500
W:M30 ± 1.0025 ± 1.00--->500
Root
NH72 ± 0.5831 ± 1.00---347
CH21 ± 0.5820 ± 0.58--->500
EA95 ± 1.5383 ± 1.5349 ± 1.1541 ± 3.6123 ± 1.53130
AC89 ± 1.0078 ± 10.989 ± 1.1584 ± 3.6143 ± 1.1540
M75 ± 1.1561 ± 0.0043 ± 2.0832 ± 2.0013 ± 2.65180
ET74 ± 1.5370 ± 0.5862 ± 2.5251 ± 3.2132 ± 2.5265
W75 ± 1.1561 ± 1.1523 ± 2.0813 ± 2.525 ± 0.5860
NH:EA66 ± 0.5863 ± 1.0034 ± 2.0822 ± 2.659 ± 1.00200
NH:ET51 ± 0.5831 ± 1.53---500
CH:M82 ± 1.0075 ± 1.0018 ± 2.0015 ± 2.009 ± 1.15180
EA:M80 ± 1.0073 ± 1.5367 ± 3.0039 ± 2.089 ± 1.0078
AC:M87 ± 0.5856 ± 1.0050 ± 0.5822 ± 2.5220 ± 0.58125
W:AC29 ± 1.0014 ± 1.00--->500
W:M24 ± 1.0014 ± 1.15--->500
Seeds
NH88 ± 1.0085 ± 0.5877 ± 3.5168 ± 2.5237 ± 2.5243
CH64 ± 1.0048 ± 0.00---261
EA71 ± 1.0064 ± 1.1552 ± 1.5328 ± 2.0019 ± 1.53110
AC83 ± 0.5867 ± 0.5853 ± 2.5231 ± 9.8728 ± 2.52107
M52 ± 1.5343 ± 1.53---500
ET62 ± 0.5844 ± 1.73---289
W20 ± 0.5816 ± 1.00--->500
NH:EA97 ± 0.5889 ± 1.7393 ± 2.5278 ± 2.0828 ± 2.6551
NH:ET47 ± 1.5344 ± 1.15--->500
CH:M64 ± 0.5832 ± 0.58---310
EA:M55 ± 0.5854 ± 1.15---300
AC:M51 ± 1.0040 ± 0.58---500
W:AC55 ± 0.5847 ± 1.15---333
W:M42 ± 0.5837 ± 0.00--->500
Leaves
NH94 ± 0.5870 ± 0.0078 ± 1.5349 ± 1.5336 ± 3.6167
CH96 ± 1.0090 ± 0.0082 ± 2.5278 ± 2.0849 ± 1.5335
EA99 ± 0.5894 ± 0.5886 ± 1.0048 ± 1.5339 ± 1.1571
AC91 ± 1.0080 ± 0.0030 ± 0.5821 ± 1.0011 ± 1.00190
M69 ± 1.1564 ± 1.0058 ± 1.5342 ± 1.5330 ± 1.0097
ET75 ± 1.5360 ± 1.5350 ± 1.0031 ± 1.0019 ± 1.53125
W43 ± 1.5320 ± 0.58--->500
NH:EA94 ± 1.0089 ± 1.0089 ± 1.5363 ± 2.5251 ± 1.1530
NH:ET83 ± 1.5376 ± 1.5371 ± 1.5367 ± 0.5850 ± 0.5832
CH:M81 ± 1.5363 ± 1.5363 ± 2.0051 ± 1.5341 ± 1.5362
EA:M84 ± 1.0078 ± 1.5362 ± 2.0039 ± 1.5332 ± 2.0076
AC:M82 ± 1.5373 ± 1.0069 ± 1.5363 ± 1.5354 ± 2.6530
W:AC90 ± 0.0074 ± 1.5360 ± 1.0038 ± 1.5330 ± 0.5883
W:M93 ± 2.0090 ± 0.5858 ± 2.0056 ± 1.5328 ± 2.0052
Negative control: DMSO. LC50 of Doxorubicin (positive control employed in the brine shrimp lethality assay) was 5.93 μg/mL. Values (mean ± SD) are the average of three samples of each plant extract, analyzed individually in triplicate (n = 1 × 3).
Publisher’s Note: MDPI stays neutral with regard to jurisdictional claims in published maps and institutional affiliations.

