Article

Orthorhombic Crystal Structure of Grossular Garnet (Suva Česma, Western Serbia): Evidence from the Rietveld Refinement

1
Department for Catalysis and Chemical Engineering, Institute of Chemistry, Technology and Metallurgy, University of Belgrade, Njegoševa 12, 11000 Belgrade, Serbia
2
Geological Survey of Serbia, Rovinjska 12, 11000 Belgrade, Serbia
3
Faculty of Mining and Geology, University of Belgrade, Djušina 7, 11000 Belgrade, Serbia
*
Author to whom correspondence should be addressed.
Powders 2023, 2(2), 387-402; https://doi.org/10.3390/powders2020023
Submission received: 24 February 2023 / Revised: 11 May 2023 / Accepted: 16 May 2023 / Published: 18 May 2023
(This article belongs to the Special Issue Feature Papers in Powders)

Abstract

:
The grossular garnet from rodingite-type rock from the Suva Česma area in western Serbia is characterized with its weak anisotropic nature. Because its anisotropy could indicate a non-cubic lower symmetry, SEM-EDS and Rietveld powder refinement methods were used. The SEM-EDS results have shown that the garnet has a (Ca3.00Mn0.01)3.01(Al1.82Fe0.15Ti0.02)1.99(Si2.97Al0.03)3.00O12 chemical composition (i.e., Grs91Adr08), which can be more specifically explained as ferric iron containing grossular. The next step further used Rietveld powder refinements of the various crystal structures in the Ia‾3d, R‾3c, R‾3, I41/a, Fddd, C2/c, and I‾1 space groups as well as a single mixture, which was followed by a comparative analysis of the R-values, site occupancy factors, and bond lengths and angles. The synthesis of these results showed both that the studied grossular garnet is not cubic and that it crystallized in the disordered Fddd space group with the final RB = 5.29% and RF = 1.75%. It was presumed that the grossular formed at temperatures between 150 and ~600 °C.

1. Introduction

Field geological mapping and accompanied laboratory studies were conducted in the vicinity of Valjevo in Western Serbia to create a basic geological map. During this process, samples of Jurassic age ophiolites, such as serpentinites, gabbros, peridotites, andesites, diabases, and amphibolites, were mapped [1]. At the Suva Česma locality within the field exploration area, a single rock was detected that was rather unusual (Figure 1). This unknown rock was collected from contact with serpentinite; after using an optical microscopic, X-ray powder diffraction (XRPD), and chemical methods to determine its constraints, the rock was found to be rodingite [2].
The occurrence of rodingite at Suva Česma was the first example of this type of rock discovered in Serbia. The initial mineralogical constraints show that the Suva Česma rodingite can be characterized by its massive structure and granoblastic texture. The results further show that the rodingite primarily consists of macroscopically white, microscopically transparent, and weakly anisotropic grossular (i.e., >80%). Grossular appears in a coarse-grain granular form, with a size of ca. 0.5–1.5 mm. The calculated unit-cell, found through the XRPD method, indicated that this grossular has Grs98Adr2 composition (the mineral abbreviations Grs and Adr refer to grossular and andradite, respectively [3]).
Green Mg-Al-Fe chlorite (Chl; [3]) occupies interstitials between the grossular grains in this rock. Pseudomorphic forms of chlorite, up to ca. 0.5 mm in size, are most likely to represent a secondary phase created by the alteration of pyroxene [2].
The typical mineral appearances of Grs and Chl as observed by the transmitted light microscopy are presented in Figure 2. Microscopic examination shows that grossular does not have visible twinning, zonation areas, or isotropic areas.
In the following study, the main goal was to conduct an XRPD examination of the crystal structure of grossular garnet from the rodingite-type rock [2] using the Rietveld powder refinement method for several reasons, including:
  • Only three optically anisotropic grossular-andradite garnets from Serbia have been characterized so far (i.e., from skarns found in the Kopaonik Mts. [4,5,6], Rogozna Mts. [7], and Rudnik Mts. [8]);
  • We believe that the weak garnet anisotropy could indicate the presence of disymmetrization; there are five possible causes of this, discussed in [4,5,6]. In summary, it is agreed that the that grossular-andradite garnet group could exhibit non-cubic symmetry in various space groups (hereinafter, s.g.’s), such as: I‾1 [9,10,11,12,13,14]; Fddd [9,12,15,16]; Fddd or C2/c [17]; R‾3c or Fddd [5]; and R‾3c [6]. More recently, it was shown that these minerals could have a tetragonal symmetry (most likely I41/a s.g.), as well [18].
To present a more reliable chemical composition of grossular garnet, we also used the results of the SEM-EDS investigations.

2. Materials and Methods

2.1. SEM-EDS Method

The SEM-EDS investigations were carried out at the University of Belgrade, Faculty of Mining and Geology, using a JEOL JSM-6610LV (JEOL Ltd., Tokyo, Japan) Scanning Electron Microscope (SEM; with a W-filament as a beam source), coupled with an XMax Energy Dispersive Spectrometer (EDS). The polished rodingite samples were coated with carbon using a BALTEC-SCD-005 sputter coating device. The results were recorded under high vacuum conditions with acceleration voltage of 20 kV. The following external standards were used to obtain garnet chemical compositions: almandine for Al, Si and Fe; spessartine for Mn; diopside for Ca; and TiO2 for Ti. Processing option was oxygen by stoichiometry, whereas the number of ions calculation was based on 8.00 cations per formula unit (hereinafter apfu).

2.2. XRPD Method

One selected rodingite sample was manually powdered and homogenized under alcohol in an agate mortar for several hours to ensure good statistical distribution of the grains. After that, it was placed in a bottom-loaded aluminum carrier. Diffraction data were collected at the University of Belgrade, Faculty of Mining and Geology, on a Phillips PW1710 diffractometer (PANalytical, Almelo, The Netherlands) equipped with a graphite monochromator (Cu 1, λ = 1.540562 Å; Cu 2, λ = 1.544390 Å) and an Xe-filled proportional counter; tests were conducted at room temperature (23 °C). Divergence and receiving slits were fixed to 1° and 0.1 mm, respectively. The generator was set up at 40 kV and 30 mA. The diffractometer alignment was checked using a reference material of powdered crystalline silicon according to the manufacturer’s user manual. Data were collected in scan-step mode, with a 0.02° 2θ step and between 4° and 135° 2θ and 12.9 s step−1 for collecting data used for Rietveld structure refinements.
The procedure applied included Rietveld refinements of the crystal structures in a series of seven space groups and one mixture, followed by the comparative analysis of the R-values, site occupancy factors (hereinafter sofs), and bond lengths and angles. Beyond these, the estimated standard deviations (hereinafter esds) were also considered as an additional accessory tool.

3. Results and Discussion
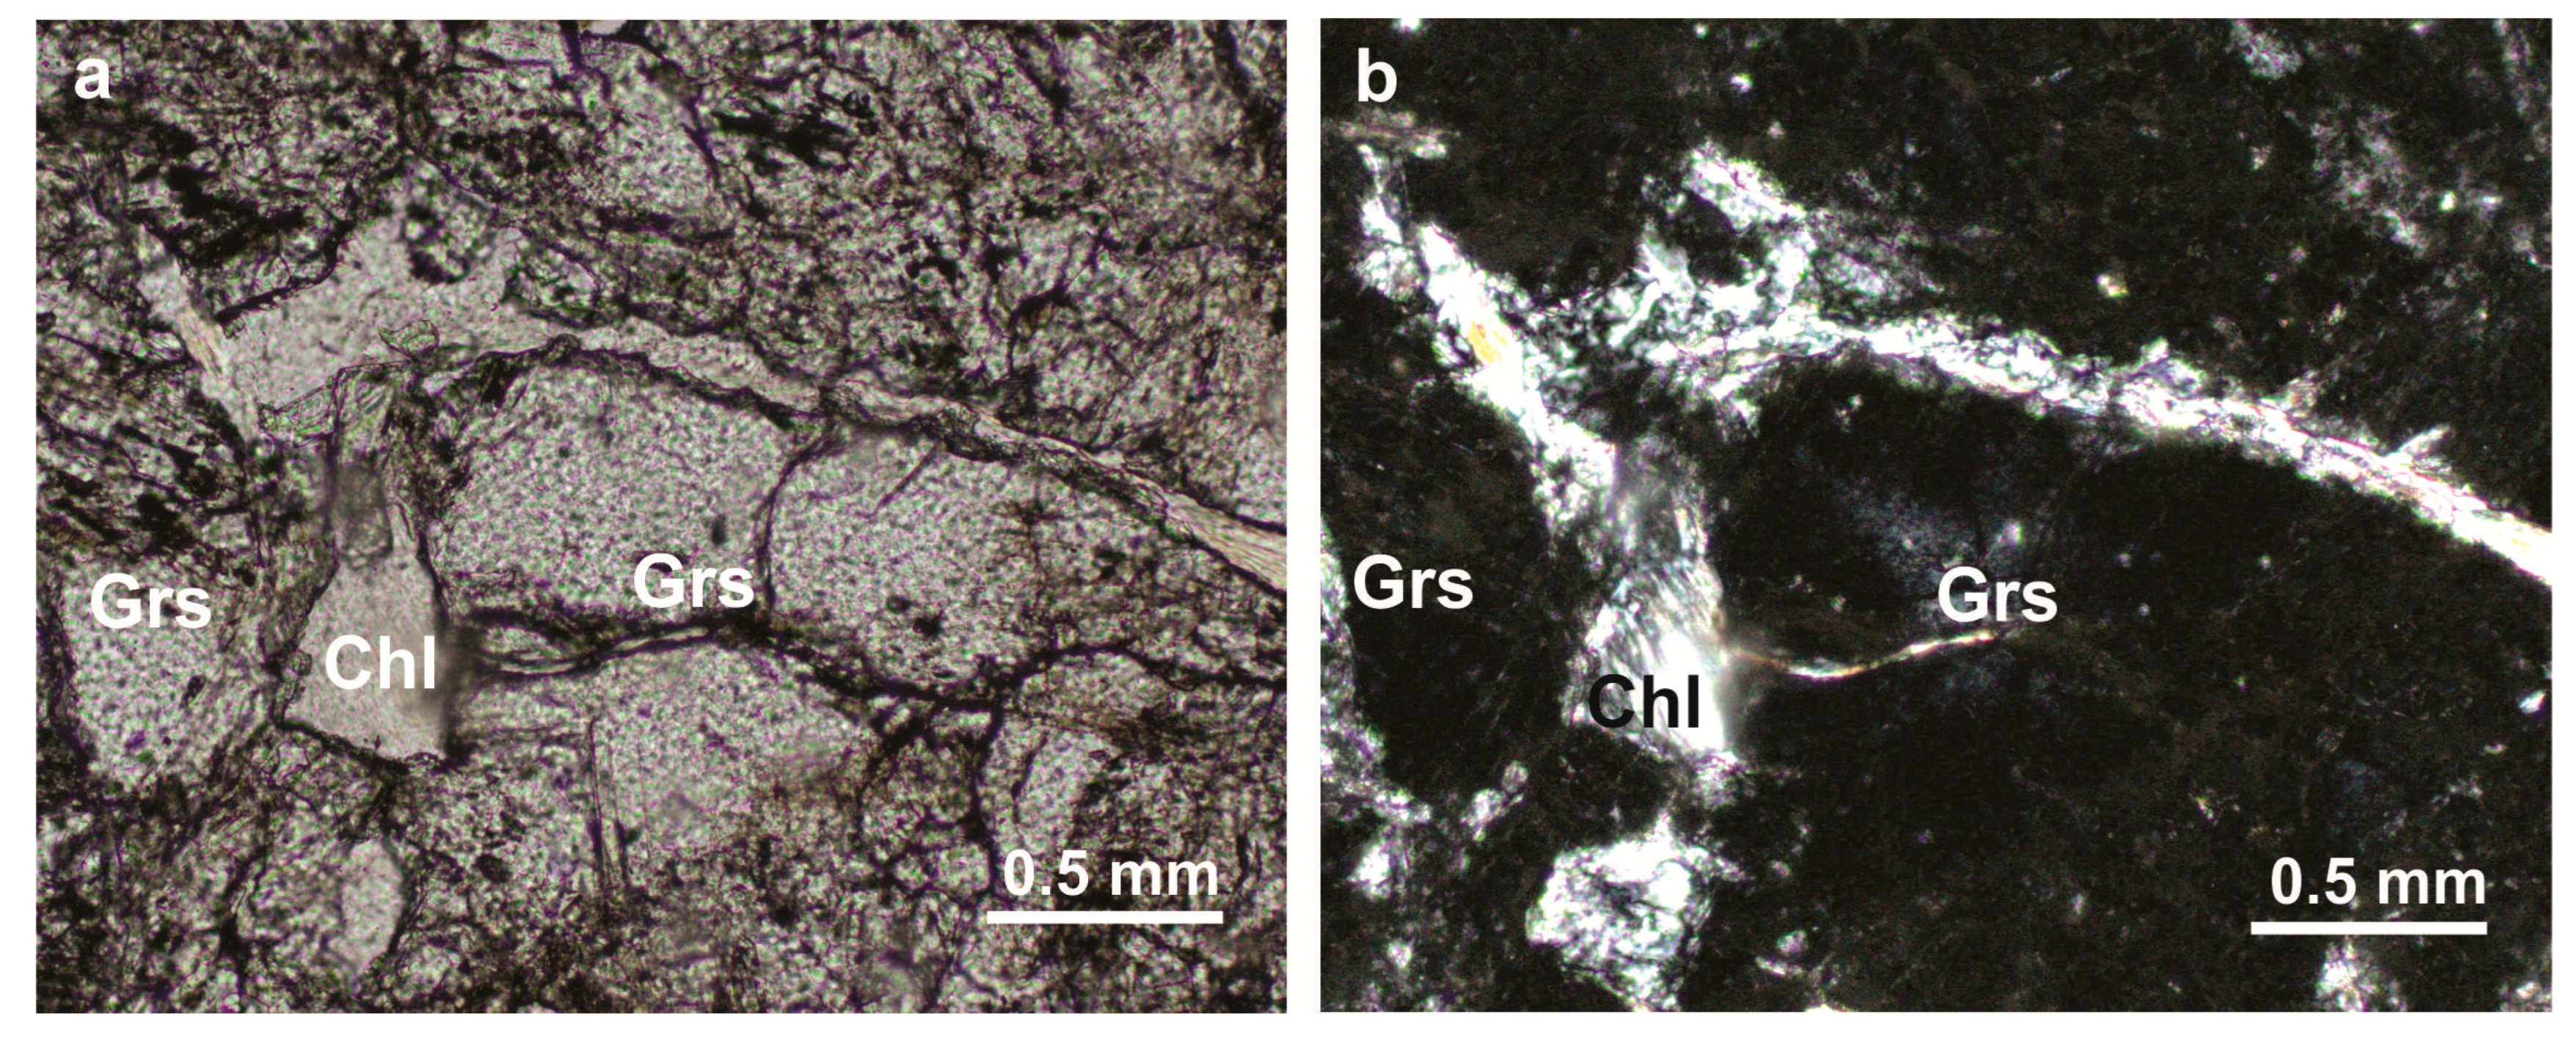
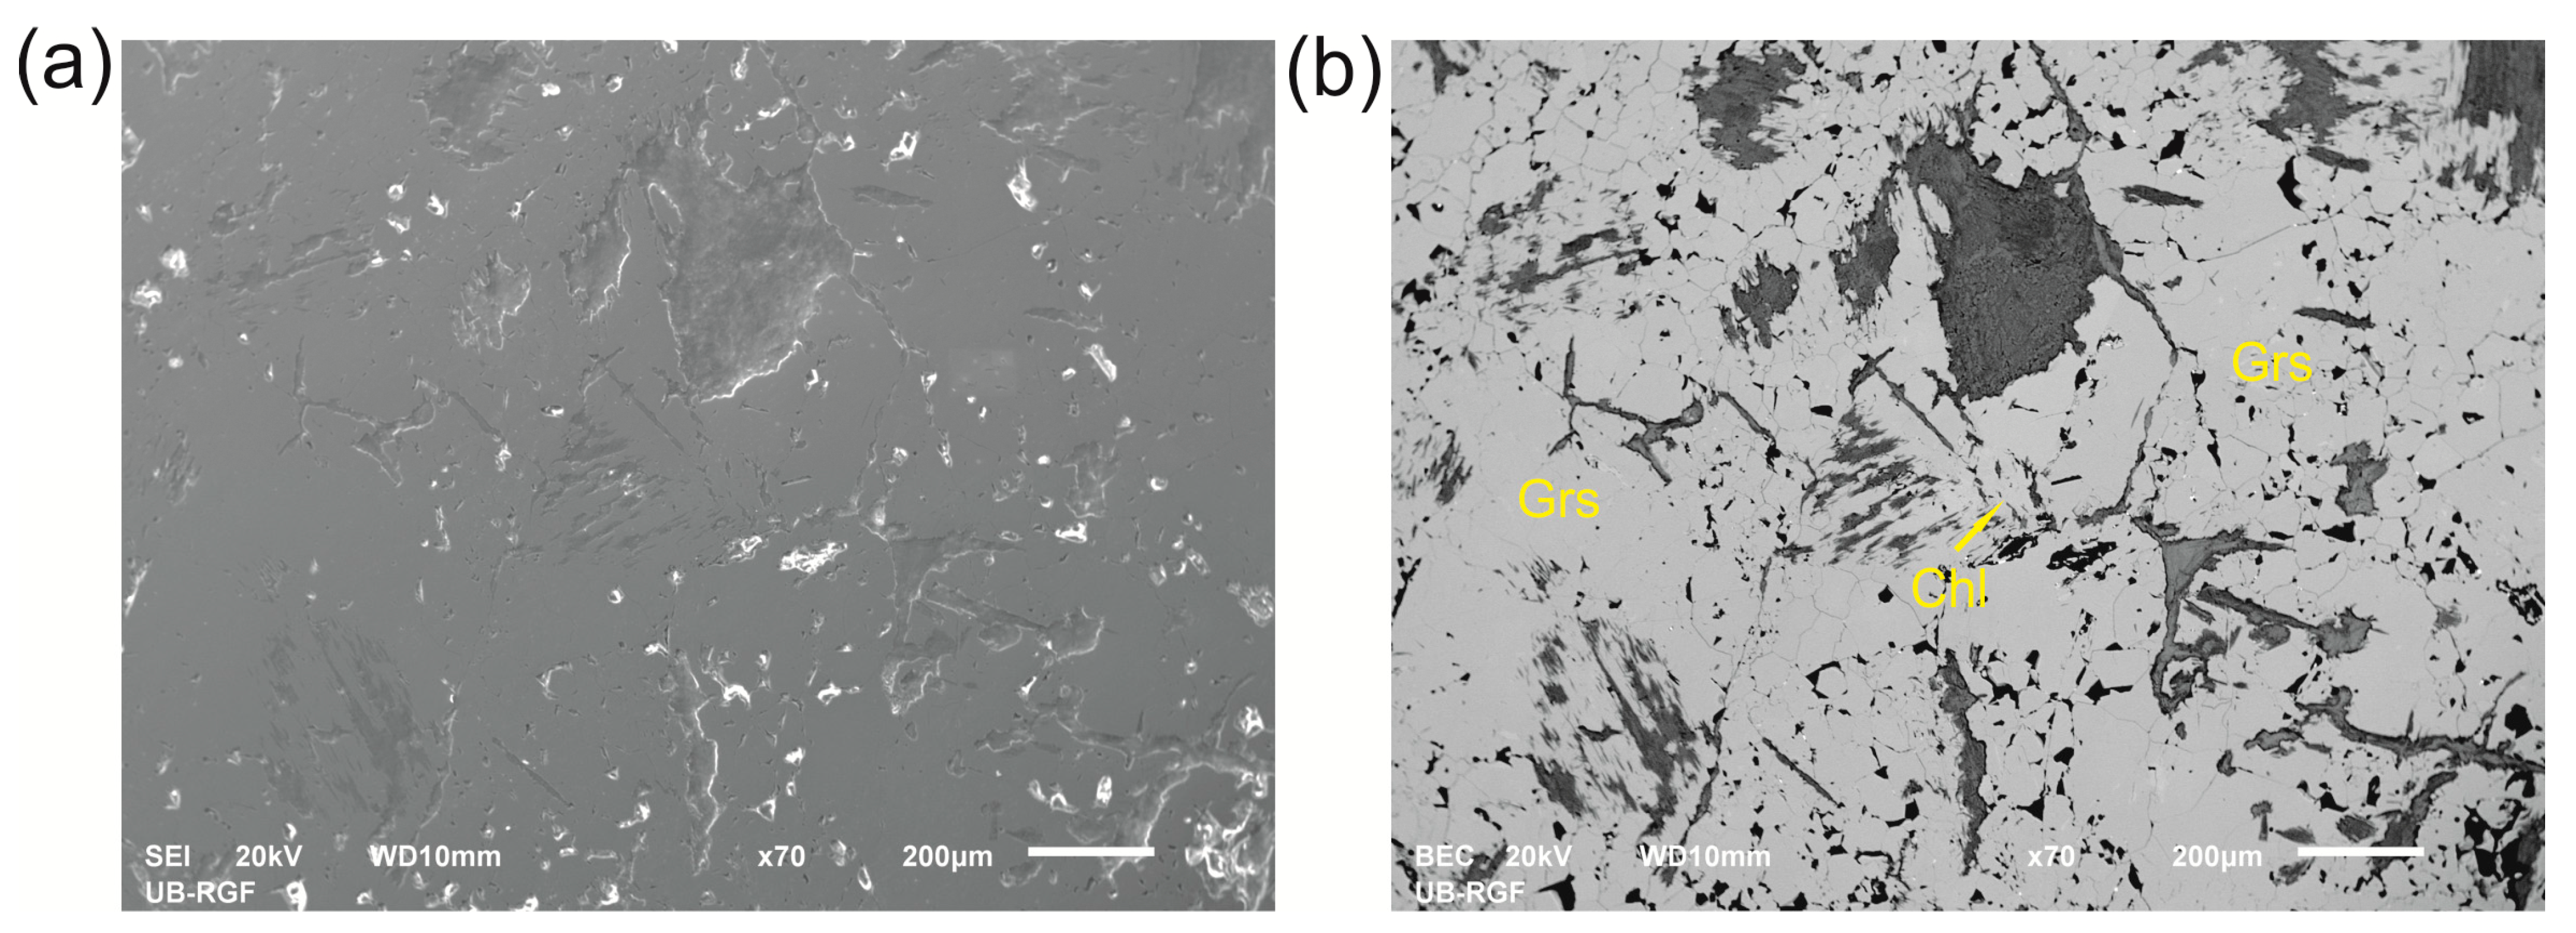
3.1. SEM-EDS Study

The SEM and BSE microphotographs of Grs and Chl are presented at Figure 3 and show that there is no visible twinning or zonation in the grossular.
The general formula of garnet is [8]{X}3[6][Y]2[4](Z)3[4]O12, where the eight-coordinated dodecahedral {X} site contains Ca2+, Mg2+, Mn2+, or Fe2+ cations; the six-coordinated octahedral [Y] site contains Al3+, Cr3+, Fe3+, Ti4+, or Zr4+ cations; and the four-coordinated tetrahedral (Z) site contains Si4+, Al3+, or Fe3+ cations, or (O4H4) groups [19].
The representative spot for chemical analyses of the studied garnet are shown in Table 1. According to these chemical analyses in tetrahedral coordination (Z-cations), a minor amount of aluminum occurs along with the silicon, whereas in octahedral coordination (Y-cations), in addition to Al, Fe3+ and Ti are occurring. In dodecahedral coordination (X-cations), calcium and minor amounts of manganese occur, as well as Fe2+. The average chemical composition shows that the examined garnet contains a major 91.1 mol. % of Grs component and 8.4 mol. % of Adr component. On the other hand, the amount of almandine (Alm; [3]) and spessartine (Sps; [3]) are minor, i.e., 0.1 and 0.4 mol. %, respectively; pyrope (Prp; [3]) and uvarovite (Uv; [3]) components were not detected.
According to these results, the average chemical composition of the studied garnet could be illustrated as (Ca3.00Mn0.01)3.01(Al1.82Fe0.15Ti0.02)1.99(Si2.97Al0.03)3.00O12. Therefore, it appears to have somewhat more andradite (calculated together with Ti) content relative to the previous results [2]. Namely, it has a Grs91Adr08 composition, which defines it more specifically as ferric iron containing grossular.

3.2. Crystal Structure Refinements

To determine what could be the true space group of the grossular garnet studied, two types of crystal models were tested using the Rietveld profile method and Fullprof program [21].
1. A mixture of two phases, with garnet as the first phase and including the various s.g.’s (such as cubic Ia‾3d (No 230), rhombohedral R‾3c (No 167) and R‾3 (No 148), tetragonal I41/a (No 88), orthorhombic Fddd (No 70), monoclinic C2/c (No 15), and triclinic I‾1 (No 2)), and chlorite as the second phase.
2. A mixture of the three phases, i.e., the two garnet phases with the cubic Ia‾3d s.g.’s and chlorite (third phase).
1. Crystal structure refinements were performed starting from the cubic Ia‾3d s.g., which was nominally assigned for the garnet group [19,22]. The pseudo-Voigt peak shape function was assumed. In the last cycle of refinements, 116 parameters were varied: 100 parameters for the background description, 11 profile parameters (1 scale factor, 1 Eta (p-v) parameter, 1 overall temperature parameter, 3 parameters for the description of the halfwidths (U, V and W), 1 parameter for preferred orientation, 2 asymmetry parameters, 1 mixing parameter, and 1 zero point; Table S1); 1 parameter for the a0 unit cell dimension (Table S2); 1 sof at the octahedral [Y] site (Table S3); and 3 free oxygen ion coordinates. According to the previously detected presence of minor Alm and Sps components (Table 1), sof at the dodecahedral {X} site was justifiably presumed to be fully occupied with Ca, and therefore was not varied. These starting parameters and all of the studied s.g.’s were taken from [5].
An additional 47 parameters were taken and varied for chlorite in the triclinic C‾1 s.g. [23]: 1 scale factor, 1 mixing parameter, 6 lattice constant parameters, and 39 free ion coordinates.
Furthermore, for approximate estimation of the Al–Fe3+ substitutions in the octahedral sites (Al<a0> and AlV0), we used available unit-cell dimensions (i.e., <a0> and volume V0; Table S2), which had been shown to be useful tools for this purpose in our previous studies [6,24,25]. All of the other calculated Al sofs and selected Si–O, Y–O and Ca–O distances are listed in Table S3, whereas the final Rietveld plot is shown in Figure S1.
As is well-known, symmetry that drops from the Ia‾3d s.g. to the other six space groups studied increases the number of ions in special and general positions, as well as the parameters of their coordinates, unit cell dimensions, and sofs (Tables S1–S3). It should be also mentioned here that for the triclinic I‾1 s.g., instead of 100 parameters for the background description, 6 Chebyschev’s polynomial parameters were used, and 2θ regions from 4° to 10° were also omitted. Crystal structure studies were performed without any constraints, whereas the esds values were multiplied with the SCOR factors [26]. The final Rietveld plots are shown in Figures S2–S7. Reliability factors for all of the studied space groups are presented in Table 2.
2. An additional seven parameters were taken and varied for the second garnet phase, which used the cubic Ia‾3d s.g. in the mixture of three aforementioned phases: one scale factor, one mixing parameter, one lattice constant parameters, one sof at the octahedral [Y] site, and three free oxygen coordinates. Unfortunately, this refinement did not reach convergence; therefore, it is not presented. On the other hand, this result could be a good indicator that the studied grossular garnet does not crystallize as a mixture of two cubic phases.
For additional confirmation, the previous crystal structure refinements in all the seven various studied s.g.’s (i.e., Tables S1–S3 and Figures S1–S7) were performed with the constraints, which is suitable for the combination of the chemical composition (Table 1) and experimental data for Grs and Adr [19]. The applied constraints for the distances are as follows: <Si–O> = 1.645(5) Å, <Ca′–O> = 2.491(5) Å, and <Ca′′–O> = 2.321(5) Å. In addition, by using the calculated Al<a0> and AlV0 values of ca. 90–92% (Table S3), and Ald420 = 89% (calculated on the basis of inter-planar spacing d420 = 2.654 Å in the cubic Ia‾3d s.g.), it was shown that the constraints of the Al sofs should be 90%, which was most appropriate for their mutually approximate average values. The results are presented in Table 3 and Tables S4–S6 and Figures S8–S14.
According to a general comparative analysis of the results (Table 2 and Table 3), it can be seen that monoclinic C2/c and triclinic I‾1 s.g.’s are showing a set of very poor reliability factors; this could preliminarily exclude them from the most probable solutions. On the other hand, the resulting reliability factors among the remained five studied s.g.’s are very good and are mutually similar. The only exceptions are the significantly higher Chi2 parameters for all of the s.g.’s studied, which were most likely induced by the preferred chlorite orientation, which is most expressive at the d-value of about 1.58 Å (i.e., 2θ angle of about 58°; see Figures S1–S14). Accordingly, these reliability factors could not be used as the most accurate and decisive parameters for the true space group determination. Accordingly, as shown in our previous studies [5,6], there are additional and more specific criterions which can be of a great value in this case:
(i)
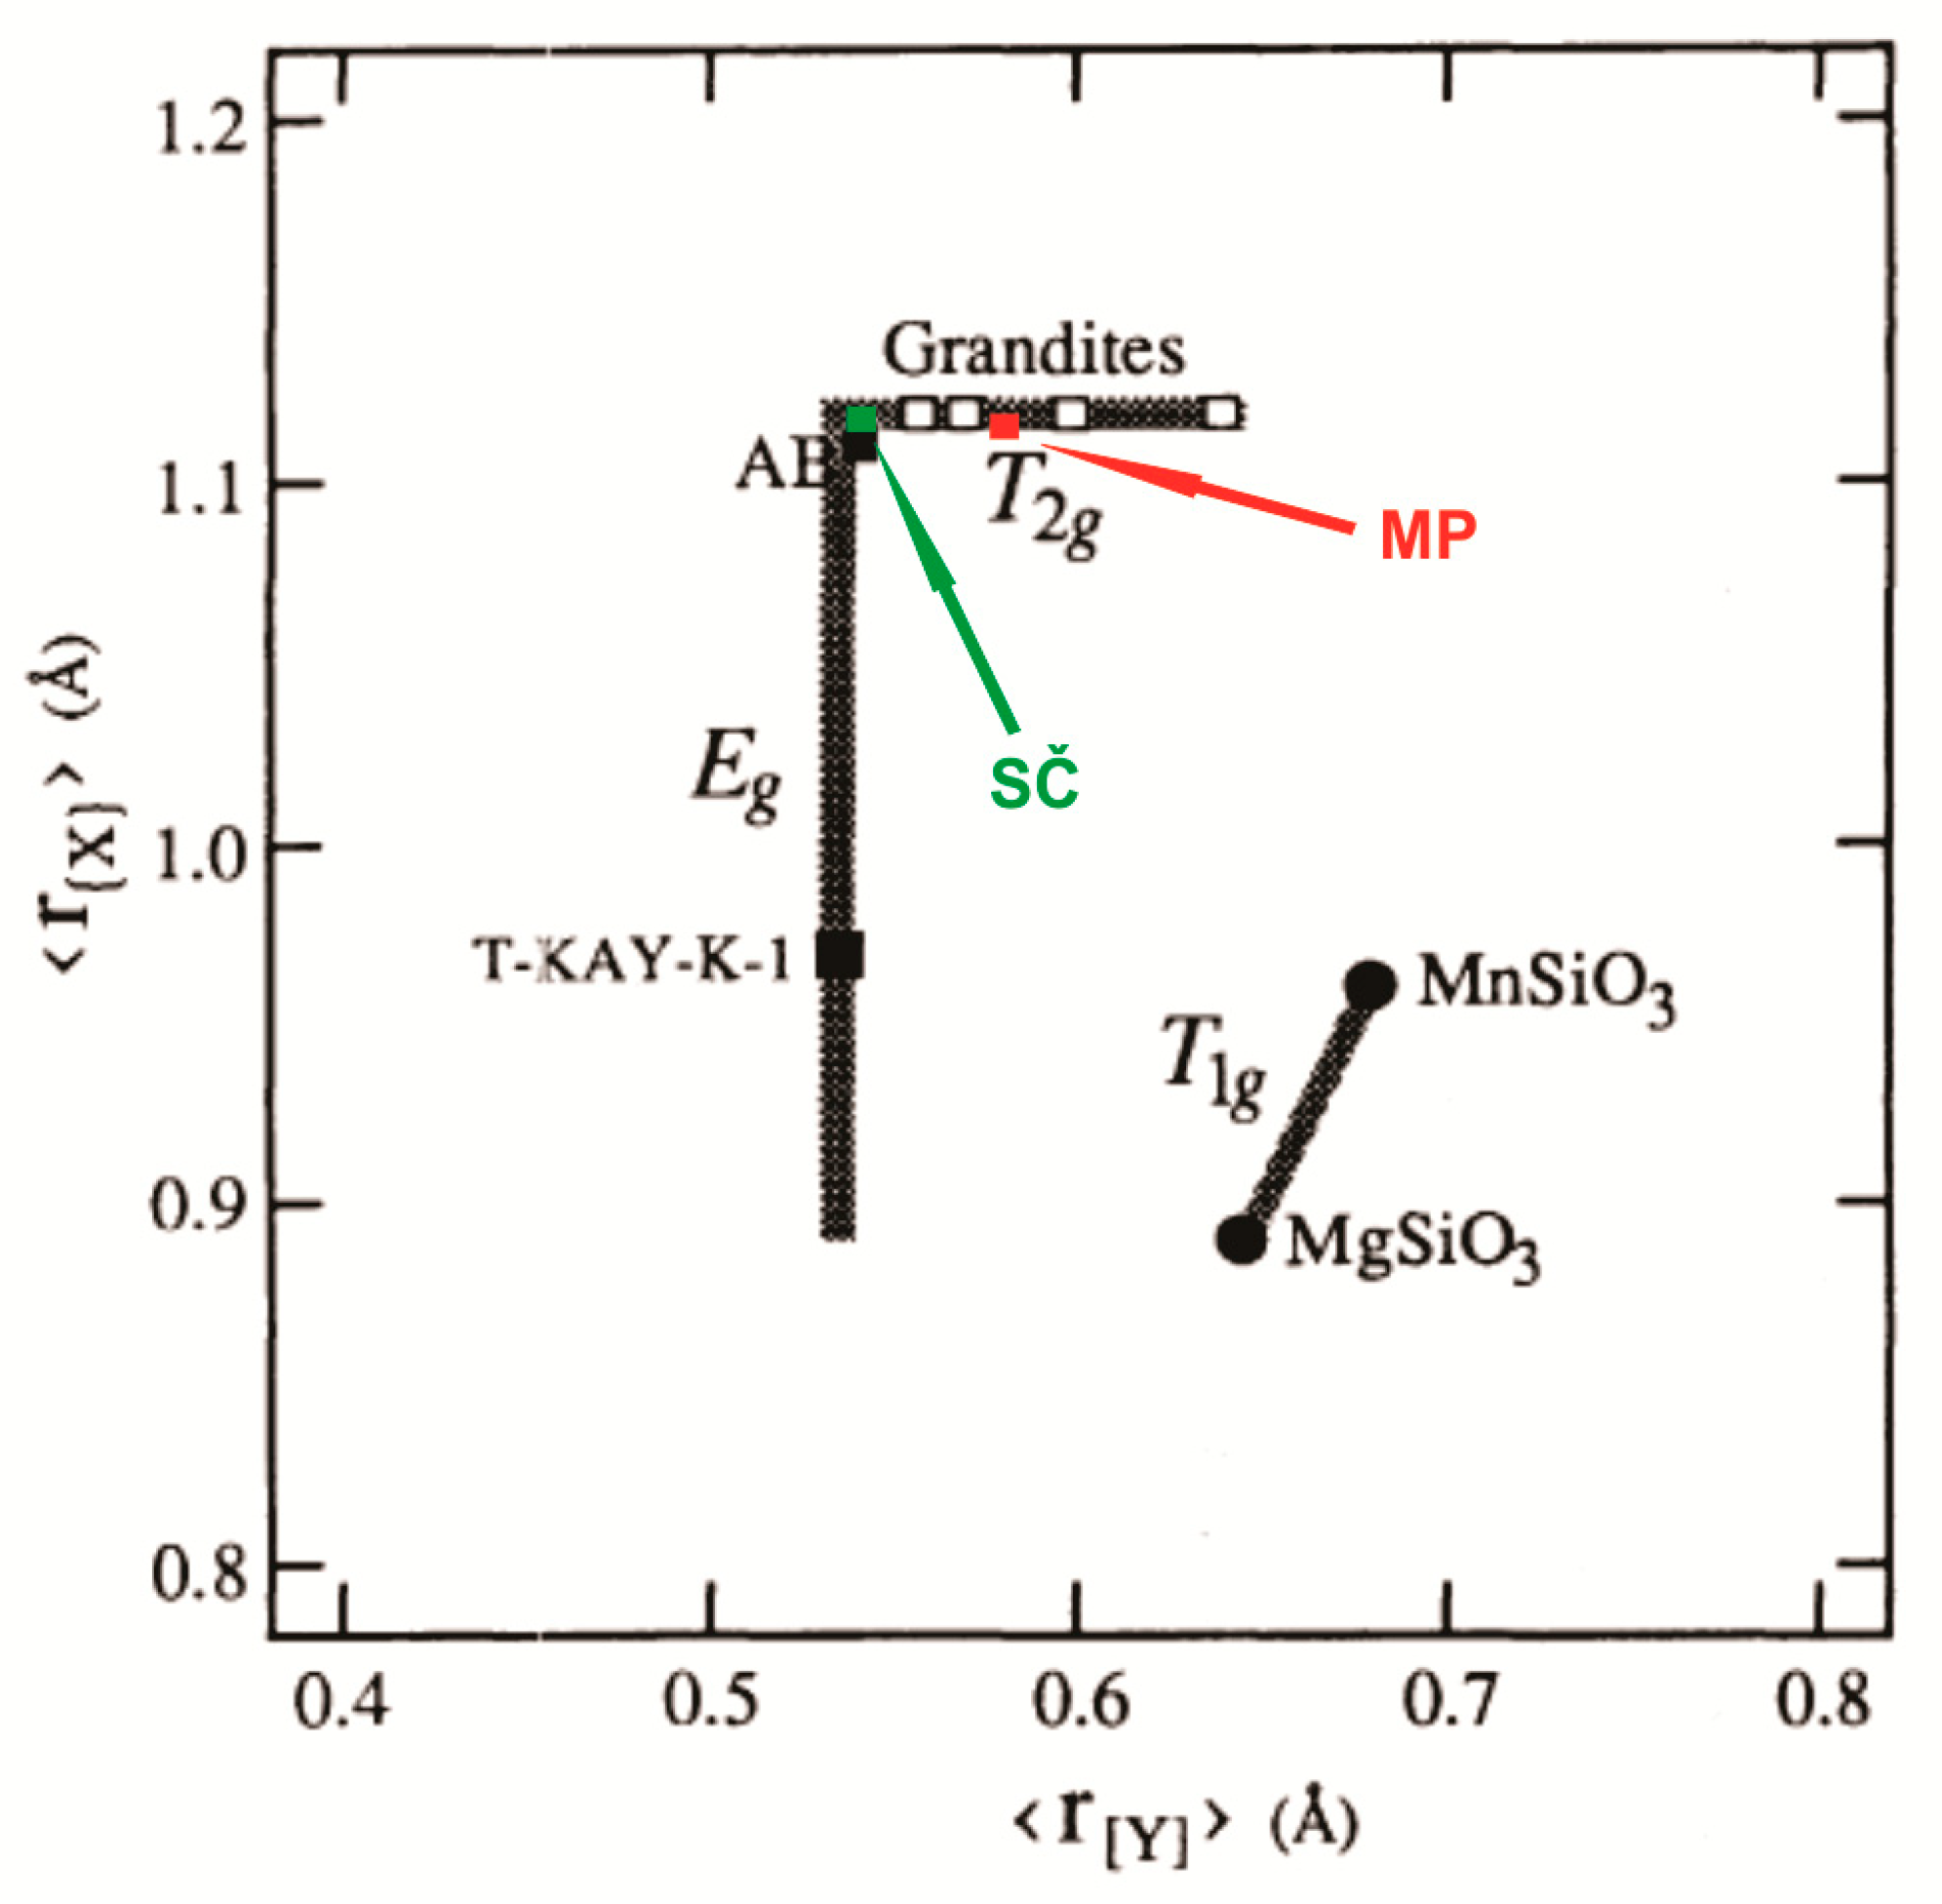
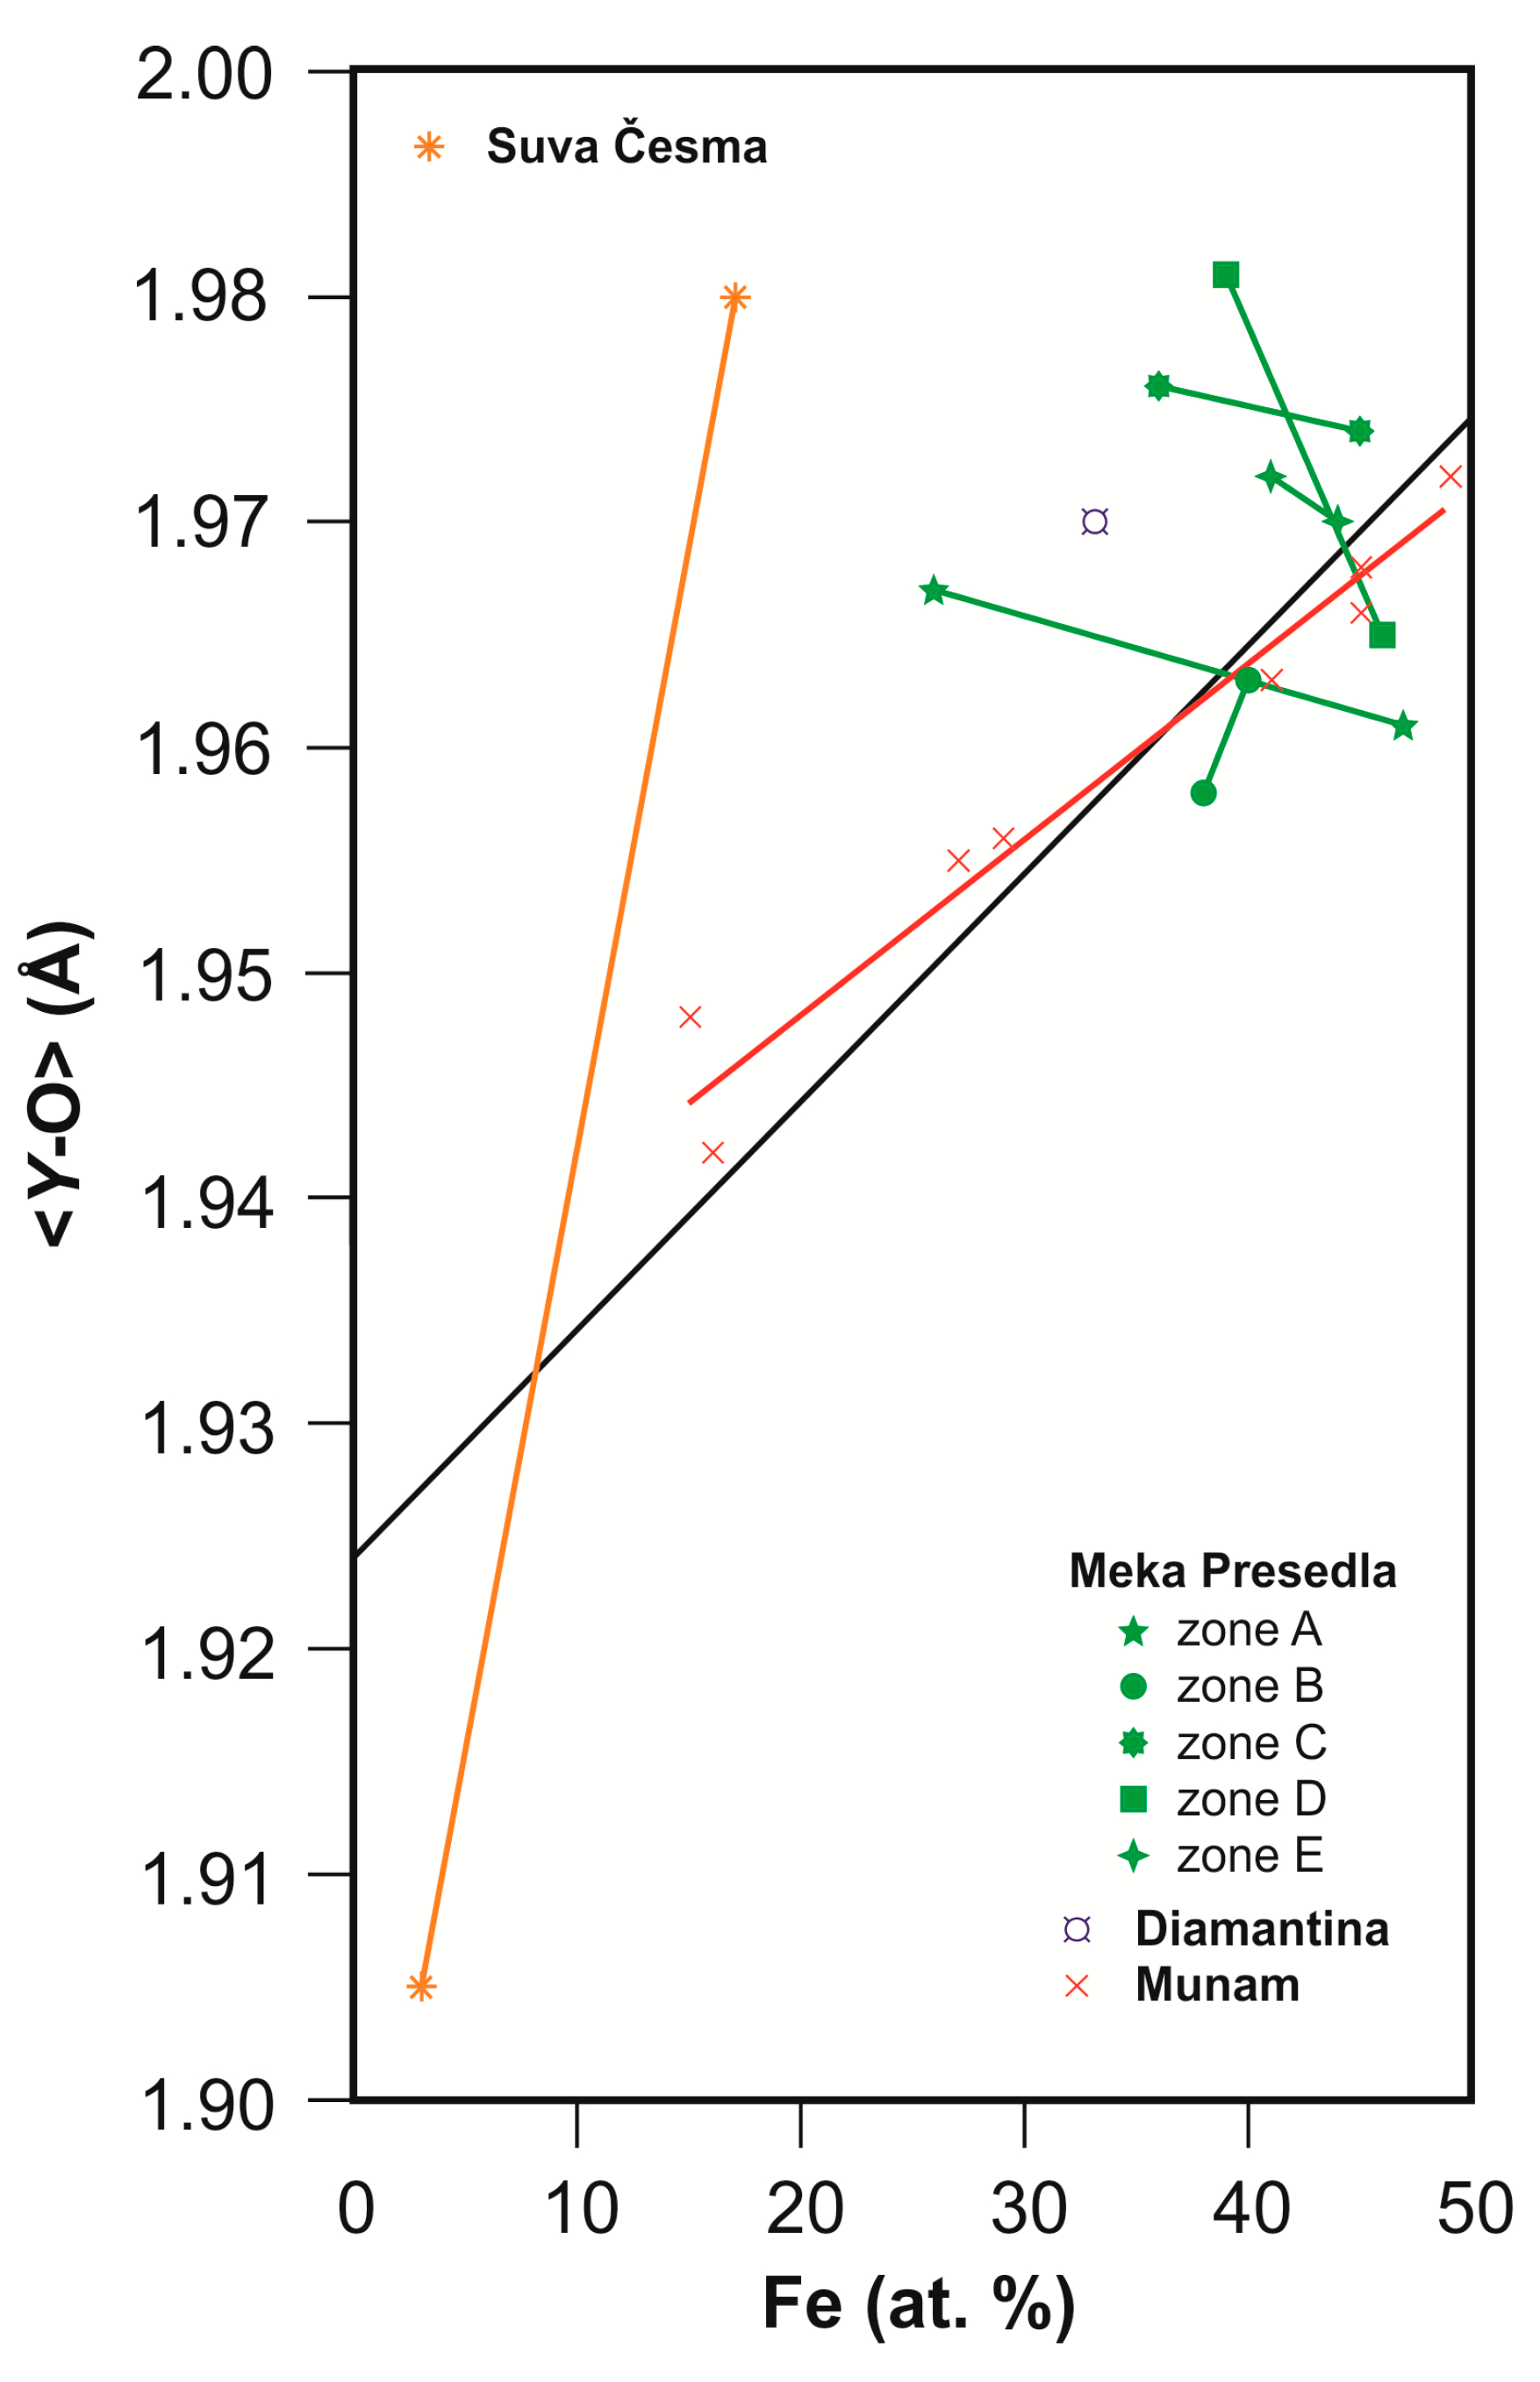
Taking into the account the mean {X} (i.e., Ca2+ and Mn2+), and [Y] cation contents (i.e., Al3+, Fe3+ and Ti4+) from the SEM-EDS analyses (Table 1) and using the data given by [27], the average cation sizes in {X} and [Y] positions were calculated to be <r{x}> = 1.119 Å and <r[y]> = 0.544 Å, respectively. The position of the grossular studied in this paper (SČ; Figure 4), clearly indicates a possibility of the T2g irreducible representation, i.e., the phase transition from the cubic Ia‾3d s.g., to the non-cubic R‾3c, Fddd, C2/c and I‾1 s.g.’s [28];
(ii)
The calculated rhombohedral distortion angles (α) depart significantly (i.e., by more than 0.004°) from 60° (i.e., 0.036o in the R‾3c s.g. and from 0.036° to 0.044° in the R‾3 s.g.; Tables S2 and S5), which clearly reveals the violation of the cubic symmetry [29]. Furthermore, β0 angles were determined to be 90.45(2)° in the triclinic I‾1 s.g. (Tables S2 and S5), allowing us to decisively conclude that the studied grandite is not cubic, and to assume that, actually, a structural disymmetrization occurred;
(iii)
Because there were no significant differences between Al sofs and their corresponding Y–O distances over the octahedral Y sites (Table S3), the R‾3 (required conditions are four different sofs and Y–O distances), C2/c (required conditions are four different sofs and Y–O distances) and I‾1 (required conditions are eight different sofs and Y–O distances) s.g.’s should also be definitively excluded as viable possibilities. Therefore, only the I41/a, R‾3c and Fddd s.g.’s remained as plausible possibilities;
(iv)
Among the later three remained solutions, the Fddd s.g. shows a greatest different sofs of ΔAl = 22(11) %, whereas I41/a and R‾3c s.g.’s show sofs that are equal to their esds (ΔAl = 1(1) % and ΔAl = 12(12) %, respectively). On the other hand, the resulting ΔY‘s for the I41/a, R‾3c, and Fddd s.g.’s are 0.06(3) Å, 0.12(2) Å and 0.08(7) Å, respectively (Table S3). Furthermore, there is a somewhat different situation with the applied constraints (Table S6). Namely, I41/a, R‾3c, and Fddd s.g.’s show ΔAl’s of 4(6) %, 22(3) %, and 14(13) %, respectively; and ΔY‘s of 0.054(6) Å, 0.060(6) Å, and 0.075(6) Å, respectively. According to the aforementioned resulting data, there is still a considerable lack of sufficiently clear evidence and reliability of the parameters for the true space group of crystallization within these three possible solutions;
(v)
For the Fddd, C2/c, and I‾1 s.g.’s, all of the three crystallographic unit cell parameters are more or less different relative to each other, which is a required condition for these space groups (Tables S2 and S5). This fact allows us to finally exclude the I41/a and R‾3c s.g.’s as options, as well, because for the aforementioned space groups, the required conditions are that the a0 and b0 axes must be equal and different from the c0 axis.
Therefore, previous results and discussion are sufficient to conclude that the studied grossular crystallized in the orthorhombic Fddd space group. Such characteristics align this sample further into a group that includes only a few orthorhombic garnets within the grossular-andradite solid-solution series, and the first occurrence of such a garnet in Serbia. The five previously studied orthorhombic specimens were extracted from Moravia (Czechoslovakia) and Kamaishi (Japan) [9], Hortsavinya (Spain) [15], Bazhenovskoe (Russia) [12], and Eden Mills (USA) [16]. There is also one birefringent uvarovite from Saranov (Russia) that belongs to the same orthorhombic Fddd space group [30]. Among these, the studied grossular has the highest content of the Grs component, and its properties are presented in more detail in Table 4, Tables S7 and S8, and Figure 5 and Figure 6.
Table S3 shows that the calculated Al sofs in most of the studied space groups are more or less inconsistent with the ones expected from the chemical composition (Table 1); more specifically, the sofs values are significantly higher. On the other hand, Al<a0> and AlV0 values, which were calculated from the unit-cell dimensions (Table S3), are mostly in a very good agreement (except for the C2/c and I‾1 s.g.’s), showing ca. 90–92%. A similar situation was already noticed in our previous study [5,6], providing an explanation that this could interpreted as a consequence of polyhedral distortions and/or crystal disordering because the resulting <D–O> distances are within the expected distance of 2.097 Å (see Table 1, Tables S3, S6 and S7).
Taking into the account the distances and angles characterized without constraints (Tables S7 and S8), the results show that the grossular studied is more or less disordered and that polyhedral distortions have occurred. Namely, although they are within the esds, the distances <Si–O> and <O–O>tet are somewhat shorter, whereas <Y–O>, <O–O>oct, <Ca–O>, and <O–O>dod are a bit longer than expected. On the other hand, the angles <O–Si–O> and <O–Y–O> are within the expected values, whereas the <O–Ca–O> angle is somewhat larger.
From the shorter <Si–O> and <O–O>tet distances (Tables S3 and S7), it can be further presumed that, in the tetrahedral coordination other than silicon, a minor content (ca. 1%) of vacancies (□) could be present instead of aluminum (which could be therefore transferred into the octahedral site). It could be also speculated that, in the octahedral site, some small part of the Fe3+ could be replaced by Fe2+ with larger cation size [27], contributing to the aforementioned Al<a0> and AlV0, whereas the dodecahedral site is fully occupied with Ca2+. In that case, the average chemical composition of the studied garnet could be presented as Ca3.00(Al1.85Fe0.15Ti0.02)2.02(Si2.970.03)3.00O12 and Grs92Adr07; which is almost identical to that previously obtained with the SEM-EDS analyses (Table 1).
Furthermore, by taking into the account determined distances without any constraints between the various Si, Y, and Ca cation sites (Table S8), the most expressive distortions are within the following: (i) considerably shorter Y(2)–Si(1), Ca(2)–Si(1), and <Ca(3)–Ca(3)> distances and (ii) considerably longer <Si(1)–Si(2)>, Y(1)–Si(1), Ca(1)–Si(1), Ca(2)–Si(2), and Ca(1)–Ca(3) distances. Hence, among the studied cations within the crystal structure (Figure 5), the Si(1), Si(2), and Ca(3) cations are more or less displaced from the expected positions for the cubic Ia‾3d s.g. [19], which additionally corroborates the lower symmetry. Namely, the Si(1) cation is displaced away from the Si(2), Y(1), and Ca(1) cations and towards the Y(2) and Ca(2) cations because Y(1), Y(2), Ca(1) and Ca(2) cations are in special positions with fixed coordinates (Table 4). Similarly, the Si(2) cation is displaced away from the Ca(2); whereas the Ca(3) cation is displaced away from the Ca(1), leaning towards the other Ca(3) cation.
Because there are a considerable number of distances which also deviate from the expected positions for the cubic Ia‾3d s.g. [19] after applied constraints (Tables S7 and S8), the resulting orthorhombic Fddd s.g. should be considered as disordered.
A comparison of the Al3+–Fe3+ variations over the octahedral sites by the octahedral average <Y–O> distances for the grossular garnets from Suva Česma (orthorhombic Fddd s.g.; this paper), Meka Presedla (rhombohedral R‾3c s.g.; [6]), Diamantina (cubic Ia‾3d s.g.; [32]), and Munam (triclinic I‾1 s.g.; [9]) localities is presented in Figure 6.
Considering the formation conditions of the studied grossular, it should be taken into account that the results show the transformation from the triclinic to the orthorhombic crystal structure occurring in the range of 150–350 °C [33]. On the other hand, the upper temperature limit could almost certainly be under ca. 600 °C, i.e., below the area of the rhombohedral R‾3c s.g. [4,5,6] that has a higher symmetry.
Finally, the results show that the quantitative content is 89(8) % of grossular and 11(2) % of chlorite (Table S2), which is in good agreement with the previous macroscopic and microscopic estimations [2]. Triclinic chlorite has the following unit cell dimensions: a0 = 5.328(3) Å, b0 = 9.290(6) Å, c0 = 14.286(4) Å, α0 = 90.95(5) o, β0 = 97.08(5) o, γ0 = 89.62(5) o, and V0 = 701.6(6) Å3. Unfortunately, there are limited opportunities for additional research regarding the presence of chlorite in this quantity in a mixture with grossular; the XRPD patterns analysis [5,6] would be possible, mainly because of their mutually extensive overlap of their diffraction peaks (see Figures S1–S14). Namely, a close inspection of the presence and nature of the grossular reflections could be useful for checking the: (1) possible doublets and extra-broadening and (2) possible mixture of two garnet phases with the cubic Ia‾3d space groups.

4. Conclusions

The grossular garnet from rodingite rock from the Suva Česma locality (western Serbia) is characterized with its weak anisotropic nature and Grs91Adr08 composition. The results further show that grossular garnet crystallized in the disordered Fddd space group, which aligned this sample further with a group of rare orthorhombic garnets within the grossular-andradite-uvarovite solid-solution series on the global scale; this sample was the first occurrence in Serbia. The results outline the temperature framework, ranging from 150 to ~600 °C.

Supplementary Materials

The following supporting information can be downloaded at: https://www.mdpi.com/article/10.3390/powders2020023/s1, Table S1. Profile parameters for the studied space groups without constraints.; Table S2. Unit cell dimensions and quantitative contents of garnet and chlorite for the studied space groups without constraints. Calculated 4 × c0/a0 parameters and distortion angles (α) for the rhombohedral R‾3c and R‾3 s.g.’s, and specific geometry–mathematical transformations [5,6] of the crystallographic axes within Ia‾3d, R‾3c, R‾3, Fddd, C2/c, and I‾1 s.g.’s are also presented.; Table S3. Calculated Al sofs (in %) and selected Si-O, Y-O, and Ca-O distances (in Å) for the studied space groups without constraints.; Table S4. Profile parameters for the studied space groups with constraints.; Table S5. Unit cell dimensions and quantitative contents of garnet and chlorite for the studied space groups with constraints. Calculated 4 × c0/a0 parameters and distortion angles (α) for the rhombohedral R‾3c and R‾3 s.g.’s, and specific geometry–mathematical transformations [5,6] of the crystallographic axes within Ia‾3d, R‾3c, R‾3, Fddd, C2/c, and I‾1 s.g.’s, are also presented.; Table S6. Calculated Al sofs (in %) and selected Si–O, Y–O, and Ca–O distances (in Å) for the studied space groups with constraints.; Table S7. Selected distances (in Å) and angles (in °) for the orthorhombic Fddd space group (withouta and withb constraints).; Table S8. Selected distances among the studied cation sites (in Å) for the orthorhombic Fddd space group (withouta and withb constraints).; Figure S1. Final Rietveld plot for the Ia‾3d space group without constraints. Observed intensities (Yobs) were presented with red color, calculated intensities (Ycalc) were presented with black color, and differences between observed and calculated intensities (Yobs-Ycalc) were presented with blue color. Reflection (Bragg) positions were presented with green vertical bars; upper row: garnet; lower row: chlorite.; Figure S2. Final Rietveld plot for the R‾3c space group without constraints. Observed intensities (Yobs) were presented with red color, calculated intensities (Ycalc) were presented with black color, and differences between observed and calculated intensities (Yobs-Ycalc) were presented with blue color. Reflection (Bragg) positions were presented with green vertical bars: upper row: garnet; lower row: chlorite; Figure S3. Final Rietveld plot for the Fddd space group without constraints. Observed intensities (Yobs) were presented with red color, calculated intensities (Ycalc) were presented with black color, and differences between observed and calculated intensities (Yobs-Ycalc) were presented with blue color. Reflection (Bragg) positions were presented with green vertical bars; upper row-garnet; lower row-chlorite; Figure S4. Final Rietveld plot for the C2/c space group without constraints. Observed intensities (Yobs) were presented with red color, calculated intensities (Ycalc) were presented with black color, and differences between observed and calculated intensities (Yobs-Ycalc) were presented with blue color. Reflection (Bragg) positions were presented with green vertical bars; upper row: garnet; lower row: chlorite; Figure S5. Final Rietveld plot for the I‾1 space group without constraints. Observed intensities (Yobs) were presented with red color, calculated intensities (Ycalc) were presented with black color, and differences between observed and calculated intensities (Yobs-Ycalc) were presented with blue color. Reflection (Bragg) positions were presented with green vertical bars; upper row: garnet; lower row: chlorite; Figure S6. Final Rietveld plot for the R‾3 space group without constraints. Observed intensities (Yobs) were presented with red color, calculated intensities (Ycalc) were presented with black color, and differences between observed and calculated intensities (Yobs-Ycalc) were presented with blue color. Reflection (Bragg) positions were presented with green vertical bars; upper row: garnet; lower row: chlorite; Figure S7. Final Rietveld plot for the I41/a space group without constraints. Observed intensities (Yobs) were presented with red color, calculated intensities (Ycalc) were presented with black color, and differences between observed and calculated intensities (Yobs-Ycalc) were presented with blue color. Reflection (Bragg) positions were presented with green vertical bars; upper row: garnet; lower row: chlorite; Figure S8. Final Rietveld plot for the Ia‾3d space group with constraints. Observed intensities (Yobs) were presented with red color, calculated intensities (Ycalc) were presented with black color, and differences between observed and calculated intensities (Yobs-Ycalc) were presented with blue color. Reflection (Bragg) positions were presented with green vertical bars; upper row: garnet; lower row: chlorite; Figure S9. Final Rietveld plot for the R‾3c space group with constraints. Observed intensities (Yobs) were presented with red color, calculated intensities (Ycalc) were presented with black color, and differences between observed and calculated intensities (Yobs-Ycalc) were presented with blue color. Reflection (Bragg) positions were presented with green vertical bars; upper row: garnet; lower row: chlorite; Figure S10. Final Rietveld plot for the Fddd space group with constraints. Observed intensities (Yobs) were presented with red color, calculated intensities (Ycalc) were presented with black color, and differences between observed and calculated intensities (Yobs-Ycalc) were presented with blue color. Reflection (Bragg) positions were presented with green vertical bars; upper row: garnet; lower row: chlorite; Figure S11. Final Rietveld plot for the C2/c space group with constraints. Observed intensities (Yobs) were presented with red color, calculated intensities (Ycalc) were presented with black color, and differences between observed and calculated intensities (Yobs-Ycalc) were presented with blue color. Reflection (Bragg) positions were presented with green vertical bars; upper row: garnet; lower row: chlorite; Figure S12. Final Rietveld plot for the I‾1 space group with constraints. Observed intensities (Yobs) were presented with red color, calculated intensities (Ycalc) were presented with black color, and differences between observed and calculated intensities (Yobs-Ycalc) were presented with blue color. Reflection (Bragg) positions were presented with green vertical bars; upper row: garnet; lower row: chlorite; Figure S13. Final Rietveld plot for the R‾3 space group with constraints. Observed intensities (Yobs) were presented with red color, calculated intensities (Ycalc) were presented with black color, and differences between observed and calculated intensities (Yobs-Ycalc) were presented with blue color. Reflection (Bragg) positions were presented with green vertical bars; upper row: garnet; lower row: chlorite; Figure S14. Final Rietveld plot for the I41/a space group with constraints. Observed intensities (Yobs) were presented with red color, calculated intensities (Ycalc) were presented with black color, and differences between observed and calculated intensities (Yobs-Ycalc) were presented with blue color. Reflection (Bragg) positions were presented with green vertical bars; upper row: garnet; lower row: chlorite.

Author Contributions

P.T.: Conceptualization, writing—original draft preparation, supervision, XRPD and Rietveld experiments, methodology, validation, investigation and visualization. S.D.: microscopic investigation and writing—review and editing. S.E.: SEM-EDS experiments, and writing—review and editing. All authors discussed the manuscript. All authors have read and agreed to the published version of the manuscript.

Funding

This work was financially supported by the Ministry of Science, Technological Development and Innovation of the Republic of Serbia (Grant No. 451-03-47/2023-01/200026).

Institutional Review Board Statement

Not applicable.

Informed Consent Statement

Not applicable.

Data Availability Statement

Not applicable.

Acknowledgments

Authors are grateful to Darko Spahić for his useful advices and to Aleksandar Pačevski for his technical assistance.

Conflicts of Interest

The authors declare no conflict of interest.

References

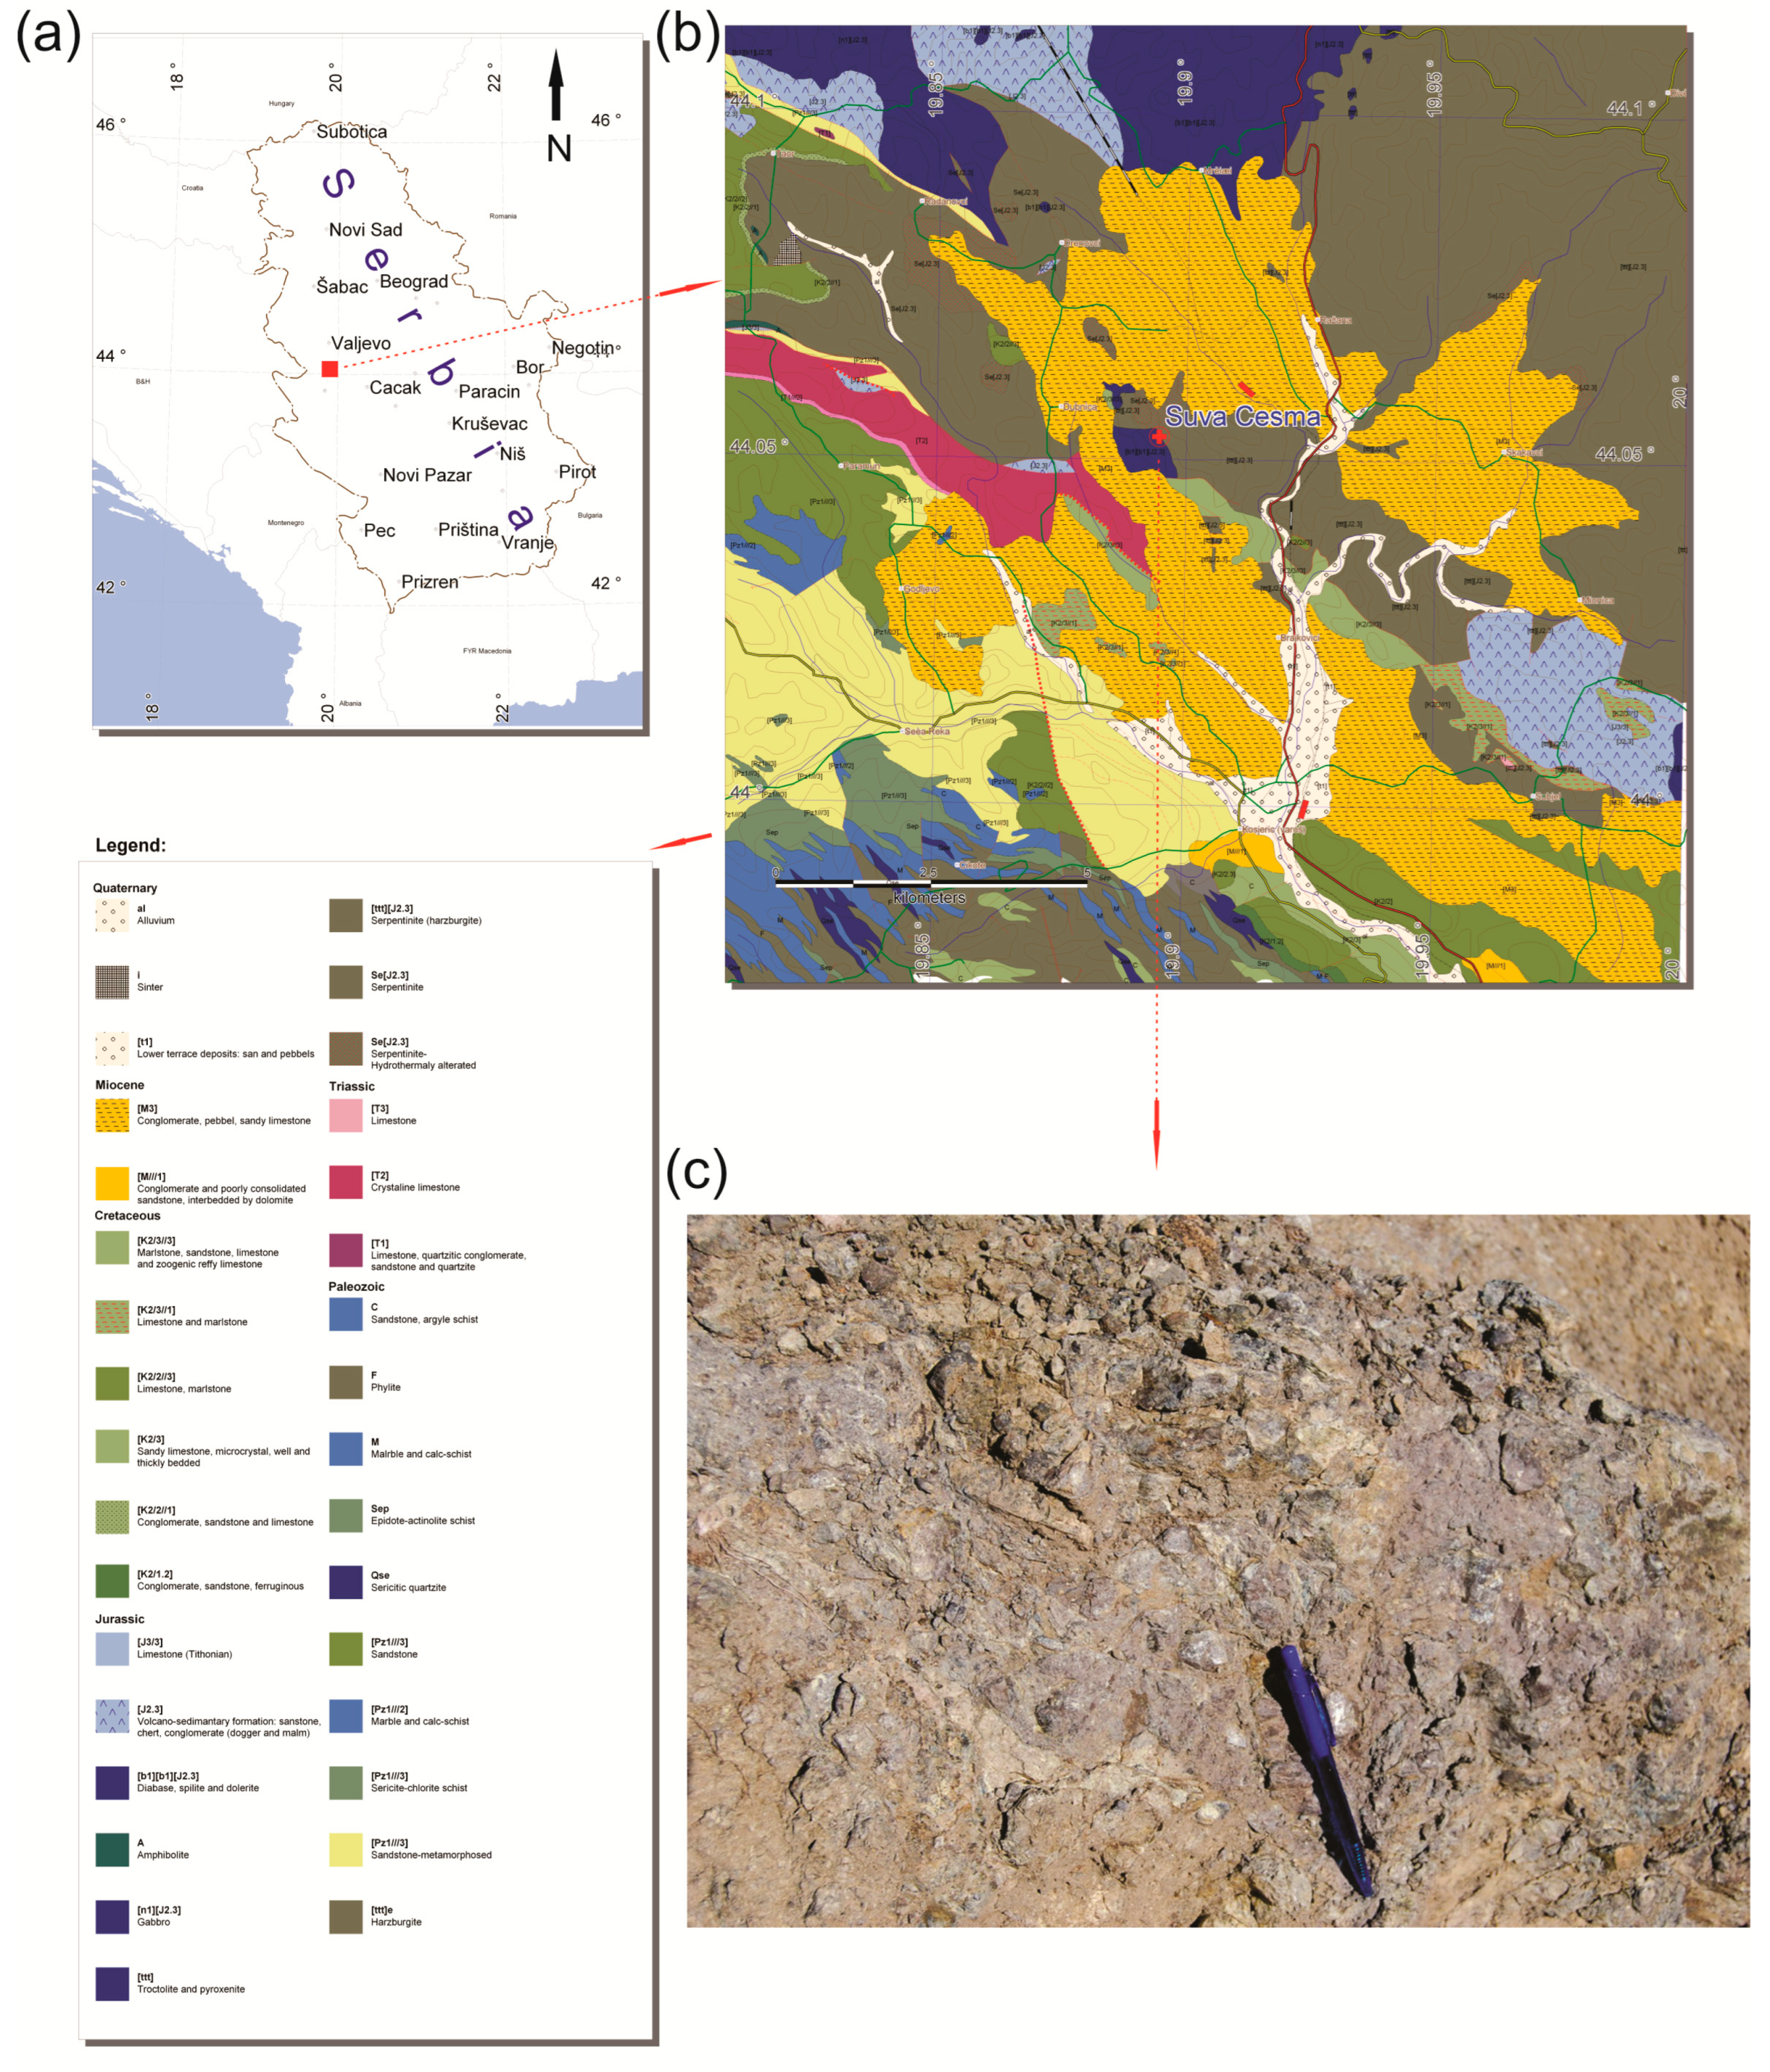
  1. Baranin, D. Basic Geological Map of Serbia, sheet Valjevo 4, scale 1:50,000. Geol. Surv. Serb. 2009, unpublished. [Google Scholar]
  2. Dušanić, S.; Tančić, P.; Popović, D. First occurrence of rodingite in Central Serbia. In Proceedings of the XIX Congress of the Carpathian-Balkan Geological Association, Thessaloniki, Greece, 23–26th September 2010; Volume 39, p. 106. Available online: https://www.geologica-balcanica.eu/journal/39/1-2/p-106 (accessed on 3 May 2023.).
  3. Warr, L.N. IMA–CNMNC approved mineral symbols. Min. Mag. 2021, 85, 291–320. [Google Scholar] [CrossRef]
  4. Tančić, P.; Vulić, P.; Kaindl, R.; Sartory, B.; Dimitrijević, R. Macroscopically-zoned grandite from the garnetite skarn of Meka Presedla (Kopaonik Mountain, Serbia). Acta Geol. Sin. 2012, 86, 393–406. [Google Scholar] [CrossRef]
  5. Tančić, P.; Kremenović, A.; Vulić, P. Structural dissymmetrization of optically anisotropic Grs64±1Adr36±1Sps2 grandite from Meka Presedla (Kopaonik Mt., Serbia). Powd. Diffr. 2020, 35, 7–16. [Google Scholar] [CrossRef]
  6. Tančić, P.; Kremenović, A. Rietveld crystal structure refinement of a natural rhombohedral grossular-andradite garnet from Serbia. Geol. Q. 2022, 66, 1639. [Google Scholar] [CrossRef]
  7. Srećković-Batočanin, D.; Vasković, N.; Milutinović, S.; Ilić, V.; Nikić, Z. Composition of zonal garnets from the garnetite exo-skarn of the ore field Rogozna (Rogozna Mts, southern Serbia). In Proceedings of the XVI Serbian Geological Congress, Donji Milanovac, Serbia, 22–25th May 2014; pp. 265–268. [Google Scholar]
  8. Kostić, B.; Srećković-Batočanin, D.; Filipov, P.; Tančić, P.; Sokol, K. Anisotropic grossular-andradite garnets: Evidence of two stage skarn evolution from Rudnik, Central Serbia. Geol. Carp. 2021, 73, 17–25. [Google Scholar] [CrossRef]
  9. Takéuchi, Y.; Haga, N.; Umizu, S.; Sato, G. The derivative structure of silicate garnets in grandite. Z. Krist. 1982, 158, 53–99. [Google Scholar] [CrossRef]
  10. Allen, F.M.; Buseck, P.R. XRD, FTIR and TEM studies of optically anisotropic grossular garnets. Am. Miner. 1988, 73, 568–584. [Google Scholar]
  11. Kingma, K.J.; Downs, J.W. Crystal-structure analysis of a birefringent andradite. Am. Miner. 1989, 74, 1307–1316. [Google Scholar]
  12. Frank-Kamenetskaya, O.V.; Rozhdestvenskaya, I.V.; Shtukenberg, A.G.; Bannova, I.I.; Skalkina, Y.A. Dissymmetrization of crystal structures of grossular–andradite garnets Ca3(Al, Fe)2(SiO4)3. Struct. Chem. 2007, 18, 493–500. [Google Scholar] [CrossRef]
  13. Kobayashi, S.; Miyawaki, R.; Momma, K.; Fujisawa, A.; Kaneda, H. Anisotropic garnet from the Yamansu ore deposit, Xinjiang, China. J. Miner. Petrol. Sci. 2013, 108, 245–254. [Google Scholar] [CrossRef]
  14. Nakamura, Y.; Kuribayashi, T.; Nagase, T. Cation ordering of {110} and {211} sectors in grandite from Mali. J. Miner. Petrol. Sci. 2016, 108, 245–254. [Google Scholar] [CrossRef]
  15. Gali, S. Reduction of symmetry in grandite solid solution. Acta Geol. Hisp. 1984, 19, 287–293. [Google Scholar]
  16. Badar, M.A.; Hussain, S.; Niaz, S.; ur Rehman, S. Anomalous optical variations in the grossular garnet from the Eden Mills, Belvidere Mountain (Vermont, USA). Arab J. Geosci. 2016, 9, 545. [Google Scholar] [CrossRef]
  17. Hirai, H.; Nakazawa, H. Visualizing low symmetry of a grandite garnet on precession photographs. Am. Miner. 1986, 71, 1210–1213. [Google Scholar]
  18. Panikorovskii, T.L.; Galuskina, I.O.; Bocharov, V.N.; Shilovskikh, V.V.; Galuskin, E.V. Merohedral Mechanism Twining Growth of Natural Cation-Ordered Tetragonal Grossular. Crystals 2022, 12, 1638. [Google Scholar] [CrossRef]
  19. Novak, G.A.; Gibbs, G.V. The crystal chemistry of the silicate garnets. Am. Miner. 1971, 56, 791–825. [Google Scholar]
  20. Droop, G.T.R. A general equation for estimating Fe3+ concentrations in ferromagnesian silicates and oxides from microprobe analyses, using stoichiometric criteria. Min. Mag. 1987, 51, 431–435. [Google Scholar] [CrossRef]
  21. Rodriguez-Carvajal, J. Program Fullprof (Computer software). In Proceedings of the Abstract of 15th Conference of International Union of Crystallography, Satellite Meeting on Powder Diffraction, Toulouse, France, 16–19 July 1990; p. 127. [Google Scholar]
  22. Grew, E.S.; Locock, A.J.; Mills, S.J.; Galuskina, I.O.; Galuskin, E.V.; Hålenius, U. IMA Report, Nomenclature of the garnet supergroup. Am. Miner. 2013, 98, 785–811. [Google Scholar] [CrossRef]
  23. Zanazzi, P.F.; Montagnoli, M.; Nazzareni, S.; Comodi, P. Structural effects of pressure on triclinic chlorite: A single-crystal study. Am. Miner. 2006, 91, 1871–1878. [Google Scholar] [CrossRef]
  24. Tančić, P.; Dimitrijević, R.; Poznanović, M.; Pačevski, A.; Sudar, S. Crystal structure and chemical composition of ludwigite from Vranovac ore deposit (Boranja Mountain, Serbia). Acta Geol. Sin. 2012, 86, 1524–1538. [Google Scholar] [CrossRef]
  25. Cvetković, Ž.; Tančić, P. Mineralogical and crystallographic characteristics of bauxites from some Grebnik’s (Metohija, Serbia) ore deposits. Geol. Anal. Balk. Poluostrva 2019, 80, 45–61. [Google Scholar] [CrossRef]
  26. Berar, J.F.; Lelann, P. ESD’s and estimated probable error obtained in Rietveld refinements with local correlations. J. Appl. Crystallogr. 1991, 24, 1–5. [Google Scholar] [CrossRef]
  27. Shannon, R.D. Revised Effective Ionic Radii and Systematic Studies of Interatomic Distances in Halides and Chalcogenides. Acta Cryst. 1976, A32, 751–767. [Google Scholar] [CrossRef]
  28. Griffen, D.T.; Hatch, D.M.; Phillips, W.R.; Kulaksiz, S. Crystal chemistry and symmetry of a birefringent tetragonal pyralspite75-grandite25 garnet. Am. Miner. 1992, 77, 399–406. [Google Scholar]
  29. Ishizawa, N.; Inagaki, Y. A Guide to Discriminating the Rhombohedral Cell from the Face-Centred Pseudo Cubic Cell, Ceramics Research Center. Annu. Rep. 2008, 8, 35–49. [Google Scholar]
  30. Wildner, M.; Andrut, M. The crystal chemistry of birefringent natural uvarovites: Part II. Single-crystal X-ray structures. Am. Miner. 2001, 86, 1231–1251. [Google Scholar] [CrossRef]
  31. Momma, K.; Izumi, F. VESTA 3 for three-dimensional visualization of crystal, volumetric and morphology data. J. Appl. Crystallogr. 2011, 44, 1272–1276. [Google Scholar] [CrossRef]
  32. Resende, J.A.L.C.; Fernandes, N.G. X-ray powder refinement of a natural garnet from Diamantina, Minas Gerais, Brazil. Acta Cryst. 2005, E61, 265–267. [Google Scholar] [CrossRef]
  33. Shtukenberg, A.G.; Popov, D.Y.; Punin, Y.O. Growth ordering and anomalous birefringence in ugrandite garnets. Min. Mag. 2005, 69, 537–550. [Google Scholar] [CrossRef]
Figure 1. (a) Schematic map of Serbia with the position of the wider studied area of Valjevo (western Serbia; marked with the red square); (b) Geological map of the studied area with legend, and the area where the rodingite was found (site Suva Česma; marked with the red “+” symbol; [1]); (c) Sampling point 5347/2 (coordinates: X = 7411434, Y = 4879346; elevation: 672 m; pencil was used to demonstrate scale; [1]). Photo by Marica Knežević.
Powders 02 00023 g001
Figure 2. Typical mineral appearances of grossular (Grs) and chlorite (Chl) observed by the transmitted light microscopy: (a) parallel nicols; (b) crossed nicols.
Powders 02 00023 g002
Figure 3. Grossular (Grs) and chlorite (Chl) appearances on (a) SEI and (b) BEC microphotographs.
Powders 02 00023 g003
Figure 4. Distribution of the average cation sizes at {X} and [Y] sites of the non-cubic garnets (after [28]; black). Position of the grossular studied in this paper is marked as SČ-Suva Česma (green), whereas position of the rhombohedral (R‾3c s.g.) Grs58–64Adr36–41Sps2 grossular [6] is marked as MP-Meka Presedla (red). Inset was taken and slightly modified from [6].
Powders 02 00023 g004
Figure 5. Crystal structure of the studied grossular in the Fddd space group viewed along the c axis. The SiO4 tetrahedra, YO6 octahedra, and CaO8 dodecahedra are shown with green, yellow, and blue colors, respectively. The oxygen atoms are presented with solid circles and red color. The polyhedral crystal structure was drawn using the VESTA 3 program [31].
Powders 02 00023 g005
Figure 6. Comparison of the Fe3+ and Al3+ variations over the octahedral sites by the octahedral average <Y–O> distances for the grossular garnets from: Suva Česma (orthorhombic Fddd s.g.; orange), Meka Presedla (rhombohedral R‾3c s.g.; green), Diamantina (cubic Ia‾3d s.g.; blue), and Munam (triclinic I‾1 s.g.; red) localities. The linear Grs-Adr join (black; after [19]) was plotted for additional comparison. Inset was taken and modified from [6].
Powders 02 00023 g006
Table 1. Representative chemical analyses of garnet spots (1–5). Their average values are also presented.
wt. %12345Average
SiO239.5339.0639.1139.1039.6039.28
TiO20.000.760.890.000.000.33
Al2O320.6421.1620.8219.8720.7420.65
Cr2O30.000.000.000.000.000.00
FeO2.261.891.973.622.172.38
MnO0.000.360.500.000.000.17
MgO0.000.000.000.000.000.00
CaO37.4736.6636.6237.2437.1337.02
Total99.9099.8999.9199.8399.6499.83
apfu12345average
Si2.9862.9552.9622.9662.9992.974
AlIV0.0140.0450.0380.0340.0010.026
(Z)3.0003.0003.0003.0003.0003.000
AlVI1.8241.8421.8211.7431.8501.816
Fe3+0.1430.1160.1160.2300.1370.148
Ti0.0000.0430.0510.0000.0000.019
[Y]1.9672.0011.9871.9731.9871.983
Mg0.0000.0000.0000.0000.0000.000
Fe2+0.0000.0040.0090.0000.0000.003
Mn0.0000.0230.0320.0000.0000.011
Ca3.0332.9722.9723.0273.0133.003
{X}3.0332.9993.0133.0273.0133.017
wt. % *12345average
Fe2O32.512.042.034.022.412.60
FeO0.000.060.140.000.000.04
mol. %12345average
Prp0.00.00.00.00.00.0
Alm0.00.10.30.00.00.1
Grs92.791.290.388.493.191.1
Adr7.38.08.411.66.98.4
Uv0.00.00.00.00.00.0
Sps0.00.81.10.00.00.4
*-Recalculation of total iron into its tri- and di-valent iron was performed according to [20].
Table 2. Reliability factors for the studied space groups without constraints.
Space GroupIa‾3dR‾3cFdddC2/cI‾1R‾3I41/a
N−P+C6388637263636351636563516364
Rp16.216.216.314.818.716.116.0
Rwp23.223.123.019.924.523.022.8
Rexp8.148.118.118.108.118.108.11
Conventional Rp14.913.814.220.225.114.214.0
Conventional Rwp17.816.016.524.630.416.916.4
Conventional Rexp6.245.645.8210.0210.085.975.84
Chi28.148.118.066.049.118.047.88
Chi2 (Bragg contr.)8.838.688.506.209.418.468.32
DW-stat.0.51540.51990.52390.63510.41930.52640.5430
DW-exp.1.97441.97951.98241.98631.98181.98631.9821
GoF2.82.82.82.43.02.82.8
Grossular RB5.635.015.298.1313.75.084.90
Grossular RF1.931.651.753.877.651.681.65
Chlorite RB6.145.275.719.5918.36.005.59
Chlorite RF1.951.561.684.236.971.791.61
Average RB5.725.065.378.3914.915.225.01
Average RF1.941.641.743.937.471.701.64
Table 3. Reliability factors for the studied space groups with constraints.
Space GroupIa‾3dR‾3cFdddC2/cI‾1R‾3I41/a
N−P+C6389637363646351636963536365
Rp16.716.416.516.319.516.616.2
Rwp23.523.323.422.725.823.523.2
Rexp8.138.128.118.108.118.108.11
Conventional Rp15.114.315.320.927.414.514.8
Conventional Rwp17.816.818.226.433.217.017.9
Conventional Rexp6.165.876.329.4310.425.856.28
Chi28.358.228.327.8310.18.438.15
Chi2 (Bragg contr.)9.068.808.768.0210.58.908.61
DW-stat.0.50410.51150.50480.49840.38050.50050.5215
DW-exp.1.97411.97921.98211.98631.98051.98571.9818
GoF2.92.82.82.83.12.92.8
Grossular RB6.355.546.5610.016.26.395.58
Grossular RF2.231.862.194.049.362.061.89
Chlorite RB5.755.346.449.6420.25.666.10
Chlorite RF1.781.491.953.898.101.671.88
Average RB6.235.506.549.9317.236.275.66
Average RF2.141.792.144.029.041.991.89
Table 4. Atom parameters (in Å) and calculated Al sofs (at. %) for the orthorhombic Fddd space group (without a and with b constraints).
SiteFddd aFddd b
Coord.sofsCoord.sofs
8a $Ca1x0.3750.250
(0) *
0.3750.250
(0)
y0.8750.875
z0.3750.375
8bCa2x0.1250.250
(0)
0.1250.250
(0)
y0.6250.625
z0.1250.125
32hCa3x0.436(2)1.000
(0)
0.4370(4)1.000
(0)
y0.563(5)0.5633(4)
z0.251(4)0.2533(6)
16cAl1x0.2500.57
(6)
0.2500.49
(6)
y0.0000.000
z0.2500.250
Fe1x0.250−0.07
(6)
0.2500.01
(6)
y0.0000.000
z0.2500.250
16dAl2x0.2500.46
(6)
0.2500.41
(6)
y0.5000.500
z0.2500.250
Fe2x0.2500.04
(6)
0.2500.09
(6)
y0.5000.500
z0.2500.250
16gSi1x0.3750.500
(0)
0.3750.500
(0)
y0.8750.875
z0.115(7)0.125(1)
32hSi2x0.319(3)1.000
(0)
0.3203(5)1.000
(0)
y0.689(6)0.6919(6)
z0.242(4)0.2450(9)
32hO1x0.291(6)1.000
(0)
0.2914(7)1.000
(0)
y0.74(1)0.7540(6)
z0.35(1)0.344(1)
32hO2x0.304(7)1.000
(0)
0.3036(6)1.000
(0)
y0.90(1)0.902(1)
z0.21(1)0.2116(9)
32hO3x0.415(5)1.000
(0)
0.4135(7)1.000
(0)
y0.694(9)0.6951(7)
z0.19(1)0.204(1)
32hO4x0.154(7)1.000
(0)
0.151(1)1.000
(0)
y0.554(8)0.5528(6)
z0.30(1)0.2884(9)
32hO5x0.308(7)1.000
(0)
0.3070(7)1.000
(0)
y0.60(1)0.6010(8)
z0.29(1)0.293(1)
32hO6x0.247(7)1.000
(0)
0.2471(6)1.000
(0)
y0.709(8)0.7066(8)
z0.16(6)0.155(1)
Al1114(11)103
(11)
97(13)90
(13)
Al292(11)83(13)
$-Wyckoff positions. *-The numbers in parentheses are the esds multiplied with SCOR [26] and refer to the last significant number.
Disclaimer/Publisher’s Note: The statements, opinions and data contained in all publications are solely those of the individual author(s) and contributor(s) and not of MDPI and/or the editor(s). MDPI and/or the editor(s) disclaim responsibility for any injury to people or property resulting from any ideas, methods, instructions or products referred to in the content.

