Article

Thermal Stability of Iron- and Silicon-Substituted Hydroxyapatite Prepared by Mechanochemical Method

by
Svetlana V. Makarova
1,*,
Natalia V. Bulina
1,
Olga B. Vinokurova
1 and
Arcady V. Ishchenko
2
1
Institute of Solid State Chemistry and Mechanochemistry, Siberian Branch of the Russian Academy of Sciences, Kutateladze Str. 18, 630090 Novosibirsk, Russia
2
G.K. Boreskov Institute of Catalysis, Siberian Branch of Russian Academy of Sciences, Pr. Akad. Lavrentieva 5, 630090 Novosibirsk, Russia
*
Author to whom correspondence should be addressed.
Powders 2023, 2(2), 372-386; https://doi.org/10.3390/powders2020022
Submission received: 2 March 2023 / Revised: 31 March 2023 / Accepted: 10 May 2023 / Published: 11 May 2023
(This article belongs to the Special Issue Particle Technologies)

Abstract

:
In this study, hydroxyapatite with the substitution of calcium cations by iron and phosphate by silicate groups was synthesized via a mechanochemical method. The as-prepared compounds have the general formula Ca10−xFex(PO4)6−x(SiO4)x(OH)2−xOx/2 with x = 0–1.5. The thermal stability of the as-prepared compounds was studied by ex situ annealing of powders in a furnace. It has been established that, at 800 °C for x ≤ 0.5, a partial decomposition of the substituted apatites occurs with the formation of the β–Ca3(PO4)2 phase. At high “x” values, the formation of this phase starts at the lower temperature of 700 °C, followed by the formation of Fe2O3 at 900 °C. The introduction of iron and silicate ions into the hydroxyapatite lattice was shown to decrease its thermal stability.

1. Introduction

Apatites are a promising class of inorganic compounds that can be used to produce new materials. The most studied compound with the apatite structure is currently hydroxyapatite Ca10(PO4)6(OH)2 (HA) with the ratio Ca/P = 1.67 [1]. Any deviation from stoichiometry in the Ca/P ratio leads to the formation of other compounds of calcium phosphates. Thus, a lack of calcium leads to the formation of tricalcium phosphate (TCP) Ca3(PO4)2 with the ratio Ca/P = 1.5 [2,3].
Apatites belong to the class of bioresorbable materials, which actively contribute to the metabolic processes of an organism to reconstitute bone tissue in part or in its entirety. These materials form strong bonds with bone (and soft) tissue after implantation. They are characterized by ion exchange reactions between the bioresorbable implant and body fluids, which leads to the formation of a biologically active carbonated apatite layer on the implant. In general, bioresorbable ceramics have poorer properties than bioinert ceramics, which do not undergo ion exchange and have better mechanical strength. Therefore, bioresorbable materials are most commonly used as bone defect fillers provided in the structures of blocks, porous material, and granules [4]. In addition, apatites are widely used in modern medicine as coatings on metal prostheses, as a medical and cosmetic means [5].
Apatites, in particular HA, are used in reconstructive surgery due to their excellent biological activity, biocompatibility, and osteoconductivity [2,4,6]. In addition, the introduction of various substituent ions with certain properties into the HA structure leads to an improvement in the biomedical properties of HA-based ceramics [7]. It is known that homo- and heterovalent substitutions of calcium cations Ca2+ by Ag+, Zn2+, La3+, Fe3+, etc., and the phosphate group PO43− by SiO44−, CO32−, etc., are possible in the HA structure [8].
It has been established that bone and cartilage tissues bind directly to Si-containing bioceramics, which, due to the presence of Si, have enhanced biological activity. They stimulate collagen type I synthesis, enhance osteoblast differentiation in cell lines, and improve regeneration of damaged bone [9]. In addition, Si-substituted hydroxyapatite plays an important role in the osteointegration of implants, as has been shown in both in vivo and in vitro studies on the biological response to the material [10,11,12]. Camaioni et al. revealed [13] that an increase in silicon content in the HA lattice leads to an increase in bioactivity, thus resulting in faster apatite formation. On the other hand, if the silicon content in the HA lattice is increased above 2 wt%, the destabilization of hydroxyapatite and the formation of α−tricalcium phosphate occur (α−TCP) [14].
Iron is an important trace element in bones and teeth that is essential for various biological processes. Recent studies have shown that the introduction of Fe3+ affects the crystallinity and solubility of HA [15,16,17], whereas low iron concentrations positively affect the biomedical properties of HA [18,19]. It was found that iron-doped HA shows biocompatibility and does not exhibit a cytotoxic effect, and it has enhanced bactericidal and mineralizing properties compared to unsubstituted HA [20]. Iron-containing HA is magnetic; therefore, it may be useful for biological applications, such as magnetic resonance imaging, cell separation, drug delivery, and as a heating mediator in hyperthermia therapy for cancer treatment [21].
The purpose of this study was to explore the possibility of mechanochemical synthesis of HA with the simultaneous substitution of the calcium cations with iron and the phosphate group with silicate, and analysis of the thermal stability of the obtained compounds. To the best of our knowledge, no study has reported the effect of this type of substitution on the thermal stability of HA.

2. Materials and Methods

2.1. Mechanochemical Synthesis

Iron- and silicon-substituted HA (x−FeSi−HA) samples were obtained by mechanochemical synthesis (MS) via the treatment of the reaction mixture in the planetary ball mill AGO−2. The synthesis was carried out in water-cooled steel vials with 0.8 cm steel balls at a rotation speed of 1200 rpm for 40 min. The weight ratio of the reaction mixture to balls was 1:20. To prevent contamination of the product, the vials were lined with a reaction mixture for 0.5 min.
Freshly calcined calcium oxide CaO, calcium hydrophosphate CaHPO4, amorphous silicon dioxide SiO2·0.7H2O, and iron (III) phosphate FePO4·2H2O were used as the initial reagents. The reagents used were of chemical or analytical grade. The reagents were mixed in ratios according to the equations given in Table 1. The samples were prepared assuming that calcium cations and the phosphate groups were simultaneously substituted with iron and silicate, respectively. The concentration of iron and silicon within the sample was equal. The samples were designated as x−FeSi−HA, where x is a substituent concentration (mole of substituent per mole of HA).
The stoichiometric sample β−TCP was prepared by mechanical activation (MA) of the reagent mixture for 5 min according to the following reaction:
2.0 CaHPO 4 + 1.0 CaO   M A   Ca 3 ( PO 4 ) 2 + H 2 O
The as-prepared powder mixture, which was a precursor for the synthesis of β−TCP, was then thermally treated at a temperature of ≥700 °C.

2.2. Ex Situ Annealing

The as-synthesized x−FeSi−HA powders as well as β−TCP precursor were heated in a high-temperature chamber-type electrical furnace (PVK 1.4−8, Russia) at 300, 600, 700, 800, 900, 1000, 1100 °C for 2 h in the air. The powders were annealed in corundum crucibles.

2.3. Sample Characterization

Fourier transform infrared (FTIR) spectra of the powders were recorded on an Infralum FT−801 spectrometer (Simex, Novosibirsk, Russia). The specimens were prepared by the KBr pellet method.
X-ray diffraction (XRD) patterns of the samples were recorded on a D8 Advance powder diffractometer (Bruker, Karlsruhe, Germany) with Bragg−Brentano geometry using CuKα radiation. The X-ray phase analysis of the compounds was carried out using an ICDD PDF−4 database (2011). The unit cell parameters and crystallite size were refined by the Rietveld method using Topas v. 4.2 software (Bruker, Karlsruhe, Germany).
TEM and high-resolution TEM (HRTEM) images were obtained using a Themis-Z 3.1 microscope (TFS, Waltham, MA, USA) at an accelerating voltage of 200 kV. The microscope is equipped with a field emission cathode having a monochromator and with two aberration correctors. Energy-dispersive X-ray (EDX) microanalysis of the elemental composition of the samples was performed on a four-segment Super-X detector (with an energy resolution of ~120 eV) in scanning dark-field mode with the construction of maps of distributions of elements by means of characteristic lines of the spectrum from each point in an analysis region. Samples for the electron microscopic examination were dispersed by ultrasonication and deposited from alcohol on a substrate: copper-perforated grids 3 mm in diameter covered with a thin carbon mesh. The Fourier images were calculated from HRTEM photographs using the Velox v. 2 program (TFS, Waltham, MA, USA).
Simultaneous thermal analysis (STA) included the determination of mass loss, differential scanning calorimetry (DSC), differential thermal analysis (DTA), and the registration of the evolved gas using a mass spectrometer. STA was carried out by means of an STA 449 F1 Jupiter device (Netzsch, Lesb, Germany) equipped with a QMS 403 C Aeolos mass spectrometer. The measurements were performed in a Pt—10 wt%Rh crucible under an argon–oxygen mixture (80:20) at a heating rate of 10 °C/min.

3. Results and Discussion

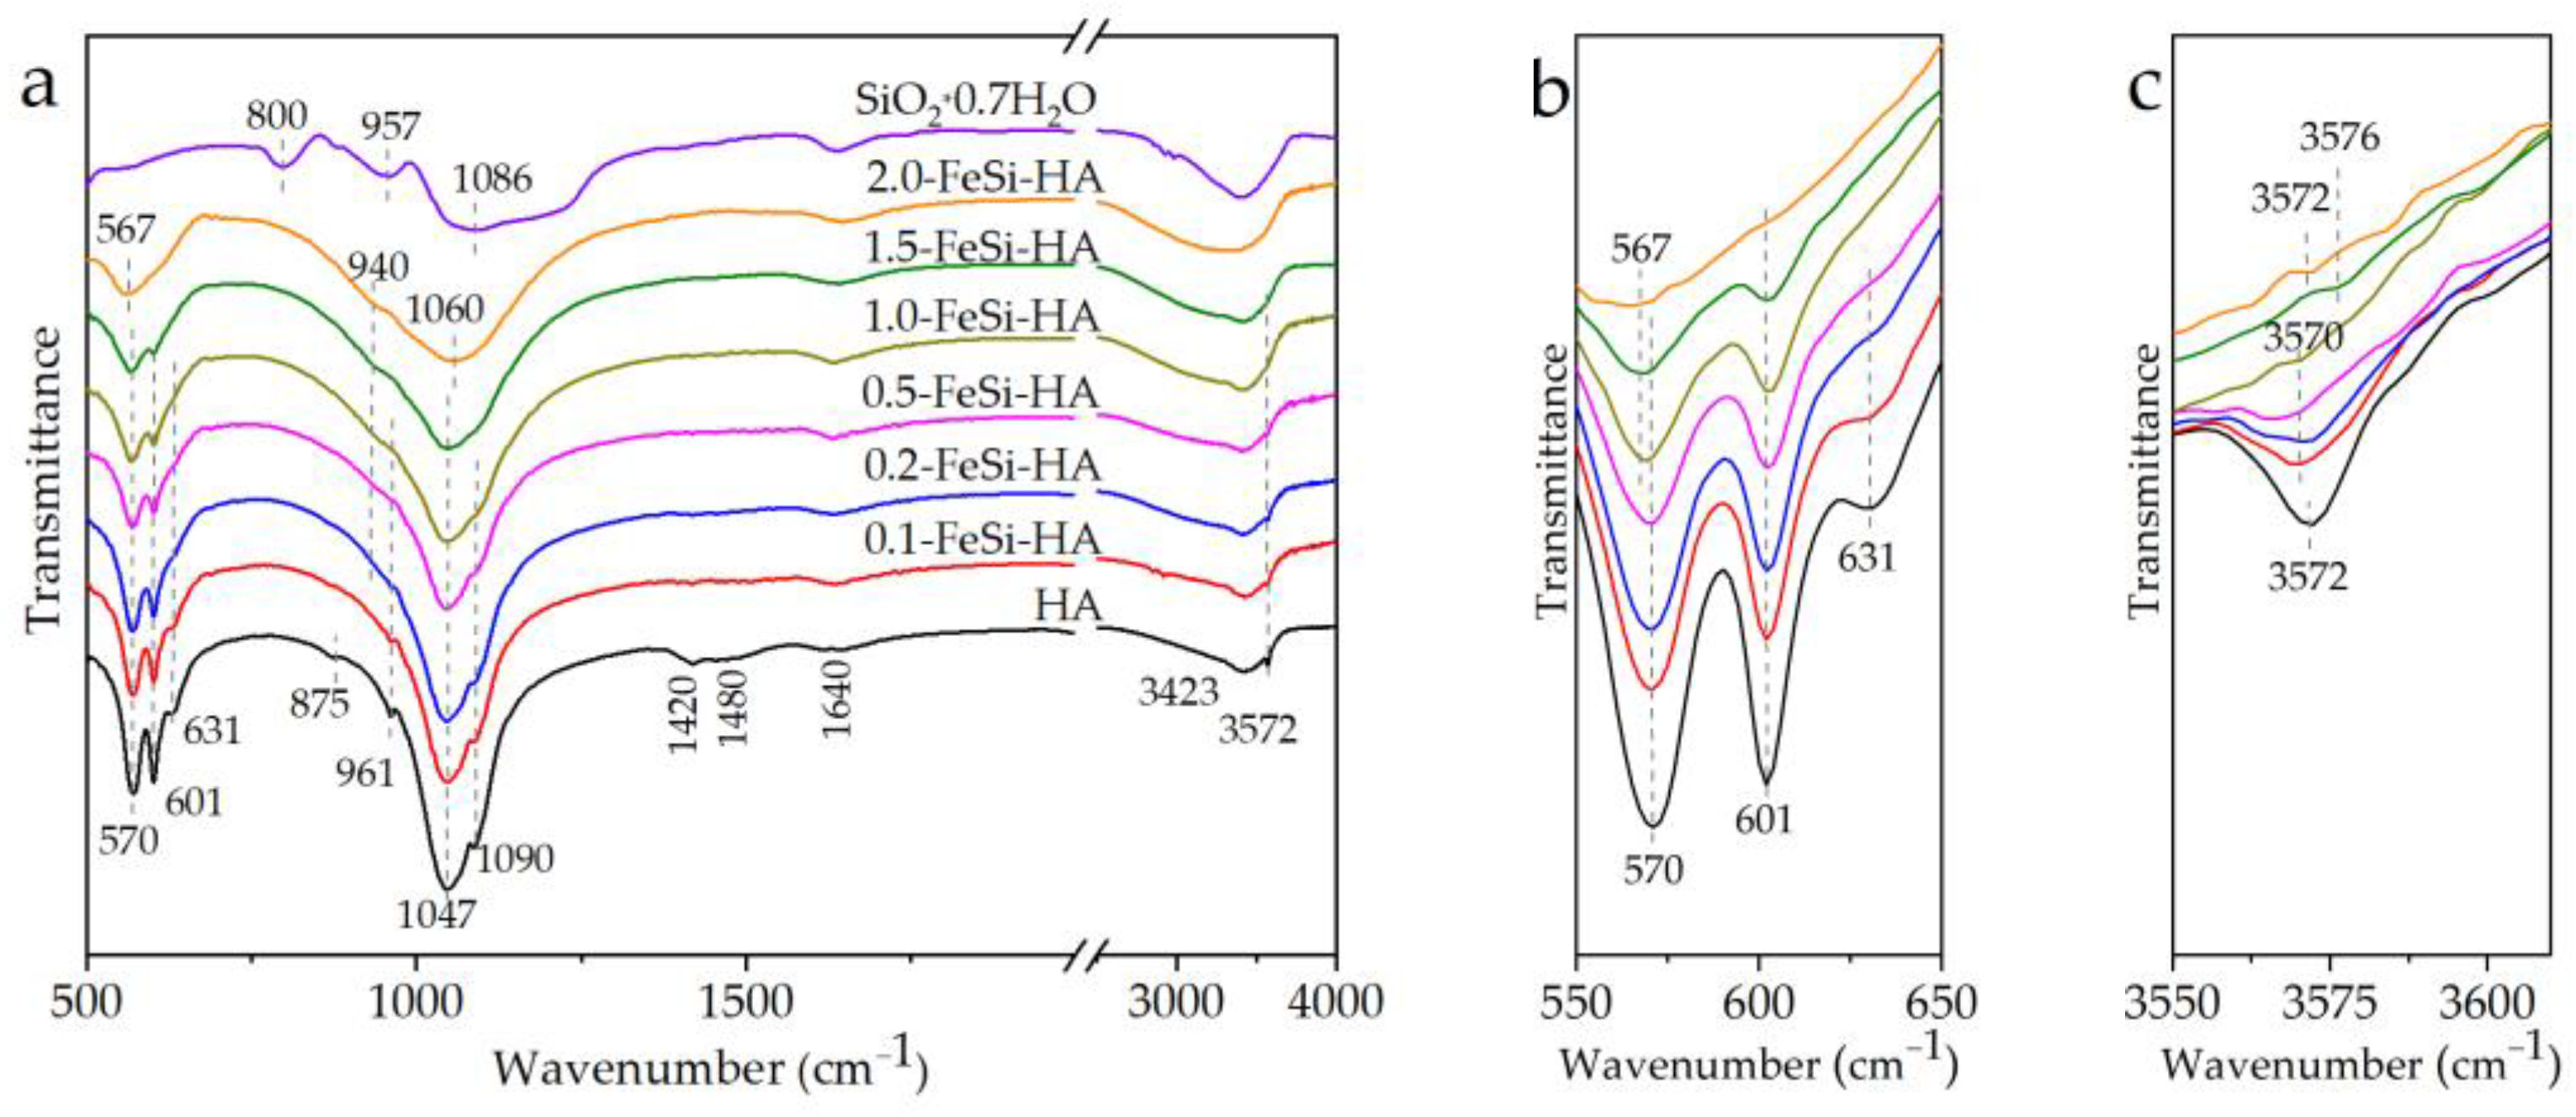
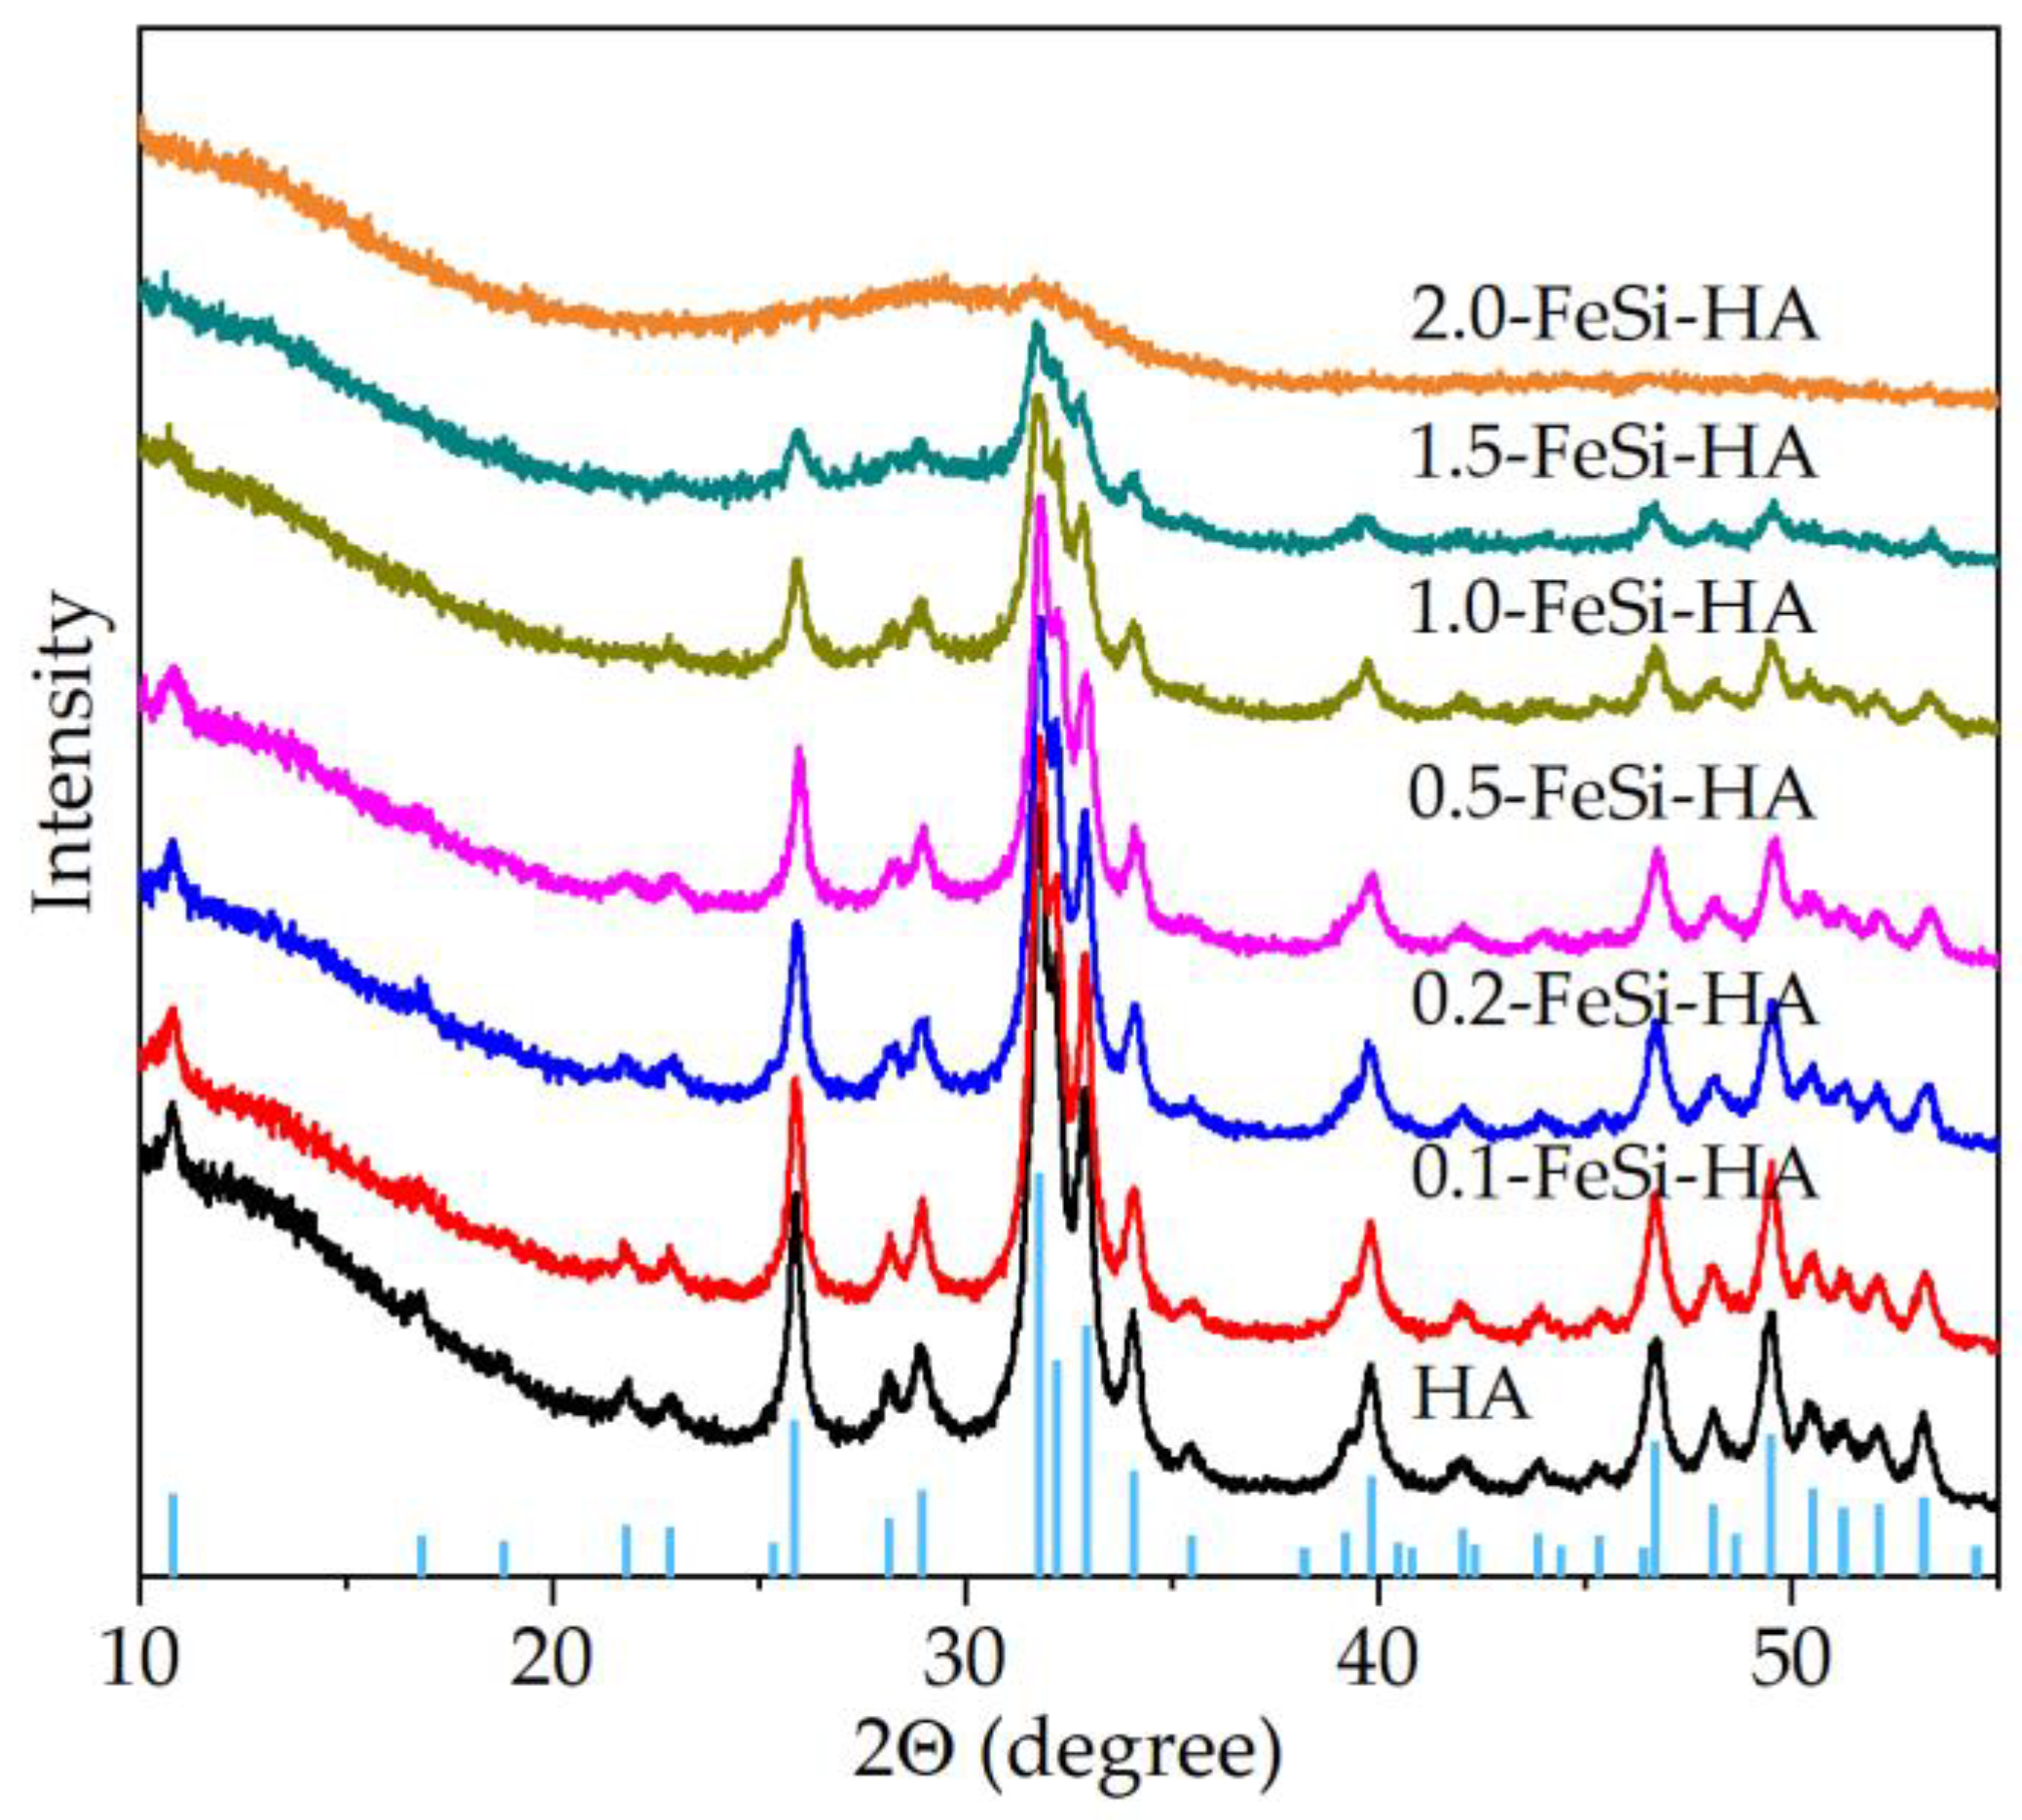
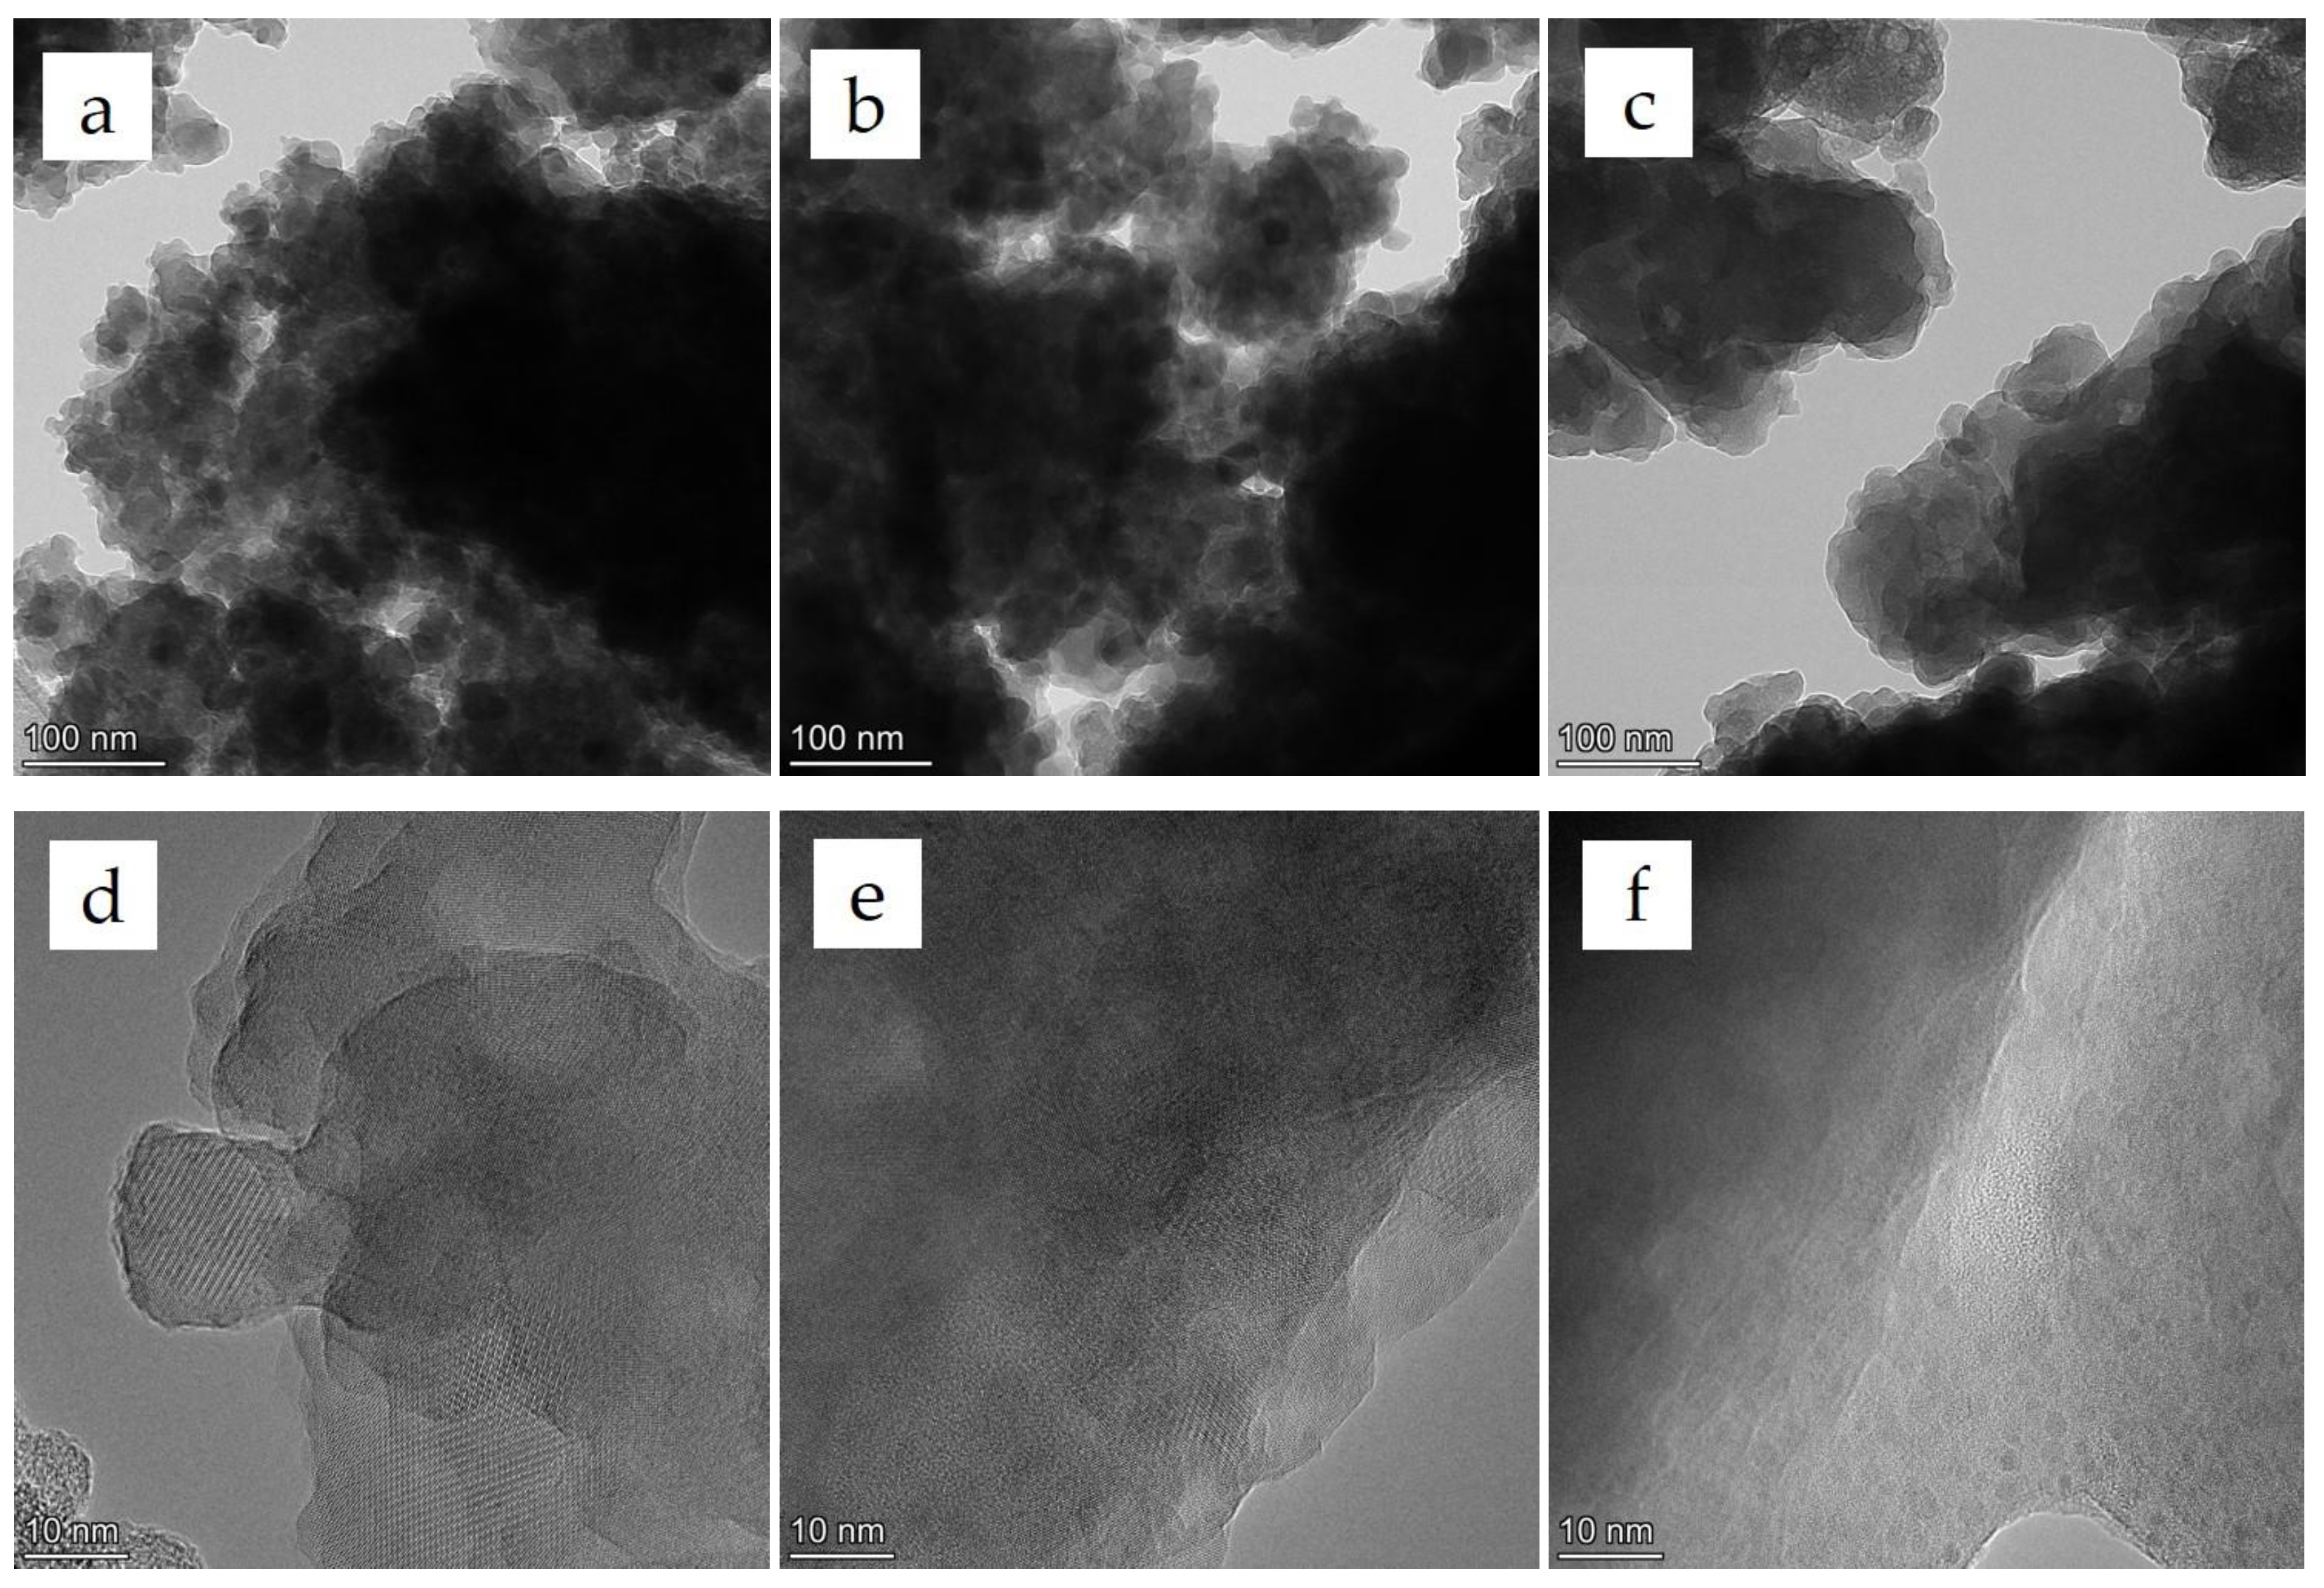
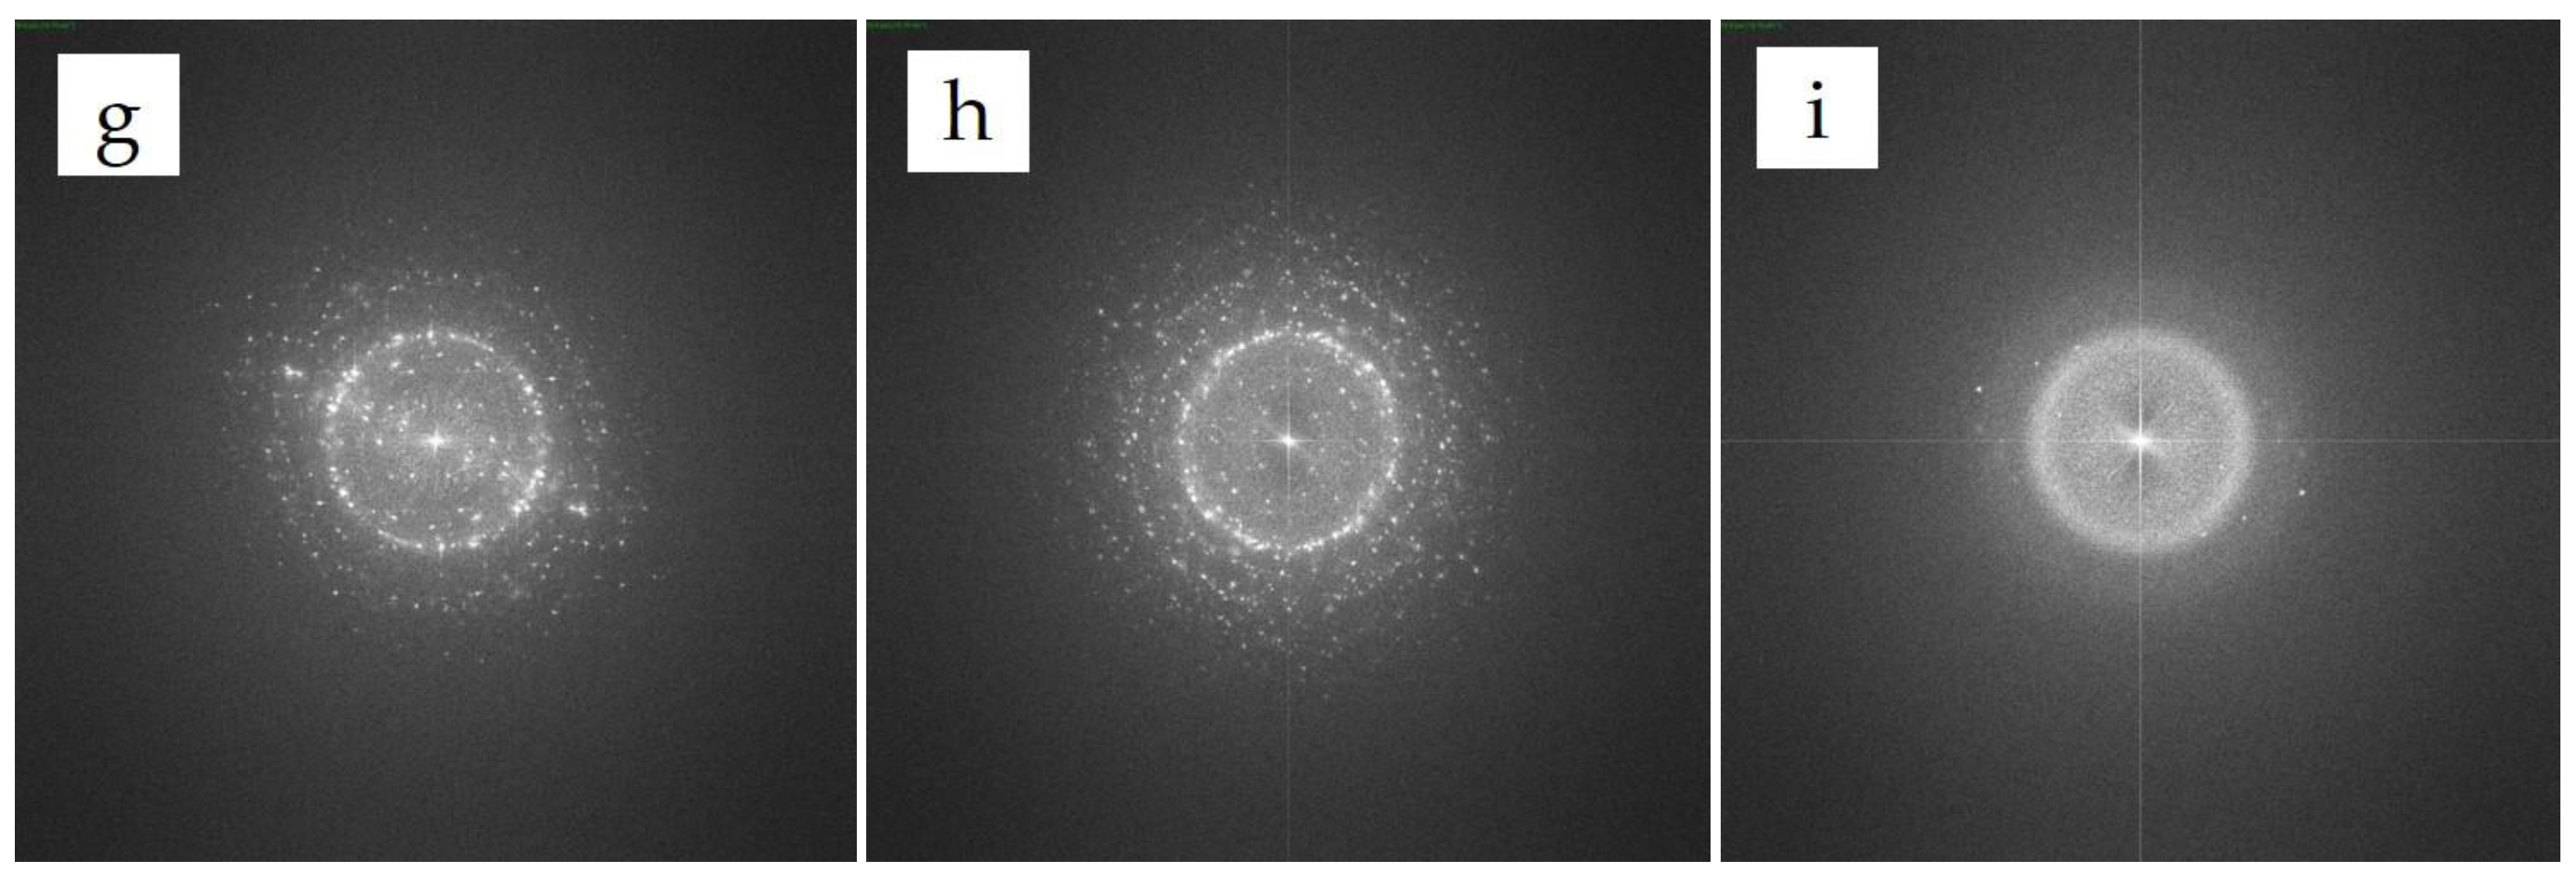
3.1. Analyses of the As-Prepared Samples

The FTIR spectra of the mechanochemically synthesized x−FeSi−HA samples are presented in Figure 1. The spectra show the absorption bands of HA assigned to the bending vibrations of the O−P−O bond at 570 and 601 cm−1 and to the stretching vibrations of the P−O bond at 1047 and 1090 cm−1. The absorption bands at 631 and 3572 cm−1 belong to the libration and stretching vibrations of the O–H group, respectively. As the concentration of introduced substituents increased, the absorption bands were broadened and some of the bands of the tetrahedral phosphate ion were slightly shifted, indicating a change in the local environment. Thus, in the spectrum of 2.0−FeSi−HA, only two intense phosphate bands at 567 and 1060 cm−1 are clearly observed. A band at 940 cm−1 detected in substituted samples belongs to the silicate group in the apatite structure. This band was registered at 950 cm−1 for Si-substituted HA obtained by the same method of synthesis [22]. The observed shift as well as the absence of the rest of the absorption bands of silicate in HA [22,23] can be explained by the presence of additional substituent and by the low crystallinity of the material. It should be noted that the absorption bands of the initial silicate are not observed even in the sample with the maximum degree of substitution; for content, x = 2.0, the unit cell of which hosts two silicate tetrahedra.
An increase in the concentration of substituents (up to x = 0.5) in the samples resulted in a decrease in the intensity of the absorption bands of the stretching (3572 cm−1) and libration (631 cm−1) vibrations of the hydroxyl group (Figure 1a,b). At the same time, there was a shift in the position of the band of stretching vibrations. At x ≥ 1.0, these bands do not appear, which is probably because, at these concentrations, each OH- group in the hydroxyl channel is isolated from the neighboring one either by the O2– anion or by a vacancy (see the chemical formulas listed in Table 1).
FTIR spectra of all the synthesized samples have the broad absorption bands of adsorbed water (1640 and 3423 cm−1). The absorption bands of the carbonate group [6] at 875, 1420, and 1480 cm−1 are observed only for unsubstituted HA.
The XRD patterns of the as-synthesized x−FeSi−HA samples are shown in Figure 2. As seen, all reflections belong to the HA phase (card PDF 40−11−9308). Reflections of the initial reagents are not observed. It should be noted that the resulting powders have XRD patterns close to that of cortical bone [24,25] and human enamel [26]. As the concentration of the introduced substituent ions increases, a broadening of the reflections of the HA phase and a decrease in their intensity are observed, indicating a decrease in the crystallite size. According to the XRD data, the 2.0−FeSi−HA sample is completely amorphous. Therefore, we can conclude that the synthesis of HA with the substitution for both iron and silicate is possible for contents up to x = 1.5, inclusive.
The dependences of the lattice parameters of dual-substituted apatite on the concentration of the substituents are given in Figure 3. For comparison, the changes in these parameters for single-substituted apatite with iron cations and the silicate groups under similar synthesis conditions are given in Figure 3. These data were taken from [22,27], respectively. The lattice parameters of the apatite phase determined from Rietveld X-ray refinements showed that the simultaneous introduction of the two types of substituents into the HA structure increases the lattice parameter a and decreases the lattice parameter c. Figure 3a,b show that a similar effect is observed when iron cations are introduced into the HA structure. Probably, this type of ion contributes the most to the structural changes upon dual substitution. The unit cell volume upon dual substitution changes non-linearly as the substituent concentration increases, while the crystallite size decreases (Figure 3c,d).
The iron cation Fe3+ has a smaller ionic radius (0.55 Å) compared to the calcium cation Ca2+ (1.00 Å); therefore, the introduction of iron ions into the HA structure should lead to a decrease in the parameters a and c. However, in our case, the incorporation of the iron cations only in the HA lattice resulted in a slight increase in the parameter a and a decrease in the parameter c. A similar effect for x−Fe–HA was reported in studies [17,20]. Possibly, this is due to OH vacancy formation to compensate for the excess positive charge from ion Fe3+. The silicate ion (0.39 Å) has a larger ionic radius compared to the phosphate ion (0.35 Å); therefore, at high concentrations, the dual substitution of HA by iron and silicate ions should further increase the parameter a. It should also be noted that, in the case of dual substitution, a change in the composition of cations located in the hydroxyl channel, namely, the availability of hydroxyl groups and O2– vacancies, should affect the lattice parameters (see Table 1). In addition, it is also necessary to take into account the different number of water molecules in the x−FeSi–HA crystal lattice, which can also change the values of the lattice parameters [6,28]. Therefore, in the case of heterovalent multi-substituted HA structure, it is rather difficult to identify the ions affecting the parameters of the crystal lattice.
As seen in TEM images (Figure 4a–c), the introduction of substituent ions does not change the particle morphology. At a low degree of substitution (Figure 4a), single particles 20–30 nm in size as well as large dense aggregates 1000 nm in size are observed. At the highest concentration of substituents, most of the powder is aggregates.
According to the XRD data (Figure 2), all samples have a crystalline structure, except for the 2.0-FeSi-HA sample. HRTEM and the Fourier images (Figure 4d–i) also confirm this fact. A diffuse hallo which is characteristic of amorphous material is observed for the 2.0-FeSi-HA sample (Figure 4e).
Figure 5 shows that the distribution of elements in 2.0−FeSi−HA particles was practically uniform. A slight heterogeneity is observed in the distribution of silicon, which is explained by its agglomeration due to the high water content in it. At lower concentrations of silicate in the initial mixture, this effect is not observed. Table 2 shows that with an increase in the concentration of the introduced substituents in samples, the concentration of the studied elements increases. Their concentrations were close to the expected concentrations, which indicates an efficient mixing of the reagents.

3.2. Thermal Properties

According to the STA data, when the samples with different dopant concentrations were heated up to 600 °C, an intense weight loss caused by the release of water occurred (Figure 6). As seen, in this case, for 2.0−FeSi−HA, the amount of the water released increased as the concentration of the introduced substituents increased up to 10 wt%. According to the reactions listed in Table 1, the initial reagents containing substituent ions are hydrates; therefore, the more hydrated the compounds are, the more water is released upon interaction with the initial reagents. The water released is adsorbed by particles, and it is also captured by the emerging crystal lattice of apatite [28]. A small amount of water released at temperatures above 700 °C is attributed to the dehydroxylation of apatite [29]. In addition, the DSC curve of the 2.0−FeSi−HA sample (Figure 6d) exhibits an exo-effect at 735 °C, which can be associated with the structural transformations accompanied by the precipitation of the β−Ca3(PO4)2 phase (β−TCP) [3]. In the 0.5-FeSi-HA and 1.0-FeSi-HA samples, there was no exo-effect at 735 °C, although the slope of the DSC curve changed. Therefore, the process of structural transformation was less pronounced in this case due to the smaller amount of the released phase.
Based on the STA data, for further investigation, the annealing temperatures 600 °C and 800 °C were identified as those wherein the main structural changes of the samples occur. Up to 600 °C, the removal of adsorbed water and lattice water was observed, and up to 800 °C, structural transformations in the substituted HA lattice occurred.
According to the FTIR spectra, the phase composition of the samples annealed at 600 °C (Figure 7a) did not change, although, compared to the as-synthesized samples (Figure 1), a slight narrowing of all absorption bands can be observed. As well as before annealing, the absorption bands of the phosphate ion were broadened with an increase in the concentration of the introduced substituents, and, at high concentrations, some of the bands were shifted (Figure 7b). The absorption bands of the OH- groups at 632 and 3572 cm−1 became more intense and narrower for the samples with a substituent content x = 0.0–1.0. In the as-synthesized samples, some of the water molecules were probably in the hydroxyl channel instead of the OH -groups. The absorption bands of the OH- groups were absent in the samples with content x = 1.5 and 2.0. Instead of them, there was a set of weakly expressed bands in the range of the stretching vibrations of the OH- groups (Figure 7c). The absorption band assigned to the vibrations of silicate tetrahedra was observed at 931 cm−1. One of the reasons for the shifting may be the removal of lattice water from the substituted HA.
It should be noted that the behavior of the libration and stretching vibrations of the OH- groups confirms the correctness of the chemical compositions of the synthesized samples with the general formula Ca10−xFex(PO4)6−x(SiO4)x(OH)2−xOx/2, given in Table 1. Consequently, a simpler option to mutually balance the excess charges of the cations and anions introduced on the formation of Ca10−xFex(PO4)6−x(SiO4)x(OH)2 did not occur. This can be explained as follows. The hydroxyl groups in the HA structure are placed in a channel with walls formed by the calcium cations [6]. Upon substitution of Ca2+ by Fe3+ cations, the channel walls at the site of substitution acquire an excess positive charge, which requires compensation that can be achieved by the loss of the OH group in favor of the O2– anion.
With an increase in the annealing temperature to 800 °C, the FTIR spectra of the samples with x = 0.5–2.0 significantly changed (Figure 7d−f), indicating the structural transformations revealed by the thermal analysis data. As seen in Figure 7d, the β-TCP spectrum differs significantly from that of the substituted samples, with x = 1.0–2.0. Given that, upon heating to 735 °C, the substituted β-TCP, rather than stoichiometric β-TCP, can be formed, and the substituent ions should change the FTIR spectrum of β-TCP. Based on this assumption, we found that the FTIR spectra of the samples with x = 1.0–2.0 are similar to that of the iron-substituted β−TCP [30]. However, in our case, the absorption band values are slightly different, which may be due to the presence of both the iron cations and the silicate anions in the β-TCP structure.
The XRD patterns after the ex situ heat treatment of the FeSi-HA powders for 2 h (Figure 8) show that the β-TCP phase appeared in all the substituted samples at temperatures above 600 °C. Thus, at x = 0.1–0.5, β-TCP started to appear at 800 °C, whereas at high concentrations (x = 1.0–2.0), this phase was detected at 700 °C. An increase in the annealing temperature resulted in an increase in the β-TCP content in all the substituted samples (Table 3), whereas the unsubstituted HA remained single-phase at all treatment temperatures. For substituent concentrations x = 1.0–2.0 at a temperature above 800 °C, another phase appeared, iron (III) oxide, whose concentration increased with an increase in the temperature and the degree of substitution.
An interesting fact is that the individual silicate-containing phase, which is commonly formed upon x−Si–HA heating [22], was not observed in the x−FeSi–HA samples even at a high concentration of the introduced silicon and at high treatment temperatures. Obviously, upon x−FeSi–HA decomposition, the silicate anion remains in the apatite phase or in the β–TCP phase, whereas the iron cation introduced in high concentrations (x > 0.5) leaves the phosphate structure and forms an individual oxide phase, indicating the supersaturation of calcium phosphate with iron.
Given the fact that the silicate-substituted apatites show higher thermal stability [22] as compared to the iron-substituted apatites [27], it can be assumed that the main destabilization in the x−FeSi–HA lattice was caused by iron cations, which have an ionic radius almost two times less than calcium ions. The thermal expansion that occured upon heating of the x−FeSi–HA samples increased the interatomic distance, thus reducing the electrostatic attraction between cations and anions. Clearly, the destruction of the x−FeSi–HA crystal lattice upon heating occurs in the region of the localization of the iron cations because the distance between the iron cation and the nearest oxygen anions becomes larger than that required for their attraction. The presence of the silicate anions in the x−FeSi–HA structure should further increase the volume of the unit cell; therefore, the limit of thermal stability of x−FeSi–HA, as compared to x−Fe–HA, is reduced by 100 °C, as we have shown in this study.
Figure 9a–c shows changes in the lattice parameters and crystallite size for the apatite phase as the annealing temperature of the samples with different degrees of substitution increased. In the sample with x = 2.0, the concentration of the apatite phase was less than 10 wt%, so the parameters for this sample are not given. As seen, the removal of adsorbed water at 300 °C led to a decrease in the lattice parameters in all the samples. The removal of lattice water at 600 °C did not change the parameter a, while the parameter c was increased. A further increase in the substituent content increased the parameter c. With a further increase in the temperature, the parameter c continued to increase, while the parameter a started to decrease. In both cases, the higher the substituent concentration, the more the lattice parameters changed. In the samples with a high concentration of substituents (x = 1.0, 1.5), at the high temperatures at which iron oxide is formed, a significant deviation of the parameters from a linear dynamic, with the analyzed values approaching the values for unsubstituted HA, took place. Therefore, we can conclude that at high temperatures, in the samples with x = 1.0 and x = 1.5, a decrease in the concentration of the iron cations was observed. These changes do not affect the size of the crystallites formed (Figure 9c). For all the samples, starting from 600 °C, the crystallite size monotonically increased with an increase in the annealing temperature.
The variation in the lattice parameters of the β-TCP phase with an increase in the treatment temperature of the samples is shown in Figure 9d–f. For comparison, the structural parameters of the unsubstituted stoichiometric β-TCP are also given in the figure. These data confirm that some of the substituent ions are in the structure of β-TCP. With an increase in the concentration of substituents, the parameter a of the substituted samples at a fixed temperature decreased, whereas its value increases as the temperature increased. For unsubstituted β−TCP, both the a and c lattice parameters almost did not change. The parameter c in the substituted samples had more complicated dynamics of change (Figure 9e). For the samples with x = 0.2–1.5, the values of the parameter c almost did not change at all treatment temperatures, which is probably due to the similar concentration of one of the substituents. With an increase in the temperature, the parameter c of these samples increased, maintaining the dynamics similar to that of the parameter a. The behavior of the parameter c for the sample with x = 2.0 was almost similar to that for the stoichiometric β-TCP. Thus, it changed slightly as the temperature increased, but the line of changes of the parameter c for this sample was lower by ~0.05 Å. Unlike the data suggesting that the parameters a and c of the iron substituted β-TCP decrease as the iron content increases [30], our study showed that β-TCP contains both iron cations and silicate anions. The concentration of the latter probably increases as the treatment temperature of the samples with x = 0.2–1.5 increases, which is reflected in an increase in the lattice parameters of the samples.
The size of the crystallites of the substituted β-TCP phase decreased with an increasing concentration of the substituents (Figure 9f), which indicates a complication of the crystallization process. In addition, an increase in the treatment temperature led to an increase in the crystallite sizes.

4. Conclusions

A series of samples of the substituted apatites with an equal content of the introduced iron cations and silicon anions was prepared by the mechanochemical method. It was found that, up to x ≤ 1.5, a single-phase substituted HA of the Ca10−xFex(PO4)6−x(SiO4)x(OH)2−xOx/2 composition was formed. This compound contains a small amount of water (<10 wt%) released during the interaction of the initial reagents. With an increase in the concentration of substituents, the formation process of the crystal lattice became more complicated, which decreased the degree of crystallinity of the material. At the degree of substitution x = 2.0, an amorphous product was formed.
An analysis of the behavior of the synthesized materials upon heating showed that the introduction of the substituents leads to a decrease in the thermal stability of hydroxyapatite, and the stability limit depends on the concentration of the substituents. Upon heating of the x−FeSi–HA sample with x ≤ 0.5 in a high-temperature furnace at 800 °C for 2 h, it was partially decomposed, with the formation of the substituted β–Ca3(PO4)2 phase. At higher concentrations, the formation of the substituted β-Ca3(PO4)2 began already at 700 °C, followed by the formation of Fe2O3 at 900 °C. The formation of iron oxide was accompanied by changes in the lattice parameters of the apatite phase, indicating the release of the iron cations from the apatite phase. Therefore, we can conclude that the limit of iron and silicon ion contents for the simultaneous substitution in hydroxyapatite is lower than x = 1. The low thermal stability of x−FeSi–HA with substitution by iron cations is due to the smaller ionic radius of iron.
This study shows that the as-synthesized materials can be used for the manufacture of medical ceramic products with a heat treatment temperature of not higher than 700 °C. For apatites with a low concentration of substituents (x ≤ 0.5), the temperature can be increased by 100 °C.

Author Contributions

Conceptualization, S.V.M. and N.V.B.; methodology, N.V.B. and A.V.I.; validation, S.V.M. and N.V.B.; investigation, S.V.M., A.V.I. and O.B.V.; data curation, S.V.M.; writing—original draft preparation, S.V.M. and O.B.V.; writing—review and editing, N.V.B.; visualization, S.V.M.; funding acquisition, N.V.B. All authors have read and agreed to the published version of the manuscript.

Funding

This research was carried out within a state assignment to the Institute of Solid State Chemistry and Mechanochemistry SB RAS (project No. 121032500064-8).

Institutional Review Board Statement

Not applicable.

Informed Consent Statement

Not applicable.

Data Availability Statement

The raw/processed data required to reproduce these results are included in the Materials and Methods section.

Acknowledgments

The TEM analysis was conducted on the equipment of the multi-access center the National Center of Catalyst Research (Novosibirsk, Russia).

Conflicts of Interest

The authors declare no conflict of interest.

References

  1. Lee, R.S.; Kayser, M.V.; Ali, S.Y. Calcium phosphate microcrystal deposition in the human intervertebral disc. J. Anat. 2006, 208, 13–19. [Google Scholar] [CrossRef] [PubMed]
  2. Dorozhkin, S.V. Calcium orthophosphates in nature, biology and medicine. Materials 2009, 2, 399–498. [Google Scholar] [CrossRef]
  3. Chaikina, M.V.; Bulina, N.V.; Vinokurova, O.B.; Gerasimov, K.B.; Prosanov, I.Y.; Kompankov, N.B.; Lapina, O.B.; Papulovskiy, E.S.; Ishchenko, A.V.; Makarova, S.V. Possibilities of Mechanochemical Synthesis of Apatites with Different Ca/P Ratios. Ceramics 2022, 5, 404–422. [Google Scholar] [CrossRef]
  4. Zakaria, S.M.; Zein, S.H.S.; Othman, M.R.; Yang, F.; Jansen, J.A. Nanophase hydroxyapatite as a biomaterial in advanced hard tissue engineering: A review. Tissue Eng. B Rev. 2013, 19, 431–441. [Google Scholar] [CrossRef]
  5. Kolmas, J.; Groszyk, E.; Kwiatkowska-Rózycka, D. Substituted hydroxyapatites with antibacterial properties. Biomed Res. Int. 2014, 2014, 178123. [Google Scholar] [CrossRef]
  6. Elliott, J.C. Structure and Chemistry of Apatite and Other Calcium Orthophosphates; Studies in Inorganic Chemistry; Elsevier: Amsterdam, The Netherlands, 1994; pp. 1–404. ISBN 0-444-81582-1. [Google Scholar]
  7. Bigi, A.; Cojazzi, G.; Panzavolta, S.; Ripamonti, A.; Roveri, N.; Romanello, M.; Noris Suarez, K.; Moro, L. Chemical and structural characterization of the mineral phase from cortical and trabecular bone. J. Inorg. Biochem. 1997, 68, 45–51. [Google Scholar] [CrossRef]
  8. Šupová, M. Substituted hydroxyapatites for biomedical applications: A review. Ceram. Int. 2015, 41, 9203–9231. [Google Scholar] [CrossRef]
  9. Carlisle, E.M. Silicon: A requirement in bone formation independent of vitamin D1. Calcif. Tissue Int. 1981, 33, 27–34. [Google Scholar] [CrossRef]
  10. Patel, N.; Best, S.M.; Bonfield, W.; Gibson, I.R.; Hing, K.A.; Damien, E.; Revell, P.A. A comparative study on the in vivo behavior of hydroxyapatite and silicon substituted hydroxyapatite granules. J. Mater. Sci. Mater. Med. 2002, 13, 1199–1206. [Google Scholar] [CrossRef]
  11. Hing, K.A.; Revell, P.A.; Smith, N.; Buckland, T. Effect of silicon level on rate, quality and progression of bone healing within silicate-substituted porous hydroxyapatite scaffolds. Biomaterials 2006, 27, 5014–5026. [Google Scholar] [CrossRef]
  12. Balas, F.; Pérez-Pariente, J.; Vallet-Regí, M. In vitro bioactivity of silicon-substituted hydroxyapatites. J. Biomed. Mater. Res. A 2003, 66, 364–375. [Google Scholar] [CrossRef] [PubMed]
  13. Camaioni, A.; Cacciotti, I.; Campagnolo, L.; Bianco, A. Silicon-Substituted Hydroxyapatite for Biomedical Applications. In Hydroxyapatite (Hap) for Biomedical Applications; Mucalo, M.R., Ed.; Elsevier: Amsterdam, The Netherlands, 2015; Volume 95, pp. 343–373. [Google Scholar] [CrossRef]
  14. Kim, S.R.; Lee, J.H.; Kim, Y.T.; Riu, D.H.; Jung, S.J.; Lee, Y.J.; Chung, S.C.; Kim, Y.H. Synthesis of Si, Mg substituted hydroxyapatites and their sintering behaviors. Biomaterials 2003, 24, 1389–1398. [Google Scholar] [CrossRef] [PubMed]
  15. Chang, Q.; Chen, D.L.; Ru, H.Q.; Yue, X.Y.; Yu, L.; Zhang, C.P. Toughening mechanism in iron-containing hydroxyapatite/titanium composite. Biomaterials 2010, 31, 1493–1501. [Google Scholar] [CrossRef] [PubMed]
  16. Pon-On, W.; Charoenphandhu, N.; Teeraporpuntakit, J.; Thongbunchoo, J.; Krishnamra, N.; Tang, I.M. Physicochemical and biochemical properties of ironloaded silicon substituted hydroxyapatite (FeSiHAp). Mater. Chem. Phys. 2013, 141, 850–860. [Google Scholar] [CrossRef]
  17. Kaygili, O.; Dorozhkin, S.V.; Ates, T.; Al-Ghamdi, A.A.; Yakuphanoglu, F. Dielectric properties of Fe doped hydroxyapatite prepared by sol gel method. Ceram. Int. 2016, 40, 9395–9402. [Google Scholar] [CrossRef]
  18. Panseri, S.; Cunha, C.; D’Alessandro, T.; Sandri, M.; Giavaresi, G.; Marcacci, M.; Hung, C.T.; Tampieri, A. Intrinsically superparamagnetic Fe-hydroxyapatite nanoparticles positively influence osteoblast-like behavior. J. Nanobiotechnol. 2012, 10, 1–10. [Google Scholar] [CrossRef]
  19. Iafisco, M.; Sandri, M.; Panseri, S.; Delgado-Lopez, J.M.; Gomez-Morales, J.; Tampieri, A. Magnetic bioactive and biodegradable hollow Fe-doped hydroxyapatite coated poly(L-lactic) acid micro-nanospheres. Chem. Mater. 2013, 25, 2610–2617. [Google Scholar] [CrossRef]
  20. Sarath Chandra, V.; Baskar, G.; Suganthi, R.V.; Elayaraja, K.; Ahymah Joshy, M.I.; Sofi Beaula, W.; Mythili, R.; Venkatraman, G.; Narayana Kalkura, S. Blood compatibility of iron-doped nanosize hydroxyapatite and its drug release. ACS Appl. Mater. Interfaces 2012, 4, 1200–1210. [Google Scholar] [CrossRef]
  21. Tampieri, A.; D’Alessandro, T.; Sandri, M.; Sprio, S.; Landi, E.; Bertinetti, L.; Panseri, S.; Pepponi, G.; Goettlicher, J.; Banobre-Lopez, M.; et al. Intrinsic magnetism and hyperthermia in bioactive Fe-doped hydroxyapatite. Acta Biomater. 2012, 8, 843–851. [Google Scholar] [CrossRef]
  22. Bulina, N.V.; Chaikina, M.V.; Andreev, A.S.; Lapina, O.B.; Ishchenko, A.V.; Prosanov, I.Y.; Gerasimov, K.B.; Solovyov, L.A. Mechanochemical synthesis of SiO44-substituted hydroxyapatite, part II—Reaction mechanism, structure, and substitution limit. Eur. J. Inorg. Chem. 2014, 2014, 4810–4825. [Google Scholar] [CrossRef]
  23. Marchat, D.; Zymelka, M.; Coelho, C.; Gremillard, L.; Joly-pottuz, L.; Babonneau, F.; Esnouf, C.; Chevalier, J.; Bernache-assollant, D. Accurate characterization of pure silicon-substituted hydroxyapatite powders synthesized by a new precipitation route. Acta. Biomater. 2013, 9, 6992–7004. [Google Scholar] [CrossRef] [PubMed]
  24. Glimcher, M.J. The Nature of the Mineral Phase in Bone: Biological and Clinical Implications. In Metabolic Bone Disease and Clinically Related Disorders, 3rd ed.; Avioli, L.V., Krane, S.M., Eds.; Academic Press: Camdridge, MA, USA, 1998; pp. 23–50. [Google Scholar] [CrossRef]
  25. Boskey, A. Bone mineral crystal size. Osteoporos. Int. 2003, 14, 16–21. [Google Scholar] [CrossRef]
  26. LeGeros, R.Z.; Bonel, G.; Legros, R. Types of “H2O” in human enamel and in precipitated apatites. Calcif. Tissue Res. 1978, 26, 111–118. [Google Scholar] [CrossRef] [PubMed]
  27. Eremina, N.V.; Makarova, S.V.; Isaev, D.D.; Bulina, N.V. Soft mechanochemical synthesis and thermal stability of hydroxyapatites with different types of substitution. Chim. Techno. Acta 2022, 9, 3–9. [Google Scholar] [CrossRef]
  28. Tõnsuaadu, K.; Gross, K.A.; Pluduma, L.; Veiderma, M. A review on the thermal stability of calcium apatites. J. Therm. Anal. Calorim. 2012, 110, 647–659. [Google Scholar] [CrossRef]
  29. Bulina, N.V.; Makarova, S.V.; Baev, S.G.; Matvienko, A.A.; Gerasimov, K.B.; Logutenko, O.A.; Bystrov, V.S. A study of thermal stability of hydroxyapatite. Minerals 2021, 11, 1310. [Google Scholar] [CrossRef]
  30. Singh, R.K.; Srivastava, M.; Prasad, N.K.; Awasthi, S.; Dhayalan, A.; Kannan, S. Iron doped β -Tricalcium phosphate: Synthesis, characterization, hyperthermia effect, biocompatibility and mechanical evaluation. Mater. Sci. Eng. C 2017, 78, 715–726. [Google Scholar] [CrossRef]
Figure 1. FTIR spectra of the as-synthesized x−FeSi−HA samples. General (a) and magnified views of the 550–650 cm−1 (b) and 3550–3610 cm−1 (c) ranges.
Powders 02 00022 g001
Figure 2. XRD patterns of the as-synthesized x−FeSi−HA samples. Vertical bars in the lower graph correspond to the HA reflections from the ISDD database (PDF 40−11−9308).
Powders 02 00022 g002
Figure 3. Evolution of parameter a (a), parameter c (b), lattice volume (c), and crystallite size (d) depending on the concentration of introduced ions of the as-synthesized x−FeSi−HA samples. Fe-HA parameter values were taken from the work [23], Si-HA parameter values were taken from the work [22].
Powders 02 00022 g003
Figure 4. TEM (ac), HRTEM (df), and the Fourier (gi) images for 0.5−FeSi−HA (a,d,g), 1.0−FeSi−HA (b,e,h), and 2.0−FeSi−HA (c,f,i) samples.
Powders 02 00022 g004aPowders 02 00022 g004b
Figure 5. Distribution map of elements across particles in 2.0−FeSi−HA sample. Data obtained by TEM measurement.
Powders 02 00022 g005aPowders 02 00022 g005b
Figure 6. STA of the as-synthesized x−FeSi−HA samples: HA (a), 0.5−FeSi−HA (b), 1.0−FeSi−HA (c), and 2.0−FeSi−HA (d). Black line 1—weight loss; red line 2—DSC; blue line 3—water release.
Powders 02 00022 g006
Figure 7. FTIR spectra of x−FeSi−HA samples after ex situ annealing at 600 °C (ac) and 800 °C (df). A general view (a,d) and enlarged views of 540–650 cm−1 (b,e) and 3550–3610 cm−1 (c,f) ranges.
Powders 02 00022 g007
Figure 8. XRD patterns of the x−FeSi−HA samples after ex situ annealing HA (a), 0.2−FeSi−HA (b), 0.5−FeSi−HA (c), 1.0−FeSi−HA (d), 1.5−FeSi−HA (e), and 2.0−FeSi−HA (f) powders. Vertical bars (cyan) correspond to the HA reflections from the ICDD database (PDF 40−11−9308). Color scheme: black—there is only HA phase; red—addition of TCP phase; blue—addition of Fe2O3 phase.
Powders 02 00022 g008
Figure 9. Structural parameters of HA (ac) and β−TCP (df) of the samples with different dopant concentrations after ex situ annealing.
Powders 02 00022 g009
Table 1. Ratios of the initial reagents and plausible stoichiometries of the mechanochemically synthesized samples.
Degree of Substitution (x)Sample DesignationEquations for Plausible Chemical Reactions
0HA6.0CaHPO4 + 4.0CaO M S Ca10(PO4)6(OH)2 + 2H2O
0.10.1−FeSi−HA5.8CaHPO4 + 4.1CaO + 0.1FePO4·2H2O + 0.1SiO2·0.7H2O M S Ca9.9Fe0.1(PO4)5.9(SiO4)0.1(OH)1.9O0.05 + 2.17H2O
0.20.2−FeSi−HA5.6CaHPO4 + 4.2CaO + 0.2FePO4·2H2O + 0.2SiO2·0.7H2O M S Ca9.8Fe0.2(PO4)5.8(SiO4)0.2(OH)1.8O0.1 + 2.34H2O
0.50.5−FeSi−HA5.0CaHPO4 + 4.5CaO + 0.5FePO4·2H2O + 0.5SiO2·0.7H2O M S Ca9.5Fe0.5(PO4)5.5(SiO4)0.5(OH)1.5O0.25 + 2.85H2O
1.01.0−FeSi−HA4.0CaHPO4 + 5.0CaO + 1.0FePO4·2H2O + 1.0SiO2·0.7H2O M S Ca9.0Fe1.0(PO4)5.0(SiO4)1.0(OH)1.0O0.5 + 3.70H2O
1.51.5−FeSi−HA3.0CaHPO4 + 5.5CaO + 1.5FePO4·2H2O + 1.5SiO2·0.7H2O M S Ca8.5Fe1.5(PO4)4.5(SiO4)1.5(OH)0.5O0.75 + 4.55H2O
2.02.0−FeSi−HA2.0CaHPO4 + 6.0CaO + 2.0FePO4·2H2O + 2.0SiO2·0.7H2O M S Ca8.0Fe2.0(PO4)4.0(SiO4)2.0O + 5.40H2O
Table 2. EDX microanalysis data of the as-synthesized x−FeSi−HA samples.
SampleConcentration (at.%)
Composition of Synthesized MaterialsExpected Composition
CaFePSiCaFePSi
HA66-34-63-37-
0.5−FeSi−HA593353593353
1.0−FeSi−HA588295576316
2.0−FeSi−HA4411331250122612
Table 3. Concentrations of phases (wt%) calculated by the Rietveld method from XRD patterns of x−FeSi−HA samples after ex situ annealing.
SamplePhase700 °C800 °C900 °C1000 °C1100 °C
HAHA100100100100100
0.1−FeSi−HAHA100100928987
β−TCP0081113
0.2−FeSi−HAHA10095767066
β−TCP05243034
0.5−FeSi−HAHA10085574337
β−TCP015435763
1.0−FeSi−HAHA9767321412
β−TCP333678183
Fe2O300156
1.5−FeSi−HAHA7931721
β−TCP2169939090
Fe2O300189
2.0−FeSi−HAHA15 6731
β−TCP8594918989
Fe2O3001810
Disclaimer/Publisher’s Note: The statements, opinions and data contained in all publications are solely those of the individual author(s) and contributor(s) and not of MDPI and/or the editor(s). MDPI and/or the editor(s) disclaim responsibility for any injury to people or property resulting from any ideas, methods, instructions or products referred to in the content.

