
Anaerobic Digestion Remediation in Three Full-Scale Biogas Plants through Supplement Additions
 , ,
, ,
Abstract
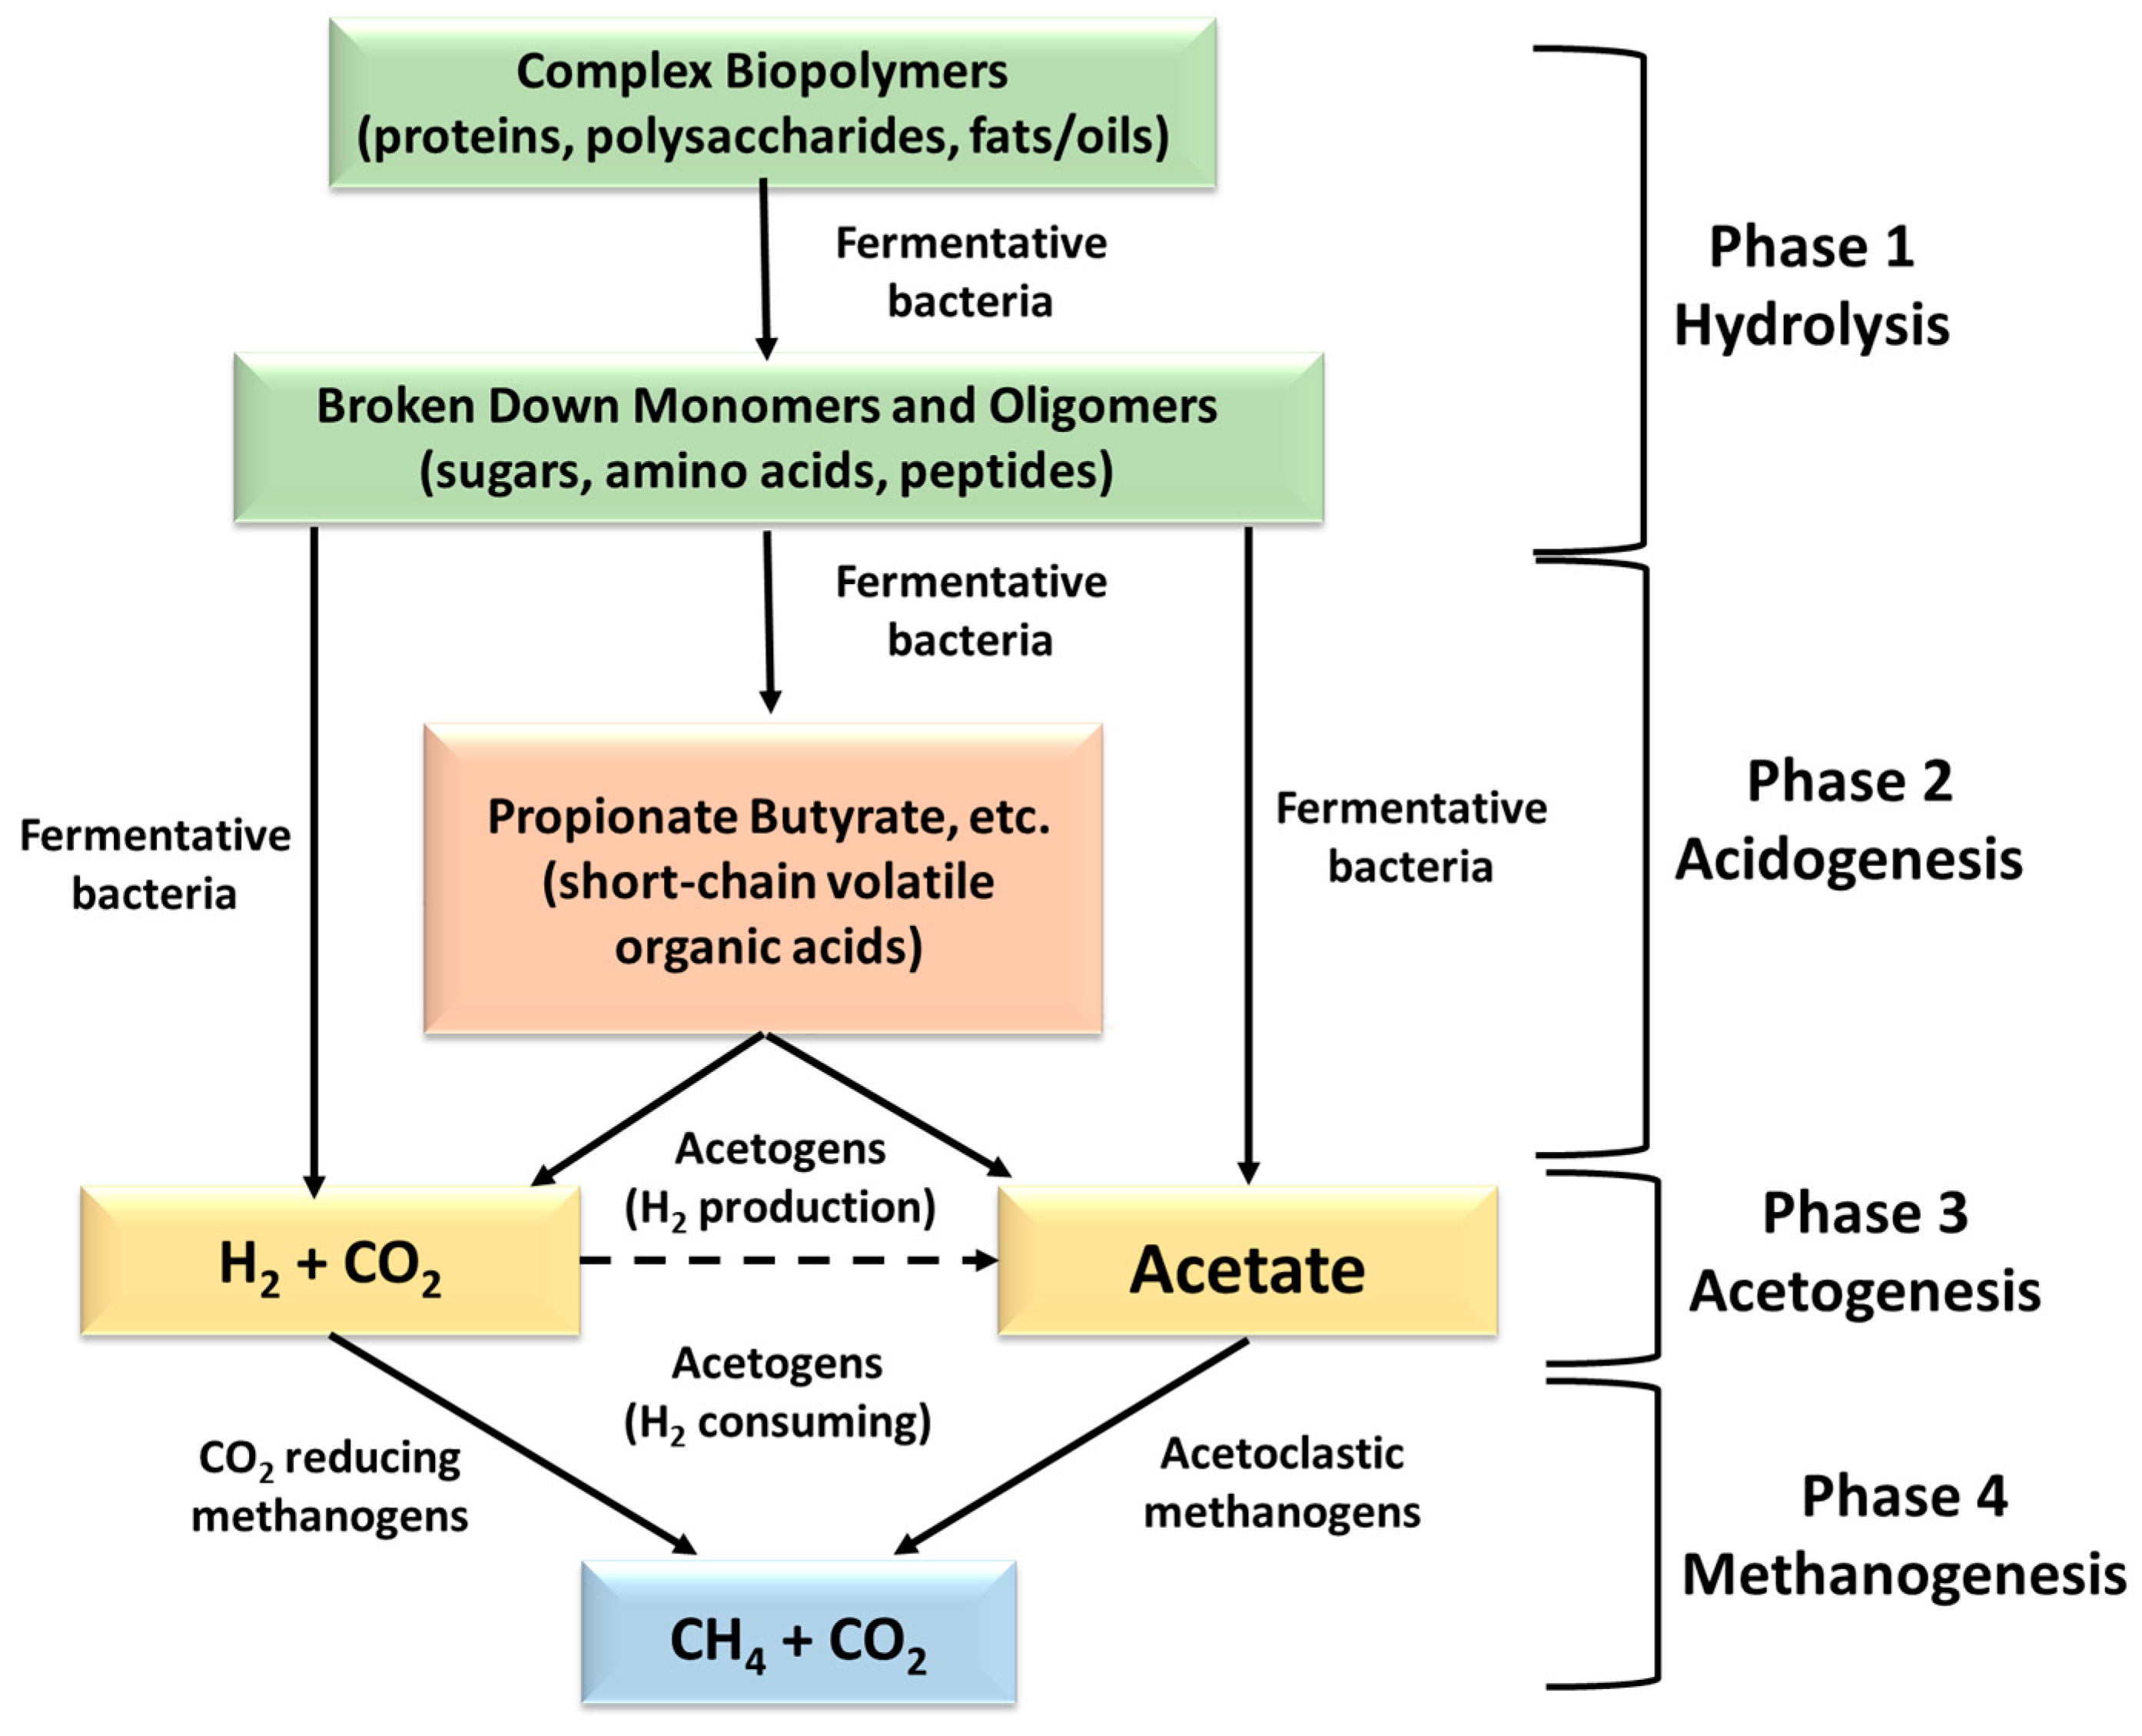
:1. Introduction
2. Results
2.1. Operating Conditions of Biogas Plants and Additives Application
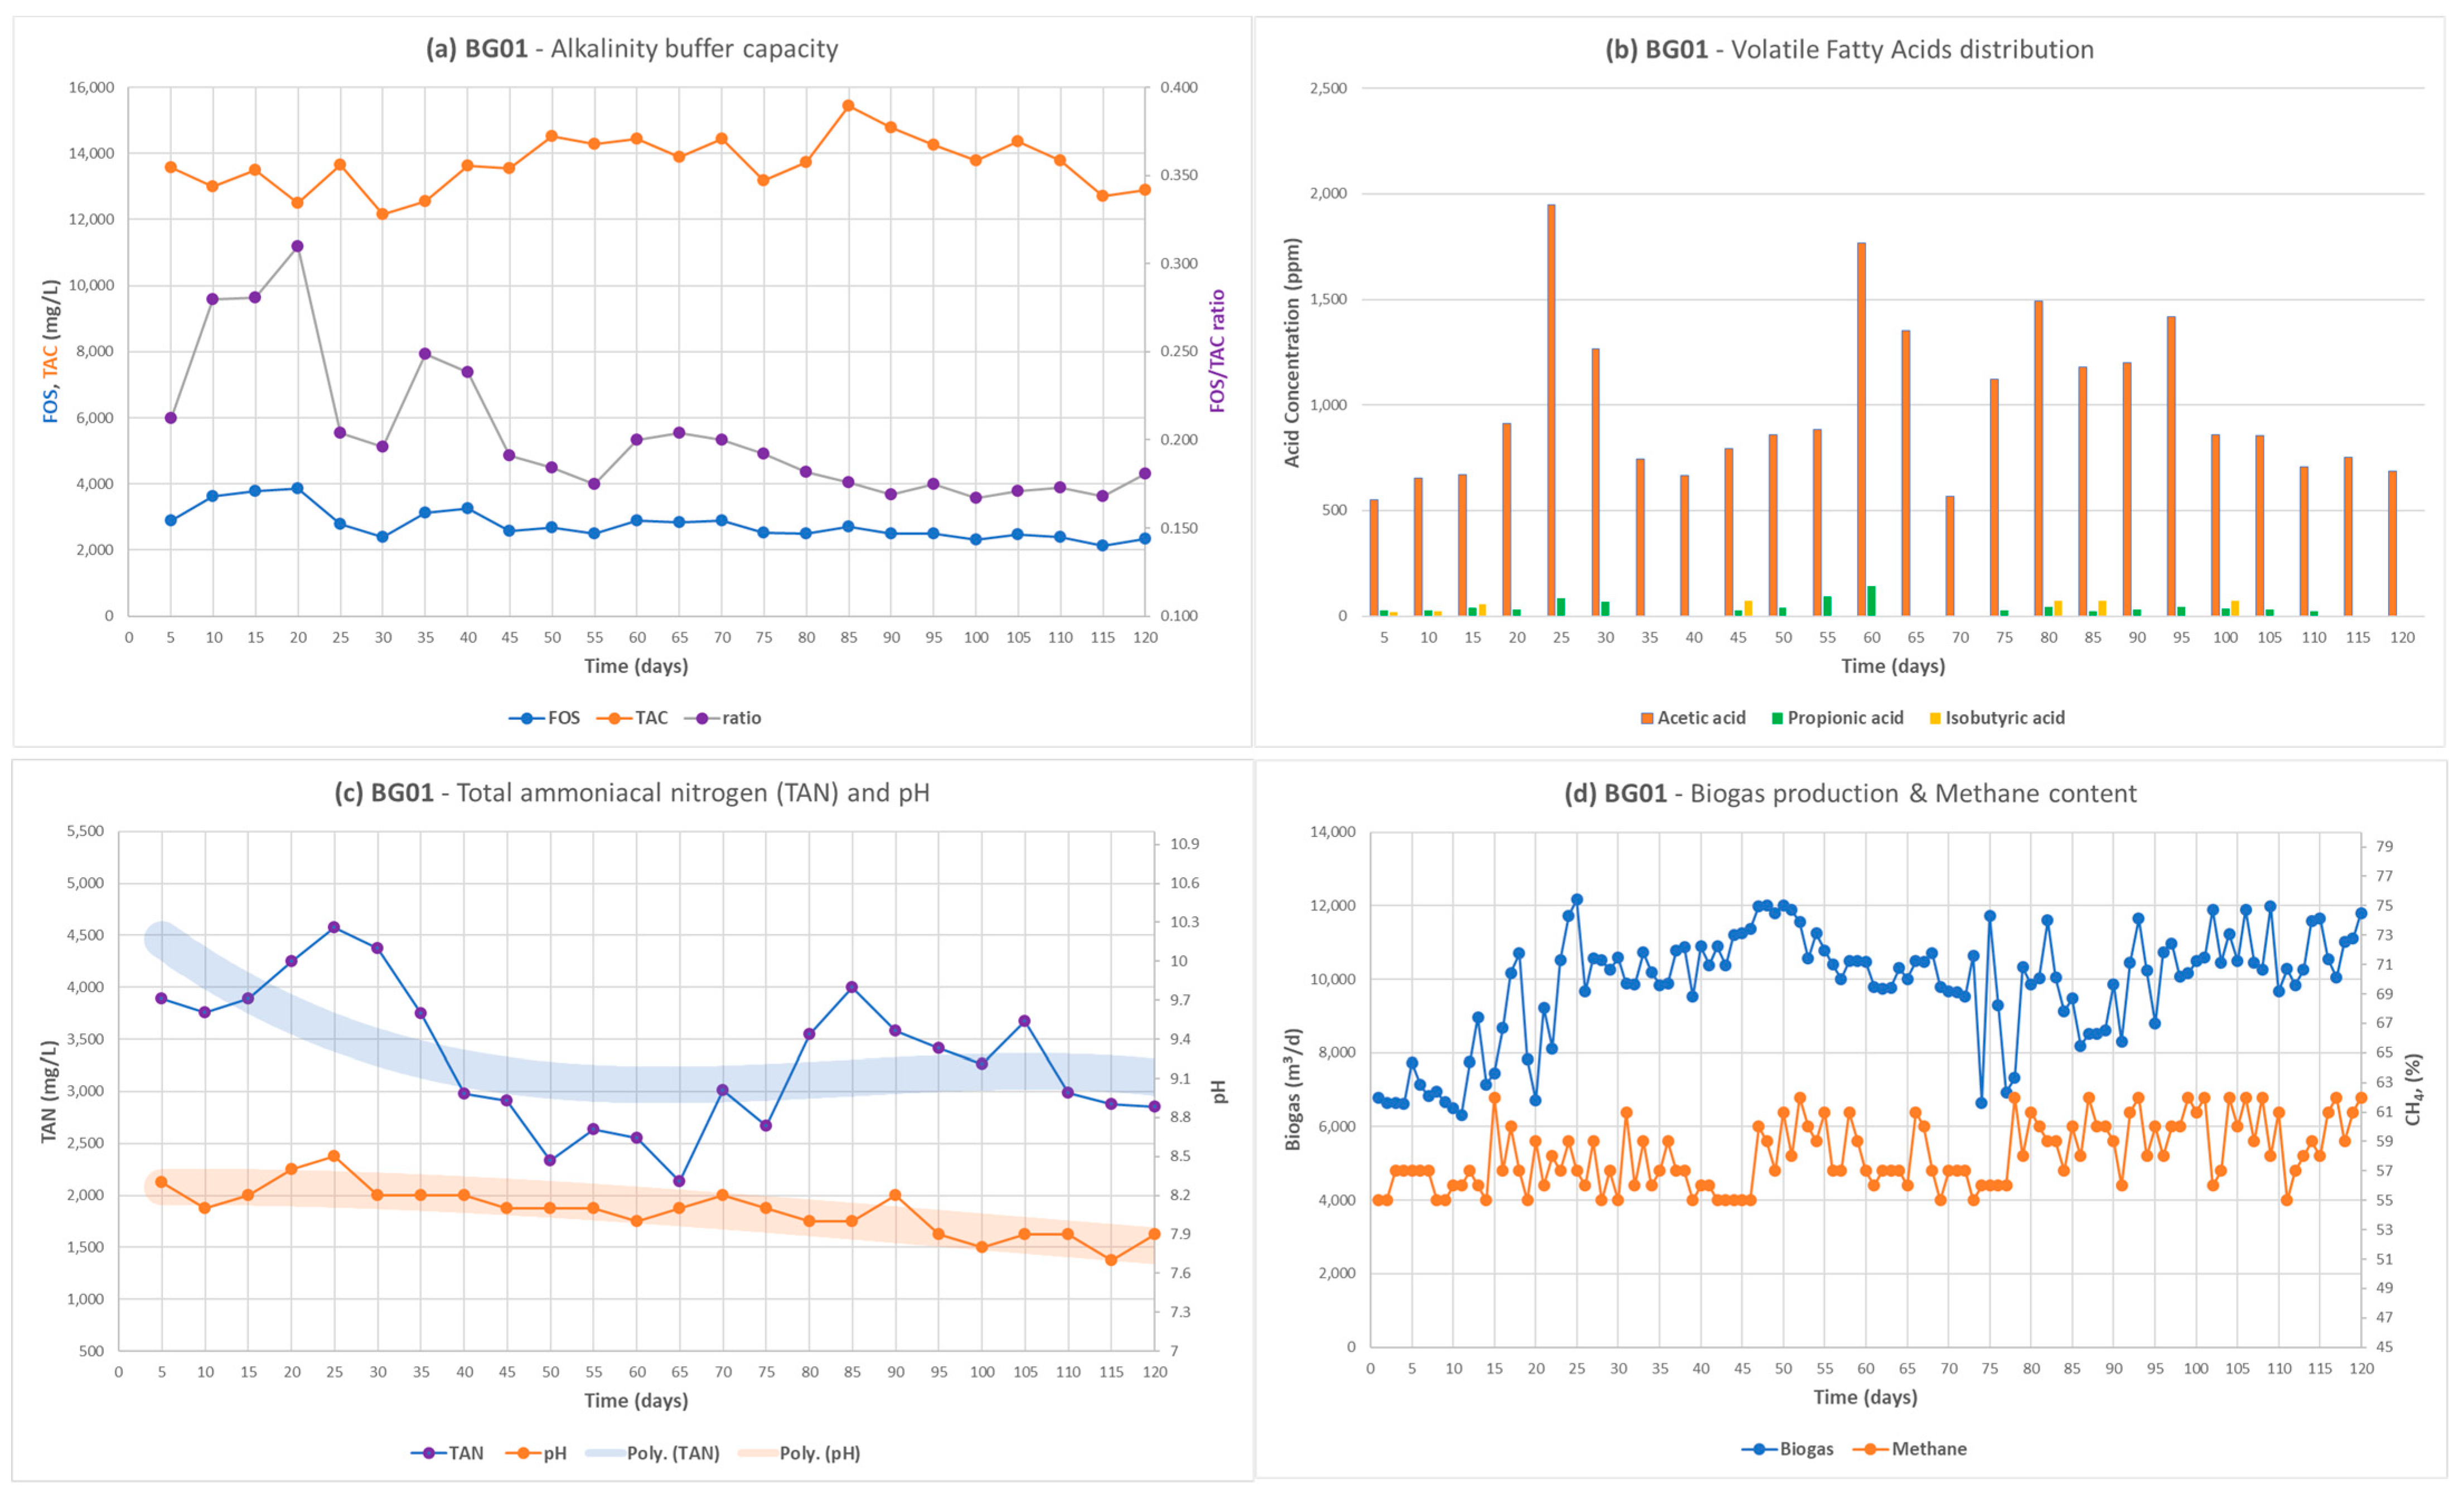
2.2. The Effect of Zeolite and Acidic Buffer Solution (Citric and Phosphoric) in Biogas Plant BG01
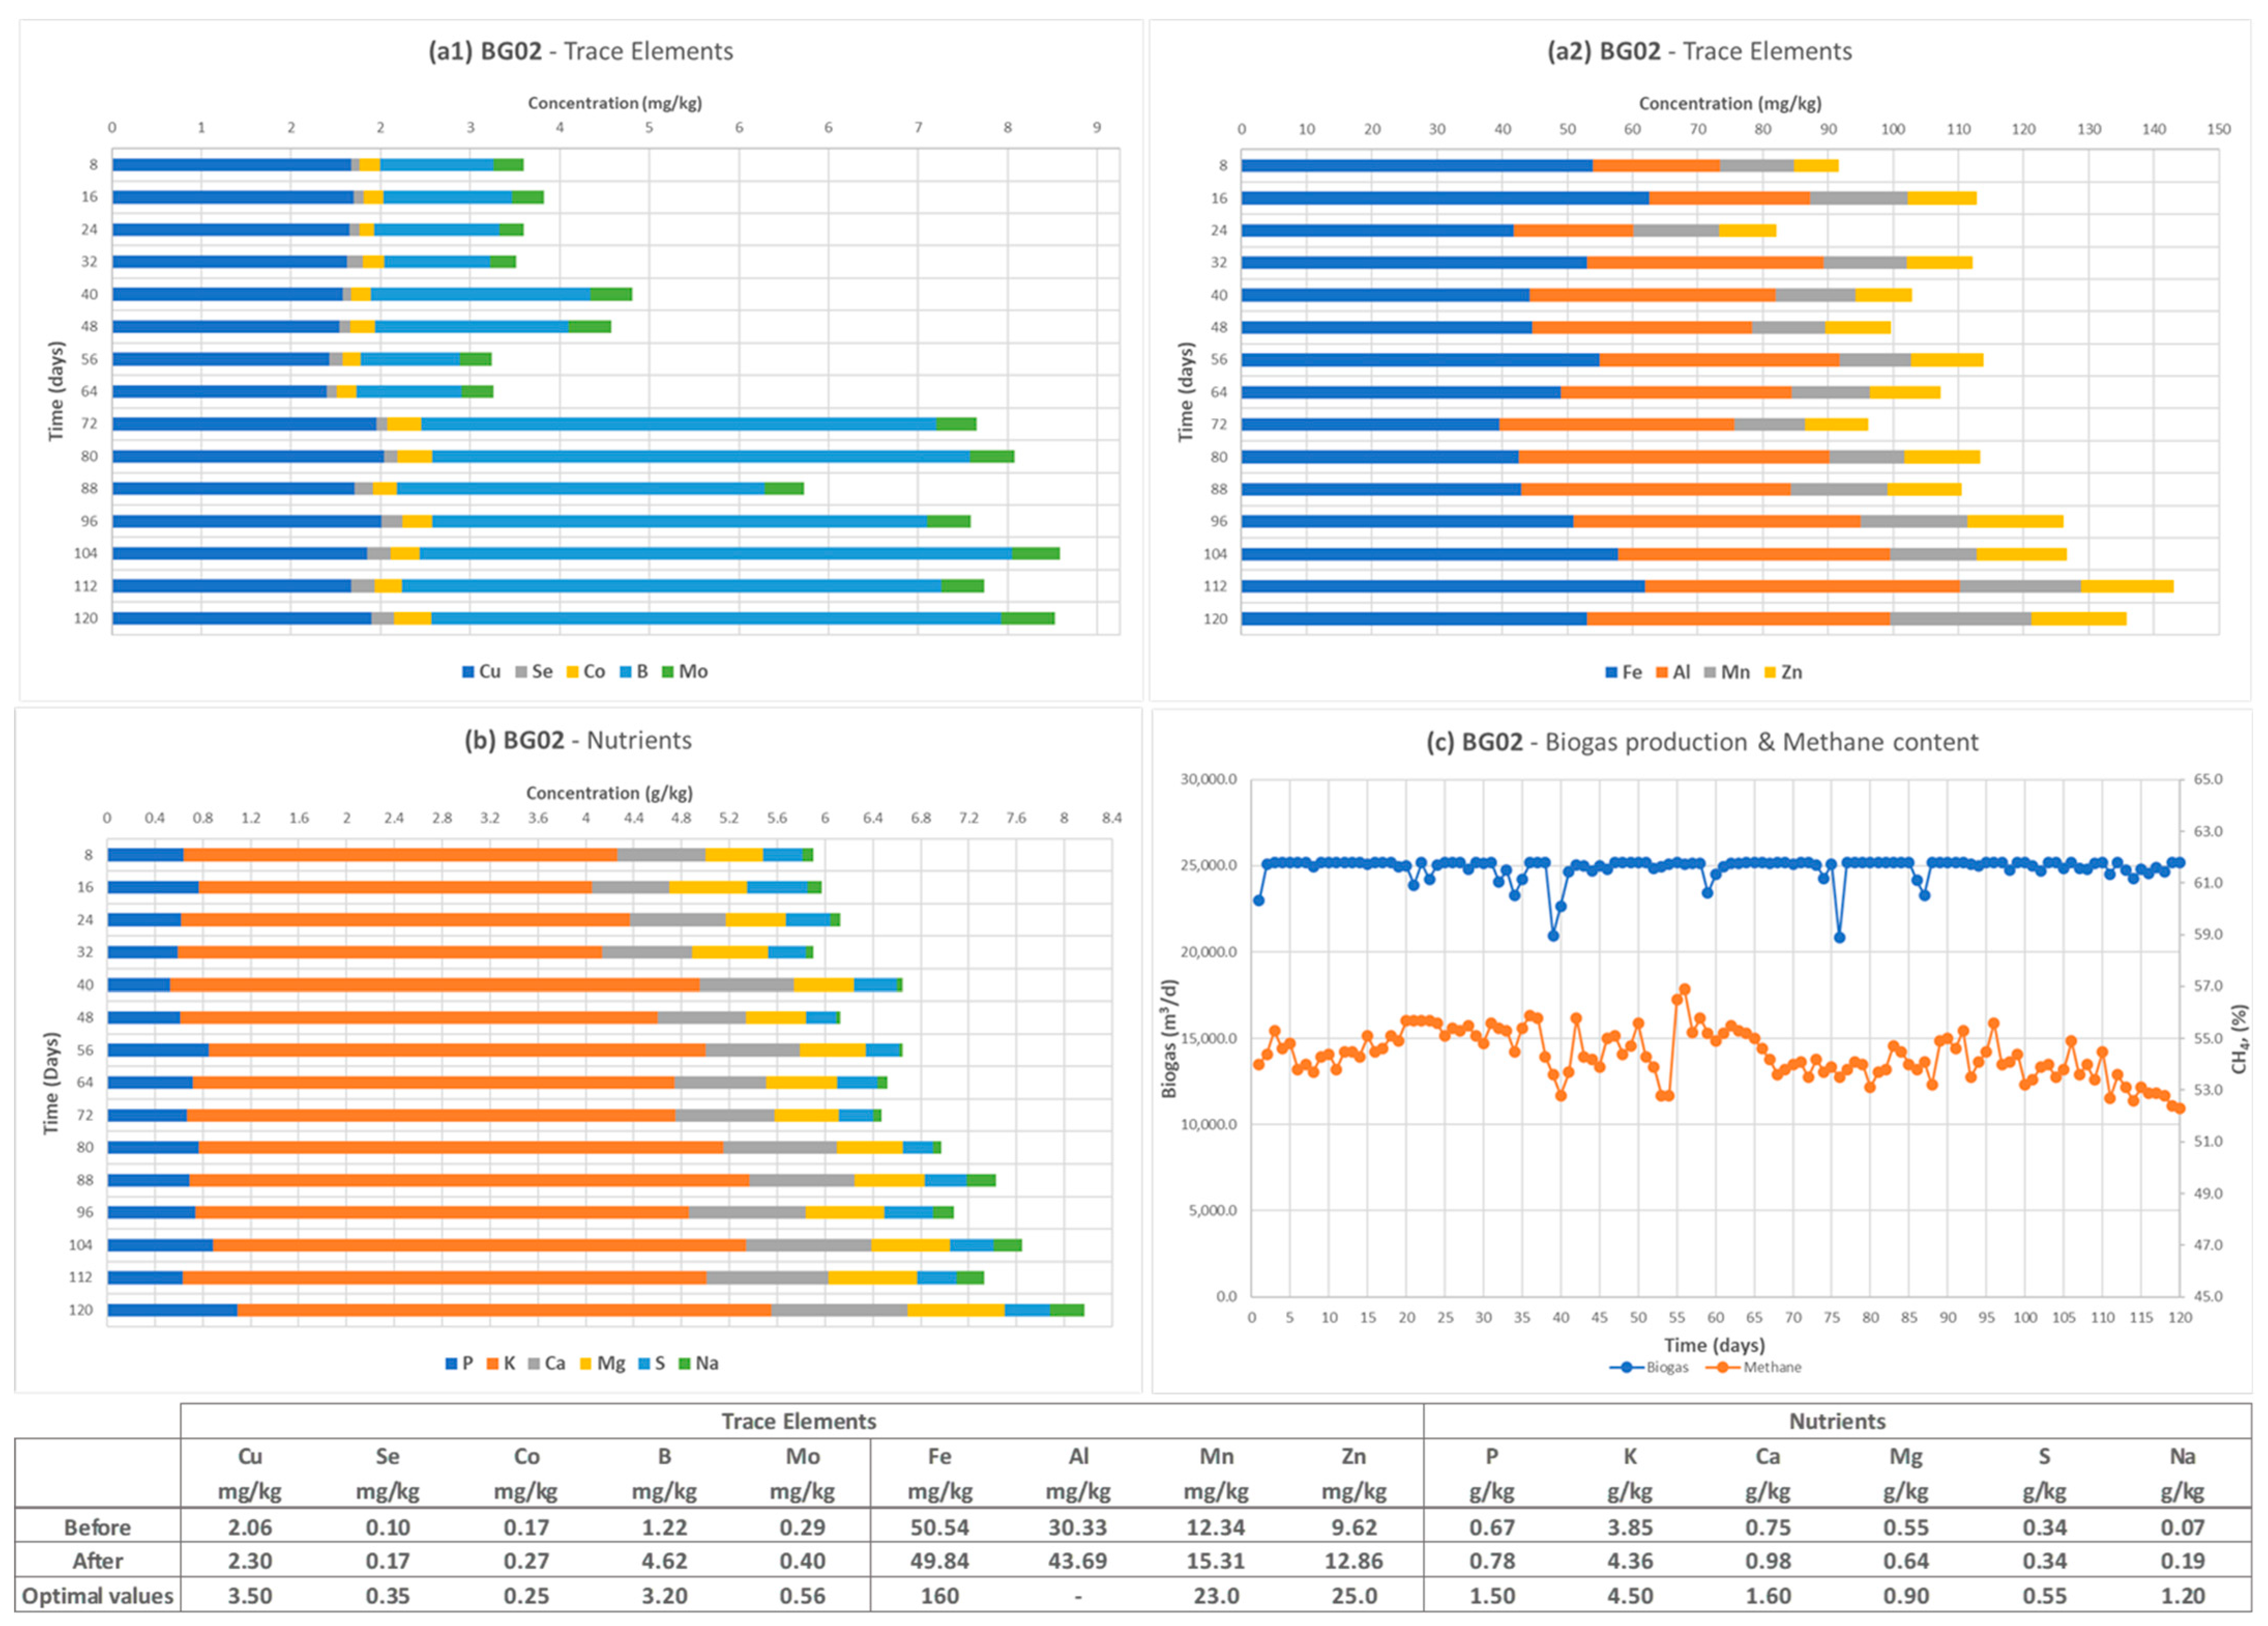
2.3. The Effect of Trace Elements in Biogas Plant BG02
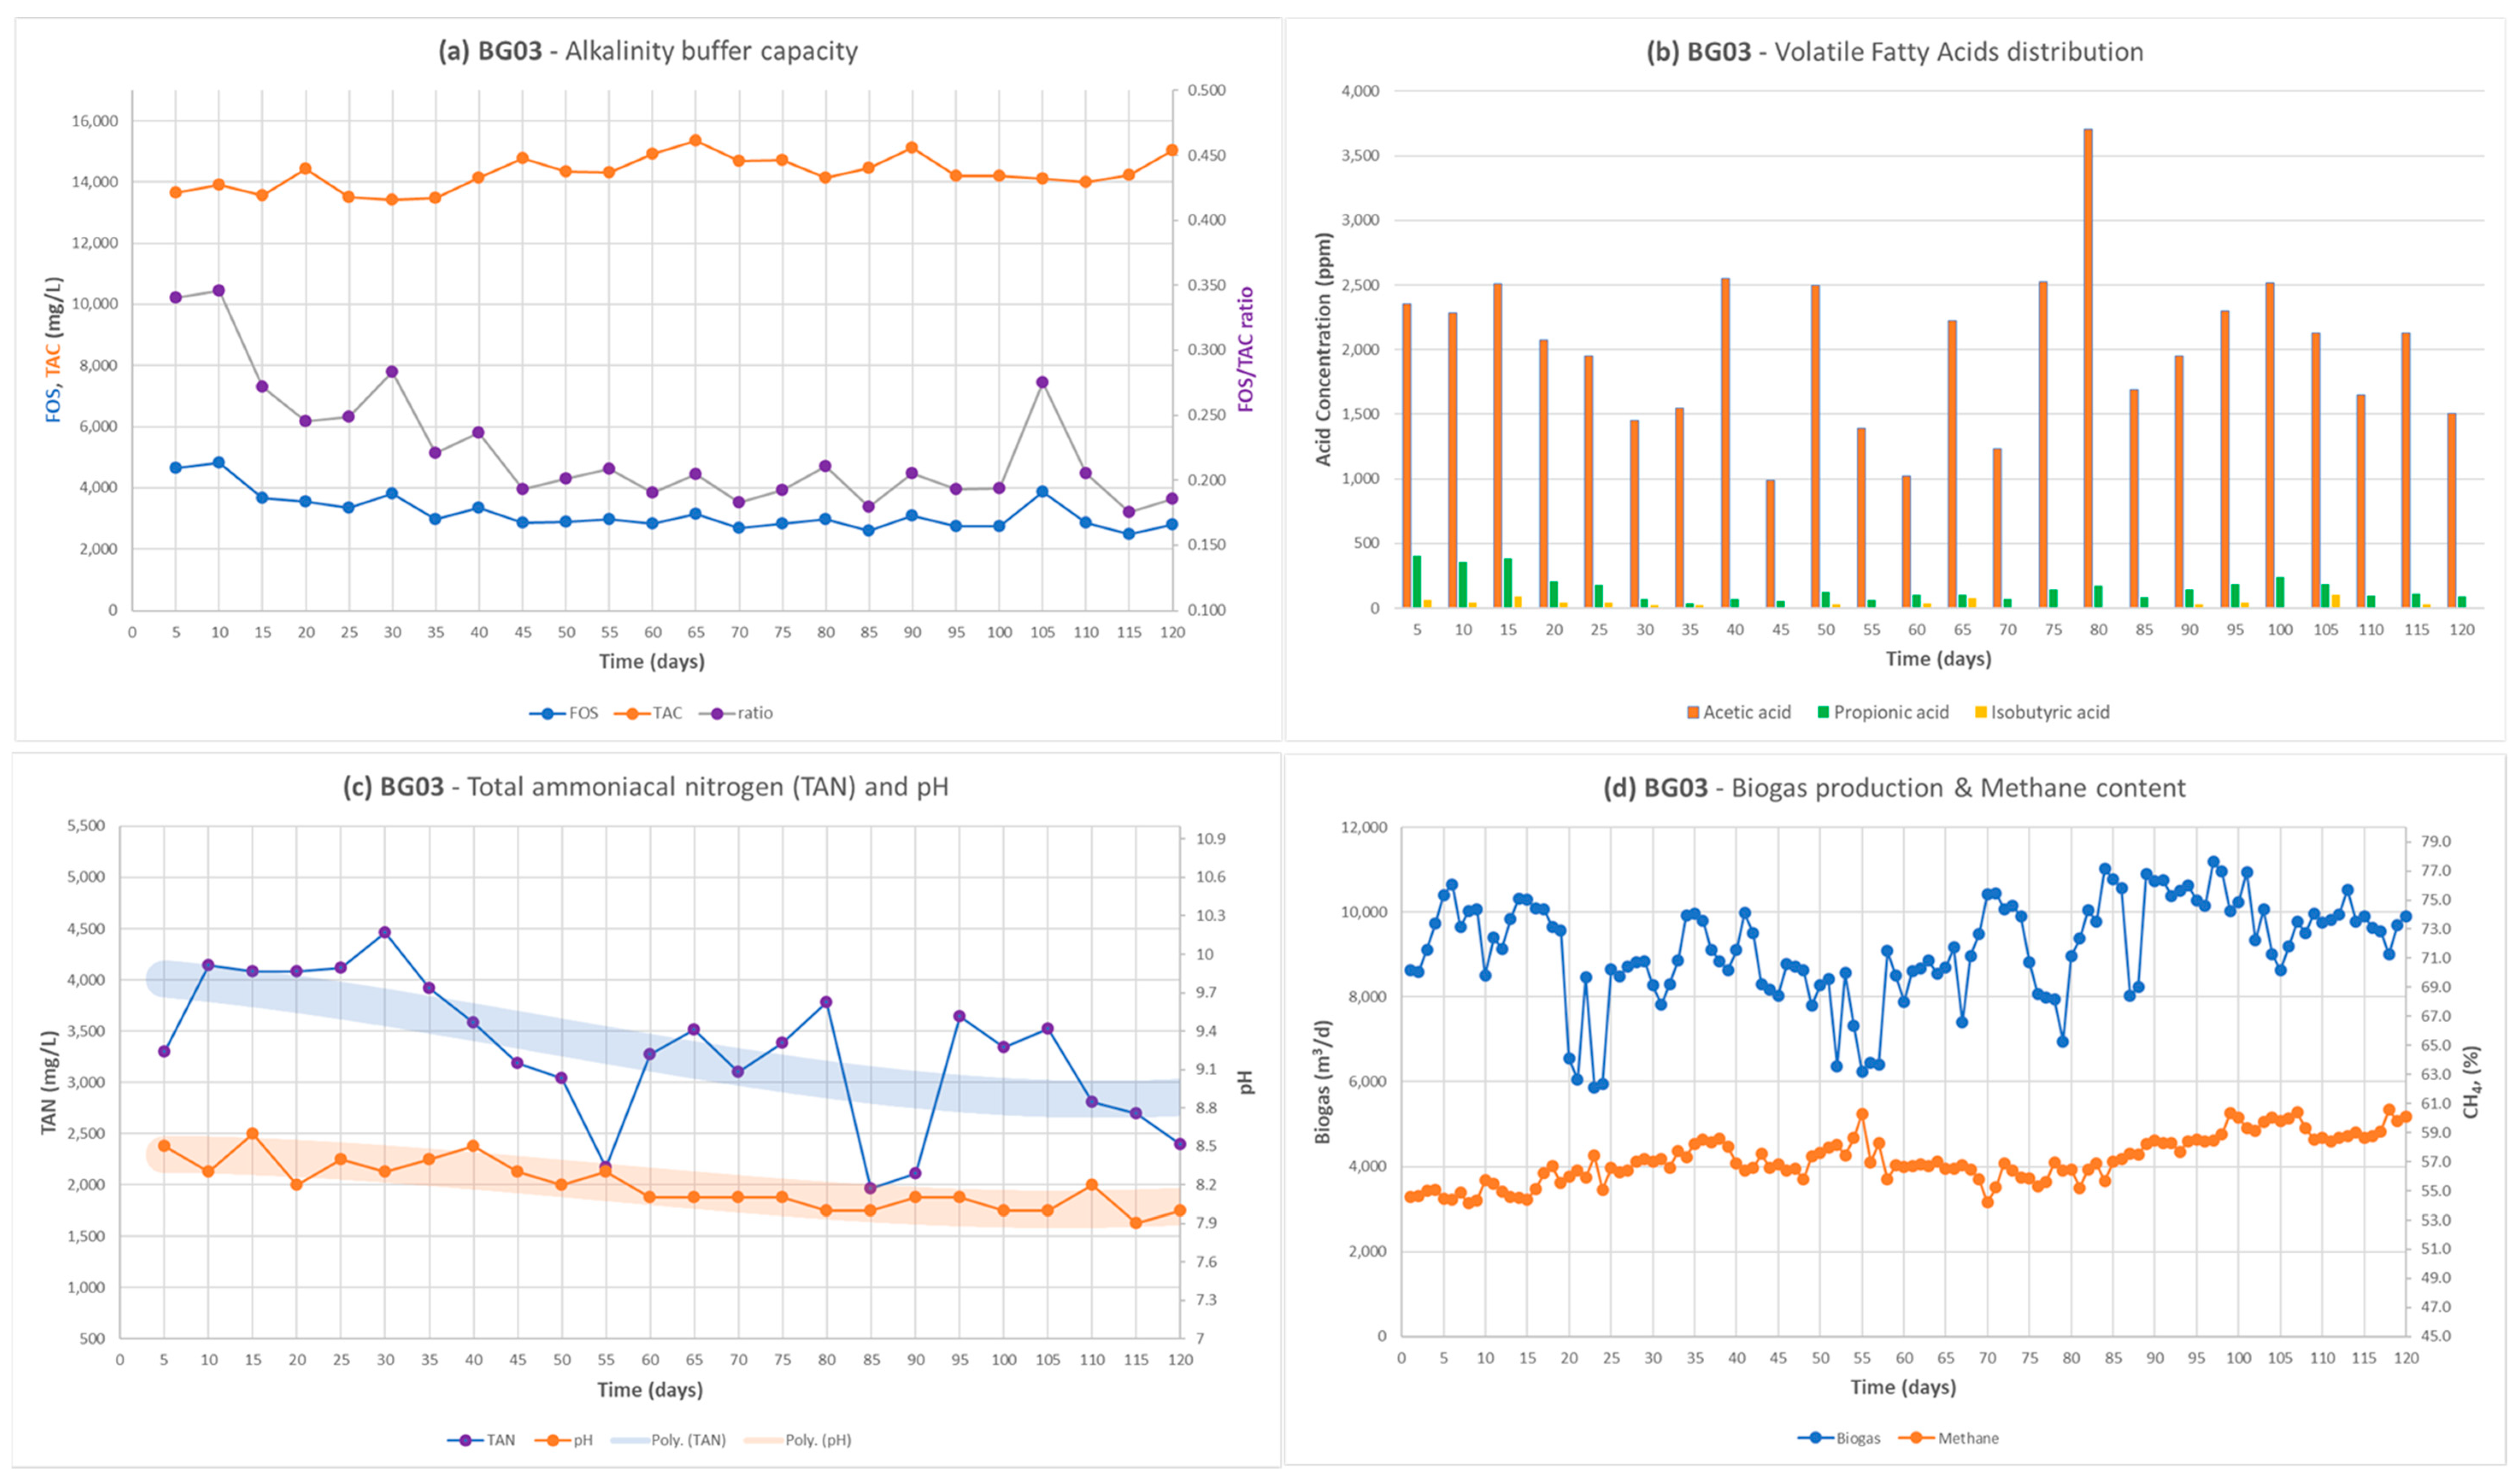
2.4. The Effect of Zeolite and Acidic Buffer Solution (Citric and Phosphoric) in Biogas Plant BG03
3. Discussion
4. Materials and Methods
4.1. Determination of Trace Elements
4.2. Determination of Moisture
4.3. Determination of Ash
4.4. Determination of Total Ammoniacal Nitrogen (TAN) Concentration by Nessler Method
4.5. Determination of FOS/TAC Ratio
4.6. Determination of Volatile Fatty Acids (VFAs)
5. Conclusions
Supplementary Materials
Author Contributions
Funding
Institutional Review Board Statement
Informed Consent Statement
Data Availability Statement
Acknowledgments
Conflicts of Interest
References
- Liu, M.; Wei, Y.; Leng, X. Improving biogas production using additives in anaerobic digestion: A review. J. Clean. Prod. 2021, 297, 126666. [Google Scholar] [CrossRef]
- Paritosh, K.; Yadav, M.; Chawade, A.; Sahoo, D.; Kesharwani, N.; Pareek, N.; Vivekanand, V. Additives as a support structure for specific biochemical activity boosts in anaerobic digestion: A review. Front. Energy Res. 2020, 8, 88. [Google Scholar] [CrossRef]
- Fugol, M.; Prask, H.; Szlachta, J.; Dyjakon, A.; Pasławska, M.; Szufa, S. Improving the energetic efficiency of biogas plants using enzymatic additives to anaerobic digestion. Energies 2023, 16, 1845. [Google Scholar] [CrossRef]
- Kelleher, B.P.; Leahy, J.J.; Henihan, A.M.; O’dwyer, T.F.; Sutton, D.; Leahy, M.J. Advances in poultry litter disposal technology—A review. Bioresour. Technol. 2002, 83, 27–36. [Google Scholar] [CrossRef]
- Clifford, C.B. EGEE 439: Alternative Fuels from Biomass Sources; Lesson 7.2; Energy Institute, The Pennsylvania State University: State College, PA, USA, 2021. [Google Scholar]
- Rasi, S.; Veijanen, A.; Rintala, J. Trace compounds of biogas from different biogas production plants. Energy 2007, 32, 1375–1380. [Google Scholar] [CrossRef]
- Wellinger, A.; Murphy, J.D.; Baxter, D. (Eds.) The Biogas Handbook: Science, Production and Applications; Elsevier: Amsterdam, The Netherlands, 2013. [Google Scholar]
- Tang, K.; Zhang, H.; Deng, J.; Wang, D.; Liu, S.; Lu, S.; Cui, Q.; Chen, C.; Liu, J.; Yang, Z.; et al. Ammonia detoxification promotes CD8+ T cell memory development by urea and citrulline cycles. Nat. Immunol. 2023, 24, 162–173. [Google Scholar] [CrossRef]
- Christou, M.L.; Vasileiadis, S.; Kalamaras, S.D.; Karpouzas, D.G.; Angelidaki, I.; Kotsopoulos, T.A. Ammonia-induced inhibition of manure-based continuous biomethanation process under different organic loading rates and associated microbial community dynamics. Bioresour. Technol. 2021, 320, 124323. [Google Scholar] [CrossRef]
- Zheng, H.; Zeng, R.J.; Angelidaki, I. Biohydrogen production from glucose in upflow biofilm reactors with plastic carriers under extreme thermophilic conditions (70 C). Biotechnol. Bioeng. 2008, 100, 1034–1038. [Google Scholar] [CrossRef]
- Rezaee, R.; Sheidary, A.; Jangjoo, S.; Ekhtiary, S.; Bagheri, S.; Kohkan, Z.; Dadres, M.; Oana Docea, A.; Tsarouhas, K.; Sarigiannis, D.A.; et al. Cardioprotective effects of hesperidin on carbon monoxide poisoned in rats. Drug Chem. Toxicol. 2021, 44, 668–673. [Google Scholar] [CrossRef]
- Li, X.; Zhang, R.; Sun, C.; Cao, W. Performance of zeolite and trace elements on biogas production from alkaline hydrogen peroxide pretreated sweet sorghum bagasse slurry. Res. Sq. 2023. preprint. [Google Scholar]
- Montalvo, S.; Guerrero, L.; Borja, R.; Sánchez, E.; Milán, Z.; Cortés, I.; Angeles de la la Rubia, M. Application of Natural Zeolites in Anaerobic Digestion Processes: A Review. Appl. Clay Sci. 2012, 58, 125–133. [Google Scholar] [CrossRef] [Green Version]
- Pérez-Pérez, T.; Correia, G.T.; Kwong, W.H.; Pereda-Reyes, I.; Oliva-Merencio, D.; Zaiat, M. Effects of the Support Material Addition on the Hydrodynamic Behavior of an Anaerobic Expanded Granular Sludge Bed Reactor. J. Environ. Sci. 2017, 54, 224–230. [Google Scholar] [CrossRef] [PubMed]
- Olympus Minerals SA, Thessaloniki. Available online: www.olympus-minerals.com (accessed on 15 April 2023).
- Takashima, M.; Speece, R.E. Mineral nutrient requirements for high-rate methane fermentation of acetate at low SRT. Res. J. Water Pollut. Control. Fed. 1989, 61, 1645–1650. [Google Scholar]
- Ortner, M.; Rameder, M.; Rachbauer, L.; Bochmann, G.; Fuchs, W. Bioavailability of essential trace elements and their impact on anaerobic digestion of slaughterhouse waste. Biochem. Eng. J. 2015, 99, 107–113. [Google Scholar] [CrossRef]
- Wang, H.; Xu, J.; Sheng, L.; Liu, X.; Zong, M.; Yao, D. Anaerobic digestion technology for methane production using deer manure under different experimental conditions. Energies 2019, 12, 1819. [Google Scholar] [CrossRef] [Green Version]
- Harirchi, S.; Wainaina, S.; Sar, T.; Nojoumi, S.A.; Parchami, M.; Parchami, M.; Varjani, S.; Khanal, S.K.; Wong, J.; Awasthi, M.K.; et al. Microbiological insights into anaerobic digestion for biogas, hydrogen or volatile fatty acids (VFAs): A review. Bioengineered 2022, 13, 6521–6557. [Google Scholar] [CrossRef]
- Atasoy, M.; Cetecioglu, Z. The effects of pH on the production of volatile fatty acids and microbial dynamics in long-term reactor operation. J. Environ. Manag. 2022, 319, 115700. [Google Scholar] [CrossRef]
- Mustapha, N.A.; Sakai, K.; Shirai, Y.; Maeda, T. Impact of different antibiotics on methane production using waste-activated sludge: Mechanisms and microbial community dynamics. Appl. Microbiol. Biotechnol. 2016, 100, 9355–9364. [Google Scholar] [CrossRef]
- Rubio, J.A.; Fdez-Güelfo, L.A.; Romero-García, L.I.; Wilkie, A.C.; García-Morales, J.L. Start-up of the mesophilic anaerobic co-digestion of two-phase olive-mill waste and cattle manure using volatile fatty. Fuel 2022, 325, 124901. [Google Scholar] [CrossRef]
- Garuti, M. I microelementi sono vitali per la digestione anaerobica. L’Informatore Agrar. 2015, 14, 61. [Google Scholar]
- Habagil, M.; Keucken, A.; Sárvári Horváth, I. Biogas production from food residues—The role of trace metals and co-digestion with primary sludge. Environments 2020, 7, 42. [Google Scholar] [CrossRef]
- Schmidt, T.; Nelles, M.; Scholwin, F.; Pröter, J. Trace element supplementation in the biogas production from wheat stillage–Optimization of metal dosing. Bioresour. Technol. 2014, 168, 80–85. [Google Scholar] [CrossRef] [PubMed]
- Li, Y.-F. An Integrated Study on Microbial Community in Anaerobic Digestion Systems. Ph.D. Thesis, The Ohio State University, Columbus, OH, USA, 2013. [Google Scholar]
- Laaber, M. Gütesiegel Biogas—Evaluierung der Technischen, Ökologischen und Sozioökonomischen Rahmenbedingungen für eine Ökostromproduktion aus Biogas. Ph.D. Thesis, University of Natural Resources and Life Sciences, Vienna, Austria, 2011. [Google Scholar]
- LfL—Bayerische Landesanstalt für Landwirtschaft. Arbeitsschwerpunkt “Regenerative Energien”—Methodik der Datenerfassung und Bewertung. 2013. Available online: http://www.lfl.bayern.de/arbeitsschwerpunkte/as_biogas/15736 (accessed on 7 March 2013).
- Weiland, P. Wichtige Messdaten für den Prozessablauf und Stand der Technik in der Praxis. In Gülzower Fachgespräche, Band 27, Messen, Steuern, Regeln bei der Biogaserzeugung; Fachagentur Nachwachsende Rohstoffe e.V.—FNR: Gülzow, Germany, 2008; pp. 17–31. [Google Scholar]
- Clemens, J. How to Optimize the Biogas Process according to Process Control Monitoring Data in Biogas Plants. 2012. Available online: http://www.biogaschina.org/index.php?id=41&cid=38&fid=23&task=download&option=com_flexicontent&Itemid=19&lang=en (accessed on 13 April 2012).
- Chen, Y.; Cheng, J.J.; Creamer, K.S. Inhibition of anaerobic digestion process: A review. Bioresour. Technol. 2008, 99, 4044–4064. [Google Scholar] [CrossRef] [PubMed]
- ISO 17294-1:2004; Water Quality—Application of Inductively Coupled Plasma Mass Spectrometry (ICP-MS)—Part 1: General Guidelines. 2004. Available online: https://www.iso.org/standard/32957.html (accessed on 22 March 2023).
- ISO 17294-2:2016; Water Quality—Application of Inductively Coupled Plasma Mass Spectrometry (ICP-MS)—Part 2: Determination of Selected Elements including Uranium Isotopes. 2016. Available online: https://www.iso.org/standard/62962.html (accessed on 22 March 2023).
- Ye, M.; Liu, J.; Ma, C.; Li, Y.; Zou, L.; Qian, G.; Xu, Z.P. Improving the stability and efficiency of anaerobic digestion of food waste using additives: A critical review. J. Clean. Prod. 2018, 192, 316–326. [Google Scholar] [CrossRef] [Green Version]
- Moset, V.; Xavier, C.D.A.N.; Feng, L.; Wahid, R.; Moller, H.B. Combined low thermal alkali addition and mechanical pre-treatment to improve biogas yield from wheat straw. J. Clean. Prod. 2018, 172, 1391–1398. [Google Scholar] [CrossRef]
- Rehakova, M.; Čuvanová, S.; Dzivak, M.; Rimár, J.; Gaval’Ová, Z. Agricultural and agrochemical uses of natural zeolite of the clinoptilolite type. Curr. Opin. Solid State Mater. Sci. 2004, 8, 397–404. [Google Scholar] [CrossRef]
- Methodo Chemicals, Via A.M. Ampère, 19/21/33, 42017 Novellara (RE)—Italy. Available online: https://www.methodochemicals.com/eng/company/methodo-chemicals (accessed on 15 April 2023).
- Lipps WC BTBHE. 3125 Metals by Inductively Coupled Plasma-Mass Spectrometry. In Standard Methods for the Examination of Water and Wastewater; American Public Health Association: Washington, DC, USA, 2018. [Google Scholar]
- Determination of FOS/TAC Value in Biogas Reactors, Based on the Nordmann Method. Available online: https://www.hach.com/asset-get.download.jsa?id=29641556309 (accessed on 15 April 2023).


| Biogas Plant | BG01 | BG02 | BG03 |
|---|---|---|---|
| Electrical Power Capacity | 1 MW | 2 MW | 1 MW |
| Pre-tank | 350 m3 | 550 m3 | 290 m3 160 m3 |
| Daily Supply | 100 tn/d: cow slurry | 79 tn/d: corn silage | 1 tn/d: cow manure |
| 20 tn/d: olive mill waste | 4 tn/d: glycerol | 90 tn/d: cow slurry | |
| 20 tn/d: cheese whey | 17 tn/d: chicken manure | ||
| 15 tn/d: corn silage | 45 tn/d: waste residues | 3 tn/d: vegetable residue | |
| First, 20 tn/d: chicken manure Then, 5 tn/d: chicken manure and 15 tn: sheep manure | 30 tn/d: cheese whey | ||
| 1.5 tn/d: corn silage | |||
| Feeding Rate | 8.1 tn/h | 2.3 tn/30 min | 5.9 tn/h |
| 1st Digester (D1) | 4000 m3 | 4000 m3 | 5130 m3 |
| Temperature | 37 °C | 45 °C | 40–42 °C |
| HRT | 21 days | 31 days | 36 days |
| Stirring | 45 min | Constantly | 30 min |
| 2nd Digester (D2) | 4000 m3 | 2.800 m3 | 2300 m3 |
| Temperature | 40 °C | 39.5 °C | 54–56 °C |
| HRT | 21 days | 22 days | 17 days |
| Recirculation of Digested Residue | No | Yes | No |
| Biogas Plant | Additive | Quantity | Frequency | Period |
|---|---|---|---|---|
| BG01 | Zeolite | 8.4 tn | 500 kg/day for 6 days, and 100 kg/day for 54 days | 60 days |
| Buffer solution | 25 kg citric acid and 100 lt phosphoric acid 5% v/v | Every 5 days | ||
| BG02 | Trace Elements mixture | 5 kg | Weekly | 60 days |
| BG03 | Zeolite | 8.4 tn | 500 kg/day for 6 days, and 100 kg/day for 54 days | 60 days |
| Buffer Solution | 25 kg citric acid and 100 lt phosphoric acid 5% v/v | Every 5 days |
Disclaimer/Publisher’s Note: The statements, opinions and data contained in all publications are solely those of the individual author(s) and contributor(s) and not of MDPI and/or the editor(s). MDPI and/or the editor(s) disclaim responsibility for any injury to people or property resulting from any ideas, methods, instructions or products referred to in the content. |
© 2023 by the authors. Licensee MDPI, Basel, Switzerland. This article is an open access article distributed under the terms and conditions of the Creative Commons Attribution (CC BY) license (https://creativecommons.org/licenses/by/4.0/).
Share and Cite
Economou, E.A.; Dimitropoulou, G.; Prokopidou, N.; Dalla, I.; Sfetsas, T. Anaerobic Digestion Remediation in Three Full-Scale Biogas Plants through Supplement Additions. Methane 2023, 2, 265-278. https://doi.org/10.3390/methane2030018
Economou EA, Dimitropoulou G, Prokopidou N, Dalla I, Sfetsas T. Anaerobic Digestion Remediation in Three Full-Scale Biogas Plants through Supplement Additions. Methane. 2023; 2(3):265-278. https://doi.org/10.3390/methane2030018
Chicago/Turabian StyleEconomou, Eleni Anna, Georgia Dimitropoulou, Nikoleta Prokopidou, Ioanna Dalla, and Themistoklis Sfetsas. 2023. "Anaerobic Digestion Remediation in Three Full-Scale Biogas Plants through Supplement Additions" Methane 2, no. 3: 265-278. https://doi.org/10.3390/methane2030018