Article

The Effects of Using Evogen Biogas Additive on the Microbiome and Performance of Full-Scale Biogas Plant

QLAB Private Company, Research & Development, Quality Control and Testing Services, 57008 Thessaloniki, Greece
*
Author to whom correspondence should be addressed.
Methane 2023, 2(3), 329-343; https://doi.org/10.3390/methane2030022
Submission received: 10 July 2023 / Revised: 9 August 2023 / Accepted: 28 August 2023 / Published: 3 September 2023
(This article belongs to the Special Issue Anaerobic Digestion Process: Converting Waste to Energy)

Abstract

:
Biogas production from organic waste is a promising renewable energy source, but achieving optimal production and digester stability can be challenging. This study investigated the impact of the Evogen microbial additive on biogas production and digester status in two biogas plants (BG01 and BG02). Microbial abundance and physicochemical parameters were analyzed to assess the effects. The results show distinct microbial community shifts in Evogen-treated digesters, with increased abundance of methanogenic archaea and hydrolytic bacteria, indicating improved anaerobic digestion. Evogen supplementation positively influenced digester performance, as evidenced by higher alkalinity buffer capacity (FOS/TAC ratios), indicating enhanced acidification and methanogenesis, along with reductions in total solids and volatile solids, demonstrating improved organic matter degradation. Evogen-treated digesters exhibited significantly higher biogas production and improved process stability, as indicated by volatile fatty acids (VFAs) profiling. The dominance of Firmicutes, Synergistetes, Proteolytic Bacteroidetes and Actinobacteria highlighted their roles in substrate degradation and VFA production. The findings contribute to optimizing biogas production systems and understanding complex microbial interactions within anaerobic digesters. The addition of Evogen influenced microbial community composition and dynamics, potentially altering substrate utilization, metabolic interactions and overall community structure.

1. Introduction

Biogas, a renewable energy source (RES) that is produced through anaerobic digestion (AD) of organic matter in biogas plants is a mixture of methane and carbon dioxide [1]. These plants can utilize a wide range of feedstocks, including agricultural waste, food waste and sewage sludge, making them a versatile and sustainable energy option [2]. However, biogas plants face several challenges that can hinder their efficiency and effectiveness. One major issue is the variation in feedstock quality and quantity, which can lead to fluctuations in biogas production [3]. Additionally, the presence of toxic compounds or the accumulation of other compounds can lead to operational problems and reduced output [4]. To ensure the optimal functioning of biogas plants, it is essential to address these challenges and develop strategies for improving their performance.
In addition to the challenges posed by varying feedstock quality and toxicity, biogas plants can also face a range of operational problems that can impact their efficiency and profitability. One common issue is the high solid content in the digester, which can reduce biogas production and damage equipment [5]. Inadequate mixing or agitation of the feedstock can also lead to uneven digestion and reduced gas output [6]. Another problem is the accumulation of hydrogen sulfide and other corrosive compounds in the biogas, which can damage pipelines and other components of the system [7] and reduce at the same time significant bacterial populations as it is toxic like gaseous ammonia. Additionally, biogas plants can experience issues related to odor control, as the breakdown of organic matter can release unpleasant odors that can be a nuisance for nearby communities [8]. Addressing these operational problems requires careful monitoring and maintenance of the system, as well as the implementation of effective control measures to prevent or mitigate issues as they arise [9,10].
The use of biogas additives has gained increasing attention as a means of improving the efficiency and effectiveness of full-scale biogas plants [11,12]. Biogas additives are substances that are added to the feedstock or the digester to enhance the performance of the system [13]. These additives can address various challenges associated with biogas plant management, including poor feed quality, recalcitrant biomass and volatile fatty acids (VFAs) accumulation. By optimizing the conditions within the digester, biogas additives can help to increase biogas production, reduce operational problems and improve overall plant performance [14,15].
One of the primary challenges facing biogas plants is the variability in feedstock quality, which can impact the availability of micronutrients and other essential components for microbial digestion [11]. Biogas additives can address this problem by providing a source of these nutrients, which can help to maintain the stability of the microbial community and enhance biogas production [16]. Additionally, the use of additives such as enzymes and acids can improve the hydrolysis of recalcitrant biomass, such as silage and corn, which can be difficult to digest through microbial action alone [15,17].
Other operational problems that can be resolved through the use of biogas additives include VFA accumulation, acetate inhibition, H2 partial pressure, H2S accumulation, NH3 accumulation, temperature and heavy metal toxicity [11,18]. For example, the addition of acidic buffer solutions or alkaline agents can help to maintain the pH balance within the digester, reducing the accumulation of VFAs and preventing acetate inhibition [19,20]. Similarly, the use of bioaugmentation agents can help to optimize the microbial community, reducing the accumulation of H2S and other problematic compounds [21]. To address these challenges, biogas plants can benefit from the use of microbial additives, which can optimize the microbial community and enhance biogas production [22]. These additives can be chemical or biological in nature and can improve the stability and efficiency of the biogas production process [13,16,19].
Bioaugmentation involves the addition of specific microorganisms to the digester to enhance the performance of the system [23,24,25] or to increase the population of a species or even a family. These microorganisms can be selected for their ability to degrade specific types of organic matter or to improve the overall efficiency of the microbial community. Bioaugmentation can be achieved by adding microbial cultures, microbial consortia, or microbial enzymes, or the selective/favored cultivation of dominant species [26,27]. By introducing these microorganisms into the digester, biogas plants can optimize the microbial community and improve biogas production.
Another approach to biogas plant management is the use of multifunctional additives, such as a combination of mineral-based powder carrier and Bacillus microorganisms; the Evogen biogas additive (Evogen) [28]. These additives can help to enhance biogas production by improving the hydrolysis of complex organic compounds and optimizing the microbial community [13]. Zeolites are natural minerals that have a high surface area and can absorb and release water, making them effective carriers for microbial additives [29]. By binding microbial cultures to zeolite particles, Evogen can improve the survival and performance of the microorganisms in the digester [28]. This approach can help to reduce the accumulation of problematic compounds, such as H2S and improve the overall efficiency of the biogas production process [29].
This study investigated the yields of two full-scale biogas plants, the microbiome alternations and the physicochemical characteristics’ variations when using the multifunctional additive, zeolite-bound Bacilli. Specifically, we investigated the performance of two biogas plants (BG01 and BG02) with the Evogen biogas additive, analyzing physicochemical parameters and microbial community dynamics. We seek to understand the impact of Evogen on biogas production and provide results for the first time concerning this biogas additive in order to explore potential optimizations for sustainable energy generation.

2. Results

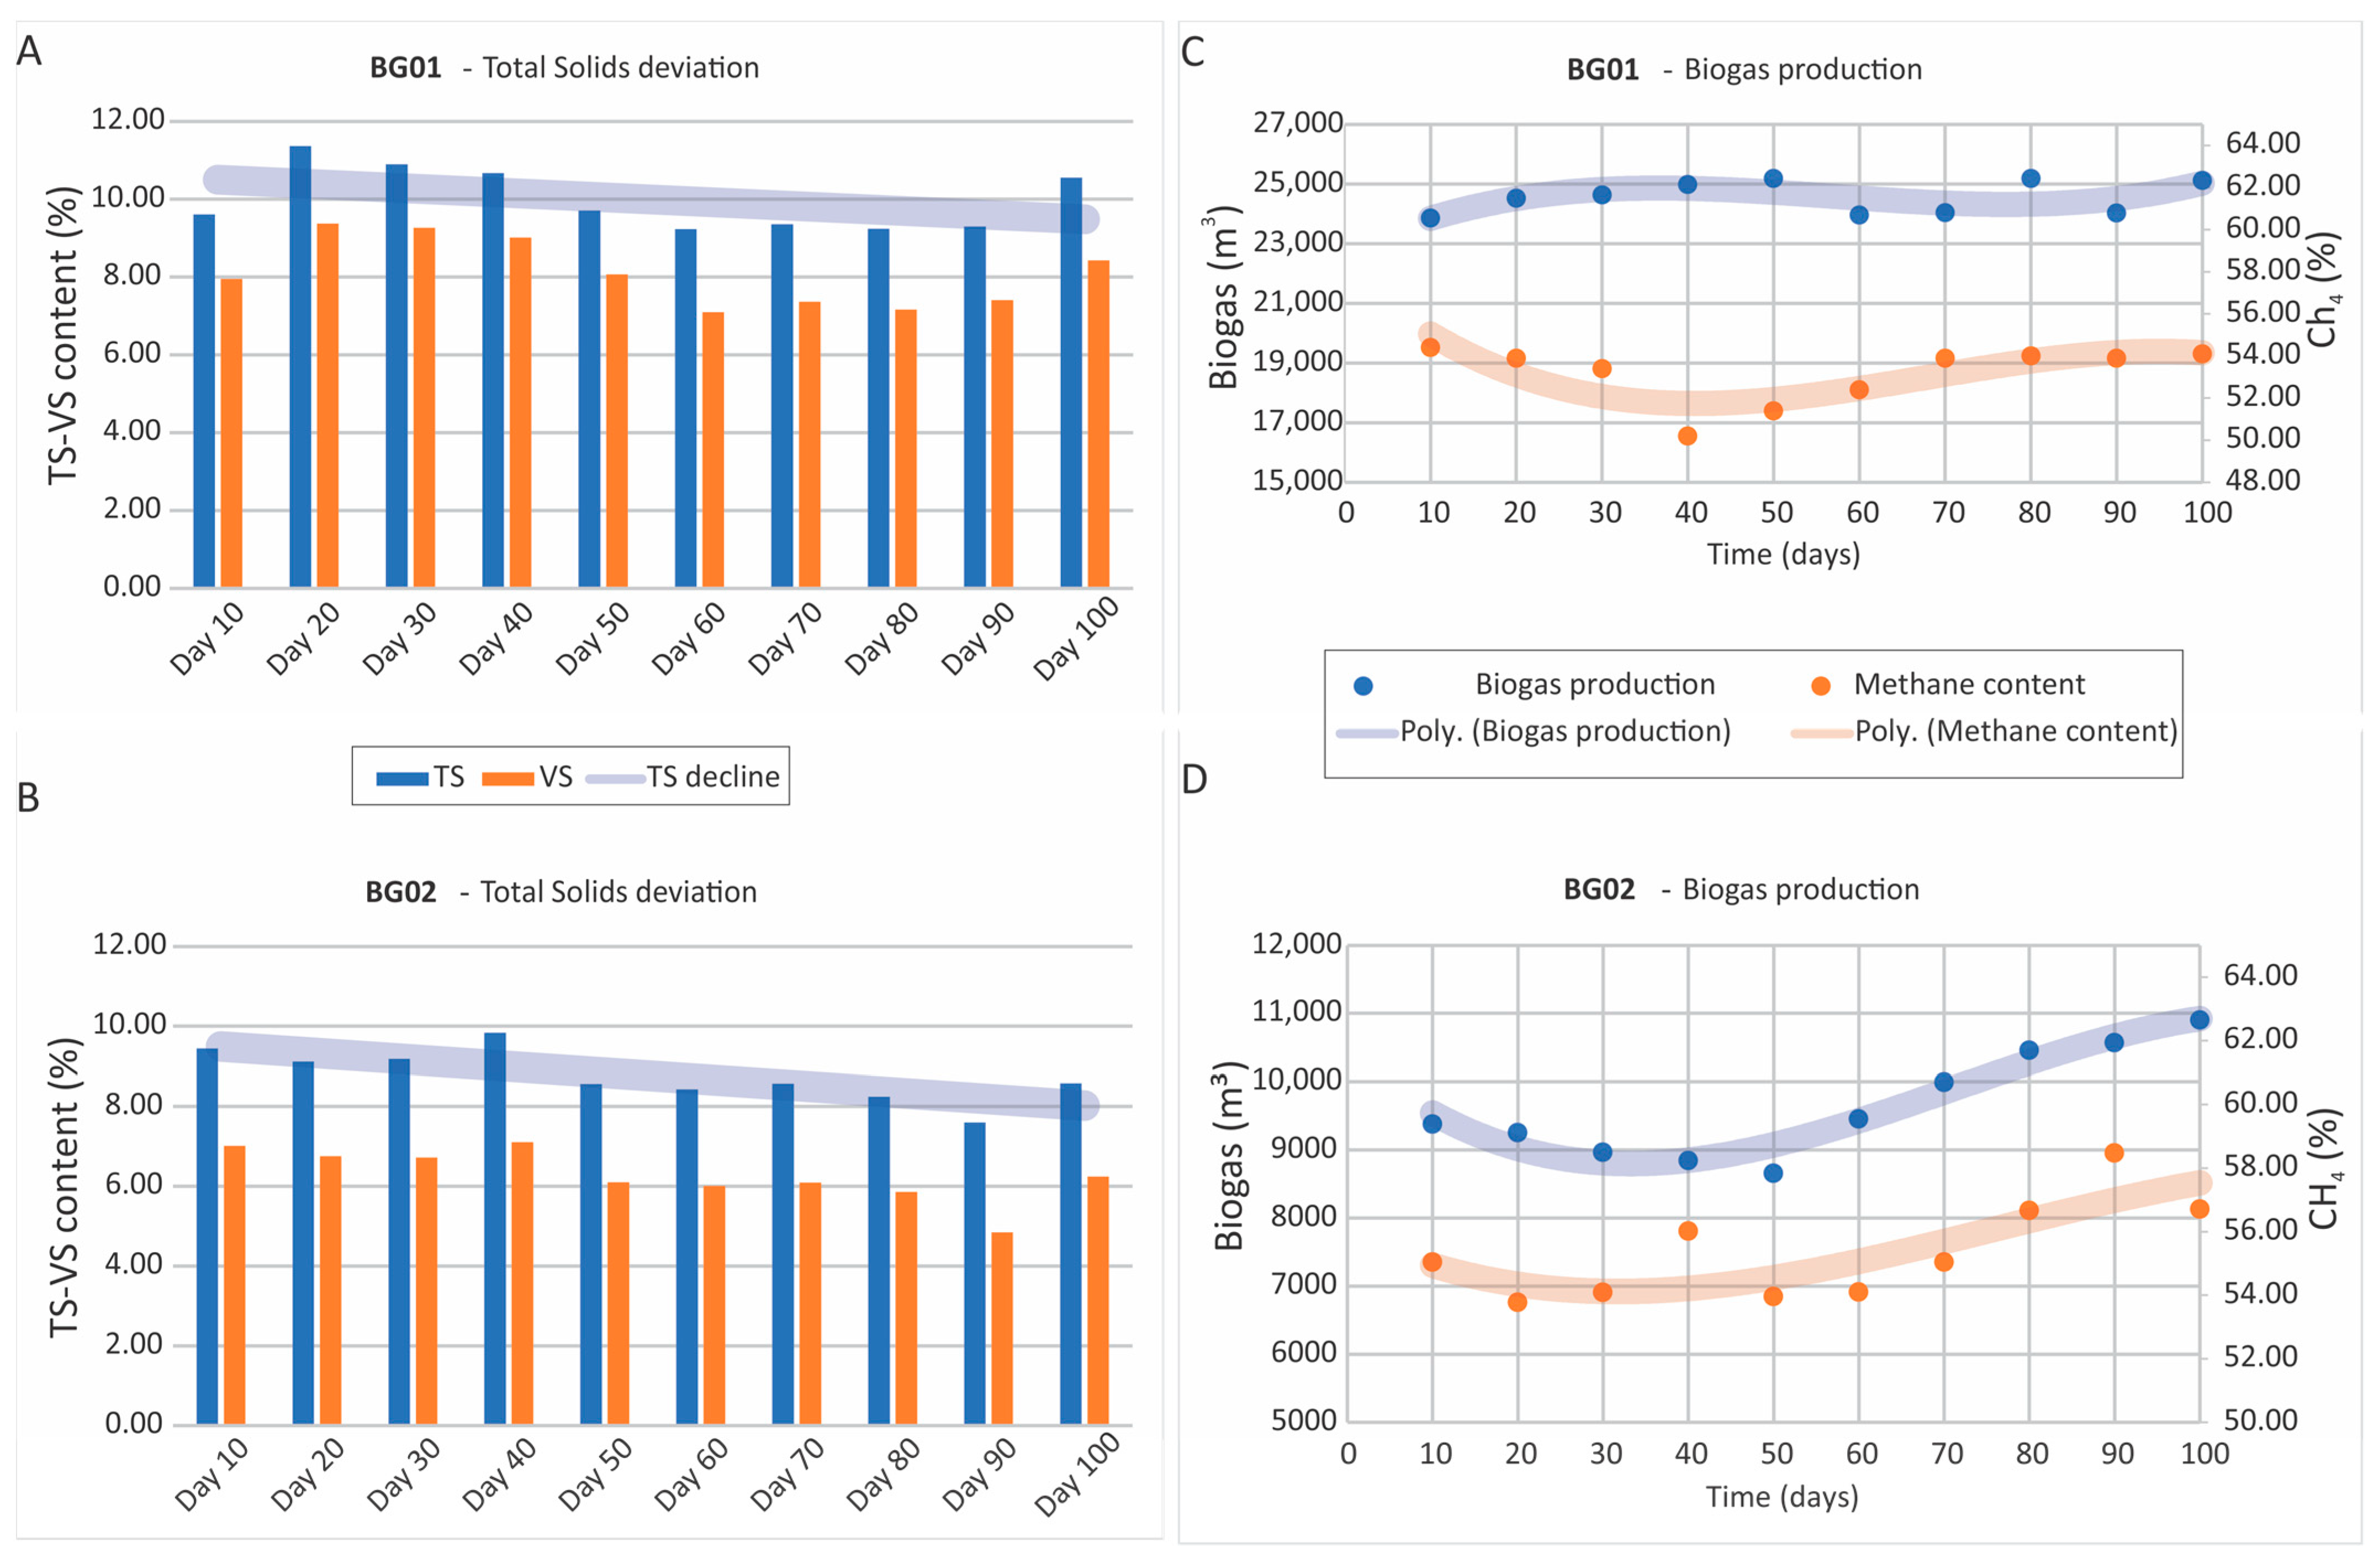
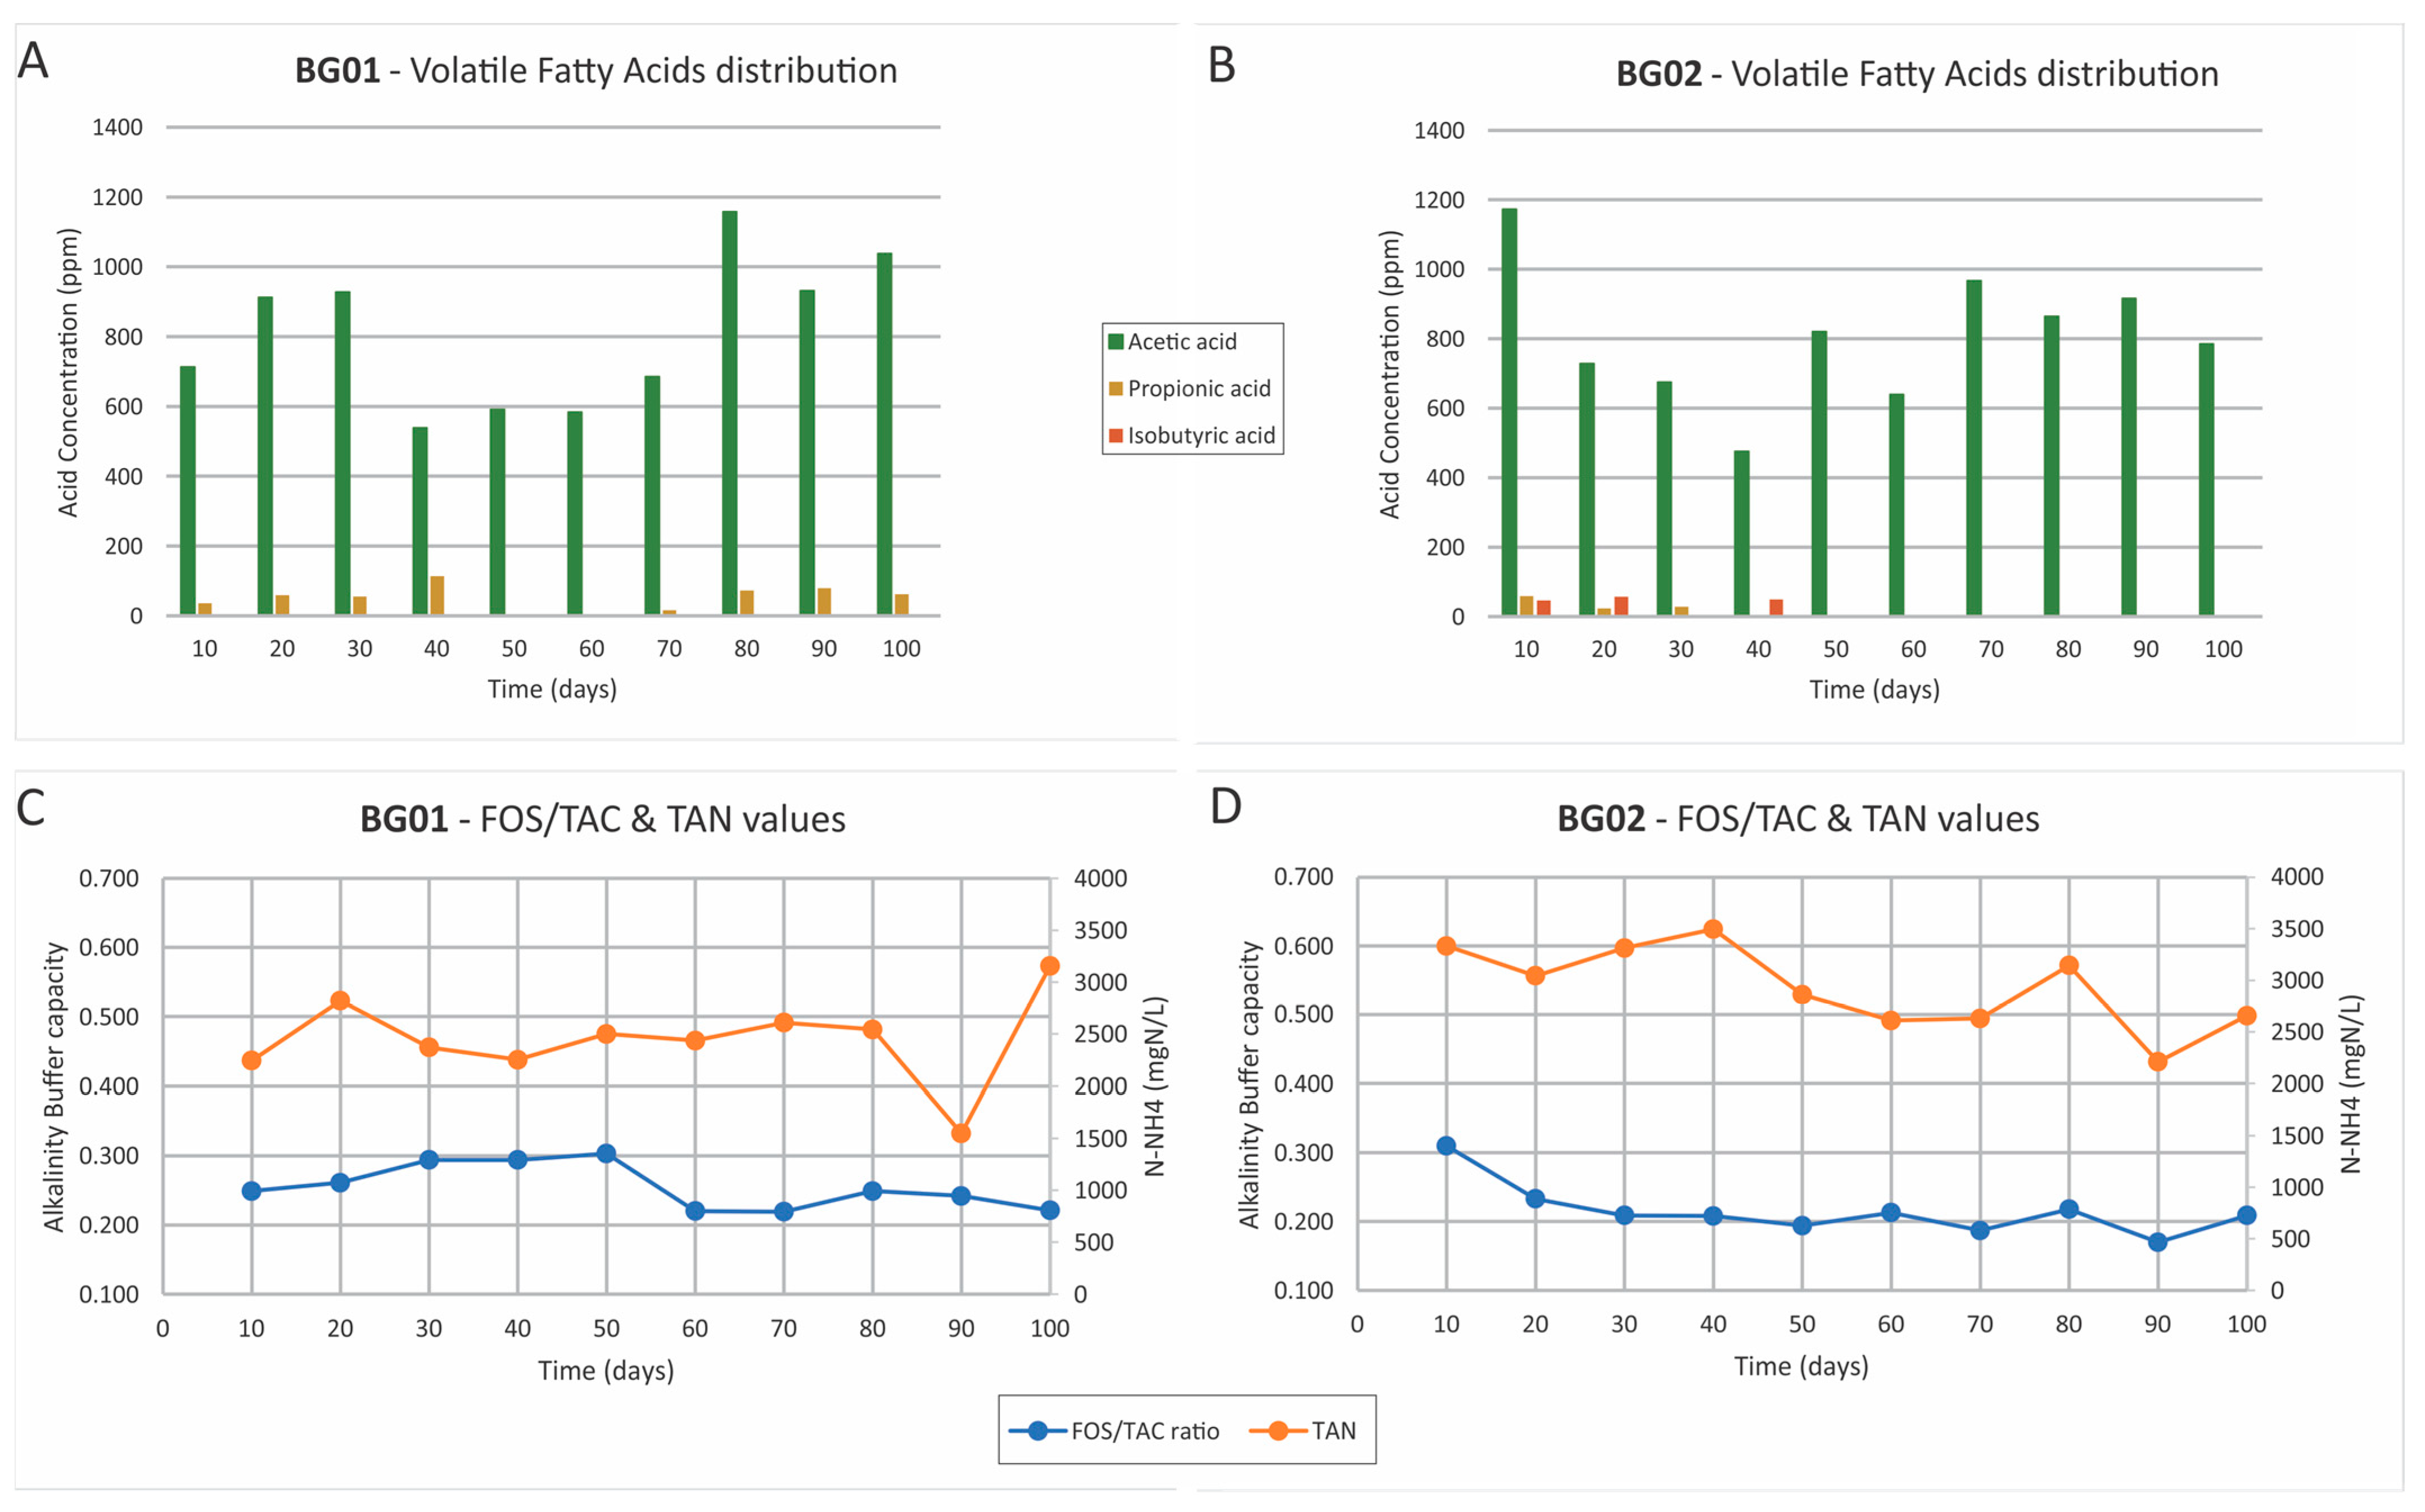
2.1. Physicochemical Results during Additive Administration

Biogas plants are vital for sustainable energy production as they convert organic waste into biogas through anaerobic digestion. The performance and efficiency of biogas plants can be influenced by various parameters and the addition of specific additives. In this study, we analyzed several parameters, including pH, FOS or volatile fatty acids (VFAs), TAC or total inorganic carbon, FOS/TAC ratio (alkalinity buffer capacity), total solids (TSs), volatile solids (VSs), theoretical gas yield estimation, methane and ammonium nitrogen (N-NH4+), for two different biogas plants (BG01 and BG02) and their respective additives (Table 1).
BG01 plant had an alkaline pH in digester D1 during the monitoring period before the introduction of Evogen, with an average value of 8.3, despite the fact that the main component of feedstock is silage, which is acidic (pH of 4.0). FOS values ranged from 1178 to 2339, with an average of 1830 mg/L, while the TAC values ranged from 4005 to 8652, with an average of 6629 mg/L (Table 1). TS content had an average of 10.45% and vs. had an average content of 8.74% for the monitoring period prior to the biogas supplement addition.
The BG02 plant had an alkaline pH in digester D1 during the monitoring period before the Evogen introduction with an average value of 8.1. FOS values ranged from 2368 to 4451 with an average of 3244.8 mg/L, while the TAC values ranged from 11,591 to 16,531 with an average of 13,946.2 mg/L (Table 1). High values of TAC are justified by chicken manure employed as raw material in the feedstock limiting the FOS/TAC ratio in low levels. TS content had an average of 9.22 % and vs. had an average content of 6.74 % for the monitoring period prior to the biogas supplement addition (Table 1). After the additive introduction, the pH had an average value of 8.0 with an FOS value of 2918 and a TAC value of 14,574.6 mg/L with a ratio of 0.199. TS and vs. average values ranged between 8.28 and 5.81, respectively.
The analysis of biogas plant parameters and additives provided valuable insights into their performance and efficiency. The reduction in TS content followed by the relative reduction in vs. content was due to the lesser feeding of D1 with less materials in a proportional and equal slight reduction. The biogas production showed an increase despite the fact that feedstock was decreased (Figure 1).
After the additive introduction in the BG01 (D1) biogas plant, the pH had an average value of 8.06, the FOS was 2443.6 and the TAC was 10,228 mg/L, with a ratio of 0.230. TS and vs. average values ranged between 9.54 and 7.50, respectively (Table 1). The reduction in TS content, followed by the relative reduction in vs. content, was due to the lesser feeding of D1 with corn silage (Figure 1). These findings highlight the potential effects of additives on biogas production and composition, emphasizing the importance of careful selection and optimization [30].
Additionally, the analysis of organic acid concentrations revealed significant variations under different conditions (Figure 2A,B, Table S1). In both biogas plants, the concentration of acetic acid slightly increased during the additive application period (Figure 2B, Table S1).
Comparing the “BG02” results with the “BG01” conditions, it was observed that the concentrations of acetic acid were slightly higher in the “BG02” samples (Figure 2A,B, Table S1). The latter was an indication that the biomass in BG02 could be decomposed further in VFAs, showing that there was more biogas potential than was produced; biogas production was lower in BG02.
However, after the introduction of the hydrolytic bacteria, a slight increase in the FOS values was gradually observed in both biogas plants and for this purpose, the daily quantity of silage was reduced. This did not affect the biogas production in volume and remained stable above 24,000 m3 and 9000 m3 (in BG01 and BG02) during the whole monitoring period (Figure 1C,D and Figure 2C,D).
In contrast, the “BG01 (D1)” samples exhibited much higher concentrations of acetic acid. The acetic acid concentration in “BG01 (D1)” reached a peak of 1158 ppm on day 80 and that was due to increased hydrolysis occurring to D1′s feedstock, which required less HRT in order to be decomposed and a higher rate of decomposition (Figure 2A, Table S1).
Overall, this analysis provides insights into the concentrations of acetic acid, as well as other organic acids, under different conditions (Table S1). The significant variations observed between the “BG01” and “BG02 (D1)” samples highlight the impact of additives on the concentrations of these organic acids, which can have implications for various applications in industries such as food, fermentation and biochemistry [30].
In conclusion, there was an improvement in the total biogas production for both biogas plants (BG01 and BG02). BG01 proved to have a big improvement, wherein the feedstock needed more HRT in order to be decomposed by hydrolytic bacteria, speeding up the rest of the metabolic pathways for biogas production. However, a small increase in biogas production was recorded, followed by a small decrease in daily feedstock, as it is depicted in the TS and vs. contents too. On the other hand, for BG02 a slight improvement was noticed in total biogas production but still it was not so significant since the plant was in a “recovery mode” from a previous inhibition incident. After rough estimations, we calculated an increase of +9% for BG02 and +16% for BG01 based on a reduction in average daily feedstock intake. Additionally, regarding biogas yield based on calculations of biogas and methane (Table 1), BG01 did not exhibit higher biogas yield; however, BG02 showed increased biogas yield after the Evogen supplement (roughly 18%).
In order to obtain more reliable results, this study will be continued and the period of Evogen effect will be increased from 6 to 12 months (monitoring period) while the steady state of 2 months of the biogas plants will be a pre-requisite for the supplement introduction. Feedstock variations should be avoided so that the daily intake reduction can be recorded in a reliable way.

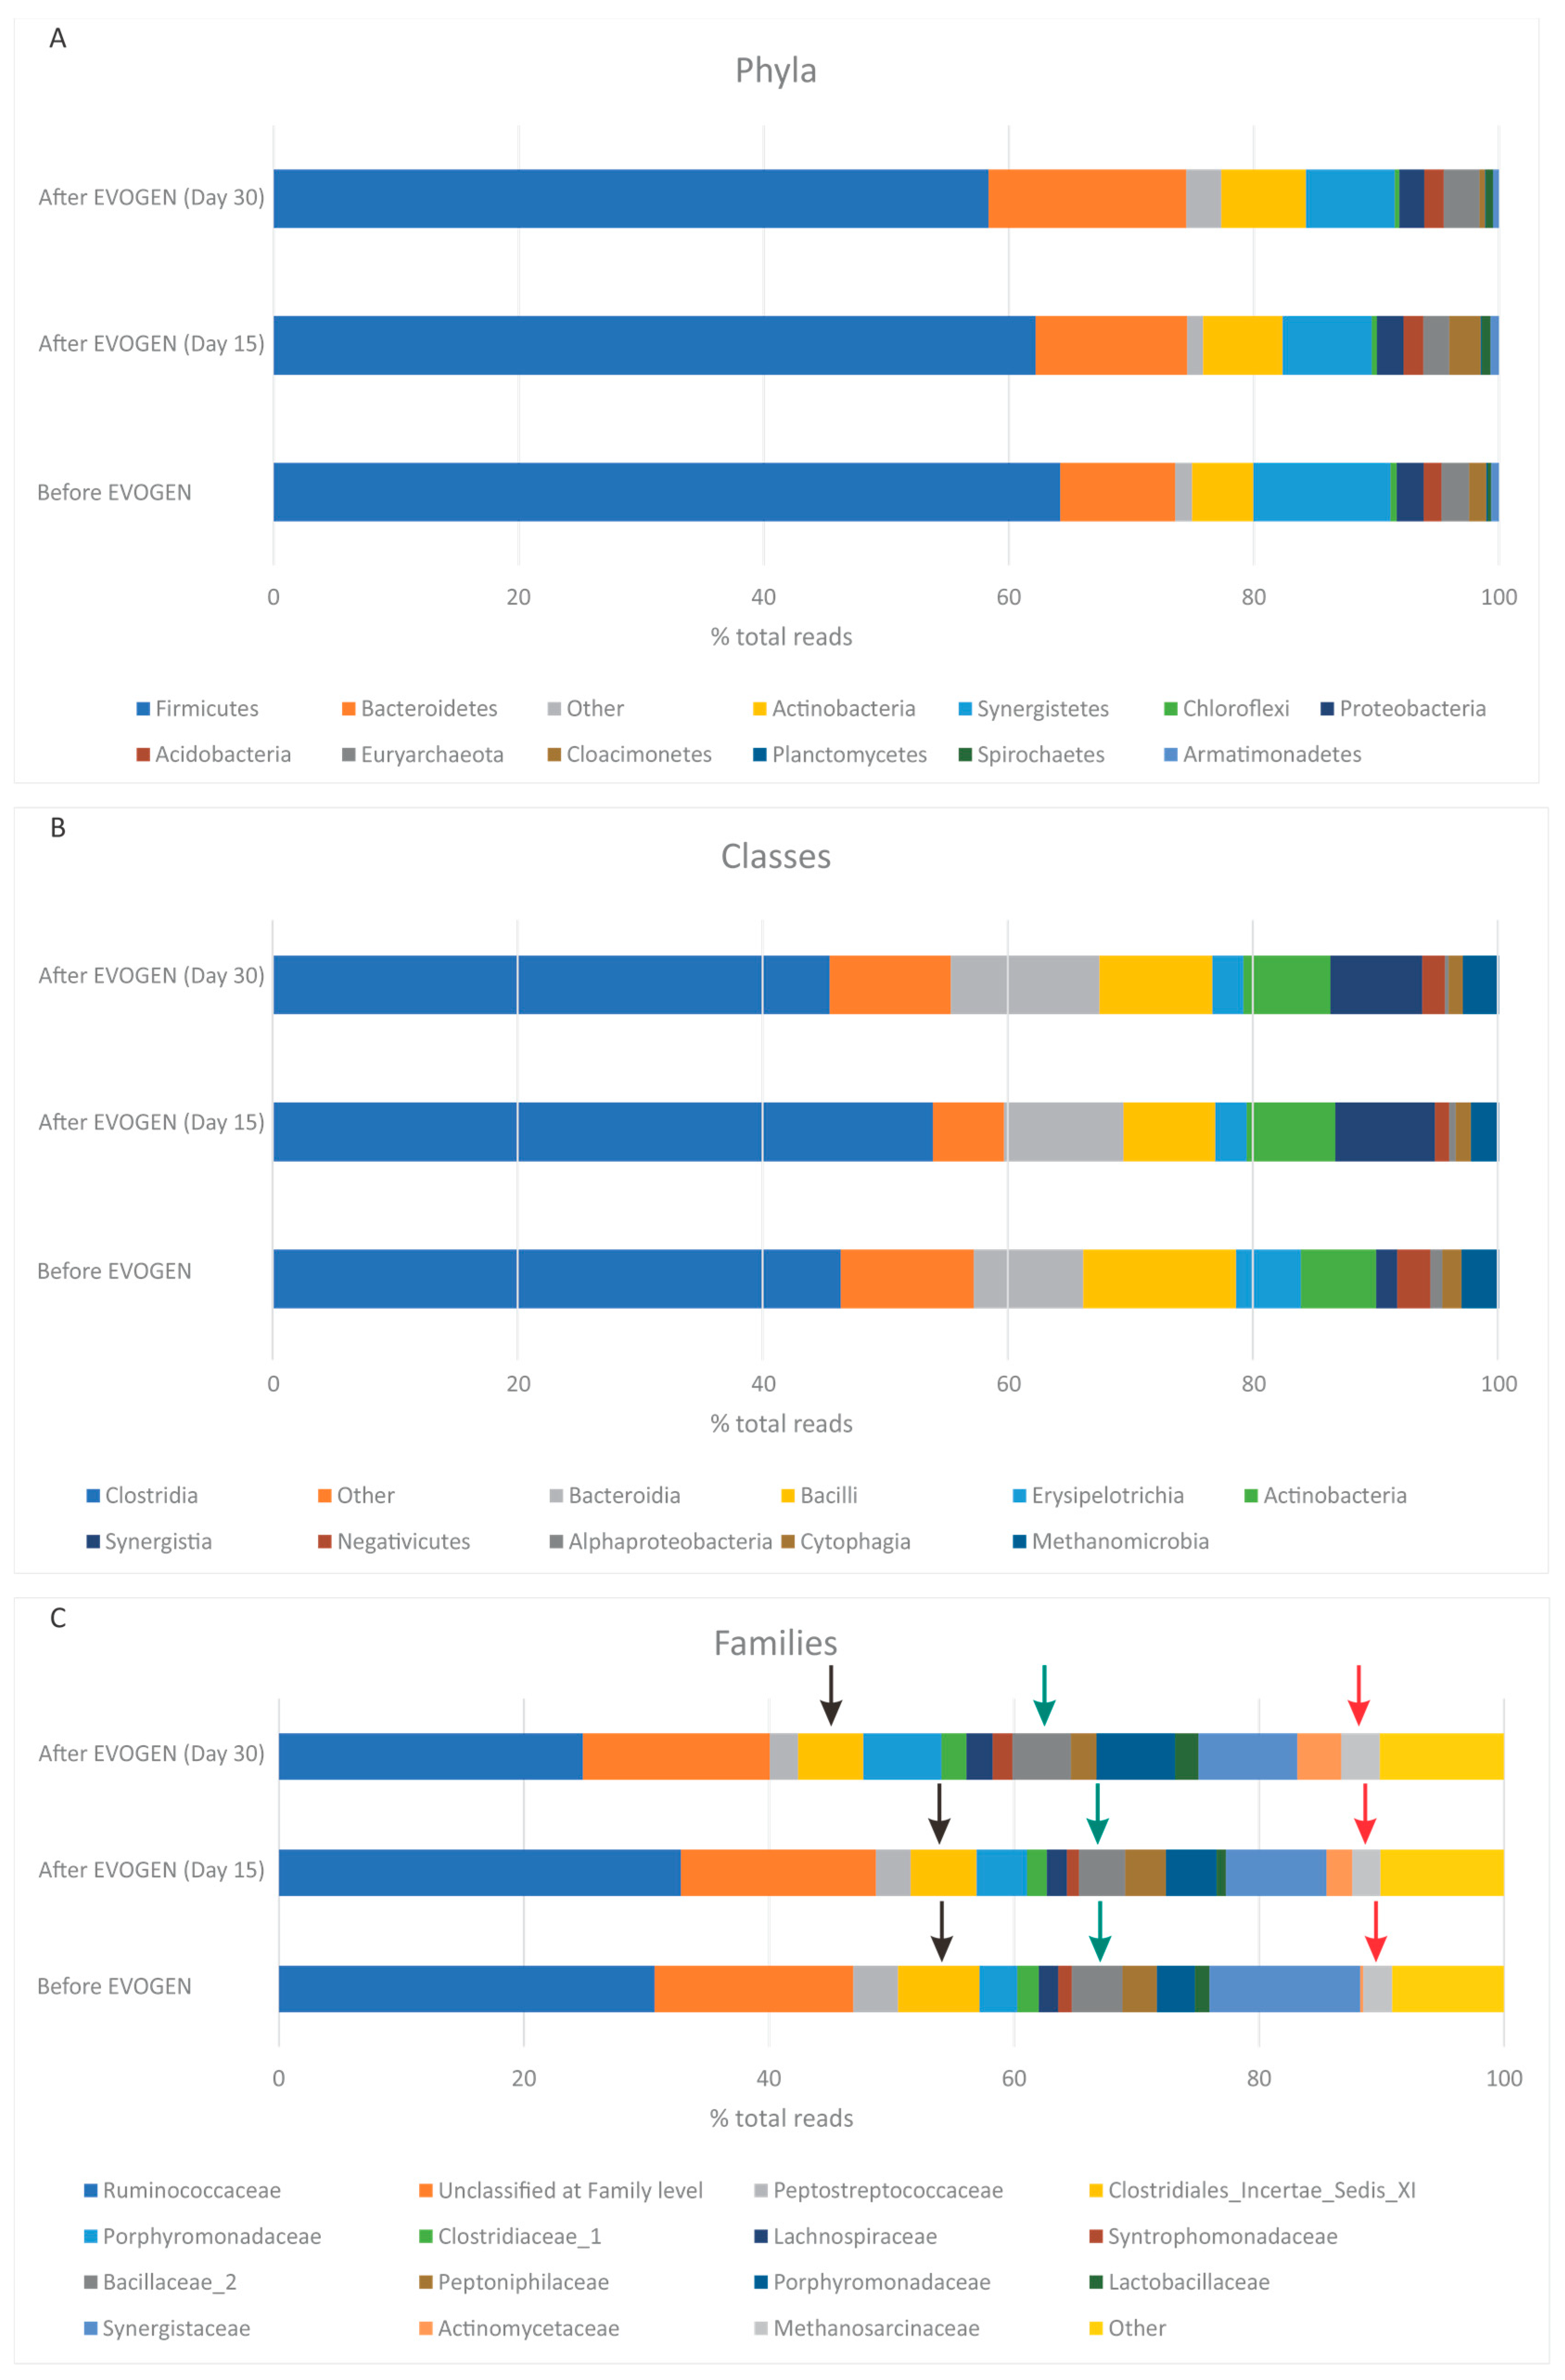
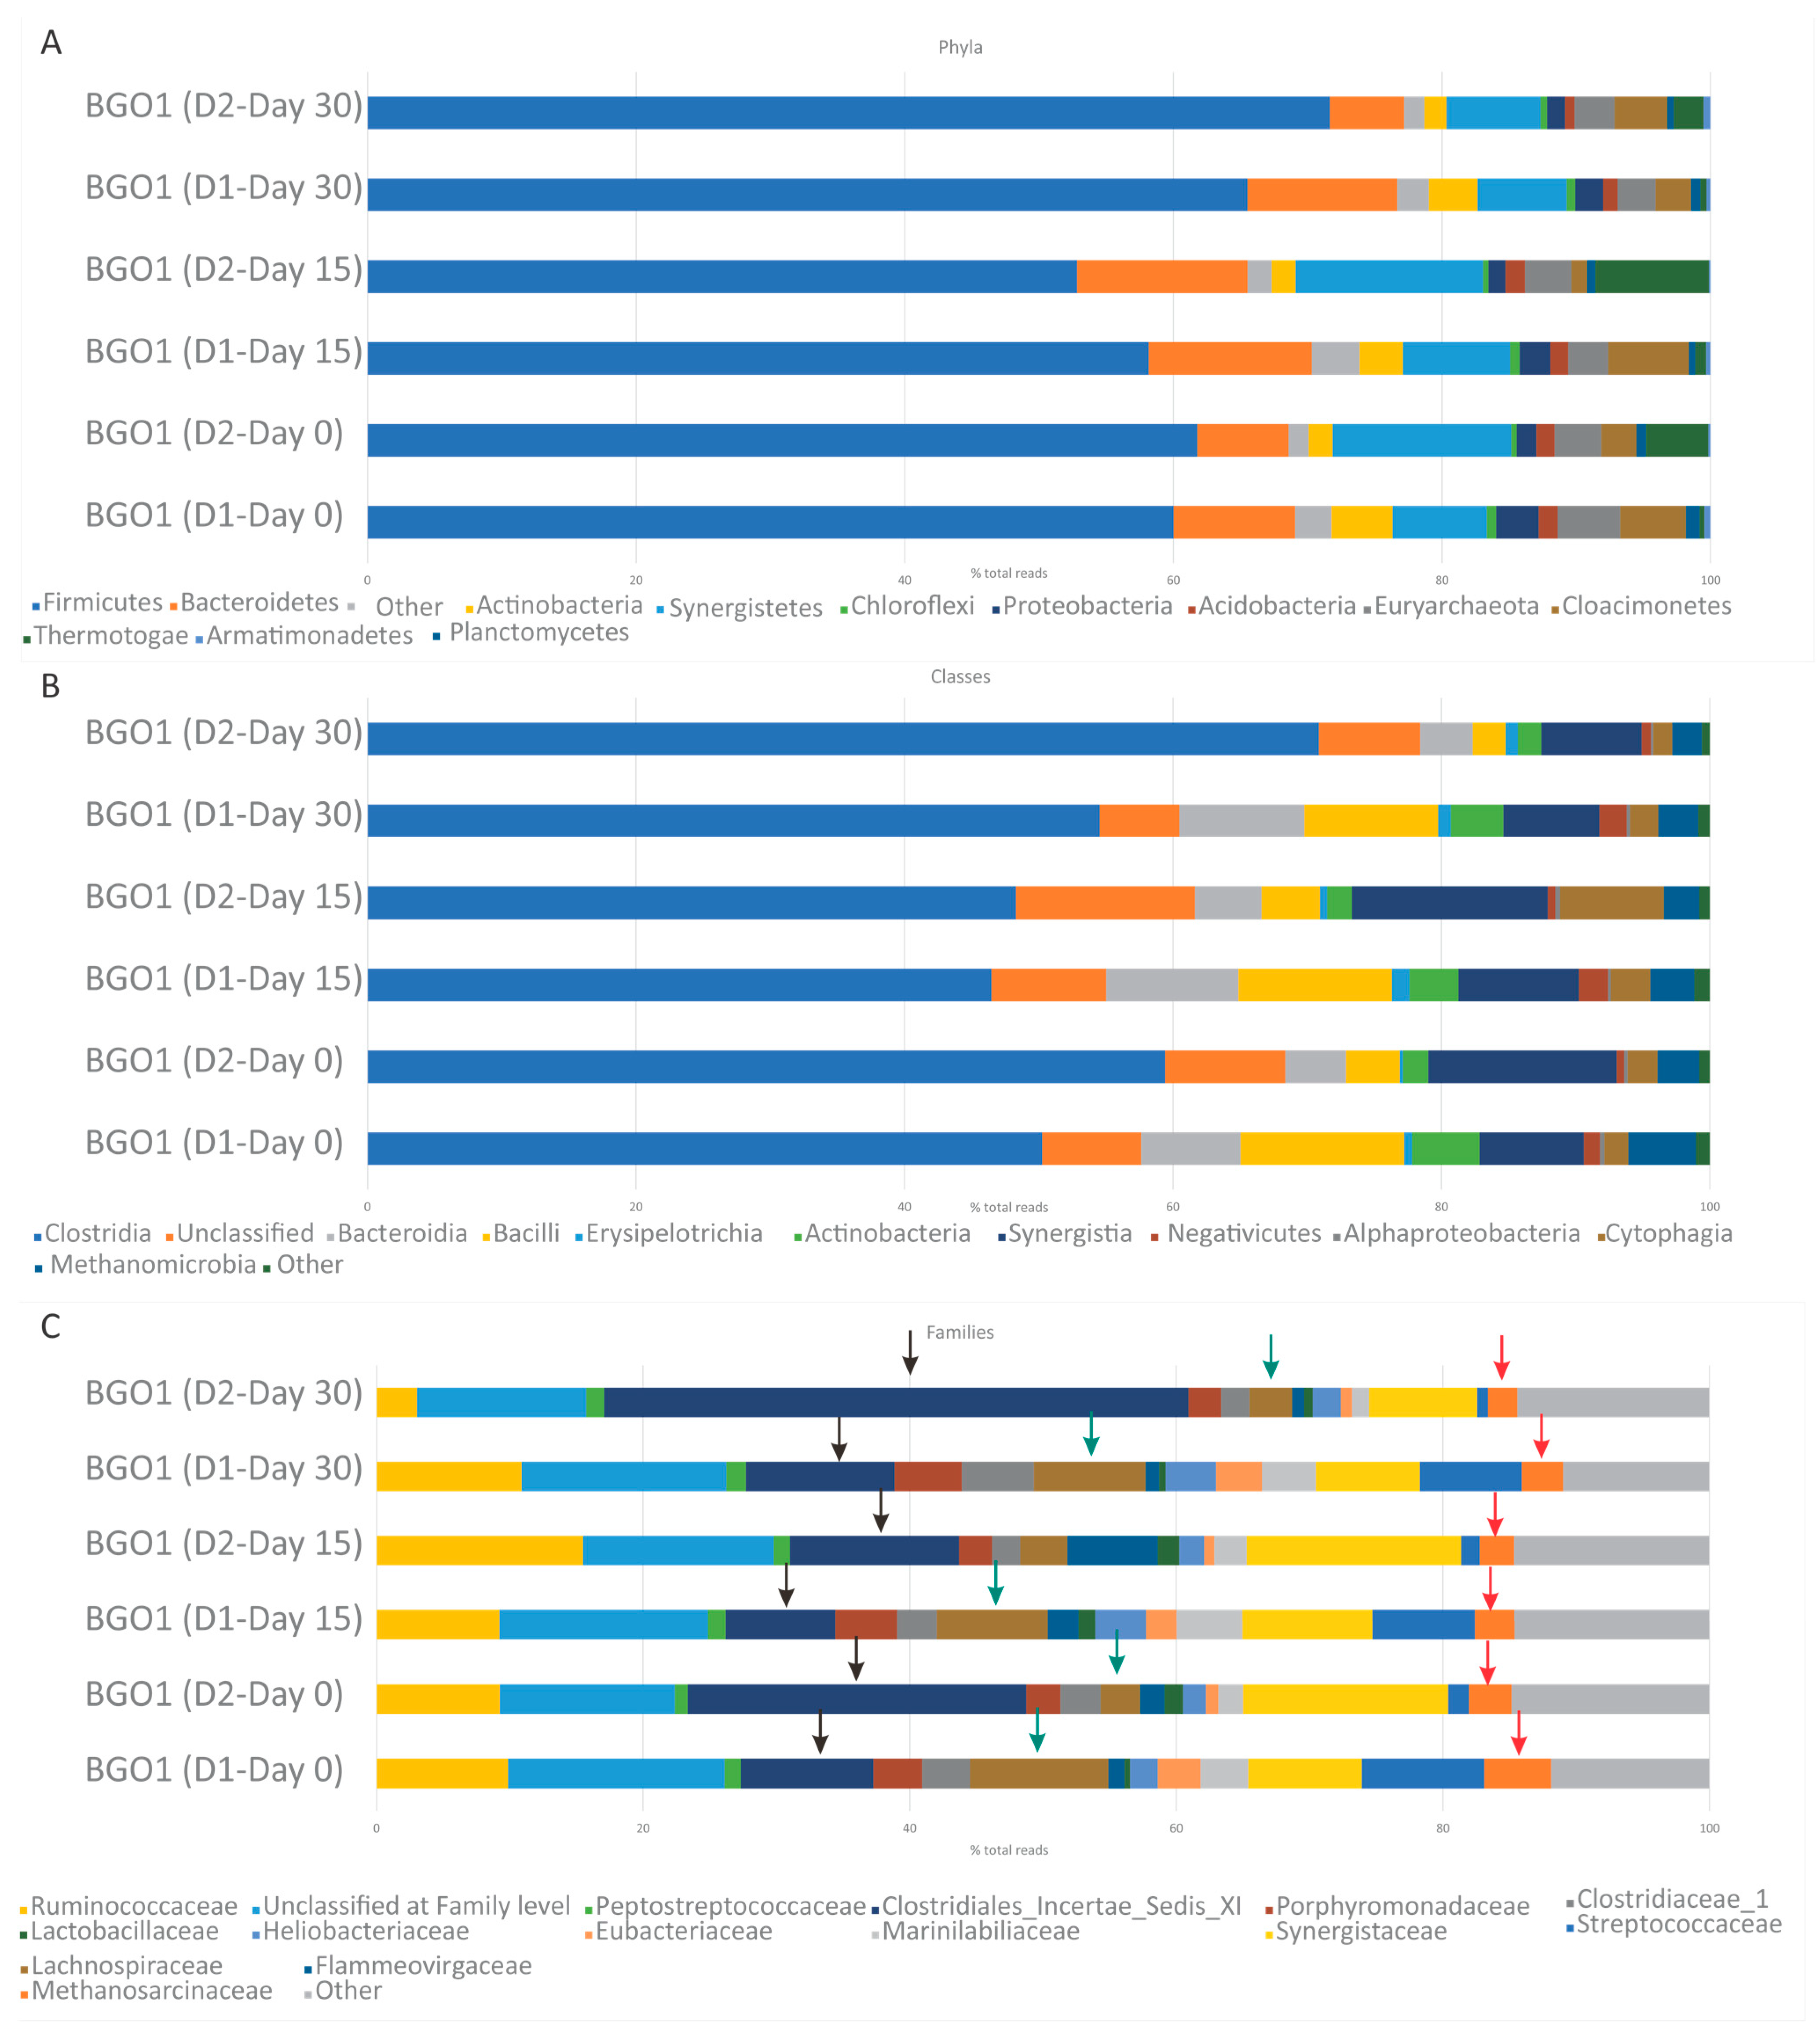
2.2. Microbiome Alternation during Additive Administration

The biotechnology behind this additive is the combination of a novel mineral carrier and selected Bacillus strains. The vector acts in a multifaceted manner, ultimately enhancing methanogenesis. The pores within the surface of the carrier allow for deep colonization, providing an extra layer of protection to microbes. Thus, they are more tolerant to pH changes and exposure to inhibitory compounds, such as ammonia. The carrier surface acts as an ion exchanger by facilitating electron transfer and absorbs compounds, such as ammonia, reducing their inhibitory effect on the system. Bacilli have been selected due to their diverse metabolic capacity and their ability to operate over a range of pH and temperature values. The ability of Bacilli to secrete hydrolytic enzymes under anaerobic conditions enhances the degradation of feed polymeric compounds, such as proteins, polysaccharides and fats [31]. In this way, complex organic compounds are converted into simpler and bioavailable compounds for further degradation to final methane production. Finally, the ability to form resistant Bacillus spores ensures that they will only germinate when the right conditions allow them to do so, providing long-term stability and specificity [30].
The results obtained from the 16S rRNA microbiome analysis of the samples collected at three timepoints (on day 0, 15 and 30) during operation with Evogen administration reveal valuable insights into the microbial composition and dynamics in the biogas digester BG02. The dominance of the phylum Firmicutes (64.2% to 58.3%) throughout the experiment indicated its significant role in biogas production (Figure 3 and Figure 4). This phylum comprises members known for their involvement in the degradation of various substrates, such as proteins and polysaccharides, leading to the generation of acetate and propionate [32]. Furthermore, Firmicutes bacteria have been found to establish syntrophic relationships with acetoclastic methanogens, facilitating the overall methanogenic process [33].
Another abundant taxon identified in the digester were Synergistetes (11.2% to 7.3%), which exhibited a high abundance at the beginning of the experiment but decreased on day 15, remaining relatively stable thereafter. Synergistetes are known for their ability to ferment long-chain and monocarboxylic fatty acids, producing acetate, H2 and CO2 [32] (Figure 3A). This metabolic activity contributes to the pool of substrates available for methanogenesis in the digester.
Proteolytic Bacteroidetes displayed an increasing trend (9.4% to 16.1%) throughout the experiment, indicating their involvement in protein degradation and subsequent biogas production (Figure 3A). These bacteria possess the capability to break down proteins into amino acids, which can be further metabolized into volatile fatty acids (VFAs) and subsequently utilized by methanogens [32].
Actinobacteria (5% to 6.9%) also exhibited an initial increase in abundance, followed by a relatively stable presence. Actinobacteria primarily function as acidogenic microorganisms, contributing to the accumulation of volatile fatty acids (VFAs) in the digester (Figure 3A). Additionally, they have the ability to inhibit the growth of methanogenic bacteria, potentially affecting the overall biogas production [32].
At the family level, Ruminococcaceae from the class Clostridia was the most enriched family in the digester but showed a decrease from 30.6% to 24.8% after the extensive use of Evogen (Figure 3B). Ruminococcaceae bacteria are known for their hydrolytic and acidogenic functions, facilitating the breakdown of complex substrates. The decrease in their abundance may indicate a shift in the metabolic dynamics of the digester following the introduction of Evogen.
Similarly, the family Synergistaceae (Synergistia) exhibited a decreasing trend, from 12.3% to 8.1%, suggesting a potential impact of Evogen on their population dynamics (Figure 3B). Synergistaceae bacteria have been associated with various mechanisms that can influence different phases of the production process [34].
On the other hand, Porphyromonadaceae (Bacteroidia) and Actinomycetaceae (Actinobacteria) showed an increase in abundance from 3.1% to 6.4% and from 0.2% to 3.6%, respectively (Figure 3B). Porphyromonadaceae bacteria are known as important fiber-digesting microorganisms, capable of enhancing the anaerobic digestion of lignocellulosic biomass. The observed increase in their abundance may be associated with the presence of lignocellulosic matter in blackwater-fed reactors [35]. Actinomycetaceae, on the other hand, may contribute to acidogenesis in the digester, aiding in VFA production [32].
At the genus level, Oscillibacter and Clostridium_IV were the dominant genera throughout the entire experimental period, although their abundances decreased from 13.3% to 11.9% and from 12.2% to 5.6%, respectively (Figure S1). Oscillibacter has been widely identified in cow manures and has been linked to the enhancement of the hydrogen-reduction CO2 pathway [36,37]. The positive correlation between the abundance of Oscillibacter and the H2 flux suggests its potential contribution to the CO2 reduction by hydrogen, ultimately leading to methane production.
Another notable genus, Proteiniphilum, displayed an upward trend from 2.9% to 5.1% throughout the experiment (Figures S1 and S2). The final production of CH4 flux was significantly correlated with the abundance of Proteiniphilum. Conversely, the H2 flux showed a negative correlation with the abundance of Proteiniphilum but a positive correlation with the abundance of Oscillibacter. Proteiniphilum has been found to produce acetate from proteins and their interaction with acetate methanogens has been shown to promote methane recovery in digesters [37].
The methanogenic community in the digester was primarily composed of the genus Methanosarcina, belonging to the class Methanomicrobia (Figure S1). Methanosarcina species are known for their versatility in utilizing various substrates, including acetate, methanol and methylamines, to produce methane [38] (Figure 3C). The presence of Methanosarcina in the digester indicates their essential role in the final step of biogas production, converting the accumulated substrates into methane gas [39].
In summary, the analysis of the microbial community dynamics in the biogas digester BG02 before and after the introduction of Evogen revealed several significant findings. The dominance of Firmicutes, along with the presence of Synergistetes, Proteolytic Bacteroidetes and Actinobacteria, highlighted their roles in substrate degradation and VFA production. The changes observed in the abundance of specific families and genera, such as Ruminococcaceae, Synergistaceae, Porphyromonadaceae and Actinomycetaceae, suggest potential impacts of Evogen on the microbial community composition. Moreover, the correlations observed between the abundance of Oscillibacter and Proteiniphilum, as well as the flux of methane and hydrogen, provide insights into the complex interactions occurring within the microbial consortium during biogas production. Further studies are warranted to elucidate the specific mechanisms underlying these interactions and the effects of Evogen on the microbial dynamics in biogas digesters.
Additionally, the investigation focused on the microbial community dynamics in biogas production during the continuous addition of the additive Evogen in two biogas plants BG01 (D1 and D2) and BG02. By introducing this additive, due to the higher hydrolysis rate which takes place mainly in the primary digester of a biogas plant, the required HRT for biomass decomposition becomes lesser, providing VFAs and subsequently acetic acid for methane production.
The microbial analysis revealed dynamic shifts in the community composition during the experiment. Firmicutes, a dominant phylum, consistently accounted for a substantial portion of the bacterial community (60% to 71%) (Figure 4A), highlighting their role in substrate degradation and methanogenesis. Bacteroidetes, another significant phylum, exhibited varying abundances (4.8% to 12.1%) (Figure 4A), contributing to lignocellulosic biomass breakdown. Fluctuations in Bacteroidetes abundance could stem from Evogen-induced substrate changes. Actinobacteria, Synergistetes and Proteobacteria were also present in lower abundances, with roles in acidogenesis, fermentation and overall microbial dynamics. Clostridia, a dominant class within Firmicutes, consistently played a key role in organic matter degradation (Figure 4B), supported by diverse classes, families and genera contributing to the intricate biogas production process.
The study highlights that Evogen addition shapes microbial community dynamics in biogas production, altering microbial abundances and potentially impacting substrate utilization and overall community structure. Firmicutes and Bacteroidetes dominance underscores their crucial roles in substrate degradation and biogas production. However, further research is needed to fully unravel how Evogen precisely influences microbial dynamics and biogas generation.
Future studies should leverage advanced techniques like RNA sequencing to delve into enzyme changes, gaining deeper insights into enzymatic dynamics and the effects of additives such as Evogen on biogas production. Exploring gene expression and enzymatic activity patterns will provide a comprehensive understanding of molecular-level mechanisms, enhancing our grasp of intricate interactions within the microbial consortium and optimizing biogas production systems.
In summary, this investigation offers valuable insights into microbial community dynamics during continuous Evogen addition in biogas production. The findings deepen our understanding of different microbial taxa roles at various taxonomic levels, shedding light on intricate interactions and processes driving biogas production.

3. Materials and Methods

3.1. Description of Evogen Biogas Additive

Evogen biogas additive (Genesis Biosciences, Ltd., Cardiff, UK) is a powder product that optimizes the anaerobic digestion process. It uses a mineral carrier to support methanogen colonization and improve electron transfer. Bacillus strains in the additive increase hydrolysis and fermentation through the secretion of anaerobic enzymes. This combination enhances biogas production and reduces sludge volume. Evogen is manufactured according to ISO 9001 standards, ensuring quality and stability. It provides both a physiochemical and biological response, strengthening microbial components and improving the degradation of complex compounds.
To the best of our knowledge, Evogen is the only commercially available product that applies this kind of technology.

3.2. Operation of the Two Full-Scale Biogas Plants under Investigation

In this study, we examined the use of Evogen biogas in two flow-through bioreactors (BG01 and BG02) belonging in two different biogas plants at the same period. The BG01 biogas plant has maintained a stable feedstock composition for a long time, giving it a stabilized microbial community and a higher probability of decomposing organic biomass into biogas. The primary digester of BG01 (D1) with an active volume of 4000 m3 operates at 44 °C with a pH of 8.3 from on-site reading. The FOS/TAC ratio ranged near 0.2. The daily feed of D1 ranges from 40 to 100 tn of silage per day, whereas Evogen was introduced in a daily amount of 0.15% of the digester’s daily feedstock supply in dry matter basis (Table 2). The second digester of BG01 (D2) received material from D1 at the frequency of OLR, which is 2.1 tn per half an hour. It has a volume of 2800 m3 and operates at a mesophilic temperature. The daily feed to D2 is 21.5 tn of whey, 3.5 tn of soapstock and 1–8 tn of glycerol, depending on the quantity of the silage. The stirring of the two digesters is continuous. As a result, the plant reaches its target of 2.1 MW with a nearly 53.1% CH4 yield (24 h × 994 to 1050 m3 biogas) (Table 2).
The BG02 biogas plant has an average yield of 354,000 m3/month biogas retrieved from one digester of 4250 m3 volume operated at 41 ± 1 °C. The hydraulic retention time (HRT) of this reactor is 40 days with feeding rate 6.7 tn/hour, while there is continuous stirring for 45 min per hour (Table 2). The additive is introduced in a daily amount of 0.15% of the digester’s daily feedstock supply in dry matter basis.

3.3. Determination of Total Solids

The method for TS determination was based on the total solids dried at 103–105 °C, methodology: APHA 2540-B [40]. A quantity of sample was placed in a dried and pre-weighed dish and the weight of the sample was recorded. The dish containing the sample was placed in the drying oven at 105 °C overnight. Afterward, the dish was cooled in a desiccator to ambient temperature and weighed.

3.4. Determination of Volatile Solids

The method was based on fixed and volatile solids ignited at 550 °C: APHA 2540-E [40]. The sample was dried before being placed in the muffle furnace. The dish was weighed with the sample within, was ignited for 4 h at 550 °C, was cooled in a desiccator and the weight was recorded.

3.5. Determination of FOS/TAC Ratio

The FOS/TAC ratio serves as a measure to evaluate fermentation processes. TAC represents the estimated total inorganic carbon in the sample, while the ratio reflects the alkalinity buffer capacity and the FOS value corresponds to the content of volatile fatty acids. The calculation of this ratio follows the Nordmann method, which involves titrating a 5 mL sample of fermentation substrate with 0.1 N sulfuric acid solution (H2SO4) until pH 5.0 to determine the TAC value, expressed in mg/L of calcium carbonate (CaCO3). Subsequently, a second titration is performed between pH 5.0 and pH 4.4 to obtain the FOS value, expressed in mg/L of acetic acid (CH3COOH) [13].

3.6. Determination of Volatile Fatty Acids (VFAs) Profile

The centrifugation process in the Eppendorf minispin table centrifuge involves spinning a 1.5 mL sample in a 2 mL Eppendorf tube at 12,000 rpm for 10 min. To ensure that the VFAs (acetate, propionate, butyrate, iso-butyrate, valerate and iso-valerate) are in their acidic form and to saturate the basic sites on the analytical column, the sample is acidified with 100 μL of ortho-phosphoric acid to reach a pH of 2 before centrifugation. For the gas chromatography analysis, 100 μL of the injection standard and 1 mL of the sample are added to the GC vial. A Shimadzu GC-2010 Plus High-End gas chromatography system equipped with a flame-ionization detector (FID) is used to inject the liquid phase. The column used is an Altmann Anaytik AS-FFAP EXT, with dimensions of 30 m × 0.25 mm × 0.25 μm. Helium of grade 99.999% is used as the carrier gas at a flow rate of 1.9 mL/min. The injection volume is 1 μL with a split ratio of 1:10 and the injector temperature is set at 250 °C. The detector temperature is also maintained at 250 °C. The temperature program consists of an initial oven temperature of 100 °C, held for 2 min. It then increases at a rate of 10 °C/min to 220 °C, without holding time. In the final step, the temperature is raised at a rate of 30 °C/min to 240 °C, with a hold time of 12 min. The total run time for the analysis is 27 min. The concentration of VFAs is determined using a linear calibration curve obtained from calibration standards and adjusted with the injection internal standard.

3.7. DNA Extraction and 16S rRNA Gene Amplicon Sequencing

Genomic DNA was extracted from the biofilm suspensions with the DNeasy PowerSoil Pro Kit (QIAGEN, Hilden, Germany) according to the manufacturer’s instructions. The quantity and quality of the extracted DNA were then estimated using a V-630 Spectrophotometer (JASCO, Inc., Tokyo, Japan). Library preparation was performed following the standard guidelines of the 16S Metagenomic Sequencing Library Preparation protocol (IlluminaTM, Inc., San Diego, CA, USA). In brief, DNA was amplified using the HotStarTaq® Master Mix Kit (QIAGEN, Hilden, Germany) with the addition of the 341f/805r primer pair, which targets the bacterial and archaeal V3–V4 hypervariable regions of the 16S rRNA gene (341f 5′-CCTACGGGNGGCWGCAG-3′, 805r 5′-GACTACHVGGTATCTAATCC-3′). The PCR mixture (25 μL) contained 12.5 μL of HotStarTaq Master Mix, 5 μL of each primer and 2.5 μL of DNA (5 ng/μL). Thermal cycling conditions included an initial 3 min step at 95 °C, followed by 25 cycles of denaturation at 95 °C for 30 s, annealing at 55 °C for 30 s and elongation at 72 °C for 30 s and a final extension step at 72 °C for 5 min. PCR amplicons were cleaned up by AMPure XP beads (Beckman Coulter, Brea, CA, USA) to remove unbound primers and primer dimers. Next, dual indices and Illumina sequencing adaptors were attached with an index PCR using the Nextera XT Index Kit (Illumina Inc., San Diego, CA, USA). The PCR reaction mixture (50 μL) comprised 25 μL of HotStarTaq Master Mix, 5 μL of each index, 10 μL of PCR Grade Water and 5 μL of the previous PCR product and the cycling conditions remained the same as that of the first PCR reaction except that the number of iterative cycles was reduced to 8. Afterward, indexed PCR amplicons were cleaned up using the AMPure XP beads (Beckman Coulter, Brea, CA, USA). The produced DNA libraries were quantified with the Qubit™ 4 Fluorometer (Thermo Fisher Scientific, Waltham, MA, USA) and their size was verified via a 1.5% agarose gel electrophoresis. Equimolar concentrations of the libraries were then pooled together and a quantitative PCR was performed using the QIAseq Library Quant Assay Kit (QIAGEN, Hilden, Germany) for library concentration evaluation. The pooled library was subsequently spiked with 25% phiX control library (Illumina Inc., San Diego, CA, USA), denatured and diluted to a final concentration of 6 pM. Sequencing was performed on an Illumina MiSeqTM platform with the MiSeq Reagent Nano Kit version 2 (500-Cycle)/MiSeq Reagent Kit version 3 (600-Cycle) chemistry for a paired-end, 2D250-bp/2 × 300 cycle run.

3.8. Bioinformatics

The primer sequences were removed and reads with a low-quality score (average score, <20) were filtered out using the FASTQ toolkit within BaseSpace version 2.2.0 (IlluminaTM, Inc., San Diego, CA, USA). The 16S Metagenomics application (version 1.0.1) within BaseSpace was used to perform a taxonomic classification, which uses an Illumina-curated version of the GreenGenes taxonomic database and the RDP naive Bayes taxonomic classification algorithm with an accuracy of >98.2% at the species level [41].

4. Conclusions

The performance and efficiency of biogas plants are influenced by various parameters and the addition of specific additives. This study analyzed several physicochemical parameters in two different biogas plants (BG01 and BG02) and their respective additives.
The addition of Evogen had a beneficial impact on digester functioning, evidenced through increased alkalinity buffer capacity (measured by FOS/TAC ratios), signifying improved acidification and methanogenesis. This was accompanied by decreases in overall solids and volatile solids, showcasing the enhanced breakdown of organic materials. Digesters treated with Evogen displayed notably elevated biogas generation and enhanced process stability, as evidenced from the analysis of VFAs’ patterns. The addition of Evogen led to an increase in biogas production despite a reduction in daily feedstock intake. On the other hand, BG02 showed an increased biogas yield after the Evogen supplement (roughly 18%), considering the plant was in a “recovery mode” from a previous inhibition incident.
The microbial community dynamics analysis revealed valuable insights into the microbial composition and dynamics in the biogas digester BG02. Firmicutes was the dominant phylum throughout the experiment, along with other taxa like Synergistetes, Proteolytic Bacteroidetes and Actinobacteria. The changes in the abundance of specific families and genera suggested positive potential impacts of Evogen on the microbial community composition, as it seems that Evogen stimulated the dominance of Firmicutes and Bacteroidetes, demonstrating their crucial role in substrate degradation and biogas production.
Future research could employ advanced techniques like RNA sequencing to examine enzyme changes and gain a deeper understanding of the molecular-level mechanisms underlying the impacts of Evogen and other additives on anaerobic digestion processes.
In conclusion, this study provides valuable insights into the crucial role of biogas plants in sustainable energy production and the influence of Evogen on biogas production and microbial community dynamics. The findings contribute to our understanding of the complex interactions within the microbial consortium and can be utilized to further optimize biogas production systems. This study encourages further research to explore the potential of additives and enhance the efficiency of biogas plants for sustainable energy generation.

Supplementary Materials

The following supporting information can be downloaded at: https://www.mdpi.com/article/10.3390/methane2030022/s1, Table S1: VFA profile over the supplementation of Evogen biogas additive in two biogas plants. All concentrations are reported as parts per million (ppm); Figure S1: Abundance of the 16S rRNA operational taxonomic units in BG02 over Evogen biogas additive administration classified in Genus rank; Figure S2: Abundance of the 16S rRNA operational taxonomic units in BG01 over Evogen biogas additive administration classified in Genus rank.

Author Contributions

Conceptualization, T.S.; methodology, T.S., M.P. and A.G.C.; software, I.D.; validation, T.S. and M.P.; formal analysis, A.G.C.; investigation, N.P., I.D. and T.S.; resources, T.S.; data curation, M.P., A.G.C. and N.P.; writing—original draft preparation, M.P.; writing—review and editing, T.S. and M.P.; visualization, M.P.; supervision, T.S.; project administration, T.S.; funding acquisition, T.S. All authors have read and agreed to the published version of the manuscript.

Funding

This research was co-funded by the European Regional Development Fund of the European Union and Greek national funds through the Operational Program Competitiveness, Entre-preneurship and Innovation, under the call RESEARCH—CREATE—INNOVATE (project code: T2EDK-00359).

Informed Consent Statement

Not applicable.

Data Availability Statement

The data presented in this study are available upon request from the corresponding author.

Acknowledgments

The authors wish to acknowledge Genesis Biosciences, Ltd., Cardiff, UK, for the information provided related to their product. Finally, the authors acknowledge all staff members of Qlab P.C. for their individual roles that contributed to the implementation of this study.

Conflicts of Interest

The authors declare no conflict of interest.

References

  1. Lisowyj, M.; Wright, M.M. A review of biogas and an assessment of its economic impact and future role as a renewable energy source. Rev. Chem. Eng. 2020, 36, 401–421. [Google Scholar] [CrossRef]
  2. Iglesias, R.; Muñoz, R.; Polanco, M.; Díaz, I.; Susmozas, A.; Moreno, A.D.; Guirado, M.; Carreras, N.; Ballesteros, M. Biogas from anaerobic digestion as an energy vector: Current upgrading development. Energies 2021, 14, 2742. [Google Scholar] [CrossRef]
  3. Yadav, P.; Yadav, S.; Singh, D.; Shekher Giri, B.; Mishra, P.K. Barriers in biogas production from the organic fraction of municipal solid waste: A circular bioeconomy perspective. Bioresour. Technol. 2022, 362, 127671. [Google Scholar] [CrossRef] [PubMed]
  4. Werkneh, A.A. Biogas impurities: Environmental and health implications, removal technologies and future perspectives. Heliyon 2022, 8, e10929. [Google Scholar] [CrossRef] [PubMed]
  5. Roubík, H.; Mazancová, J.; Banout, J.; Verner, V. Addressing problems at small-scale biogas plants: A case study from central Vietnam. J. Clean. Prod. 2016, 112, 2784–2792. [Google Scholar] [CrossRef]
  6. Wang, Y.; Zhang, J.; Sun, Y.; Yu, J.; Zheng, Z.; Li, S.; Cui, Z.; Hao, J.; Li, G. Effects of intermittent mixing mode on solid state anaerobic digestion of agricultural wastes. Chemosphere 2020, 248, 126055. [Google Scholar] [CrossRef] [PubMed]
  7. Vu, H.P.; Nguyen, L.N.; Wang, Q.; Ngo, H.H.; Liu, Q.; Zhang, X.; Nghiem, L.D. Hydrogen sulphide management in anaerobic digestion: A critical review on input control, process regulation and post-treatment. Bioresour. Technol. 2022, 346, 126634. [Google Scholar] [CrossRef]
  8. Wiśniewska, M.; Kulig, A.; Lelicińska-Serafin, K. Odour Emissions of Municipal Waste Biogas Plants—Impact of Technological Factors, Air Temperature and Humidity. Appl. Sci. 2020, 10, 1093. [Google Scholar] [CrossRef]
  9. Hewitt, J.; Holden, M.; Robinson, B.L.; Jewitt, S.; Clifford, M.J. Not quite cooking on gas: Understanding biogas plant failure and abandonment in Northern Tanzania. Renew. Sustain. Energy Rev. 2022, 165, 112600. [Google Scholar] [CrossRef]
  10. Lin, L.; Xu, F.; Ge, X.; Li, Y. Improving the sustainability of organic waste management practices in the food-energy-water nexus: A comparative review of anaerobic digestion and composting. Renew. Sustain. Energy Rev. 2018, 89, 151–167. [Google Scholar] [CrossRef]
  11. Liu, M.; Wei, Y.; Leng, X. Improving biogas production using additives in anaerobic digestion: A review. J. Clean. Prod. 2021, 297, 126666. [Google Scholar] [CrossRef]
  12. Romero-Güiza, M.S.; Vila, J.; Mata-Alvarez, J.; Chimenos, J.M.; Astals, S. The role of additives on anaerobic digestion: A review. Renew. Sustain. Energy Rev. 2016, 58, 1486–1499. [Google Scholar] [CrossRef]
  13. Paritosh, K.; Yadav, M.; Chawade, A.; Sahoo, D. Additives as a Support Structure for Specific Biochemical Activity Boosts in Anaerobic Digestion: A Review. Front. Energy Res. 2020, 8, 1–17. [Google Scholar] [CrossRef]
  14. Dompara, I.; Maragkaki, A.; Papastefanakis, N.; Floraki, C.; Vernardou, D.; Manios, T. Effects of Different Materials on Biogas Production during Anaerobic Digestion of Food Waste. Sustainability 2023, 15, 5698. [Google Scholar] [CrossRef]
  15. Fugol, M.; Prask, H.; Szlachta, J.; Dyjakon, A.; Pasławska, M.; Szufa, S. Improving the Energetic Efficiency of Biogas Plants Using Enzymatic Additives to Anaerobic Digestion. Energies 2023, 16, 1845. [Google Scholar] [CrossRef]
  16. Barua, S.; Dhar, B.R. Bioresource Technology Advances towards understanding and engineering direct interspecies electron transfer in anaerobic digestion. Bioresour. Technol. 2017, 244, 698–707. [Google Scholar] [CrossRef]
  17. Rasapoor, M.; Young, B.; Brar, R.; Sarmah, A.; Zhuang, W.Q.; Baroutian, S. Recognizing the challenges of anaerobic digestion: Critical steps toward improving biogas generation. Fuel 2019, 261, 116497. [Google Scholar] [CrossRef]
  18. Mishra, A.; Kumar, M.; Bolan, N.S.; Kapley, A.; Kumar, R.; Singh, L. Multidimensional approaches of biogas production and up-gradation: Opportunities and challenges. Bioresour. Technol. 2021, 338, 125514. [Google Scholar] [CrossRef]
  19. Eduok, S.; John, O.; Ita, B.; Inyang, E.; Coulon, F. Enhanced Biogas Production From Anaerobic Co-digestion of Lignocellulosic Biomass and Poultry Feces Using Source Separated Human Urine as Buffering Agent. Front. Environ. Sci. 2018, 6, 1–9. [Google Scholar] [CrossRef]
  20. Tian, W.; Gu, L.; Li, S.; Deng, R.; Zhu, L.; Li, W.; Liu, F. Facilitating Digester Recovery from Acid Inhibition at High Organic Load Rates by Limited Calcium Peroxide Addition. ACS Sustain. Chem. Eng. 2022, 10, 8184–8195. [Google Scholar] [CrossRef]
  21. Wang, C.; Li, Y.; Sun, Y. Acclimation of Acid-Tolerant Methanogenic Culture for Bioaugmentation: Strategy Comparison and Microbiome Succession. ACS Omega 2020, 5, 6062–6068. [Google Scholar] [CrossRef] [PubMed]
  22. Leca, E.; Zennaro, B.; Sambusiti, C. Use of additives to improve collective biogas plant performances: A comprehensive review. Biotechnol. Adv. 2023, 65, 108129. [Google Scholar] [CrossRef] [PubMed]
  23. Tale, V.P.; Maki, J.S.; Struble, C.A.; Zitomer, D.H. Methanogen community structure-activity relationship and bioaugmentation of overloaded anaerobic digesters. Water Res. 2011, 45, 5249–5256. [Google Scholar] [CrossRef]
  24. Lovato, G.; Kovalovszki, A.; Alvarado-morales, M.; Domingues, A.; Angelidaki, I. Modelling bioaugmentation: Engineering intervention in anaerobic digestion. Energy 2021, 175, 1080–1087. [Google Scholar] [CrossRef]
  25. Liang, T.; Elmaadawy, K.; Liu, B.; Hu, J.; Hou, H.; Yang, J. Anaerobic fermentation of waste activated sludge for volatile fatty acid production: Recent updates of pretreatment methods and the potential effect of humic and nutrients substances. Process Saf. Environ. Prot. 2021, 145, 321–339. [Google Scholar] [CrossRef]
  26. Shanmugam, S.; Sun, C.; Chen, Z.; Wu, Y.R. Enhanced bioconversion of hemicellulosic biomass by microbial consortium for biobutanol production with bioaugmentation strategy. Bioresour. Technol. 2019, 279, 149–155. [Google Scholar] [CrossRef]
  27. Mistry, A.N.; Kachenchart, B.; Pinyakong, O.; Assavalapsakul, W.; Jitpraphai, S.M.; Somwangthanaroj, A.; Luepromchai, E. Bioaugmentation with a defined bacterial consortium: A key to degrade high molecular weight polylactic acid during traditional composting. Bioresour. Technol. 2023, 367, 128237. [Google Scholar] [CrossRef]
  28. Additive, E.B. Optimising the AD circular economy. Filtr. Sep. 2021, 58, 8–10. [Google Scholar]
  29. Król, M.; Syguła-Cholewińska, J.; Sawoszczuk, T. Zeolite-Supported Aggregate as Potential Antimicrobial Agents in Gypsum Composites. Materials 2022, 15, 3305. [Google Scholar] [CrossRef]
  30. Cho, W.I.; Chung, M.S. Bacillus spores: A review of their properties and inactivation processing technologies. Food Sci. Biotechnol. 2020, 29, 1447. [Google Scholar] [CrossRef]
  31. Danilova, I.; Sharipova, M. The Practical Potential of Bacilli and Their Enzymes for Industrial Production. Front. Microbiol. 2020, 11, 1782. [Google Scholar] [CrossRef] [PubMed]
  32. Ma, G.; Chen, Y.; Ndegwa, P. Association between methane yield and microbiota abundance in the anaerobic digestion process: A meta-regression. Renew. Sustain. Energy Rev. 2021, 135, 110212. [Google Scholar] [CrossRef]
  33. Yi, J.; Dong, B.; Jin, J.; Dai, X. Effect of increasing total solids contents on anaerobic digestion of food waste under mesophilic conditions: Performance and microbial characteristics analysis. PLoS ONE 2014, 9, e102548. [Google Scholar]
  34. Tzun-Wen Shaw, G.; Liu, A.C.; Weng, C.Y.; Chou, C.Y.; Wang, D. Inferring microbial interactions in thermophilic and mesophilic anaerobic digestion of HOG waste. PLoS ONE 2017, 12, e0181395. [Google Scholar]
  35. Gao, M.; Guo, B.; Zhang, L.; Zhang, Y.; Liu, Y. Microbial community dynamics in anaerobic digesters treating conventional and vacuum toilet flushed blackwater. Water Res. 2019, 160, 249–258. [Google Scholar] [CrossRef]
  36. Mutungwazi, A.; Ijoma, G.N.; Ogola, H.J.O.; Matambo, T.S. Physico-Chemical and Metagenomic Profile Analyses of Animal Manures Routinely Used as Inocula in Anaerobic Digestion for Biogas Production. Microorganisms 2022, 10, 671. [Google Scholar] [CrossRef]
  37. Wang, N.; Yang, Y.; Xu, K.; Long, X.; Zhang, Y.; Liu, H.; Chen, T.; Li, J. Distinguishing anaerobic digestion from electrochemical anaerobic digestion: Metabolic pathways and the role of the microbial community. Chemosphere 2023, 326, 138492. [Google Scholar] [CrossRef]
  38. Carr, S.; Buan, N.R. Insights into the biotechnology potential of Methanosarcina. Front. Microbiol. 2022, 13, 4577. [Google Scholar]
  39. Pyzik, A.; Ciezkowska, M.; Krawczyk, P.S.; Sobczak, A.; Drewniak, L.; Dziembowski, A.; Lipinski, L. Comparative analysis of deep sequenced methanogenic communities: Identification of microorganisms responsible for methane production. Microb. Cell Fact. 2018, 17, 197. [Google Scholar] [CrossRef]
  40. Rice, E.W.; Baird, R.B. Methods for the Examination of Water and Wastewater. Am. Public Health Assoc. Am. Water Work. 2017, 23, 2–66. [Google Scholar]
  41. Wang, Q.; Garrity, G.M.; Tiedje, J.M.; Cole, J.R. Naïve Bayesian classifier for rapid assignment of rRNA sequences into the new bacterial taxonomy. Appl. Environ. Microbiol. 2007, 73, 5261–5267. [Google Scholar] [PubMed]
Figure 1. Total solids deviation and total biogas in the two biogas plants during the Evogen biogas additive administration; (A,B) Total solids deviation in BG01 and BG02, respectively, (C,D) Biogas production and methane content in BG01 and BG02, respectively. Day 50 is the interval day of Evogen supplementation.
Methane 02 00022 g001
Figure 2. Volatile fatty acids distribution and FOS/TAC ratio in the two biogas plants; (A,B) Volatile fatty acids distribution in BG01 and BG02, respectively; (C,D) FOS/TAC ratio and TAN values in the BG01 and BG02 during Evogen biogas additive introduction. Day 50 is the interval day of Evogen supplementation.
Methane 02 00022 g002
Figure 3. Abundance of the 16S rRNA operational taxonomic units in BG02 over Evogen biogas additive administration classified in (A) Phyla, (B) Classes and (C) Families ranks. Arrows indicate hydrolyzing (black and green) and methanogen (red) bacteria families.
Methane 02 00022 g003
Figure 4. Abundance of the 16S rRNA operational taxonomic units in BG01 (D1 and D2) over Evogen biogas additive administration classified in (A) Phyla, (B) Classes and (C) Families ranks. Arrows indicate hydrolyzing (black and green) and methanogen (red) bacteria families.
Methane 02 00022 g004
Table 1. Physicochemical parameters measured in two biogas stations (BG01 and BG02) during the Evogen biogas additive administration.
Biogas PlantSampling Day pHFOS (mg (AcOH)/L)TAC
(mg (CaCO3)/L)
FOS/TAC RatioTS
(%)
VS
(%)
N-NH4 (mgN/L)Biogas (m3)Methane (%)H2S (ppm)
BG01 (D1)Day 10Before Evogen8.3215486520.2499.617.95224323,86154.4061
Day 208.4220484420.26111.379.38282024,53053.9070
Day 307.9117840050.29410.909.27237124,63353.4053
Day 408.6127643320.29410.679.02225224,98750.2071
Day 508.4233977150.3039.718.07250025,18851.4053
Day 60During Evogen8.1225510,2280.2209.237.10243623,95852.4053
Day 707.9232110,5920.2199.367.37260824,04353.9055
Day 808.1218687940.2499.247.17254325,18754.0053
Day 908.0256210,5950.2429.307.41154724,03153.9051
Day 1008.2289416,6450.22110.568.43315625,12154.1034
BG02 (D1)Day 10Before Evogen7.9445114,3770.3109.447.013333937755.04116
Day 208.1385316,5310.2339.116.753044925353.77145
Day 308.1314015,0290.2099.186.723313896554.08163
Day 408.2241211,5910.2089.837.103496884356.01211
Day 508.2236812,2030.1948.566.102861865753.95138
Day 60During Evogen8.1253411,9060.2138.436.012609945554.0921
Day 708.2268914,3440.1878.576.092629998755.04119
Day 808.0400118,3870.2188.245.86314310,45656.6698
Day 908.0238113,9660.1707.604.84220910,56358.47117
Day 1007.9298514,2700.2098.586.24265610,89856.70107
Table 2. Technical specifications and operational parameters amongst the two biogas plants (BG01 and BG02).
Biogas PlantBG01BG02
Electrical Power
Capacity
2 MW1 MW
Pre-tank1 pre-tank1 pre-tank
Daily Supply40–100 tn/d: corn silage
8 tn/d: LD recirculation from storage tank
1–8 tn/d: glycerol
21 tn/d: waste residues
20 tn/d: pomace (olive, fruits)
8 tn/d: mix corn silage, potatoes,
sunflower
7 tn/d: rye silage
3 tn/d: beetroot
30 tn/day: chicken manure (solid)
2 tn/day: liquid digested residue (after separator)
20 tn/d: organic waste (food waste, etc.)
30 tn/d: whey
60 tn/d: cattle manure (liquid)
Feeding Rate2.1 tn/30 min160 tn/day
First Digester (D1)4000 m34250 m3
Temperature44 °C41 °C
HRT50 days40 days
StirringConstantly45 min/h
Second Digester (D2)2.800 m3-
Temperature39.5 °C-
HRT20 days-
Recirculation of Digested ResidueYesYes
Disclaimer/Publisher’s Note: The statements, opinions and data contained in all publications are solely those of the individual author(s) and contributor(s) and not of MDPI and/or the editor(s). MDPI and/or the editor(s) disclaim responsibility for any injury to people or property resulting from any ideas, methods, instructions or products referred to in the content.

