1. Introduction
In 2019, more than one-third of the world’s population did not have access to clean cooking technologies and fuels [
1]. Moreover, in Sub-Saharan Africa, the increase in the utilization of so-called clean fuels (e.g., liquefied petroleum gas, natural gas, etc.) lagged population growth [
1]. Most African countries still use biomass, notably firewood, as the main source of energy for cooking [
2,
3]. Alternative cooking energy sources used in these countries include charcoal, kerosene, diesel and, to a more limited extent, gas.
Cooking with such energy sources, particularly with firewood, has several drawbacks. From an environmental point of view, firewood harvesting causes degradation of forest ecosystems [
4] and is a potential source of deforestation [
5], especially in places where it is used for charcoal production [
6]. Healthwise, the use of inefficient stoves and energy sources prone to inefficient combustion (particularly charcoal and firewood) potentiates health problems such as respiratory and cardiovascular illness due to the emission of particulate matter and gases such as carbon monoxide [
5,
7,
8]. Moreover, unlike the use of stoves powered by gases (liquified petroleum gas, natural gas or biogas), ethanol or electricity, even the use of efficient stoves powered with biomass is associated with health risks [
9,
10]. In terms of human and economic development, the harvesting of firewood and other biomaterials leads to a reduction in time available for schooling, productive or leisure activities, predominantly affecting women and children [
11,
12]. Finally, in terms of safety, collecting biomass fuels can be risky due to potential attacks by wildlife and humans; moreover, the use of combustion stoves can increase the risk of fires [
12]. It should be noted that the drawbacks associated with the use of firewood and charcoal extend beyond the first-order effects and the aforementioned risks. For example, reduced availability of wood can negatively affect the nutritional status of households by causing changes in cooking and eating habits [
13].
Solar energy has the potential to become the main source of energy on the African continent due to the high annual solar irradiation. It can be used for various purposes such as generating electricity, heating and cooling, as well as cooking. The use of solar energy for cooking allows these populations to overcome the above-mentioned drawbacks and is an environmentally beneficial solution with zero marginal costs.
Traditionally, solar cooking solutions use solar thermal energy in solar ovens or cookers, equipment that collects solar radiation and converts it into heat used to cook food. Their mode of operation is based on reflecting solar radiation to a focal area where the pot or pan (or frying pan in some cases) is placed, and/or trapping and absorbing solar radiation in an enclosure that retains the heat [
14,
15,
16].
The design and implementation of solar box cookers have improved in terms of insulation, design affordability and the shape of the cooking vessels. These improved designs have minimal environmental impact and are cheap to build. Mirdha and Dhariwal [
17] concluded that a box-type solar cooker with five booster mirrors was the optimal design for cooking two meals per day. Ozturk [
18] found that a box-type cooker outperformed a concentrating cooker in terms of temperature, power, energy efficiency and exergy efficiency. However, solar box cookers are known to cook slowly and take a long time to attain the maximum desired temperature for cooking.
In contrast, solar-concentrating cookers, such as parabolic and trough designs, offer an alternative to box cookers but are less popular due to their higher costs and construction complexity. Recent improvements have focused on enhancing their ease of use, portability and thermal power output, developing portable parabolic cookers with automatic tracking axes, reflective satellite dishes and Fresnel concentrators. Solar panel cookers, which are known for their simplicity and low cost, use reflective materials to concentrate sunlight on a cooking vessel. Various designs, including light funnels and different panel configurations, have been explored to achieve higher temperatures and efficiency [
14]. However, these cookers have yet to find traction in the market as their value-addition is not yet high enough.
Currently, photovoltaic (PV) technologies present advantages compared to other renewable technologies, including low investment and operating costs and the ability to gradually increase the size of the system due to its modularity. Thus, solar photovoltaic technology is one of the preferred energy technologies for developing countries. A significant reduction in price of photovoltaic modules has created an opportunity for the development and implementation of photovoltaic-powered solutions for cooking, increasing the interest and relevance of their development and study. Considering the African context, photovoltaic-powered electric cooking (PVPEC) solutions can be exploited in small electricity grids (mini grids) or in stand-alone systems, representing a modern clean cooking technology that can overcome the existing limitations in availability of cleaner cooking fuels and electric power distribution in several African countries. Examples of electric cooking solutions that can be powered by solar photovoltaic technologies are the use of induction or vitro-ceramic plates, rice cookers and electric pressure cookers (EPCs). Of these, EPCs have been identified as the most efficient solution, in addition to having other benefits such as the inclusion of automatisms that allow other tasks to be performed during the cooking process [
2,
3].
The exploitation of solar electric cooking (eCooking) as a high-value-added approach to address energy access and efficiency is considered as a viable pathway. Kachione et al. [
19] have worked extensively with rural communities in Malawi to develop low-cost direct-drive solar electric cooking products using off-grid solar-photovoltaic-powered solar electric cookers with a pay-as-you-go system. Their findings showed significant reductions in cooking time and regular cost savings. However, fuel stacking remained an issue as vendors found it easier to use alternative fuel sources depending on the type of food cooked. Zubi et al. [
20] developed and assessed a solar home system using an EPC and Light Emitting Diode lamps to cover cooking and lighting needs in developing regions, finding it “an effective solution to replace traditional biomass and fossil fuels in developing regions” with an “incremental cost advantage over existing practices” over time.
The use of EPCs has become a popular cooking method since these electric appliances reduce time spent cooking high-energy-demand foods, create a healthy living environment in households and contribute to reducing carbon emissions associated with burning biomass fuels [
21]. With large enough panels and well-sized batteries, solar PV systems can provide households with enough energy for cooking. However, the development of PV powered EPC solutions for off-grid applications is still in its early phases and the challenge to make them energy-efficient, cost-effective and functional remains.
EPCs have been considered attractive due to their energy-saving capabilities resulting from utilizing insulation, automatic control and pressurization features. Modern Energy Cooking Services (MECS) compared the safety features and functions of eight EPCs produced by various manufacturers [
22]. One of the cookers was a 12 V DC unit, while the other seven were designed for 230 V AC supply. All eight EPCs presented similar geometries, while their constructive and operational features varied significantly, and the 12 V direct current (DC) model presented significant safety concerns.
In 2020, MECS analyzed a smaller version of that 12 V DC EPC, finding that its low nominal operating power of only 300 W is beneficial in comparison to conventional AC cookers (typically rated between 1000 W and 1200 W), reducing the size required for the PV panels and battery system. However, the MECS assessment also found the cable sheathing to be weak, posing several risks (e.g., electrical shocks and fire hazard) and affecting the appliance’s overall performance [
23]. This highlights the need for further industrial development of low-powered DC EPCs.
The Long-Term Joint Research and Innovation Partnership on Renewable Energy (LEAP-RE) project, co-funded by the European Union, is developing a standalone EPC-based solar electric cooker for use in rural African locations to address the challenges caused by traditional cooking methods used in rural communities in Africa, namely in Kenya and Rwanda. To reach large-scale deployment and implementation of PVPEC solutions and to evaluate how these technologies can meet the needs of local populations and their required design, it is necessary to assess the availability of the solar resource and its relationship with local cooking habits. However, cooking habits present strong regional variations and there is a lack of experimental data related with EPC energy demand profiles in Kenya and Rwanda.
To overcome this limitation and gather the required information, a survey and an experimental campaign were performed to characterize the cooking habits and EPC energy demand in real operating conditions. The regions of Kericho and Kisumo in Kenya and Bugesera in Rwanda were selected for the campaign, encompassing both rural and urban areas. The electricity used by the EPCs was sourced from the grid, allowing the assessment of cooking habits and the corresponding energy demand profile during regular use of the EPCs.
This article presents a statistical analysis of the survey results and data from an experimental campaign to characterize cooking patterns and the electricity demand required to power EPCs in real use conditions. In contrast to several existing studies, the current analysis focuses on two distinct countries, enabling the identification of the benefits of EPC solutions compared to conventional methods in two different contexts. Moreover, this article provides insights into the solar resource availability in the regions of interest and evaluates the feasibility of utilizing solar power to support EPC solutions.
The methodology used in this work is presented in
Section 2. The analysis of the cooking habits in the Kericho and Kisumo regions in Kenya and Bugesera region in Rwanda and associated energy demand are presented in
Section 3. Additionally, in
Section 4, the solar power’s average daily profile is established for a standard PV system and an assessment of the solar PV generation required to supply the electric cooking energy demand is performed for those regions.
2. Methodology
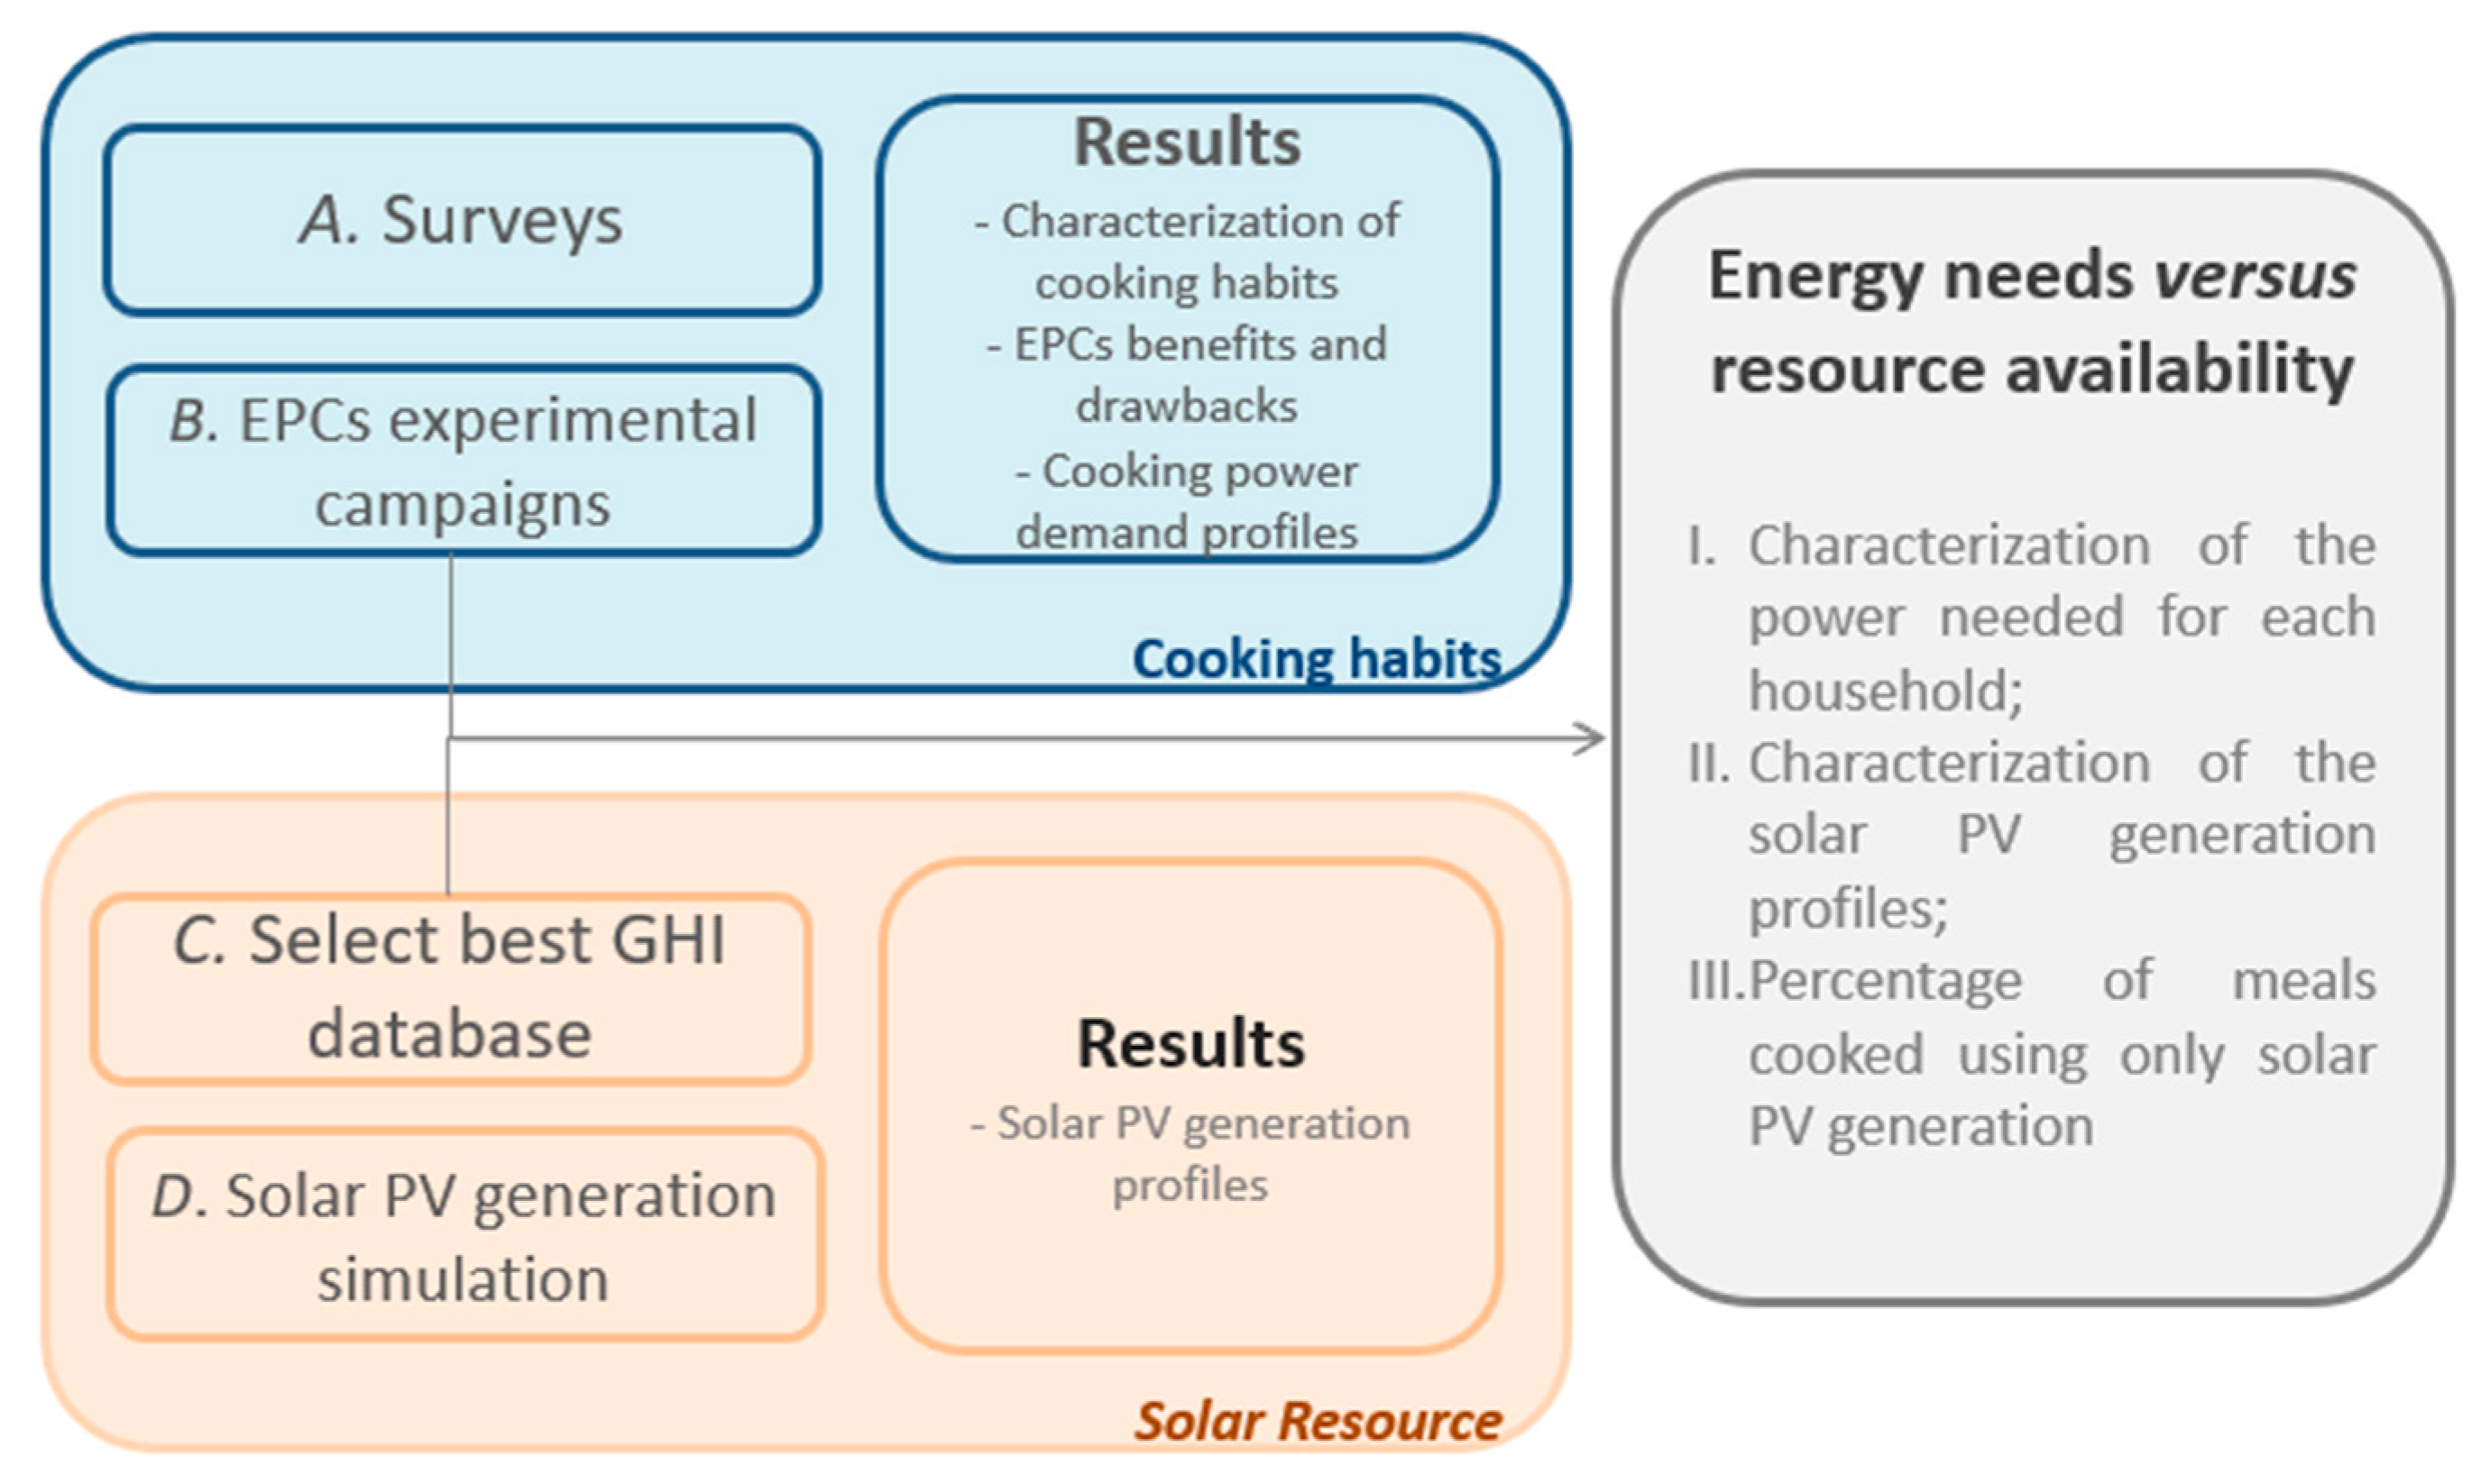
This analysis adopted a three-step methodology. Firstly, the cooking habits and the electricity demand from the EPCs were established based on a (i) survey and an (ii) experimental campaign (
Section 2.1). Secondly, the typical production profile of autonomous PV systems in the regions of interest was estimated (
Section 2.2). Finally, the solar energy availability profile was compared with the EPCs‘ electricity demand profile (
Section 2.3). An overview of these three steps is shown in
Figure 1.
2.1. Cooking Habits
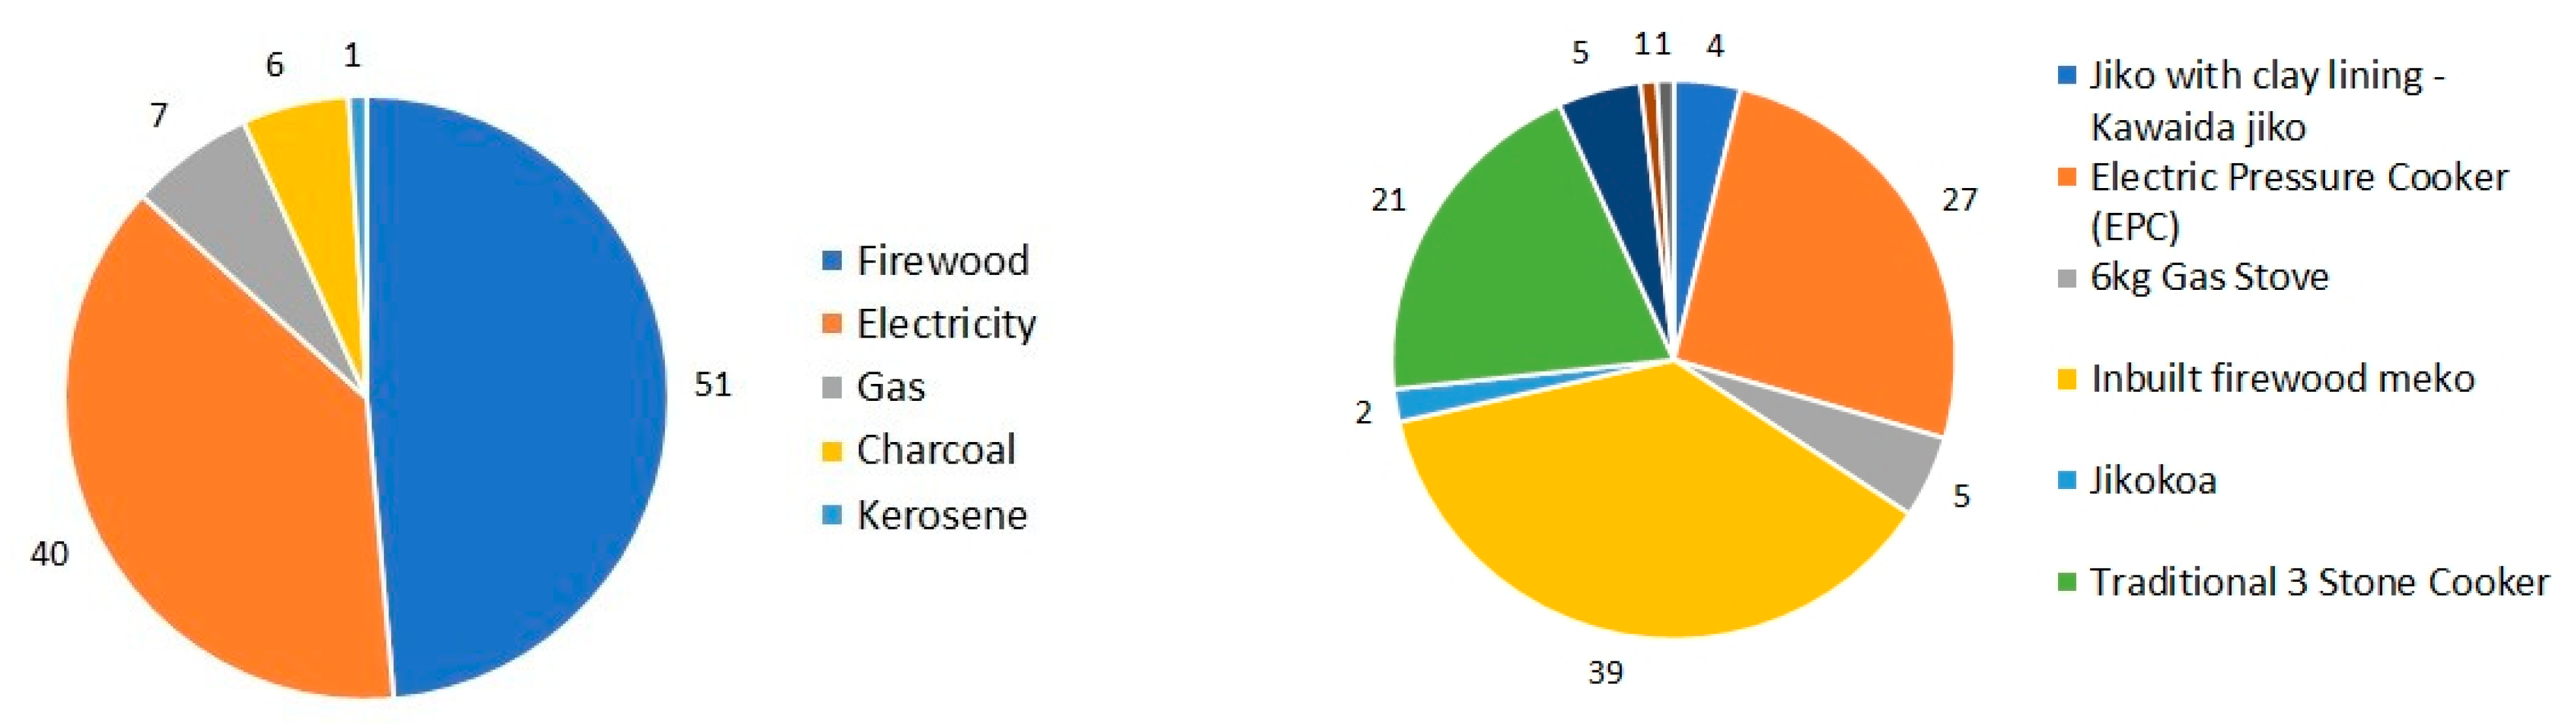
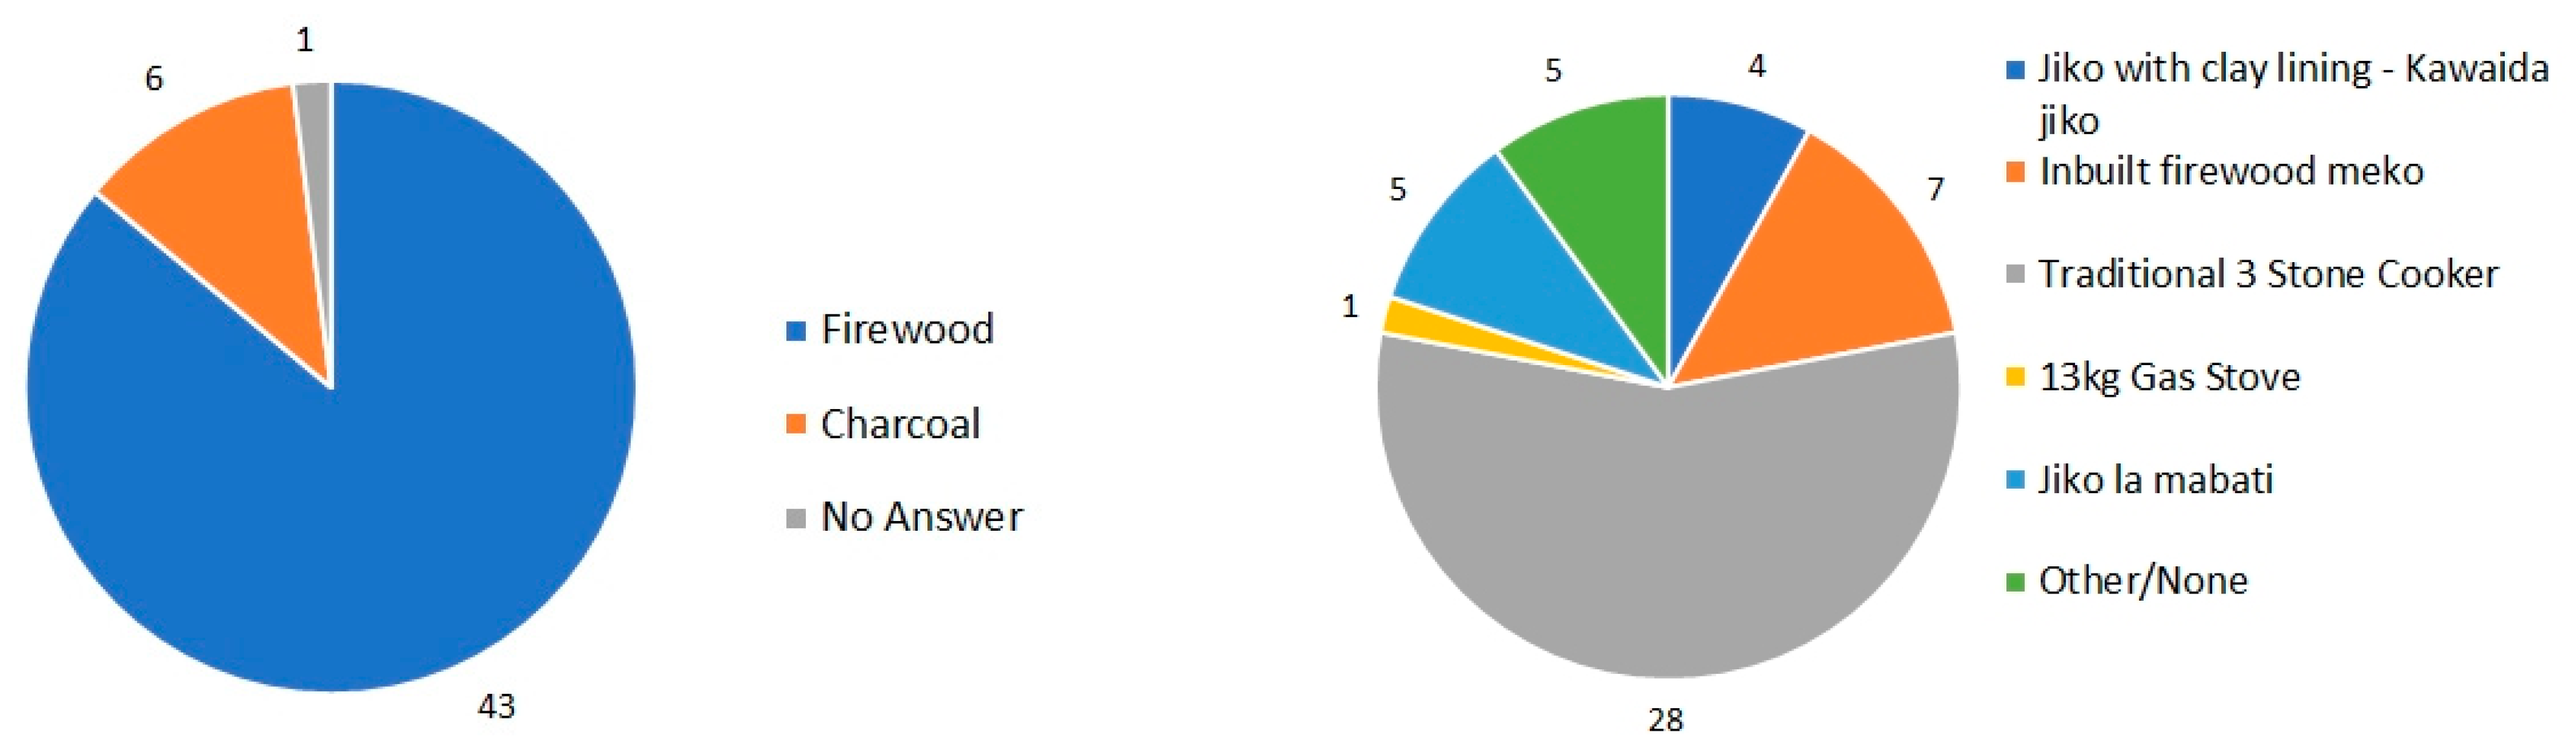
To characterize local cooking habits, surveys were conducted in several houses, where residents answered a wide range of questions about their cooking habits as well as their social, economic and energy context.
The survey was developed using the software “SurveyCTO” and the data were collected “door to door”, in person, with the help of electronic tablets to register the responses. To retrieve the relevant information from the households’ data, a Geographic Information System (GIS) was used (© ESRI ArcGIS) due to the large amount of data and to be able to understand the distribution of the solar resource assessment in the surveys’ area. A set of queries was defined to obtain and process the information related to the number of inhabitants, diners, most used fuels and cookers and cooking habits (types of food and cooking duration).
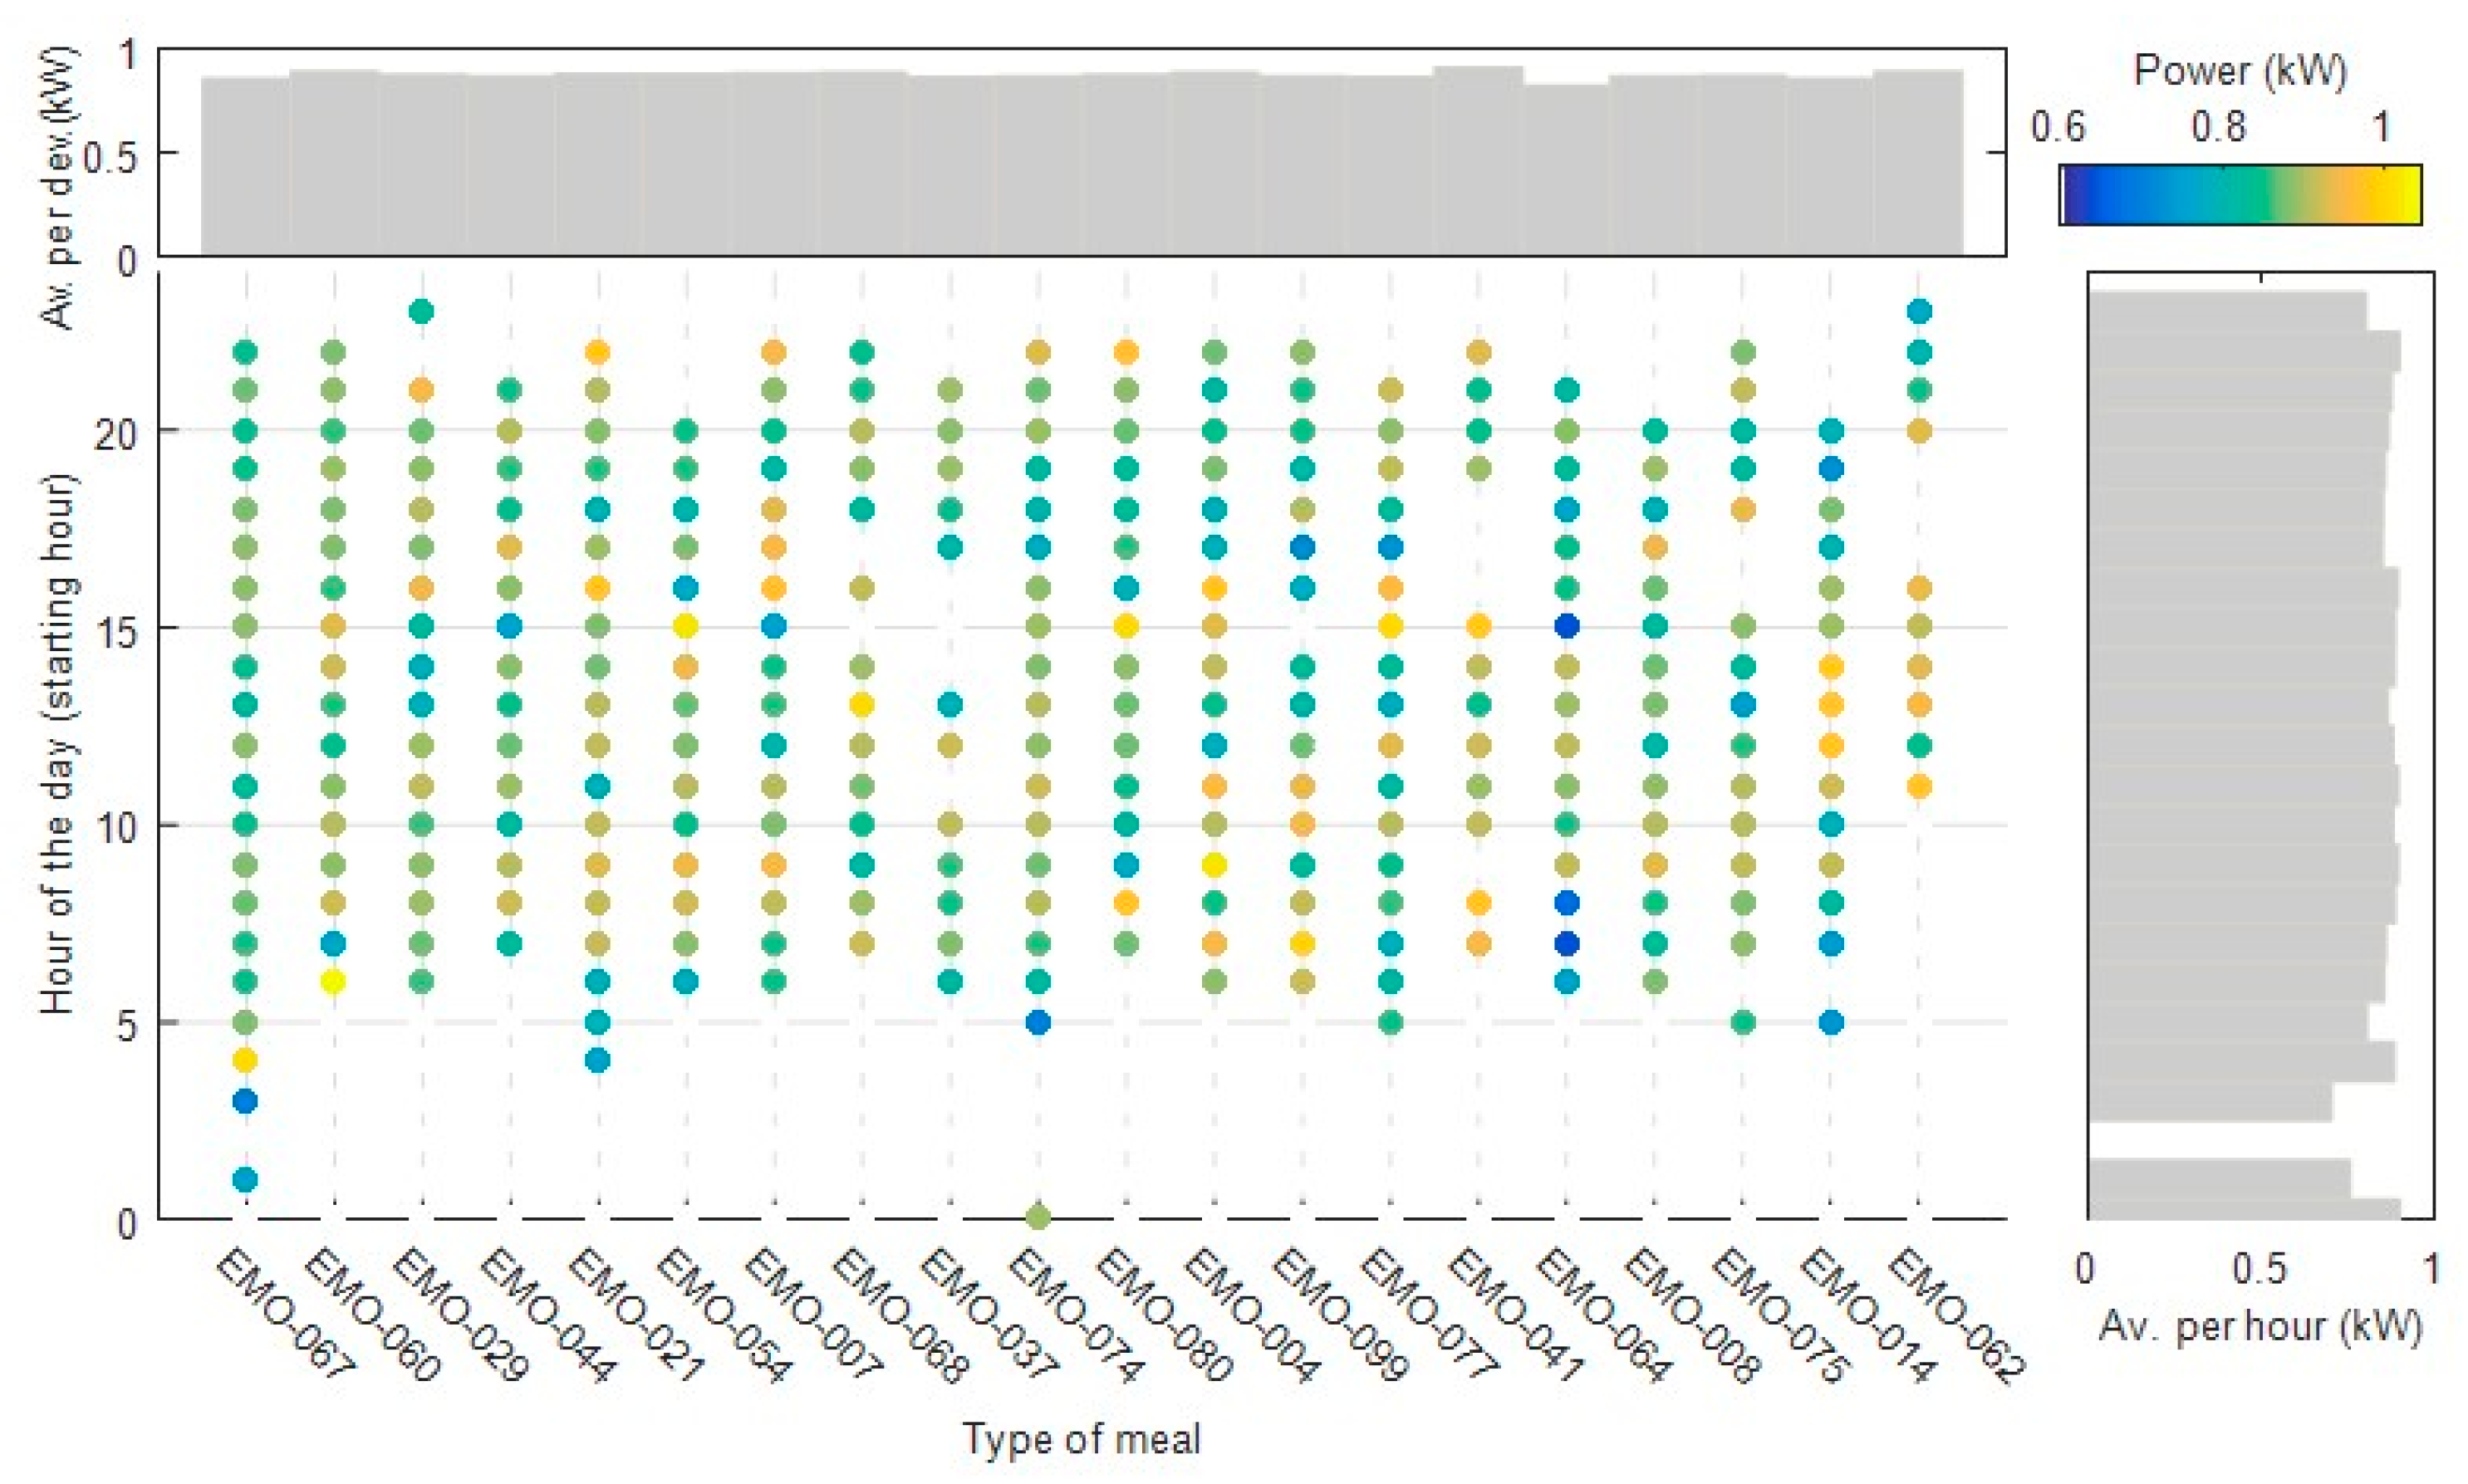
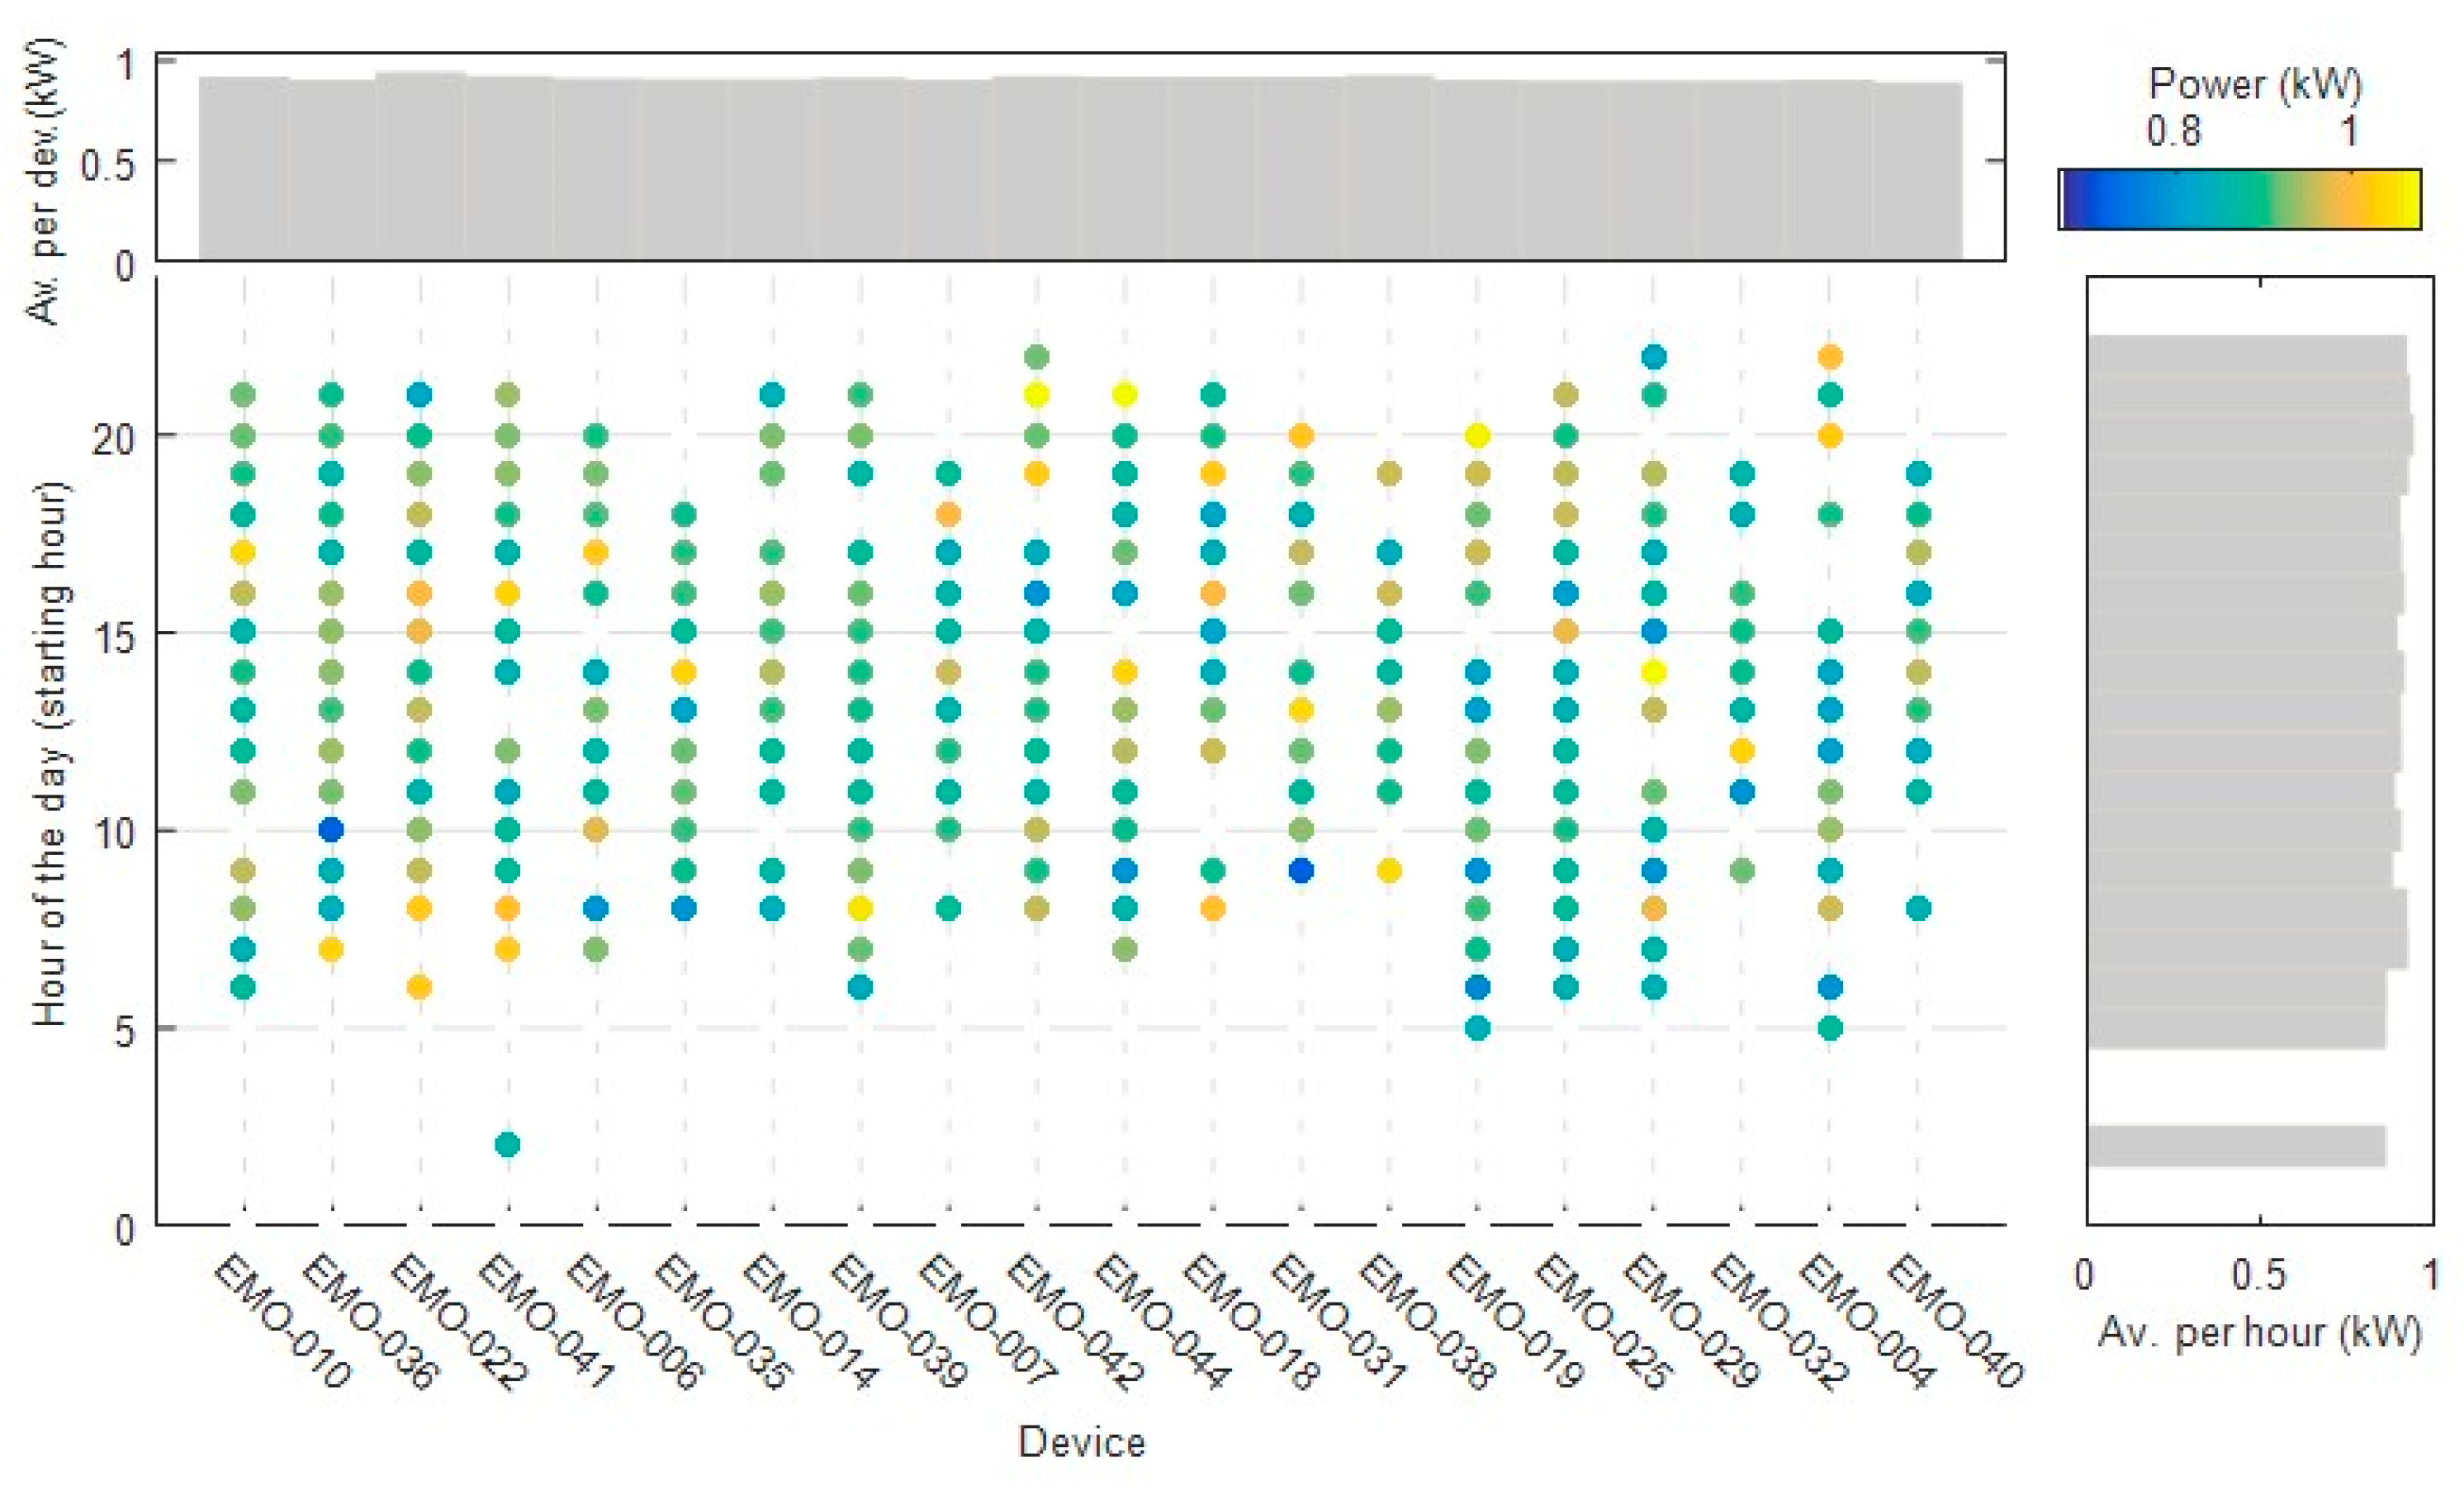
In a second phase, EPCs and measuring devices (smart meters) were distributed to characterize the electricity demand to feed these cookers under real use conditions. The EPCs were powered with electricity from the main grid. This allowed for the establishment of electricity demand profiles for the EPCs, corresponding to actual cooking needs and avoiding the influence of the variable behavior of PV power availability.
A sample of 105 households was considered in Kenya and 50 in Rwanda. The experimental data collection campaign took place between June 2021 and January 2022 in Kenya and June 2022 and September 2022 in Rwanda. Using a smart meter for each EPC, the following information was recorded: “Device name”, “Time”, “Meal”, “Cook time” and “Used energy (kWh)”.
2.2. Solar Energy Availability
To understand whether the energy required for cooking processes can be supplied by solar systems at a given location, and to design or size such systems, it is necessary to quantify the amount of solar irradiance available for energy conversion over a period of interest. Such information can be obtained by performing a solar resource assessment, which requires historical irradiance data from local ground-based measurements, meteorological model outputs or satellite measurements [
24,
25]. The data and methodologies used for those assessments should (i) ensure reliability; (ii) account for different time-scale phenomena and intra/inter annual patterns and trends by considering long-term data; and (iii) have low uncertainty.
Several databases with historical irradiance data from ground-based measurements, meteorological model outputs or satellite measurements are available, openly or under paid access. However, their accuracy, uncertainty and geographical and temporal coverage are highly variable.
Experimental campaigns using measurement stations are the most robust way to characterize the solar resource at a specific site. These stations usually have lower levels of uncertainty when compared to other methods. However, experimental measurement campaigns, while accurate, are costly and prone to equipment failure. Currently, the African continent does not have a dense network of meteorological stations with publicly available data, limiting the use of ground-based measurements in solar resource assessments for PVPEC deployment in African countries such as Kenya and Rwanda.
Examples of the most relevant databases that have publicly available data for the African continent are identified below:
Global Energy Balance Archive (GEBA), available at
www.geba.ethz.ch (accessed on 25 March 2022);
Southern African Universities Radiometric Network (SAURAN), available at
https://sauran.ac.za (accessed on 25 March 2022);
Trans-African Hydro-Meteorological Observatory (TAHMO), available at
https://tahmo.org (accessed on 25 March 2022);
To characterize the local solar resource, or to perform a regional and/or national resource assessment, without using an extensive and expensive network of solar-radiation-measuring stations, it is common to resort to mesoscale numerical models (usually referred to as numerical weather prediction models, NWP) [
26]. These models parameterize and simulate in detail the atmosphere and its circulation mechanisms. NWP models provide meteorological parameters such as cloud cover/fraction, air temperature and pressure, etc. There are two major groups of NWP models: global models (which simulate the entire terrestrial globe) and regional/mesoscale models (also known as limited area models) [
27]. The main differences between global and regional models are associated with the spatial and temporal resolution of each model and the geographical area simulated. In addition, mesoscale/regional numerical models need to be forced with data from the global models at the boundaries of their domains (surface, laterally and at the top of the domain). Examples of publicly available numerical model data are ERA-Interim, NASA-MERRA-2 and ECMWF-ERA5.
The use of geostationary meteorological satellites for deriving solar radiation components at specific locations or regions is currently the most usual approach for solar resource assessment studies [
24]. Satellite-based methodologies for solar applications have evolved greatly in recent years, supported by improvements in remote acquisition systems coupled with computational capabilities. There are two main approaches for dealing with satellite-based information that can be classified as physical or empirical [
28]. Physical approaches are based on satellite information to resolve radiative transmissivity phenomena in the atmosphere, allowing for the description of the optical properties of clouds that impact radiation at the Earth’s surface. Empirical approaches, on the other hand, are based on the statistical relationship between satellite observations and surface information. Of the empirical approaches, the cloudiness index is the most commonly used [
24]. In recent years, the synergies between the different approaches have been utilized, allowing for the development of semi-empirical approaches. There are several solar radiation databases derived from satellite information and web services that provide solar radiation time series, such as the following:
CM SAF Surface Solar Radiation Data Set–Heliosat (SARAH), available at
https://wui.cmsaf.eu (accessed on 25 March 2022);
National Aeronautics and Space Administration (NASA) Prediction of Worldwide Energy Resources (POWER), available at
https://power.larc.nasa.gov (accessed on 25 March 2022);
A more detailed list of databases (including paid commercial services) is provided in [
24].
Database Selection for Solar Resource Assessment in Kenya and Rwanda
No long-term ground-based measurements are available for the three regions of interest (Kericho and Kisumo in Kenya and Bugesera in Rwanda); thus, it is necessary to use satellite or NWP data to perform the solar resource availability analysis.
Although satellite or NWP (or combined) methodologies constitute valuable information, they require validation to determine the possible deviations in the values of the estimates. Thus, in this work, solar irradiance data for both Kenya and Rwanda were obtained from one of the satellite databases previously identified. To choose the best database, a validation procedure with ground-based measured temporal series was performed for the global horizontal irradiance (GHI) time series of the following databases: CAMS [
29], POWER [
30] and PVGIS [
31]. This validation used ground-measured data, obtained in Kenya at three sites during the period between 8 December 2019 and 31 December 2021, which are publicly available through the World Bank Group at
www.energydata.info/dataset (accessed on 25 March 2022).
The validation of the satellite data was performed applying the results for the following metrics [
32]: correlation coefficient; bias (BIAS); and root mean square error (RMSE).
Table 1,
Table 2 and
Table 3 present the validation results for CAMS, PVGIS and POWER databases, respectively.
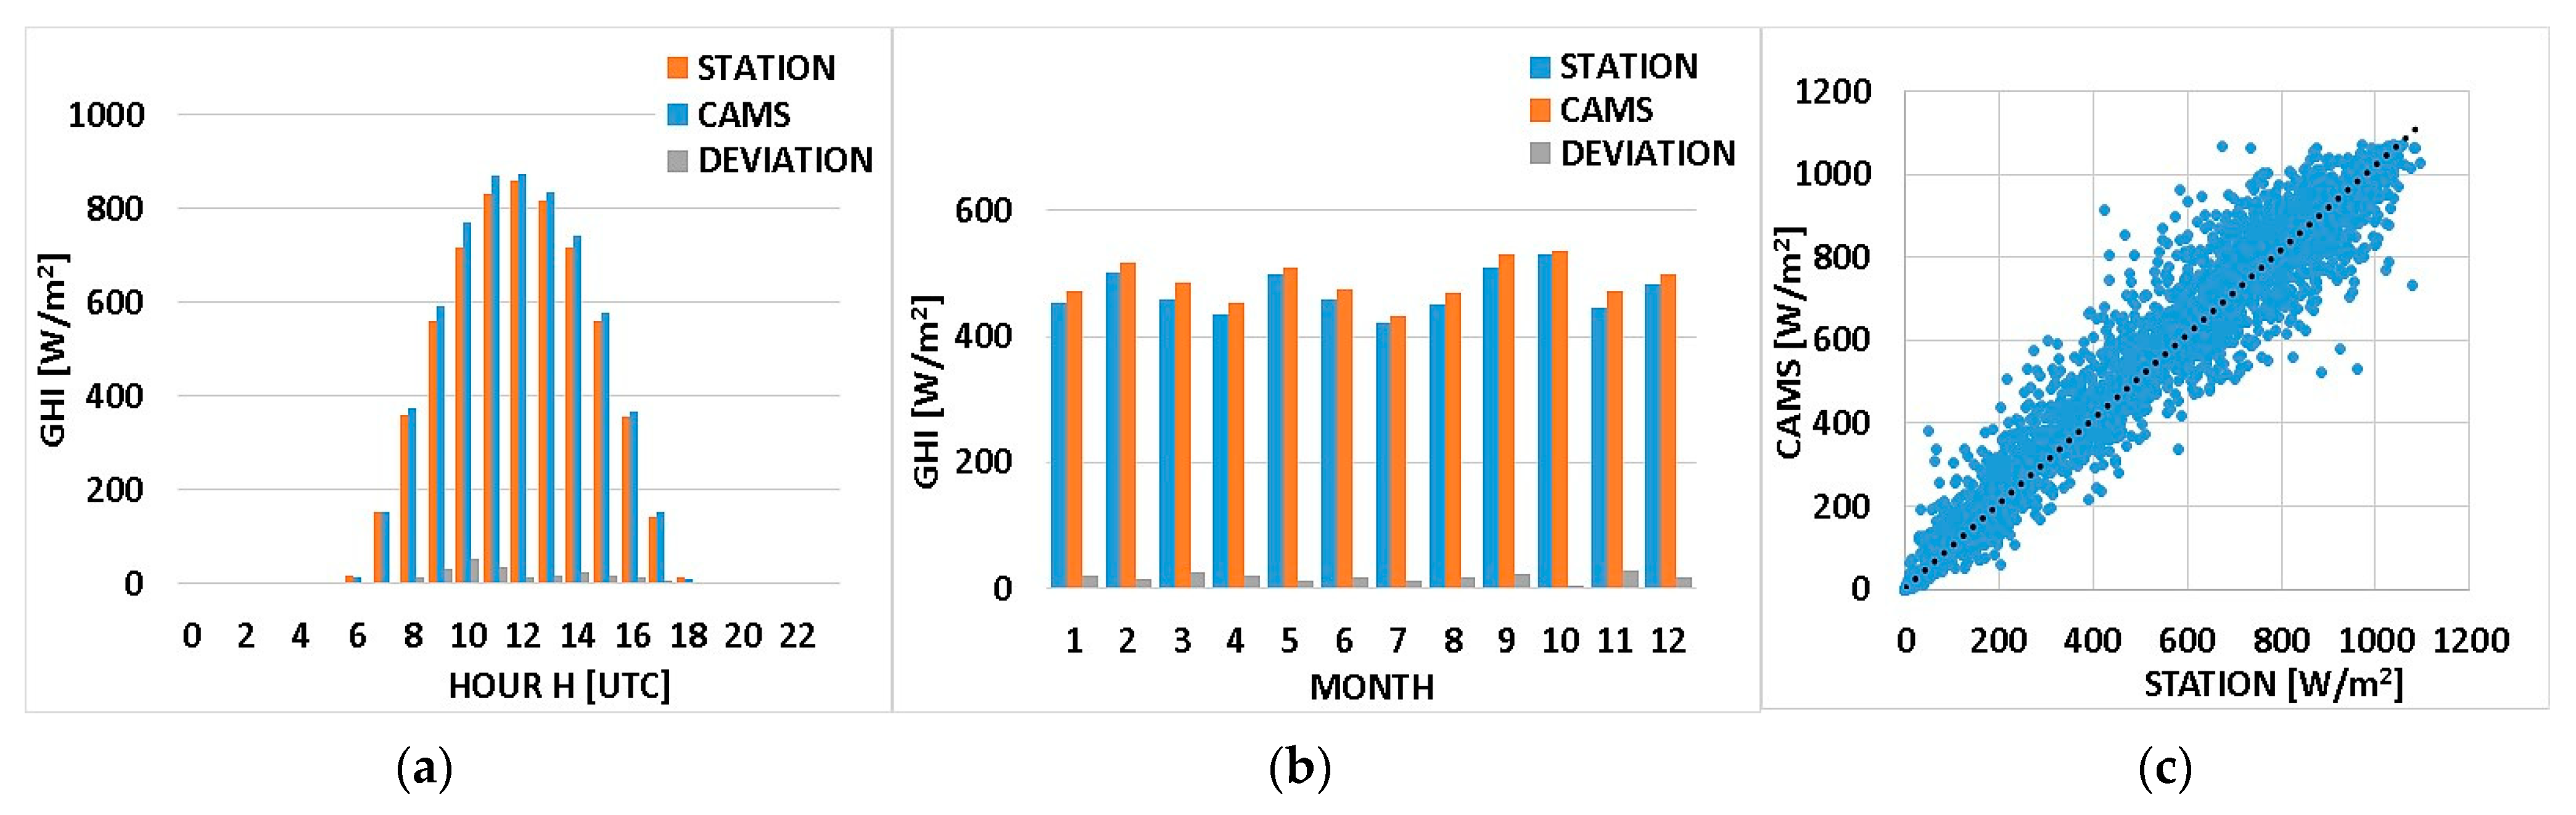
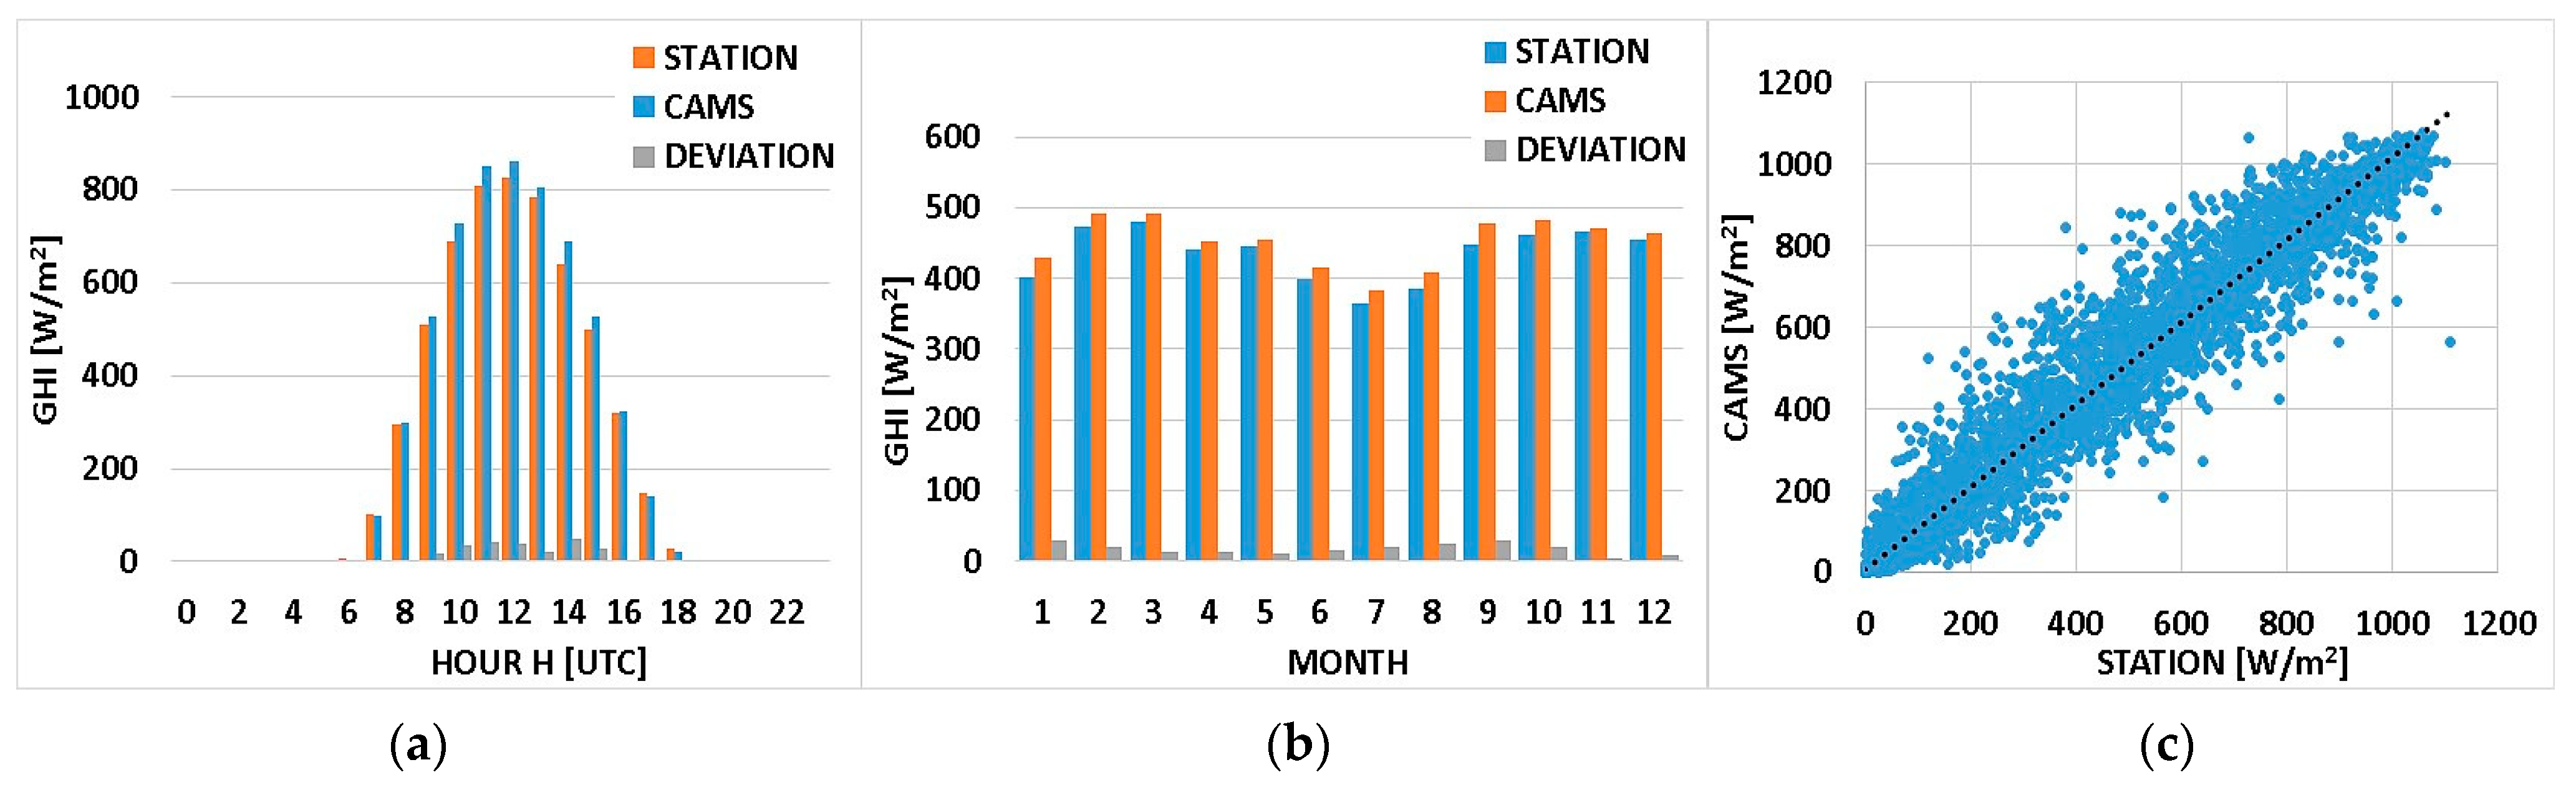
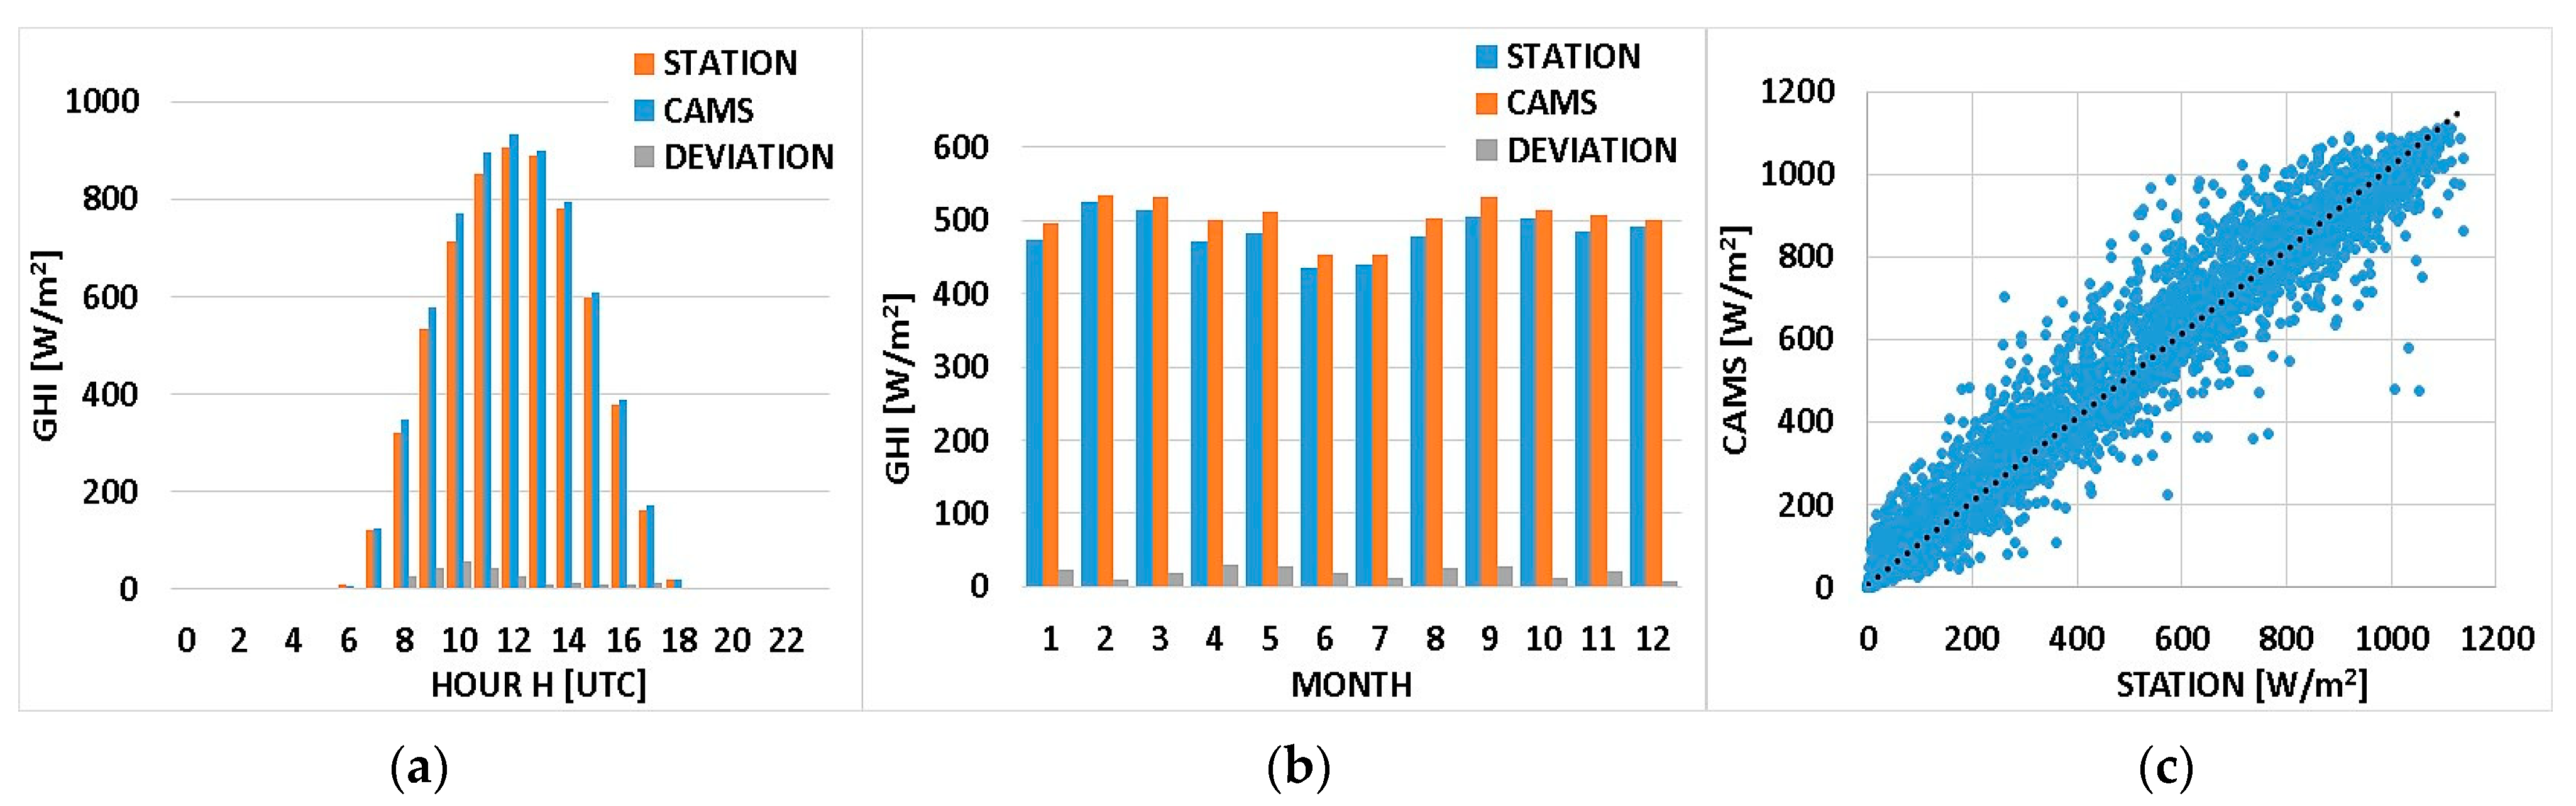
Figure 2,
Figure 3 and
Figure 4 show the average daily and monthly GHI profile and the scatter plot between the observed data at the three stations with CAMS data.
Overall, the validation results for Kenya confirmed that satellite-based databases are perfectly suited for providing solar data, as they have high correlation values with values above 0.99, indicating that the solar variability is well estimated using the satellite data. The maximum absolute bias error observed was 5.69% and the maximum RMSE value was 22.77%. These values are in line with global validation studies of the SolarGIS and CAMS radiation service for African countries. It was also possible to verify that, for all three stations, the daily mean and daily monthly profiles show bias values ranging between 1% and 9%, these values also being in agreement with the global validation studies indicated above. The validation results show that the methodology based on CAMS satellite data provides the best correlation and RMSE values with lower bias values. For Rwanda, no observations are available for validation.
Considering these results, it was decided to use CAMS data for the remainder of this work.
2.3. EPC Electricity Demand versus Solar Energy Availability
To assess the availability of solar energy, the global horizontal and diffuse horizontal irradiance values from the CAMS database were used to generate an estimate of the PV power available at each of the mean centroid coordinates of house areas. The available PV power was estimated through a simulation performed with PVSYST using standard crystalline silicon PV technology and considering an optimal slope and azimuth for an inclined mounting of solar modules at each centroid coordinate locale. For Rwanda, one centroid coordinate point was considered for the analysis while in Kenya, the most western centroid coordinate point was considered.
The daily average PV power profile was analyzed for the full year and according to the climate of both countries, thus, PV power daily average profiles for the wet season and for the dry season were prepared. According to Peixoto et al. [
33], Kenya’s wet season occurs mainly from April to September and the dry season from October to March, while in Rwanda, the wet season runs from September to May and the dry season from June to August. The PVSYST simulations cover the years of 2021 to 2022 (2 years of continuous data), the ones during which the experimental campaigns with EPCs took place.
The analysis of the EPC electricity demand and solar energy availability was performed in terms of the percentage of meals cooked using PV power only, i.e., the periods when the solar PV system was capable of generating at least as much electricity as that consumed by the EPC. This analysis addresses PV systems of different sizes (i.e., peak capacity).
4. Energy Demand versus Resource Availability
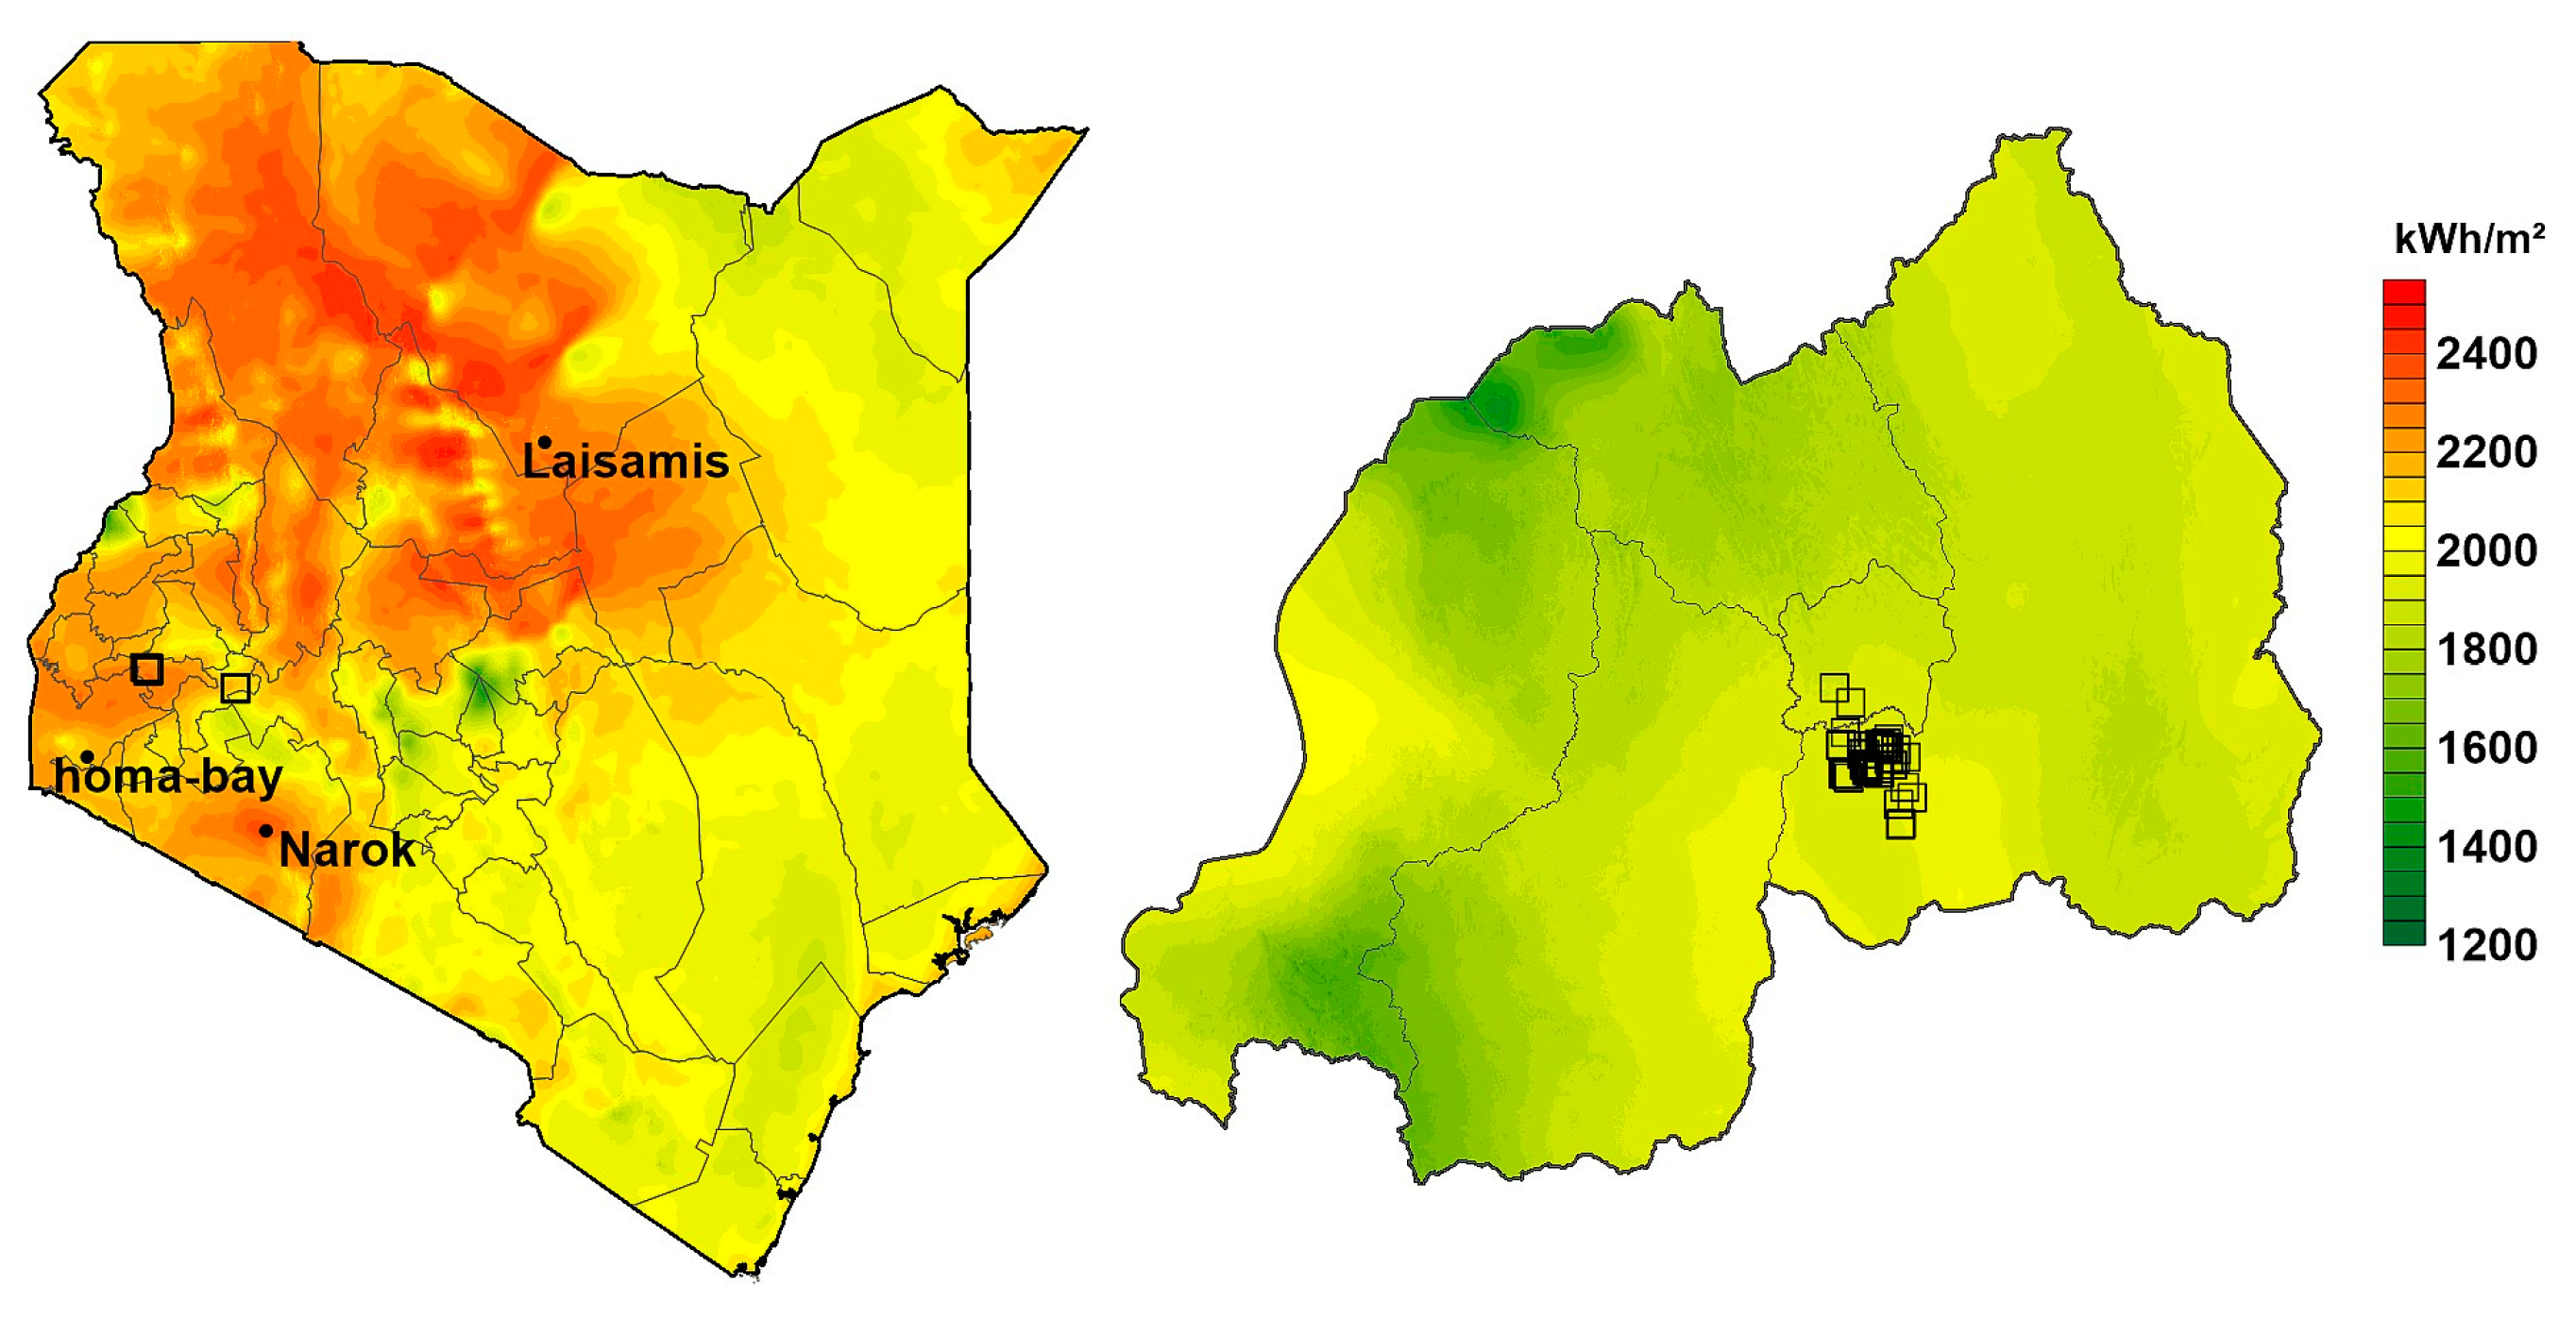
Figure 9 provides an overview of the solar resource available in Kenya and Rwanda, as well as the location of the experimental campaigns with EPCs. The GHI parameter is commonly used by the solar photovoltaic industry to estimate the power output of solar modules. Therefore, GHI was the parameter selected for mapping the solar resource availability.
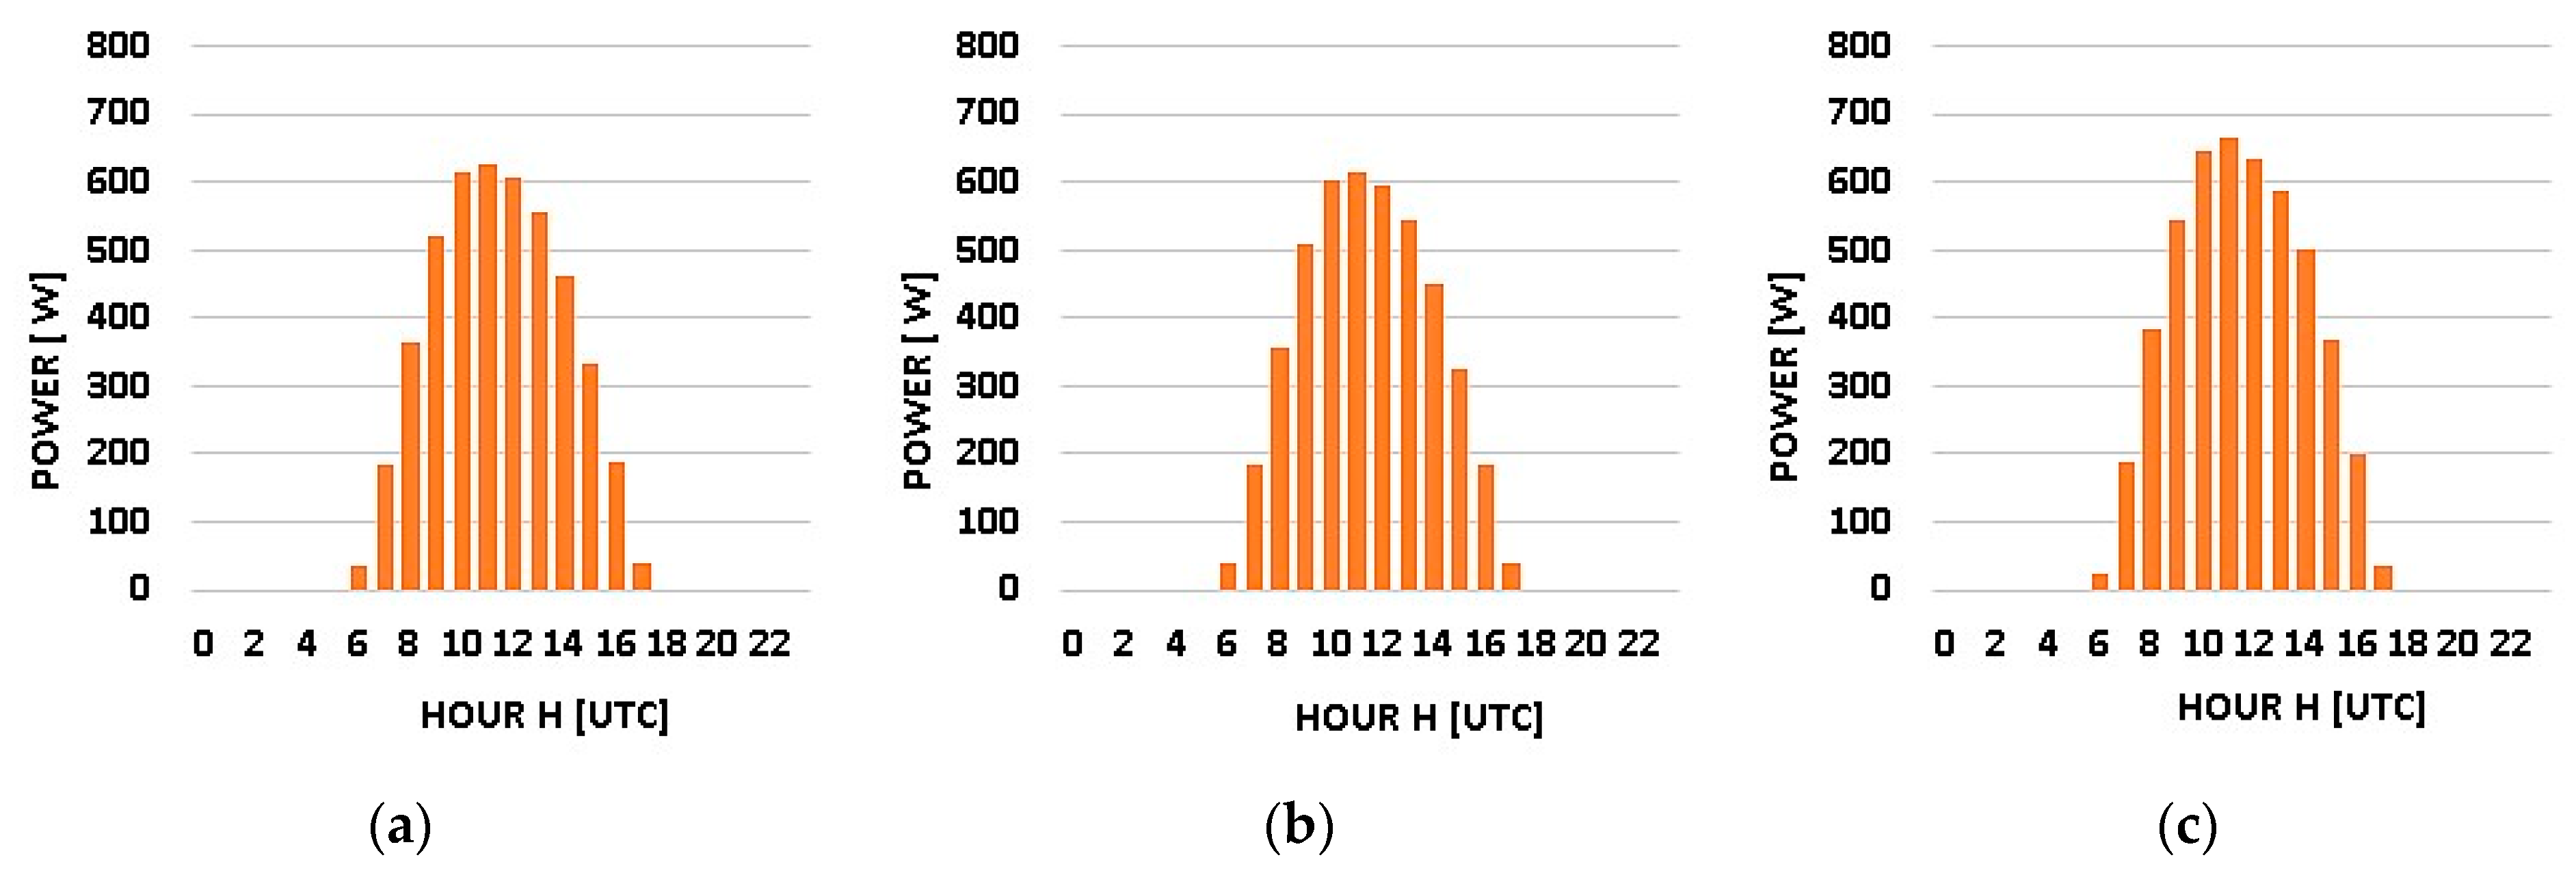
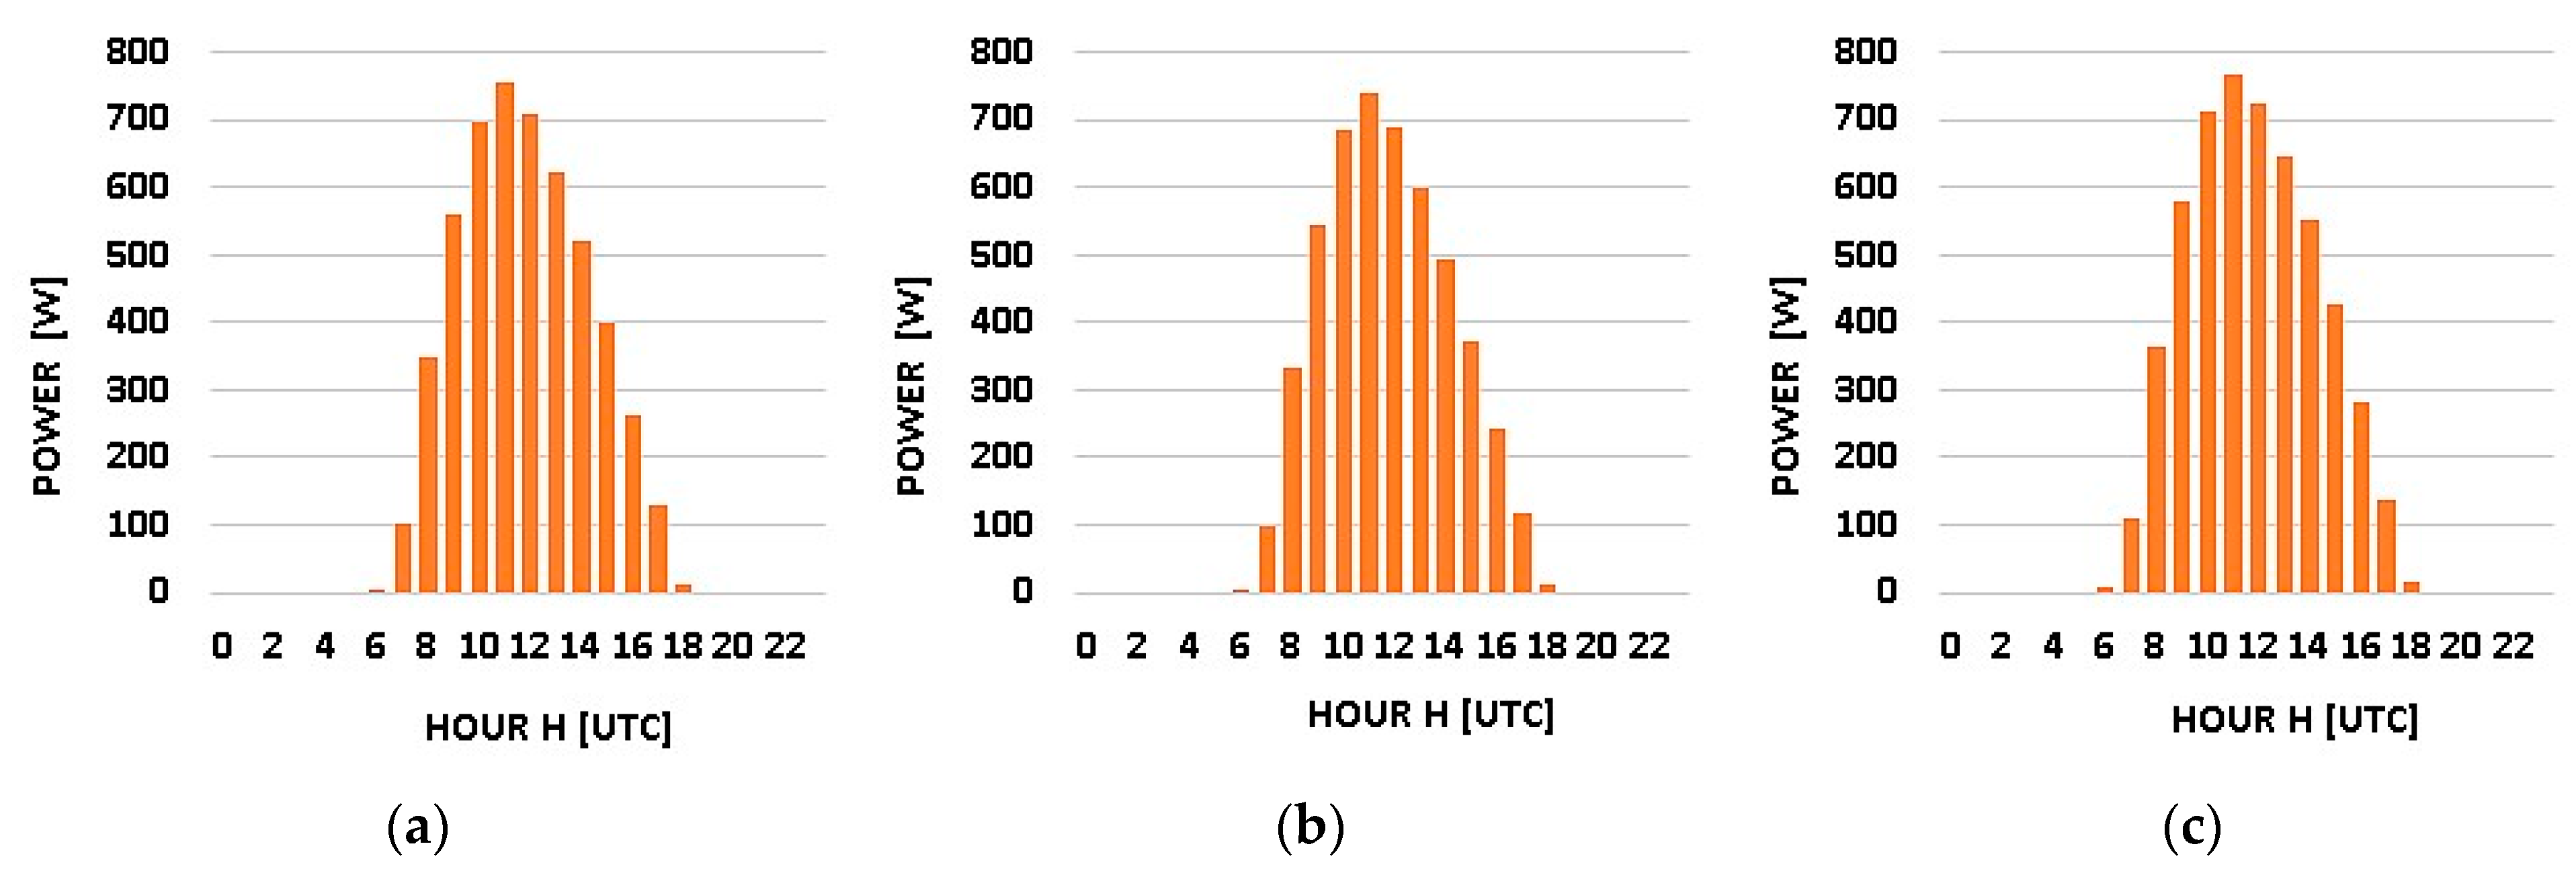
Figure 10 and
Figure 11 depict the processed mean daily PV power profile (obtained following the methodology described in
Section 2.3) for the Rwandan and Kenyan households’ centroid coordinates.
The daily average PV power profiles at each centroid coordinate location do not vary significantly between seasons, and the annual daily average PV power profile tends to be similar to the PV power profiles for the wet and dry seasons. The maximum power values per 1000 W of installed peak capacity range between 600 W and almost 800 W between 10 a.m. and 12 a.m. Generally, the daily average PV power profiles reveal an expected strong increase from 4 a.m. to 10 a.m. and decrease after 12 p.m., with the decrease more prominent in Kenya than in Rwanda. This may impact the available resource for cooking during the afternoon or late afternoon in Kenya.
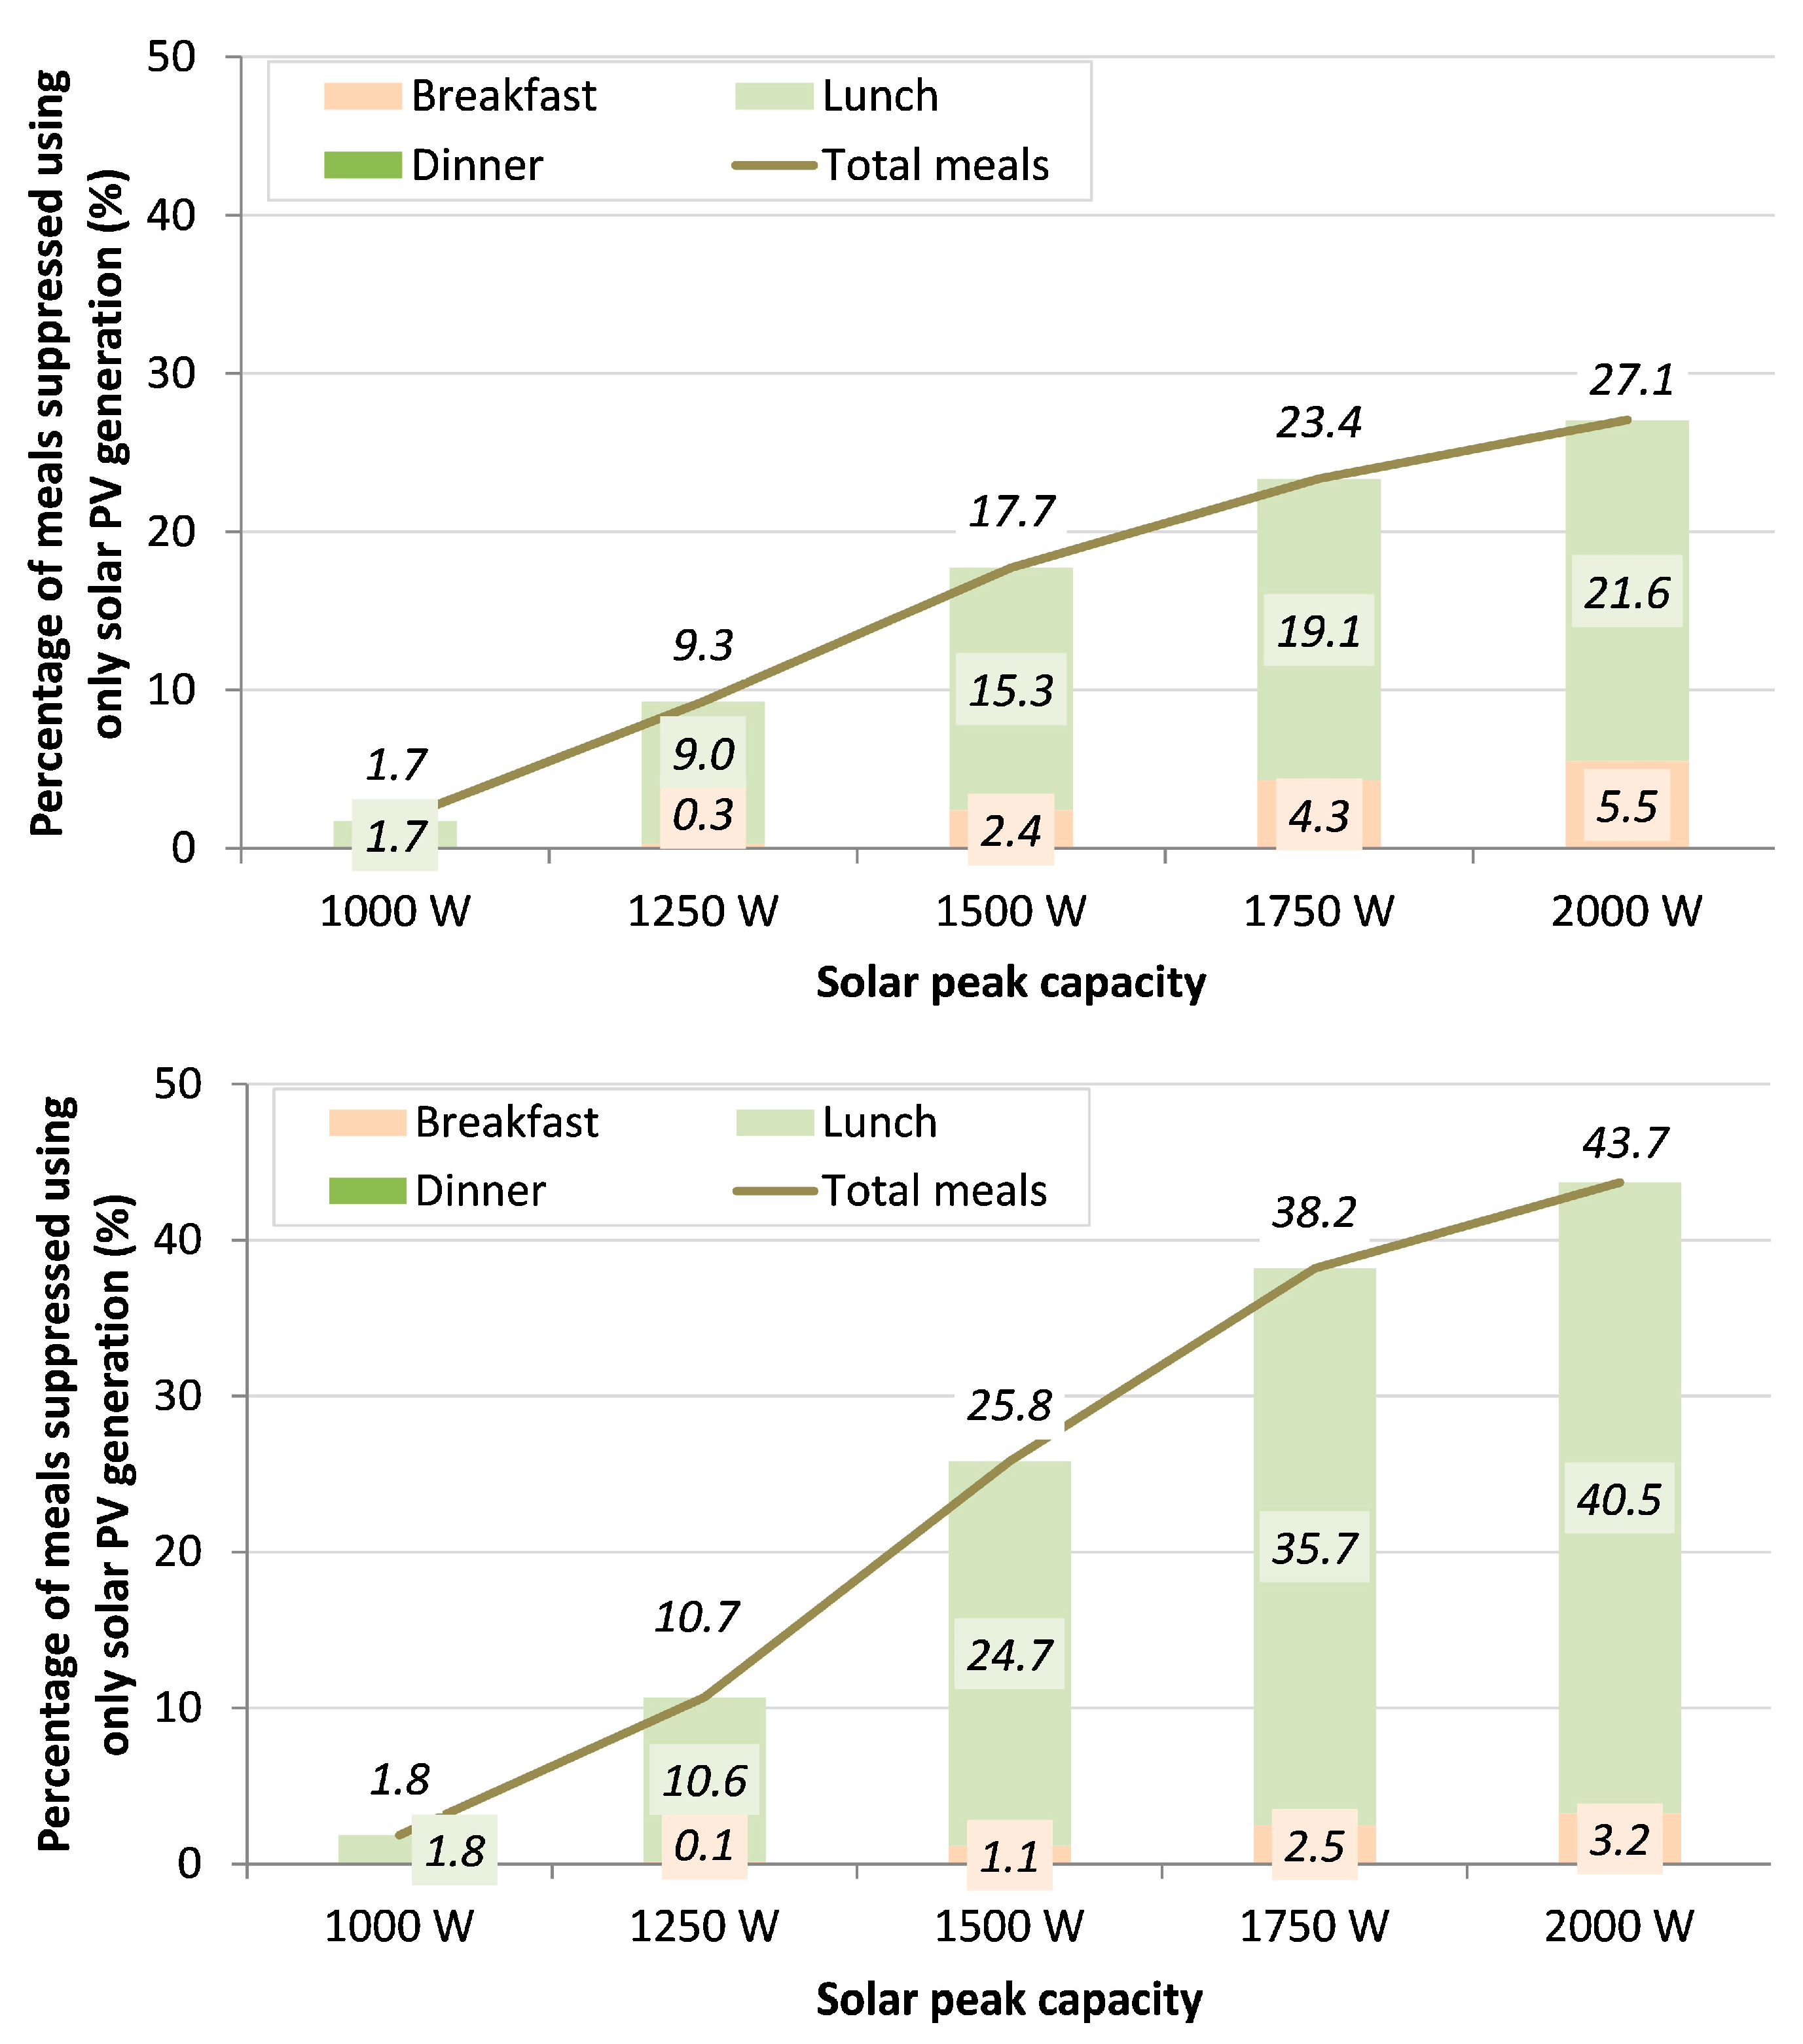
The percentage of meals cooked using only solar electricity is presented in
Figure 12. Different installed peak capacity scenarios were considered, ranging from 1000 W to 2000 W. It is assumed that breakfast occurred from 6 a.m. to 10 a.m., lunch from 10 a.m. to 3 p.m. and dinner from 5 to 10 p.m.
Based on the data from the experimental campaign, installations with solar PV systems directly powering EPCs are expected to have a limited impact on meal cooking, with most of their contribution occurring during lunchtime in both countries. For instance, if each household in Kenya has a solar PV system with 1000 W of peak capacity, it can only supply energy to cook 1.7% of its meals, while in Rwanda, this figure increases by only 0.1 p.p. However, when the installed peak capacity is raised to 2000 W, the percentage of meals that can be fully cooked with solar power increases significantly. In this case, 27% of meals prepared in a Kenyan household could be achieved with solar electricity (including 5% of breakfasts), while in Rwanda, this figure rises to 43.7%. However, significant installation areas would be required for these scenarios. The results indicate that relying solely on directly fed solar PV electricity would not allow the supply of the energy required to cook at least 50% of meals prepared in a household. Therefore, additional measures should be taken to ensure an adequate and reliable energy supply for cooking purposes, such as the use of storage systems. This finding is in line with the existing literature regarding the use of energy storage systems together with solar (thermal- or PV-powered) cookers to enable cooking when sufficient solar irradiance is unavailable [
14,
34].
Interestingly, even though Rwanda has a lower annual solar resource potential, the results indicate that Rwandan applications of PV-powered EPCs are better suited to the local solar PV generation profiles, allowing them to fully provide cooking energy to more meals when compared with the Kenyan results. The difference reaches up to 16.6 p.p. in a scenario of an EPC powered by a PV system with 2 kW of peak capacity. This outcome was somewhat expected, given that in Kenya, the EPCs were used more frequently during hours when solar generation was not available compared with Rwanda.
The findings suggest that incorporating battery storage is crucial in achieving self-sustaining, environmentally friendly cooking solutions. It is important to ensure that the storage system is of an appropriate size to accommodate energy consumption during periods of low or no solar PV generation.
5. Conclusions
This work presents some of the results obtained in the LEAP-RE PURAMS project, which aims to develop an autonomous solar cooker to address challenges posed by traditional cooking methods used in rural and peri-urban communities in Africa. This work followed a three-step approach. Firstly, cooking habits and associated electricity demand for EPCs’ operation were determined through a survey and experimental campaign in Kenya and Rwanda. Secondly, the estimated production profile of autonomous PV systems in the regions of interest was established. Finally, the solar energy availability profile was compared with the electricity demand profile of EPCs.
The aim was to gather experimental data regarding energy demand and consumption patterns, which are scarce in the existing literature, as well as identifying cooking conditions and types of food commonly cooked, information crucial for the development of a solar cooker that meets the needs of the local communities.
Despite the limited number of questionnaires and use of electric pressure cookers, the survey data provided insights into cooking habits for Rwanda and Kenya, including energy consumption and types of food. By considering both these parameters, the results highlighted some of the benefits of electric cooking compared to fossil-fuel-based sources commonly used in African countries. Overall, the findings suggest that, for these countries’ most commonly prepared food types, using EPCs saves time compared to traditional cooking methods. In Rwanda, the time saved ranges from 55% (for preparing Cassava Flour) to 84% (Irish Potatoes). For Kenya, the saved time varies from 9% (tea) to 64% (rice).
The experimental campaign results demonstrate that solar PV alone would have a limited impact on meal cooking in Kenya and Rwanda, with a significant increase in the supply of meal cooking energy only achievable in scenarios with high installed peak capacity of solar PV, requiring large areas for installation and increasing costs. Furthermore, the study shows that the use of EPCs in Rwanda aligns better with local solar PV generation profiles than in Kenya, allowing for up to 17 p.p. more meal preparations in comparison with a similar system (2000 W of peak power) installed in Kenya. However, even with this increased meal preparation coverage, relying solely on solar PV would not be sufficient to supply the required energy for at least 50% of the prepared meals, highlighting the need for additional measures to ensure a reliable energy supply for cooking purposes. The findings emphasize the importance of incorporating appropriately sized energy storage systems to optimize the use of solar energy and support energy needs during periods of low or no solar PV generation.
In conclusion, from a technological point of view, solar PV shows promise as a renewable energy source for cooking in Kenya and Rwanda, but it should be complemented with other sources and supported by energy storage systems to ensure a sustainable and reliable energy supply. The results presented in this work offer valuable insights into local cooking habits, EPC cooking energy demand profiles and their relationship with solar energy availability, and can be used to guide the development of autonomous solar cookers that can provide clean energy cooking solutions to millions of people in Africa. Future work will address requirements such as PV system sizing, energy storage, integration into local building structures and economic viability.

 ,
, 


