
Possibility of Biological Observations Using the Speckle Interferometry-Based Super-Resolution Technology

Department of Mechanical Engineering, Faculty of Engineering Science, Kansai University, 3-3-35, Suita 564-8680, Japan
Micro 2022, 2(4), 620-631; https://doi.org/10.3390/micro2040041
Submission received: 1 October 2022
/
Revised: 19 October 2022
/
Accepted: 27 October 2022
/
Published: 31 October 2022
(This article belongs to the Collection Advances in Microtechnology for Cell/Tissue Engineering and Biosensing)
Abstract
:Speckle interferometry techniques based on the phase-detection method have been widely used to observe microstructures beyond the diffraction limit, and the observations of hard solid samples such as microspheres and micro-characters have been previously reported. In this study, the possibility of applying this super-resolution technology to the observation of biological tissues is investigated using plant-cell chromosomes, which are relatively easy to handle and compatible with the diffraction limit. The results reveal that the new super-resolution technique, which is based on speckle interferometry, can be used to observe cellular tissues with complex structures that are subjected to conventional cell-fixation treatments similar to solid samples. However, the shape of the fixed-treated chromosomes is distorted and differs from that of living cells. Furthermore, when observing real living cells using current optics systems, the sample is typically observed vertically. This study indicates that these optics systems must be improved to allow horizontal placements of the samples in the culture medium.
1. Introduction
Typically, microstructure observation techniques are critical for advancements in biotechnological research [1,2,3,4,5]. To that end, several optical observation techniques that allow observations beyond the diffraction limit [6,7,8] and those that are based on fluorescent staining techniques [9,10], such as photoactivated localization microscopy (PALM) and stimulated emission depletion (STED), have been developed and widely used [11,12,13,14,15]. However, these techniques require long processing times for information collection and analysis owing to the involved staining process and the object-scanning requirements for image collection.
To mitigate this issue, a method based on speckle interferometry [16,17,18] has been developed [19]. Instead of the conventional optical observation technique, which analyzes the intensity distribution obtained by imaging the object of interest, this new observation technique achieves super-resolution by analyzing the phase components in the light wavefront captured by an optical microscope [19].
This new observation method based on phase analysis detects changes in the phase distribution resulting from intentional lateral shifts of the object of interest, and it can observe microstructural shapes beyond the diffraction limit [20]. To streamline this process, scattered light with multiple ray vectors is used to illuminate the measurement object.
Previously, the validity of this new observation technique was verified using diffraction gratings with known lattice constants as the measurement objects. In this validation, the geometry of the periodic microstructures with dimensions shorter than the diffraction limit of the objective lens used for measurements was obtained. The measurement results were compared with the microstructure results obtained using atomic force microscopy. The comparison results confirmed that the new observation technique was capable of observing structures beyond the diffraction limit [19].
Subsequently, the validation was extended to randomly distributed microstructures using microsilica spheres with known diameters that exceeded the diffraction limit as the measurement objects [21]. In the verification of micro-spheres, the result of the microspheres measured by this method was compared with the basic data disclosed by the microsphere manufacturer using statistical processing to demonstrate the effectiveness of this method. Furthermore, another validation based on microcharacters formed using line segments with widths of less than 100 nm with directionality in each element confirmed that the shapes of such microcharacters formed by line segments with line widths exceeding multiple diffraction limits could be detected [20].
These results confirm that the speckle-interferometry-based microstructural observation technique using phase analysis of light is capable of observing microstructures comprising line widths of approximately 100 nm that exceed the diffraction limit.
Based on these results, it can be assumed that the layered organization within biological tissues apparent in the colored slide images of human cells [22] can be modeled as a periodic structure such as a diffraction grating, which can be observed using this method. In addition, spherical tissues within living cells can be modeled using a measurement process based on microsilica spheres [21]. Furthermore, it is assumed that the branch-like tissues in living organisms can be modeled in the form of microcharacters [20].
Based on the results of virtual biological observation experiments conducted using diffraction gratings, microsilica spheres, and microcharacters, we can infer that living biological tissues with sizes of approximately 100 nm can be observed using the new observation technique. Furthermore, observing the movements of microstructures in biological tissues in the form of moving images may be possible by analyzing and arranging consecutive individual images.
This paper discusses the possible challenges in applying super-resolution technique based on speckle interferometry to the observation of living cellular tissues with complex structures, instead of artificial solid structures such as diffraction gratings, microspheres, and microcharacters; for this, chromosomes produced during cell division in garlic were considered as the measurement objects.
As confirmed by the abovementioned verification results for solid structures, the speckle interferometry-based observation technique for microstructures is capable of observing structures as small as 100 nm. Thus, in this study, garlic chromosomes were selected as the measurement samples because they are cellular tissues that are easy to handle and, thus, can be utilized to identify challenges that may arise when handling living organisms.
Notably, the width of a garlic chromosome is approximately 800 nm, which is approximately on the same scale as the diffraction limit of the optical system used in this study. The cellular-tissue sample-preparation process is also based on traditionally established general processing.
Our results indicate that the super-resolution technique based on speckle interferometry can observe cellular tissues with complex structures that are subjected to conventional cell-fixation treatments similar to solid specimens, such as microspheres and microcharacters.
Therefore, based on the results obtained for solid objects, we hypothesize that biological cellular tissues that are approximately 100 nm in size may be observable using this technique.
However, the shapes of the measured objects were distorted when the cells were subjected to traditional plant-cell fixation treatments, as in the present study.
Thus, it is necessary to develop a method to observe living cells naturally without subjecting them to fixation treatments, along with an optical system that allows horizontal growth of the sample in the culture medium.
2. Materials and Methods
2.1. Principle of Measurement
The microstructural observation technique adopted in this study assumes that the measurement cross section along the x-axis of the object of interest can be represented as f(x). Based on existing speckle interferometry-based studies [19], when a lateral shift δx is applied to the measurement object, the shape displacement generated at each measurement point before and after the shift can be expressed as f(x + δx) − f(x). The difference in the resulting shapes can be accurately quantified using speckle interferometry. By dividing the detected displacement by the lateral shift amount δx, the pseudo-differential value {f(x + δx) − f(x)}/δx along the shift direction for the shape can be obtained. Furthermore, the shape f(x) of the measurement object can be reconstructed by integrating the pseudo-differential value along the x-axis. Based on this principle, the shape measurement method used in this study can be applied to three-dimensional (3D) shape measurements.
2.2. Measurement Procedure
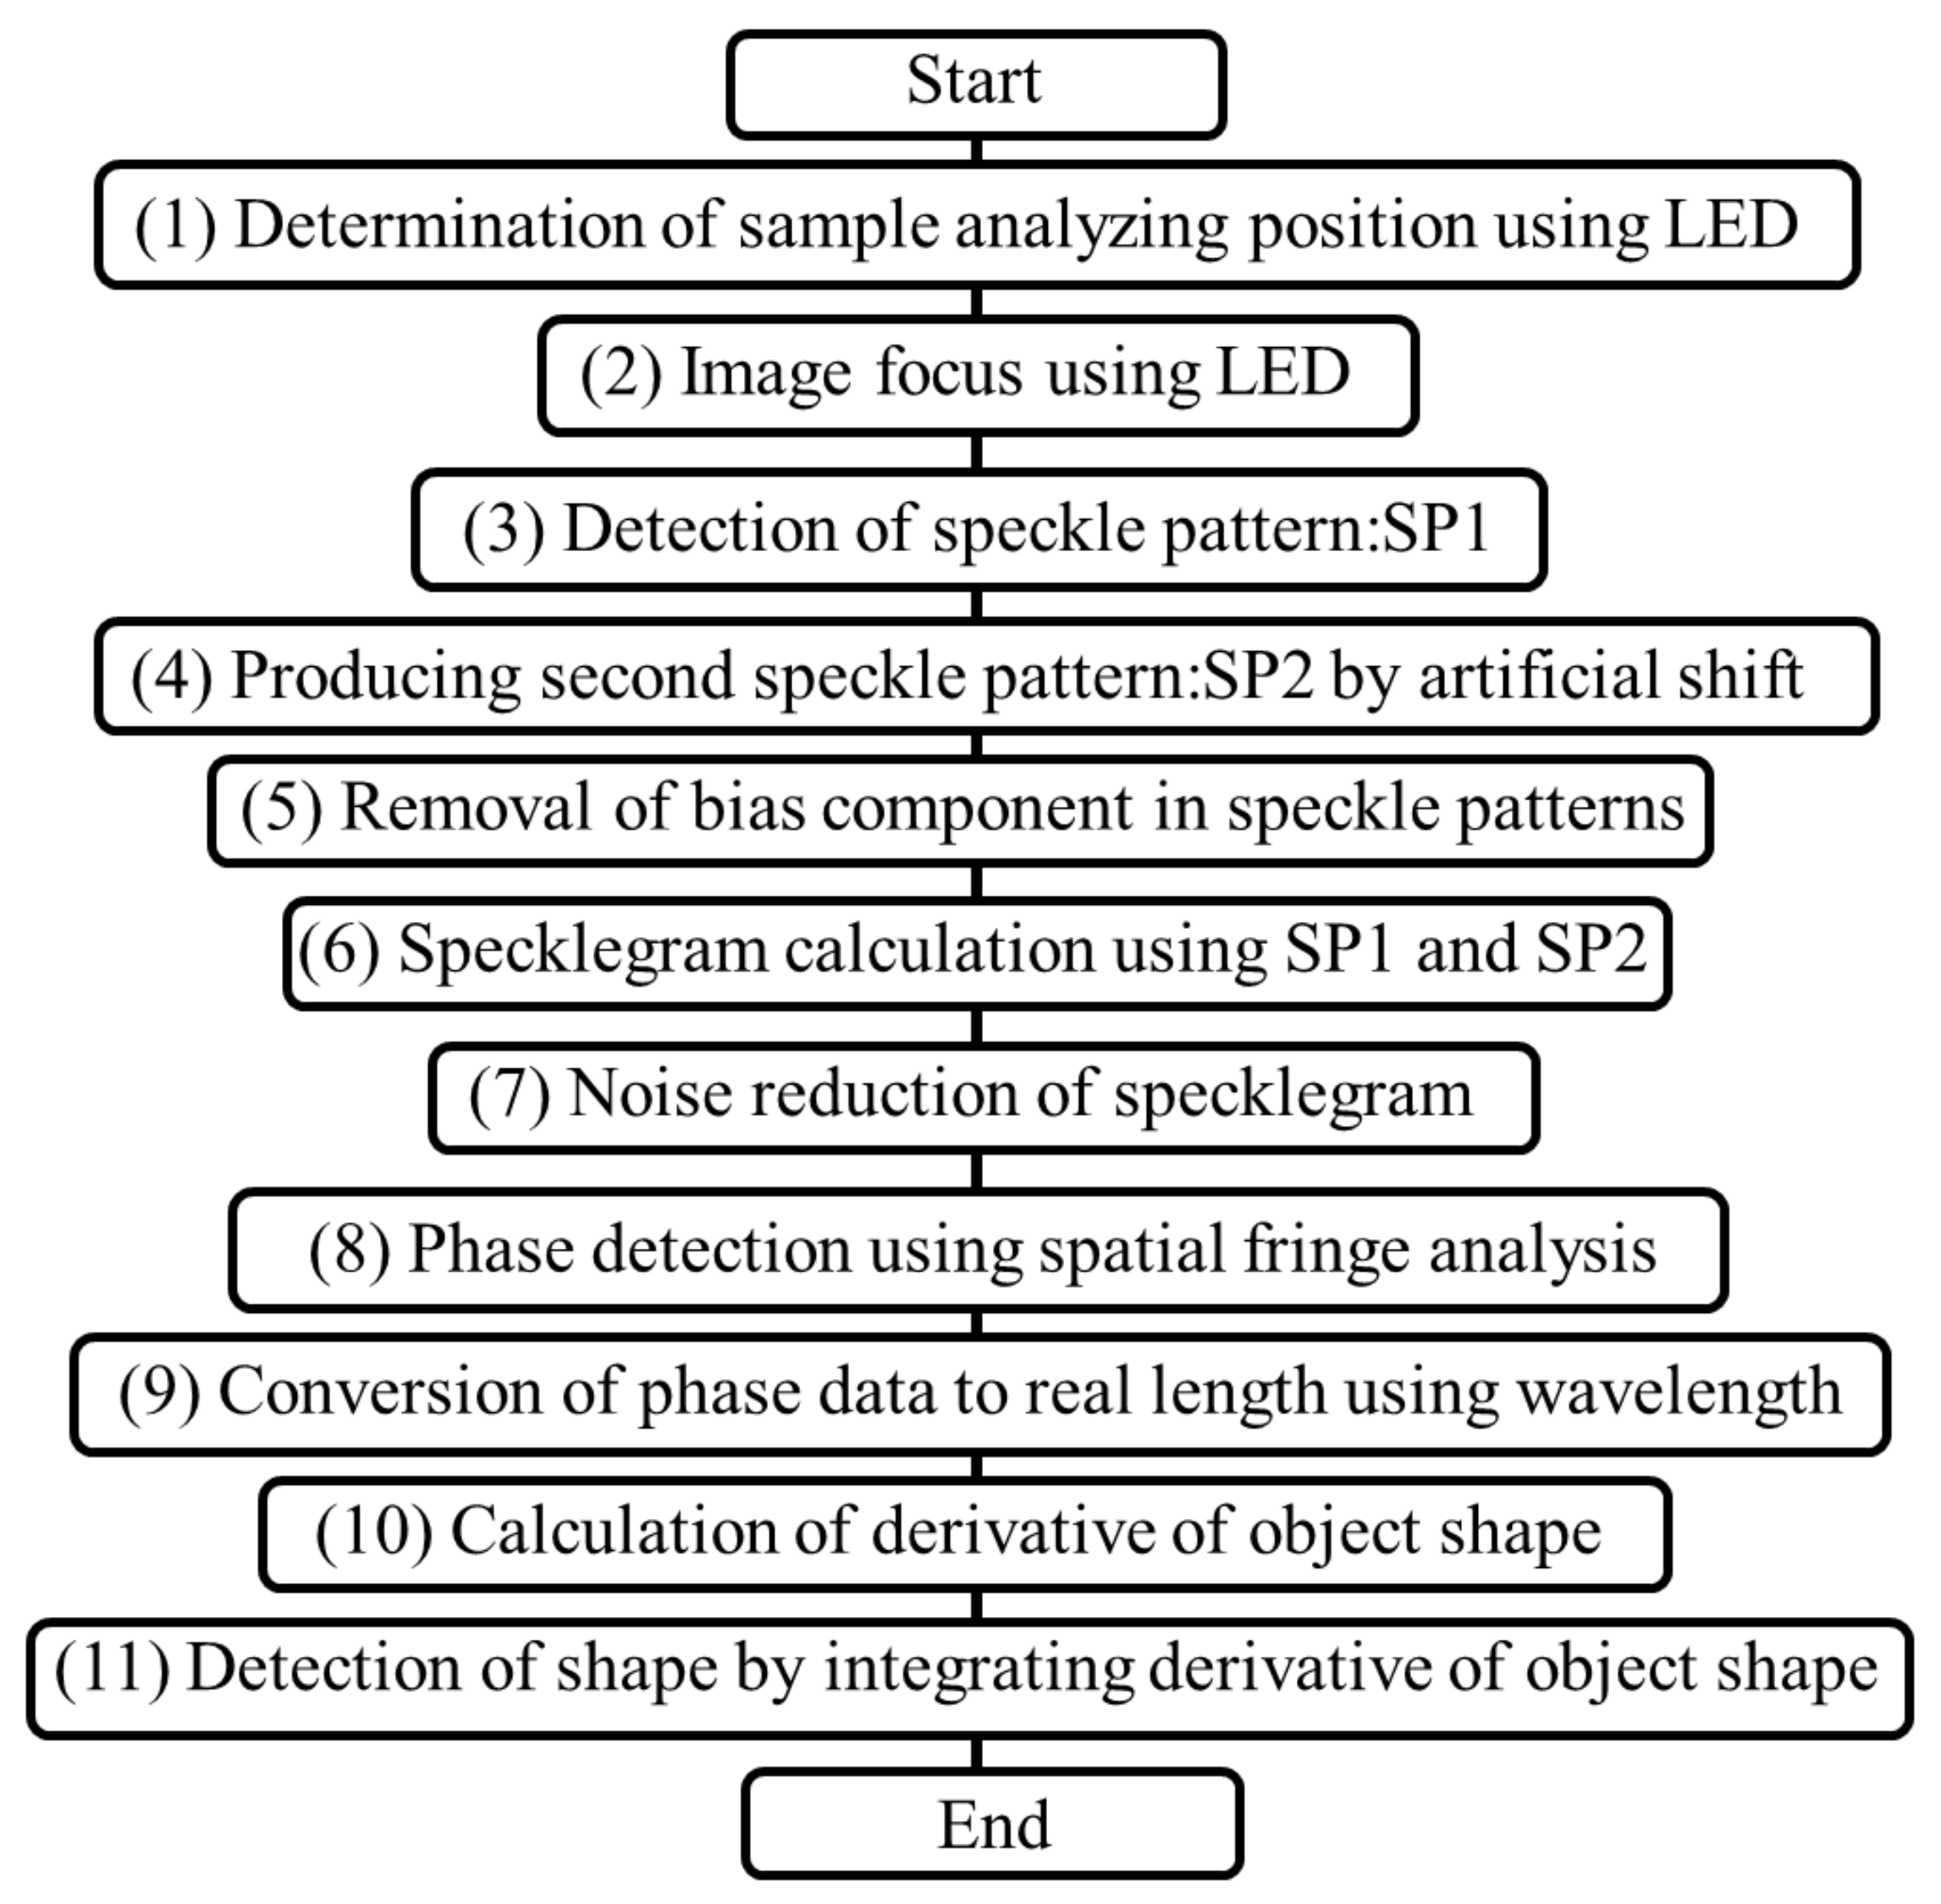
Figure 1 illustrates a flowchart of the measurement and analysis processes. First, (1) the measurement area was illuminated using a light-emitting diode (LED). Subsequently, (2) the measurement object was accurately focused upon using the LED light source. Notably, the aforementioned method relies on the property that light emitted from a single point on a measurement object focuses on another single point on the focal plane when passed through a lens in a perfect optical system [8]. Therefore, it was important for the measurement object to be focused upon before initiating the measurement process to ensure that accurate measurements were obtained. Thus, the measurement surface was visually imaged, and an LED with the same wavelength as a laser light source was then focused on the surface to avoid problems caused by the wavelength dependence of the optical system.
Subsequently, (3) the LED light was replaced with the laser source, and the measurement object was illuminated with scattered laser light passed through ground glass. Traditionally, in speckle interferometry, the associated analyses are based on the properties of scattered light with various ray vectors. In this technique, the measurement object is illuminated using scattered light. The light reflected from the surface of the measurement object passes through a lens and is used for the detection. Therefore, the captured measurement object image represents a speckle pattern, which is a cluster of speckles.
In deformation speckle interferometry, the deformation value is considered as the phase change between the speckle patterns before and after deformation [16,17]. Based on this concept, the underlying method involves a deformation of the measurement object. However, the purpose of this study was to detect the actual 3D shape of the measurement object; therefore, the shape of the measurement object was only subjected to a minor horizontal shift, instead of a deformation as in general speckle interferometry. Furthermore, the distribution of the change rate for the shape of the measurement object was obtained by dividing the measurement result of the deformation by the shift value; following this, the 3D shape was reconstructed by integrating the change rate distribution.
A second speckle pattern was initially captured by shifting the speckle pattern horizontally using a piezoelectric stage [19]. However, the lateral shift introduced was only on the order of several nanometers; thus, it was observed that (4) the second speckle pattern was created from the first speckle pattern [23]. Thus, by virtually shifting the first speckle pattern, the second speckle pattern could be obtained and analyzed without shifting the measurement object.
When the bias component was removed from the two speckle patterns using a (5) Fourier transform, as reported in a previous study [24], the speckle pattern could be processed to reconstruct the required shape using only one speckle pattern at each measurement. Using this property, the movement of an object could be captured in the form of a moving image by continuously recording only a single speckle pattern from the measurement object, processing each speckle pattern sequentially, and then arranging the results processed in the order of capturing according to the time series.
Accordingly, in our analysis, the speckle pattern was captured, as depicted in the computation of the specklegram in (6). The specklegram was obtained based on two speckle patterns recorded before and after the horizontal shift, and the 3D shape was determined based on the phase distribution in the specklegram. In the traditional optical observation technique, the shape of an object is represented as an image, and the 3D shape is obtained using the focused information. Therefore, the intensity distribution for the measured object must be imaged and captured as a clear image. If any part of the intensity distribution obtained from the measurement object exceeds the diffraction limit and is thus unable to enter the lens aperture, a clear image cannot be captured. Under such scenarios, as only a hazy image can be obtained, observing the fine structure of the 3D shape is often impossible [6].
In contrast, in the proposed method, the 3D-shape information was detected by analyzing the phase distribution in the specklegram, rather than by generating images based on the intensity distribution. Therefore, the 3D shape was detected by capturing the phase change of light passing through the objective lens used in the measurement when a lateral shift was applied.
Notably, speckle interferometry is based on this approach. However, speckle formation is a phenomenon that is widely recognized as a noise component [25]. Therefore, various noise-removal processes were required, as shown in (7), to identify the change resulting from the lateral shift with a high resolution. Subsequently, the spatial-fringe analysis method was used to perform (8) phase detection on the denoized specklegrams using various filters [26]. In addition, (9) the phase component was converted into a distance component using the wavelength of light, and it was divided by (10) the lateral shift value to obtain the change rate distribution for the shape of the measurement object along the direction of the lateral shift. Then, the 3D shape of the measurement object was reconstructed (11) by integrating the change rate distribution.
2.3. Measurement System
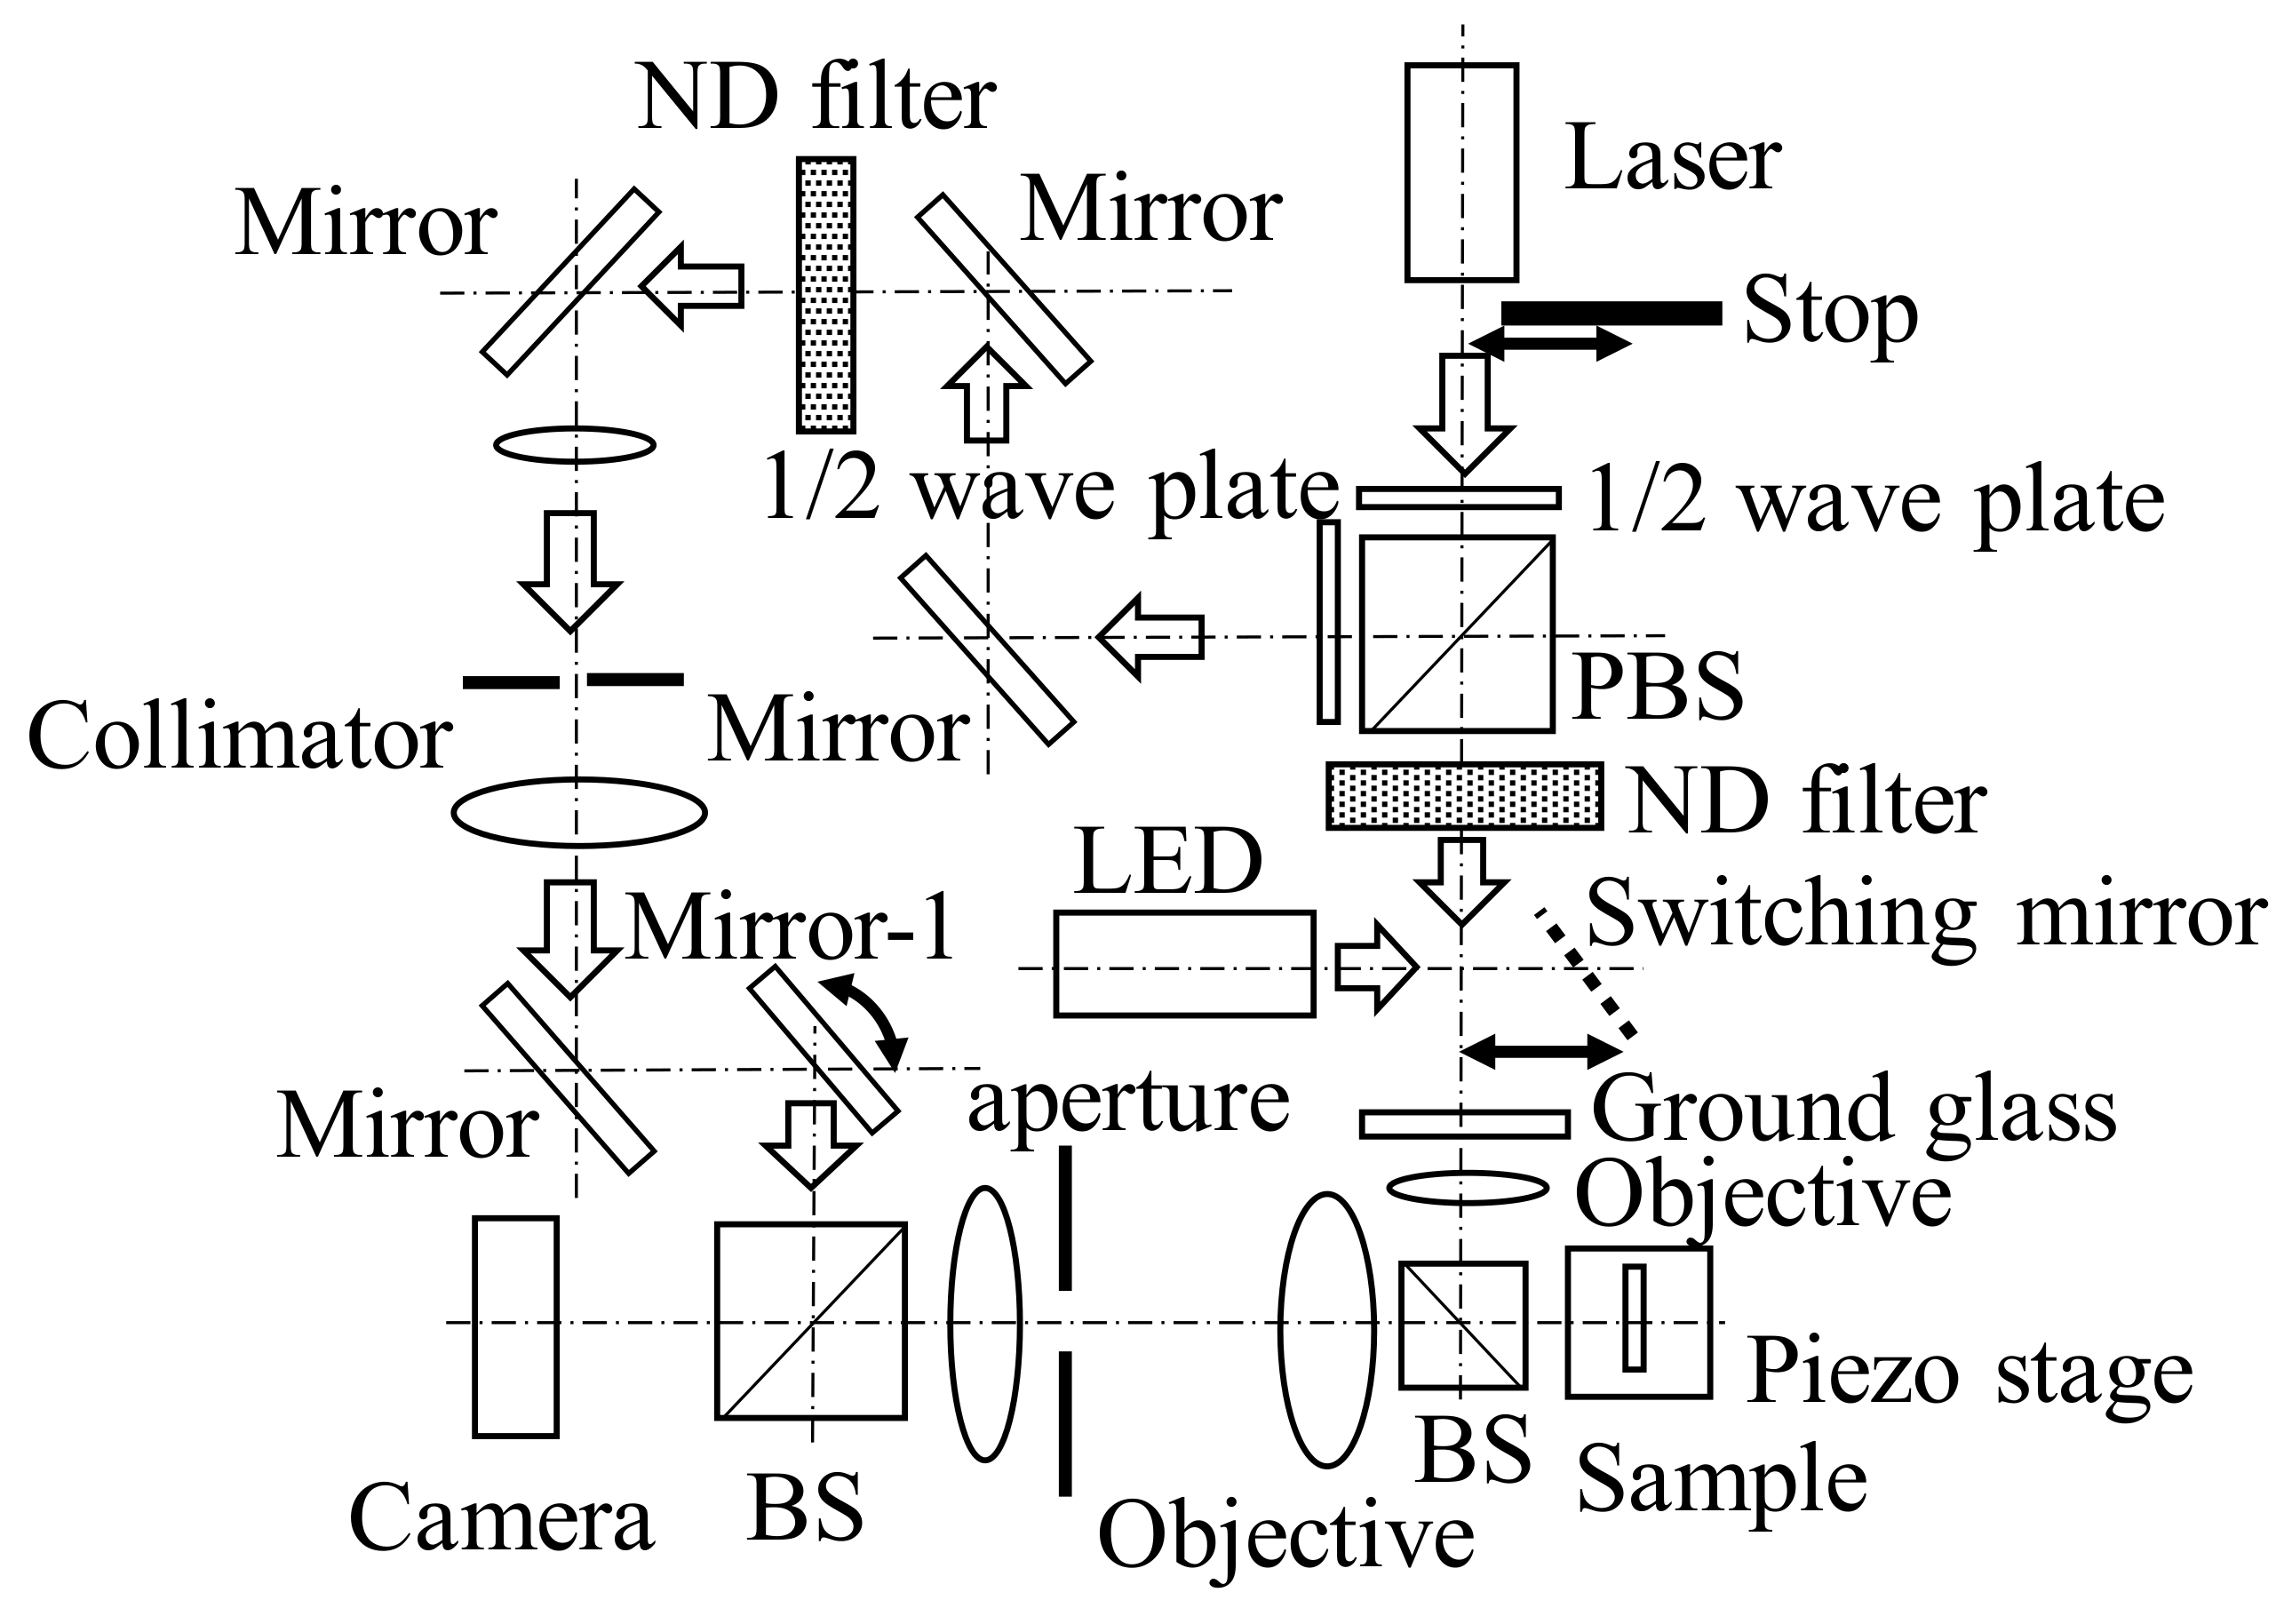
As depicted in Figure 2, the optical system proposed in this paper is a speckle interferometer. This optical system was constructed on an active vibration isolation table, as described in a previous study [27]. The length and width of the system were 700 mm and 600 mm, respectively. To facilitate observation of the measurement object, a new mirror was installed to switch between the light sources when observing the measurement object using an LED light source with the same wavelength as that of the laser light source. The LED light improved the focus on the surface of the measurement object.
Equalizing the wavelengths of the LED and laser sources made it easier for the laser to focus on the measurement object. Furthermore, the measurement results were not affected by the wavelength dependence of the optical elements in the lens system (i.e., the variation in the focal position due to different wavelengths) or by the several interference fringes generated when the sample was illuminated with the laser light source. In the measurement method adopted in this study, the size of the object exceeded the diffraction limit, as indicated in a previous study [27]; however, the measurement object could be accurately placed at the imaging position of the lens by placing a dummy focusing mark near the measurement area. Therefore, this easy focus adjustment enabled via LED illumination is an important improvement in optical systems that significantly contributes to the improved measurement results.
The wavelength of the laser source used as the source of illumination light was 671 nm, and the output power was 100 mW. The objective lens was a long-working-distance lens (M Plan Apo 200×, manufactured by Mitutoyo Corporation, Kawasaki, Japan, NA: 0.62, magnification: 200×). The camera had a resolution of 1024 × 1024 pixels with a pixel spacing of 1.6 μm, and intensity signals were captured in 12 bits with 4096 Gy levels. The laser beam passed through the ground glass and illuminated the measurement object in the form of scattered light. As demonstrated in a previous study [19,20,21], the reference light in a speckle interferometer is a plane wave; thus, the bias and signal components can be separated based on the Fourier transform of the collected speckle pattern.
2.4. Measured Biological Tissues
For our analysis, chromosome samples were prepared as measurement objects using a squashing method based on traditional chromosome-sample preparation procedures [28]. Specifically, garlic was grown hydroponically, and its root tips were excised in the morning when cell division was active.
Notably, the 24 h “pretreatment” with 0 °C water, which is typical in the preparation of chromosome samples, was not performed to enable observations of all cell division processes. The excised root tips were “fixed” by treating them with a fixative solution of acetic acid and ethyl alcohol for 24 h at room temperature. In addition, they were stained with a carmine acetate solution.
Subsequently, the crown of the root tips was cut and “dissociated” on a glass slide using a 45% acetic acid solution. The tissues were then covered with a cover glass, and the glass was tapped lightly to disperse the tissue. The glass slide was cooled on dry ice for approximately 30 min. The cover glass was then removed, and the tissue was allowed to dry naturally. In this study, platinum-coated samples were prepared and observed using scanning electron microscopy (SEM).
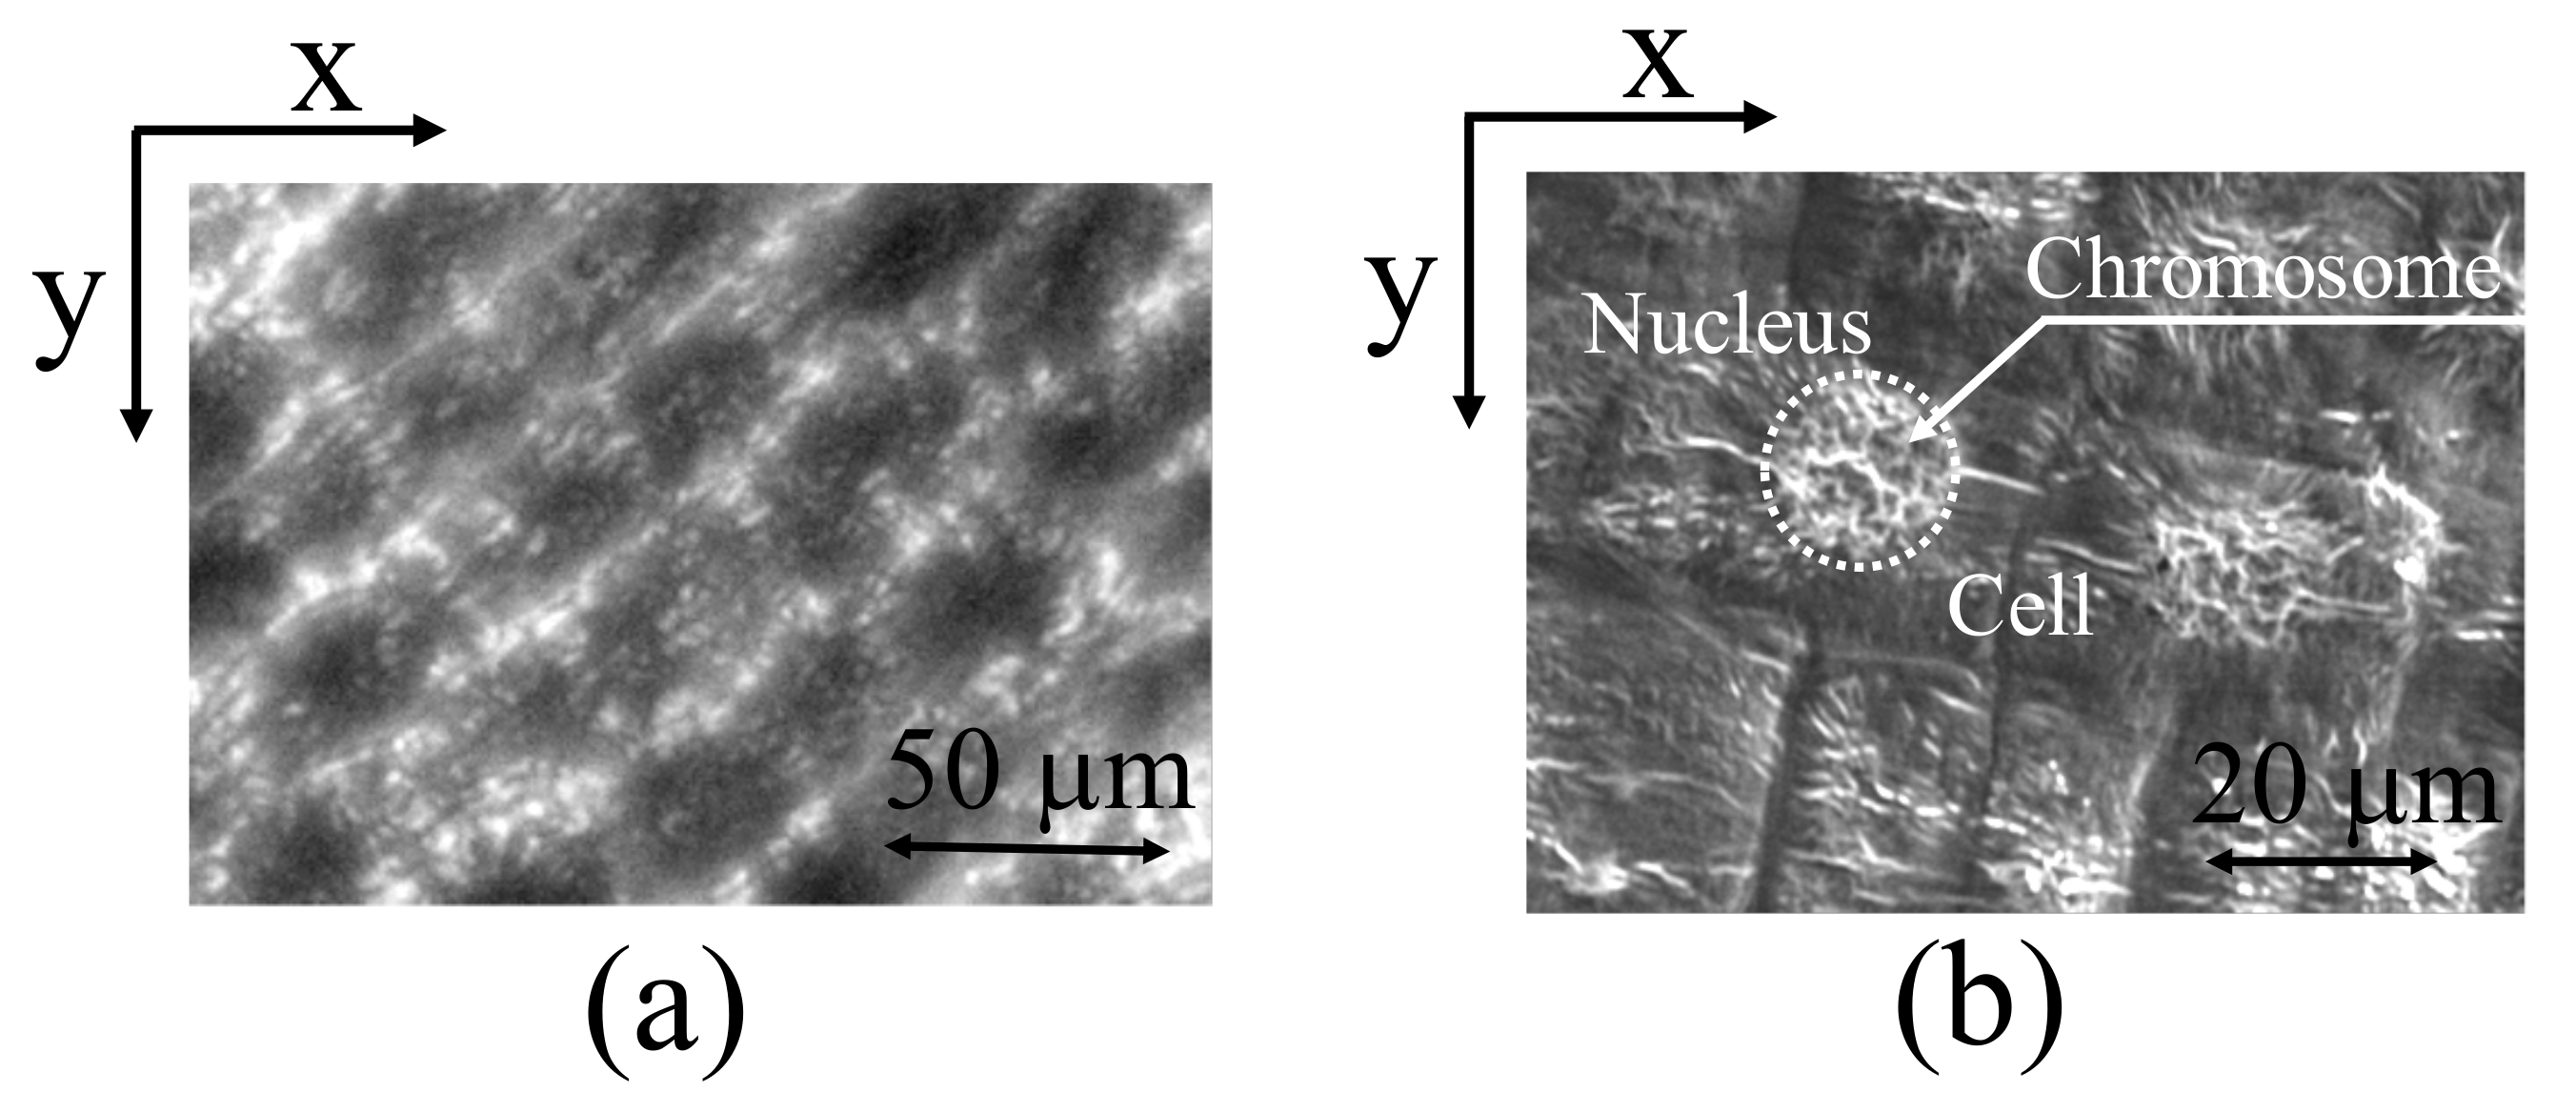
Figure 3a,b illustrate images of the prepared samples obtained via optical microscopy and SEM, respectively. Note that the SEM images were captured after platinum coating. Figure 3a indicates that the cells are aligned, and Figure 3b reveals that the nucleus is circular and is located at the center of the cell.
Furthermore, the possibility of using the proposed speckle interferometry-based observation method in the field of biotechnology was investigated by obtaining the shapes of chromosomes distributed inside the nucleus.
3. Results and Discussion
After blocking the laser light by installing a block in the optical path directly in front of the laser light source and after turning on the LED, a switching mirror was inserted into the laser optical path of the optical system, as depicted in Figure 2. In addition, the sample was precisely positioned on the piezo stage; thus, images could be captured with a focus on the cell tissues. The use of LEDs enabled efficient focusing on cellular tissues, and the observations were not affected by unwanted interference fringes, which are generated in large numbers during laser irradiation.
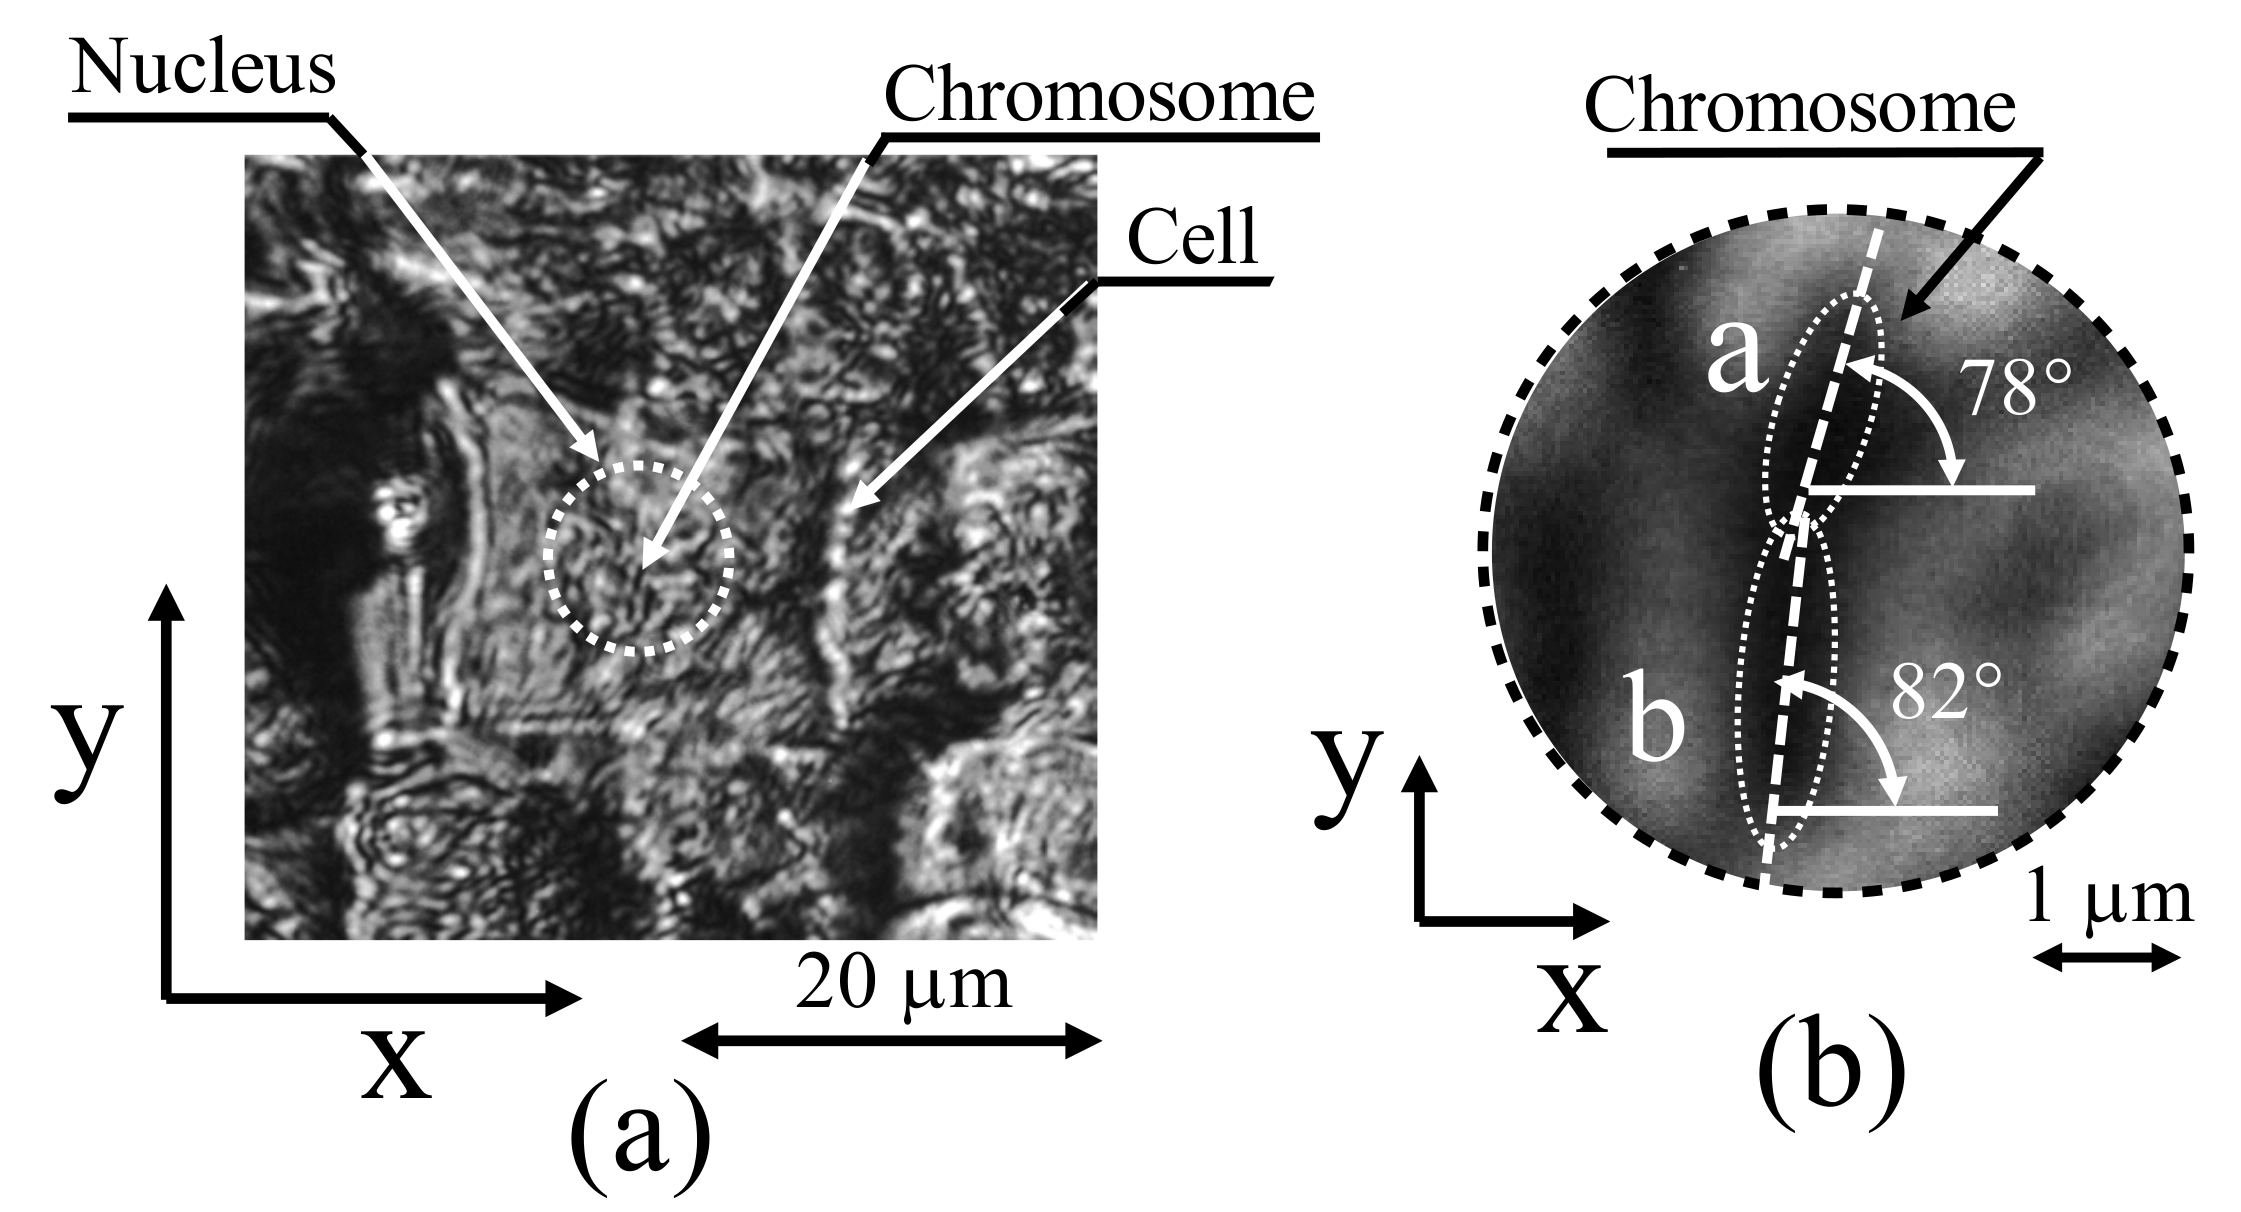
Figure 3b indicates that the garlic-cell tissues were relatively large-approximately 20 μm. By further magnifying the cell tissues using the optical system presented in Figure 2, the image depicted in Figure 4a was captured.
At the center of the cell, the nucleus was enclosed by a white dashed line. When the chromosomes scattered inside the nucleus were further magnified, individual stained chromosomes could be observed, as illustrated in Figure 4b. However, the image is already fuzzy because the chromosomes are approximately the same size as the diffraction limit. Among the chromosomes that were observed in this manner, two chromosomes (a and b shown in Figure 4b) that were relatively large and easy to observe were selected for further observations of the fine structure.
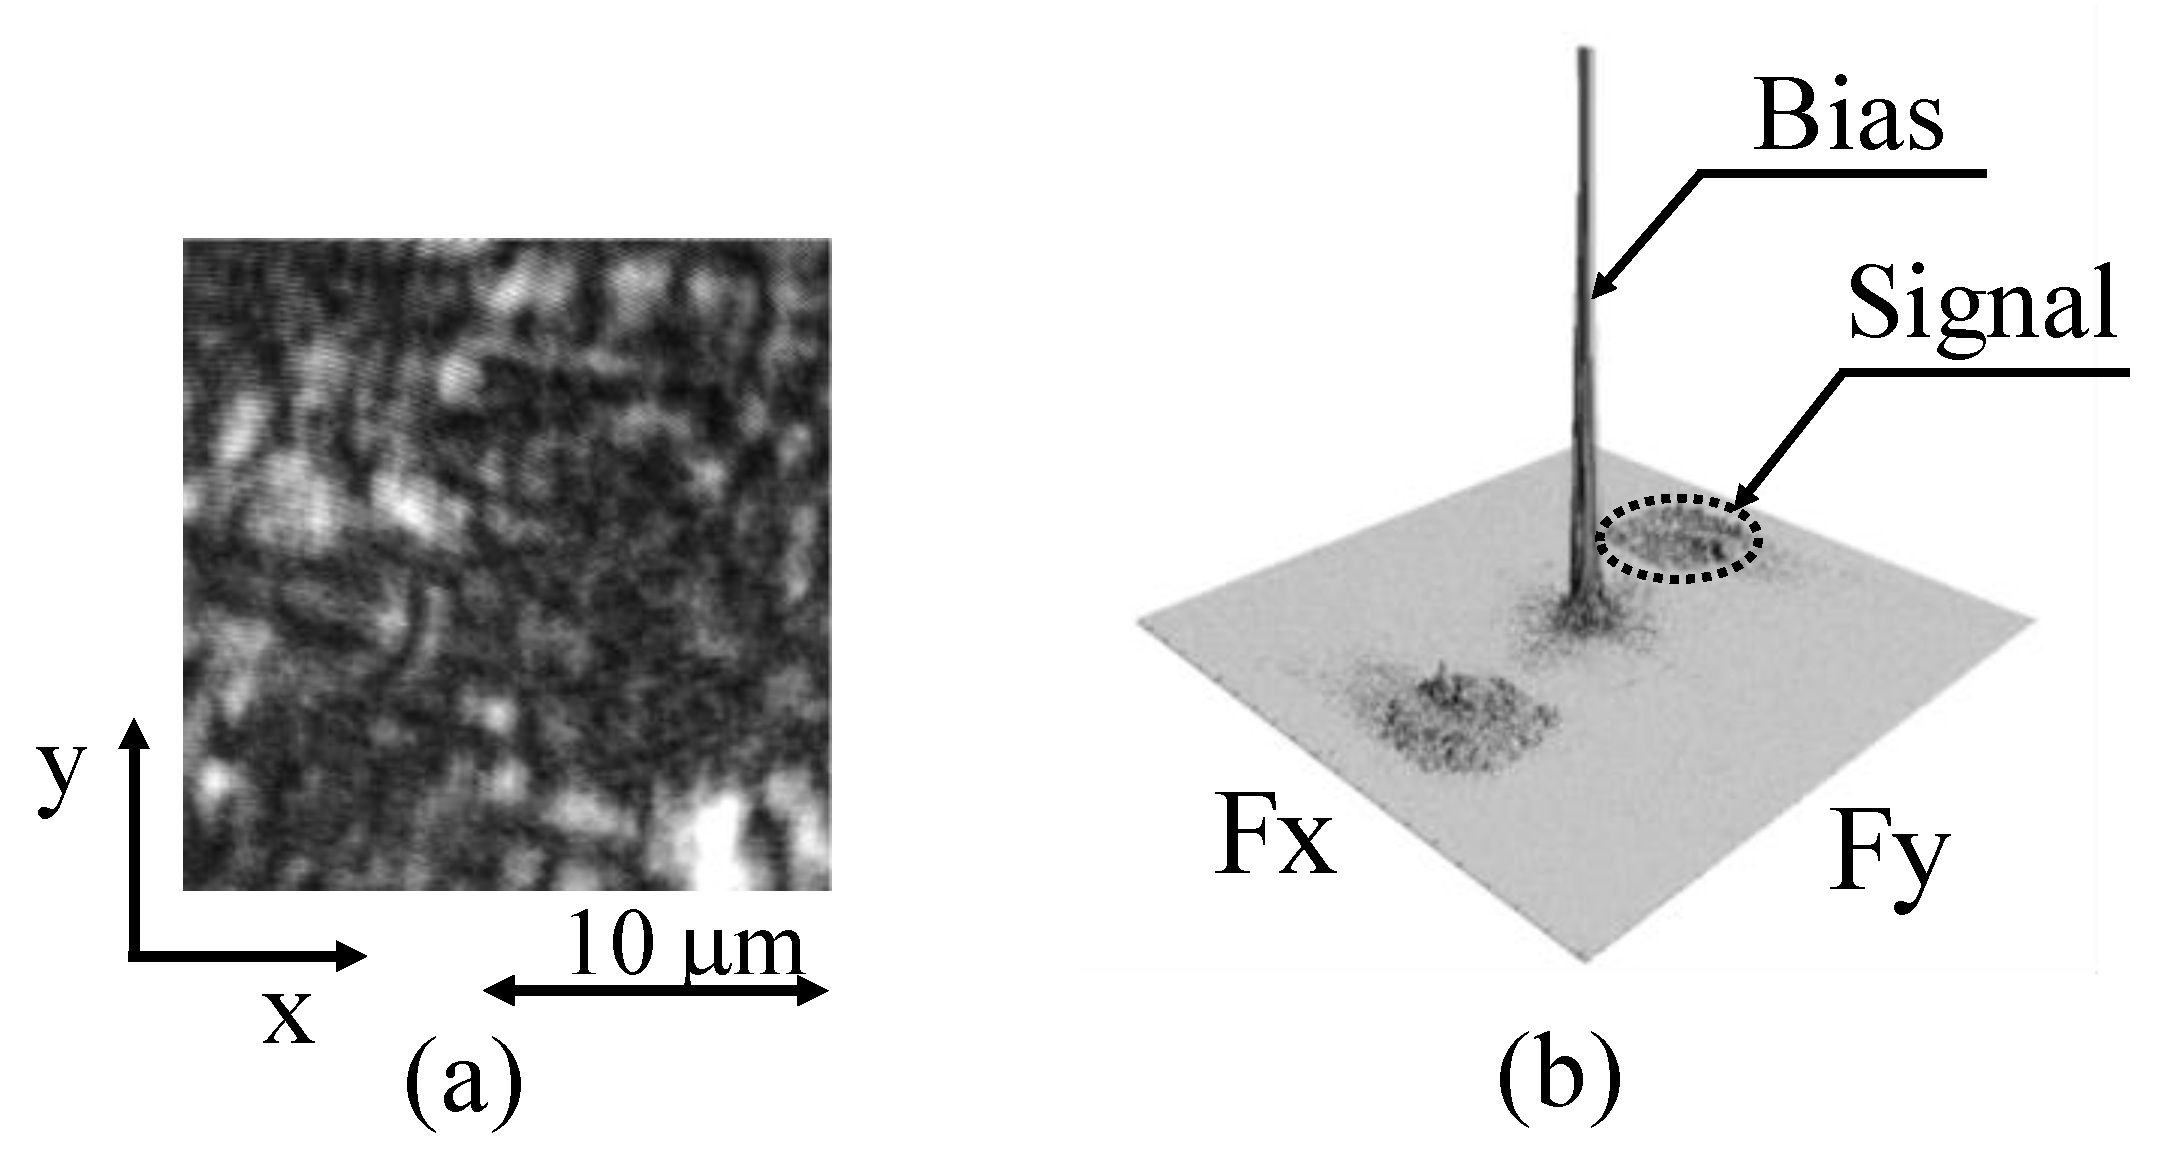
To observe the 3D structure of chromosomes a and b, depicted in Figure 4b, the stopping and switching mirrors were released in the optical system, the light source was restored to a laser light source (wavelength: 671 nm), and the area around the cell nucleus was magnified and captured. Accordingly, a speckle pattern was recorded, as depicted in Figure 5a. Several spherical light speckles were generated by the illumination light passing through the ground glass placed in the optical system [17]. As stated, a Fourier transform was performed on this speckle pattern, and frequency domain information, shown in Figure 5b, was recorded [24]. Here, note that only the signal component was extracted to perform spatial-fringe analysis based on speckle interferometry; the first speckle pattern (SP1) was detected by shifting it by 128 pixels (=1024/8) in the frequency domain to obtain a carrier signal of 8 pixels/period.
In contrast, the speckle pattern depicted in Figure 5a was shifted horizontally by 3 pixels, which is the optimal shift in this method, to create a virtual speckle pattern, as reported in a previous study [23]. Subsequently, the signal component was detected in the frequency domain in the same manner, as illustrated in Figure 5b. SP2 was artificially created based on (4) in the flowchart depicted in Figure 1. Using this technique of artificially creating a second speckle pattern, 3D analysis could be performed based on only a single speckle pattern, as depicted in Figure 5a.
Notably, this technique enables one to capture the dynamically changing deformation processes of an object in the form of moving images; this can be accomplished by analyzing the speckle patterns captured sequentially for the object subjected to deformation over time and displaying them in succession. This function is considered essential for biological observations.
The specklegram depicted in Figure 6a was obtained after the specklegram between SP1 and the carrier component of 8 pixels/cycle were added, and the artificially created SP2 was determined using the process described in a previous study [23,27]. In this specklegram, fringe information with a period of 8 pixels was provided for use in subsequent processing based on the spatial-fringe analysis method.
However, as stated, speckles are generally treated as noise components [25]; therefore, this specklegram contained several noise components owing to the influence of unsolved speckles [29]. Thus, it was necessary to use a noise-reduction processing method that matched each signal component of the measurement object, as demonstrated in a previous study [26], where the information of the object was extracted using the directional characteristics exhibited by chromosomes.
As depicted in Figure 4b, chromosomes a and b were the objects observed using this method. Generally, the origin of the coordinate system for an image captured using an industrial TV camera lies in the upper-left corner, whereas in a computer-processed image, this origin lies in the lower-left corner. In this study, all images were modified such that the origin of the image was positioned in the lower-left corner of the image at the time of capture to reduce complexity, and the passband of the filter was determined.
For example, let us consider the case of a diffraction grating with a saw-tooth wave-shaped cross section along the x-direction and a constant shape along the y-direction. When such a grating is transformed using a Fourier transform, there exists a signal peak in the frequency domain associated with the period of the saw-tooth wave along the x-direction. In addition, the higher-order frequency signal peaks that form the saw-tooth wave shape are lined up along the frequency axis in the x-direction. However, in this study, no signal peaks were noted on the frequency axis in the y-direction because the object shape was unchanged. The signal components along the x- and y-directions were appropriately filtered in the frequency domain to reduce noise, and the inverse Fourier transform was used to reconstruct the original saw-tooth shape.
Notably, when several noise components are present in the frequency domain, as in this study, a filter that can allow the passage of only signal components necessary for reconstruction while eliminating as many noise components as possible is required. The original shape of a figure can be obtained by extracting signals using such a filter and reconstructing them using the inverse Fourier transform. Thus, an appropriate filter is required to perform this task.
Specifically, considering the bandwidth of the filter, detecting the fundamental frequency component of the saw-tooth wave along the x-direction and higher-order signal components up to the highest possible frequency was necessary to reproduce the detailed grating cross section in the frequency domain. Typically, as grating strips extend along the y-direction, the grating figure, as a measurement object, is oriented along the y-direction. This indicates that the filter requires a wide passband up to a high frequency along the x-axis, and its bandwidth must be perpendicular to the shape orientation. Furthermore, if the shape is oriented along the y-direction, it is assumed that the original shape can be reproduced with a narrow passband because the same shape values continue along the y-direction.
Therefore, it is advantageous for a filter that restores the shape of samples using the inverse Fourier transform to have a wide passband along the direction perpendicular to the orientation of the figure and a narrow passband along the direction parallel to the orientation of the figure to eliminate as much noise as possible [27].
Note that the analysis in this study was primarily based on the observation of cross-sectional shapes of chromosomes; therefore, a filter with a wide frequency band perpendicular to the longitudinal orientation of the chromosomes and a narrow frequency band along the longitudinal orientation of the chromosome was used to eliminate the maximum possible noise. The filter passband was determined according to the concept described in a previous study [26].
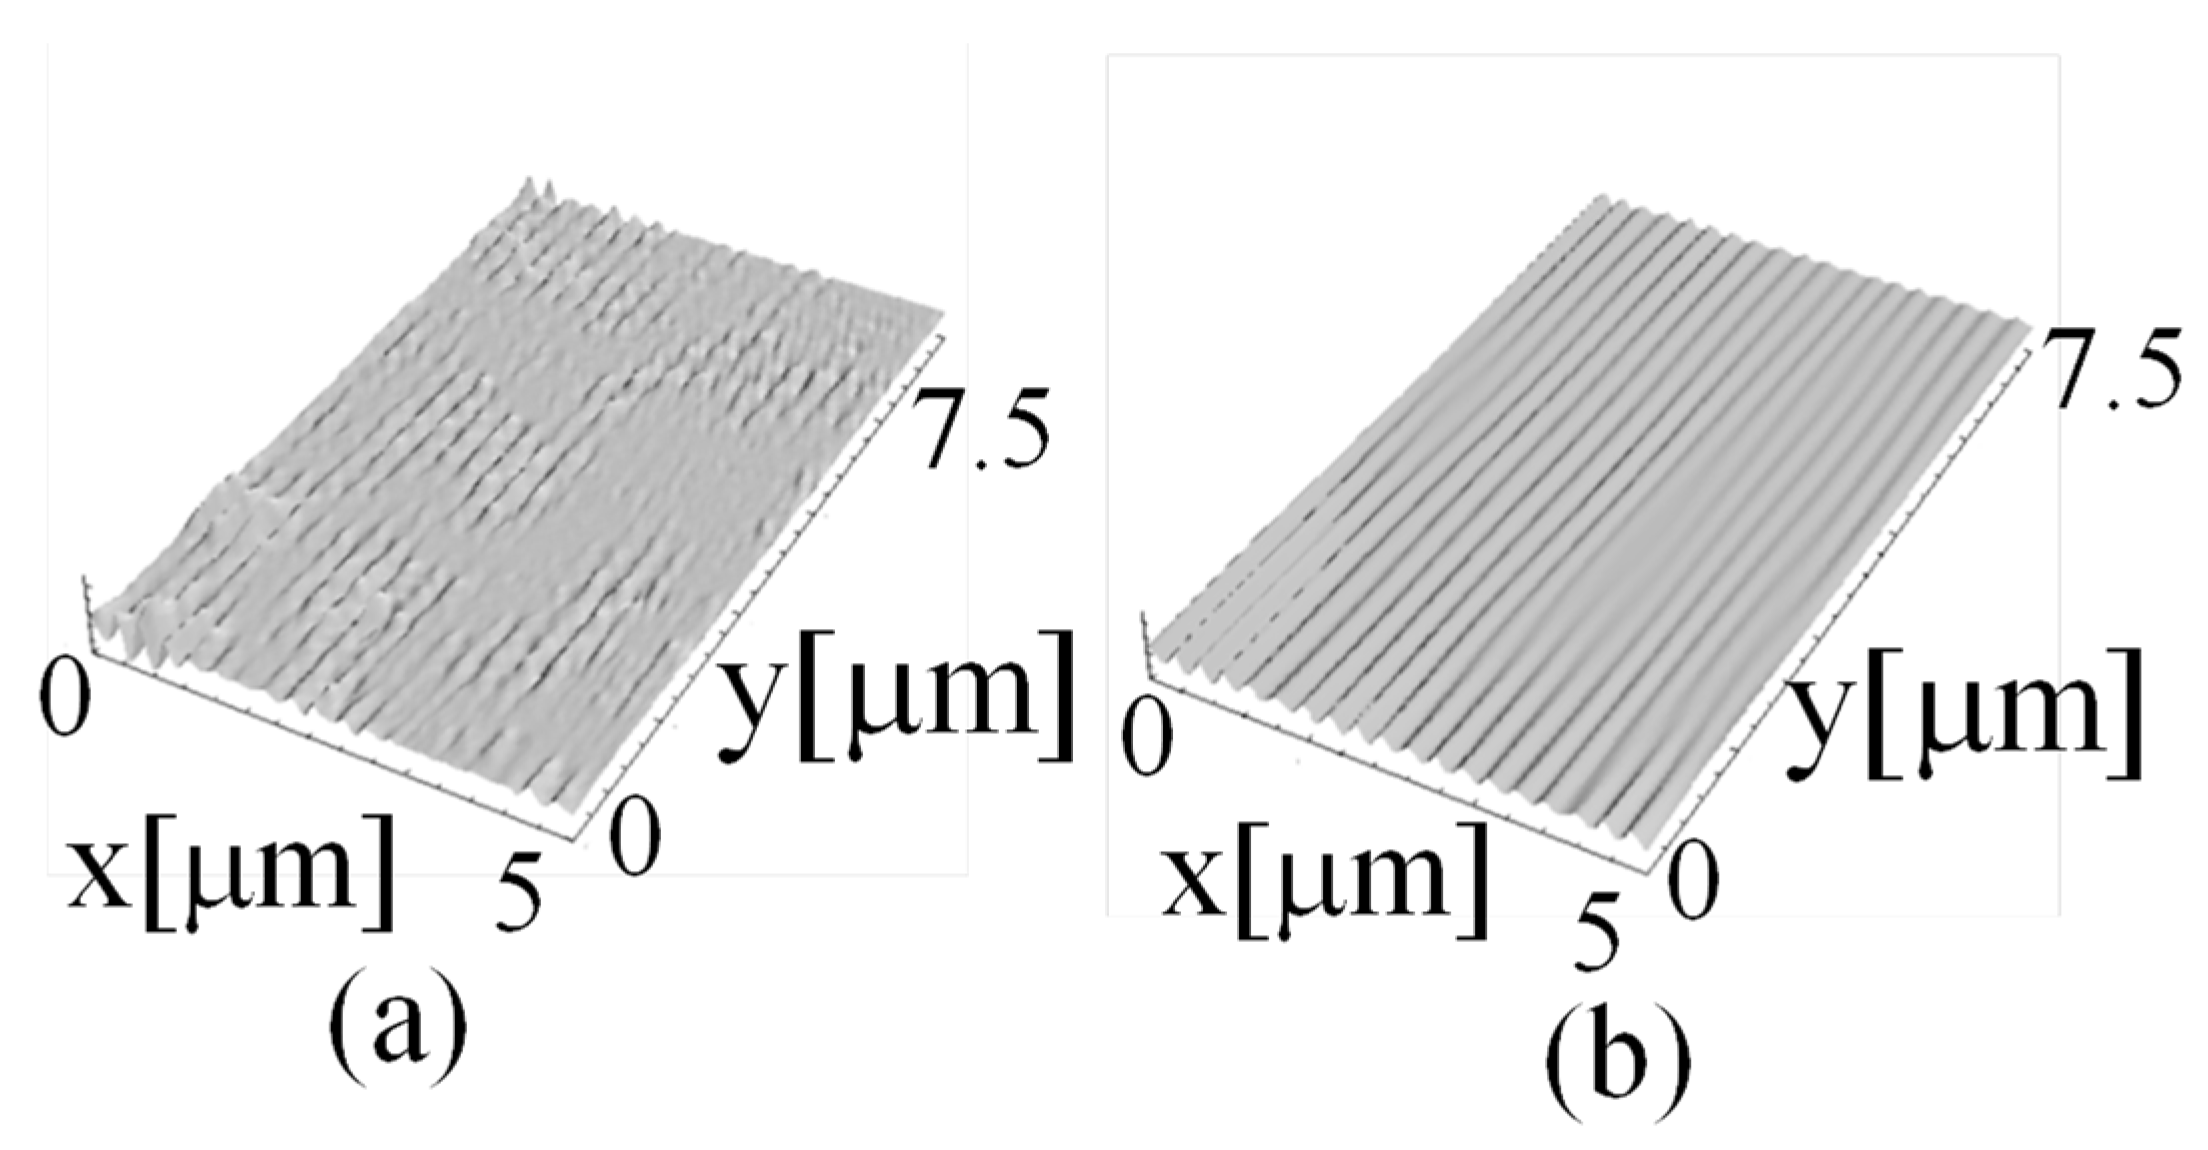
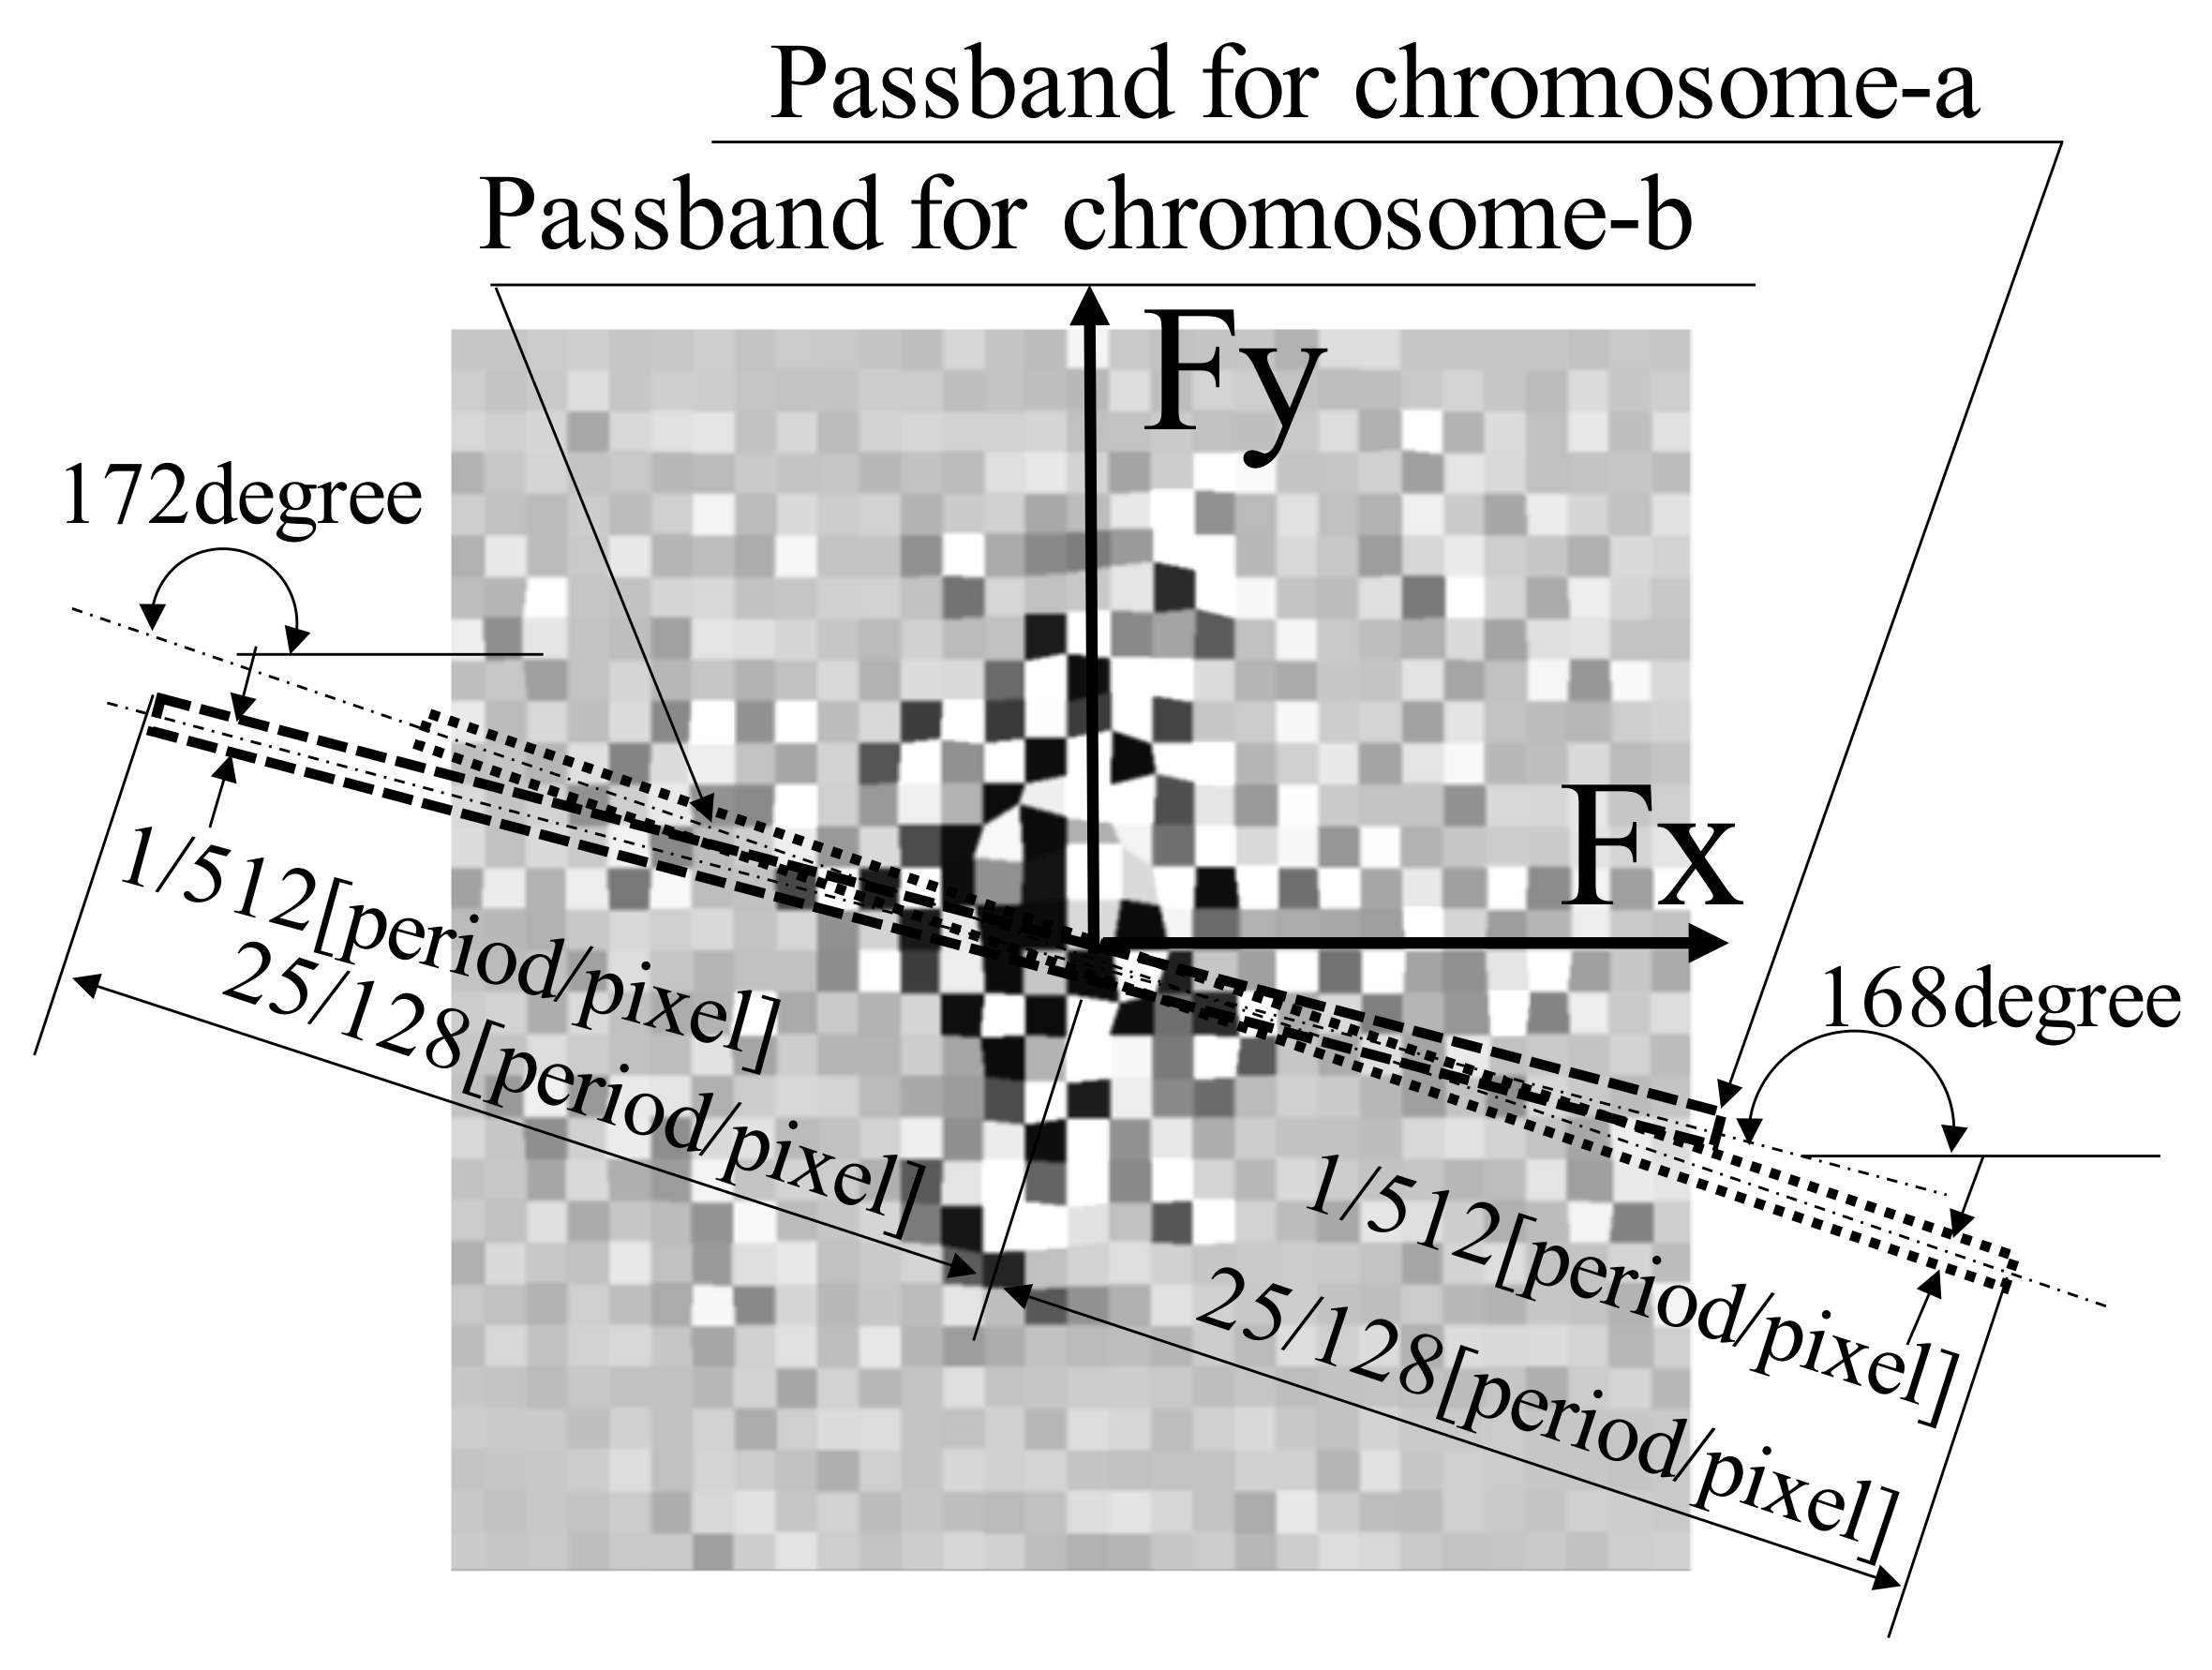
Herein, by performing a Fourier transform on the image depicted in Figure 6a, a specklegram in the frequency domain was obtained, as illustrated in Figure 7, which indicated the presence of ample noise.
On examining chromosomes a and b, as depicted in Figure 4b, the orientation of chromosome a was found to be 78° with respect to the horizontal line and that of chromosome b was found to be 82°. Based on this observation, a wide passband was set in the frequency domain along the direction perpendicular to the orientation of the measurement object to detect the signal components of chromosomes a and b, depicted in Figure 7, as in a previous study [27]. For chromosomes a and b, the passbands were set with slopes of 168° (=78° + 90°) and 172° (=82° + 90°), respectively. The width of the passband was set to 1/512 period/pixel, and the total length of the passband was set to 25/128 period/pixel. These parameters were set according to the results of a previous study [27].
Using this filtering process, the specklegram depicted in Figure 6a was processed as the fringe image shown in Figure 6b. Furthermore, for the specklegram result illustrated in Figure 6a, the phase distribution was obtained by analyzing the fringes of the specklegram after filtering, as illustrated in Figure 6b; this approach reduced the influence of noise using the spatial-fringe analysis method. The camera magnification was set in advance using a reference scale such that 1 pixel of the camera in the optical system corresponded to 40 nm of the actual length.
Therefore, the resulting phase distribution was set to 2π rad for 335.5 nm (half the wavelength of the light source) because the light source wavelength was 671 nm, and the light was double passed. Furthermore, the speckle pattern was shifted by 3 pixels; therefore, the change rate distribution for the shape of the measurement object resulting from the 3 pixels shift (120 nm = 40 nm × 3 pixel) could be obtained by multiplying the phase distribution by (335.5 nm/2 rad)/120 nm, as depicted in (9) and (10) in Figure 1.
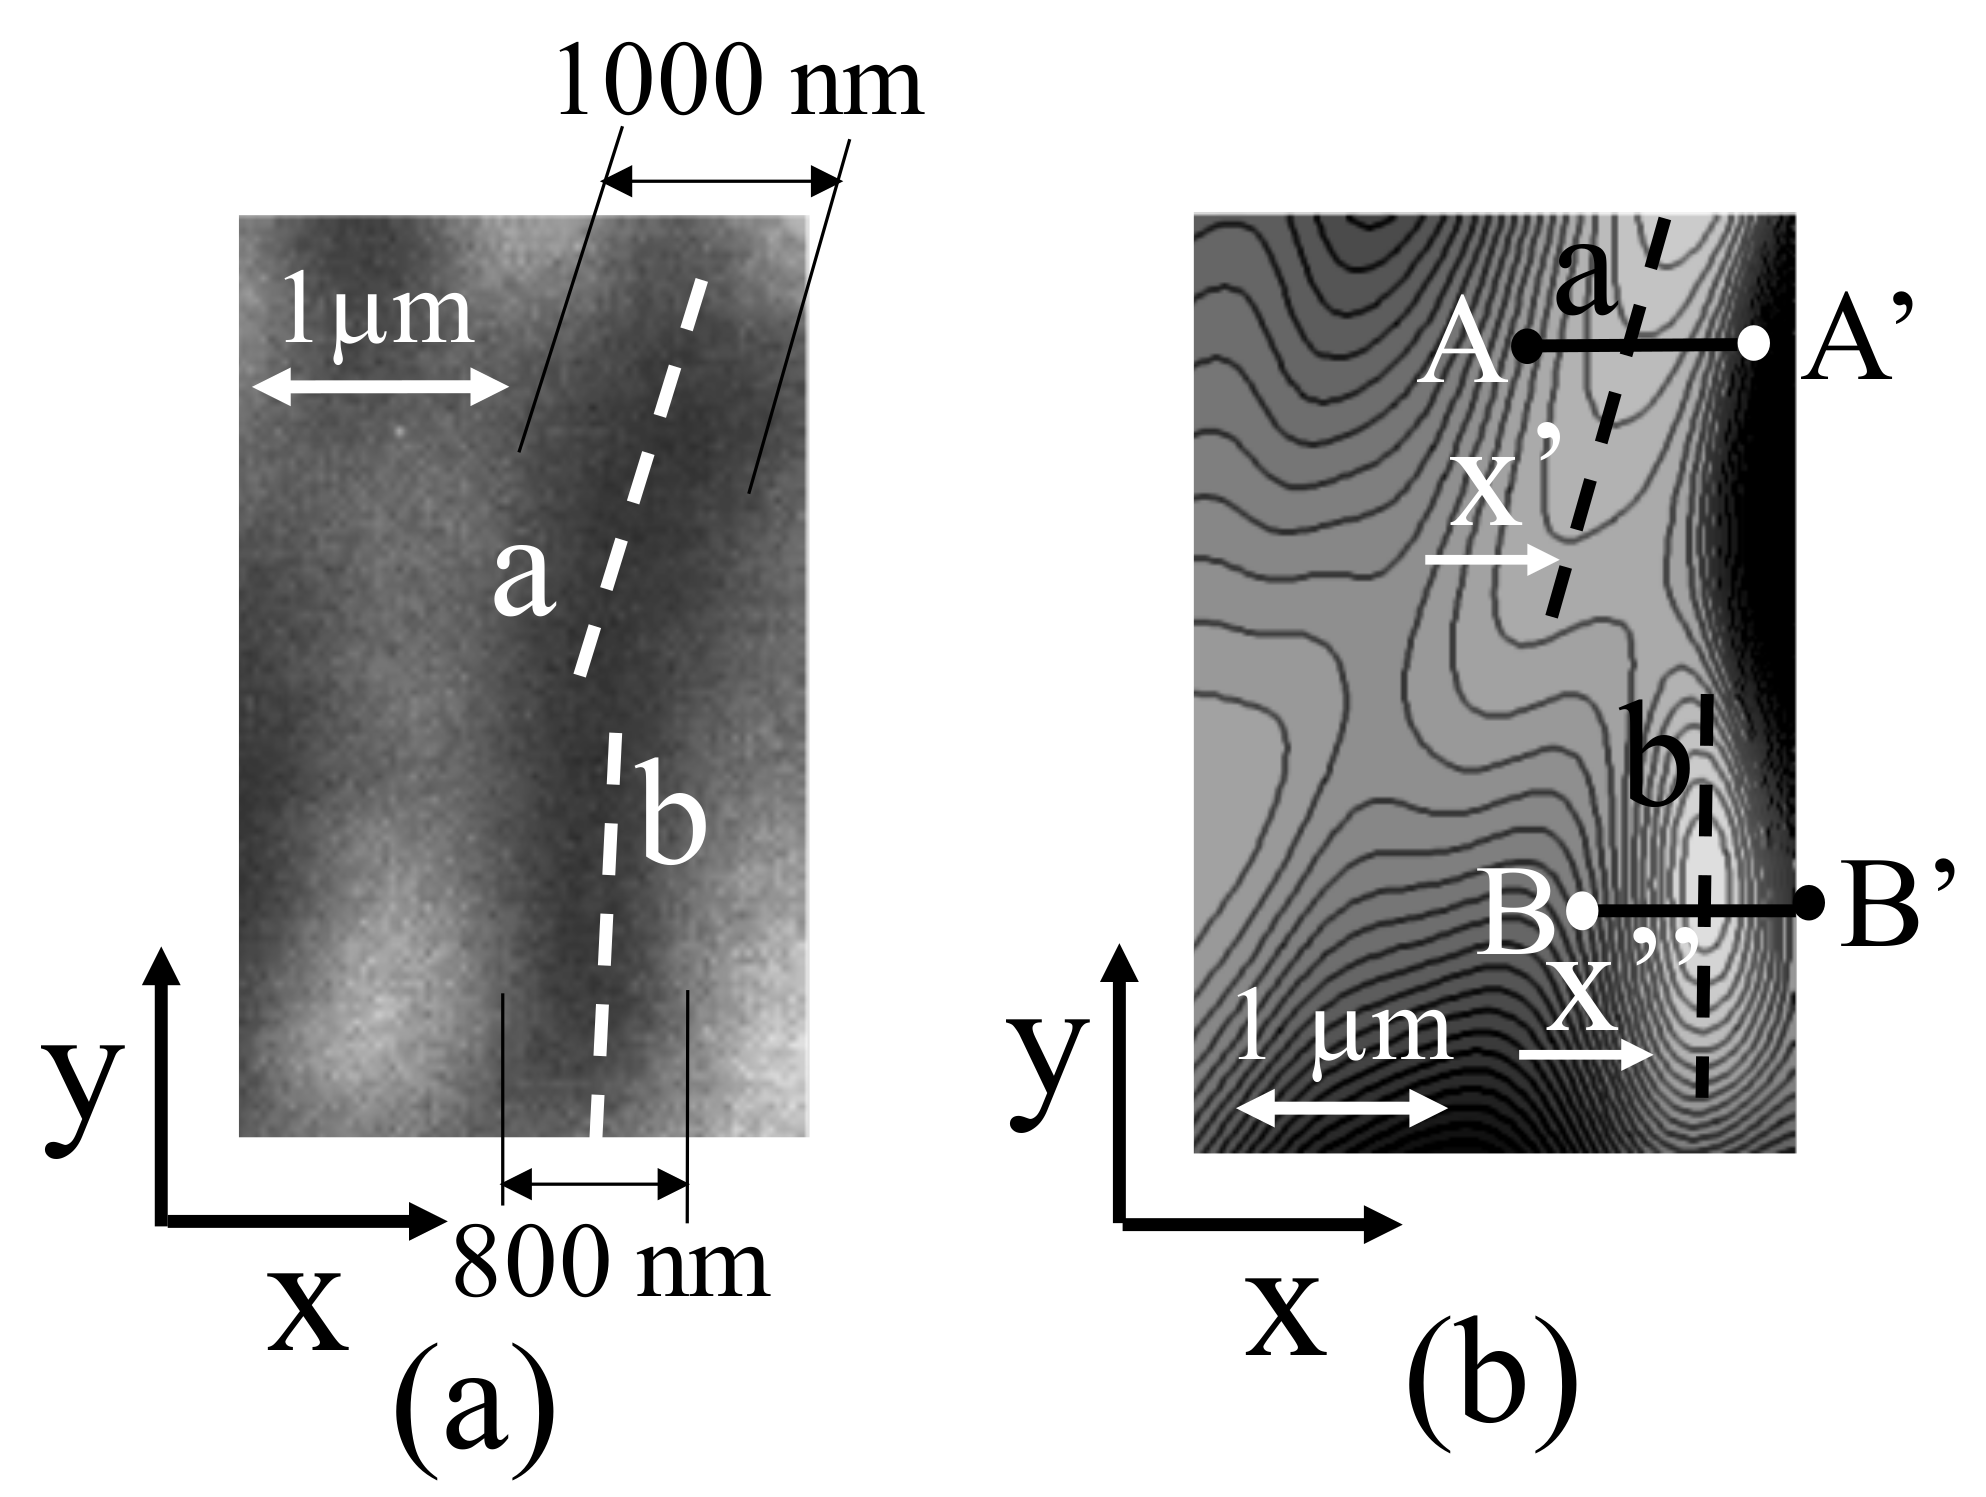
By integrating this rate of change distribution for the shape along two dimensions using the method described in a previous study [23,27] and considering that 1 pixel accounted for 40 nm, the surface shape obtained from the contour map shown in Figure 8b could be realized.
Figure 8a depicts magnified images of chromosomes a and b shown in Figure 4b, and Figure 8b illustrates chromosomes a and b in the same positions as those in the measurement results. The chromosomes stained by the carmine acetate solution exhibited widths of approximately 800–1000 nm, as illustrated in Figure 8a.
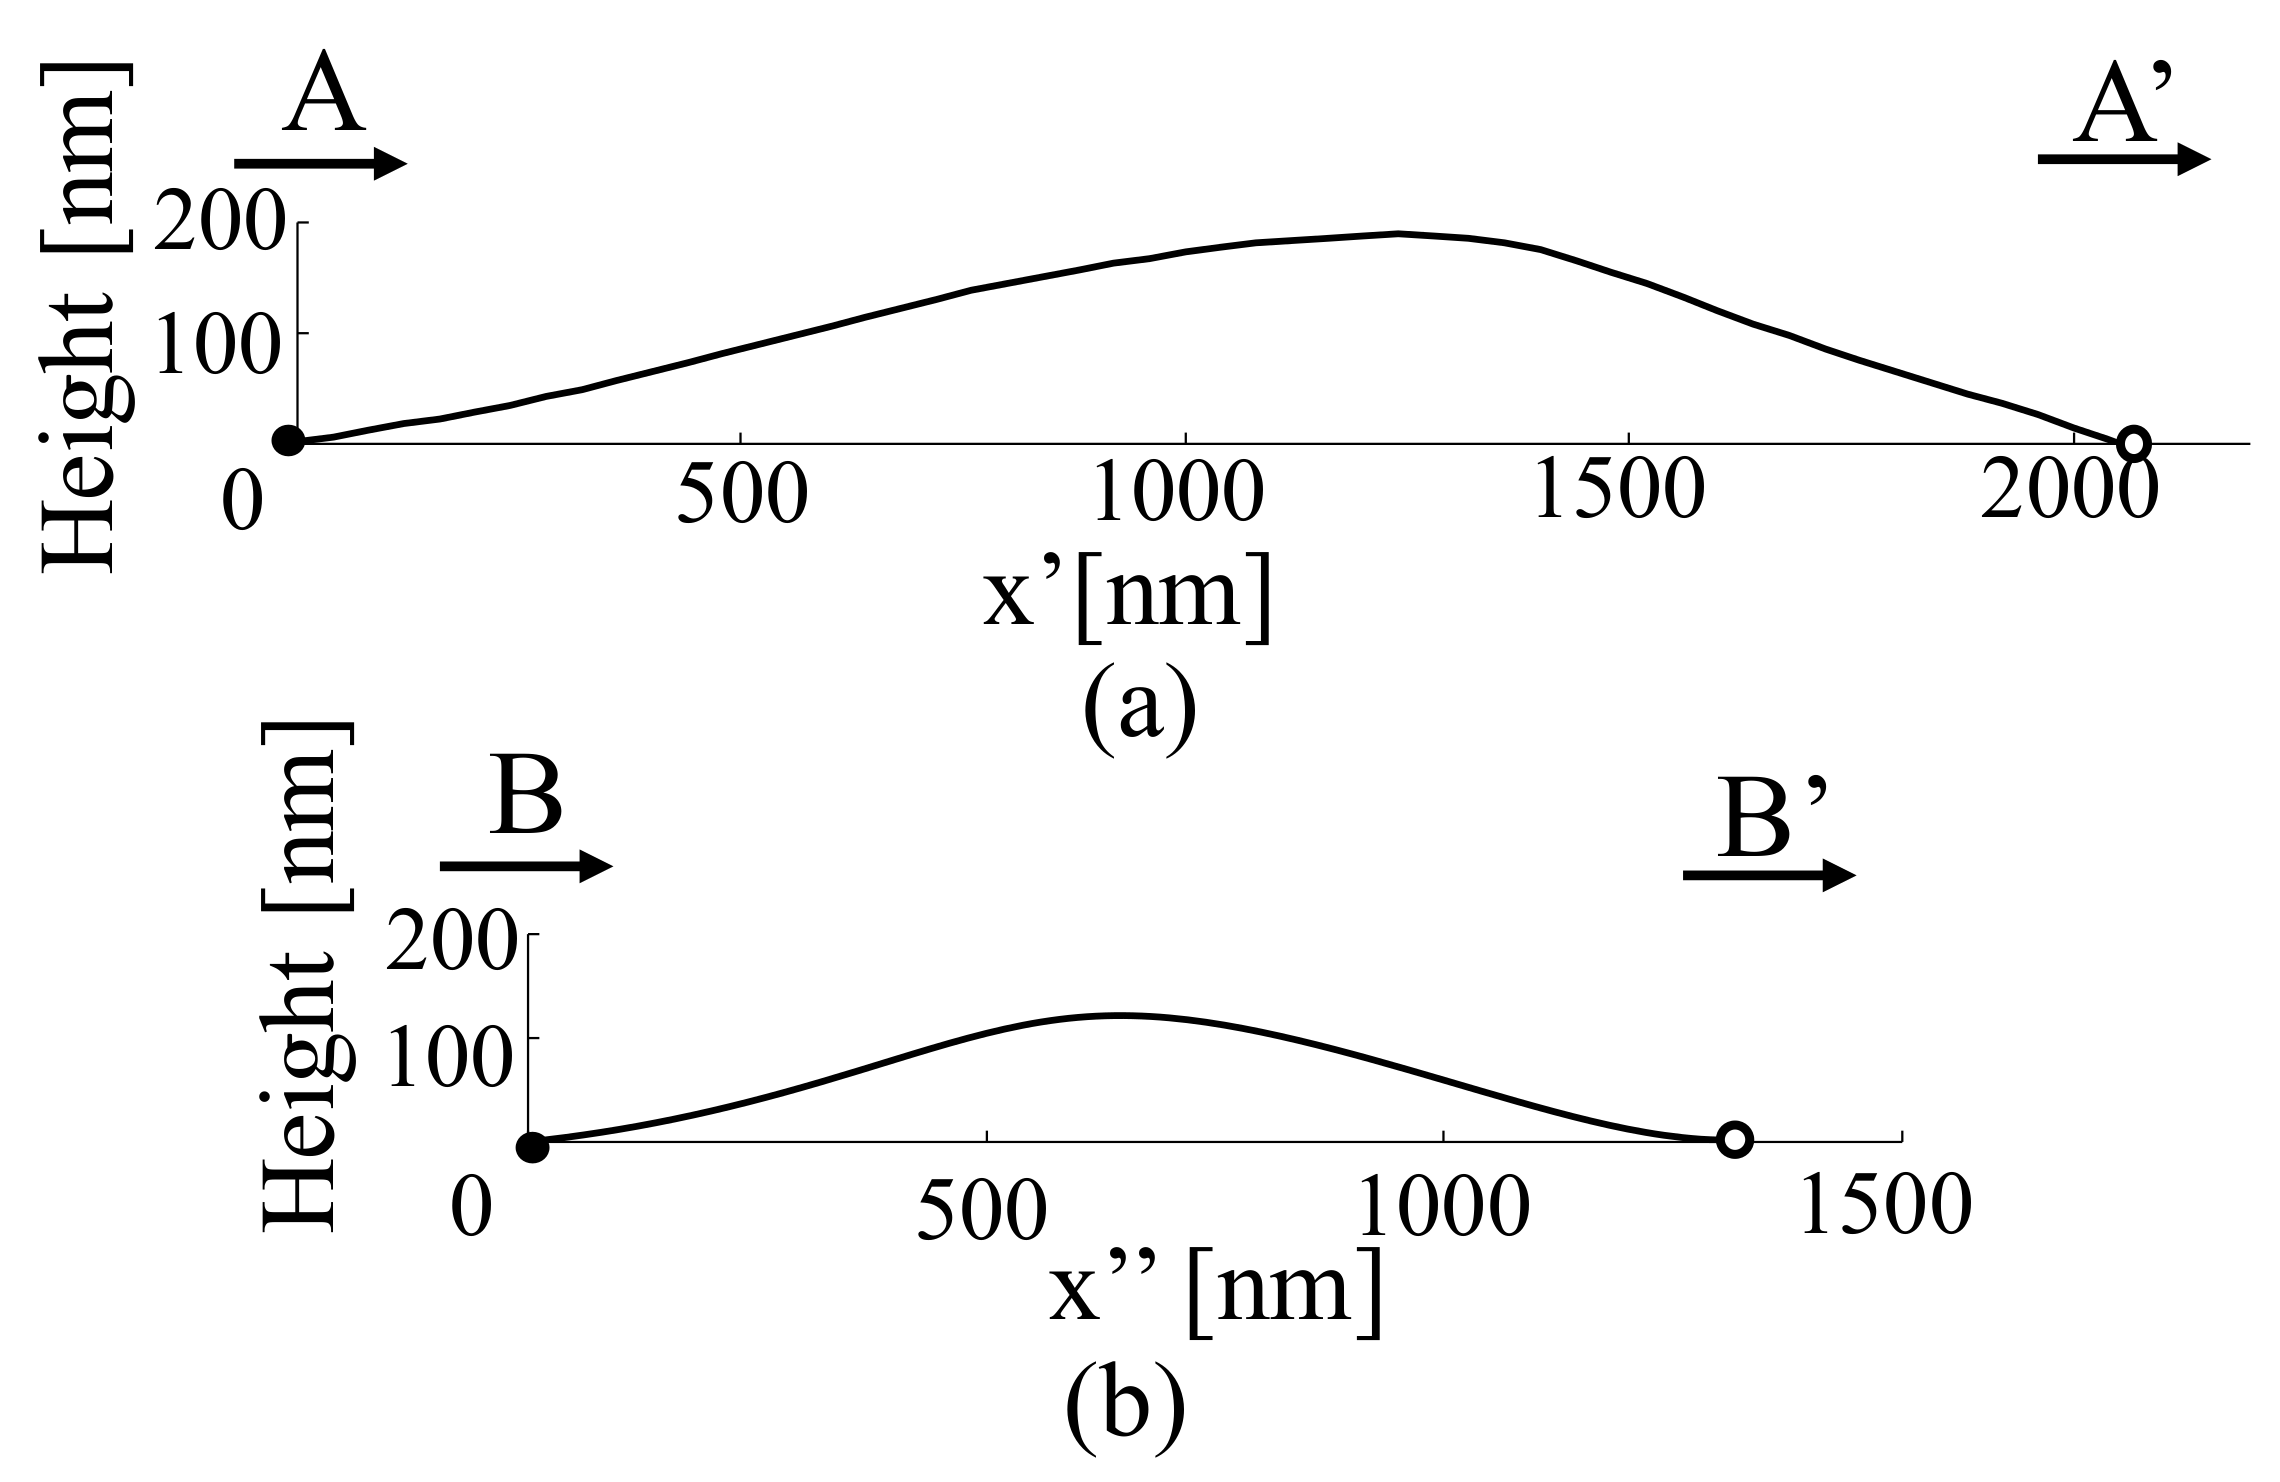
Figure 9 depicts the cross-sectional shapes (A-A’ and B-B’) of chromosomes a and b, which are indicated as black dashed lines in Figure 8b and 3D shapes at the same coordinates in Figure 8a.
Along the A-A’ cross section of the chromosome shown in Figure 9a, the width of the chromosome is greater than 1000 nm, as indicated in Figure 8a. The observation of the chromosome cross section in the form of a 3D shape indicates that the height was approximately 200 nm, which suggests that the chromosome was a flattened tissue. If the chromosome cross section is considered to be approximately elliptical (not necessarily circular), the chromosome cross section depicted in Figure 9a is a heavily condensed tissue, which may have resulted from the processing during chromosome-sample preparation.
Similarly, chromosome b, shown in Figure 9b, is slightly narrower than chromosome a, and the height of the 3D cross section is approximately 130 nm. Both chromosomes have structures that would be more circular naturally; however, condensation is assumed to have occurred during the sample-preparation process, thus altering their shapes. The presence of chromosomes in the samples produced by the traditional sample-preparation process can be confirmed by staining and observing the samples using an optical microscope; however, the samples are considered highly distorted biological tissues. Therefore, it is necessary to develop a new sample-preparation method that does not deform the tissue or depend on conventional sample-preparation methods to realize biological observations.
The observations of structures with dimensions of 100 nm in solid samples, such as microspheres and microcharacters, along with the observations of other plant-cell structures with complex organizations, suggest that this technique may play an important role in the biotechnology field as a super-resolution technique.
Based on the numerous results discussed in this paper, peripheral technologies, such as optical-system fabrication, sample fabrication methods, and sample holding methods, will be developed in the future for the effective use of the speckle interferometry-based super-resolution technology in the field of biotechnology.
4. Conclusions
This study examined the possibility of using a new speckle interferometry-based observation technique, which enabled the observation of objects beyond the diffraction limit by analyzing the phase of light, in the field of biotechnology.
While this technique was already reported to allow observations of microspheres and microcharacters as solid samples with sizes of 100 nm beyond the diffraction limit, this study further confirmed that the technique can also be used to observe plant-cell tissues with complex structural organizations.
The results indicate that this new observation technique can be used for the super-resolution of two-dimensional images based on a lens system, which was previously considered impossible for living tissue observations.
In addition, this study demonstrates that moving images can also be captured. However, problems such as those presented by distorted shapes were encountered with conventional cell-fixed biological samples.
The results presented herein reveal that the observation of living cells requires a processing method that allows one to observe the cells without fixation treatments and a system that allows cultivation by holding the sample horizontally in the culture medium.
The numerous results discussed in this study show that super-resolution technology using speckle interferometry can be an effective observation technique to support the field of bio-research, although there are problems to be solved in the future.
Funding
This work was supported by JSPS KAKENHI grant number 20H02165.
Institutional Review Board Statement
Not applicable.
Informed Consent Statement
Not applicable.
Data Availability Statement
Not applicable.
Conflicts of Interest
The authors declare no conflict of interest.
References
- Garini, Y.; Vermolen, B.J.; Young, I.T. From micro to nano: Recent advances in high-resolution microscopy. Curr. Opin. Biotechnol. 2005, 16, 3–12. [Google Scholar] [CrossRef] [PubMed]
- Hell, S.W.; Wichmann, J. Breaking the diffraction resolution limit by stimulated emission: Stimulated-emission-depletion fluorescence microscopy. Opt. Lett. 1994, 19, 780–782. [Google Scholar] [CrossRef] [PubMed]
- Hell, S.W.; Kroug, M. Ground-state-depletion fluorescence microscopy: A concept for breaking the diffraction resolution limit. Appl. Phys. B 1995, 60, 495–497. [Google Scholar] [CrossRef]
- Heintzman, R.; Ficz, G. Beaking the resolution limit in light microscopy. Brief. Funct. Genom. Proteomics. 2006, 5, 289–301. [Google Scholar] [CrossRef] [PubMed]
- Huang, B. Super-resolution optical microscopy: Multiple choices. Curr. Opin. Chem. Biol. 2010, 14, 10–14. [Google Scholar] [CrossRef]
- Kohler, H. On Abbe’stheory of image formation in the microscope. Opt. Acta 1981, 28, 1691–1701. [Google Scholar] [CrossRef]
- Feynman, R.P. The Feynman Lectures on Physics; Addison-Wesley Publishing Co.: Reading, MA, USA, 1989; pp. 30–35. [Google Scholar]
- Born, M.; Wolf, E. Principles of Optics, Electromagnetic Theory of Propagation, Interference and Diffraction of Light, 7th ed.; Cambridge University Press: Cambridge, UK, 1999; pp. 199–201, 461–476. [Google Scholar]
- Krafft, G.A.; Sutton, W.R.; Cummings, R.T. Photoactivable fluorophores. 3. Synthesis and photoactivation of fluorogenic difunctionalized fluoresceins. J. Am. Chem. Soc. 1988, 110, 301–303. [Google Scholar]
- Girousi, S.T.; Golia, E.E.; Voulgaropoulos, A.N.; Maroulis, A.J. Fluorometric determination of formaldehyde. Anal. Bioanal. Chem. 1977, 358, 667–668. [Google Scholar] [CrossRef]
- Rust, M.J.; Bates, M.; Zhuang, X. Sub-diffraction-limit imaging by stochastic optical reconstruction microscopy (STORM). Nat. Methods 2006, 3, 793–796. [Google Scholar] [CrossRef] [Green Version]
- Betzig, E.; Patterson, G.H.; Sougrat, R.; Lindwasser, O.W.; Olenych, S.; Bonifacino, J.S.; Davidson, M.W.; Lippincott-Schwartz, J.; Hess, H.F. Imaging intracellular fluorescent proteins at nanometer resolution. Science 2006, 313, 1642–1645. [Google Scholar] [CrossRef] [Green Version]
- Hess, S.T.; Girirajan, T.P.K.; Mason, M.D. Ultra-high resolution imaging by fluorescence photoactivation localization microscopy. J. Biophys. 2006, 91, 4258–4272. [Google Scholar] [CrossRef]
- Weber, M.; Khan, T.A.; Patalag, L.J.; Bossi, M.; Leutenegger, M.; Belov, V.N.; Hell, S.W. Photoactivatable Fluorophore for Stimulated Emission Depletion (STED) Microscopy and Bioconjugation Technique for Hydrophobic Labels. Chem. Eur. J. 2021, 27, 451–458. [Google Scholar]
- Heilemann, M.; Van De Linde, S.; Schüttpelz, M.; Kasper, R.; Seefeldt, B.; Mukherjee, A.; Tinnefeld, P.; Sauer, M. Subdiffraction-resolution fluorescence imaging with conventional fluorescent probes. Angew. Chem. Int. Ed. 2008, 47, 6172–6176. [Google Scholar] [CrossRef]
- Sirohi, R.S. Speckle Metrology; Marcel Dekker: New York, NY, USA, 1993; pp. 99–234. [Google Scholar]
- Cloud, G. Optical Methods of Engineering Analysis; Cambridge University Press: Cambridge, UK, 1995; pp. 395–476. [Google Scholar]
- Malacara, D. Optical Shop Testing; John Wiley &Sons: Hoboken, NJ, USA, 1992; pp. 501–652. [Google Scholar]
- Arai, Y. Three-dimensional shape measurement beyond the diffraction limit of lens using speckle interferometry. J. Mod. Opt 2018, 65, 1866–1874. [Google Scholar] [CrossRef]
- Arai, Y. Observation of micro-characters using three-dimensional shape measurement method based on speckle interferometry. J. Mod. Opt. 2020, 67, 1451–1461. [Google Scholar] [CrossRef]
- Arai, Y. Microshape measurement method using speckle interferometry based on phase analysis. Photonics 2021, 8, 112. [Google Scholar] [CrossRef]
- Mizoguchi, S. Data Base of Histology Color Slides. Kobe University Library Digital Archive. 2015. Available online: https://hdl.handle.net/20.500.14094/90009617 (accessed on 30 September 2022).
- Arai, Y. Three-Dimensional shape measurement beyond diffraction limit for measurement of Dynamic Events. Prog. Optomechatronic Technol. 2019, 233, 1–10. [Google Scholar] [CrossRef]
- Arai, Y. Electronic Speckle Pattern Interferometry based on spatial information using only two sheets of speckle patterns. J. Mod. Opt. 2014, 61, 297–306. [Google Scholar] [CrossRef]
- George, N.; Jain, A. Speckle reduction using multiple tones of illumination. Appl. Opt. 1973, 12, 1202–1212. [Google Scholar] [CrossRef] [Green Version]
- Arai, Y. Pre-treatment for preventing degradation of measurement accuracy from speckle noise in speckle interferometry. Measurement 2019, 136, 36–41. [Google Scholar] [CrossRef]
- Arai, Y. Shape measurement method of two-dimensional microstructures beyond the diffraction limit based on speckle interferometry. Photonics 2021, 8, 420. [Google Scholar] [CrossRef]
- ALeitch, R.; Schwarzacher, T.; Jackson, D.; Leitch, I.J. In Situ Hybridization; Bios Scientific Publishers Ltd.: Oxford, UK, 1994; pp. 19–31. [Google Scholar]
- Arai, Y.; Yokozeki, S. Improvement of measuring accuracy of spatial fringe analysis method using a Kalman filter and its application. Opt. Eng. 2001, 40, 2605–2611. [Google Scholar]
Figure 1.
Flowchart of processing.

Figure 2.
Optical system.

Figure 3.
Cell of garlic root. (a) Cell image by optical microscope. (b) Cell image by scanning electron microscope.
Figure 3.
Cell of garlic root. (a) Cell image by optical microscope. (b) Cell image by scanning electron microscope.

Figure 4.
Measured cell of garlic root. (a) Cell image by the optical system in this method using LED. (b) Magnified chromosome image shown (a).
Figure 4.
Measured cell of garlic root. (a) Cell image by the optical system in this method using LED. (b) Magnified chromosome image shown (a).

Figure 5.
Speckle pattern. (a) Speckle pattern as cell image by the optical system in this method. (b) Speckle pattern in frequency domain.
Figure 5.
Speckle pattern. (a) Speckle pattern as cell image by the optical system in this method. (b) Speckle pattern in frequency domain.

Figure 6.
Specklegrams. (a) Specklegram. (b) Filtered specklegram.

Figure 7.
Specklegram in frequency domain and passband of filter.

Figure 8.
Measured shape of surface. (a) Chromosome image by the optical system in this method using LED. “a” and “b” are chromosome images. (b) Contour map of measured object. “A-A′” and “B-B′” are the observed positions of the cross sections of chromosomes “a” and “b”.
Figure 8.
Measured shape of surface. (a) Chromosome image by the optical system in this method using LED. “a” and “b” are chromosome images. (b) Contour map of measured object. “A-A′” and “B-B′” are the observed positions of the cross sections of chromosomes “a” and “b”.


Publisher’s Note: MDPI stays neutral with regard to jurisdictional claims in published maps and institutional affiliations. |
© 2022 by the author. Licensee MDPI, Basel, Switzerland. This article is an open access article distributed under the terms and conditions of the Creative Commons Attribution (CC BY) license (https://creativecommons.org/licenses/by/4.0/).
Share and Cite
MDPI and ACS Style
Arai, Y. Possibility of Biological Observations Using the Speckle Interferometry-Based Super-Resolution Technology. Micro 2022, 2, 620-631. https://doi.org/10.3390/micro2040041
AMA Style
Arai Y. Possibility of Biological Observations Using the Speckle Interferometry-Based Super-Resolution Technology. Micro. 2022; 2(4):620-631. https://doi.org/10.3390/micro2040041
Chicago/Turabian StyleArai, Yasuhiko. 2022. "Possibility of Biological Observations Using the Speckle Interferometry-Based Super-Resolution Technology" Micro 2, no. 4: 620-631. https://doi.org/10.3390/micro2040041