Article

Sonochemical Synthesis of Silica-Supported Iron Oxide Nanostructures and Their Application as Catalysts in Fischer–Tropsch Synthesis

1
Institute of Gas Innovation and Technology, Advanced Energy Research and Technology Center, Stony Brook University, Stony Brook, NY 11794, USA
2
Department of Materials Science and Chemical Engineering, Stony Brook University Cancer Center, Stony Brook University, Stony Brook, NY 11794, USA
3
Gas Asset Management and Engineering, National Grid, Melville, NY 11747, USA
*
Author to whom correspondence should be addressed.
Micro 2022, 2(4), 632-648; https://doi.org/10.3390/micro2040042
Submission received: 7 September 2022 / Revised: 29 September 2022 / Accepted: 18 November 2022 / Published: 21 November 2022
(This article belongs to the Section Microscale Materials Science)

Abstract

:
The emphasis on climate change requires processes to be more efficient to minimize CO2 emissions, and nanostructured materials as catalysts could play a crucial role due to their high surface area per unit volume. Herein, we report the synthesis of silica microspheres (450–600 nm) using a modified Stober process, on which iron oxide clusters were deposited by sonolysis of iron pentacarbonyl to yield a nanostructured iron material (Si-Fe). A suite of spectroscopic techniques was used to characterize the synthesized materials. The BET surface area of freshly prepared Stober silica was 8.00 m2/g, and the Si-Fe material was 24.0 m2/g. Iron is commercially used as a Fischer–Tropsch (F–T) catalyst due to its low cost. However, catalyst attrition causes catalyst loss and lower product quality. In this study, the synthesized Si-Fe materials were evaluated for F–T synthesis to address these challenges. For comparison, two commercial materials, UCI (silica-supported micron-sized iron oxide) and BASF (unsupported nanosized iron oxide), were also evaluated. All three materials were first activated by pretreatment with either CO or synthesis gas (a mixture of CO and H2) for 24 h, then evaluated for quick screening in batch mode for F–T synthesis in a Parr batch reactor at three temperatures: 493 K, 513 K, and 533 K. The F–T data at 513 K showed that the CO-pretreated Si-Fe catalyst demonstrated lower CO2 (<0.5%), lower CH4 (<0.5%), and higher (>58%) C8–C20 selectivity (mol% C) to hydrocarbons, surpassing both reference catalysts. The temperature dependence data for Si-Fe: 17.4%, 58.3%, and 54.9% at 493 K, 513 K, and 533 K, respectively, showed that the hydrocarbon yield maximized at 513 K. The surface area increased to 27.9 m2/g for the CO-reduced Si-Fe catalyst after the F–T reaction at 513 K. The morphology and structural change of catalysts, before and after the F–T runs, were imaged. Of all the catalysts evaluated, the SEM–EDS data analysis showed the least carbon deposition on the CO-treated Si-Fe catalyst after the F–T reaction at 513 K and minimized CO2, a greenhouse gas. This could pave the way for selecting nanomaterials as F–T catalysts that effectively operate at lower temperatures and produce negligible CO2 by minimizing water-gas-shift (WGS) activity.

Graphical Abstract

1. Introduction

Fischer–Tropsch synthesis (F–T) is a widely used commercial process to produce fuels and chemicals from coal, natural gas, or biomass-derived synthesis gas (syngas). Since its discovery in the 1920s [1,2], F–T has been one of the most important gas-to-liquid (GTL) processes [3]. The advantage of syngas conversion via F–T is the production of clean hydrocarbons free of sulfur, nitrogen, and aromatics. Due to emerging environmental and sustainability demands and the evolution of new methods to produce petrochemicals from abundant natural gas or biomass and other feedstocks [1,4], there is renewed interest in F–T synthesis. Based on the published data, the research output of the F–T topic more than tripled, with the published papers increasing from 1709 during 1999–2008 to 5740 during the 2009–2018 period.
The F–T reaction involves the hydrogenation of CO over a metal catalyst. Metals such as Co, Ru, Fe, and Ni are known to be F–T active [4], though Co and Fe catalysts stand out in industrial applications due to their higher activity and selectivity for hydrocarbons. Catalysts based on iron are favored over cobalt to produce long-chain hydrocarbons due to their low cost and low methane selectivity at low-temperature F–T (LTFT) conditions [4]. However, in practice, an iron catalyst is used in the LTFT application with an H2 deficient syngas source (H2/CO ratio < 1) due to its unique water–gas shift (WGS) activity, while cobalt is favored in F–T with relatively high H2/CO ratio (>1.7). As a result of the WGS reaction, the Fe-catalyzed F–T is usually highly produced (over 20% CO2) as a major side product.
Previously published reports suggest that nanosized iron catalysts could potentially retard the WGS activity as the F–T reaction temperature is lowered. In previous work from our group, it was suggested that the size of catalyst particles proved crucial during F–T synthesis as CO2 yield decreased with smaller α-Fe2O3 catalyst particle size [3,5]. The simulation of the WGS kinetics over a nanostructured iron-catalyzed F–T by Pour et al. [6] was based on the Langmuir–Hinshelwood–Hougen–Watson rate equations that were of a similar type as those derived for the formate mechanism. These simulations indicated that the reduction in the catalyst particle size leads to an increase in the activation energy of the WGS reaction, which resulted in a decrease in the reaction rate. Among other characteristics, the attrition of iron catalyst is a major issue in slurry bubble column reactors that causes the plugging of downstream filters and lowers product quality [7,8]. Thus, smooth round catalyst particles are desirable to limit abrasion as particles contact each other in the moving bed in a slurry reactor [9]. To improve the mechanical integrity of the catalyst from attrition, structural promoters/support are often included. To anchor the catalyst, SiO2, Al2O3, and TiO2 are the most widely studied supports [7,10,11]. Silica was the best support in terms of both activity and selectivity during the F–T reaction [12]. Recent results [13,14,15] featured special morphologies, such as hollow multi-shelled structures and hierarchical porous structures in catalysis, and established that these features play an important role in catalytic activity.
Considering all the above aspects, a solid silica sub-microsphere structural support was proposed in the present study for the deposition of nanosized iron catalysts. The silica sphere support could also serve other purposes, such as (1) to spread catalyst nanoparticles over a larger surface area to reduce aggregation that leads to low catalytic activity and high methane selectivity, as observed when using bulk iron catalysts, and (2) to stabilize catalysts from sintering which would potentially result in longer catalyst life.
Sonolysis is a technique to synthesize nanostructure materials that allows the production of novel materials without the demand of reaction conditions such as high temperatures, pressures, or long reaction times. Ultrasound-assisted chemistry involves a process of acoustic cavitation that involves the formation, growth, and implosive collapse of bubbles within a solvent [16]. Localized hot spots are generated by the collapsing bubbles, and these have been experimentally determined to produce extreme conditions: over 5000 K temperature, 180 MPa pressures, and a 1010 K.s−1 cooling rate [17,18,19]. Inside the collapsing bubble, volatile organometallic compounds could decompose into metal atoms and agglomerate to form nanostructured materials. Suslick et al. [18,19,20] reported a series of studies to use these exceptional local conditions to produce amorphous metal nanoclusters, nanostructure alloys, and metal carbides.
The use of silica as a support was studied previously for application in F–T synthesis, where the atomic ratio of Fe to silica was varied from 100 to 2 [21]. Recently, the use of silica-encapsulated nanosized Fe, Co, and Ru metals for F–T synthesis in a microchannel reactor was also reported [22]. In this study, we report a novel nanostructured iron catalyst synthesized using an ultrasound-driven method to deposit iron clusters on sub-microspherical silica support. The synthesized nanosized material was evaluated in a batch reactor, along with two commercially available F–T catalysts for comparative performance, concerning selectivity for total hydrocarbons (useful products) and CO2 (a greenhouse gas) and temperature-dependent catalyst sintering. For preliminary screening, all three catalysts were evaluated in a 300 mL Parr batch reactor for F–T synthesis at three operating temperatures of 493 K, 513 K, and 533 K.

2. Materials and Methods

2.1. Materials

Ethyl alcohol (≥99.5% purity), ammonium hydroxide (ACS reagent, 28.0–30.0% NH3 basis), Tetraethyl orthosilicate (TEOS), reagent grade, 98% purity), iron pentacarbonyl (>99.99%), N, N-Dimethylformamide (DMF, 99.8%), and n-hexadecane (95%) were purchased from Sigm-Aldrich- USA and used as received. Millipore-Q purity water was used. Ethylflopolyolefin-164 solvent, a dec-1-ene homopolymer (composition: 84.4% trimer, 14.5% tetramer; b.pt. = 518 °C; d = 0.818 g mL−1; mol. wt. = 437) was purchased from the Ethyl Corporation.
Two commercial reference Fe-containing catalysts were used as received. (1) BASF catalysts from BASF corporation, comprised of α-Fe2O3 nanoparticles having the following properties: Size = 20 to 80 nm; surface area (SA) = 16 to 20 m2 g−1 and d (bulk) = 5.25 g/mL, and (2) UCI catalyst comprised of 69.6 wt.% Fe2O3, 5.1 wt.% K2O, 8.3 wt.% SiO2 = 8.3 and 2.6 wt.% CuO, having the following properties: Loss on ignition (LOI) = 14.4 wt.%, MPD = 32.5 μm, SA = 232 m2 g−1, and d = 0.80 g/mL, from Air Products and Chemicals [3].

2.2. Synthesis of Silica Nanospheres by the Stober Process

The silica microspheres were synthesized by the Stober process consisting of the hydrolysis of TEOS (described elsewhere) according to the following procedure [23]: Two solutions, solution I containing 8.6 mL TEOS in 51.4 mL ethanol, and solution II containing 16.3 mL ammonia in 85.7 mL ethanol, were prepared separately at room temperature under an inert atmosphere with continuous stirring. Solution II was placed in a round-bottom flask. Solution I was then added to solution II with a micro-feed pump using a syringe with a constant flow rate of 2.5 mL/min. A water bath was used to control the temperature of the reactions with an accuracy of ±0.05 °C. The whole mixture reacted within 12 h. A powder of silica microspheres was obtained by washing extensively with alcohol in a centrifuge and then drying in an oven at 333 K overnight. The size range of the silica particles obtained was between 400–600 nm.

2.3. Sonochemical Synthesis of Iron Oxide on the Silica Nanoparticle Support

Iron oxide was deposited onto the silica support by using the sonochemical synthesis technique. The reaction was carried out by a MISONIX S3000 ultrasonic liquid processor with microprocessor-controlled auto-tuning and temperature control. The sonicator had a power output of 600 W, operating at a fixed frequency of 20 kHz. The deposition procedure was carried out by adding 2 g silica to a mixture of 60 mL hexadecane and 3 mL DMF in the sonication vessel. The cell was attached to the sonicator probe tip (diameter of 0.5 inches), nitrogen was bubbled for 30 min to expel any dissolved air/oxygen, and the solution was kept under nitrogen. Iron pentacarbonyl was then added to the vessel, which was kept immersed in a water bath during the entire sonication. The sonolysis was monitored through the evolution of carbon monoxide (CO) gas and lasted for 3 h. Previous studies of this reaction indicate that the average yield obtained was 80%. To evaluate the effect of iron concentration on the final product, the initial volume of the Fe(CO)5 precursor added to the silica suspension was set at 1 mL, 0.5 mL, and 0.2 mL, corresponding to an initial SiO2/Fe(CO)5 weight ratios of 1.38, 2.76, and 6.89, respectively. The brick red solid product was collected by multiple cycles of washing with hexane and centrifugation and then dried overnight. To fully oxidize the iron phase in the sample, the solid product obtained from sonication was crystallized in a furnace at 773 K under flowing air for 3 h.

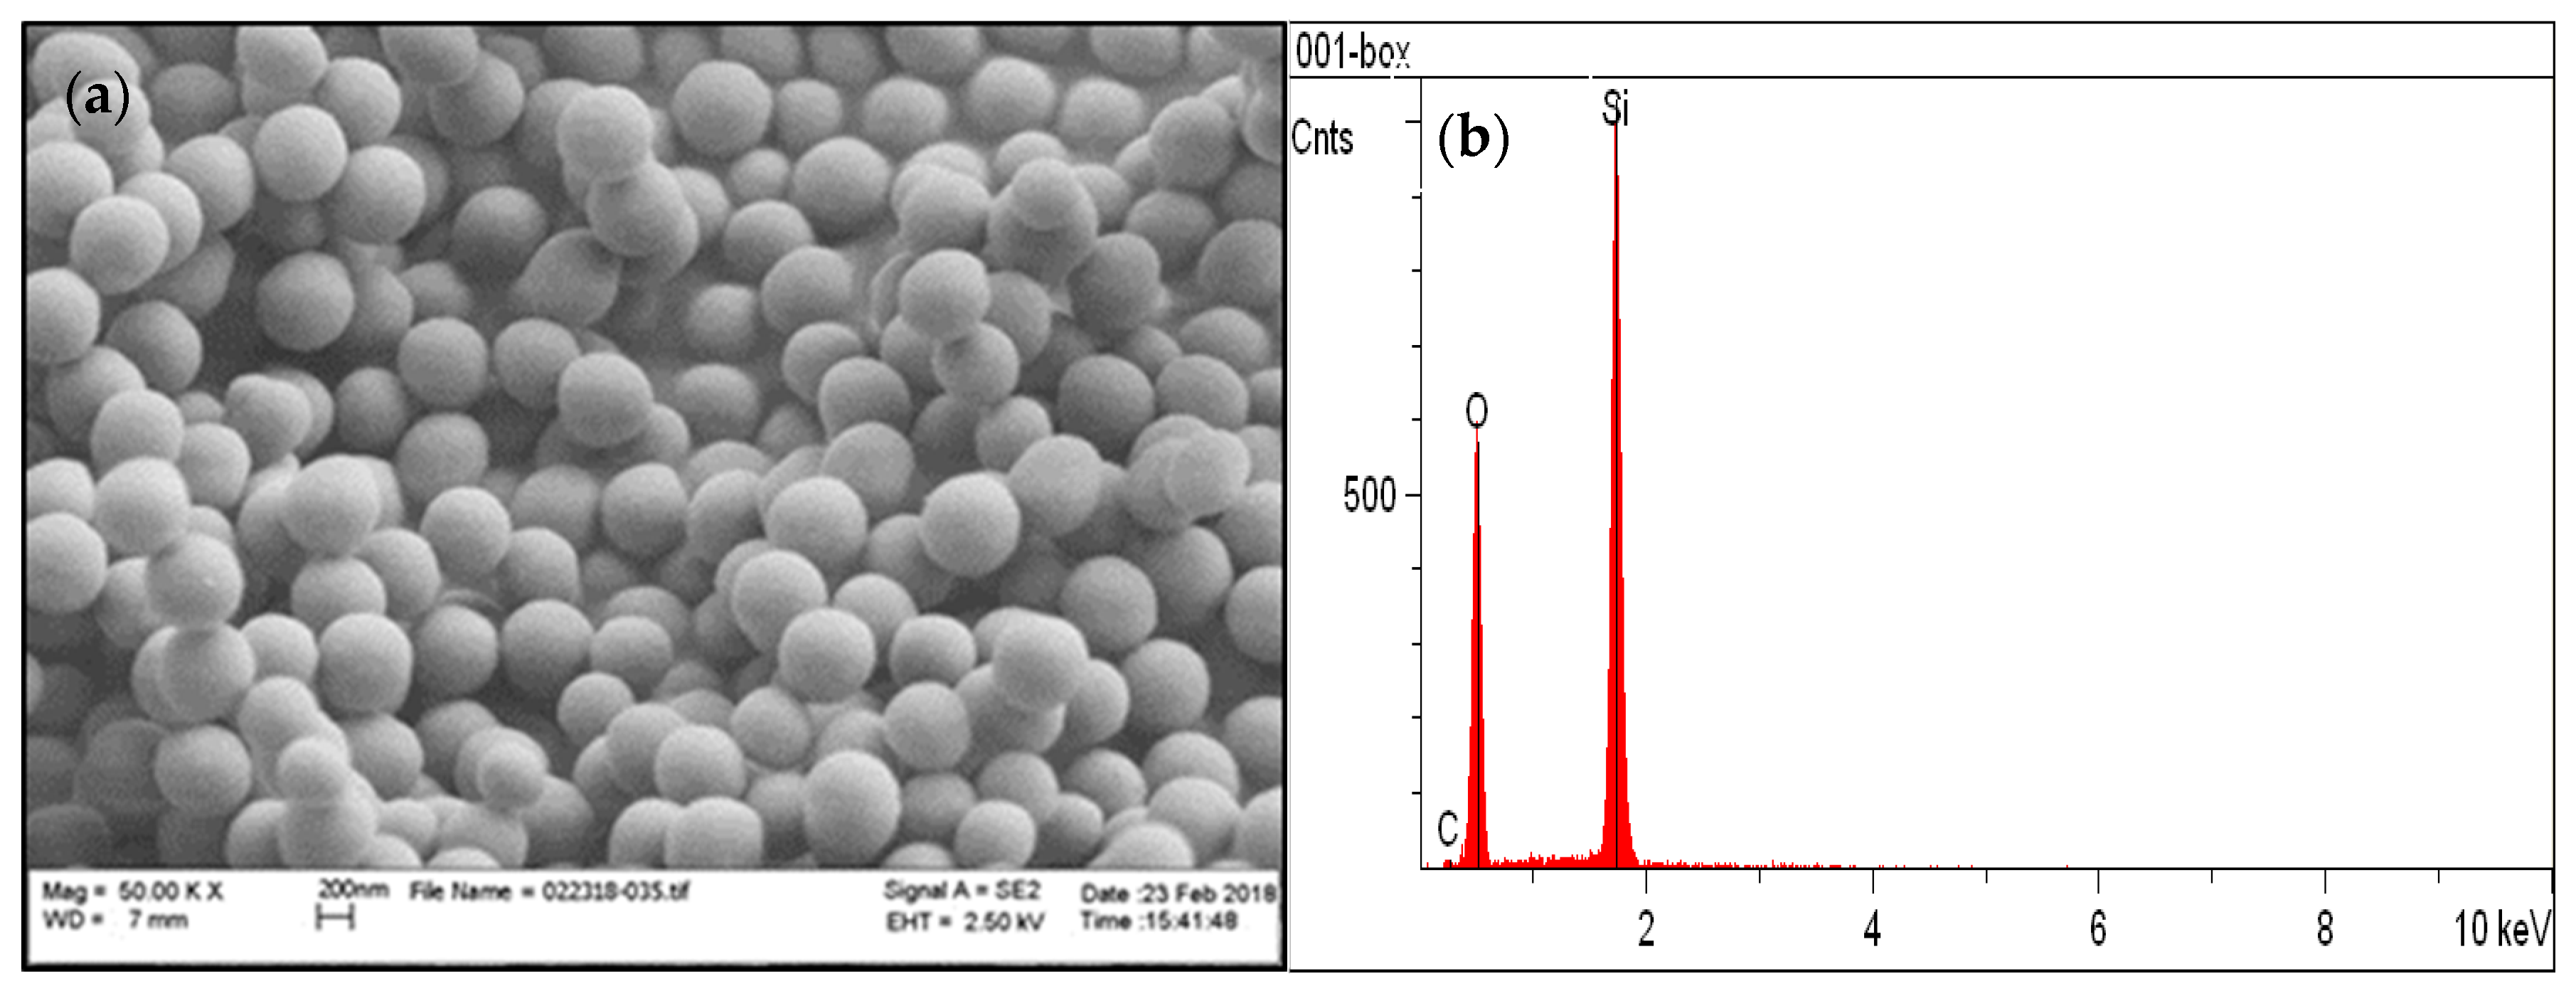
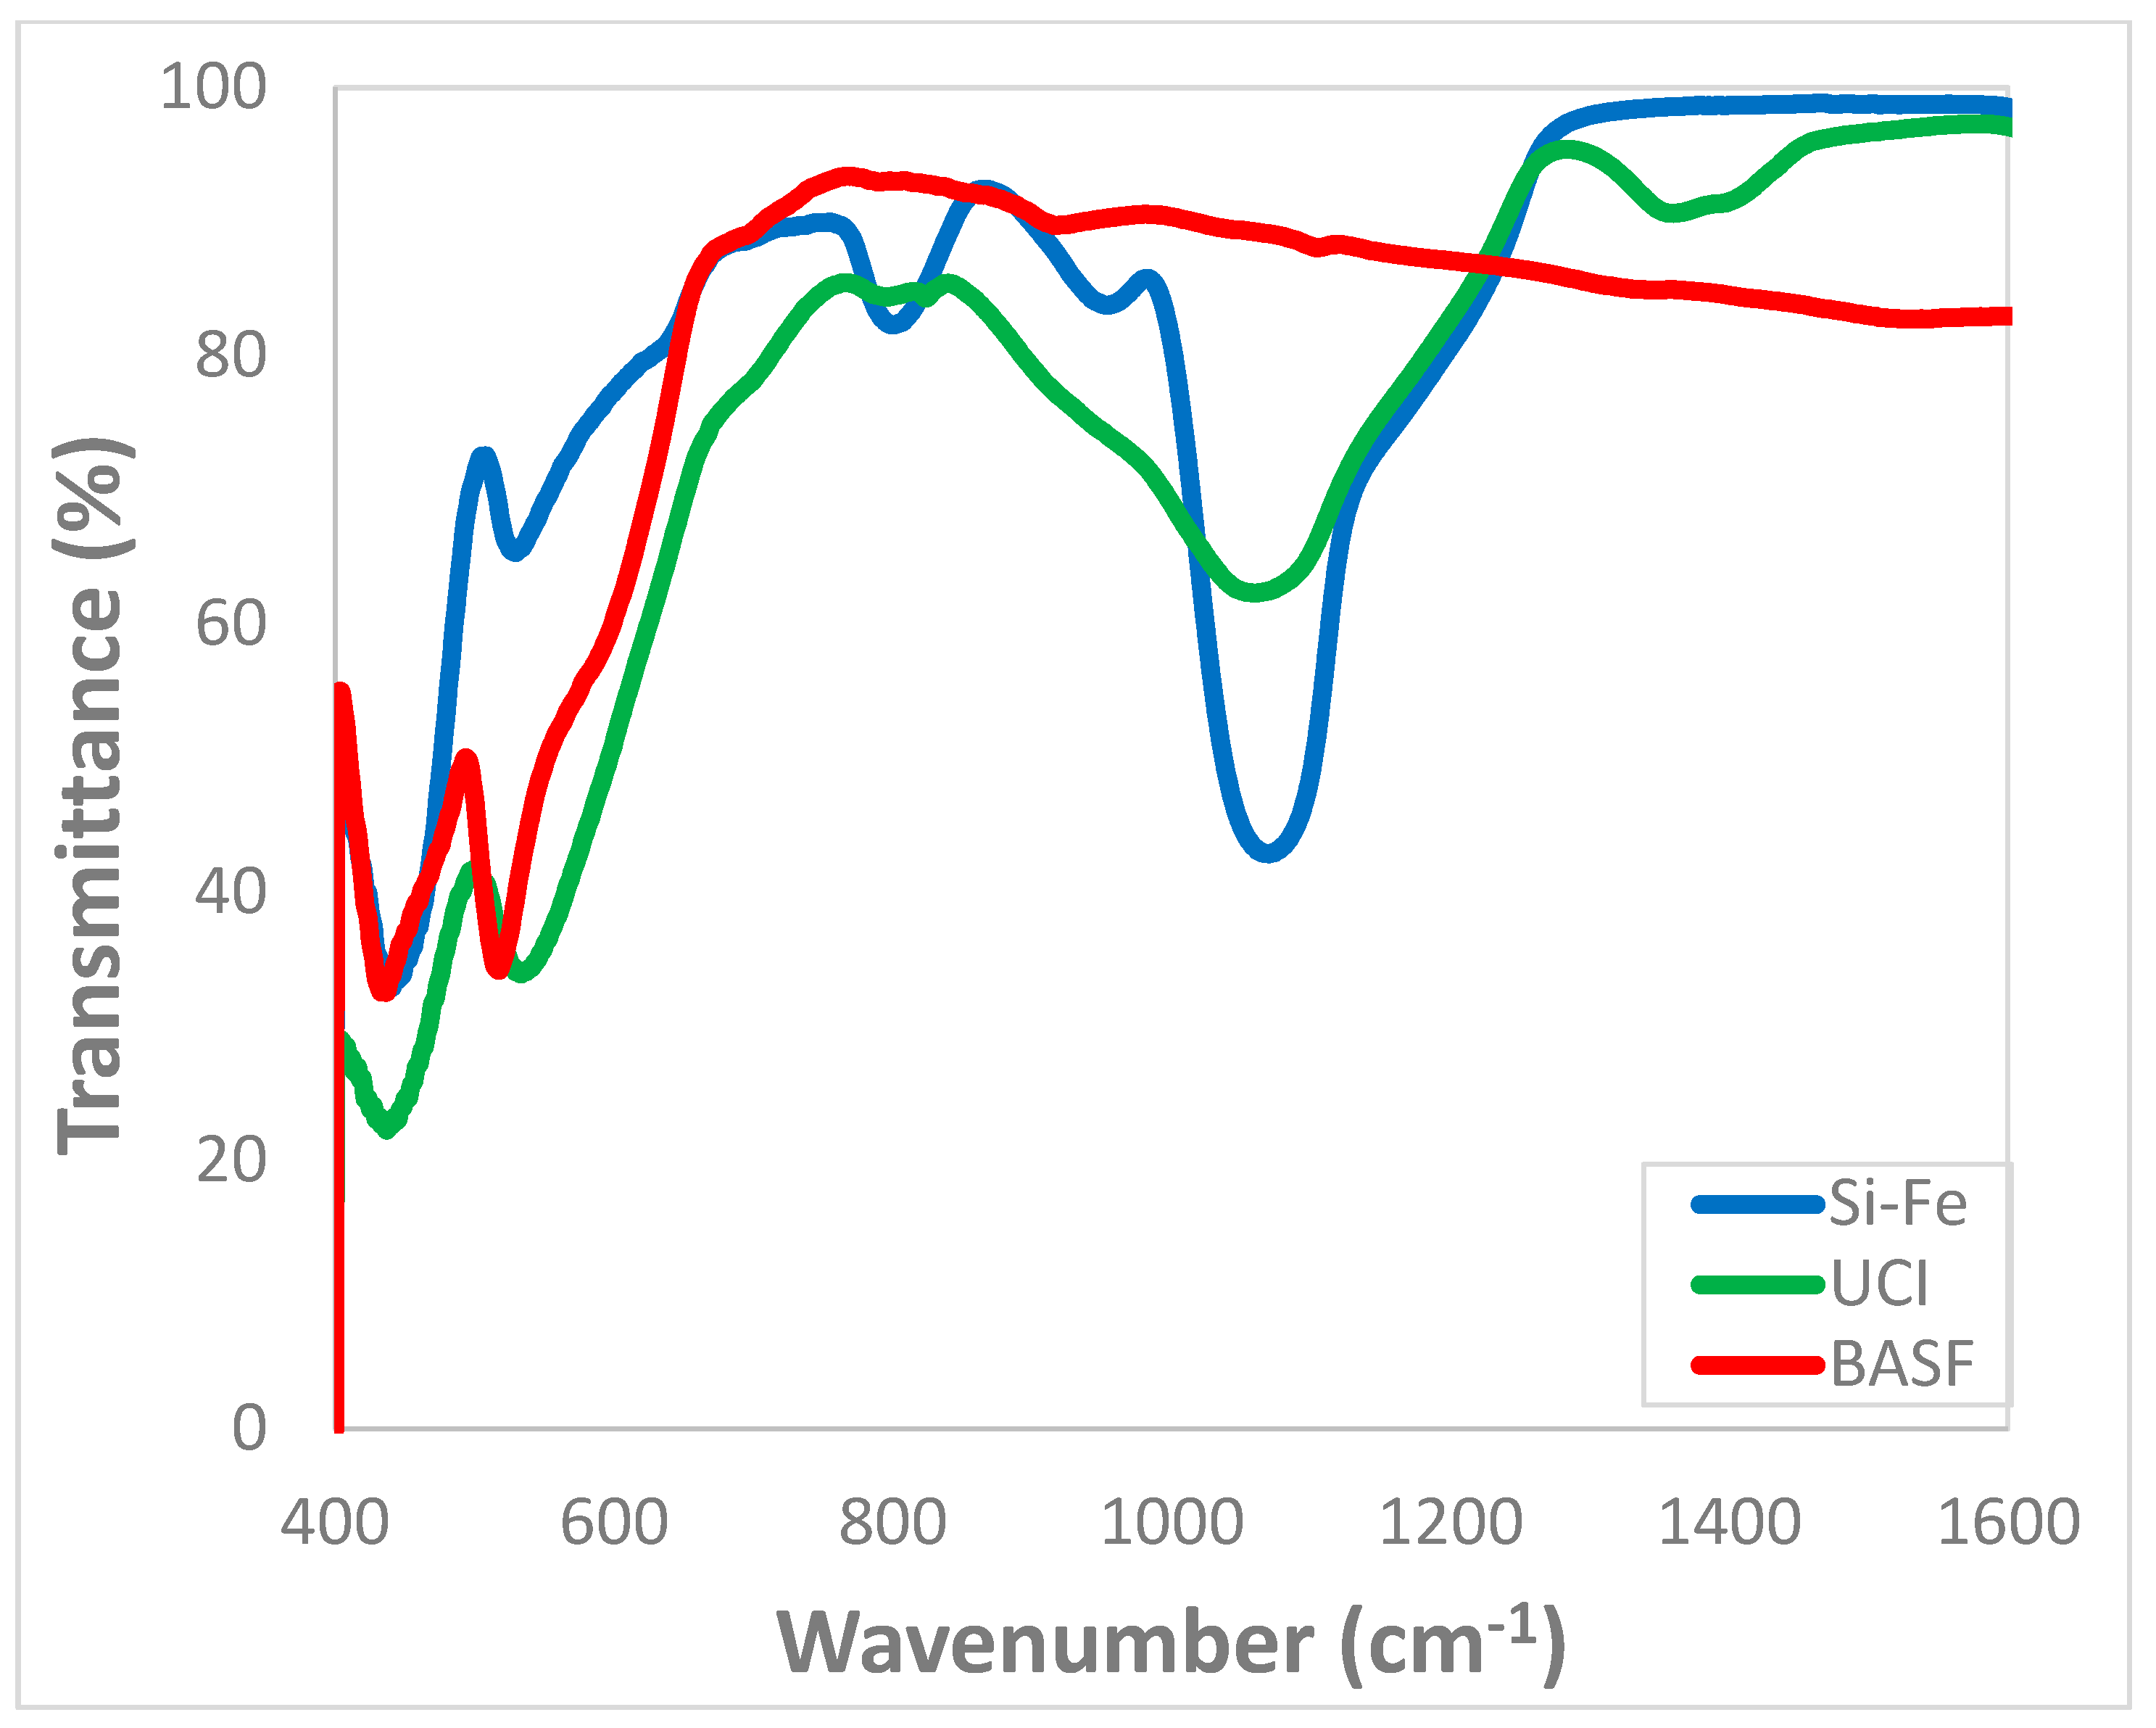
2.4. Characterizations of Silica and Si-Fe Hybrid Catalyst

The characterization of silica nanospheres, the Si-Fe hybrid particles, and the nature of the interactions between the Fe2O3 nanoparticles to the surface of the silica particle support were studied using Scanning Electron Microscopy (SEM) Model LEO Gemini 1550 equipped with Energy-dispersive X-ray spectroscopy (EDS), and Transmission Electron Microscopy (TEM) Model JEOL-1400, 120 kV). TEM samples were prepared by drying a droplet of a freshly prepared sample on a formamide-carbon film 400 × 400 copper grid. Attenuated Total Reflectance (ATR) infrared spectra were recorded with a Nicolet (IS50) FT-IR spectrometer. All spectra were scanned in over the 400–4000 cm−1 spectral range with a resolution of 4 cm−1.

2.5. Study of the F–T Synthesis

Three materials were evaluated for their catalytic activity for the F–T reaction using a 300 mL batch reactor coupled to a Parr 4848 reactor controller. The reactor was loaded with 0.70 g catalyst and 70 mL ethylflo-164 solvent and then purged with syngas (H2/CO = 2, v/v) for 10 min. As a first step, the catalyst was activated by an in situ reduction using two pretreatment methods. (1) Method 1: In the presence of CO at 553 K and at a pressure of 1.45 MPa for 24 h. (2) Method 2: In the presence of syngas at 553 K and at a pressure of 1.45 MPa for 24 h. After reduction, the temperature was lowered to the F–T operating temperature, the reducing gas was replaced with syngas, and the reactor was pressurized to a preset value. The F–T reaction was conducted at three operating temperatures (T), i.e., 493 K, 513 K, and 533 K, and at a pressure (P) of 2.8 MPa with a stirring speed of 500 rpm. After each batch run, the reactor was allowed to cool down to room temperature so that the distribution of components would be equilibrated. Then gas and liquid samples were removed and analyzed by gas chromatographs (GCs). Non-hydrocarbon gases were analyzed on a Gow-Mac model 580 gas chromatograph via three different columns set up in parallel: H2 on a molecular sieve column (8′x1/4″) with N2 carrier gas, CO on a molecular sieve column (8′x1/4″) under He, and CO2 on carboxen-1000 (5′x1/8″), also under He. Analysis of liquid samples for hydrocarbons was achieved using a Perkin Elmer Elite 5MS capillary column on a Perkin-Elmer GC 680 gas chromatograph operating in the FID mode.
For SEM-EDS imaging, liquid samples were taken out of the reactor after each F–T run and centrifuged to obtain a solid that was dried and stored under nitrogen.

3. Results and Discussions

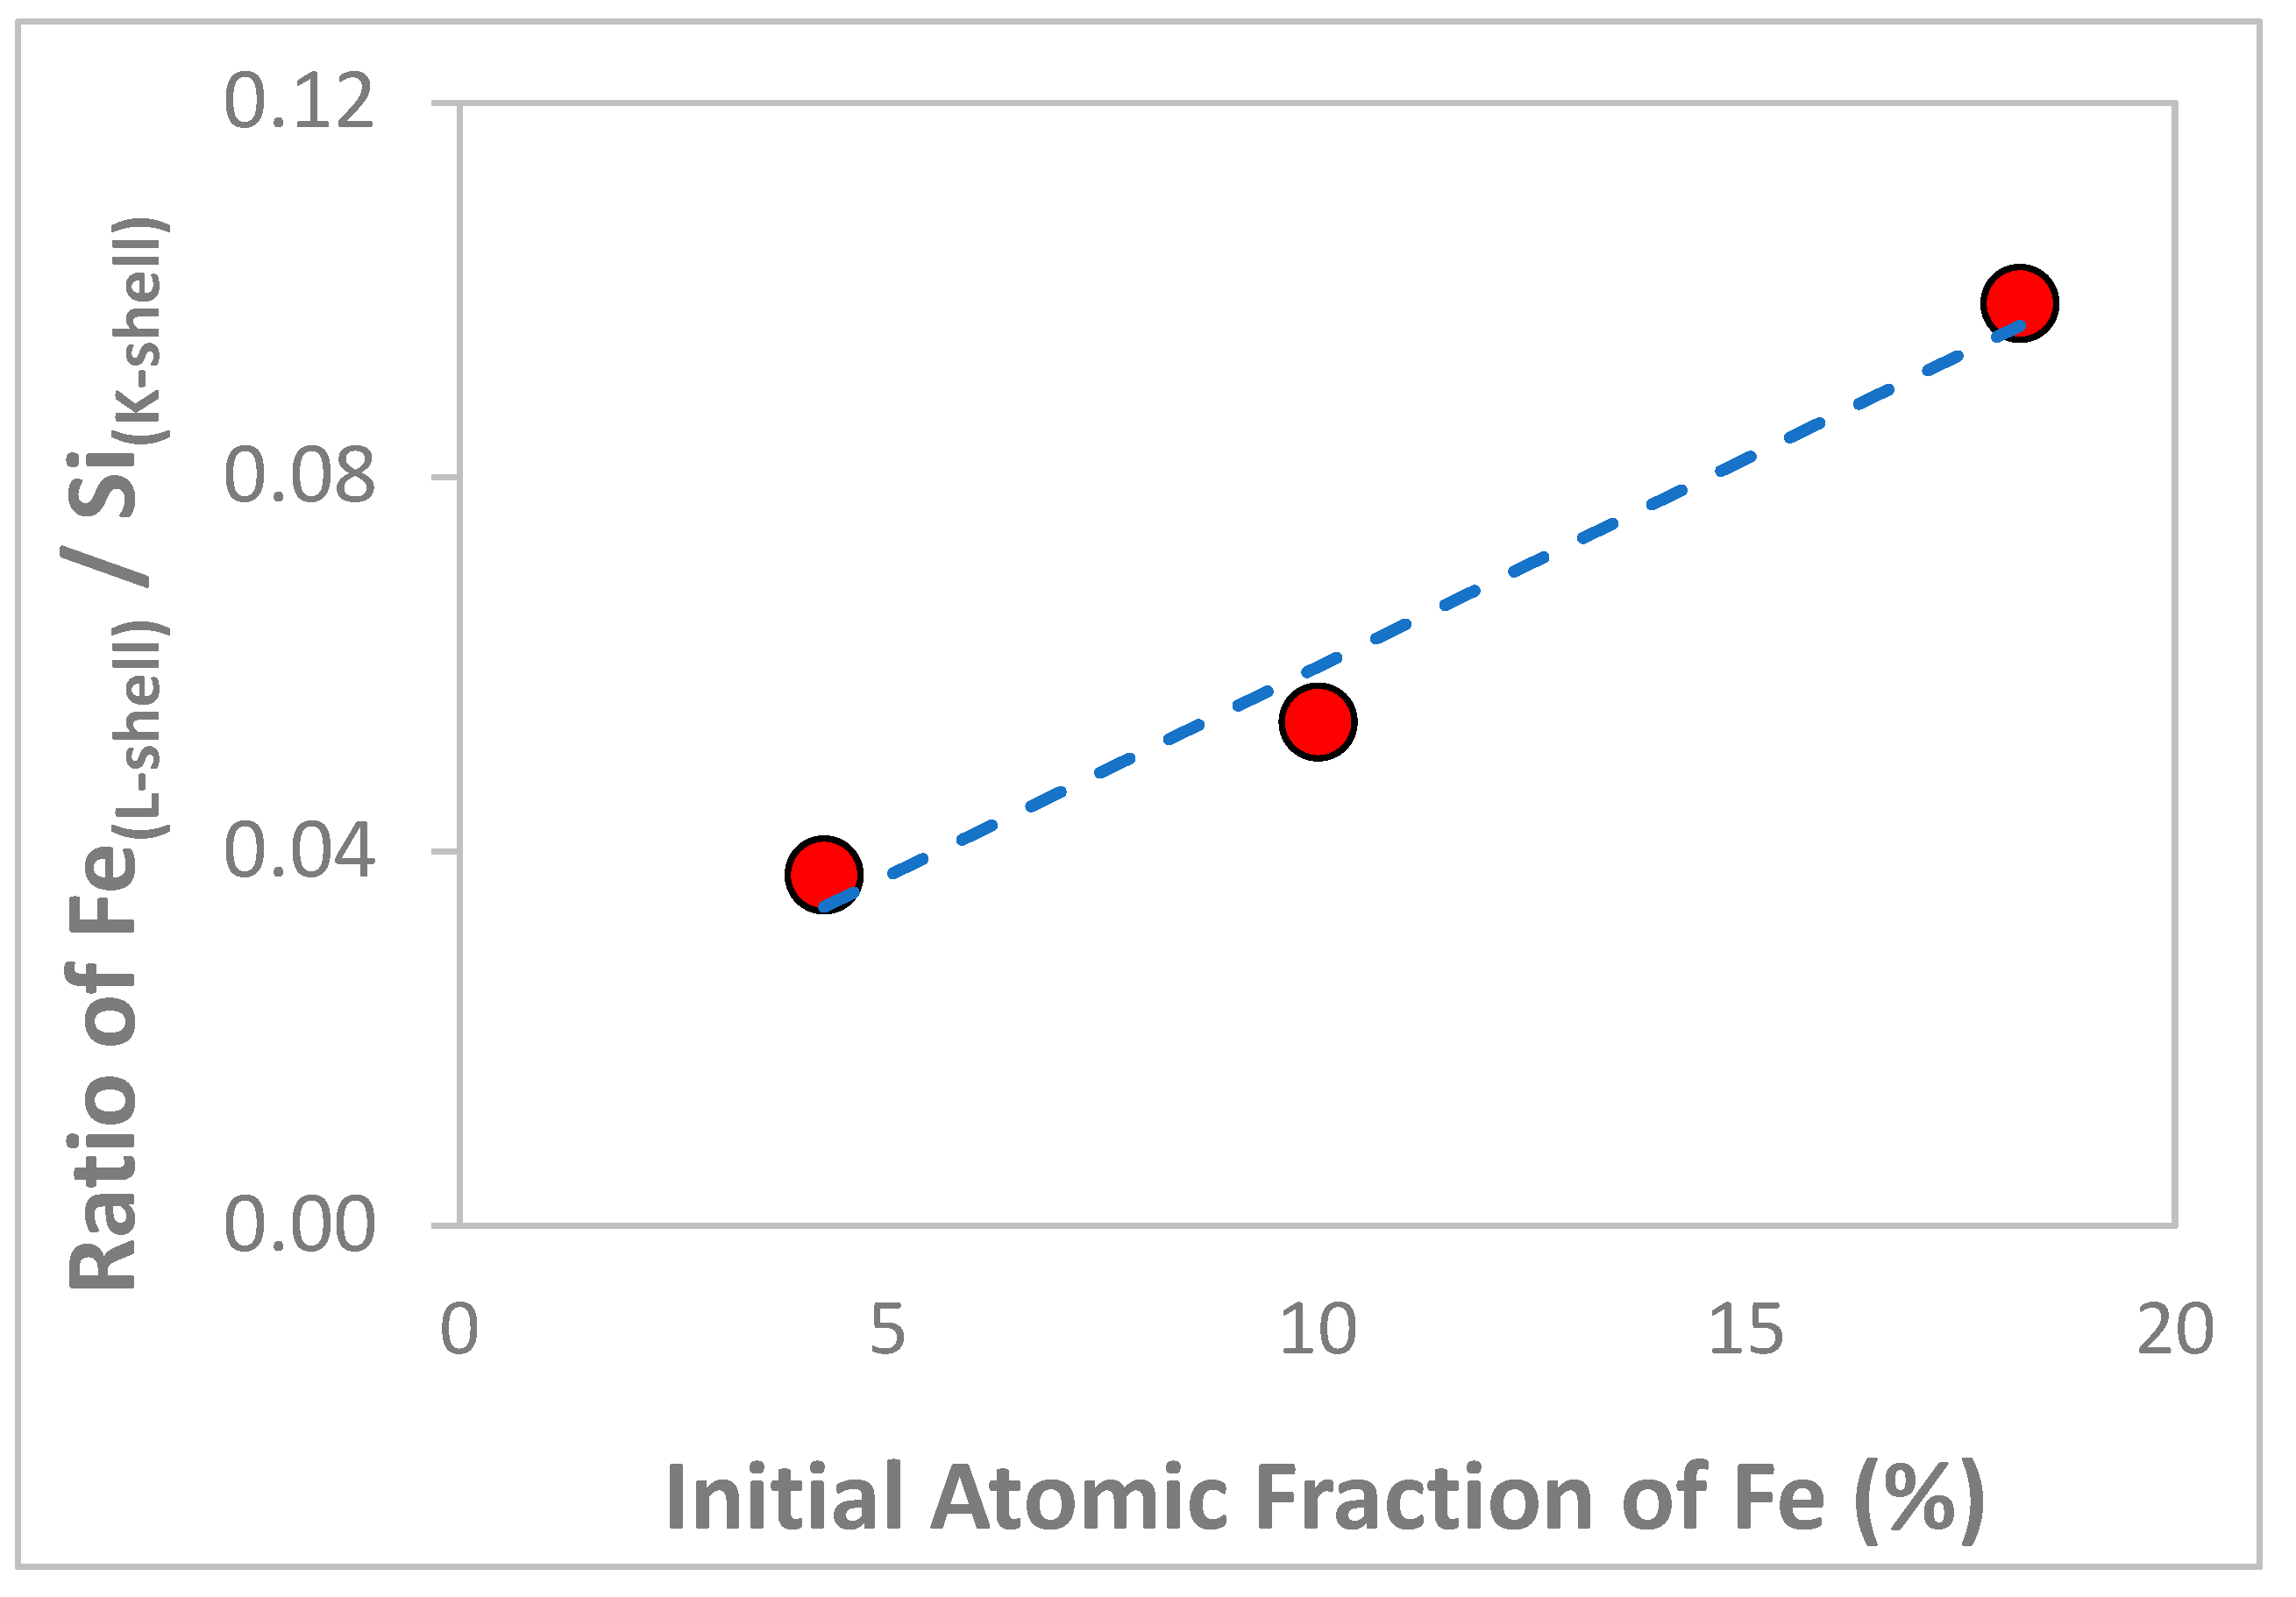
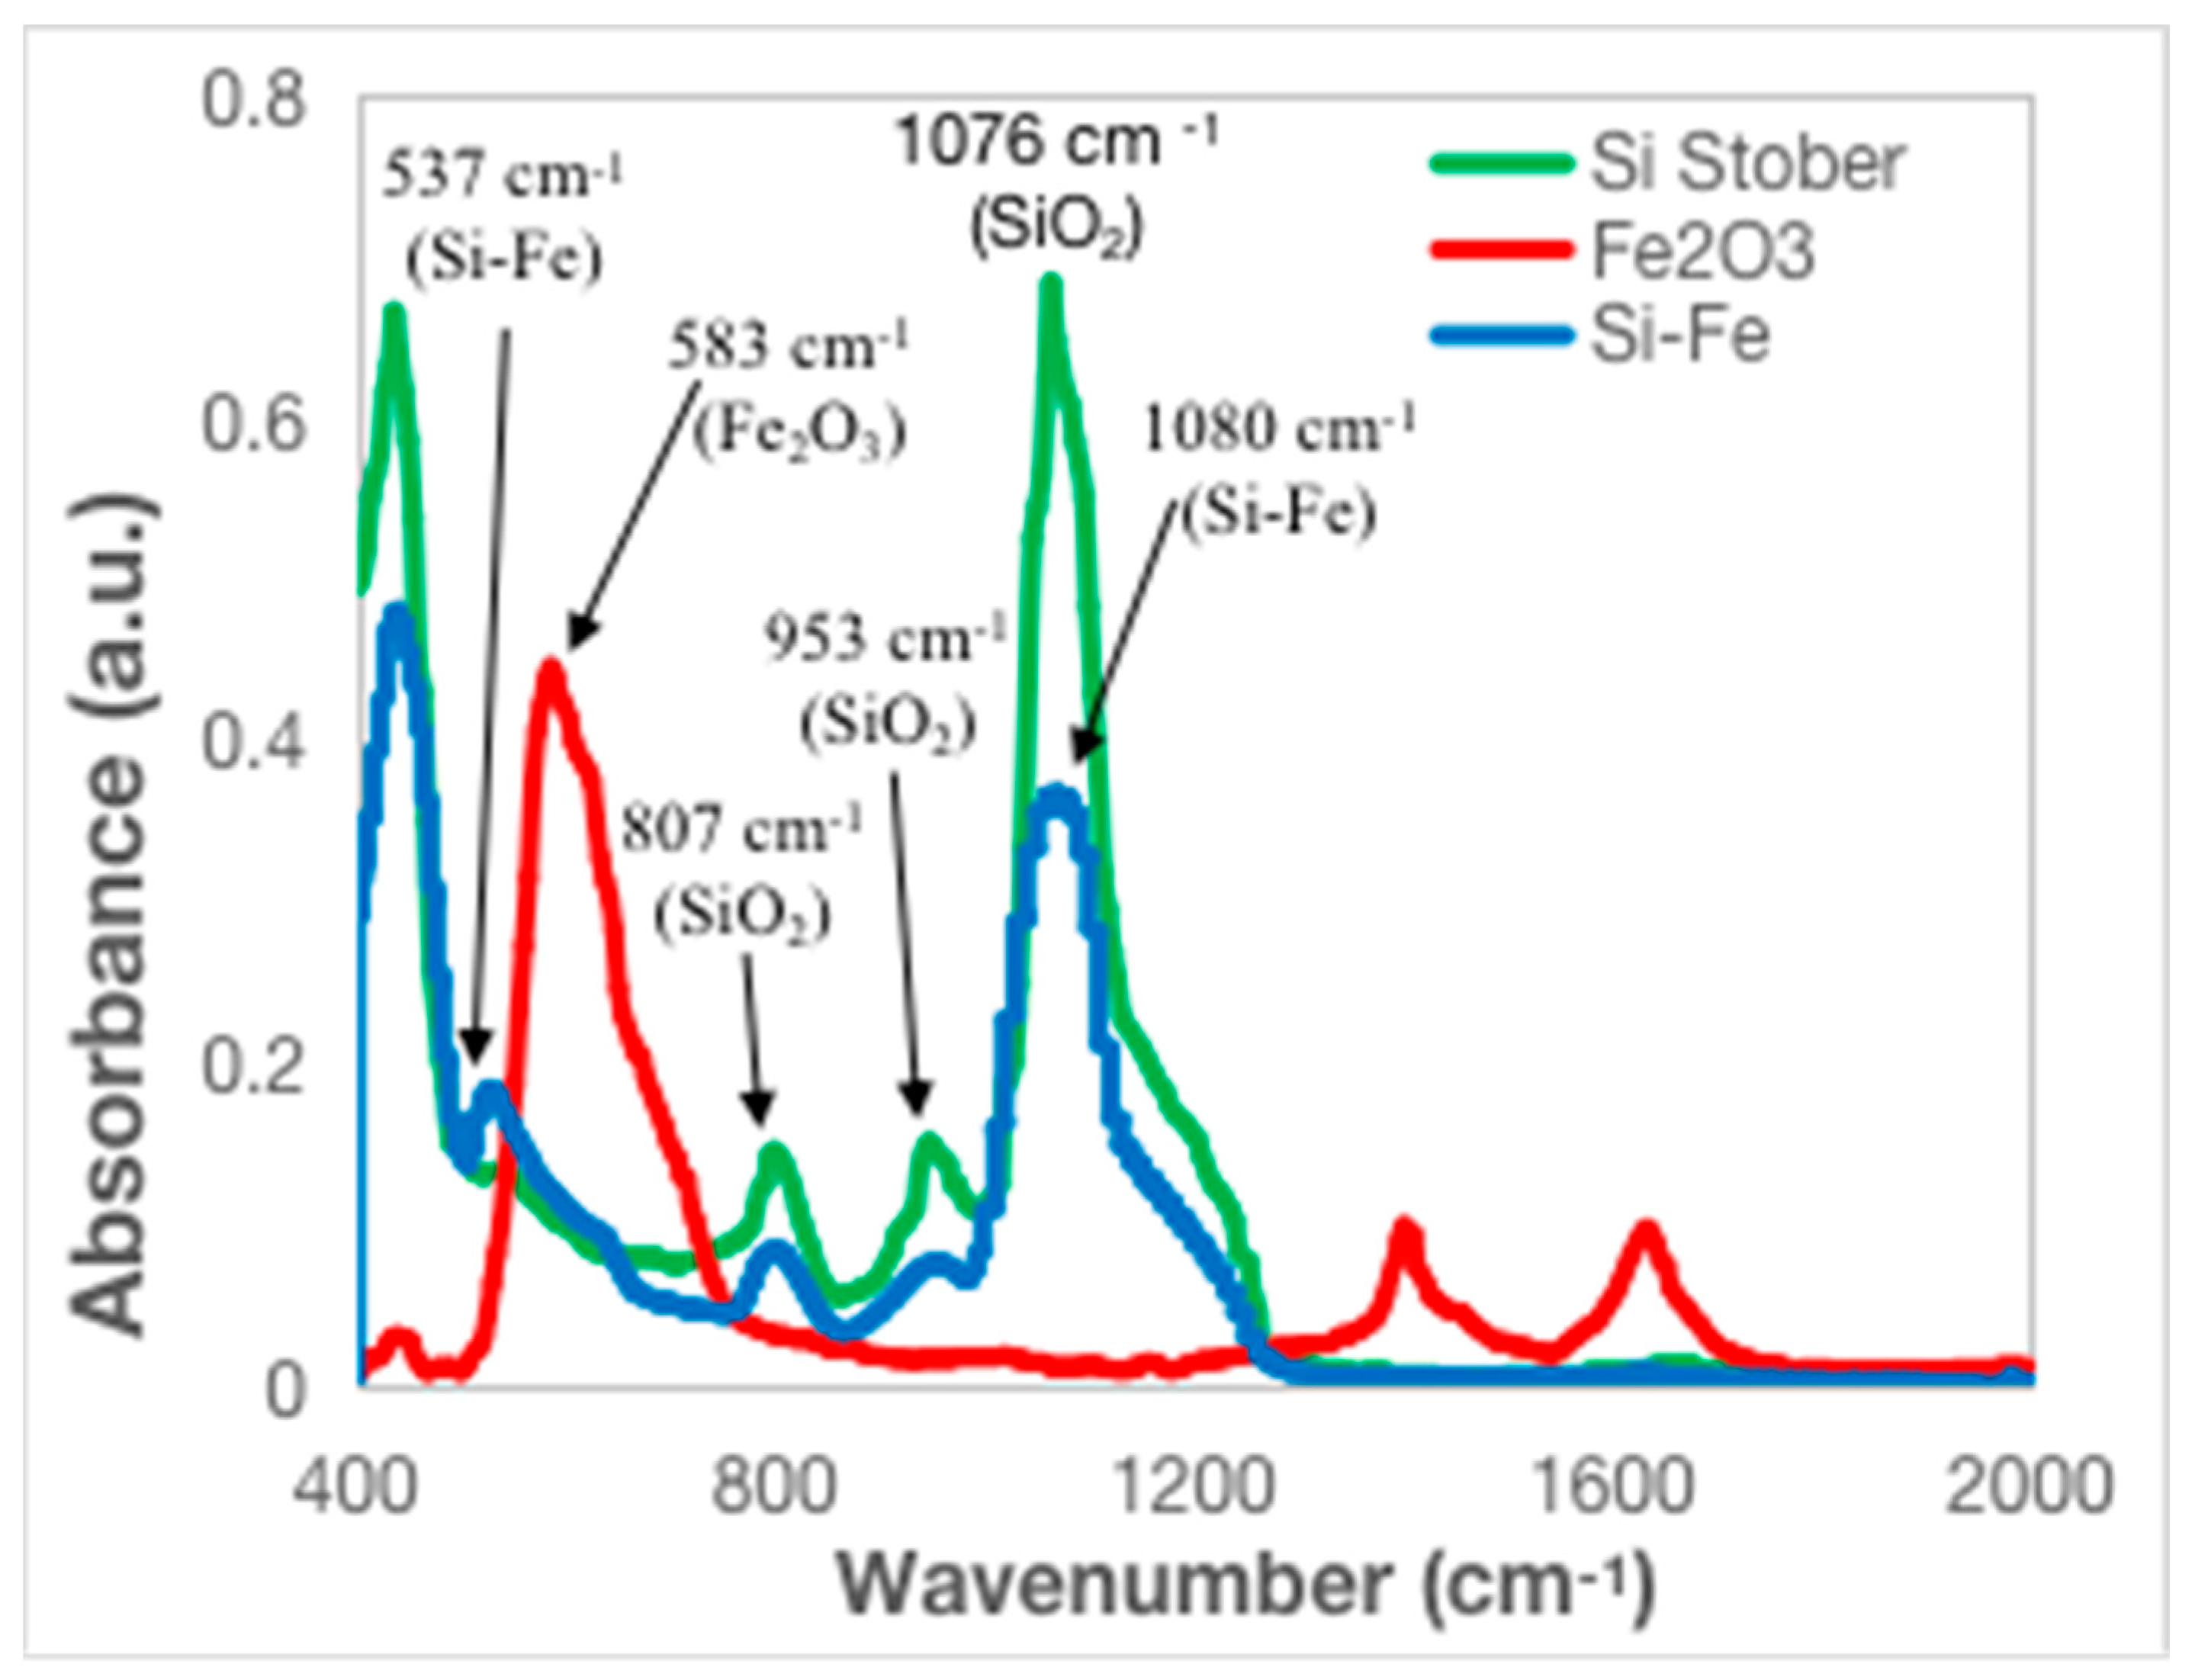
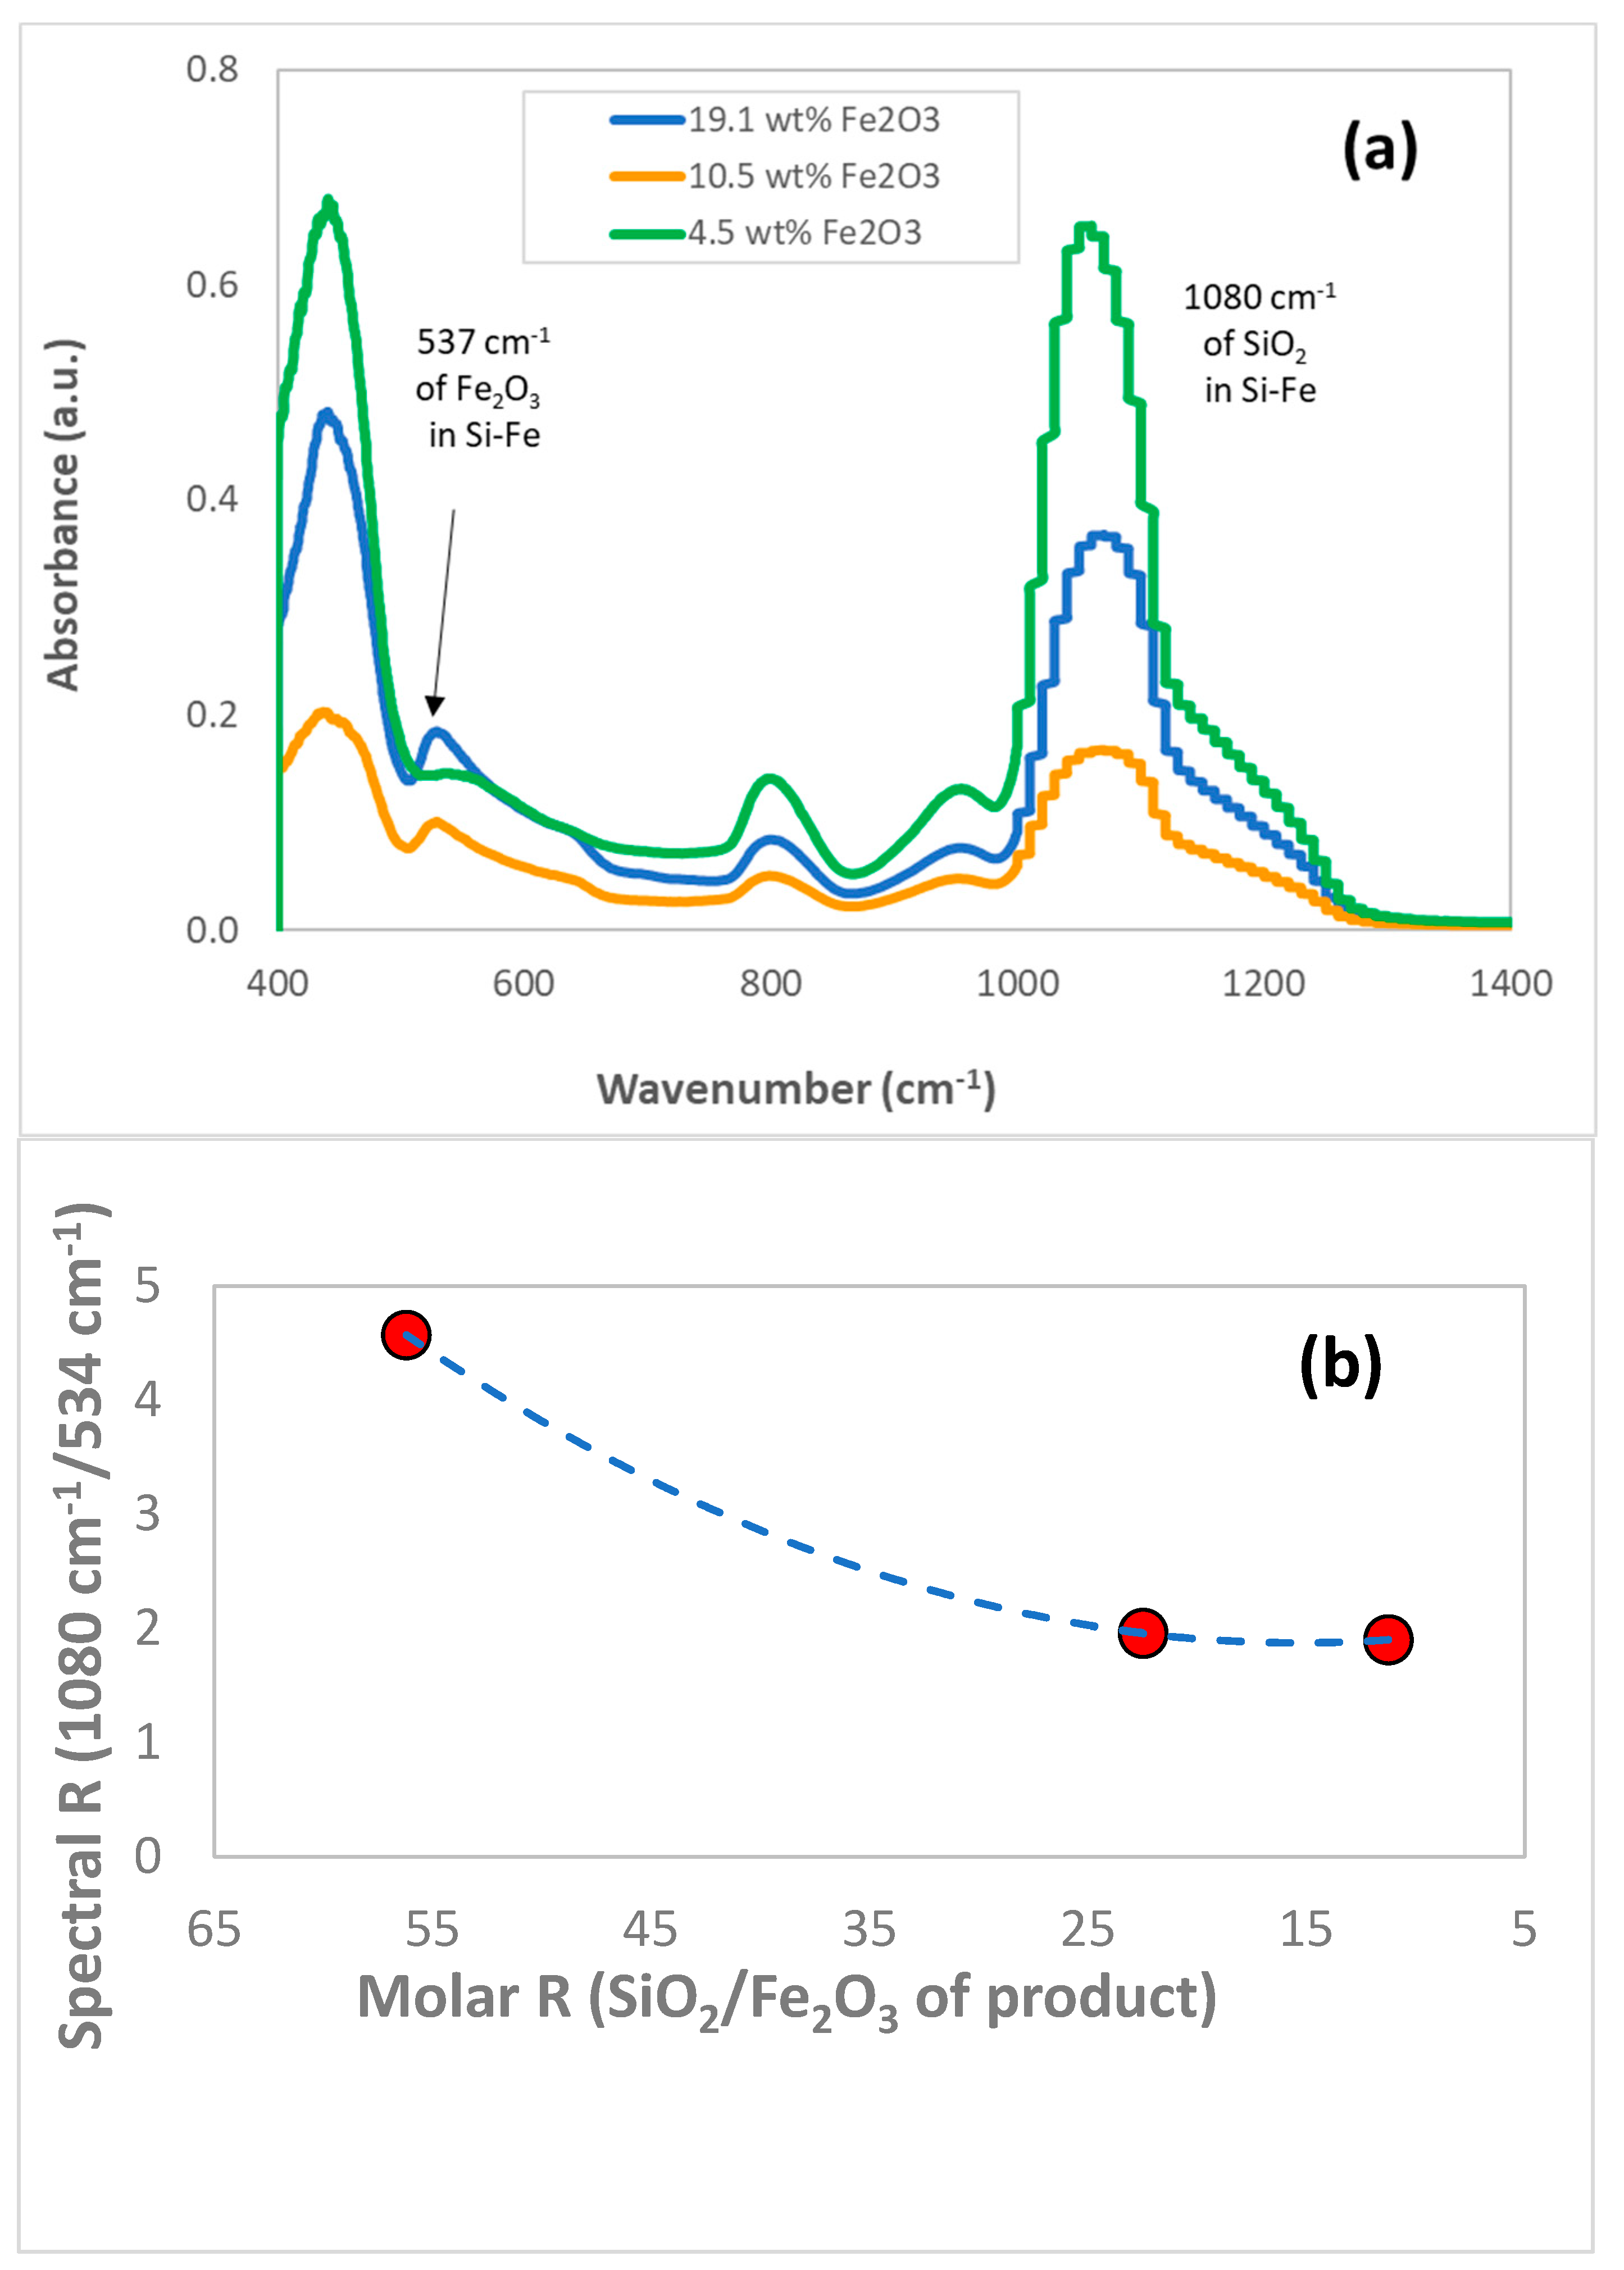
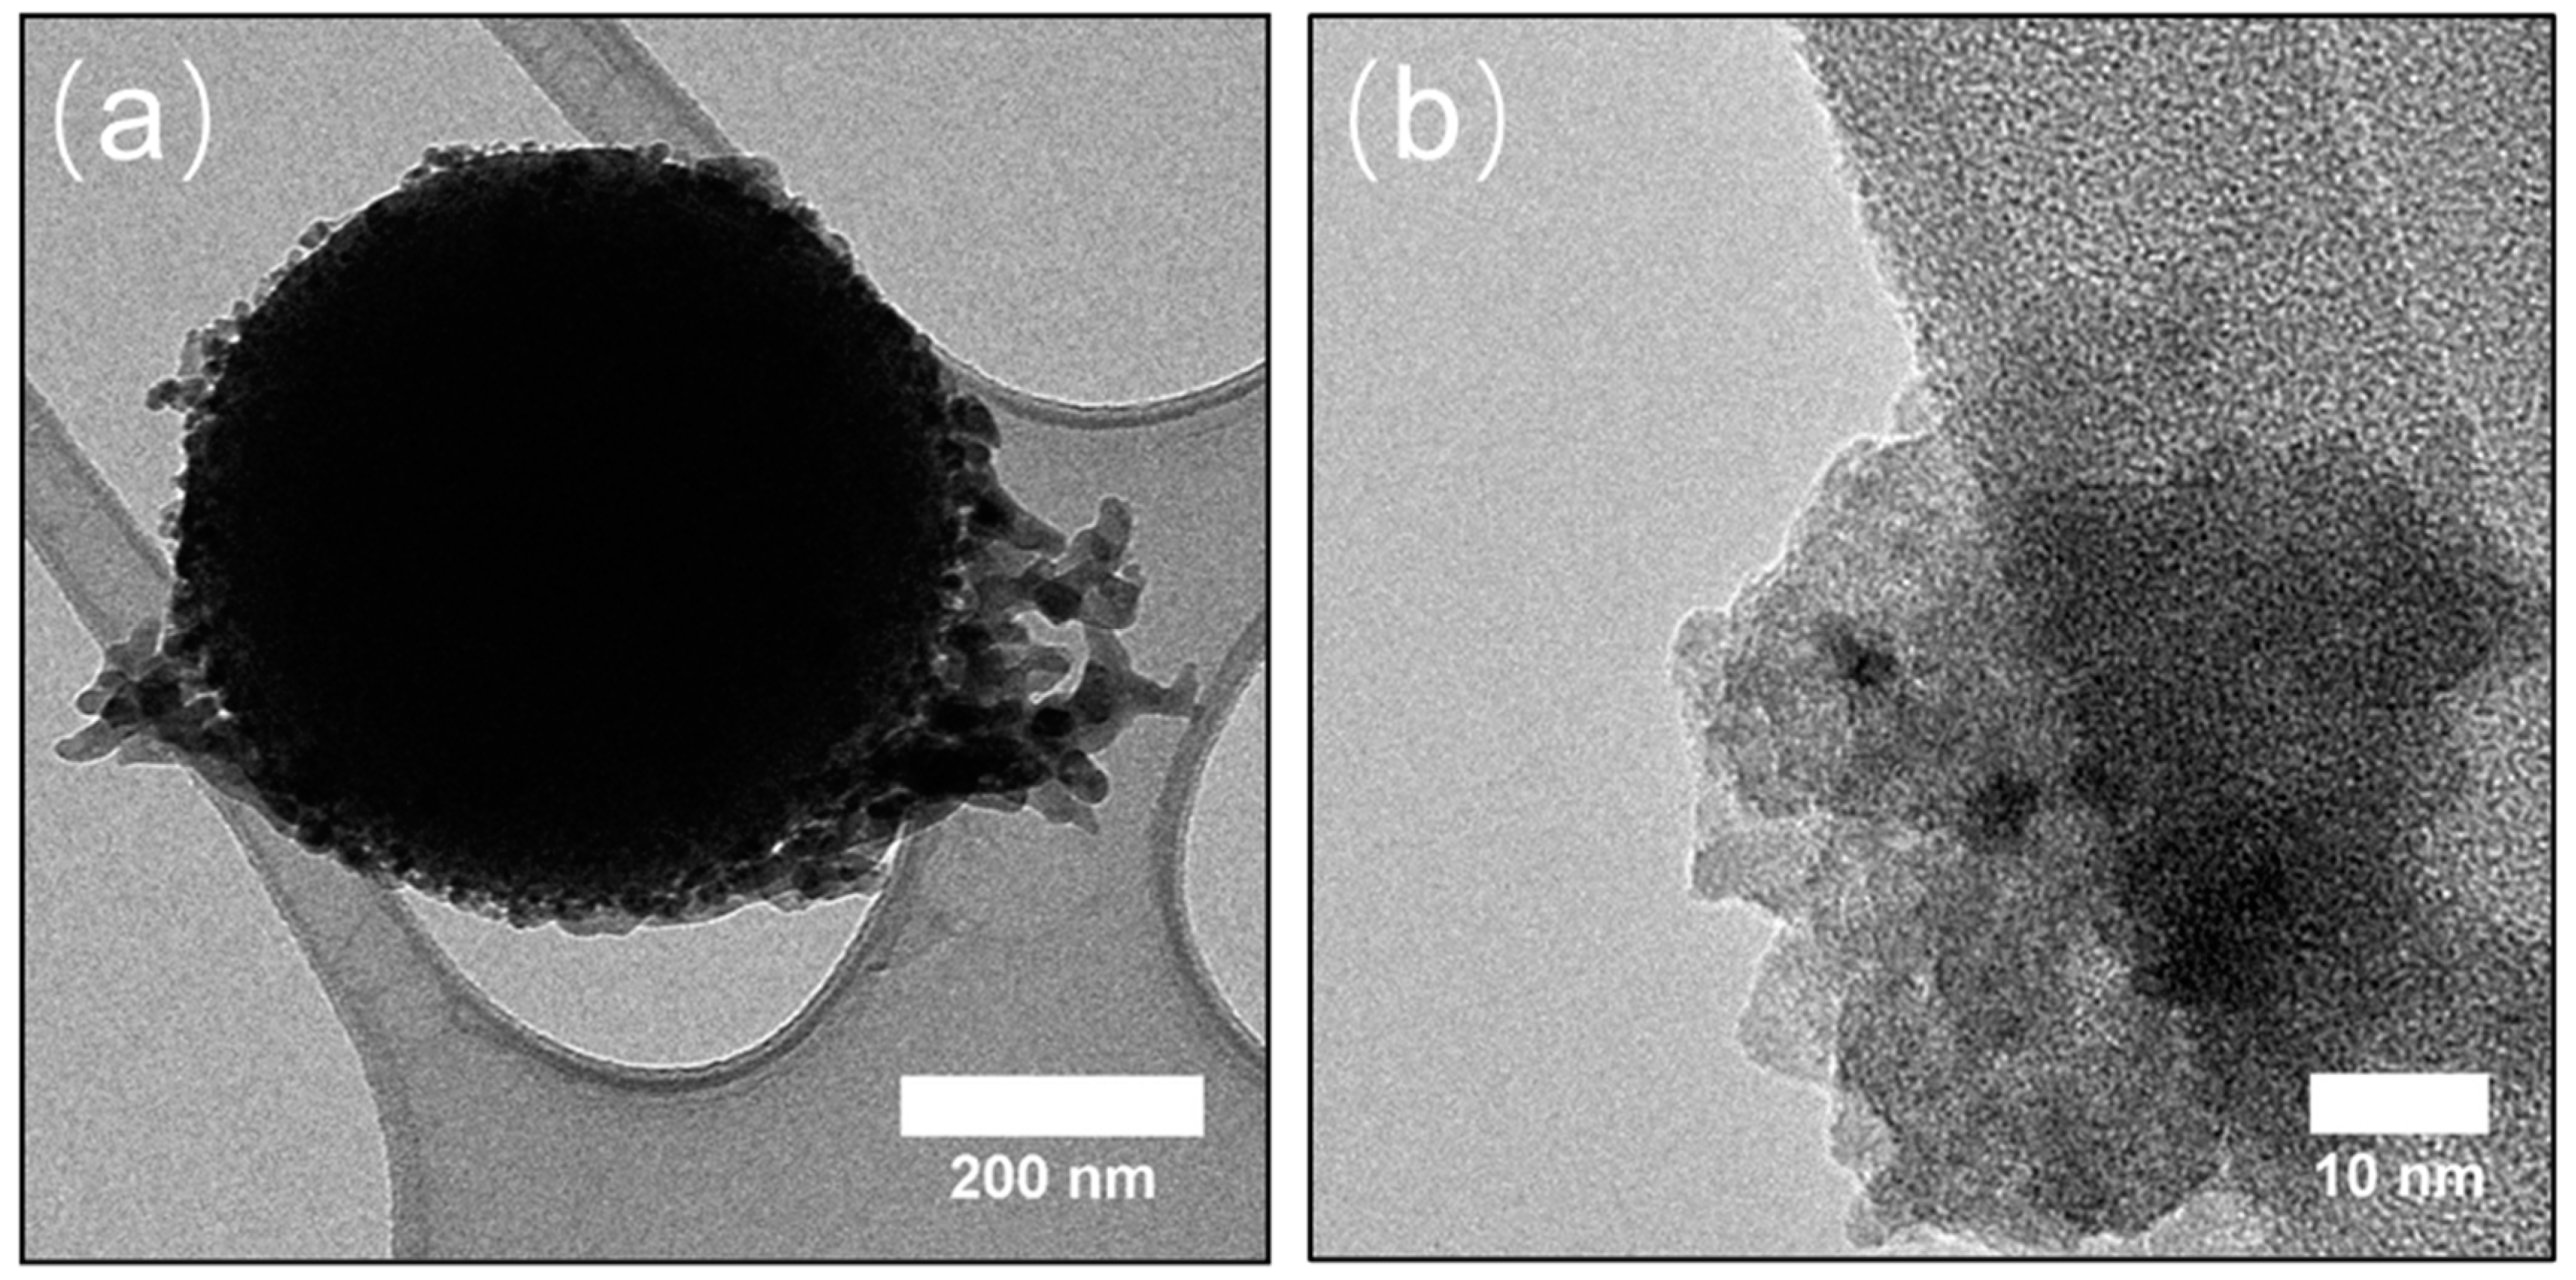
3.1. Chemical and Structural Characterization of the Si-Fe Catalyst

The silica spheres obtained from the Stober process possessed a narrow size distribution with an average diameter of 564 ± 45 nm. The size of silica spheres can be modulated by controlling the rate of monomer addition into the mixed solution [19]. As noted in earlier studies [24,25], the resulting silica surface was rich in hydroxyl groups due to the interaction of the oxide surface groups with the water molecules present in the ambient environment.
The initial nucleation stage of the thermally/chemically induced decomposition reaction of iron pentacarbonyl is governed by several mechanisms. As a first step, iron pentacarbonyl (Fe(CO)5) undergoes a disproportionation reaction in the presence of dimethylformamide (DMF), giving rise to the Fe(II) species with six coordinated DMF molecules [26,27,28] and anionic counterpart species containing iron carbonyl fragments [29,30].
DMF is a neutral Lewis base that donates a pair of electrons to the iron carbonyl molecule and induces the formation of an activated complex by adding the base to the carbonyl group [29,30,31,32]. The iron in complexes with DMF as the Lewis base formed in these reactions are in the formal oxidation states of (+1) and (−1), respectively. The Fe(+1) radical complexes, in which the iron has a d7 configuration, are usually extremely unstable. Hence, in the case of hard Lewis bases such as DMF, the coordination sphere of the carbonyl complex is destabilized, resulting in the substitution with DMF until all coordination sites have been populated, the elimination of CO ligands, and the oxidation of the iron atoms to Fe2+ [29,30]. The result, in this case, is the formation of the [Fe(DMF)6]2+ moiety. Variable amounts of CO gas evolved during the reaction, depending on the molar ratios of the Fe(CO)5 and DMF, which also impact the nature of the anionic iron carbonyl fragment. Given the presence of these reactive disproportionation ionic products, a possible mechanism may involve the attraction of the partially-negative oxygen bridges on the surface monolayer of the silica nanospheres Si δ +   O δ Si δ + and to the positively charged Fe(II) fragments, constituting the nucleating centers and anchoring points for the formation of iron oxides nanoparticles. Alternatively, nucleophilic nucleation sites may result from the polar O δ H δ + groups on the surface of the silica nanospheres [25,33,34,35], and the reaction would then propagate similarly to a sol-gel process, and upon calcination at 773 K, the nucleated iron moieties on the surface of silica nanospheres would be oxidized to Fe2O3. Another mechanism of nucleation may be attributed to the stepwise decarbonylation of Fe(CO)5, generating a cascade of iron carbonyl clusters with an increasing Fe/CO ratio, resulting in Fe clusters that are further oxidized to Fe2O3 [36,37]. However, the mechanism governing the sono-induced production of Fe nanoparticles is simpler. Suslick et al. [38] reported that the sonolysis of Fe(CO)5 in decalin resulted in the formation of a mixture of dodecacarbonyl triiron and iron metal. The reaction yielded a first-order rate constant of k = 13.4 × 10⁻⁴ s−1 at 294 K. The mechanism to explain the formation of the observed mixture of products involved an initial dissociation of a CO ligand, followed by secondary reactions with Fe(CO)5 to yield Fe3(CO)12 and Fe, having Fe(CO)3 and Fe(CO)4/Fe2(CO)8 species as intermediates.
The morphologies of the SiO2 nanoparticles and the Fe2O3-decorated SiO2 nanostructures are depicted in the scanning transmission electron microscopy (SEM) images shown in Figure 1. The bare SiO2 nanoparticles (Figure 1a), together with the corresponding energy dispersive x-ray spectroscopic measurements (EDX) of the sample (Figure 1b), show a pristine surface composed of Si and O atoms. The silica spheres were used to support the sonolysis-driven decomposition and deposition of iron catalyst onto their surface. The concentration of the precursor Fe(CO)5 was varied to investigate the impact of iron concentration on the final Si-Fe structure and how the Si-Fe structure evolved by increasing the concentration of the iron precursor. Table 1 shows the various reaction compositions and the calculated weight and molar ratio between the SiO2 support and Fe(CO)5 precursor.
The morphology of the Si-Fe catalysts with silica/iron precursor molar ratios of 22.49, 8.99, and 4.50, accompanied by the corresponding EDX spectra, are shown in Figure 1b–g.
The SEM data show that with increasing concentration of the iron precursor, a larger amount of iron oxide nanoclusters was formed, and most of it was deposited onto silica spheres. The average size of iron oxide clusters depicted in Figure 1c,e,g was 54 ± 20 nm, and the observed aggregates were as large as ~200 nm. The associated EDX spectra show an overall correlation between the intensities of the Fe peaks at ~0.7 and ~6.5 keV with the initial precursor concentration, as shown in Figure 1d,f,h. The peak at ~0.7 keV, corresponding to the L-shell of the iron atoms, while of lower intensity than that of the peak at ~6.5 keV, corresponding to the K-shell of the iron atom, seems to be a better indicator of the iron concentration [39,40]. Figure 2 shows a semi-quantitative analysis of the EDX peaks in which the ratios of the L-shell band of Fe at ~0.7 keV and the K-shell band of Si at ~1.7 keV were plotted as a function of the initial atomic fraction of Fe in the reaction mixture. Given that the Si-Fe composite product was collected after extensive washing and centrifugation to remove unreacted and un-anchored species, this increased presence of iron as iron oxide nanoparticles on the surface of silica nanoparticles as a function of precursor concentration indicates that the sonolysis of Fe(CO)5 has indeed occurred on the surface of the silica nanospheres. Hence, the latter acted as a support for nucleation and growth processes.
Additional support for the role of SiO2 nanospheres in the nucleation and growth of Fe2O3 nanoparticles can be inferred from the Fourier-transform infrared (FTIR) analysis of one of the synthesized Si-Fe catalyst samples, as compared to the SiO2 nanospheres and unsupported Fe2O3 nanoparticles, shown in Figure 3.
The infrared spectrum of silica nanospheres synthesized by the Stober process exhibited characteristic absorption bands at 1076 cm−1 and 953 cm−1 corresponding to the asymmetric stretching of Si–O–Si and Si–O(H)–Si groups, respectively, at 807 cm−1 corresponding to the symmetric stretching of Si–O–Si, and at 437 cm−1 corresponding to the bending mode vibrations of O–Si–O [26,27]. The infrared spectrum of the reference Fe2O3 nanoparticles exhibited characteristic absorption bands at 443 cm−1 and 583 cm−1, corresponding to the cooperative vibrational stretching modes of the Fe–O and Fe=O molecular fragments [41,42]. Finally, the infrared spectrum of the Si-Fe complex nanostructure (having an initial 18.19% atomic Fe fraction) exhibited a characteristic and significant red shift of the 581 cm−1 to 534 cm−1, most likely due to the restricted mobility of the Fe2O3 molecules that are anchored on the surface of the silica nanospheres coupled with a possible Fe–O–Si bond [38]. Due to the specificity of the band at 534 cm−1 to the Si-Fe complexes, and the fact that the 1080 cm−1 silica band remained unchanged, it was possible to use the latter as an internal standard and correlate the ratio of these two bands with the concentration of the Fe moiety expressed as molar ratios of SiO2 and Fe2O3 in the final complex nanostructure, assuming that the yield of Fe(CO)5 sonochemical decomposition to Fe2O3 was about 80% [43], as summarized in Table 2 and shown in Figure 4.
As shown in Figure 3, the atomic fraction of iron in the Si-Fe complex nanostructures was calculated to be 4.25%, 10.01%, and 18.19%, corresponding to the initial reactant mixtures with SiO2/Fe(CO)5 weight ratios of 6.90, 2.75, and 1.38, respectively. The transmission electron microscopy (TEM) image of the Si-Fe catalyst (with an initial concentration of 18.19% Fe atomic fraction) is shown in Figure 5. The SiO2 nanosphere is observed to possess a “corona” comprised of the small Fe2O3 nanoparticles, seen in Figure 5a, while the adherence of the iron oxide nanoparticles onto the surface of the silica nanospheres can be seen in Figure 5b. It is also obvious in both the SEM (Figure 1g) and TEM images that at these higher reactant concentrations, the iron oxide clusters undergo some aggregation on the silica nanospheres that can generate clusters as large as 200 nm.

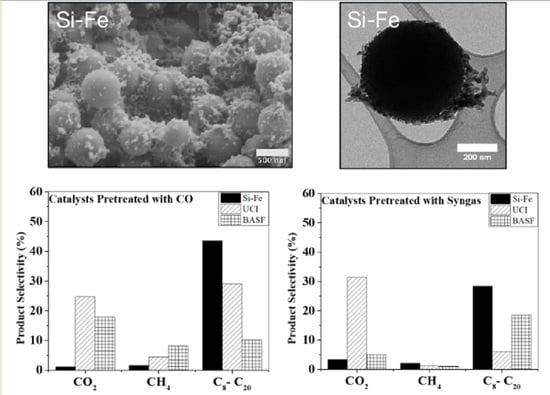
3.2. Comparison of F–T Synthesis Products

The Si-Fe complex nanoparticles system containing a 4.25% atomic fraction of Fe (corresponding to 4.5 wt.% of Fe2O3 in the system) was selected for the F–T synthesis reaction, mainly because in this “dilute” system, most of the Fe2O3 nanoparticles were distributed evenly on the surface of the SiO2 nanospheres, with little or no aggregation, as seen in Figure 1c. The catalytic performance of the Si-Fe system was compared to that of several commercial catalysts (UCI and BASF), consisting of iron oxide supported on silica microspheres and unsupported iron oxide nanoparticles, respectively. All three catalyst precursors were pretreated and activated with either CO or syngas for 24 h and then loaded into a batch reactor to assess the effect of temperature on the F–T process. Note that though the amount of catalyst added in each experiment was the same, i.e., 0.70 g, the fraction of the iron oxide moiety was different for the three different catalysts.
Following catalyst reduction with CO or syngas [44], the F–T reaction was conducted in a 300 mL Parr batch reactor at three preset temperatures (493 K, 513 K, and 533 K) and pressure (2850 kPa) for 24 h. A typical F–T reaction involves the hydrogenation of CO to produce a mixture of hydrocarbons and some oxygenates as by-products [45,46,47]. The iron catalyst also produces carbon dioxide (CO2) due to the Water-Gas Shift (WGS) reaction [48].
The F–T process generates two different products depending on the reaction temperatures. At low temperatures, as in this work, i.e., 473–553 K, larger hydrocarbon molecules are produced with n ≥ 5, while at higher temperatures, i.e., 573–623 K, lower olefins and liquid hydrocarbons are more prevalent. The formation of methane, CH4 (n = 1), is undesirable. At low concentrations of H2, i.e., H2/CO < 2, and in the presence of iron catalysts, the WGS reaction becomes an important source of hydrogen, however, at the expense of the undesired formation of CO2 [45,46,47,48]. The extent of CO conversion, the associated hydrocarbon product distribution, and CO2 selectivity for all three catalysts that were activated by CO or by syngas prior to their utilization in the reaction are summarized in Table 3 and Table 4.
The CO conversion in the F–T reaction with CO-reduced catalysts, shown in Table 3, exhibits the order of UCI > BASF > Si-Fe at all three working temperatures. The discrepancy between the conversion of CO and the conversion of H2 in the H2/CO syngas mixture, particularly for the system catalyzed by the UCI catalysts and to a lesser extent by the BASF catalyst, implies that CO may have been consumed by a side reaction such as the WGS reaction or possibly the Boudouard reaction (2CO → CO2 + C), generating CO2 instead of the desired CnH2n+2 product [45,46,47,48]. These observations are consistent with the higher fraction of CO2 formed for these two systems compared with the synthesized Si-Fe catalyst system, in which the fraction of CO2 formed is very small. Hence, the selectivity of the process for the formation of the C8–C20 hydrocarbons follows the order of Si-Fe > BASF > UCI for all three working temperatures.
The catalytic performance of the syngas-activated catalysts in the F–T reaction, shown in Table 4, exhibits similar patterns as those observed with the CO-activated catalysts, albeit with several exceptions. While the CO conversion in the F–T reaction followed the order: UCI > BASF > Si-Fe for all three working temperatures, the efficiency of the Si-Fe catalyst system appears to be much lower (<50%) than that observed with the CO-activated catalyst. Moreover, while the Si-Fe catalyst still maintains a higher process selectivity for the formation of the C8–C20 hydrocarbons, the noted advantage that was observed with the CO-activated Si-Fe system is diminished. However, the most important feature observed for the Si-Fe system is the very low generation of CO2, both for the CO-activated and the syngas-activated systems.
For both pretreatment conditions, however, the Si-Fe catalyst produces the highest fraction of the higher hydrocarbons and the lowest fraction of CO2, implying a limited extent of the WGS side reaction. This is most likely due to the nanoscale dimensions of the SiO2 support, providing a large surface area for efficient and homogeneous dispersion of iron oxide nanoparticles, particularly with a low fraction of Fe that was chosen for our experiments. Conversely, the commercial catalyst UCI tends to generate large amounts of CO2 with both catalyst pretreatment conditions, while the BASF commercial catalyst, comprised of nanoscale iron oxide particles, exhibits CO2 selectivity and high hydrocarbon selectivity in the intermediate range between those of UCI and those of the Si-Fe system, as shown in Figure 6a–f. Clearly, the Si-Fe catalyst exhibits a lower degree of CO consumption than the other commercial catalysts, but a higher degree of selectivity to produce high hydrocarbons with the lowest generation of CO2 as compared to the other commercial catalysts.

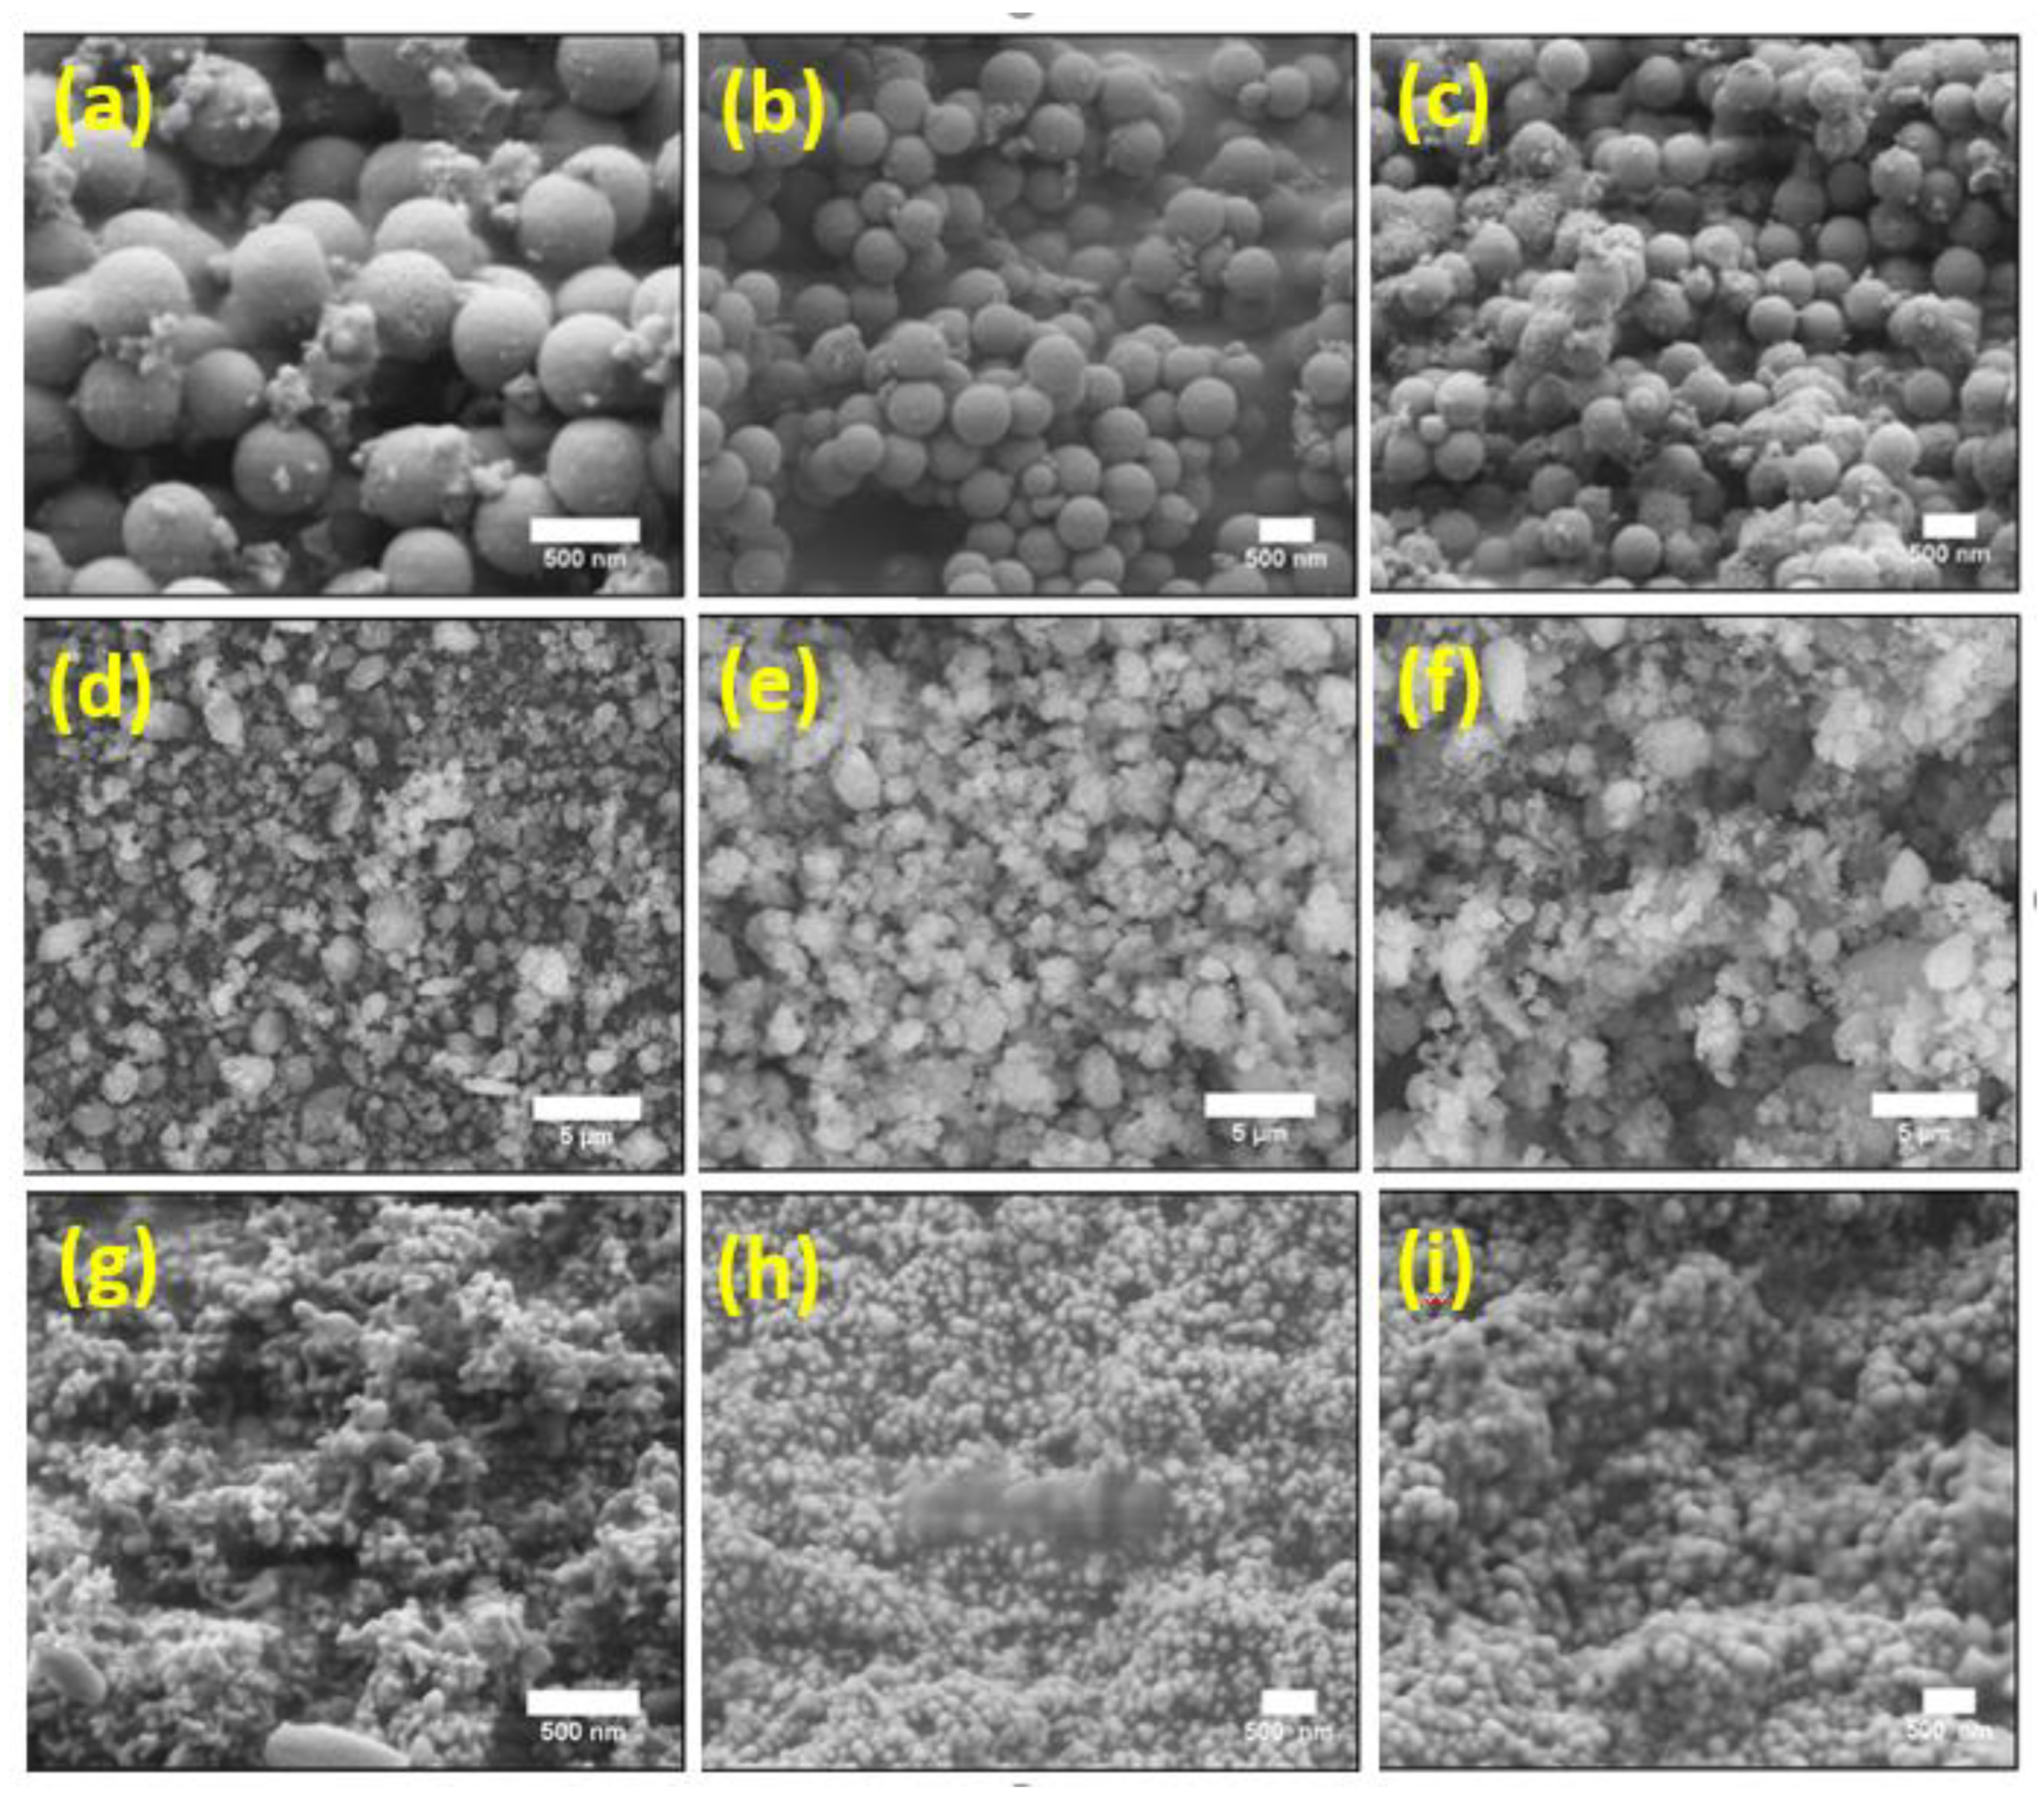
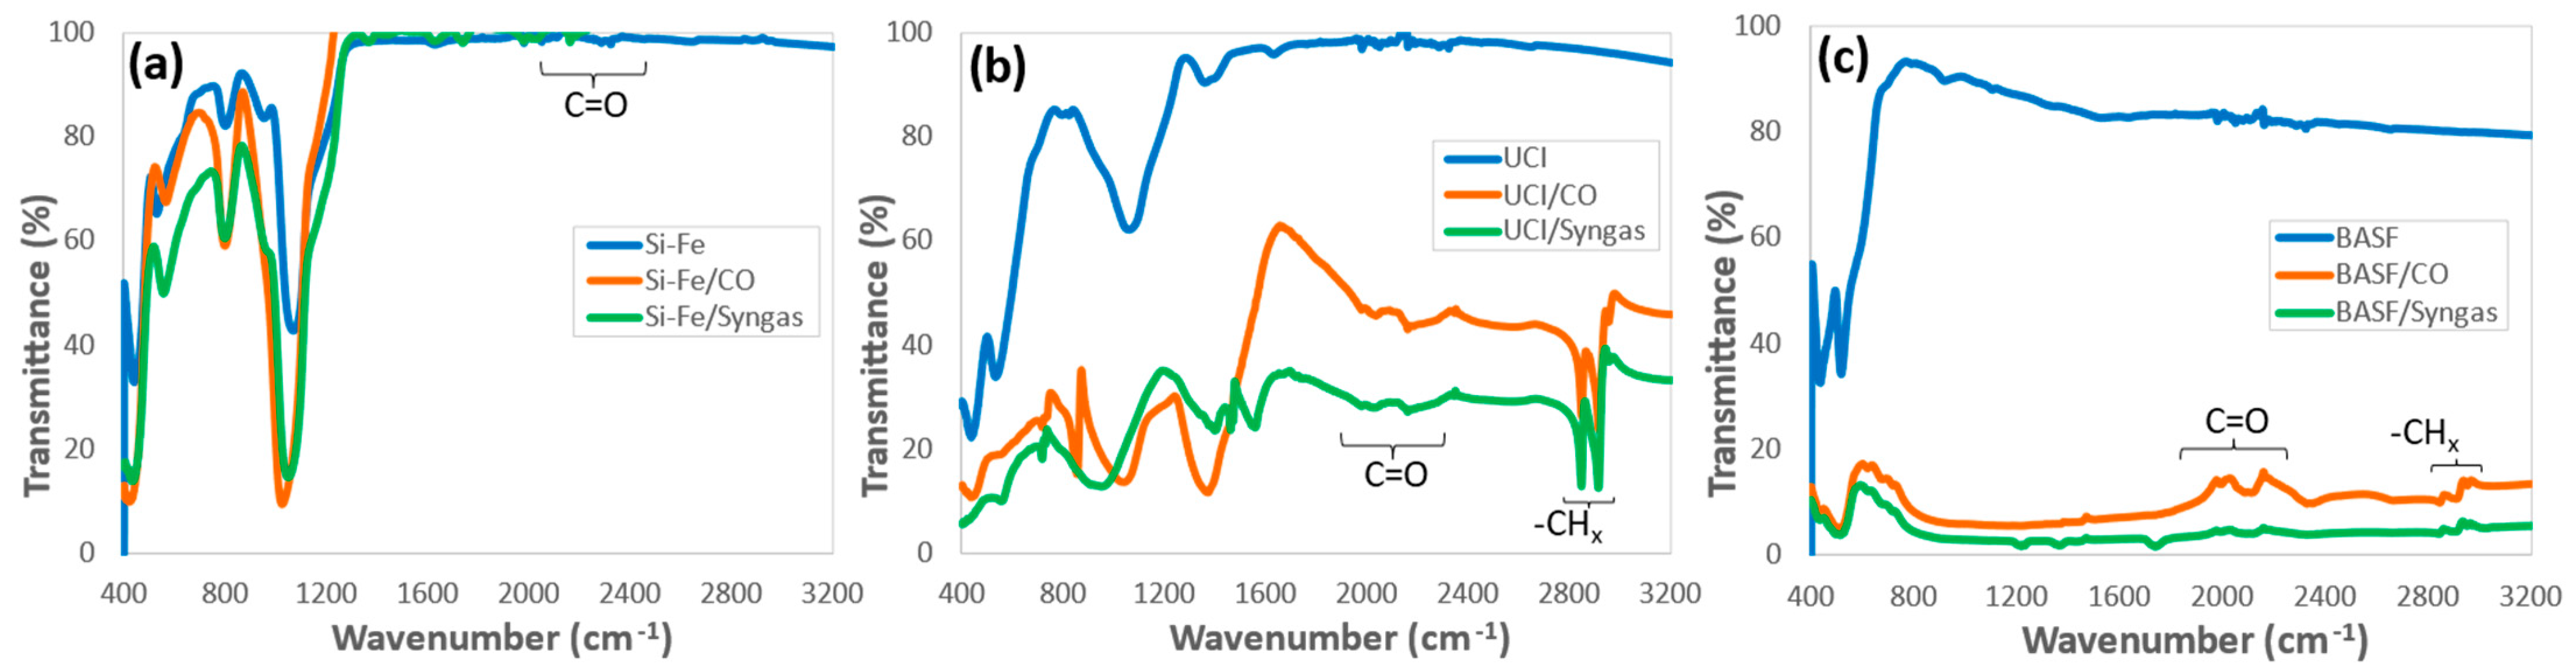
3.3. Morphology and Chemical Structure of the Catalysts after the F–T Synthesis

The size of the SiO2-supported iron catalyst particles for the Si-Fe and UCI systems remained essentially unaltered during the F–T reaction, irrespective of their mode of activation, as can be observed from the SEM images shown in Figure 7a–f. However, the size of the BASF catalyst, which consists of unsupported iron oxide nanoparticles, increased from an initial average of 61 nm ± 21 nm (Figure 7g) to a post-reaction size of 119 nm ± 35 nm for the CO-activated catalyst (Figure 7h) and a post-reaction size of 188 nm ± 35 nm for the syngas-activated catalyst (Figure 7i), in agreement with the previously reported data [3].
The morphology changes that we observed for the three catalysts due to their pre-activation and F–T reaction support the original hypothesis that smooth round catalyst particles are desirable to maintain the mechanical integrity of the catalyst system during the F–T process. The spherical silica support, present both in the UCI and the Si-Fe systems, could promote and sustain the dispersion of the iron catalyst nanoparticles and effectively avoid catalyst particle aggregation during the F–T process. The increase in the average particle size of the BASF catalyst is consistent with the fact that it consists of unsupported iron oxide nanoparticles. Hence, some degree of aggregation is observed. The catalyst stability, in turn, would affect the catalytic performance in F–T and result in a higher value product (non-CO2 and non-CH4 hydrocarbons) yield.
Additional insight into the chemical and structural differences among the Si-Fe, UCI, and BASF catalysts before and after F–T synthesis was obtained by examining the vibrational signatures of the molecular species in the three systems. The FTIR spectra of Si-Fe, BASF, and UCI catalysts, before the F–T reaction are shown in Figure 8. The BASF catalyst sample exhibited bands at 436 and 518 cm−1 corresponding to the cooperative stretching of the Fe–O and Fe=O molecular fragments in Fe2O3. The spectral shoulder at 578 cm−1 is indicative of the presence of a fraction of unaggregated pure iron oxide fragments in the sample (see Figure 3). Both the UCI and the Fe-Si catalysts consist of Fe2O3 nanoparticles supported on silica and exhibit the spectral features of silica, in particular peaks of silica at 820 and 1071 cm−1 corresponding to the symmetric and antisymmetric stretching vibrations of Si–O–Si, respectively. The characteristic peak of Fe2O3 in the UCI and Fe-Si samples also overlapped with the O–Si–O bending mode at 437 cm−1 [28].
The FTIR spectra of three catalysts (reduced with either syngas or CO) after being utilized in the F–T reaction are shown in Figure 9. The weak to medium intensity vibrational peaks observed in the 2800–3000 cm−1 spectral range correspond to the –CHx stretching vibrations arising from hydrocarbon products formed during the reaction, some of which were adsorbed on the surface of the catalysts. In addition, the weak vibrational peaks observed in the 1900–2400 cm−1 spectral range may be attributed to C=O stretching modes of various carbonyl-containing species, resulting from a multitude of possible F–T side reactions [49,50,51,52]. These features are observed for all catalysts, irrespective of their activation process (either by CO or syngas reduction). Still, the intensity of peaks in the 1900–2400 cm−1 spectral range seems to be higher in the CO-pretreated catalysts, which indicates more active iron sites during the F–T reaction [53]. The FTIR also indicates that the material homogeneity for the Si-Fe samples, both before and after the F–T reaction, has been preserved, while the other two catalysts have undergone some morphological changes, also demonstrated by the SEM images shown in Figure 7.

4. Conclusions

In this study, the synthesis of silica microspheres (450–600 nm) using a modified Stober process, on which iron oxide clusters were deposited by sonolysis of iron pentacarbonyl to yield a nanostructured iron material (Si-Fe) is reported. The structure of synthesized materials was characterized using a suite of spectroscopic techniques. Further, the effect of nanosizing in catalysis was established using the synthesized materials for F–T synthesis with a balanced ratio of syngas (H2/CO = 2) in batch mode for quick screening. A comparative F–T study with two commercial iron oxide catalysts, UCI (silica-supported iron oxide catalyst) and BASF (unsupported nano iron oxide catalyst), was also conducted. All three catalysts were pretreated with either CO or syngas and then evaluated in a 300 mL Parr batch reactor for 24 h at three temperatures: 493 K, 513 K, and 533 K. The collected data show that under the conditions used in this study, Si-Fe had the lowest CO2 (1.1% with CO-reduced catalyst and 3.3% with syngas-reduced catalyst), while the commercial catalysts, UCI and BASF, either have a higher CO2 selectivity with catalysts produced under both (CO and syngas) pretreatment conditions (UCI) or at one of the pretreatment conditions (BASF with CO reduction). The Si-Fe catalyst also has the lowest WGS activity and the highest C8–C20 selectivity (43.5% with CO-reduced and 28.3% with syngas-reduced catalysts). The catalytic performance results agree well and are supported by the catalyst morphology and spectroscopic studies. The spherical silica support could promote the dispersion of iron catalysts and effectively avoid agglomeration of catalysts during the F–T reaction, e.g., with the BASF catalyst. The spherical support appears to retard serious carbon deposition observed on the UCI catalyst surface. The FTIR data show that the CO-pretreated catalysts (Si-Fe and BASF) contained more active iron species. Thus, the morphology and structure of catalysts affect the catalytic performance during the F–T reaction and contribute to a higher/lower product yield. The finding of this study suggests that the nanostructured Si-Fe allows F–T operation at a lower-than-normal temperature, thus retarding CO2 production due to decreased WGS activity. This study is a good example of utilizing the structure-property relationship to design systems to activate higher space-time yield (STY) in catalysis while minimizing CO2 production, a greenhouse gas. Though the present study mainly focused on materials characterization and the presented F–T batch data are preliminary, we plan to design similar systems for application in other catalytic reactions.

Author Contributions

Conceptualization, D.M.; methodology, D.M. and L.C.; validation, D.M. and P.K.; formal analysis, D.M., E.C. and R.T.; resources, D.M. and P.K.; data curation, L.C., J.L. and E.C.; writing—D.M., L.C. and R.T.; original draft preparation, L.C. and D.M.; writing—review and editing, L.C., D.M., R.T. and P.K.; supervision, D.M.; project administration, D.M.; funding acquisition, D.M. All authors have read and agreed to the published version of the manuscript.

Funding

The research was funded by the Institute of Gas Innovation and Technology at Stony Brook University. This research used resources of the Center for Functional Nanomaterials, a U.S. DOE Office of Science Users’ Facility, at Brookhaven National Laboratory under Contract No. DE-SC0012704. The surface area measurements by Kai Chi and Grenalynn IIacas of the Center for Integrated Electrical Energy Systems (CIEES) at Stony Brook University are acknowledged.

Data Availability Statement

Not applicable.

Conflicts of Interest

The authors declare no conflict of interest.

References

  1. Schulz, H. Short history and present trends of Fischer–Tropsch synthesis. Appl. Catal. A Gen. 1999, 186, 3–12. [Google Scholar] [CrossRef]
  2. Dry, M.E. Practical and theoretical aspects of the catalytic Fischer-Tropsch process. Appl. Catal. A Gen. 1996, 138, 319–344. [Google Scholar] [CrossRef]
  3. Mahajan, D.; Gütlich, P.; Ensling, J.; Pandya, K.; Stumm, U. Vijayaraghavan Evaluation of nanosized iron in slurry-phase Fischer—Tropsch synthesis. Energy Fuels 2003, 17, 1210–1221. [Google Scholar] [CrossRef]
  4. Thomas, J.M.; Thomas, W.J. Principles and Practice of Heterogeneous Catalysis; John Wiley & Sons: Hoboken, NJ, USA, 2014. [Google Scholar]
  5. Mahajan, D.; Kobayashi, A.; Gupta, N. Fischer–Tropsch synthesis catalysed by ultrafine particles of iron: Cessation of water–gas shift activity. Chem. Commun. 1994, 7, 795–796. [Google Scholar] [CrossRef]
  6. Pour, A.N.; Housaindokht, M.R.; Tayyari, S.F.; Zarkesh, J. Kinetics of the water-gas shift reaction in Fischer-Tropsch synthesis over a nano-structured iron catalyst. J. Nat. Gas Chem. 2010, 19, 362–368. [Google Scholar] [CrossRef]
  7. Dlamini, H.; Motjope, T.; Joorst, G.; Stege, G.t.; Mdleleni, M. Changes in Physico-Chemical Properties of Iron-Based Fischer–Tropsch Catalyst Induced by SiO2 Addition. Catal. Lett. 2002, 78, 201–207. [Google Scholar] [CrossRef]
  8. Zhao, R.; Goodwin, J.G.; Oukaci, R. Attrition assessment for slurry bubble column reactor catalysts. Appl. Catal. A Gen. 1999, 189, 99–116. [Google Scholar] [CrossRef]
  9. Botes, F.G.; Niemantsverdriet, J.W.; van de Loosdrecht, J. A comparison of cobalt and iron-based slurry phase Fischer–Tropsch synthesis. Catal. Today 2013, 215, 112–120. [Google Scholar] [CrossRef]
  10. Bartholomew, C.H.; Pannell, R.B.; Butler, J.L. Support and crystallite size effects in CO hydrogenation on nickel. J. Catal. 1980, 65, 335–347. [Google Scholar] [CrossRef]
  11. Bond, G. Metal-support and Metal-additive Effects in Catalysis. Platin. Met. Rev. 1983, 27, 16–18. [Google Scholar]
  12. Bukur, D.B.; Lang, X.; Mukesh, D.; Zimmerman, W.H.; Rosynek, M.P.; Li, C. Binder/support effects on the activity and selectivity of iron catalysts in the Fischer-Tropsch synthesis. Ind. Eng. Chem. Res. 1990, 29, 1588–1599. [Google Scholar] [CrossRef]
  13. Wang, H.; Mao, D.; Qi, J.; Zhang, Q.; Wang, D. Hollow multishelled structure of heterogeneous Co3O4–CeO2− x nanocomposite for CO catalytic oxidation. Adv. Funct. Mater. 2019, 29, 1806588. [Google Scholar] [CrossRef]
  14. Li, Z.; Wang, H.; Zhao, W.; Xu, X.; Wang, D. Enhanced catalytic activity of Au-CeO2/Al2O3 monolith for low-temperature CO oxidation. Catal. Commun. 2019, 129, 105729. [Google Scholar] [CrossRef]
  15. Wang, Z.; Qi, J.; Yang, N.; Yu, R.; Wang, D. Core–shell nano/microstructures for heterogeneous tandem catalysis. Mater. Chem. Front. 2021, 5, 1126–1139. [Google Scholar] [CrossRef]
  16. Suslick, K. Homogeneous sonochemistry. In Ultrasound: It’s Chemical, Physical, Biological Effects; VCH Publishers: New York, NY, USA, 1988; pp. 123–163. [Google Scholar]
  17. Flint, E.B.; Suslick, K.S. The Temperature of Cavitation. Science 1991, 253, 1397. [Google Scholar] [CrossRef]
  18. Suslick, K.S.; Choe, S.-B.; Cichowlas, A.A.; Grinstaff, M.W. Sonochemical synthesis of amorphous iron. Nature 1991, 353, 414–416. [Google Scholar] [CrossRef]
  19. Suslick, K.S.; Hyeon, T.; Fang, M.; Cichowlas, A.A. Sonochemical synthesis of nanostructured catalysts. Mater. Sci. Eng. A 1995, 204, 186–192. [Google Scholar] [CrossRef]
  20. Suslick, K.S.; Hyeon, T.; Fang, M. Nanostructured Materials Generated by High-Intensity Ultrasound:  Sonochemical Synthesis and Catalytic Studies. Chem. Mater. 1996, 8, 2172–2179. [Google Scholar] [CrossRef]
  21. Nozawa, K.; Gailhanou, H.; Raison, L.; Panizza, P.; Ushiki, H.; Sellier, E.; Delville, J.P.; Delville, M.H. Smart Control of Monodisperse Stöber Silica Particles:  Effect of Reactant Addition Rate on Growth Process. Langmuir 2005, 21, 1516–1523. [Google Scholar] [CrossRef]
  22. Tannenbaum, R.; Goldberg, E.P.; Flenniken, C.L. Decomposition of Iron Carbonyls in Solid Polymer Matrices: Preparation of Novel Metal-Polymer Composites. In Metal-Containing Polymeric Systems; Sheats, J.E., Carraher, C.E., Pittman, C.U., Eds.; Springer US: Boston, MA, USA, 1985; pp. 303–339. [Google Scholar]
  23. Richmond, T.G.; Shi, Q.Z.; Trogler, W.C.; Basolo, F. Kinetics and mechanism of Lewis-base-induced disproportionation of vanadium hexacarbonyl and its phosphine-substituted derivatives. J. Am. Chem. Soc. 1984, 106, 76–80. [Google Scholar] [CrossRef]
  24. Pomogailo, A.D.; Rozenberg, A.S.; Dzhardimalieva, G.I. Controlled Pyrolysis of Metal-Containing Precursors as a Way for Synthesis of Metallopolymer Nanocomposites. In Metal–Polymer Nanocomposites; John Wiley & Sons, Inc.: Hoboken, NJ, USA, 2004; pp. 75–122. [Google Scholar]
  25. Chen, L.; Sharma, S.; Darienzo, R.E.; Tannenbaum, R.J.M.R.E. Decoration of cellulose nanocrystals with iron oxide nanoparticles. Mater. Res. Express 2020, 7, 055003. [Google Scholar] [CrossRef]
  26. Beganskienė, A.; Sirutkaitis, V.; Kurtinaitienė, M.; Juškėnas, R.; Kareiva, A. FTIR, TEM and NMR investigations of Stöber silica nanoparticles. Mater. Sci. 2004, 10, 287–290. [Google Scholar]
  27. Suo, H.; Wang, S.; Zhang, C.; Xu, J.; Wu, B.; Yang, Y.; Xiang, H.; Li, Y.-W. Chemical and structural effects of silica in iron-based Fischer–Tropsch synthesis catalysts. J. Catal. 2012, 286, 111–123. [Google Scholar] [CrossRef]
  28. Al-Oweini, R.; El-Rassy, H. Synthesis and characterization by FTIR spectroscopy of silica aerogels prepared using several Si (OR)4 and R′′Si(OR′)3 precursors. J. Mol. Struct. 2009, 919, 140–145. [Google Scholar] [CrossRef]
  29. Belousov, Y.A. Radical chemistry of iron carbonyls. Russ. Chem Rev. 2007, 76, 41–58. [Google Scholar] [CrossRef]
  30. Luo, F.H.; Yang, S.R.; Li, C.S.; Duan, J.P.; Cheng, C.H. Kinetics and electron paramagnetic resonance evidence of an electron-transfer chain mechanism for PPh3 substitution of [Fe3(CO)12]. J. Chem. Soc. Dalton Trans. 1991, 9, 2435–2439. [Google Scholar] [CrossRef] [Green Version]
  31. Ragaini, F. Mechanistic Study of the Phase-Transfer-Catalyzed Reduction of Nitrobenzene to Aniline by Iron Carbonyl Complexes. Role of the Radical Anion [Fe3(CO)11]. Organometallics 1996, 15, 3572–3578. [Google Scholar] [CrossRef]
  32. Belousov, Y.A.; Brin, E.F. Investigation of the kinetics of the chain-radical process in the system iron carbonyl–Lewis base. Polyhedron 2001, 20, 2765–2769. [Google Scholar] [CrossRef]
  33. Sivakumar, M.; Gedanken, A. Insights into the sonochemical decomposition of Fe(CO)5: Theoretical and experimental understanding of the role of molar concentration and power density on the reaction yield. Ultrason. Sonochem. 2004, 11, 373–378. [Google Scholar] [CrossRef]
  34. Zhang, S.; Zhang, Y.; Wang, Y.; Liu, S.; Deng, Y. Sonochemical formation of iron oxide nanoparticles in ionic liquids for magnetic liquid marble. Phys. Chem. Chem. Phys. 2012, 14, 5132–5138. [Google Scholar] [CrossRef]
  35. Mogorosi, R.P.; Fischer, N.; Claeys, M.; van Steen, E. Strong-metal–support interaction by molecular design: Fe–silicate interactions in Fischer–Tropsch catalysts. J. Catal. 2012, 289, 140–150. [Google Scholar] [CrossRef]
  36. Hauchard, C.; Rowntree, P.A. Low-energy electron-induced decarbonylation of Fe(CO)5 films adsorbed on Au(111) surfaces. Can J. Chem. 2011, 89, 1163–1173. [Google Scholar] [CrossRef]
  37. Alexandrescu, R.; Morjann, I.; Crunteanu, A.; Cojocaru, S.; Petcu, S.; Teodorescu, V.; Huisken, F.; Koh, B.; Ehbrecht, M. Iron-oxide-based nanoparticles produced by pulsed infrared laser pyrolysis of Fe(CO)5. Mater. Chem. Phys. 1998, 55, 115–121. [Google Scholar] [CrossRef]
  38. Suslick, K.S.; Goodale, J.W.; Schubert, P.F.; Wang, H.H. Sonochemistry and sonocatalysis of metal carbonyls. J. Am. Chem. Soc. 1983, 105, 5781–5785. [Google Scholar] [CrossRef]
  39. Einhiuser, T.J. ICP-OES and SEM-EDX Analysis of Dust and Powder Produced by the Laser-Processing of a Cr-Ni-Steel Alloy. Mikrochim. Acta 1997, 127, 265–268. [Google Scholar] [CrossRef]
  40. Nakamichi, H.; Sato, K.; Miyata, Y.; Kimura, M.; Masamura, K. Quantitative analysis of Cr-depleted zone morphology in low carbon martensitic stainless steel using FE-(S) TEM. Corr. Sci. 2008, 50, 309–315. [Google Scholar] [CrossRef]
  41. Wang, Y.; Muramatsu, A.; Sugimoto, T. FTIR analysis of well-defined α-Fe2O3 particles. Coll. Surf. A Physicochem. Eng. Asp. 1998, 134, 281–297. [Google Scholar] [CrossRef]
  42. Kayani, Z.N.; Arshad, S.; Riaz, S.; Naseem, S. Synthesis of Iron Oxide Nanoparticles by Sol–Gel Technique and Their Characterization. IEEE Trans. Magnet. 2014, 50, 2200404. [Google Scholar] [CrossRef]
  43. Mahajan, D.; Papish, E.T.; Pandya, K. Sonolysis induced decomposition of metal carbonyls: Kinetics and product characterization. Ultrason Sonochem. 2004, 11, 385–392. [Google Scholar] [CrossRef]
  44. Ojeda, M.; Nabar, R.; Nilekar, A.U.; Ishikawa, A.; Mavrikakis, M.; Enrique, E. CO activation pathways and the mechanism of Fischer–Tropsch synthesis. J. Catal. 2010, 272, 287–297. [Google Scholar] [CrossRef]
  45. Mahmoudi, H.; Mahmoudi, M.; Doustdar, O.; Jahangiri, H.; Tsolakis, A.; Gu, S.; Miroslaw, L.M. A review of Fischer Tropsch synthesis process, mechanism, surface chemistry and catalyst formulation. Biofuels Eng. 2017, 2, 11–31. [Google Scholar] [CrossRef]
  46. Peña, D.; Cognigni, A.; Neumayer, T.; van Beek, W.; Jones, D.S.; Quijada, M.; Rønning, M. Identification of carbon species on iron-based catalysts during Fischer-Tropsch synthesis. Appl. Catal. A 2018, 554, 10–23. [Google Scholar] [CrossRef]
  47. van der Laan, G.P.; Beenackers, A.A.C.M. Kinetics and selectivity of the Fischer–Tropsch synthesis: A literature review. Catal. Rev. 1999, 41, 255–318. [Google Scholar] [CrossRef]
  48. Ma, W.; Jacobs, G.; Sparks, D.E.; Klettlinger, J.L.S.; Yen, C.H.; Davis, B.H. Fischer-Tropsch synthesis and water gas shift kinetics for a precipitated iron catalyst. Catal. Today 2016, 275, 49–58. [Google Scholar] [CrossRef]
  49. Davidson, G. Spectroscopic Properties of Inorganic and Organometallic Compounds; RSC Publishing: Cambridge, UK, 2007; Volume 39. [Google Scholar]
  50. Benziger, J.B.; Larson, L.R. An infrared spectroscopy study of the adsorption of CO on Fe/MgO. J. Catal. 1982, 77, 550–553. [Google Scholar] [CrossRef]
  51. Sheline, R.K.; Pitzer, K.S. The Infrared Spectra and Structures of the Iron Carbonyls. J. Am. Chem. Soc. 1950, 72, 1107–1112. [Google Scholar] [CrossRef]
  52. Bian, G.; Oonuki, A.; Kobayashi, Y.; Koizumi, N.; Yamada, M. Syngas adsorption on precipitated iron catalysts reduced by H2, syngas or CO and on those used for high-pressure FT synthesis by in situ diffuse reflectance FTIR spectroscopy. Appl. Catal. A Gen. 2001, 219, 13–24. [Google Scholar] [CrossRef]
  53. Dey, S.; Sun, S.; Mehta, N.S. Carbon monoxide catalytic oxidation over various iron-based nanoparticles at ambient conditions: A Review. Carbon Capture Sci. Technol. 2021, 1, 100013. [Google Scholar] [CrossRef]
Figure 1. SEM images of the SiO2 nanospheres synthesized by the Stober process and complex SiO2-supported Fe2O3 nanostructures. (a) SEM image of “as synthesized” bare SiO2 nanospheres; (b) Corresponding EDX spectrum of bare SiO2 nanospheres; (c) SEM image of complex SiO2-supported Fe2O3 nanostructures synthesized from an initial mixture with a Si/Fe molar ratio of 22.49; (d) Corresponding EDX spectrum; (e) SEM image of complex SiO2-supported Fe2O3 nanostructures synthesized from an initial mixture with a Si/Fe molar ratio of 8.99; (f) Corresponding EDX spectrum; (g) SEM image of complex SiO2-supported Fe2O3 nanostructures synthesized from an initial mixture with a Si/Fe molar ratio of 4.50; (h) Corresponding EDX spectrum.
Micro 02 00042 g001aMicro 02 00042 g001b
Figure 2. Semi-quantitative analysis of EDX peaks of Si-Fe complex nanostructures.
Micro 02 00042 g002
Figure 3. A comparison of the infrared spectrum of the Si-Fe complex nanostructure with bare SiO2 nanospheres and unsupported Fe2O3 nanoparticles.
Micro 02 00042 g003
Figure 4. (a) Correlation between the infrared band ratios of the SiO2 support at 1080 cm−1 and tethered Fe2O3 nanoparticles at 534 (or 537) cm−1, and (b) molar ratios of SiO2/Fe2O3 of the products assuming 80% conversion yield.
Micro 02 00042 g004
Figure 5. TEM images of a SiO2 nanosphere decorated with Fe2O3 nanoparticles. (a) TEM image of the complex Si-Fe nanostructure having an 18.19% Fe atomic fraction; (b) A magnified image showing an aggregate Fe2O3 cluster.
Micro 02 00042 g005
Figure 6. Product (CO2, CH4,and C8 to C20) selectivity measured after the F–T synthesis for all three catalysts. Each catalyst was pretreated either with CO or with syngas. While Figures (a,c,e) were pre-activated with syngas, Figures (b,d,f) were pre-activated using CO.
Micro 02 00042 g006
Figure 7. SEM images of the catalysts at different stages before and after the F–T reaction at 533 K. Morphologies of (a) Si-Fe catalyst after CO reduction, (b) CO-reduced Si-Fe catalyst after the F–T reaction, (c) syngas-reduced Si-Fe catalyst after the F–T reaction, (d) UCI catalyst after CO reduction, (e) CO-reduced UCI catalyst after the F–T reaction, (f) syngas-reduced UCI catalyst after the F–T reaction, (g) BASF catalyst after CO reduction, (h) CO-reduced BASF catalyst after the F–T reaction, (i) syngas-reduced BASF catalyst after the F–T reaction.
Micro 02 00042 g007
Figure 8. FTIR spectra in the 400–1600 cm−1 spectral range of three catalysts, Si-Fe, UCI, and BASF, prior to their use in the F–T reaction. The spectra demonstrate the presence of the two main components, SiO2 and Fe2O3, for Si-Fe catalysts and Fe2O3 only for the BASF catalyst.
Micro 02 00042 g008
Figure 9. FTIR spectra of all three catalysts pretreated with CO and syngas after use in the F–T reaction at 533 K. Comparison of the post-activation and post F–T catalysis for (a) Si-Fe, (b) UCI catalyst, (c) BASF catalyst, as compared to the initial material.
Micro 02 00042 g009
Table 1. Weights and corresponding molar compositions of the reactants for three different Fe content, calculated weight and molar ratios between the SiO2 support and the Fe(CO)5 precursor.
Weight and Molar Composition of ReactantsReactant Ratios
SiO2 wtSiO2 MolesFe(CO)5 wtFe(CO)5 Moles Molar   R SiO 2 / Fe ( CO ) 5 wt   R SiO 2 / Fe ( CO ) 5
2.00 g0.03330.29 g0.001522.56.9
2.00 g0.03330.73 g0.00379.02.8
2.00 g0.03331.45 g0.00744.51.4
Table 2. A comparison of the Si/Fe molar ratios of the reactants and products of the sonochemical conversion of Fe(CO)5 onto SiO2 nanospheres support, as well as the respective ratios of the bridging oxygen stretching vibrations in SiO2 and Fe2O3 for the three different reactant compositions used.
Reactant Composition and Ratio Products Ratios
SiO2 MolesFe(CO)5 Moles Molar   R SiO 2 / Fe ( CO ) 5 I1080/I534 molar   R SiO 2 / Fe 2 O 3
0.03330.001522.54.57356.2
0.03330.00379.01.95822.5
0.03330.00744.51.90211.2
Table 3. F–T activity and selectivity data for CO-reduced catalysts (Solvent: ethylflopolyolefin-164 = 70 mL; Catalyst loading: 1 wt.%; Initial P: 2850 MPa).
Catalyst
Conversion (%)UCIBASFSi-Fe
493 K513 K533 K493 K513 K533 K493 K513 K553 K
Total (H2/CO)83.775.372.277.681.785.355.868.460.0
CO 95.996.093.581.989.876.154.667.161.1
Selectivity (C mole %)UCIBASFSi-Fe
CO224.822.027.415.219.818.71.60.51.1
CH43.23.66.66.78.98.73.90.50.2
C8–C20 hydrocarbons10.113.07.512.343.631.417.458.354.9
Table 4. F–T activity and selectivity data for syngas pretreated catalysts. (Solvent: ethylflopolyolefin-164 = 70 mL; Catalyst loading: 1 wt.%; Initial P: 2850 kPa).
Catalyst
Conversion (%)UCIBASFSi-Fe
493 K513 K533 K493 K513 K533 K493 K513 K533 K
Total (H2/CO)62.175.075.754.754.163.028.725.935.3
CO73.095.595.153.055.869.125.119.828.9
Selectivity (C mole%)UCIBASFSi-Fe
CO227.434.432.33.24.27.73.51.94.6
CH40.71.31.40.60.71.51.42.52.5
C8–C20 hydrocarbons6.75.46.023.613.418.621.239.324.6
Publisher’s Note: MDPI stays neutral with regard to jurisdictional claims in published maps and institutional affiliations.

