Article

Investigation of the Self-Cleaning Property of Photocatalytic Coatings at a Laboratory Scale

1
Laboratoire Matériaux et Durabilité des Constructions (LMDC), INSA/UPS Génie Civil, 135 Avenue de Rangueil, CEDEX 4, 31077 Toulouse, France
2
LRVision SAS, 695 Rue de l’Hers, Zone d’Activité de la Masquère, 31750 Escalquens, France
*
Author to whom correspondence should be addressed.
Photochem 2023, 3(4), 461-476; https://doi.org/10.3390/photochem3040028
Submission received: 8 October 2023 / Revised: 17 November 2023 / Accepted: 22 November 2023 / Published: 25 November 2023
(This article belongs to the Topic New Materials and Advanced Applications in Photocatalysis)

Abstract

:
Self-cleaning products are commercially available to protect surfaces against soiling and avoid the high consumption of energy and chemical detergents necessary for cleaning. They are based on semiconductor oxides, mostly titanium dioxide (TiO2), which induce photocatalytic oxidation activity and superhydrophilicity. Therefore, we present an experimental procedure at a lab scale to assess the self-cleaning ability of various photocatalytic coatings (five TiO2-based commercial products and one lab-grade zinc oxide (ZnO) product) applied to mortar surfaces. The samples were artificially stained with three types of soiling: Congo red dye, diesel soot, and motor oil. They were exposed to the environmental cycle of UV illumination and water flow for two weeks and the changes in stain colors were first assessed with visual inspection. Then, spectrophotometry measurements were conducted before and after the self-cleaning experiment to calculate the color differences for each stain in the CIELab color space data. In addition, the coatings were characterized via X-ray diffraction analyses and water contact angle measurements. Results highlighted color changes for each stain and higher wettability (induced by OH radicals) of the coated surfaces, which favored surface washing and thus stain removal. Light also had a positive effect on the attenuation of the stains, particularly for the Congo red dye.

1. Introduction

The increasing concentrations of people, industrial activities, and traffic are leading to significant levels of pollution, notably in urban areas, where the preservation of buildings is compromised [1,2,3]. Buildings are exposed to natural elements and man-made pollutants such as nitrogen oxides (NOx) (x = 1 and/or 2), the primary component of smog, which constantly attack outdoor surfaces, leaving them dirty, and in some cases causing serious damage [4]. In such a context, attention is increasingly being paid to technologies capable of maintaining the aesthetic durability of building materials. Building surfaces are generally cleaned using chemical detergents accompanied by scrubbing, wiping and use of a high-pressure water jet. However, such processes involve high energy consumption and costs, and negative impacts on the environment. Self-cleaning products have thus attracted growing interest in recent years due to their potential applications in many aspects of human daily life, and especially their ability to conserve the aesthetic appearance of buildings throughout their lifetime, therefore reducing surface cleaning costs. This is an effective preventive maintenance strategy that can bring economic benefits and a more sustainable management of buildings. The two principal ways to obtain self-cleaning materials are to develop superhydrophobic and superhydrophilic surfaces. Both of these surfaces have the ability to clean themselves when water is present. Hydrophobic behavior has been known for a long time and can be observed in the natural world, notably with the famous Lotus effect in the case of lotus plant leaves [5,6]. Other strategies to avoid surface contamination are found among animals and plants, which inspire researchers in materials science, physics, chemistry and engineering [7]. Hydrophobic surfaces show low wettability (water contact angle > 90°), which means that the adhesion of water is extremely reduced. Particle contaminants adhere to the water droplets formed on such surfaces and are then removed when the droplets roll off the surface [8]. On the contrary, superhydrophilic surfaces attract water (water contact angle < 90°), which spreads rapidly and uniformly on the entire surface. The dirt can be washed away with the water layer [9]. Such behavior can be observed in the case of photocatalytic surfaces [10].
The self-cleaning ability of titanium oxide-based photocatalytic surfaces is generally due to two synergistic phenomena: the photocatalytic process and photo-induced superhydrophilicity [11]. First, UV irradiation of the semiconductor leads to the formation of photo-generated electron–hole pairs that react with oxygen and water molecules to generate reactive oxygen species (hydroxyl OH, superoxide O2•− and hydroperoxyl HO2 radicals) on the photocatalytic surface, which are able to decompose a wide spectrum of organic pollutants adhering to the surface through oxidation–reduction reactions. Second, the photo-induced superhydrophilicity under UV irradiation (water contact angle < 10°) leads to the spreading of water drops (formation of a water film) on the surface of the photocatalyst, preventing direct contact between external contaminants and the surface itself and washing them away [12,13]. The synergy of photocatalytic and superhydrophilic effects will promote and maintain the self-cleaning capacity of a surface to keep the aesthetic image of buildings unchanged over time [14,15], while helping to reduce air pollution [16] and mitigate the consequences of heat islands [17].
In the field of building materials, the semiconductor titanium dioxide (TiO2) is one of the most widely used and efficient photocatalysts for self-cleaning applications [18,19]. Its popularity is notably due to its high photocatalytic activity (anatase crystallographic form), chemical stability, reasonable cost, compatibility with construction materials and the variety of applications it offers (self-cleaning, air-purification, anti-bacterial activity, water treatment and H2 production) [20,21,22,23,24]. Academic research has significantly promoted the practical applications of TiO2 as photochemistry applied to construction materials may be an attractive path to obtain cleaner surroundings (lower energy use and pollutant reduction) [25,26]. Studies in the literature report on the combination of TiO2 nanoparticles with various construction materials (e.g., cement, mortar, asphalt, and concrete pavement) to enhance their aesthetic durability [27,28]. In addition, photocatalytic coatings applied to surfaces as a post treatment have been investigated [29,30,31,32,33]. In this case, the quantity of photoactive material is effectively exploited. The coating technique avoids the encapsulation of TiO2 particles within inner layers where light is not available and pollutants have no access. Such a treatment can also be applied to new buildings characterized by complex shapes or to existing facades to preserve old historic buildings without changing their appearance. It allows for a transparent protective surface to be formed, which is activated by sunlight and can significantly ease cleaning operations during the whole service life of the building, thanks to physicochemical effects [34,35,36,37].
This paper presents an experimental method conducted at a lab scale, which aims to assess the self-cleaning efficiency of semiconductor oxide-based dispersions in conditions approaching those found in real-world exposure. A test bench was developed to expose coated mortar samples to alternating light and water flow sequences (simulation of solar light and rainfall) and thus evaluate their self-cleaning potential. Commercially available photocatalytic products were tested: five products were based on ultrafine TiO2 particles and one was a chemical grade zinc oxide (ZnO). They were characterized with X-ray Diffraction analysis, from which the particle size was deduced. Aqueous dispersions were prepared from these products and applied to mortar surface samples, which were then artificially stained with Congo red dye, diesel soot and motor oil. Visual inspection and spectrophotometry measurements were used to assess the stain degradation. Water contact angle measurements were also conducted on cement paste samples to characterize the wettability of the five tested coatings.

2. Materials and Methods

2.1. Substrates

Mortar samples were used for the self-cleaning experiments. Normalized mortar with a water–cement ratio of 0.5 (W/C = 0.5) was prepared according to the NF EN 196-1 standard. It was composed of siliceous sand (granulometry: 0/2 mm) and CEM I 52.5 Portland cement, and the preparation was carried out at ambient temperature and relative humidity of 55%. The sample was mixed mechanically and then cast in a 30 cm × 30 cm × 1 cm steel mold with the aid of a vibrating table. The resulting slab was kept covered in a room at constant temperature and humidity, then demolded after 7 days and sawn into 10 cm × 5 cm × 1 cm pieces. Mortar samples were polished with an ESCIL ESC 300 GT polishing machine (120 µm silicon carbide abrasive disk) before the photocatalytic dispersion was applied to half of the surface (left side). Reference mortar surface (right side of the sample) was protected from any coating (cf. part 2.3 Photocatalytic Dispersion Application).
For water contact angle (WCA) measurements, cement paste was preferred as the substrate. The higher porosity of mortar led to rapid penetration of the photocatalytic dispersion into the cavities of the surface, which made it difficult to determine the WCA.

2.2. Photocatalytic Products

Five commercial products were used. They are specified in Table 1: two ultrafine TiO2 powders of high purity, two stable aqueous dispersions of ultrafine TiO2 particles (TiO2 content of 18 wt% and 10 wt% for Products 3 and 4, respectively) and one nanopowder of ZnO (Products 1 to 4, Tronox, Thann, France; Product 5, Sigma Aldrich, Saint-Quentin-Fallavier, France). Aqueous dispersions with the same dry semiconductor particle content were then prepared based on these products. The final weight content of TiO2 or ZnO-based dispersions was 4 ± 0.25%. TiO2 and ZnO are semiconductors known to provide a powerful oxidation under UV irradiation [38,39].

2.3. Photocatalytic Dispersion Application

The dispersion was applied to the surface using a fine brush. The quantity of TiO2 or ZnO deposited on the surface—3.5 ± 0.5 g/m2—was determined by weighing the recipient containing the dispersion and the brush before and after the coating of the sample. Two layers were applied if necessary, with a drying step of 30 min at ambient temperature and humidity between applications. The same surface treatment protocol was followed for all the samples. In order to better follow and compare the efficiency of the dispersion to maintain the aesthetic aspect of the sample surface, the dispersion was only applied to the left side of the sample, the two sides being separated with an adhesive tape as shown in Figure 1a.

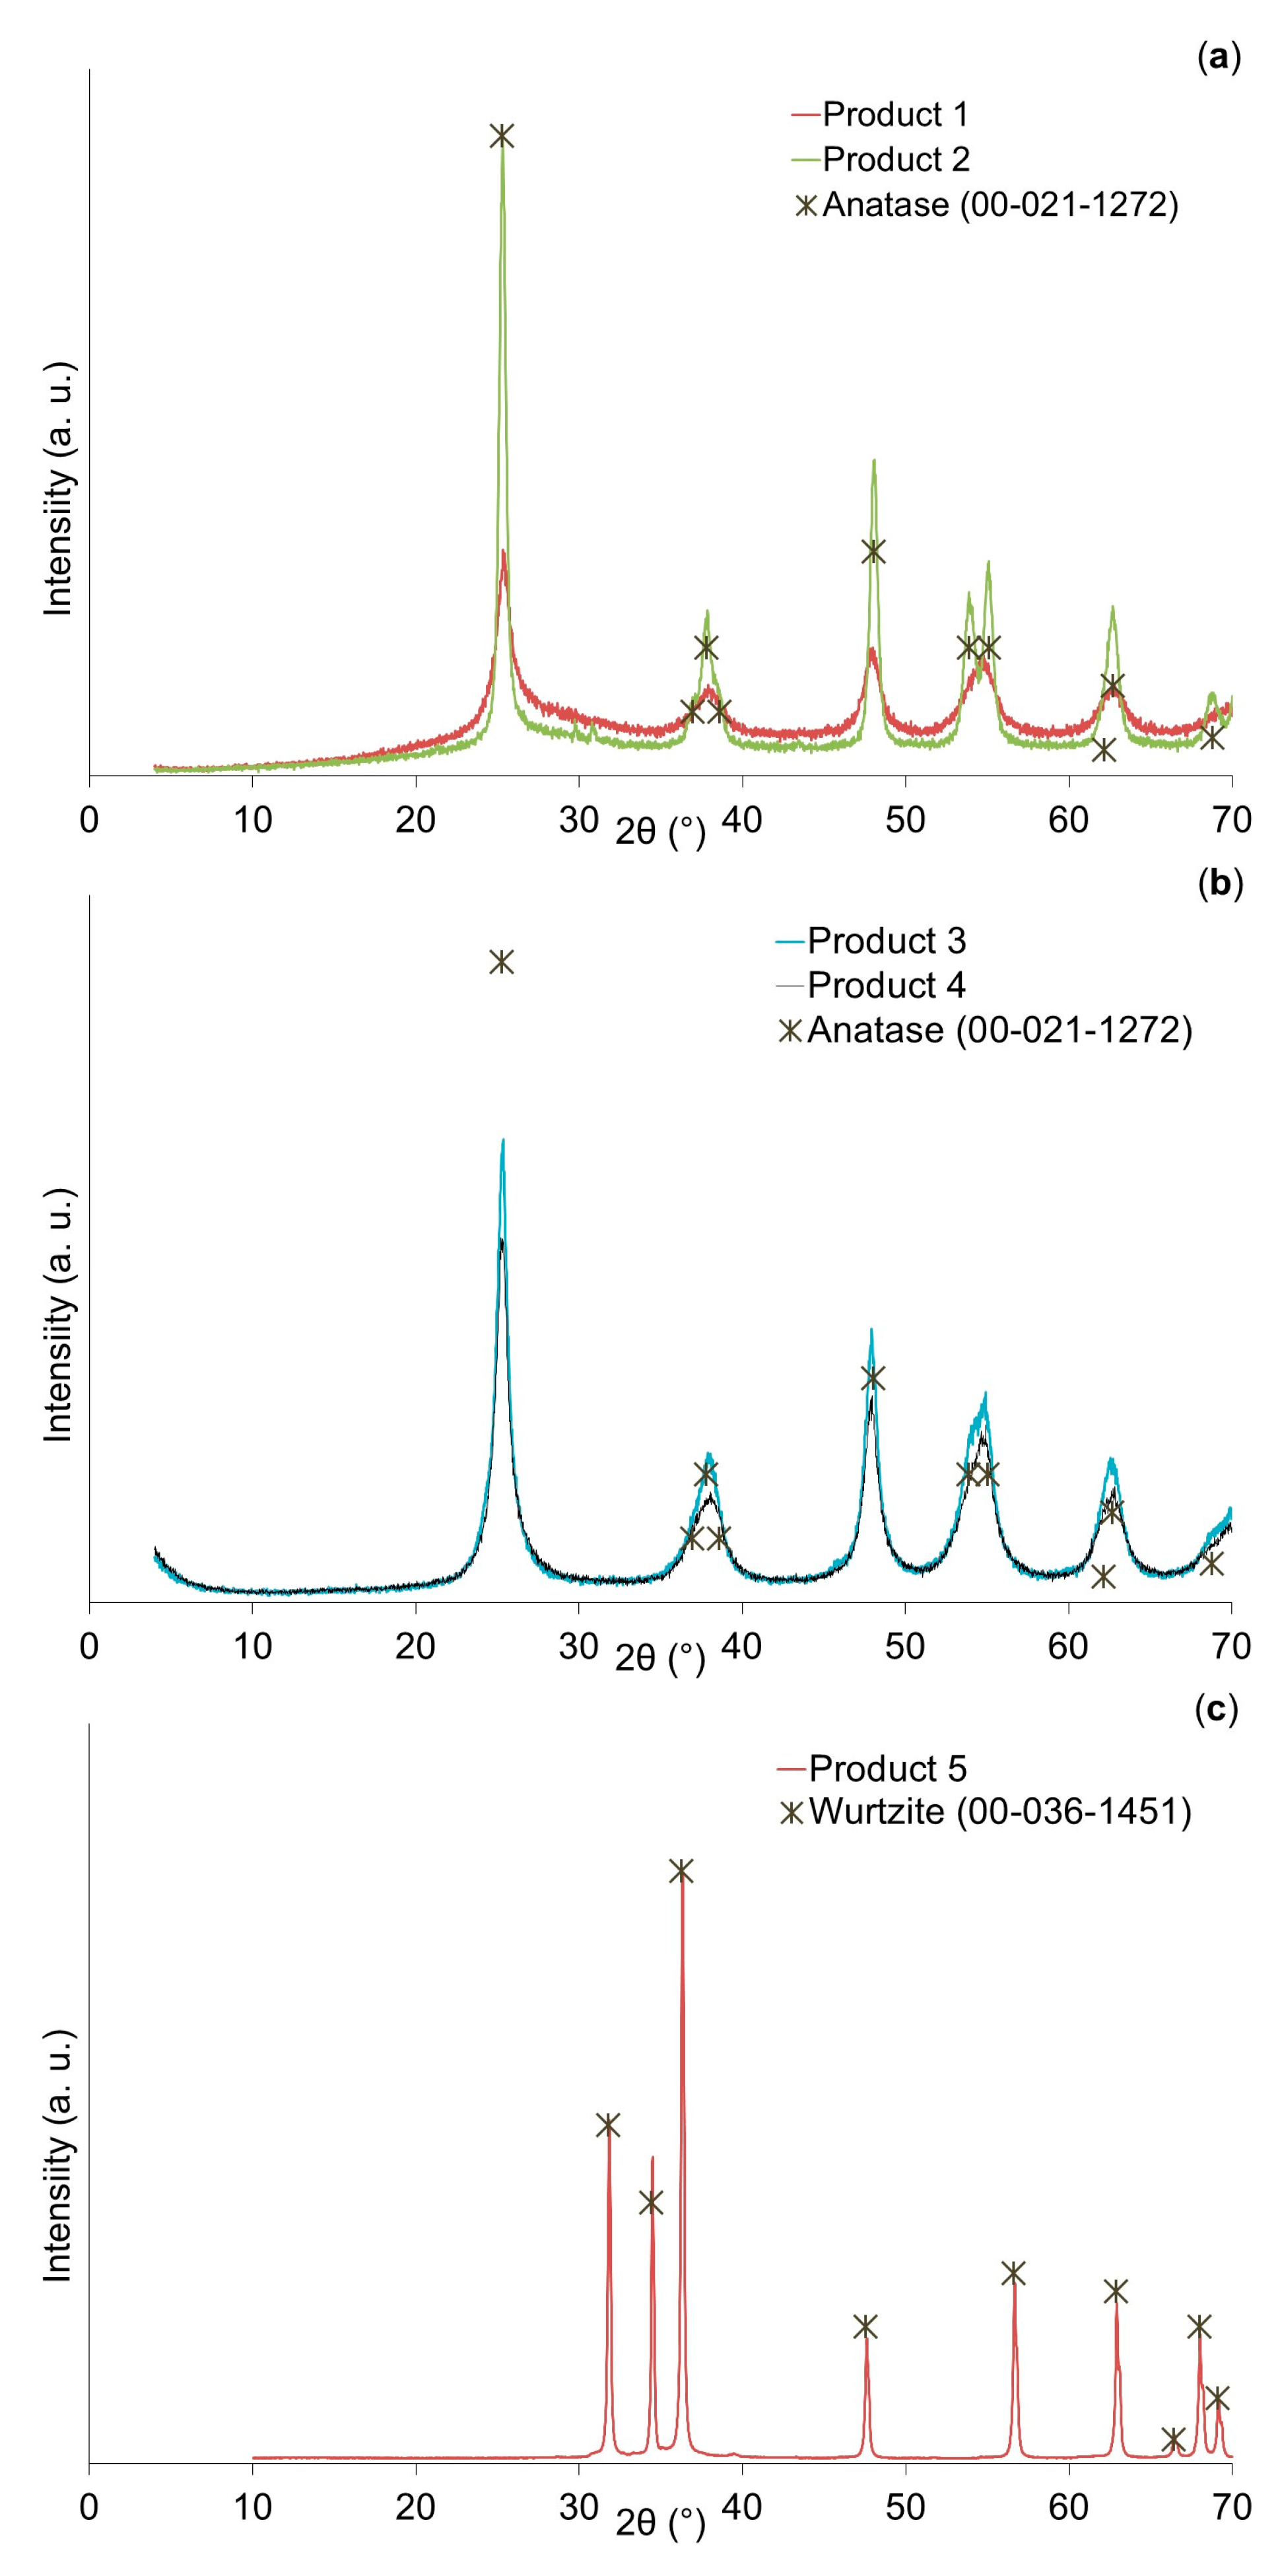
2.4. X-ray Diffraction

The photocatalytic products were analyzed with X-ray Diffraction (XRD) using the BRUKER ADVANCE D8 X-ray diffractometer (BRUKER, Karlsruhe, Germany) equipped with a copper anticathode ( λ = 0.15406 nm) and a 1D LYNXEYE XE-T detector (BRUKER, Karlsruhe, Germany). Products 3 and 4 (initial state: aqueous dispersion) were dried to collect powders of TiO2 particles (a drying step at 100 °C for 12 h). Each product powder was homogenized using ten 6 mm glass balls for 3 min and then ground and sieved with an 80 mm mesh before XRD analyses were carried out. The compounds were identified with EVA software (V4.1.1, BRUKER, Karlsruhe, Germany). The sizes of the crystallites were calculated from the peak with the highest intensity using the Scherrer formula (cf. Equation (1)) [40,41]:
L = k × λ β × cos θ
where L is the crystallite size in nm, k = 0.9 (for particles of unknown sizes) is a constant representing the shape factor, λ = 0.15406 is the monochromatic wavelength in nm, β is the width of the peak at mid-height, expressed in radians, and θ is the position of the peak on the diffractogram in degrees.

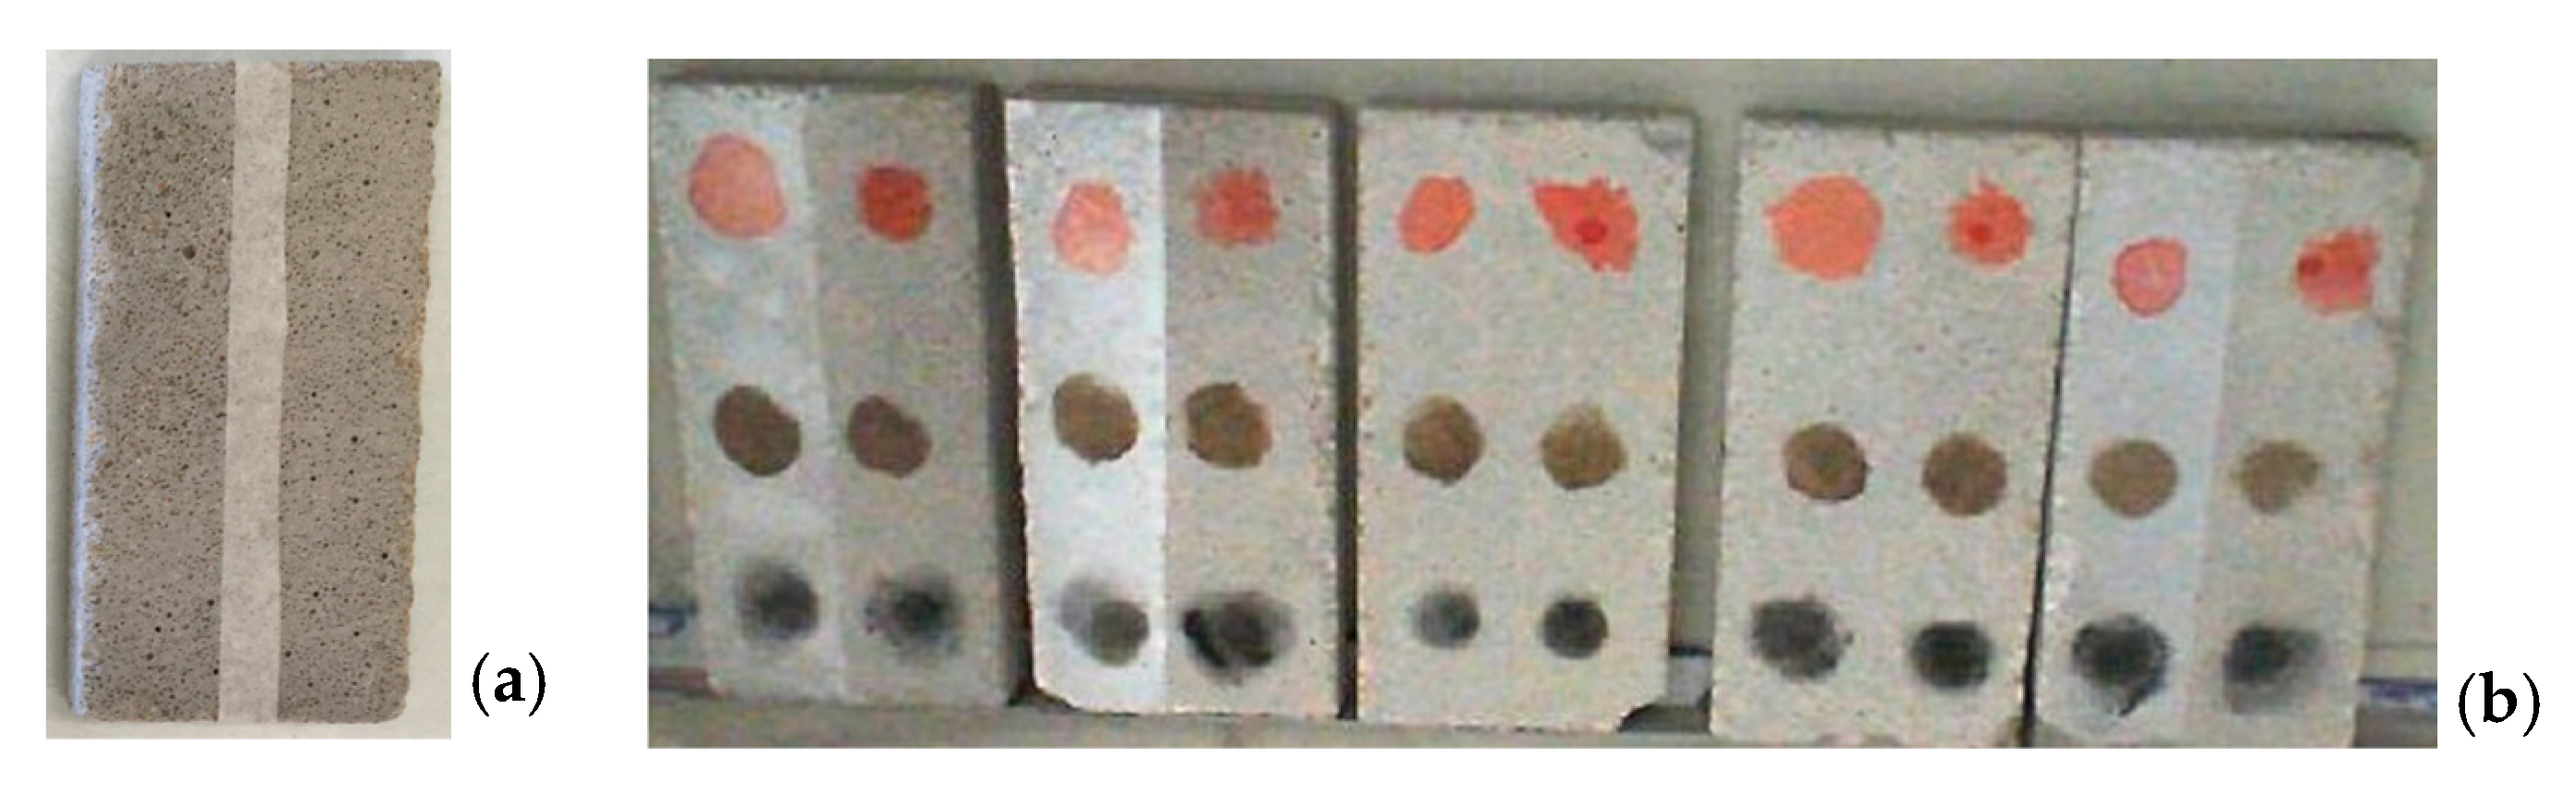
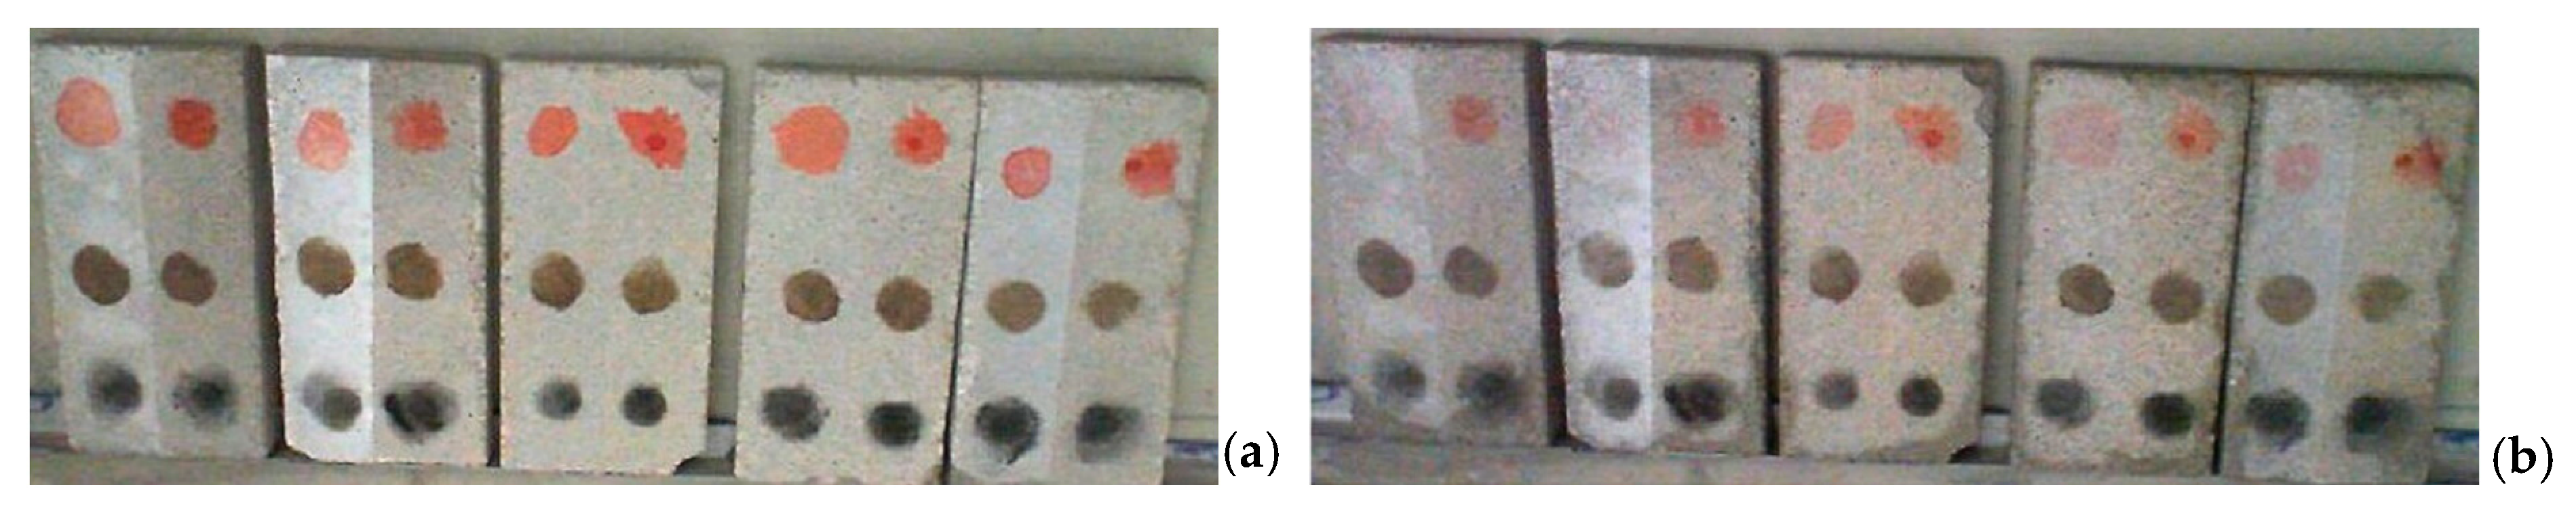
2.5. Surface Contamination

After the left sides of mortar samples had been coated, they were dried in a dark box for 12 h before being stained. Three different stains, Congo Red dye, diesel soot and motor oil, were applied to each side of the mortar surface. The Congo red deposition was carried out with a micro pipette. Soot and motor oil were deposited with the index finger using a thin metal sheet stencil with circular holes 15 mm in diameter. It should be noted that real diesel soot collected from exhaust pipes was used. The appearance of stains on mortar surfaces before the self-cleaning experiment was carried out are shown in Figure 1b.

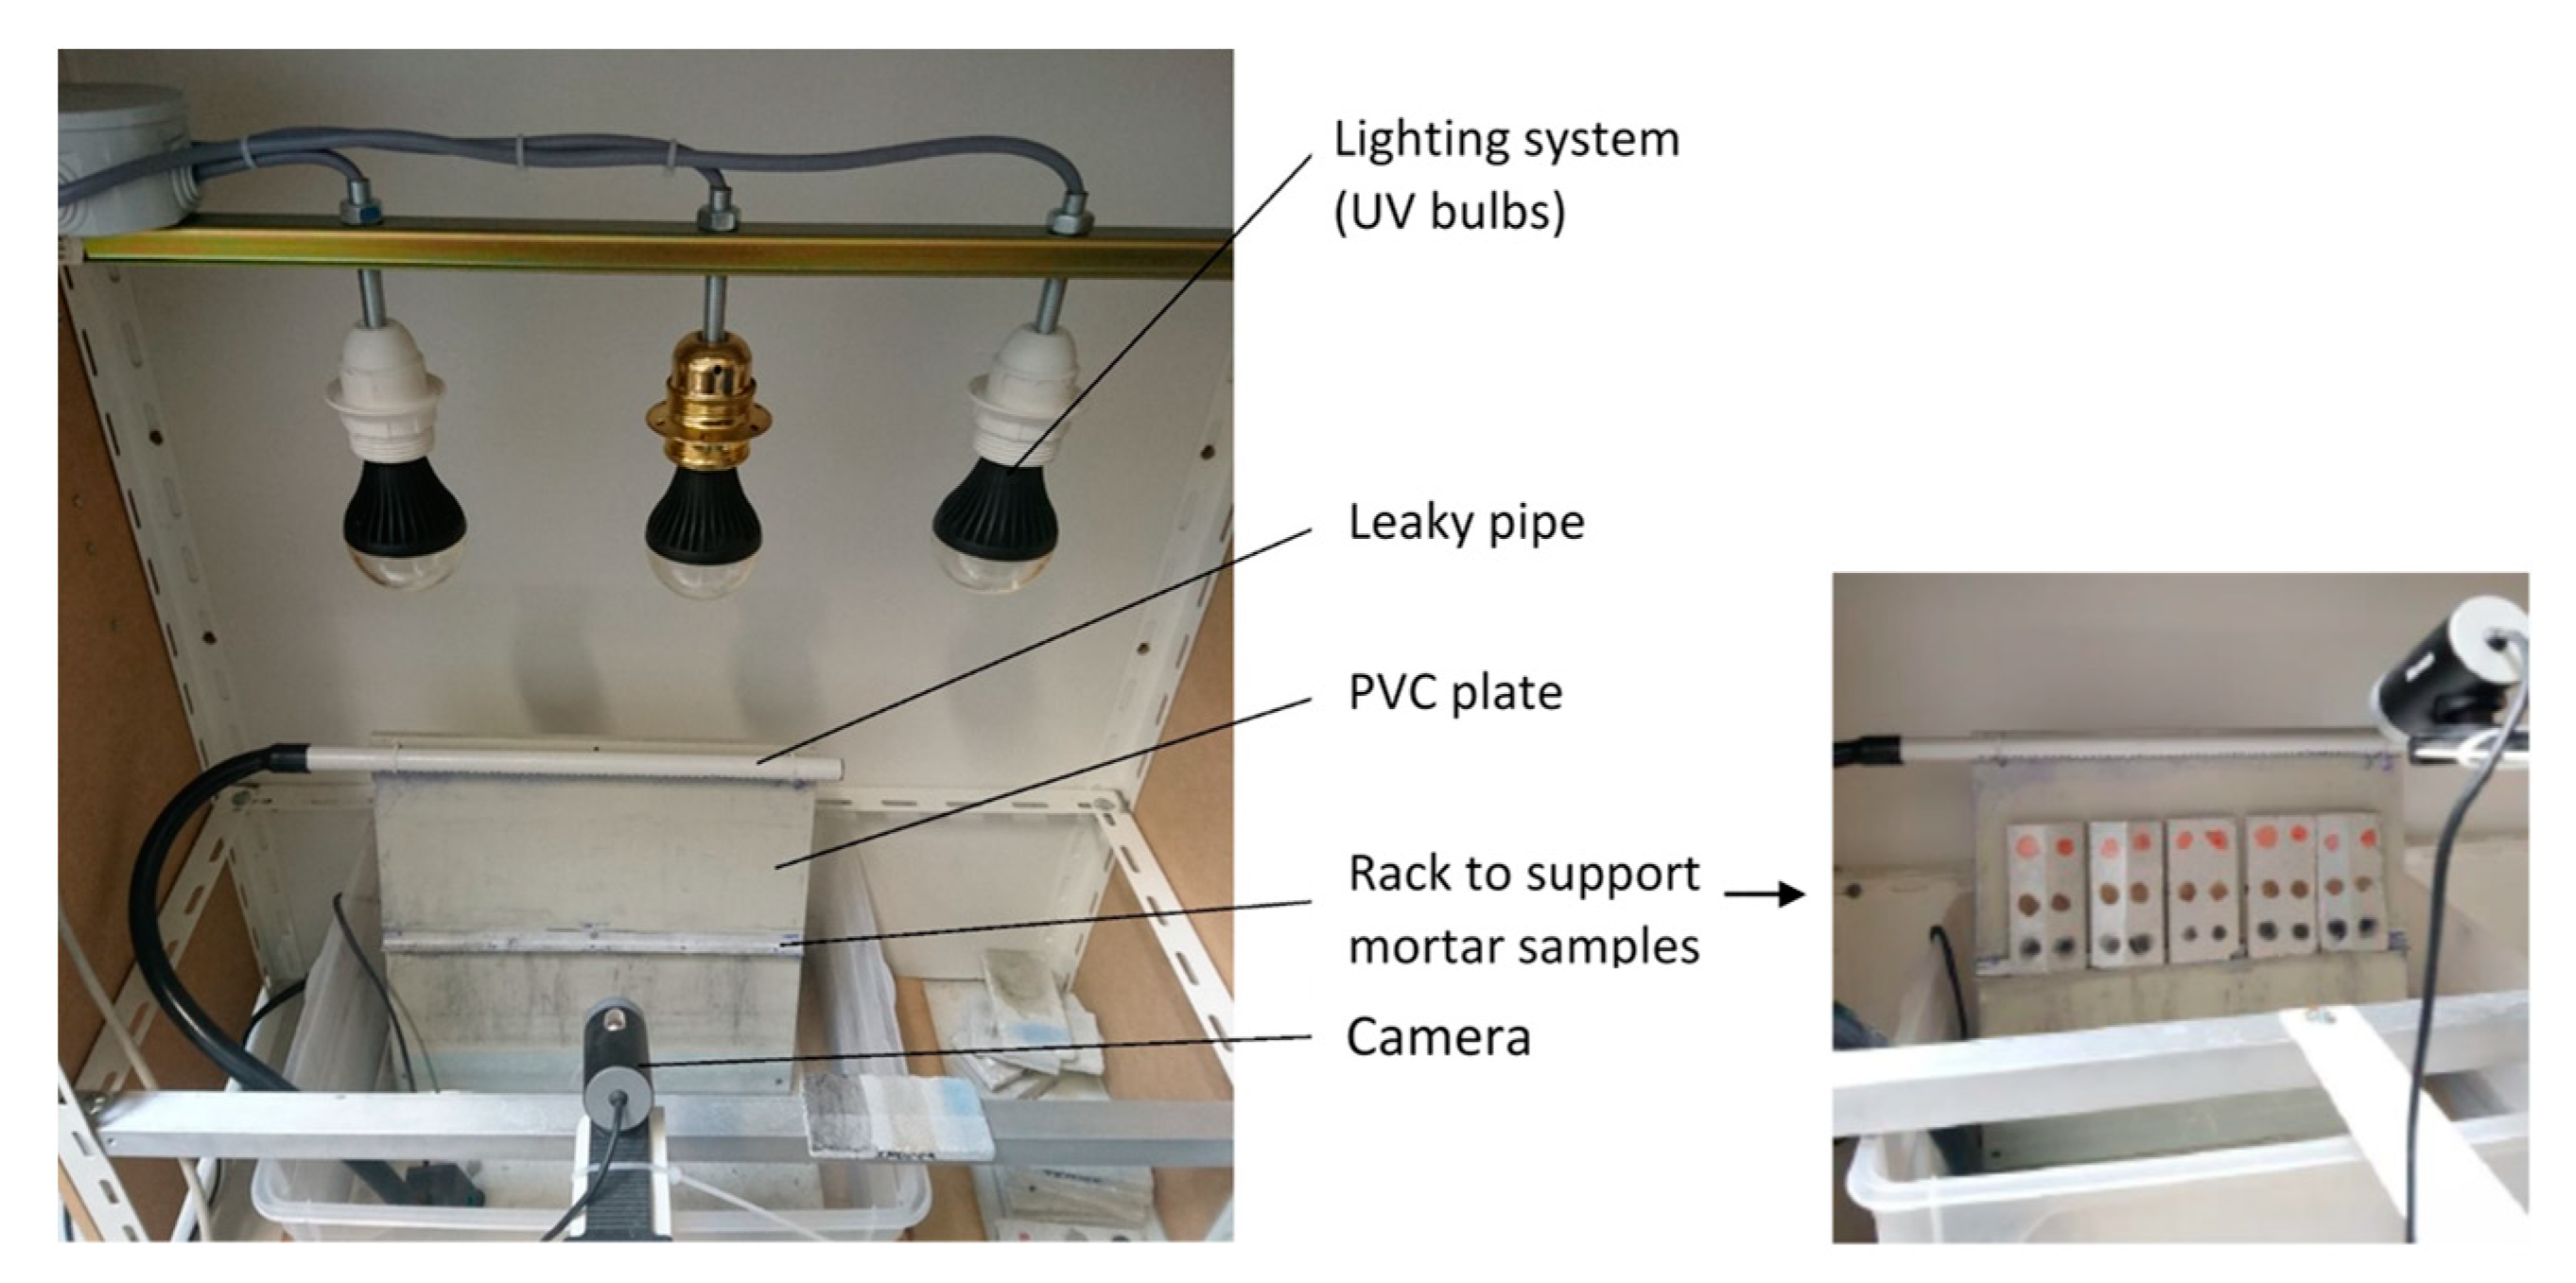
2.6. Self-Cleaning Experiments

Self-cleaning experiments were conducted using the lab-made test bench shown in Figure 2. A leaky pipe connected to a pump allowed the water to flow over the mortar sample surfaces. The pipe was fixed to a PVC plate 5 cm above the sample top. Mortar samples were placed on a horizontal rack. This test bench was exposed to homogeneous artificial light provided by three identical UV-A LED bulbs located 30 cm above the horizontal rack (CroLED E27 UV-A Blacklight 7 Watts, λ = 365 nm, average irradiance of 10 W/m2 on the sample surfaces measured with a Gigahertz-Optik radiometer (UV-A detector: UV-3717 model, 315–400 nm; Gigahertz Optik GmbH, Türkenfeld, Germany)) and a camera was installed in front of the mortar samples. The water pump and the lighting system were connected to a computer and the LrvWash® program (from LRVision company, Escalquens, France), designed especially for the self-cleaning experiments, controlled the starting/stopping of the water flow and the switching on/off of the light.
In order to simulate weather conditions (solar irradiation and rainfall) at a laboratory scale, the mortar samples were subjected to a cycle of artificial light and water flow. This cycle is defined in Table 2. The water flow and light sequences were interrupted by a resting period, i.e., no light and no water flow. A curtain allowed the test bench to be isolated from the light of the room and therefore to be in the dark when the artificial lighting system was switched off.

2.7. Spectrophotometry

Color measurements in the CIELab (or CIE L * a * b ) space were conducted with a Konica Minolta CM-2300d portable spectrophotometer (wavelength range 360 nm to 740 nm, Konica Minolta, Roissy, France). Measurements for each stain on each mortar surface sample (6 stains on 5 mortar samples) were carried out before starting the self-cleaning test and at the end of the test, 2 weeks later. The following colorimetric data were obtained: the color lightness L * (from black (0) to white (+100)), and the color coordinates a * and b * (+ a * was the red axis, − a * was the green axis, + b * was the yellow axis; − b * was the blue axis). From these values, the global color change Δ E * was calculated using Equation (2). The higher the Δ E * , the stronger the self-cleaning action.
Δ E * = ( Δ L * ) 2 + ( Δ a * ) 2 + ( Δ b * ) 2  
where Δ L * , Δ a * , and Δ b * are the lightness and color variations. The colors of the stains before the start of the self-cleaning experiment were taken as references, and the final color measurements were carried out at the end of the experiment in order to assess the self-cleaning properties of each photocatalytic coating. Color measurements were also performed on the right sides of the mortar samples, which were not coated with a photocatalytic product, in order to assess the stain degradation due to the action of light and water.

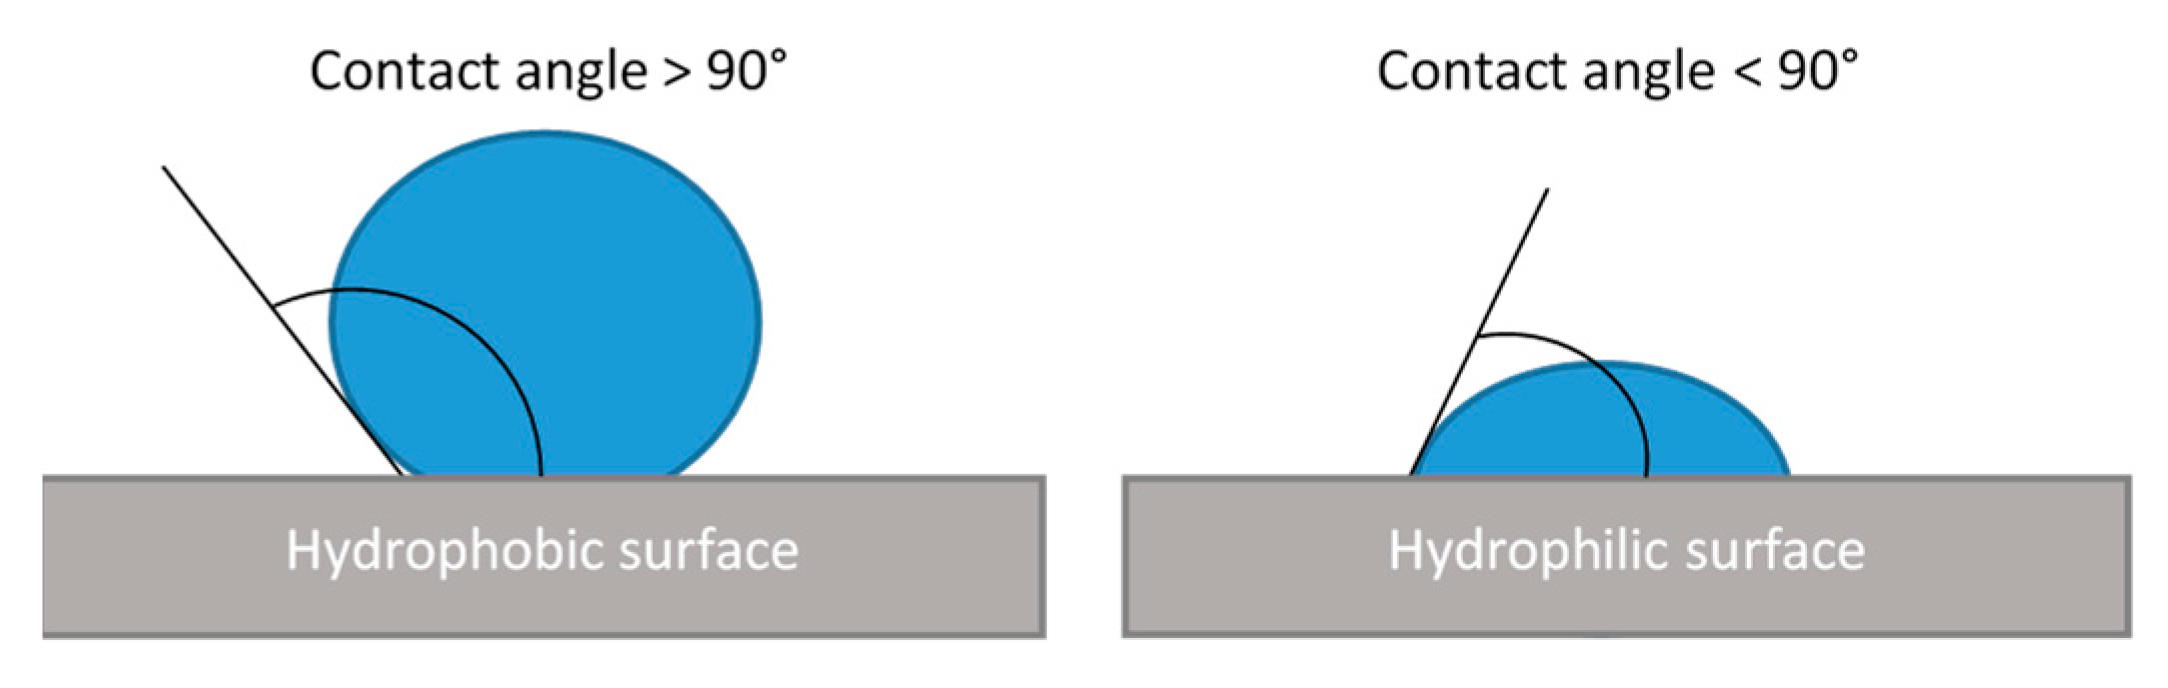
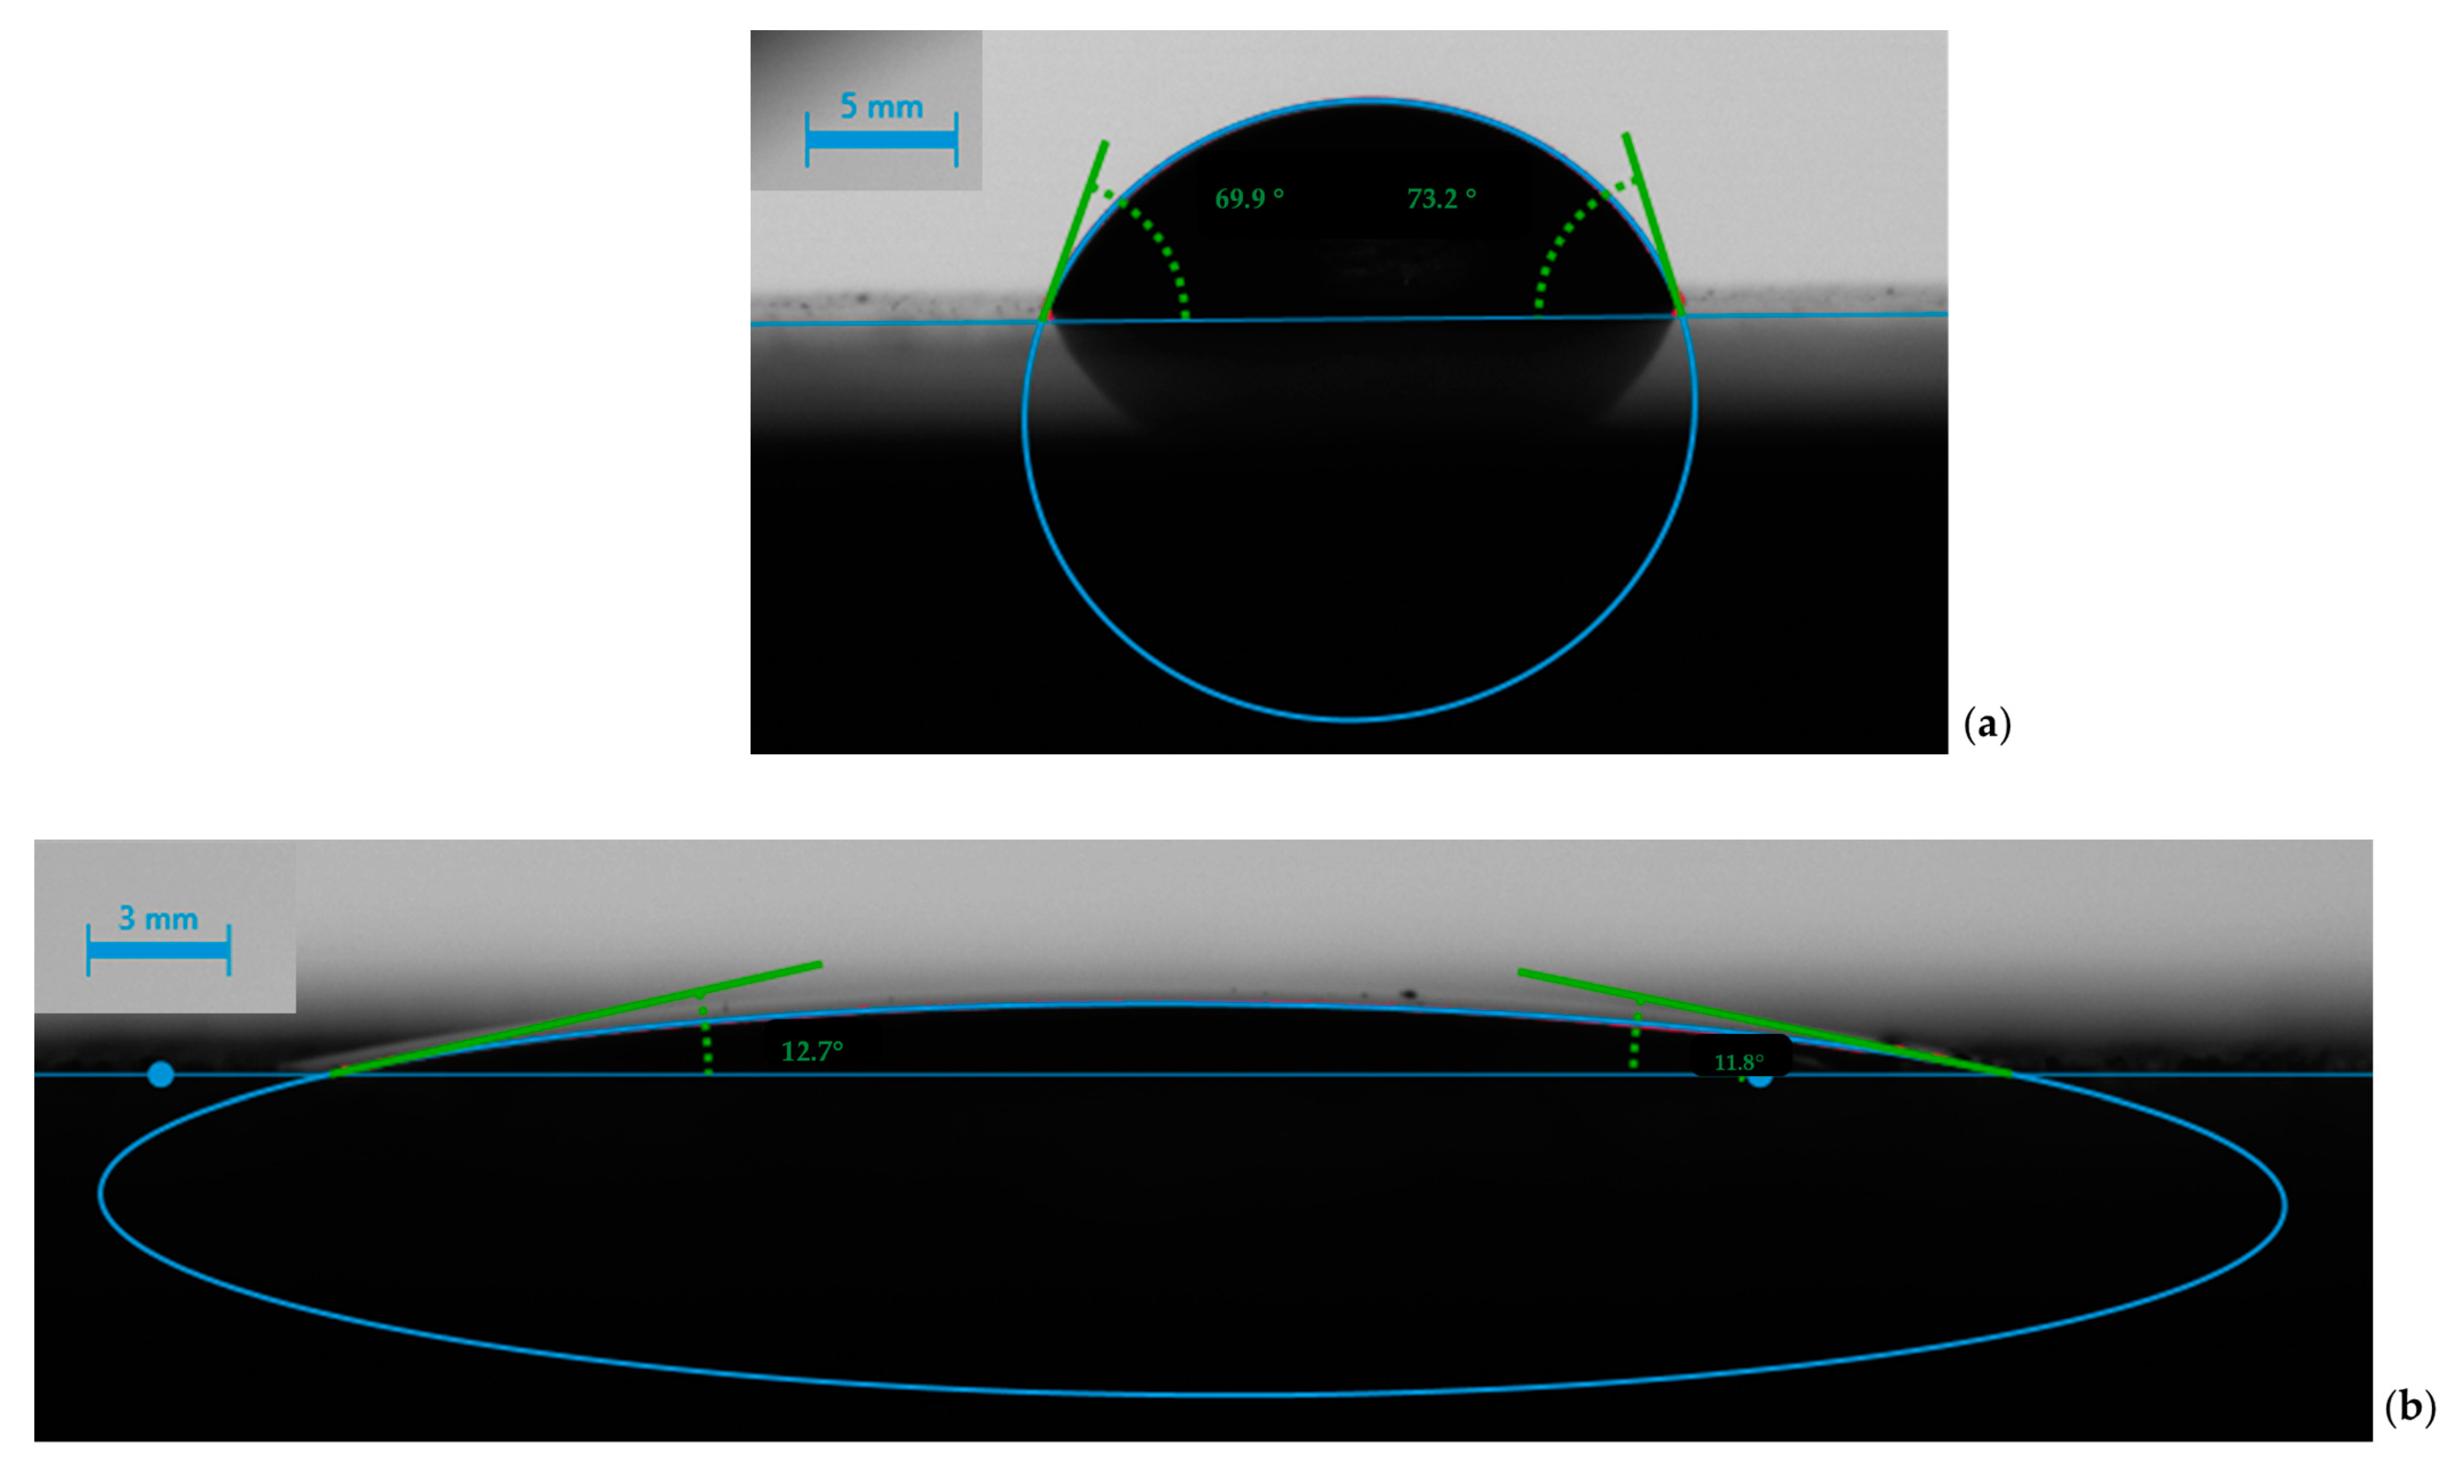
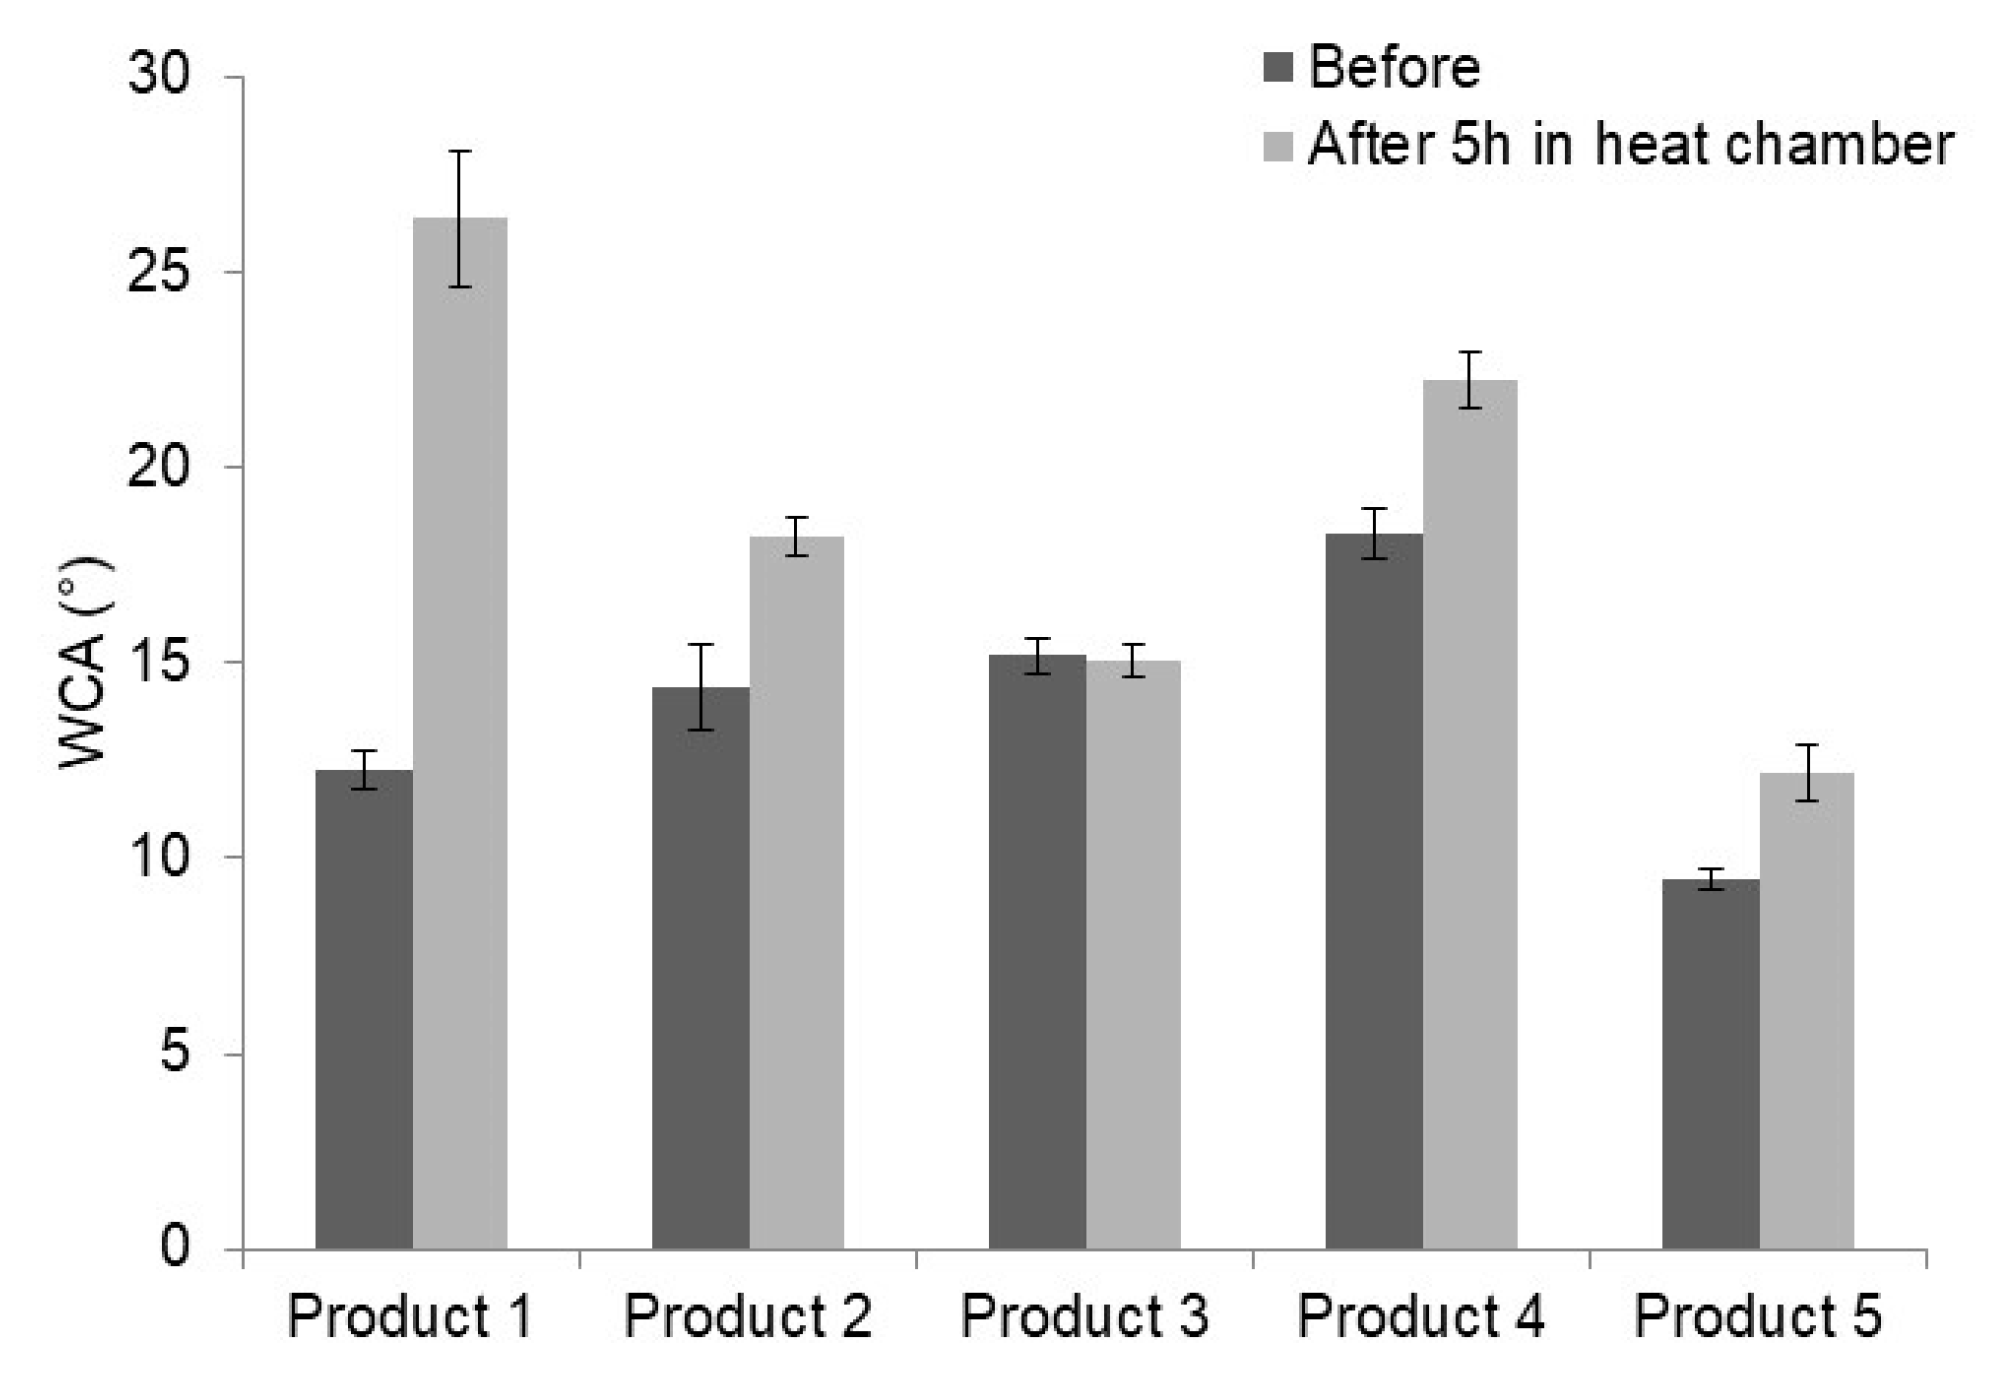
2.8. Water Contact Angle Measurements

The wettability of a surface can be determined by measuring the water contact angle (WCA), which is defined as the angle between the solid surface and the tangent to the liquid at the contact [35]. For surfaces with good wettability, the contact angle is low (<90°, cf. Figure 3) and approaches 0° for superhydrophilic surfaces. WCA was calculated using the Krüss DSA30S goniometer (Krüss GmbH, Hamburg, Germany), piloted with the ADVANCE software (V1.41, Krüss GmbH, Hamburg, Germany). The deposit height of the droplet and the volume of the droplet were controlled with precision. The following values were chosen for all tests: 1 cm and 10 μL (minimal volume to allow the droplet to fall due to its own weight), respectively. The goniometer was equipped with a camera, which took images and videos of the fall of the water droplet onto the material surface. A first series of WCA measurements was conducted on a reference cement paste sample (a clean surface without photocatalytic dispersion). Then, the photocatalytic coatings based on the products presented in Table 1 were applied to the surface of cement paste samples. After they had dried for 24 h in a box in the dark, a new series of WCA measurements were carried out on the coated samples. The WCA obtained at 0.25 ± 0.03 s after the deposition of the droplet on the surface was chosen for all the samples. The results are the averages of five WCA measurements.

3. Results and Discussion

3.1. XRD Analyses

The XRD diffractograms obtained for each powder are shown in Figure 4. The peaks were identified with the EVA software (Inorganic Crystal Structure Database, ICSD) and are specified on each graph. Anatase was the only crystalline phase found for TiO2-based products (Products 1, 2, 3 and 4), with well-defined peaks for Product 1 (probably due to very small particles, cf. Table 3). The larger anatase particle size of Product 2 could explain the wider peaks observed (12.7 nm for Product 1 vs. 67.6 nm for Product 2, cf. Table 3). A more pronounced amorphous phase was detected for Products 3 and 4, probably due to residual compounds coming from the solution (powders were collected from commercial aqueous dispersion after a drying step). The well distinguished and highly crystalline peaks on Figure 4c can be indexed to the wurtzite hexagonal phase (Product 5). Among the crystal structures of TiO2, anatase and rutile crystalline phases have been most studied as photocatalysts (brookite has been the object of much less interest), and the mixture of these two phases is known to have a synergetic effect resulting in an increase in photocatalytic activity, as evidenced by the famous TiO2 Degussa P25 [42]. However, when pure phases are considered, anatase appears as the preferred one for the photocatalytic application of TiO2, as reported in numerous studies [43,44,45,46,47]. This phase has a higher specific area, which increases the number of active sites and facilitates the contact and diffusion of reactants and products, and a lighter average effective mass of photogenerated electron and hole pairs, which clearly improves the photogenerated charge carrier mobility, thus resulting in their lowest recombination rate. ZnO has proved to be a promising photocatalyst and has been suggested as an alternative to TiO2 semiconductor because of its adsorption efficiency over a larger fraction of the solar spectrum [48,49]. It is known for its antifouling and antibacterial properties [50,51,52] and has been used in photocatalytic degradation applications, and notably in dye degradation [49]. ZnO is available in three crystallite structures: hexagonal wurtzite, zinc blende, and rock salt, the wurtzite crystalline phase being the most stable in ambient conditions [53].
The Scherrer formula (cf. Equation (1)) was then used to calculate the size of the crystallite of each product from the width at half-maximum and the height of the peak showing the highest intensity. Results are reported in Table 3. As expected, the materials analyzed were of nanometric size and were characterized to be average crystallites of 12–68 nm. Micro-sized particles can exhibit photocatalytic properties but the best activity was found with nano-sized particles, mainly because of the lower specific surface of particles of micrometric size, which tended to have lower OH species concentrations at the surface and different bridged-OH species structure [54]. However, it has to be noted that the efficiency of photocatalytic activity cannot be attributed to a single property like the size of the particles. The crystallinity, the morphology of particles (which also impacts the surface area) and the band gap value are also influencing parameters [55].

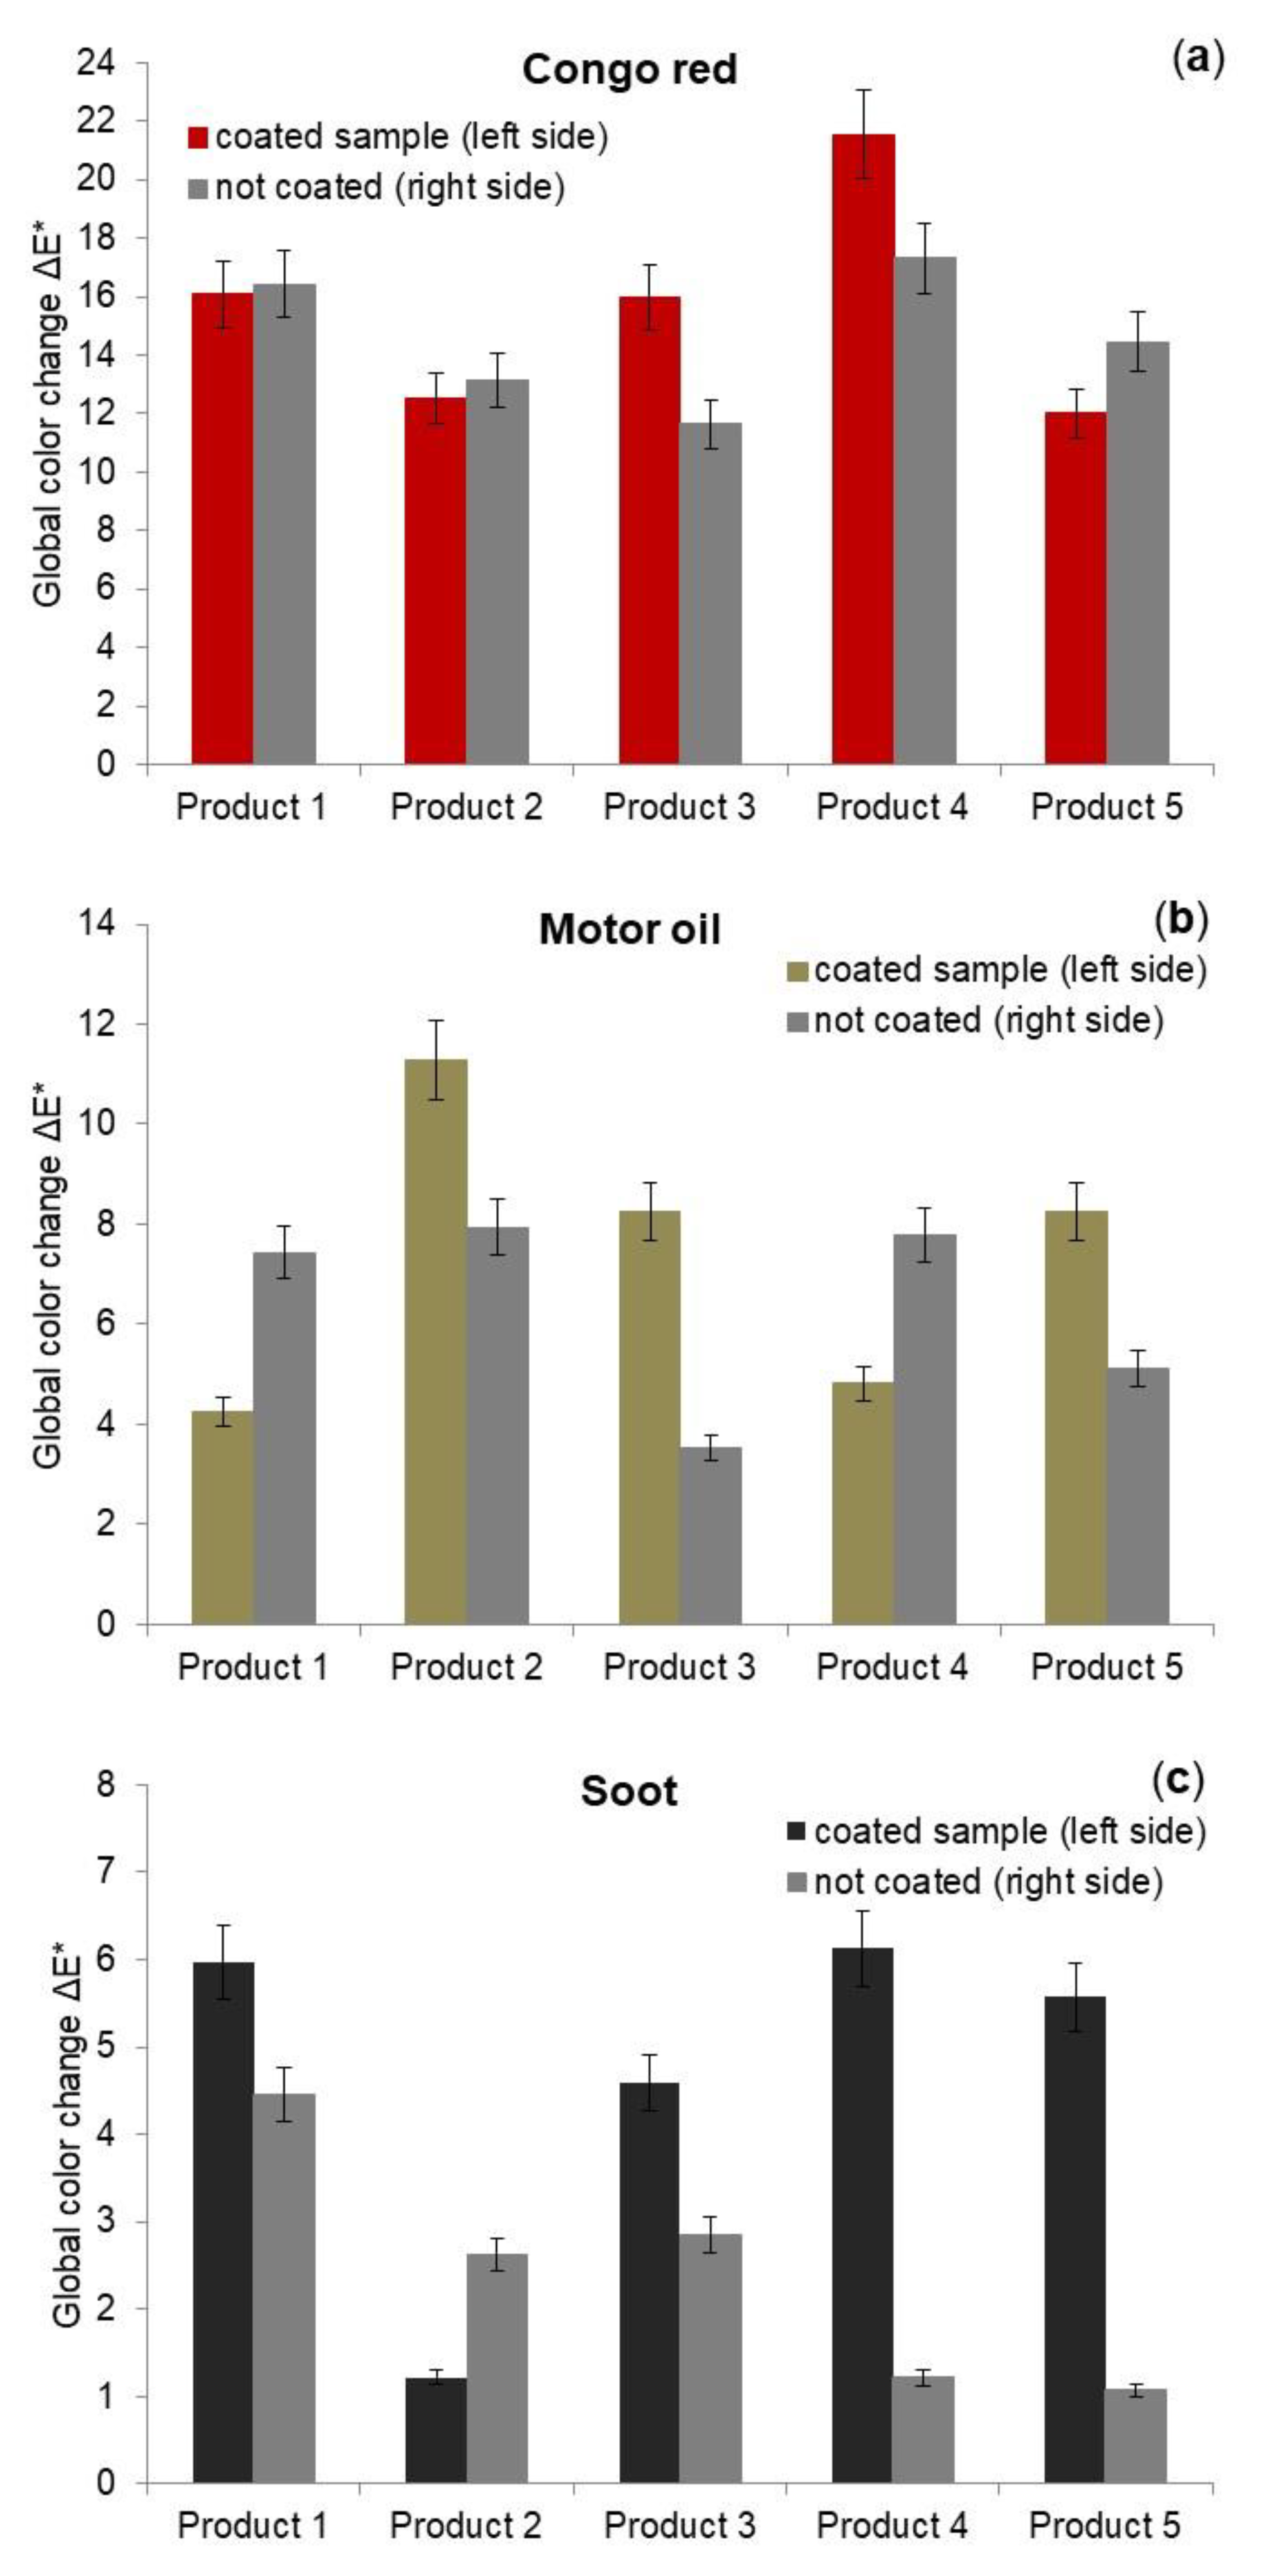
3.2. Stain Degradation Quantification

Visual inspection and color measurements via spectrophotometry were conducted, and the results are shown in Figure 5 and Figure 6, respectively. As stated in part 2.5, three kinds of soiling were used: Congo red dye, diesel soot and motor oil.
It can be observed in Figure 5 that the Congo red stain faded during the self-cleaning experiment on both the coated side (left) and uncoated side (right) for all the mortar samples. Dyes are among the tools used for demonstrating the benefits of photocatalysis. They have been used as model compounds to investigate the photocatalytic degradation process by following their removal from aqueous solution [56,57,58,59]. For example, Congo red and methyl red dyes were used by Patil et al. to assess the photocatalytic performance of TiO2/WO3 nanocomposites [60]. The photocatalyst was dispersed in an aqueous solution of Congo red or methyl red dye, and the color change of the solutions under visible light irradiation was followed with UV-Vis spectrophotometry. In [61], the Congo red was immobilized over a TiO2 thin film, which was irradiated with a UV lamp. The authors highlighted the oxidation process of the Congo red by following the changes in its characteristic Raman bands. Moreover, Khairol et al. [62] studied the photocatalytic performance of ZnO-based catalysts by assessing the removal of Congo red in aqueous solution under visible light illumination. However, the use of dyes may be inappropriate in some conditions. They can lead to an unreliable assessment of the photocatalytic activity or self-cleaning potential of a semiconductor oxide, as other mechanisms, such as photolysis, a decoloration of the dye due to absorption of photons, can occur [63,64].
Concerning soot and motor oil stains, the color changes were slight: stains on the left side of the samples seemed to be lighter after the self-cleaning test but variations were difficult to detect with the naked eye. Several authors have used soot as soiling to assess the self-cleaning properties of a coating by following the color change on the surface [29,65,66,67]. Among them, Pozo-Antonio et al. [67] stained mortar surfaces with real diesel exhaust soot collected from car exhaust pipes. They did not observe relevant color changes with the naked eye after 30 days of exposure to different experimental conditions (UV-A, artificial sunlight and UV-A in an SO2 atmosphere). However, a self-cleaning effect was noticed, thanks to analytical techniques such as color spectrophotometry. Smits et al. [29] also investigated the degradation of soot via photocatalysis on mortar samples coated with various TiO2-based commercial products. They quantified the photocatalytic soot removal via optical detection methods based on the changes in color.
It is difficult to draw relevant conclusions on the influence of the coating on the color change of the stain using visual observations alone. Further experimental results are presented in Figure 6. The global color changes Δ E * (measurements were carried out before and after the self-cleaning test) are reported for both the coated and uncoated sides of the samples in Figure 6a–c for Congo red dye, motor oil and diesel soot, respectively. It can be seen that the color of the stains changed even if the surface was not coated with a photocatalytic product (right side of the mortar sample). The greatest change was observed for the Congo red dye (cf. Figure 6a) and the smallest for the soot (cf. Figure 6c): the average values of Δ E * on the right side of the sample were 14.60, 6.36 and 2.44 for the Congo red, motor oil and soot, respectively. These changes can be explained by the combined action of light and water during the test, which tended to clean the surface. This is especially true for azo dyes such as Congo red, which are water soluble and can react with light. The hydrophilicity of the stain and its more or less pronounced dilution in water during washing cycles could also be a reasonable explanation.
The color changes observed on the left side (coated with a photocatalytic dispersion) were mostly higher that the ones obtained on the right side of the samples. The highest color changes were obtained with Product 4 for Congo red dye and soot, and with Product 2 for motor oil: the Δ E * values were 21.55, 6.13 and 11.28, respectively. The color changes observed on the left side of the samples could be explained by three phenomena: the self-cleaning potential of the product applied to the surface, the degradation of the stain by UV light, and the cleaning action of water running off the mortar surface. However, the self-cleaning action of each product could not be decorrelated from the other two phenomena: as the initial shape and intensity of a stain were not exactly the same on both sides of the samples, the stain color changes reported on the right side could not be deducted from the ones obtained on the left side.
The quantification of color variations through the calculation of Δ E * or the comparison of color characteristics in the CIELab space ( L *, a * and b *) before and after exposure to specific environmental conditions have often been used in the literature to follow the degradation of an artificial stain or the modification of the aesthetic appearance of a surface. Colangiuli et al. pointed out that TiO2-based products preserved the color properties of a coated surface from natural soot deposition. However, the color variations observed could not be attributed solely to the self-cleaning ability of the coating but also to the change in color of the organic host matrix [68]. Authors Lettieri et al. and Diamanti et al. also highlighted the influence of other external factors, such as the orientation of the sample, the surface roughness, or the exposure time, on the recorded color variations [69,70]. Van Hal et al. recently suggested a new methodology for detecting soot degradation based on digital image analysis. They were able to correct for the intrinsic color changes of the photocatalysts themselves during surface illumination throughout a self-cleaning experiment, and thus avoid misinterpretations of the degradation efficiency [71].
From the results of the present study, the following conclusions can be drawn: (1) It seems that the action of light and the washing were the main causes of the Congo red dye decoloration, except for Products 3 and 4, for which a self-cleaning activity could be identified. (2) Products 2, 3 and 5 may be more appropriate for cleaning a surface stained with a hydrophobic pollutant such as motor oil and. (3) Product 2 seems to be ineffective for degrading soot, which is an amphiphilic contaminant. Generally speaking, Product 3 proved to have a self-cleaning action against various kinds of pollutants—hydrophobic, hydrophilic and amphiphilic compounds—under UV, and Product 2 appeared more effective for cleaning hydrophobic pollutants.

3.3. Wettability of the Surfaces

Figure 7 shows the water droplet on the reference cement paste surface (clean surface) and on the surface coated with the photocatalytic dispersion based on Product 1 (cf. Figure 7a and Figure 7b, respectively). The variation in the WCA was clearly visible to the naked eye. The WCA values are summarized in Table 4. Results show that all the surfaces were hydrophilic, with WCA values less than 90°. The clean cement paste sample had good water wettability (WCA~70°), which was clearly increased with the application of the coating. The coated surfaces had WCA values varying between 9 and 20°; the lowest WCA was obtained with the coating based on ZnO. The hydrophilic state observed for the coated surfaces could be responsible for the self-cleaning effect (cf. Section 3.2 Stain Degradation Quantification) by promoting the runoff of water and thus the washing of the surface and removal of the stain. The key role of water was notably highlighted by Nishimoto et al. [72]. They investigated the cleaning efficiency of TiO2 surface contaminated with oleic acid under various UV irradiation and water flow conditions. By following the WCA evolution as a function of time during the experiments, these authors showed that the supply of flowing water significantly enhanced the self-cleaning effect of the TiO2 surface.
The assessment of surface wettability through WCA measurements has been common in research papers exploring the self-cleaning potential of surfaces. Most studies have reported initial and final WCA values, and several of them have followed WCA measurements over time and under UV light exposure to explore the kinetics of WCA evolution. This was conducted by Nishimoto et al. [72], as explained above, and also by Tobaldi et al. [73], who studied the self-cleaning and photocatalytic abilities of ceramic tiles functionalized with a micrometric TiO2 layer. They observed a decrease in the contact angle value after only one hour of UV irradiation. Moreover, they followed the decomposition of oleic acid on ceramic tile specimens through contact angle measurements in the dark and under UV-A exposure. They showed that the titania layer was capable of activating the decomposition of organic matter through photocatalytic action. Hashimoto et al. [74] also discussed the change in contact angle due to external stimuli on a TiO2 surface. They showed a rapid decrease in contact angle with exposure to UV light (from 30° to 10° only after 30 min) and its increase with storage in the dark. These authors notably pointed out that the high hydrophilic state of a TiO2 surface is explained not only by the photocatalytic oxidation mechanism but rather by a change, after UV irradiation, in the surface structure of TiO2 caused by an increase in the number of hydroxyl (OH) groups. The relationship between photocatalytic activity, hydrophilicity and self-cleaning was more specifically investigated by Guan [14]. He highlighted the important role of OH groups and showed that photocatalysis and hydrophilicity have a synergetic effect: the two mechanisms reinforce each other and allow the self-cleaning effect of a surface to be maintained for a longer time.
The authors of the present paper tended to assess the role of OH radicals in the hydrophilic state by measuring the WCA of coated cement paste surfaces after a 5 h heating step. Results are reported in Figure 8. The WCAs obtained after the heating period were higher, except for Product 3, for which the value did not change. These preliminary results seem to confirm the larger number of OH groups adsorbed on the surface due to hydrophilicity. The absence of variation in WCA for Product 3 could be explained by its formulation at basic pH (pH = 11), which seemed to preserve OH at the surface of semiconductor oxide even after heating. This effect was less pronounced for Product 4, formulated at a lower pH (pH = 8.5). The Products 1, 2 and 5 in powder form showed changes in WCA values, the greatest being for Product 1, which has the highest specific surface area (350 m2/g, 90 m2/g and 15–25 m2/g for Products 1, 2 and 5, respectively).

4. Conclusions

The research presented in this paper focused on the self-cleaning potential of various semiconductor oxide-based dispersions applied to mortar surfaces. Experiments were carried out at a lab scale using a specific test bench that allowed for the change in color to be followed for three stains—Congo red dye, diesel soot and motor oil—when applied to the surface of coated and uncoated mortar samples. These samples were subjected to a cycle of artificial light and water flow simulating weather conditions. The color difference was first assessed with visual inspection and then via spectrophotometry by measuring the color characteristics in the CIELab space at the beginning and at the end of the test. The results clearly showed that the azo dye Congo red was sensitive to light and water flow, as the stain faded from all the uncoated samples. The same was true for diesel soot and motor oil but to a lesser extent. The self-cleaning action of the tested products depended on the hydrophilic or hydrophobic character of the stain: Product 3 had a self-cleaning action with the three contaminants tested—hydrophobic (motor oil), hydrophilic (Congo red dye) and amphiphilic (diesel soot) compounds—under UV, and Product 2 appeared to be more effective for cleaning hydrophobic pollutants. In addition, the formulation of Product 3 and its high specific area (330 m2/g) may also have played an important role. WCA measurements showed that all the products led to a high surface wettability. The self-cleaning effect could be explained by the hydrophilic state (induced by the OH radicals) of the coated surfaces, which favored the runoff of water and thus the washing of the surface and removal of the stain. Assessing the self-cleaning potential of photocatalytic products remained a tricky task, notably because of the contribution of various phenomena (photolysis, effect of water and self-cleaning). Further real-world investigations should be carried out to assess the benefits of such products over time.

Author Contributions

Conceptualization, J.H. and E.R.; methodology, J.H. and K.C.L.; formal analysis, J.H. and K.C.L.; investigation, J.H. and K.C.L.; supervision, J.H. and E.R.; validation, J.H., K.C.L. and E.R.; writing—review and editing, J.H. and K.C.L. All authors have read and agreed to the published version of the manuscript.

Funding

This research received no external funding.

Data Availability Statement

The data presented in this study are available on request from the corresponding author.

Acknowledgments

The authors are grateful to Arnaud Reyrolle for his collaboration in this work, in particular his contribution to the carrying out of the experiments during his internship at the LMDC.

Conflicts of Interest

The authors declare no conflict of interest. Author Erick Ringot was co-manager of the company LRVision. The remaining authors declare that the research was conducted in the absence of any commercial or financial relationships that could be construed as a potential conflict of interest.

References

  1. Hamilton, R.; Crabbe, H. Environment, Pollution and Effects. In The Effects of Air Pollution on Cultural Heritage; Hamilton, R., Kucera, V., Tidblad, J., Watt, J., Eds.; Springer: Boston, MA, USA, 2009; pp. 1–27. ISBN 978-0-387-84893-8. [Google Scholar]
  2. Li, Z.; Zhang, H.; Wen, C.-Y.; Yang, A.-S.; Juan, Y.-H. The Effects of Lateral Entrainment on Pollutant Dispersion inside a Street Canyon and the Corresponding Optimal Urban Design Strategies. Build. Environ. 2021, 195, 107740. [Google Scholar] [CrossRef]
  3. Naidu, R.; Biswas, B.; Willett, I.R.; Cribb, J.; Kumar Singh, B.; Paul Nathanail, C.; Coulon, F.; Semple, K.T.; Jones, K.C.; Barclay, A.; et al. Chemical Pollution: A Growing Peril and Potential Catastrophic Risk to Humanity. Environ. Int. 2021, 156, 106616. [Google Scholar] [CrossRef] [PubMed]
  4. Vidal, F.; Vicente, R.; Mendes Silva, J. Review of Environmental and Air Pollution Impacts on Built Heritage: 10 Questions on Corrosion and Soiling Effects for Urban Intervention. J. Cult. Herit. 2019, 37, 273–295. [Google Scholar] [CrossRef]
  5. Barthlott, W.; Neinhuis, C. Purity of the Sacred Lotus, or Escape from Contamination in Biological Surfaces. Planta 1997, 202, 1–8. [Google Scholar] [CrossRef]
  6. Koch, K.; Ensikat, H.-J. The Hydrophobic Coatings of Plant Surfaces: Epicuticular Wax Crystals and Their Morphologies, Crystallinity and Molecular Self-Assembly. Micron 2008, 39, 759–772. [Google Scholar] [CrossRef]
  7. Yu, C.; Sasic, S.; Liu, K.; Salameh, S.; Ras, R.H.A.; van Ommen, J.R. Nature–Inspired Self–Cleaning Surfaces: Mechanisms, Modelling, and Manufacturing. Chem. Eng. Res. Des. 2020, 155, 48–65. [Google Scholar] [CrossRef]
  8. Li, W.; Amirfazli, A. Microtextured Superhydrophobic Surfaces: A Thermodynamic Analysis. Adv. Colloid Interface Sci. 2007, 132, 51–68. [Google Scholar] [CrossRef]
  9. Otitoju, T.A.; Ahmad, A.L.; Ooi, B.S. Superhydrophilic (Superwetting) Surfaces: A Review on Fabrication and Application. J. Ind. Eng. Chem. 2017, 47, 19–40. [Google Scholar] [CrossRef]
  10. Padmanabhan, N.T.; John, H. Titanium Dioxide Based Self-Cleaning Smart Surfaces: A Short Review. J. Environ. Chem. Eng. 2020, 8, 104211. [Google Scholar] [CrossRef]
  11. Wei, Y.; Wu, Q.; Meng, H.; Zhang, Y.; Cao, C. Recent advances in photocatalytic self-cleaning performances of TiO2-based building materials. RSC Adv. 2023, 13, 20584–20597. [Google Scholar] [CrossRef]
  12. Fujishima, A.; Zhang, X.; Tryk, D.A. TiO2 Photocatalysis and Related Surface Phenomena. Surf. Sci. Rep. 2008, 63, 515–582. [Google Scholar] [CrossRef]
  13. Zhang, L.; Dillert, R.; Bahnemann, D.; Vormoor, M. Photo-Induced Hydrophilicity and Self-Cleaning: Models and Reality. Energy Environ. Sci. 2012, 5, 7491–7507. [Google Scholar] [CrossRef]
  14. Guan, K. Relationship between Photocatalytic Activity, Hydrophilicity and Self-Cleaning Effect of TiO2/SiO2 Films. Surf. Coat. Technol. 2005, 191, 155–160. [Google Scholar] [CrossRef]
  15. Liao, G.; Yao, W.; She, A. Enhanced Self-Cleaning Capacity of RBP@TiO2 Based Building Coating: Synergetic Effect of Photocatalysis and Photo-Induced Superhydrophilicity. Constr. Build. Mater. 2023, 388, 131699. [Google Scholar] [CrossRef]
  16. Li, F.; Liu, G.; Liu, F.; Yang, S. A Review of Self-Cleaning Photocatalytic Surface: Effect of Surface Characteristics on Photocatalytic Activity for NO. Environ. Pollut. 2023, 327, 121580. [Google Scholar] [CrossRef] [PubMed]
  17. Gholami, Z.; Jalilisadrabad, S.; Amrollahi, R. Investigating the Impact of Using Modified Cool Materials by Titanium Dioxide (TiO2)-Based Photocatalytic Self-Cleaning Nanoparticles in Urban Facades on Urban Microclimate Parameters. Case Stud. Constr. Mater. 2023, 19, e02268. [Google Scholar] [CrossRef]
  18. Banerjee, S.; Dionysiou, D.D.; Pillai, S.C. Self-Cleaning Applications of TiO2 by Photo-Induced Hydrophilicity and Photocatalysis. Appl. Catal. B Environ. 2015, 176–177, 396–428. [Google Scholar] [CrossRef]
  19. Guo, M.-Z.; Maury-Ramirez, A.; Poon, C.S. Self-Cleaning Ability of Titanium Dioxide Clear Paint Coated Architectural Mortar and Its Potential in Field Application. J. Clean. Prod. 2016, 112, 3583–3588. [Google Scholar] [CrossRef]
  20. Fujishima, A.; Rao, T.N.; Tryk, D.A. Titanium Dioxide Photocatalysis. J. Photochem. Photobiol. C Photochem. Rev. 2000, 1, 1–21. [Google Scholar] [CrossRef]
  21. Fujishima, A.; Zhang, X. Titanium Dioxide Photocatalysis: Present Situation and Future Approaches. Comptes Rendus Chim. 2006, 9, 750–760. [Google Scholar] [CrossRef]
  22. Haider, A.J.; Jameel, Z.N.; Al-Hussaini, I.H.M. Review on: Titanium Dioxide Applications. Energy Procedia 2019, 157, 17–29. [Google Scholar] [CrossRef]
  23. Qin, Y.; Li, H.; Lu, J.; Meng, F.; Ma, C.; Yan, Y.; Meng, M. Nitrogen-doped hydrogenated TiO2 modified with CdS nanorods with enhanced optical absorption, charge separation and photocatalytic hydrogen evolution. Chem. Eng. J. 2020, 384, 123275. [Google Scholar] [CrossRef]
  24. Ma, J.; Zhang, L.; Fan, Z.; Sun, S.; Feng, Z.; Li, W.; Ding, H. Construction of R-TiO2/n-TiO2 heterophase photocatalysts for efficient degradation of organic pollutants. J. Alloys Compd. 2023, 968, 172127. [Google Scholar] [CrossRef]
  25. Cassar, L. Photocatalysis of Cementitious Materials: Clean Buildings and Clean Air. MRS Bull. 2004, 29, 328–331. [Google Scholar] [CrossRef]
  26. Pacheco-Torgal, F.; Jalali, S. Nanotechnology: Advantages and Drawbacks in the Field of Construction and Building Materials. Constr. Build. Mater. 2011, 25, 582–590. [Google Scholar] [CrossRef]
  27. Folli, A.; Campbell, S.B.; Anderson, J.A.; Macphee, D.E. Role of TiO2 Surface Hydration on NO Oxidation Photo-Activity. J. Photochem. Photobiol. Chem. 2011, 220, 85–93. [Google Scholar] [CrossRef]
  28. Jimenez-Relinque, E.; Rodriguez-Garcia, J.R.; Castillo, A.; Castellote, M. Characteristics and Efficiency of Photocatalytic Cementitious Materials: Type of Binder, Roughness and Microstructure. Cem. Concr. Res. 2015, 71, 124–131. [Google Scholar] [CrossRef]
  29. Smits, M.; Chan, C.; Tytgat, T.; Craeye, B.; Costarramone, N.; Lacombe, S.; Lenaerts, S. Photocatalytic Degradation of Soot Deposition: Self-Cleaning Effect on Titanium Dioxide Coated Cementitious Materials. Chem. Eng. J. 2013, 222, 411–418. [Google Scholar] [CrossRef]
  30. Cedillo-González, E.I.; Riccò, R.; Montorsi, M.; Montorsi, M.; Falcaro, P.; Siligardi, C. Self-Cleaning Glass Prepared from a Commercial TiO2 Nano-Dispersion and Its Photocatalytic Performance under Common Anthropogenic and Atmospheric Factors. Build. Environ. 2014, 71, 7–14. [Google Scholar] [CrossRef]
  31. Andaloro, A.; Mazzucchelli, E.S.; Lucchini, A.; Pedeferri, M.P. Photocatalytic Self-Cleaning Coatings for Building Facade Maintenance. Performance Analysis through A&nbsp;Case-Study Application. J. Facade Des. Eng. 2016, 4, 115–129. [Google Scholar] [CrossRef]
  32. Da Silva, A.L.; Dondi, M.; Raimondo, M.; Hotza, D. Photocatalytic Ceramic Tiles: Challenges and Technological Solutions. J. Eur. Ceram. Soc. 2018, 38, 1002–1017. [Google Scholar] [CrossRef]
  33. Rocha Segundo, I.; Ferreira, C.; Freitas, E.F.; Carneiro, J.O.; Fernandes, F.; Júnior, S.L.; Costa, M.F. Assessment of Photocatalytic, Superhydrophobic and Self-Cleaning Properties on Hot Mix Asphalts Coated with TiO2 and/or ZnO Aqueous Solutions. Constr. Build. Mater. 2018, 166, 500–509. [Google Scholar] [CrossRef]
  34. Quagliarini, E.; Bondioli, F.; Goffredo, G.B.; Cordoni, C.; Munafò, P. Self-Cleaning and de-Polluting Stone Surfaces: TiO2 Nanoparticles for Limestone. Constr. Build. Mater. 2012, 37, 51–57. [Google Scholar] [CrossRef]
  35. Quagliarini, E.; Bondioli, F.; Goffredo, G.B.; Licciulli, A.; Munafò, P. Self-Cleaning Materials on Architectural Heritage: Compatibility of Photo-Induced Hydrophilicity of TiO2 Coatings on Stone Surfaces. J. Cult. Herit. 2013, 14, 1–7. [Google Scholar] [CrossRef]
  36. Graziani, L.; Quagliarini, E.; Bondioli, F.; D’Orazio, M. Durability of Self-Cleaning TiO2 Coatings on Fired Clay Brick Façades: Effects of UV Exposure and Wet & Dry Cycles. Build. Environ. 2014, 71, 193–203. [Google Scholar] [CrossRef]
  37. Munafò, P.; Goffredo, G.B.; Quagliarini, E. TiO2-Based Nanocoatings for Preserving Architectural Stone Surfaces: An Overview. Constr. Build. Mater. 2015, 84, 201–218. [Google Scholar] [CrossRef]
  38. Youssef, Z.; Colombeau, L.; Yesmurzayeva, N.; Baros, F.; Vanderesse, R.; Hamieh, T.; Toufaily, J.; Frochot, C.; Roques-Carmes, T.; Acherar, S. Dye-Sensitized Nanoparticles for Heterogeneous Photocatalysis: Cases Studies with TiO2, ZnO, Fullerene and Graphene for Water Purification. Dyes Pigments 2018, 159, 49–71. [Google Scholar] [CrossRef]
  39. Wetchakun, K.; Wetchakun, N.; Sakulsermsuk, S. An Overview of Solar/Visible Light-Driven Heterogeneous Photocatalysis for Water Purification: TiO2- and ZnO-Based Photocatalysts Used in Suspension Photoreactors. J. Ind. Eng. Chem. 2019, 71, 19–49. [Google Scholar] [CrossRef]
  40. Warren, B.E. X-ray Diffraction; Courier Corporation: Chelmsford, MA, USA, 1990; ISBN 978-0-486-66317-3. [Google Scholar]
  41. Narayan, H.; Alemu, H.; Macheli, L.; Sekota, M.; Thakurdesai, M.; Gundu Rao, T.K. Role of Particle Size in Visible Light Photocatalysis of Congo Red Using TiO2·[ZnFe2O4]x Nanocomposites. Bull. Mater. Sci. 2009, 32, 499–506. [Google Scholar] [CrossRef]
  42. Ohno, T.; Sarukawa, K.; Tokieda, K.; Matsumura, M. Morphology of a TiO2 Photocatalyst (Degussa, P-25) Consisting of Anatase and Rutile Crystalline Phases. J. Catal. 2001, 203, 82–86. [Google Scholar] [CrossRef]
  43. Teh, C.M.; Mohamed, A.R. Roles of Titanium Dioxide and Ion-Doped Titanium Dioxide on Photocatalytic Degradation of Organic Pollutants (Phenolic Compounds and Dyes) in Aqueous Solutions: A Review. J. Alloys Compd. 2011, 509, 1648–1660. [Google Scholar] [CrossRef]
  44. Luttrell, T.; Halpegamage, S.; Tao, J.; Kramer, A.; Sutter, E.; Batzill, M. Why Is Anatase a Better Photocatalyst than Rutile—Model Studies on Epitaxial TiO2 Films. Sci. Rep. 2014, 4, 4043. [Google Scholar] [CrossRef] [PubMed]
  45. Zhang, J.; Zhou, P.; Liu, J.; Yu, J. New Understanding of the Difference of Photocatalytic Activity among Anatase, Rutile and Brookite TiO2. Phys. Chem. Chem. Phys. 2014, 16, 20382–20386. [Google Scholar] [CrossRef]
  46. Holm, A.; Hamandi, M.; Simonet, F.; Jouguet, B.; Dappozze, F.; Guillard, C. Impact of Rutile and Anatase Phase on the Photocatalytic Decomposition of Lactic Acid. Appl. Catal. B Environ. 2019, 253, 96–104. [Google Scholar] [CrossRef]
  47. Katal, R.; Masudy-Panah, S.; Tanhaei, M.; Farahani, M.H.D.A.; Jiangyong, H. A Review on the Synthesis of the Various Types of Anatase TiO2 Facets and Their Applications for Photocatalysis. Chem. Eng. J. 2020, 384, 123384. [Google Scholar] [CrossRef]
  48. Qiu, R.; Zhang, D.; Mo, Y.; Song, L.; Brewer, E.; Huang, X.; Xiong, Y. Photocatalytic Activity of Polymer-Modified ZnO under Visible Light Irradiation. J. Hazard. Mater. 2008, 156, 80–85. [Google Scholar] [CrossRef]
  49. Ong, C.B.; Ng, L.Y.; Mohammad, A.W. A Review of ZnO Nanoparticles as Solar Photocatalysts: Synthesis, Mechanisms and Applications. Renew. Sustain. Energy Rev. 2018, 81, 536–551. [Google Scholar] [CrossRef]
  50. Al-Fori, M.; Dobretsov, S.; Myint, M.T.Z.; Dutta, J. Antifouling Properties of Zinc Oxide Nanorod Coatings. Biofouling 2014, 30, 871–882. [Google Scholar] [CrossRef]
  51. Valenzuela, L.; Iglesias, A.; Faraldos, M.; Bahamonde, A.; Rosal, R. Antimicrobial Surfaces with Self-Cleaning Properties Functionalized by Photocatalytic ZnO Electrosprayed Coatings. J. Hazard. Mater. 2019, 369, 665–673. [Google Scholar] [CrossRef]
  52. Dyshlyuk, L.; Babich, O.; Ivanova, S.; Vasilchenco, N.; Atuchin, V.; Korolkov, I.; Russakov, D.; Prosekov, A. Antimicrobial Potential of ZnO, TiO2 and SiO2 Nanoparticles in Protecting Building Materials from Biodegradation. Int. Biodeterior. Biodegrad. 2020, 146, 104821. [Google Scholar] [CrossRef]
  53. Chinnasamy, M.; Balasubramanian, K. Enhanced UV Photodetection Behavior of Cr Doped Wurtzite ZnO Crystalline Nanorods. Opt. Mater. 2020, 110, 110492. [Google Scholar] [CrossRef]
  54. Bianchi, C.L.; Gatto, S.; Pirola, C.; Naldoni, A.; Di Michele, A.; Cerrato, G.; Crocellà, V.; Capucci, V. Photocatalytic Degradation of Acetone, Acetaldehyde and Toluene in Gas-Phase: Comparison between Nano and Micro-Sized TiO2. Appl. Catal. B Environ. 2014, 146, 123–130. [Google Scholar] [CrossRef]
  55. Allen, N.S.; Mahdjoub, N.; Vishnyakov, V.; Kelly, P.J.; Kriek, R.J. The Effect of Crystalline Phase (Anatase, Brookite and Rutile) and Size on the Photocatalytic Activity of Calcined Polymorphic Titanium Dioxide (TiO2). Polym. Degrad. Stab. 2018, 150, 31–36. [Google Scholar] [CrossRef]
  56. Lachheb, H.; Puzenat, E.; Houas, A.; Ksibi, M.; Elaloui, E.; Guillard, C.; Herrmann, J.-M. Photocatalytic Degradation of Various Types of Dyes (Alizarin S, Crocein Orange G, Methyl Red, Congo Red, Methylene Blue) in Water by UV-Irradiated Titania. Appl. Catal. B Environ. 2002, 39, 75–90. [Google Scholar] [CrossRef]
  57. Wahi, R.K.; Yu, W.W.; Liu, Y.; Mejia, M.L.; Falkner, J.C.; Nolte, W.; Colvin, V.L. Photodegradation of Congo Red Catalyzed by Nanosized TiO2. J. Mol. Catal. Chem. 2005, 242, 48–56. [Google Scholar] [CrossRef]
  58. Khataee, A.R.; Kasiri, M.B. Photocatalytic Degradation of Organic Dyes in the Presence of Nanostructured Titanium Dioxide: Influence of the Chemical Structure of Dyes. J. Mol. Catal. Chem. 2010, 328, 8–26. [Google Scholar] [CrossRef]
  59. Werle, A.P.; de Souza, M.L.; Loh, K.; Ando, R.; John, V.M. The Performance of a Self-Cleaning Cool Cementitious Surface. Energy Build. 2016, 114, 200–205. [Google Scholar] [CrossRef]
  60. Patil, S.M.; Deshmukh, S.P.; More, K.V.; Shevale, V.B.; Mullani, S.B.; Dhodamani, A.G.; Delekar, S.D. Sulfated TiO2/WO3 Nanocomposite: An Efficient Photocatalyst for Degradation of Congo Red and Methyl Red Dyes under Visible Light Irradiation. Mater. Chem. Phys. 2019, 225, 247–255. [Google Scholar] [CrossRef]
  61. Sansiviero, M.T.C.; dos Santos, D.S.; Job, A.E.; Aroca, R.F. Layer by Layer TiO2 Thin Films and Photodegradation of Congo Red. J. Photochem. Photobiol. Chem. 2011, 220, 20–24. [Google Scholar] [CrossRef]
  62. Fahmi Khairol, N.; Sapawe, N.; Danish, M. Photocatalytic Study of ZnO-CuO/ES on Degradation of Congo Red. Mater. Today Proc. 2019, 19, 1333–1339. [Google Scholar] [CrossRef]
  63. Ibhadon, A.O.; Fitzpatrick, P. Heterogeneous Photocatalysis: Recent Advances and Applications. Catalysts 2013, 3, 189–218. [Google Scholar] [CrossRef]
  64. Rochkind, M.; Pasternak, S.; Paz, Y. Using Dyes for Evaluating Photocatalytic Properties: A Critical Review. Molecules 2015, 20, 88–110. [Google Scholar] [CrossRef]
  65. Smits, M.; Huygh, D.; Craeye, B.; Lenaerts, S. Effect of Process Parameters on the Photocatalytic Soot Degradation on Self-Cleaning Cementitious Materials. Catal. Today 2014, 230, 250–255. [Google Scholar] [CrossRef]
  66. Mills, A.; Wang, J.; Crow, M. Photocatalytic Oxidation of Soot by P25 TiO2 Films. Chemosphere 2006, 64, 1032–1035. [Google Scholar] [CrossRef] [PubMed]
  67. Pozo-Antonio, J.S.; Dionísio, A. Self-Cleaning Property of Mortars with TiO2 Addition Using Real Diesel Exhaust Soot. J. Clean. Prod. 2017, 161, 850–859. [Google Scholar] [CrossRef]
  68. Colangiuli, D.; Lettieri, M.; Masieri, M.; Calia, A. Field Study in an Urban Environment of Simultaneous Self-Cleaning and Hydrophobic Nanosized TiO2-Based Coatings on Stone for the Protection of Building Surface. Sci. Total Environ. 2019, 650, 2919–2930. [Google Scholar] [CrossRef] [PubMed]
  69. Lettieri, M.; Colangiuli, D.; Masieri, M.; Calia, A. Field Performances of Nanosized TiO2 Coated Limestone for a Self-Cleaning Building Surface in an Urban Environment. Build. Environ. 2019, 147, 506–516. [Google Scholar] [CrossRef]
  70. Diamanti, M.V.; Paolini, R.; Rossini, M.; Aslan, A.B.; Zinzi, M.; Poli, T.; Pedeferri, M.P. Long Term Self-Cleaning and Photocatalytic Performance of Anatase Added Mortars Exposed to the Urban Environment. Constr. Build. Mater. 2015, 96, 270–278. [Google Scholar] [CrossRef]
  71. Van Hal, M.; Lenaerts, S.; Verbruggen, S.W. Photocatalytic soot degradation under UV and visible light. Environ. Sci. Pollut. Res. 2023, 30, 22262–22272. [Google Scholar] [CrossRef]
  72. Nishimoto, S.; Tomoishi, S.; Kameshima, Y.; Fujii, E.; Miyake, M. Self-Cleaning Efficiency of Titanium Dioxide Surface under Simultaneous UV Irradiation of Various Intensities and Water Flow. J. Ceram. Soc. Jpn. 2014, 122, 513–516. [Google Scholar] [CrossRef]
  73. Tobaldi, D.M.; Graziani, L.; Seabra, M.P.; Hennetier, L.; Ferreira, P.; Quagliarini, E.; Labrincha, J.A. Functionalised Exposed Building Materials: Self-Cleaning, Photocatalytic and Biofouling Abilities. Ceram. Int. 2017, 43, 10316–10325. [Google Scholar] [CrossRef]
  74. Hashimoto, K.; Irie, H.; Fujishima, A. TiO2 Photocatalysis: A Historical Overview and Future Prospects. Jpn. J. Appl. Phys. 2005, 44, 8269. [Google Scholar] [CrossRef]
Figure 1. (a) Mortar surface treatment: reference surface on the right; coated surface on the left. The separation was carried out with an adhesive tape. (b) Mortar surface stained with Congo red dye (top), motor oil (middle) and diesel soot (bottom). The left hand side of the surface of each sample was coated with a photocatalytic dispersion: Product 1, Product 2, Product 3, Product 4 and Product 5, from left to right.
Photochem 03 00028 g001
Figure 2. Self-cleaning test bench.
Photochem 03 00028 g002
Figure 3. Schematic representation of hydrophobic and hydrophilic surfaces.
Photochem 03 00028 g003
Figure 4. Diffractograms of semiconductor oxide-based commercial products and peak indexing (ICSD): (a) Products 1 and 2 are TiO2 ultrafine powders, (b) Products 3 and 4 are aqueous dispersions of ultrafine TiO2 particles, from which powder was collected after a drying step, (c) Product 5 is a ZnO nanopowder.
Photochem 03 00028 g004
Figure 5. Mortar samples: (a) before self-cleaning experiment and (b) after self-cleaning experiment. The left side of the surface was coated with a photocatalytic dispersion: Product 1, Product 2, Product 3, Product 4 and Product 5, from left to right. The right side was uncoated.
Photochem 03 00028 g005
Figure 6. Global color changes Δ E * for each stain, obtained from spectrophotometry measurements: (a) Congo red dye, (b) motor oil and (c) soot. Colors of the stains before the self-cleaning experiment were taken as initial values, and the final color measurements were taken at the end of the experiment. Measurements were conducted on each side of a sample: the left side, which was coated with a photocatalytic product, and the right side, which was not coated.
Photochem 03 00028 g006
Figure 7. Water droplet on (a) uncoated cement paste surface (top) and (b) coated cement paste surface with the photocatalytic dispersion based on Product 1 (bottom).
Photochem 03 00028 g007
Figure 8. Water contact angles (WCA) measured on coated cement paste surfaces before and after a 5 h heating period.
Photochem 03 00028 g008
Table 1. Commercial photocatalytic products.
ProductDescriptionCrystal FormSpecific Surface Area (m2/g)
Product 1Ultrafine TiO2 powderAnatase at 85 wt%350
Product 2Ultrafine TiO2 powderAnatase at 95 wt%90
Product 3Aqueous dispersion of ultrafine TiO2 particles (pH = 11)Anatase at 18 wt%330
Product 4Aqueous dispersion of ultrafine TiO2 particles (pH = 8.5)Anatase at 10 wt%300
Product 5ZnO—Nanopowder < 100 nmWurtzite15–25
Table 2. Weather conditions applied to mortar samples at a lab scale and durations of resting period/UV light/water flow cycle.
Weather Conditions Simulated at Lab ScaleDuration (min)
Resting period 1
(no light, no water flow)
36
UV light60
Resting period 2
(no light, no water flow)
35
Water flow2
Table 3. Crystallite mean size determined using the Scherrer formula from the peak with the highest intensity.
ProductPosition of the Peak with the Highest Intensity
( 2 θ in Degrees)
Full Width at
Half-Maximum
(FWHM)
Crystallite Mean Size
( L in nm)
Product 125.3980.62912.7
Product 225.3150.11867.6
Product 325.3630.19740.6
Product 425.2240.35422.5
Product 536.2280.16365.7
Table 4. Water contact angle (WCA) results.
Surface TreatmentReference Cement PasteProduct 1Product 2Product 3Product 4Product 5
WCA (°)69.16 ± 1.412.26 ± 0.9414.38 ± 2.2415.17 ± 0.9218.32 ± 1.299.46 ± 0.73
Disclaimer/Publisher’s Note: The statements, opinions and data contained in all publications are solely those of the individual author(s) and contributor(s) and not of MDPI and/or the editor(s). MDPI and/or the editor(s) disclaim responsibility for any injury to people or property resulting from any ideas, methods, instructions or products referred to in the content.

