1. Introduction
Vitamin D
3 is a crucial nutrient for maintaining bone density [
1,
2,
3,
4] and regulating mood in humans [
5,
6]. It is a fat-soluble sterol that can be endogenously formed [
7,
8] or supplemented through a nutrient-rich diet [
9,
10]. Since a sufficient supply of vitamin D
3 can be synthesized with light alone to support physiological function, this disqualifies it as a proper vitamin by definition [
11]. In the human body, 7-dehydrocholesterol, also known as provitamin D
3 (Pro-D), is a necessary intermediate in the cholesterol biosynthesis pathway [
12] and its secondary use is as the primary vitamin D
3 precursor [
13]. Provitamin D
3 has a characteristic steroid base with a long alkyl chain (
Figure 1) that helps stabilize its presence in lipids [
14]. Lipids often depend on steroids to modulate their fluidity, and when a specific lipid bilayer requires structural support, steroids are sent to provide it, making lipids the primary region where Pro-D is found within human skin [
14,
15,
16]. The concentration of Pro-D within lipid bilayers of the stratum spinosum and stratum basale regions of the epidermis ranges between 20–100 μg/cm
2 of the lipid layer [
4]; however, the amount of Pro-D present in individuals can vary due to several factors, including age, diet, environment, and general lifestyle [
17,
18].
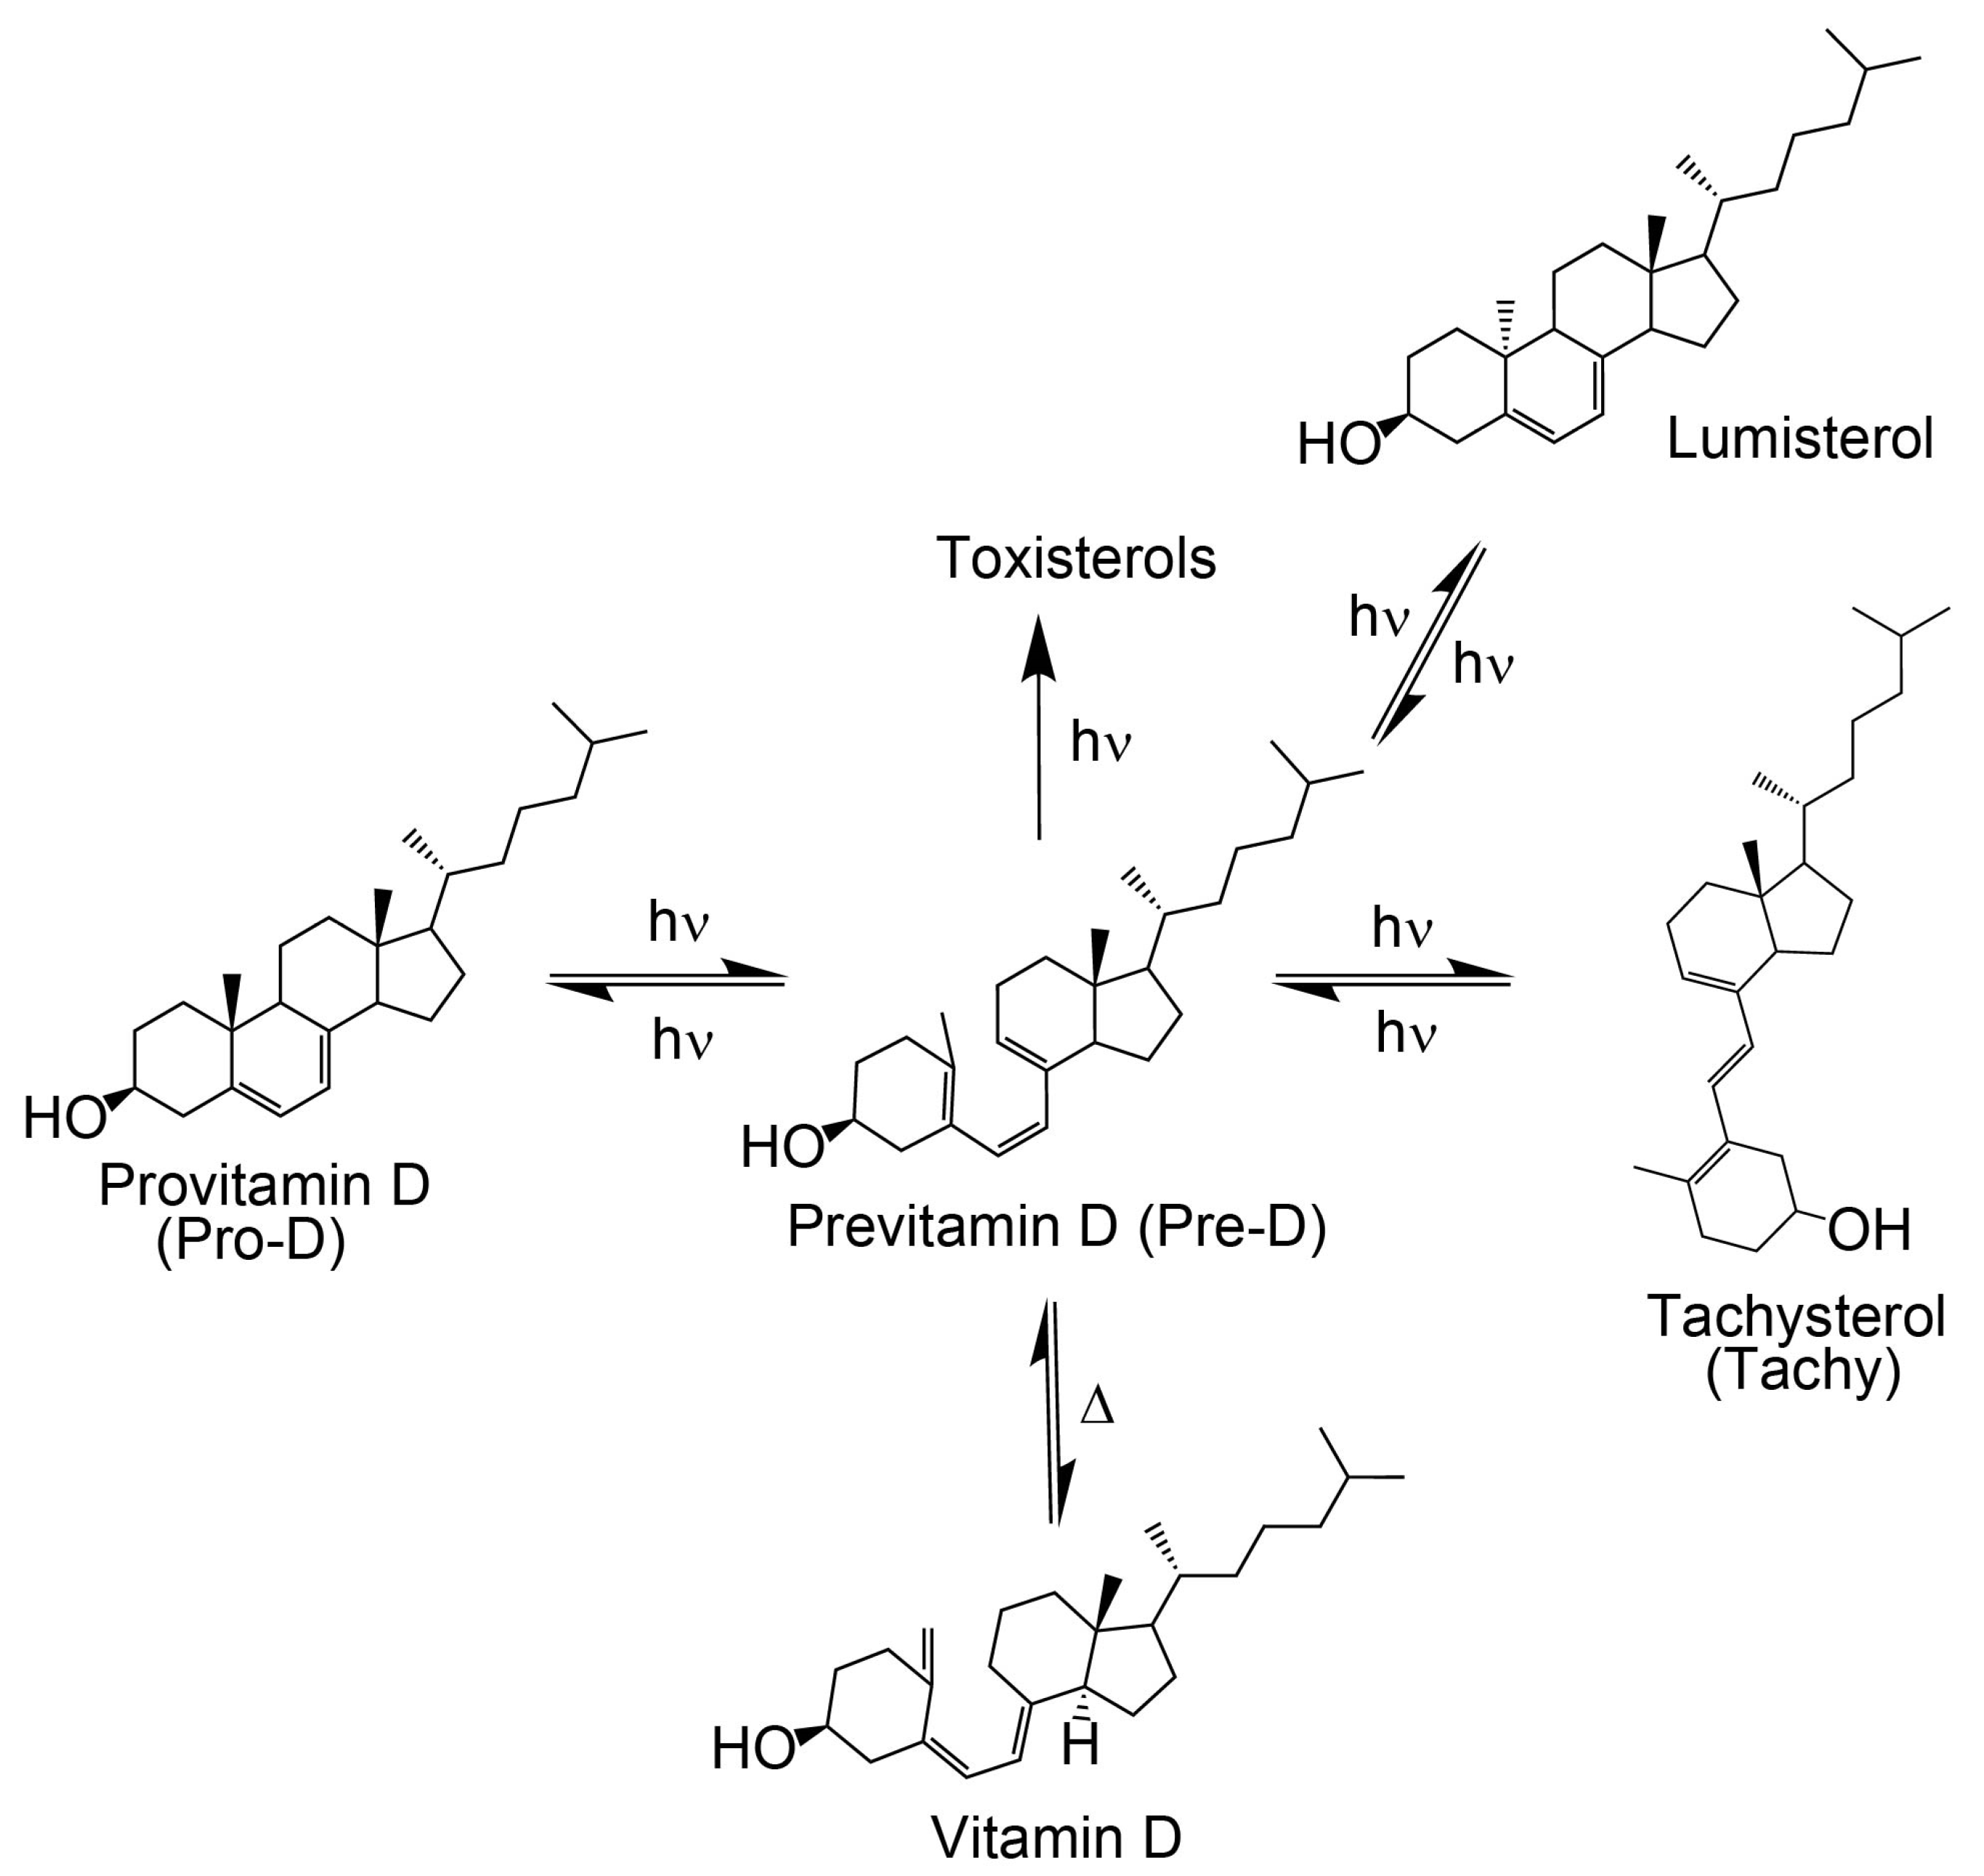
As shown in
Figure 1, the process of converting Pro-D to vitamin D
3 begins with exposure to UV light. The excited Pro-D, following a π→π* transition, rapidly undergoes photolytic ring opening at the cyclohexadiene chromophore, resulting in the formation of the metastable triene intermediate, previtamin D
3 (Pre-D) [
19,
20]. The near-ultrafast timescale for the photochemical ring-opening of Pro-D→Pre-D has been found to be 1–2 ps, according to ultrafast transient absorption and circular dichroism spectroscopy [
21,
22]. However, the decay of excited Pro-D is biexponential, with a seemingly parallel ~0.5 ps component associated with internal conversion to the ground state, resulting in a final fluorescence quantum yield of ~3 × 10
−4 [
21,
23]. It should be noted, however, that more recent transient absorption and high-level theoretical treatments of the excited-state dynamics have shown that the biexponential decay actually stems from nonequilibrium dynamics along the ring-opening coordinate where the excited population oscillates across the S
0/S
1 coupling region [
24,
25]. While these dynamics result in biexponential excited-state decay as measured in the experiment, the physical picture precludes the concept of two exclusive parallel pathways for ring-opening and internal conversion.
The photochemical Pre-D intermediate is considered a secosterol, which refers to a sterol backbone that has opened its ring, conferring significant conformational flexibility compared to its Pro-D counterpart. As such, following its rapid formation, it is prone to further thermal and photochemical isomerization reactions, resulting in a wide variety of tertiary structures, one of which is the desired vitamin D (
Figure 1) [
19,
20,
26]. The mechanisms for those reactions have been well studied and documented [
23,
27,
28,
29,
30]. Briefly, the initial Pre-D conformation following photolysis adopts a
gZg configuration (or
cZc in 2D) according to the relative orientations of the outer double bonds about the central double bond [
23,
30,
31]. The hot ground-state
gZg conformer then thermalizes into an equilibrium distribution of cooled
gZg and
tZg (following a nominally
cis→
trans isomerization about the first single bond), favoring the lower free energy
tZg conformer in solution [
17,
30,
32]. Notably, the dominant
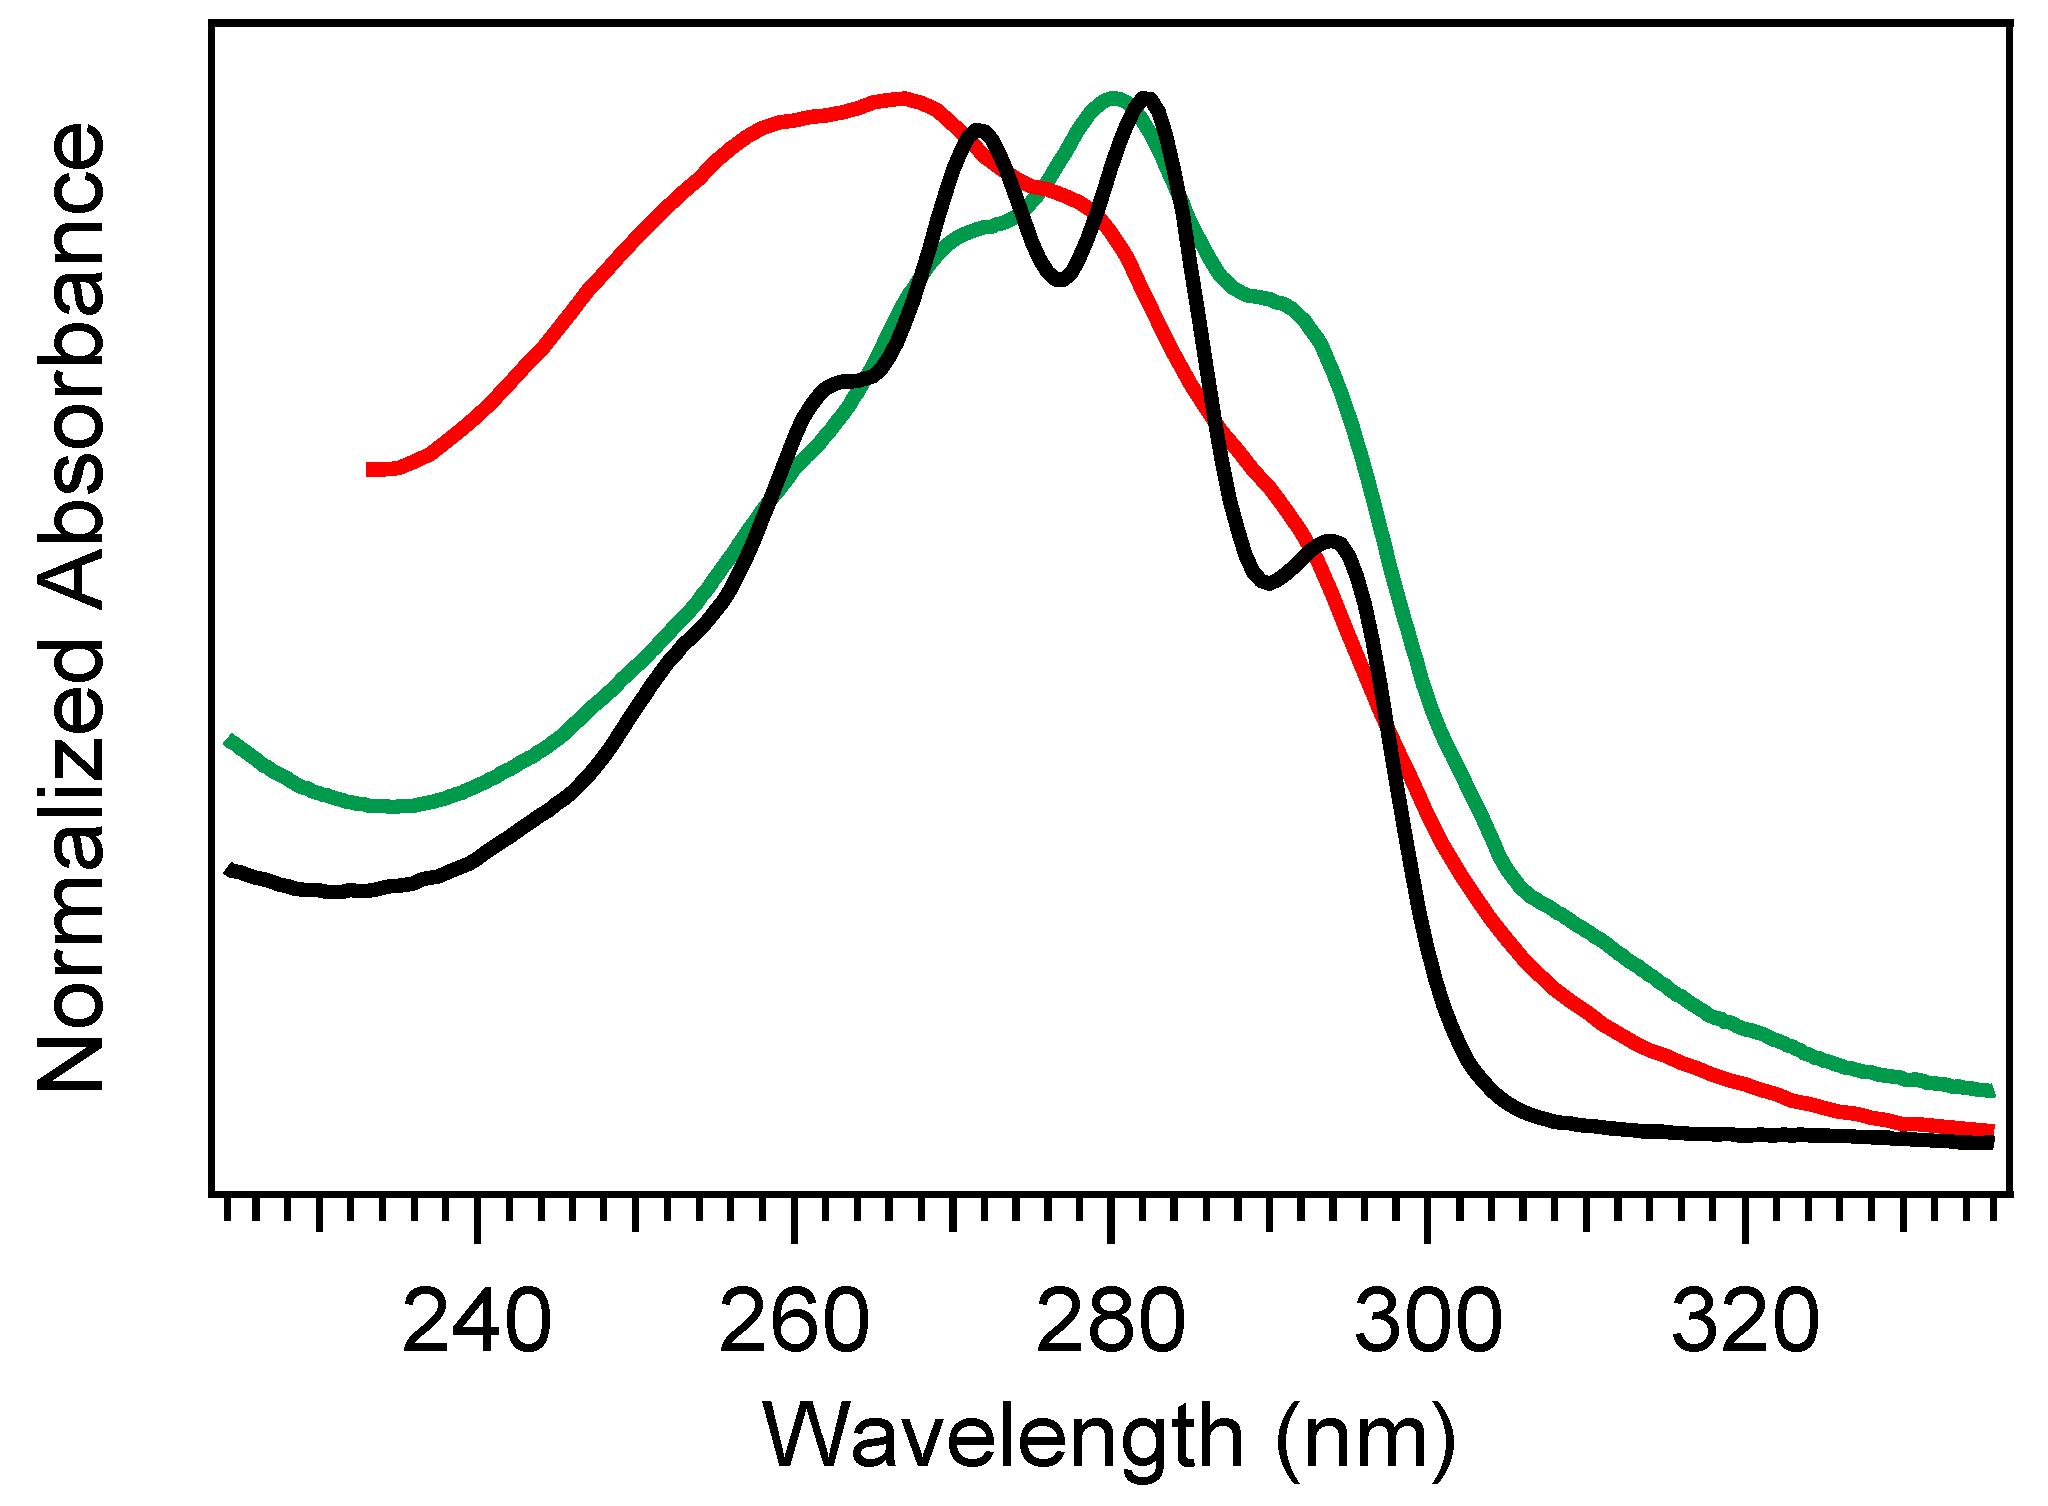
tZg-Pre-D absorbs blue of the Pro-D absorption spectrum (
Figure 2) with wavelengths shorter than 260 nm, while the
gZg conformer absorbs red around 300 nm [
17,
30,
31,
32]. Vitamin D is finally produced by the thermal rearrangement of the
gZg Pre-D conformer in vivo [
16,
33].
If the ground state Pre-D is continuously exposed to UV light, it is susceptible to further undesired photochemistry leading to lumisterol, toxisterols (irreversible), and the main photoproduct tachysterol (Tachy) [
19,
20,
28,
31].
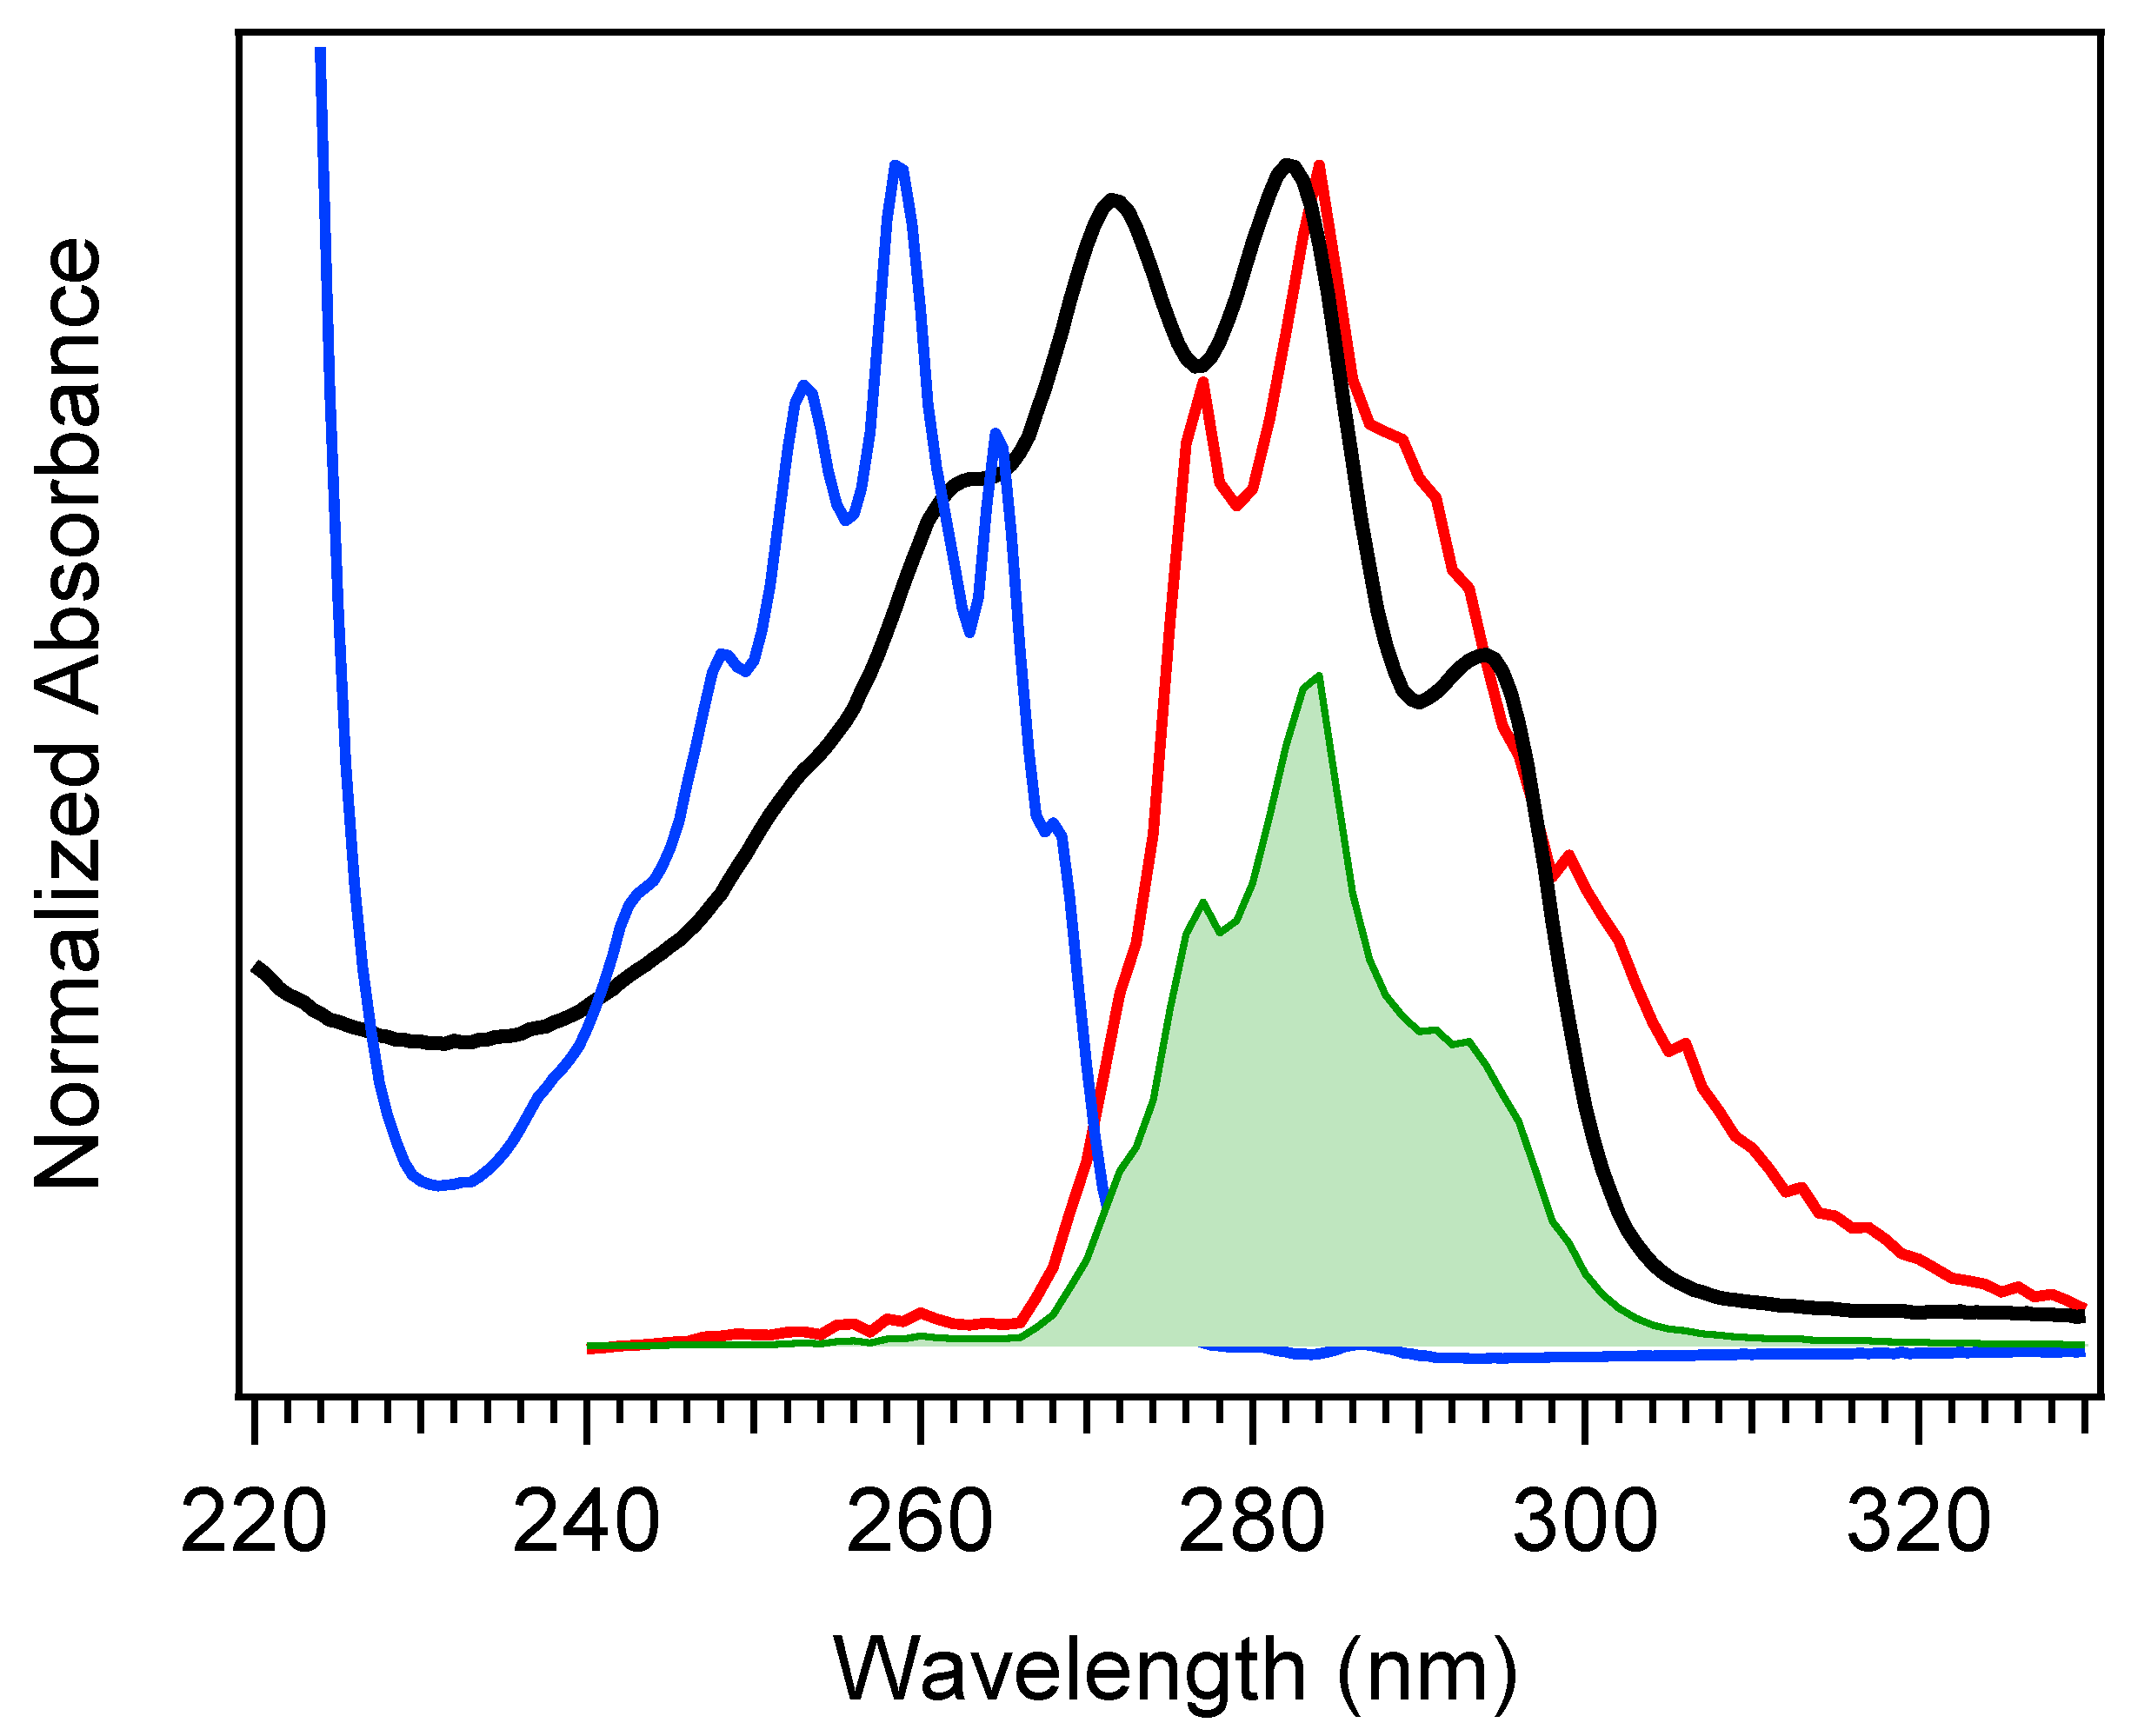
Figure 2 shows a comparison of absorption spectra for Pro-D, Pre-D, and Tachy in methanol. Extraction of the Pre-D spectrum in
Figure 2 was done by long-time exposure to 294 nm light, while Tachy was collected following long-time exposure to 258 nm. We note that, by comparison to other spectra recorded under similar conditions [
30,
32,
34], the Pre-D spectrum in the figure contains a trace population of lumisterol seen from the hint of structure underneath the otherwise broad Pre-D profile.
It has been found that Tachy preferentially accumulates from the tZg-Pre-D form due to less overlap of the tZg-Pre-D absorption spectrum with Tachy and Pro-D. This essentially traps a photostationary population of Tachy, while exposure wavelengths further red access the reverse reactions Tachy→Pre-D and Pre-D→Pro-D, which recycles the precursors and therefore maximizes equilibrium Pre-D formation. The reverse reactions leading to ring closure (Pro-D formation) at red wavelengths can be rationalized by the gZg absorption in that region, which poises the Pre-D triene optimally for reformation of the diene ring. Importantly, rearrangement to the desired vitamin D3 product from Pre-D is the only pathway not achieved photochemically—therefore, maximizing a steady-state population of Pre-D should also maximize final vitamin D3 production in vivo.
Taking these factors altogether, the broad, conformationally-heterogeneous Pre-D absorption spectrum along with the unique absorption spectra of secondary products leads to significant wavelength dependence in the photostationary populations of all species possible in the photochemical reaction. Norval et al. [
28] nicely summarized the wavelength dependence on quantum yields for the formation of each species by compiling results from several seminal works. As previously suggested, it is found that when Pro-D is illuminated at the blue edge of its S
0–S
1 absorption band, the steady-state concentration of Tachy is maximal, while the 290–300 nm region primarily favors Pre-D. Specifically, at 254 nm exposure, the Tachy/Pre-D fraction was found to be 3.6, while at 300 nm, it was 0.40 [
28]. Again, the yield dependence on wavelength can be rationalized by the conformational distribution of Pre-D and their absorption regions. With this in mind, several studies have investigated the effect of environment on the wavelength sensitivity to product yield. Interestingly, the reaction is very insensitive to solvent polarity, showing similar Pre-D formation kinetics and product branching in heptane and alcohols, for example. However, incorporation of Pro-D into other media such as liquid crystals [
31,
35], silica gel [
31,
36], and lipid bilayers [
32] was found to affect photostationary populations, more often inhibiting Tachy formation relative to Pre-D through conformational effects fostered by van der Waals interactions with the materials. These effects in vivo significantly enhance vitamin D
3 production, as it is believed that the
gZg-Pre-D form ultimately precedes thermal conversion to vitamin D
3 [
33,
37].
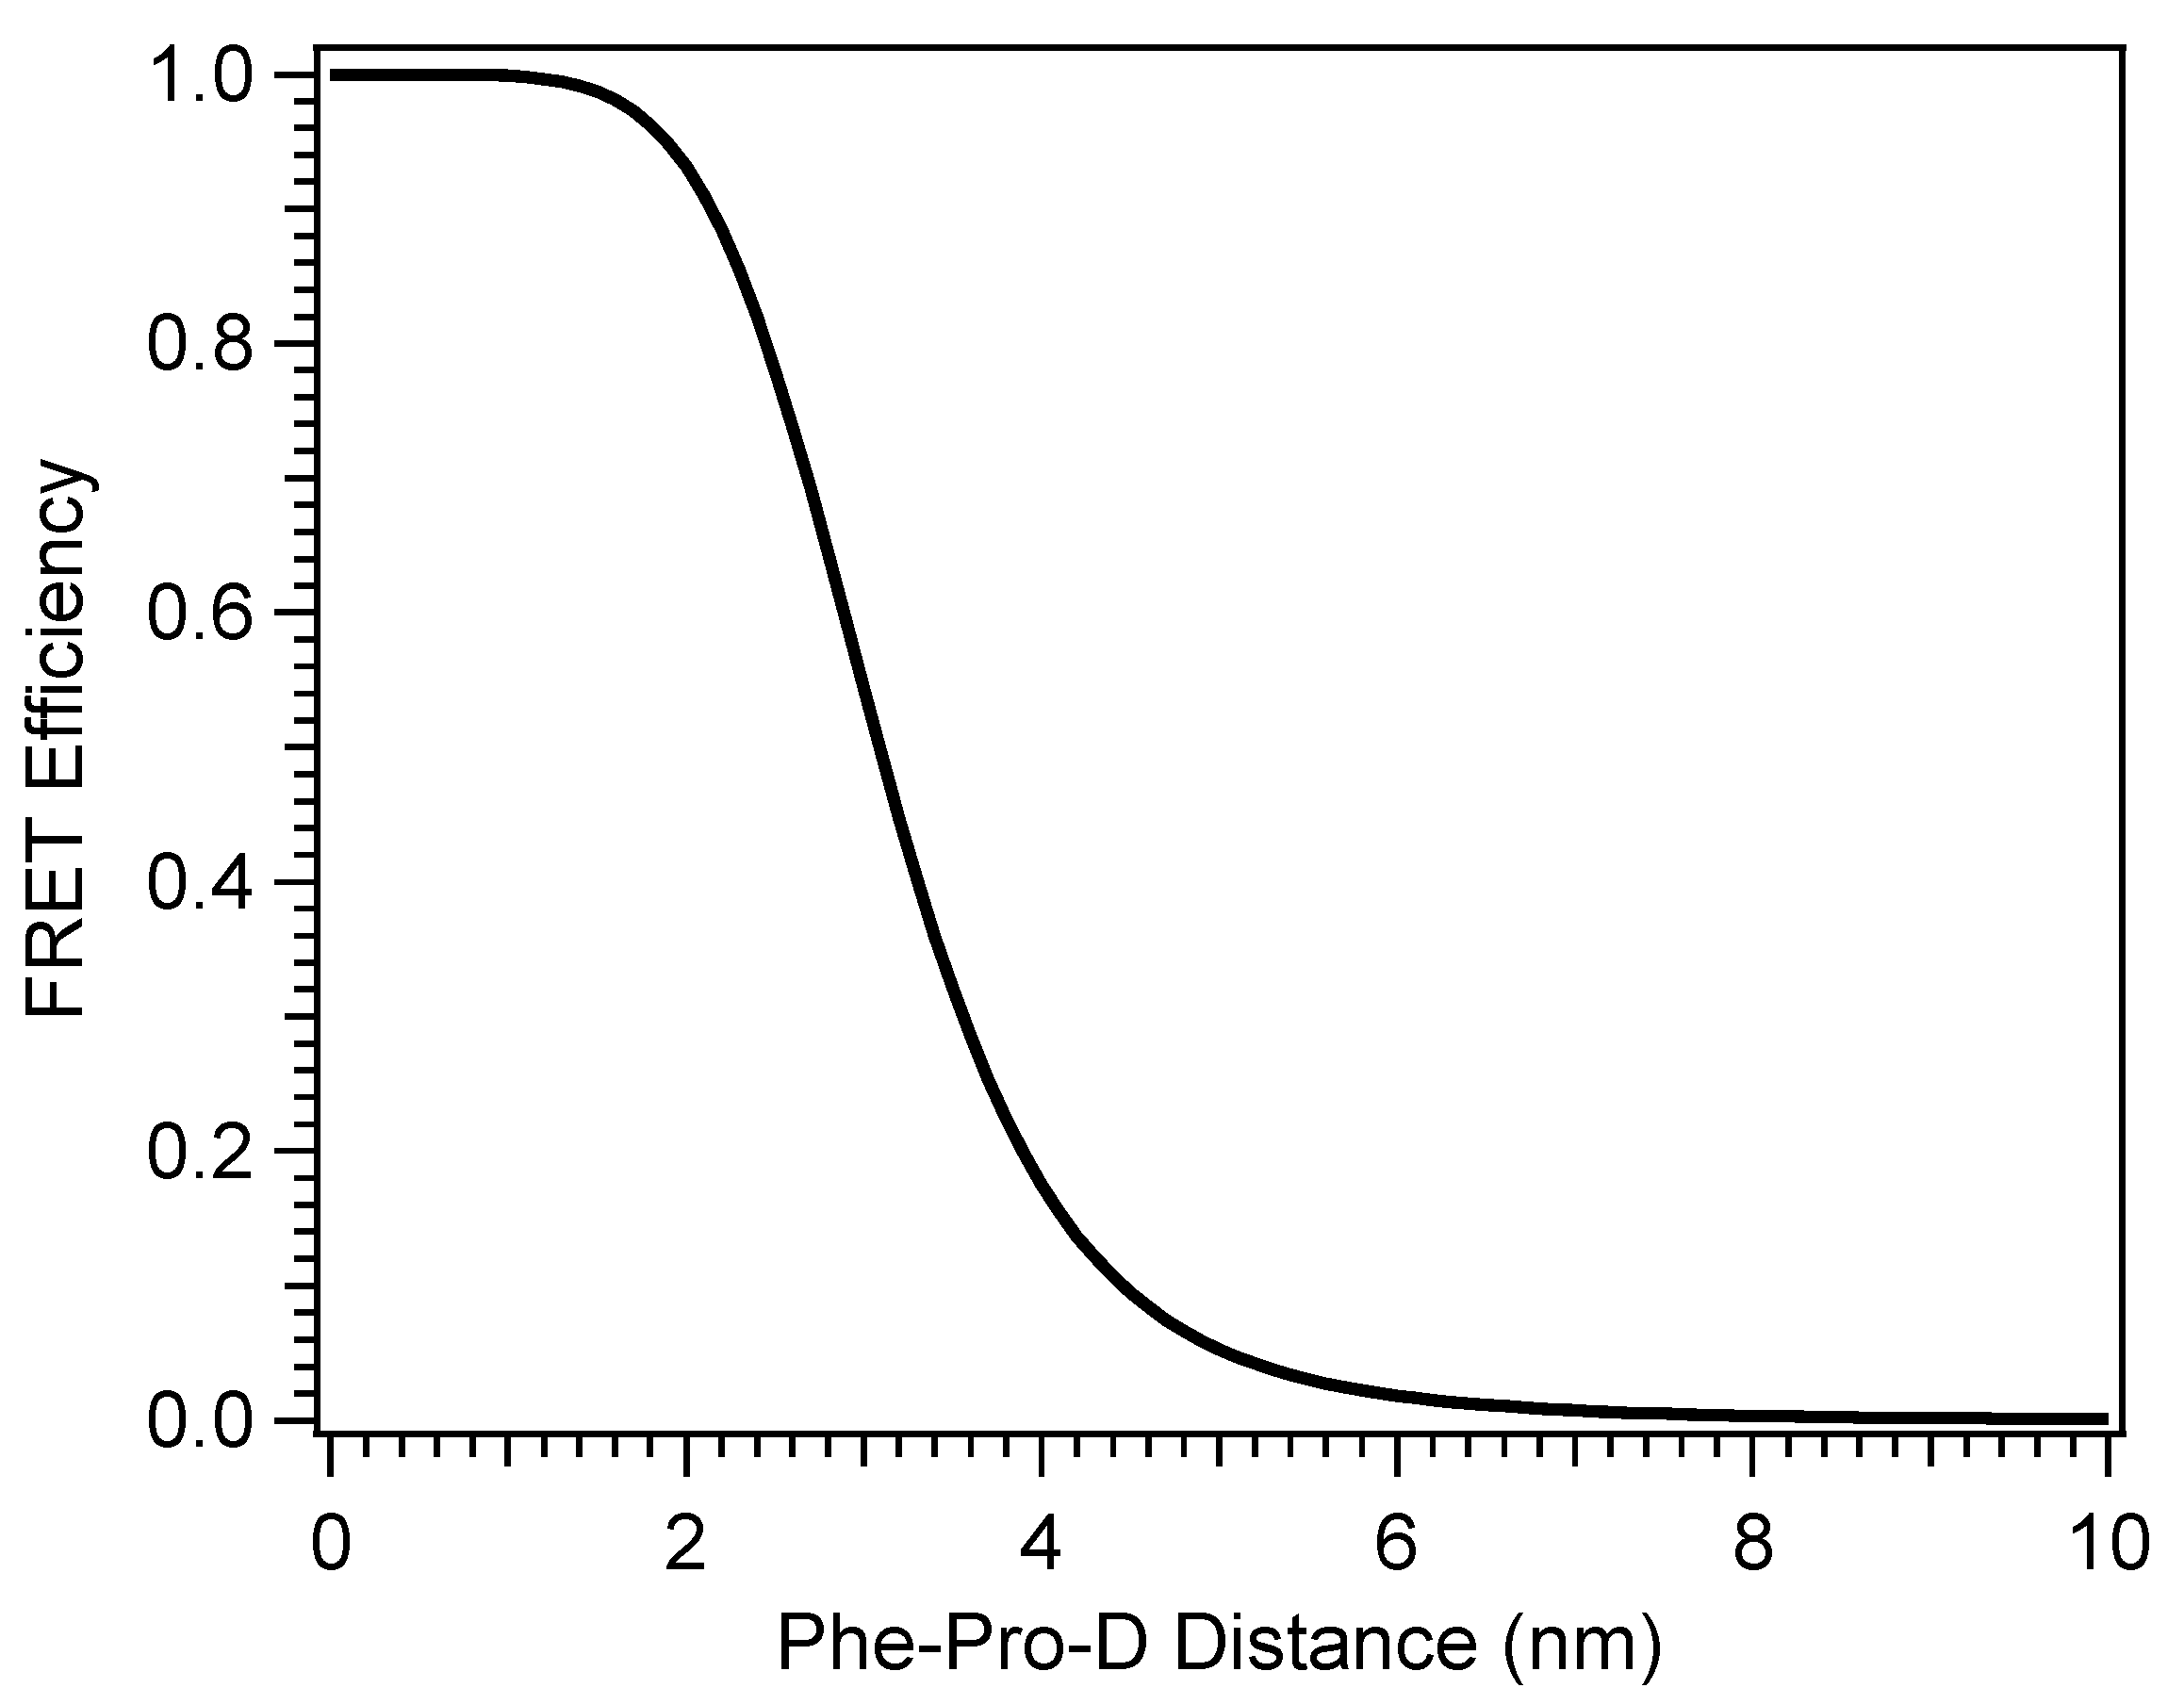
The conformationally-driven optimization of vitamin D production by explicit interactions with heterogeneous materials suggests then that aggregation of Pro-D by a single molecule in solution may similarly steer the product branching of its photochemistry and optimal Pre-D production, presuming the appropriate interaction(s). In addition, selection of a UVB chromophore as the aggregate partner could achieve a similar result by altering the action spectrum and potentially engaging in Fӧrster resonance energy transfer (FRET) with Pro-D as its energy acceptor. In this work, we aim to investigate these effects by comparing the spectral evolution of Pro-D with and without the presence of a FRET donor in solution. Further, the wavelength dependence of the photoconversion of Pro-D to time-dependent populations of Pre-D and Tachy is also compared in order to address the factors responsible for any changes in the photochemical mechanism due to the presence of the donor compound. By utilizing a single small molecule as the “substrate” for Pro-D, insights into the particular chemical driving forces that optimize vitamin D production in vivo can be closely examined. Namely, we seek to explore the following questions: (1) is the optimal condition for maximizing vitamin D production primarily restriction of the Pre-D conformation/flexibility? (2) Does screening shorter wavelengths of light by other UV absorbers help optimally steer Pre-D formation? (3) Can a FRET donor enhance efficiency of Pre-D formation by down-converting parasitic high energy UV light to excitation wavelengths which favor Pre-D?
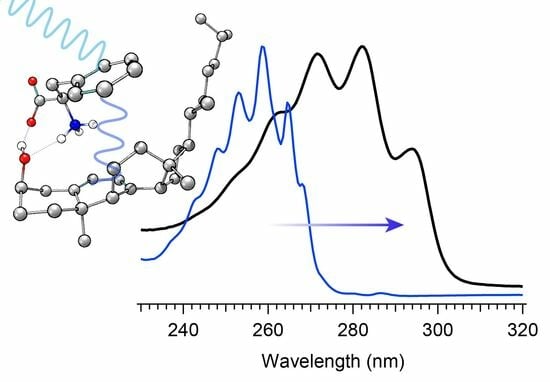
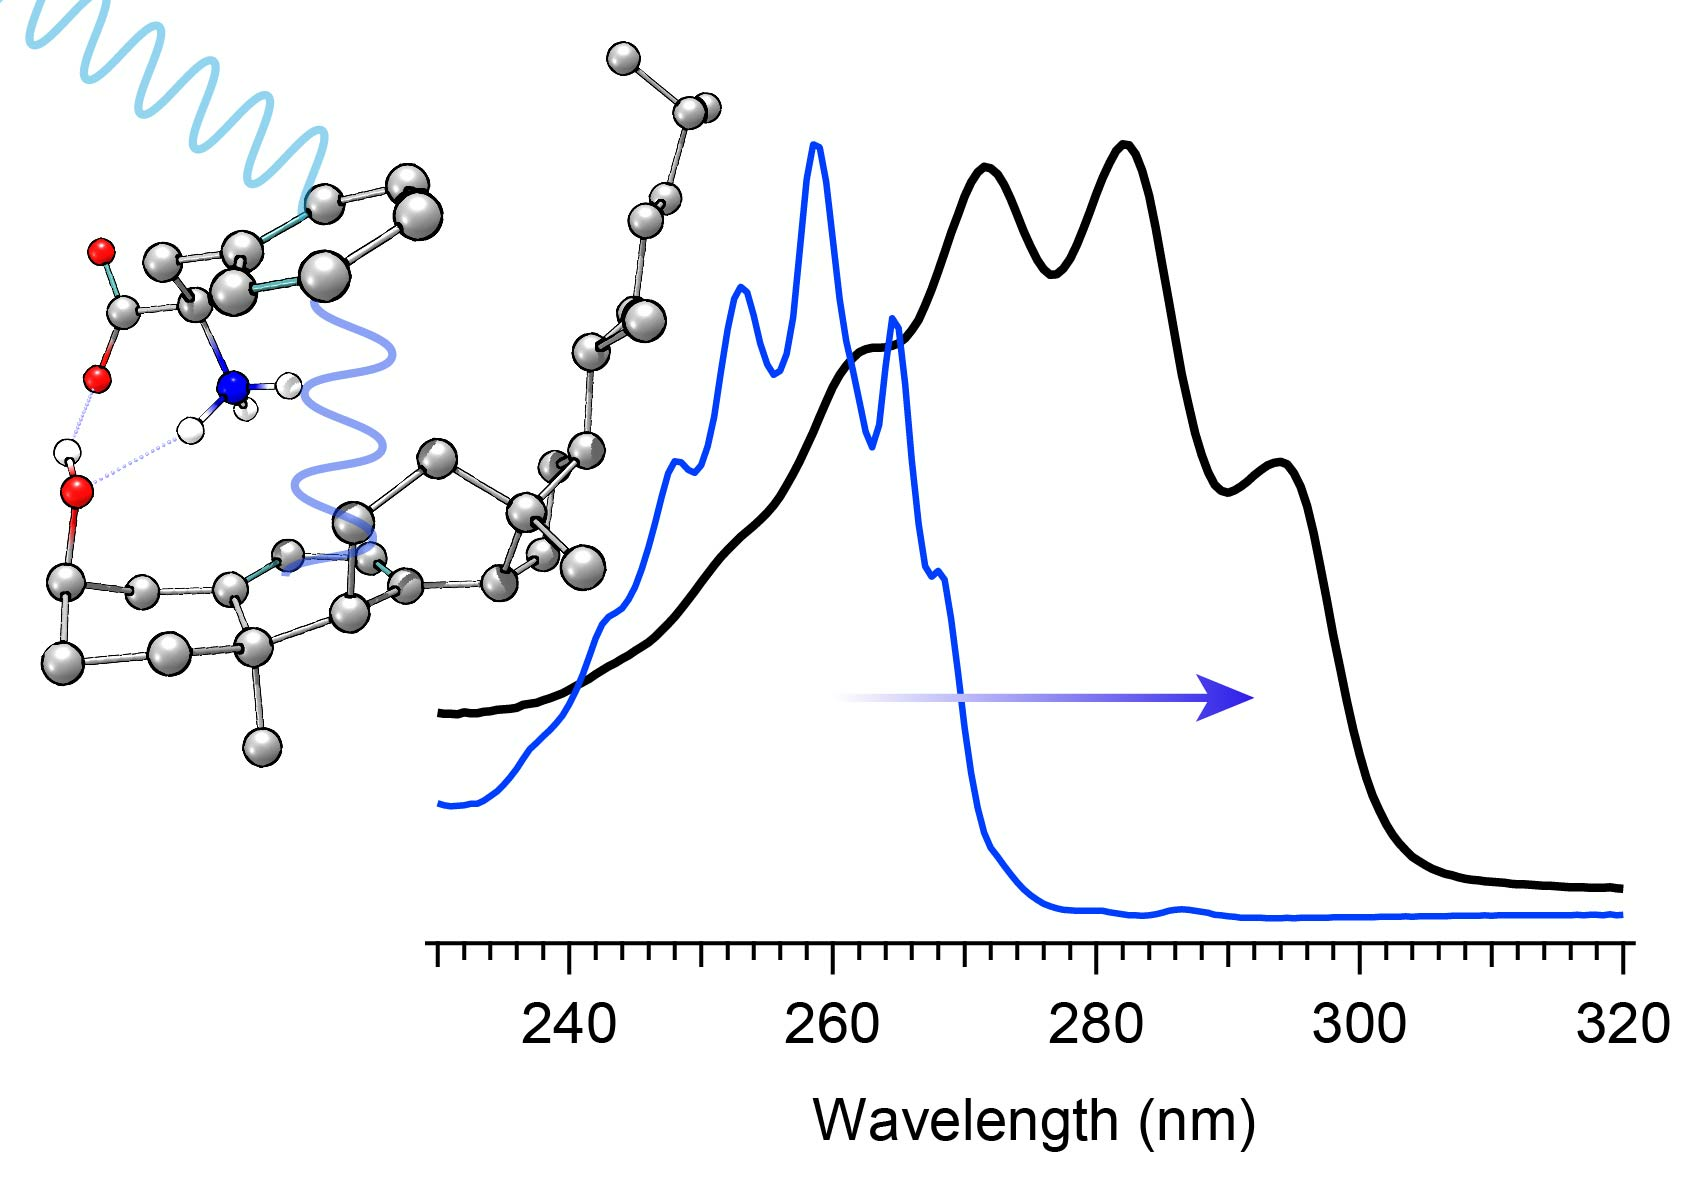
The selection of a binding partner must be made judiciously to satisfy several criteria that are compatible with Pro-D. Namely, structural properties must first be considered to generate the potential for binding in a well-dissolved solution, and secondly, the spectral characteristics should enable the capacity for FRET toward the Pro-D acceptor. Furthermore, the compound should be highly photostable in the region 220–320 nm. Here, we have chosen the natural amino acid phenylalanine (Phe) due to its similar solubility properties as Pro-D and its incorporation of a hydrogen bond donor and acceptor. In addition, the incorporation of a phenyl ring yields an absorption just blue of Pro-D peaking at 258 nm with a fluorescence spectrum that yields optimal overlap with the Pro-D absorption spectrum to ensure energy conservation in the FRET process (i.e., spectral overlap). To demonstrate this FRET compatibility, the Phe absorption (blue) and fluorescence (red) spectrum are shown in
Figure 3 against the Pro-D absorption spectrum (black) in methanol, along with the spectral overlap function (shaded green) plotted below. In
Figure 3, the spectral overlap function is notably found almost exclusively in the region overlapping the
gZg Pre-D absorption red of 260 nm. Finally, Phe is a ubiquitous natural amino acid and has many relevant physiological functions, including its role in anchoring proteins and enzymes to lipid bilayers. Such a case would bring the Phe residue within a protein in proximity to the Pro-D imbedded in the lipid bilayer.
In what follows, we compare the evolution of the UV-vis absorption spectrum of a Pro-D solution in the absence of Phe to one incorporating Phe and utilize the wavelength dependence of product branching to aid in interpreting the role of Phe on the photochemical mechanism. We find that the presence of Phe inhibits Tachy buildup, while simultaneously generating a prolonged population of Pre-D. Global spectral analysis was performed to evaluate the kinetics of the reaction for each case, and high-performance liquid chromatography (HPLC) was used to estimate the final Tachy and Pre-D product yields. Quantum chemical calculations were performed to predict the binding properties of various Pro-D•••Phe dimer conformations, and FRET analysis was done to predict energy transfer properties between them.
3. Results
The absorption spectra for Phe and Pro-D in methanol are shown in
Figure 3, displaying a
λmax of 258 nm and 282 nm, respectively. The Phe spectrum spans from ~235 to 275 nm, while the spectrum of Pro-D is broader, ranging from 240 to 300 nm for its first electronic transition. Notably, the wavelength region of Phe, which covers the blue edge of Pro-D’s, yields a significant Tachy concentration from Pro-D in the absence of Phe. However, the first vibronic band of Pro-D is found at 294 nm, significantly red-shifted from Phe in a region where Pre-D is preferentially formed. With that in mind, four distinct irradiance studies are reported in what follows, associated with two excitation wavelengths. The first set is associated with an irradiance wavelength of 294 nm, exposing a pure Pro-D solution compared against that of a 1:1 mixture of Pro-D:Phe. The second set is to the blue at 258 nm (Phe
λmax) of the same pair of starting solutions. The effect of Phe on the Pro-D spectral evolution and its wavelength dependence are evaluated through the time-resolved difference absorption spectra, which conveniently subtract Phe’s contribution to the total absorption spectrum. Its complete absence in the ∆
A spectra for the mixtures further indicates its high photostability, leaving only changes to the Pro-D photochemistry represented in the spectra.
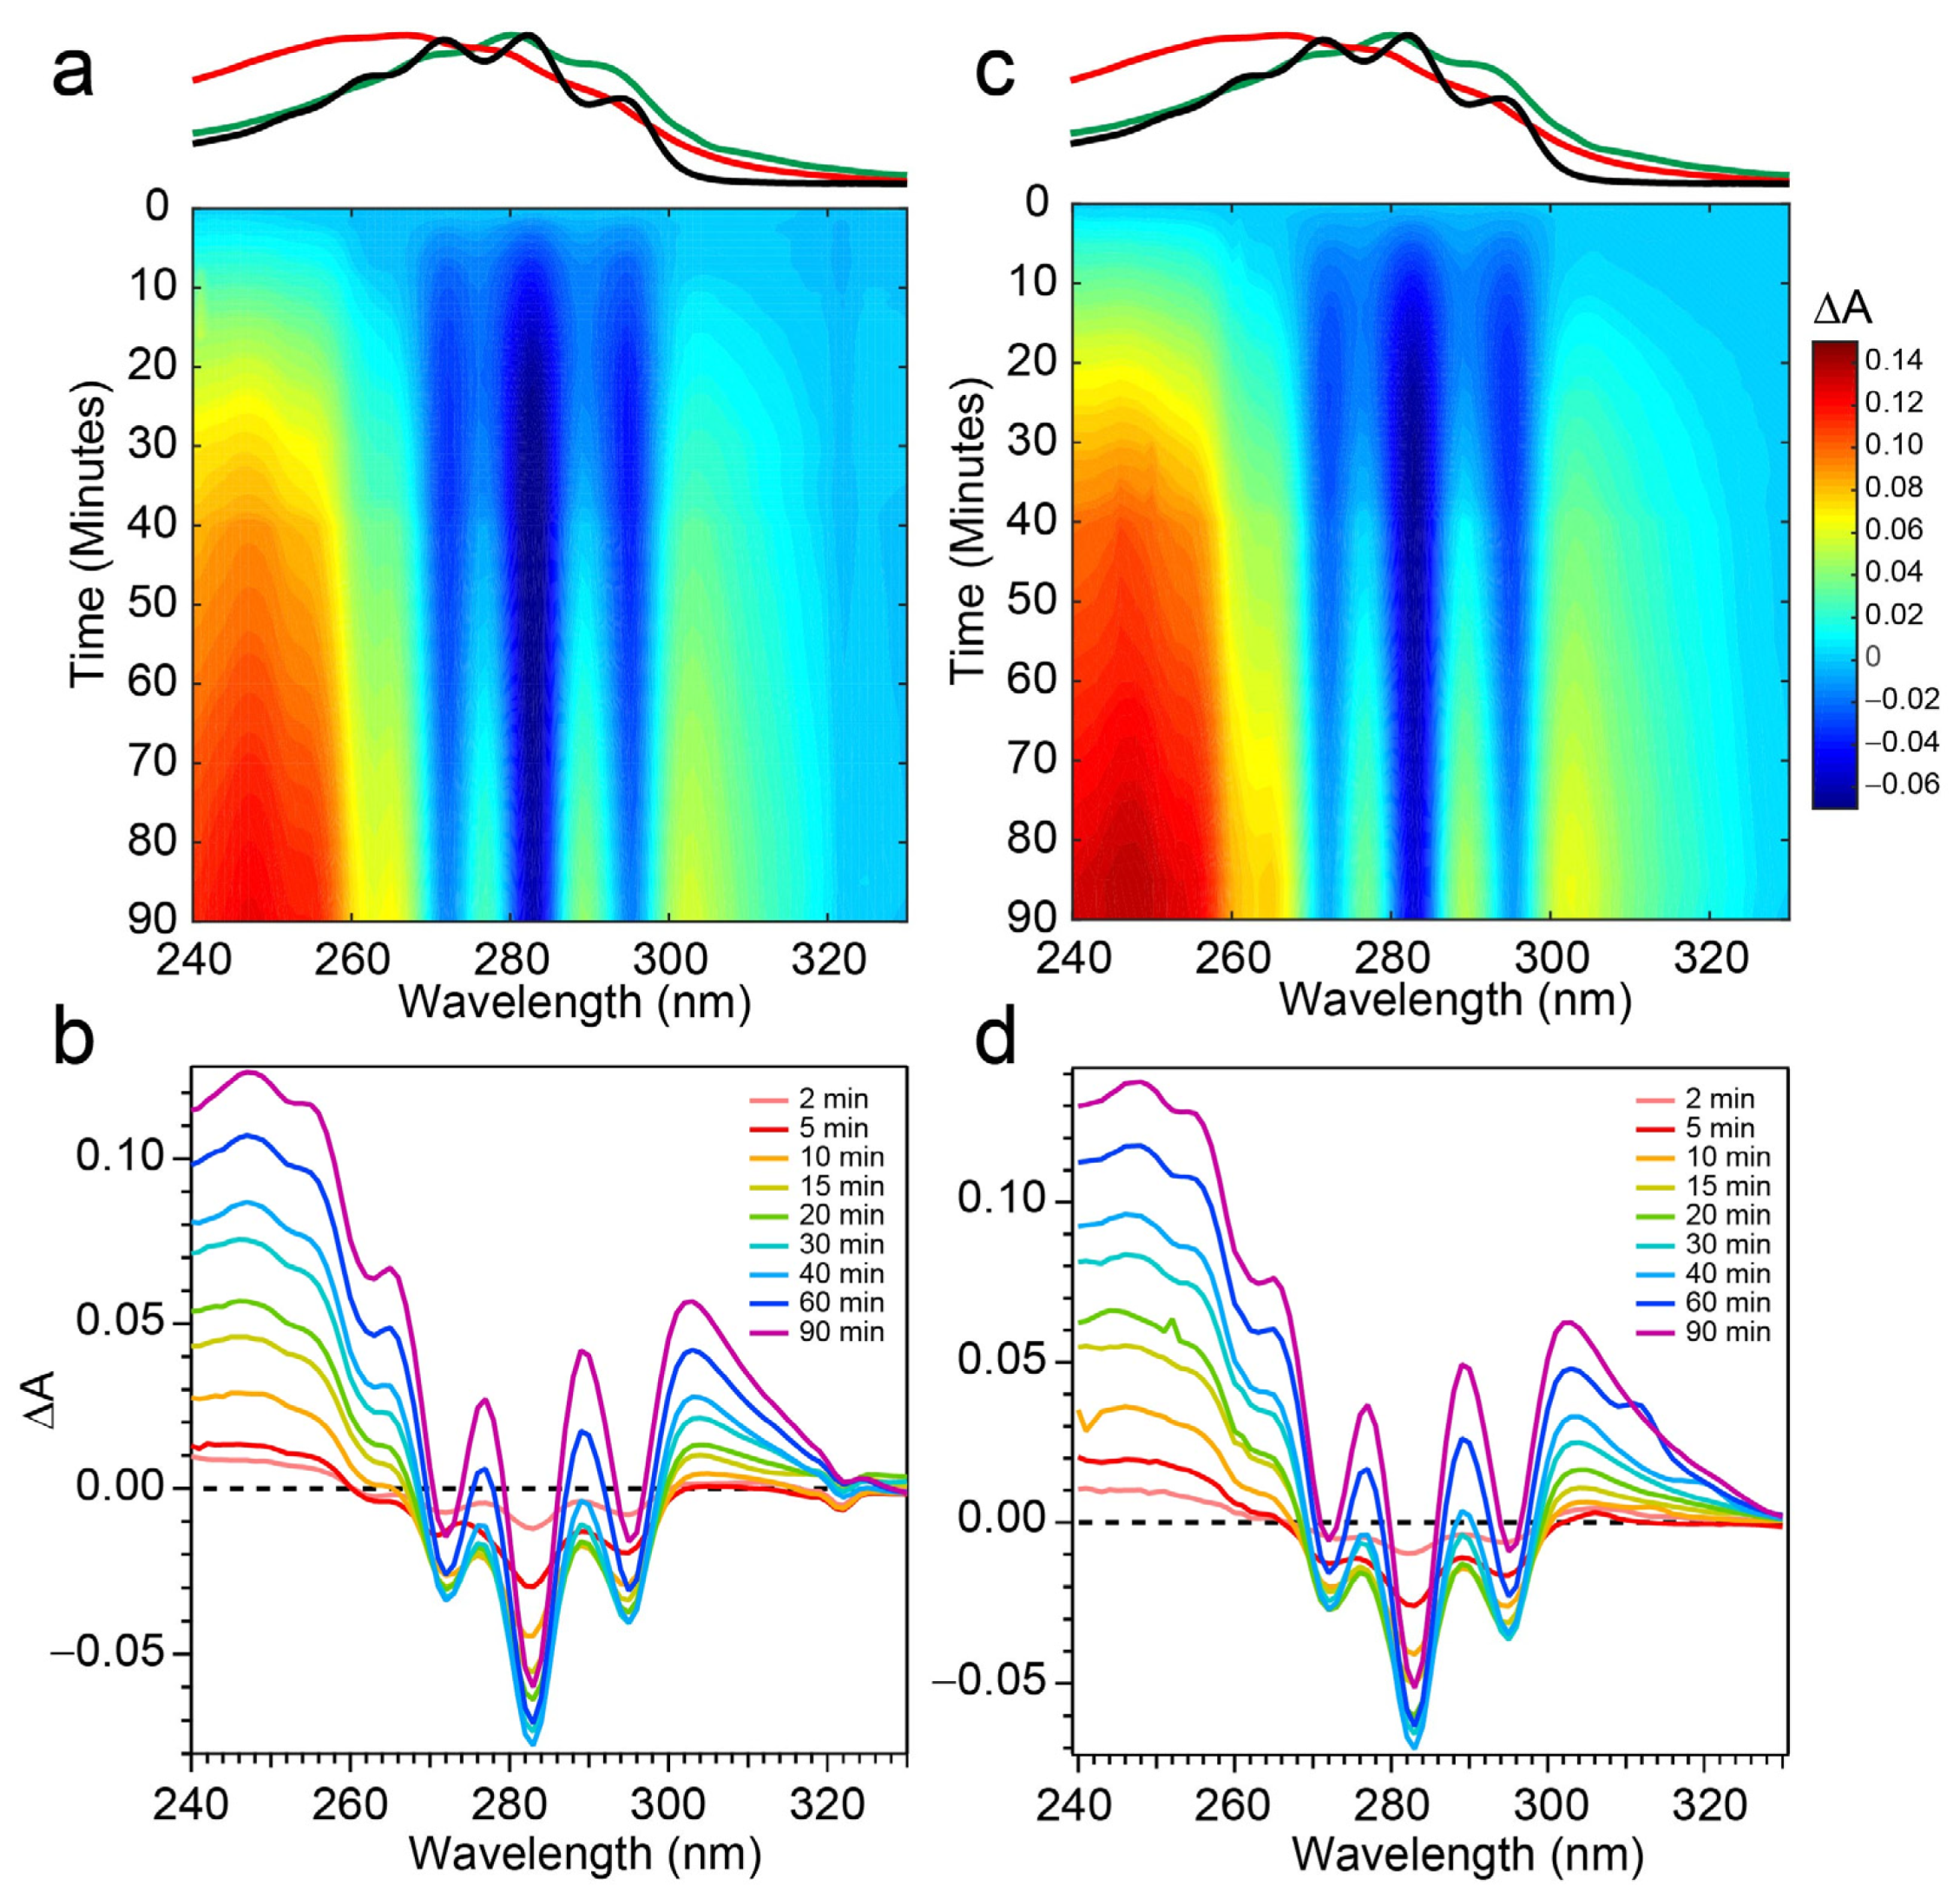
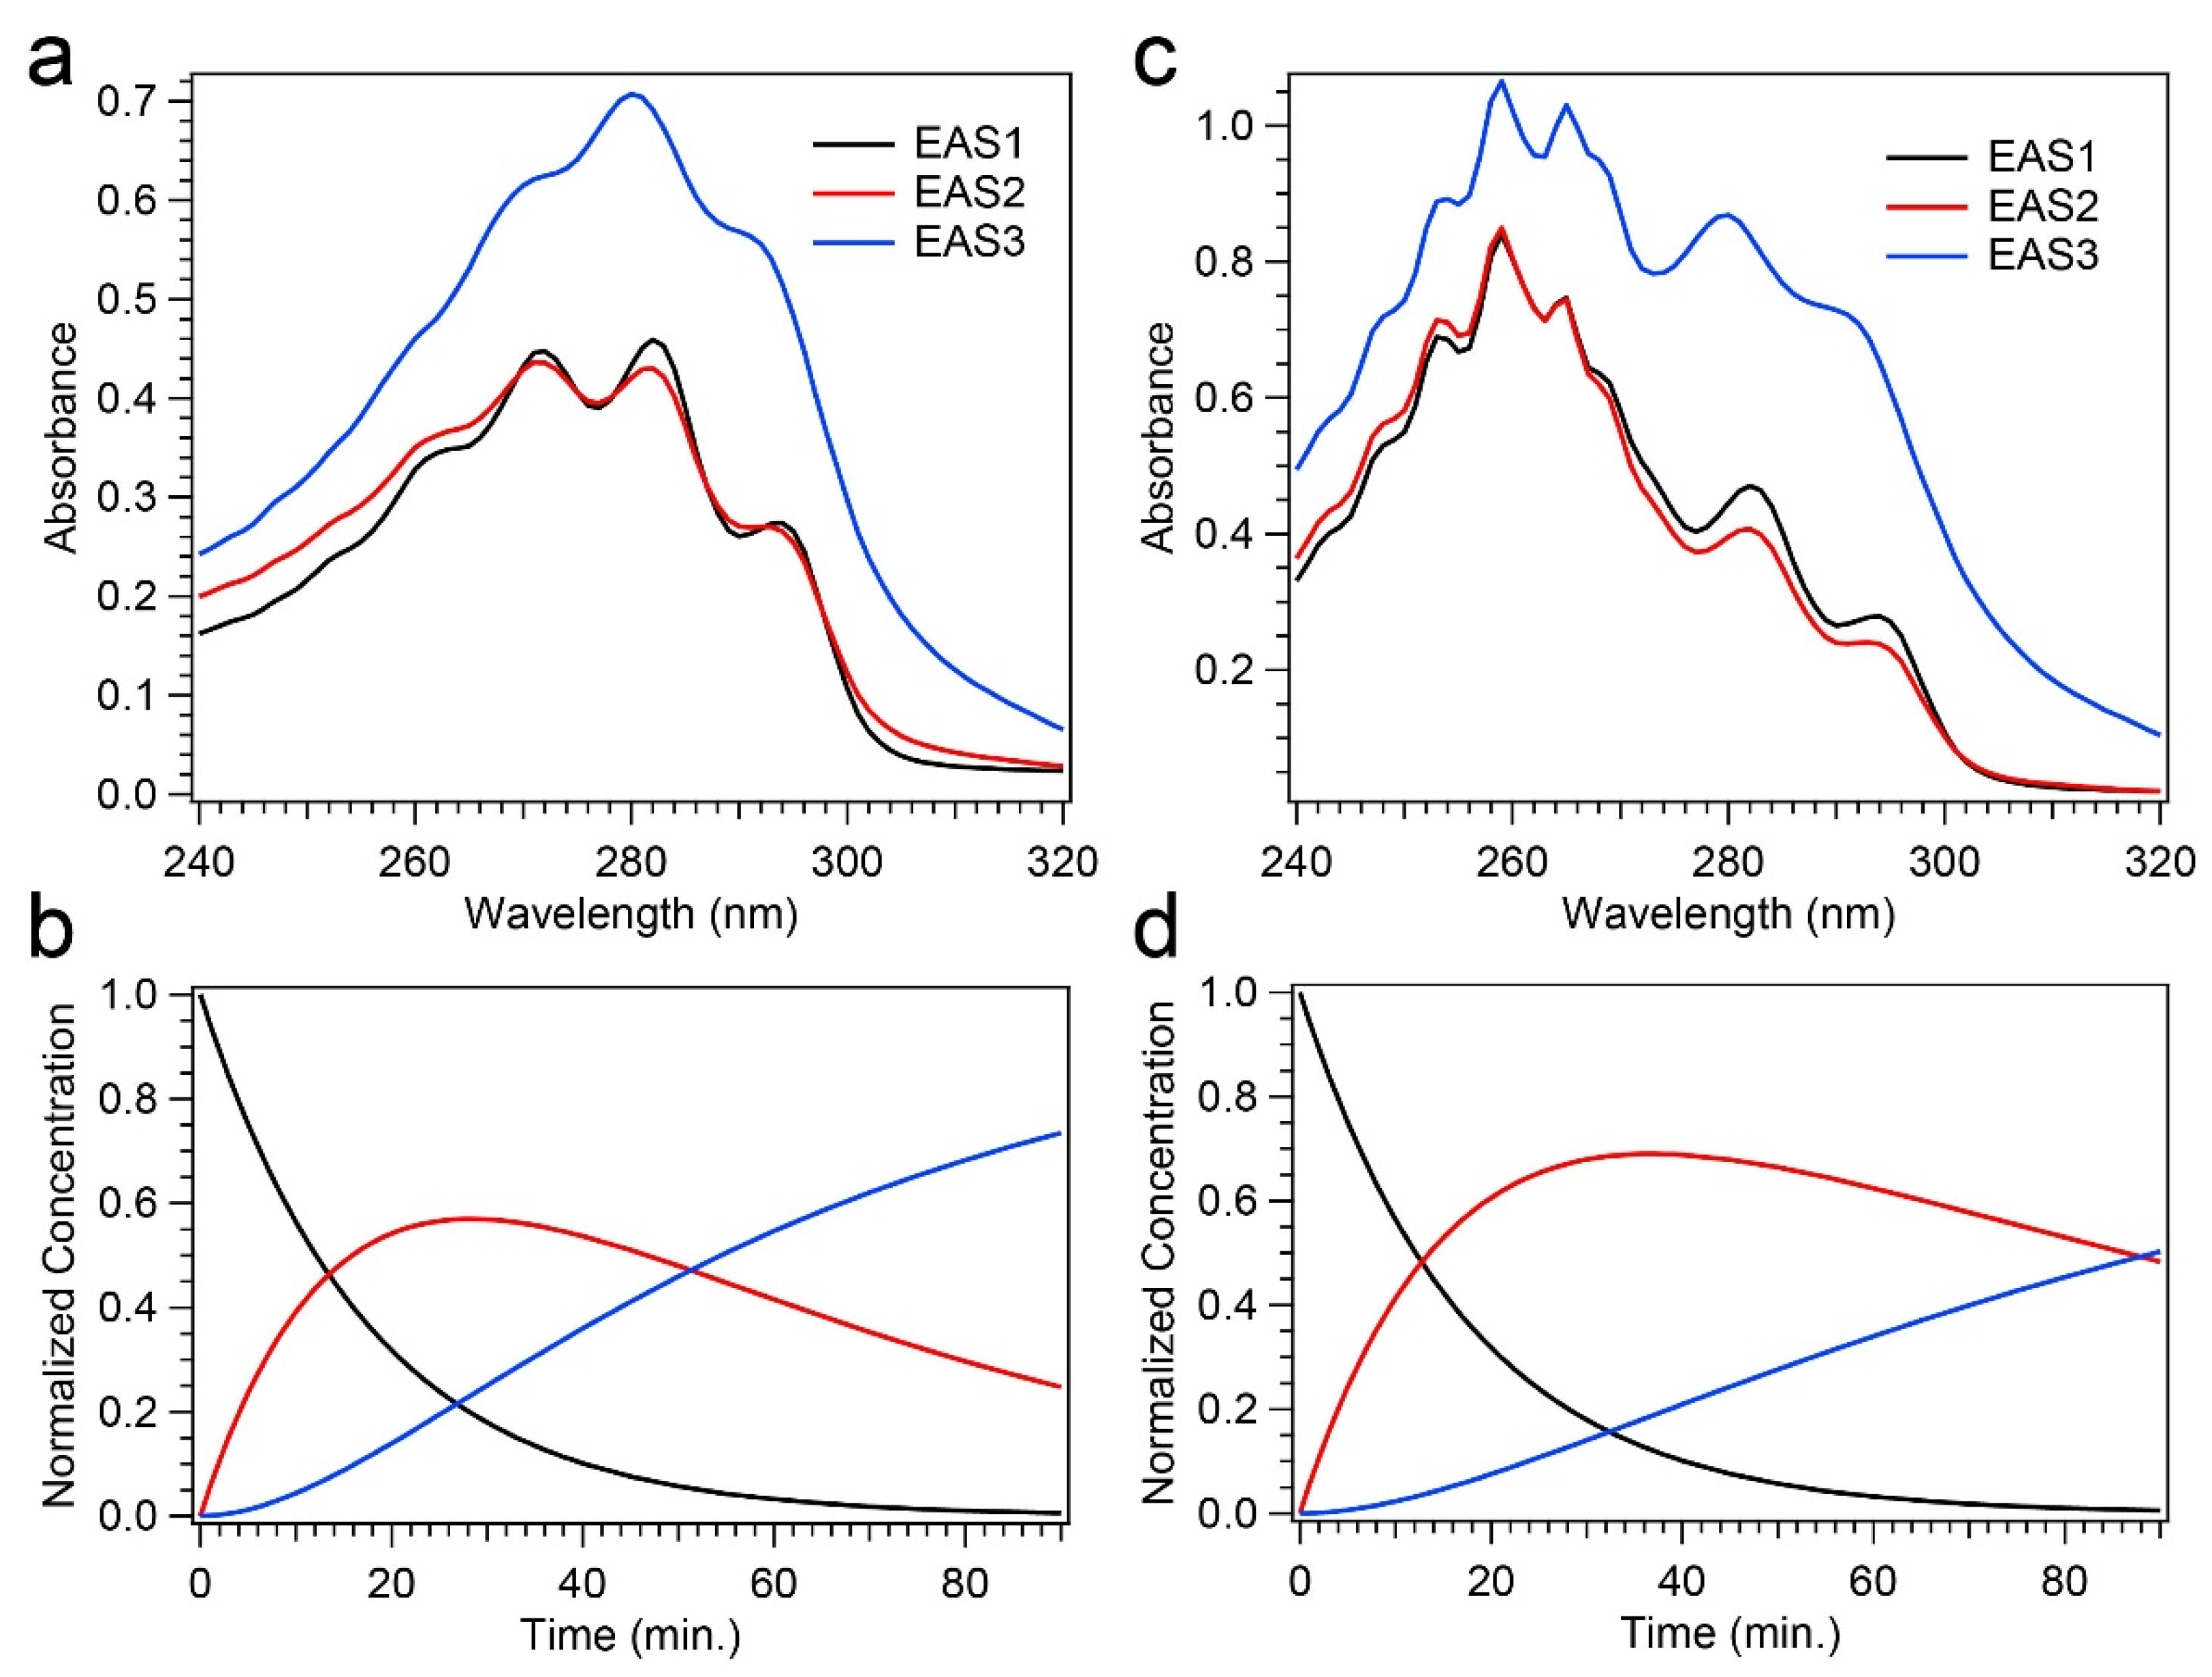
The spectral evolution of a Pro-D solution irradiated with 294 nm light for a total of 90 min is shown in
Figure 4a,b. Immediately, depletion of Pro-D signatures is detected and reaches a minimum ∆
A around 30 min of exposure time. Throughout the experiment, a broad feature to the blue ranging from 240 to 270 nm gradually grows in and reaches up to 0.13 optical density (OD) at the end of the experiment. In a similar way, another broad induced absorption peaks at 303 nm and trails off past 320 nm. The feature is distorted due to the negative Pro-D signals, but comparison to the steady-state absorption spectra (top) suggests that the combination of these broad signals arise from a growing Pre-D population with traces of Tachy. The blue-most features are particularly distinguishable as Pre-D since the Tachy absorption approaches a minimum there.
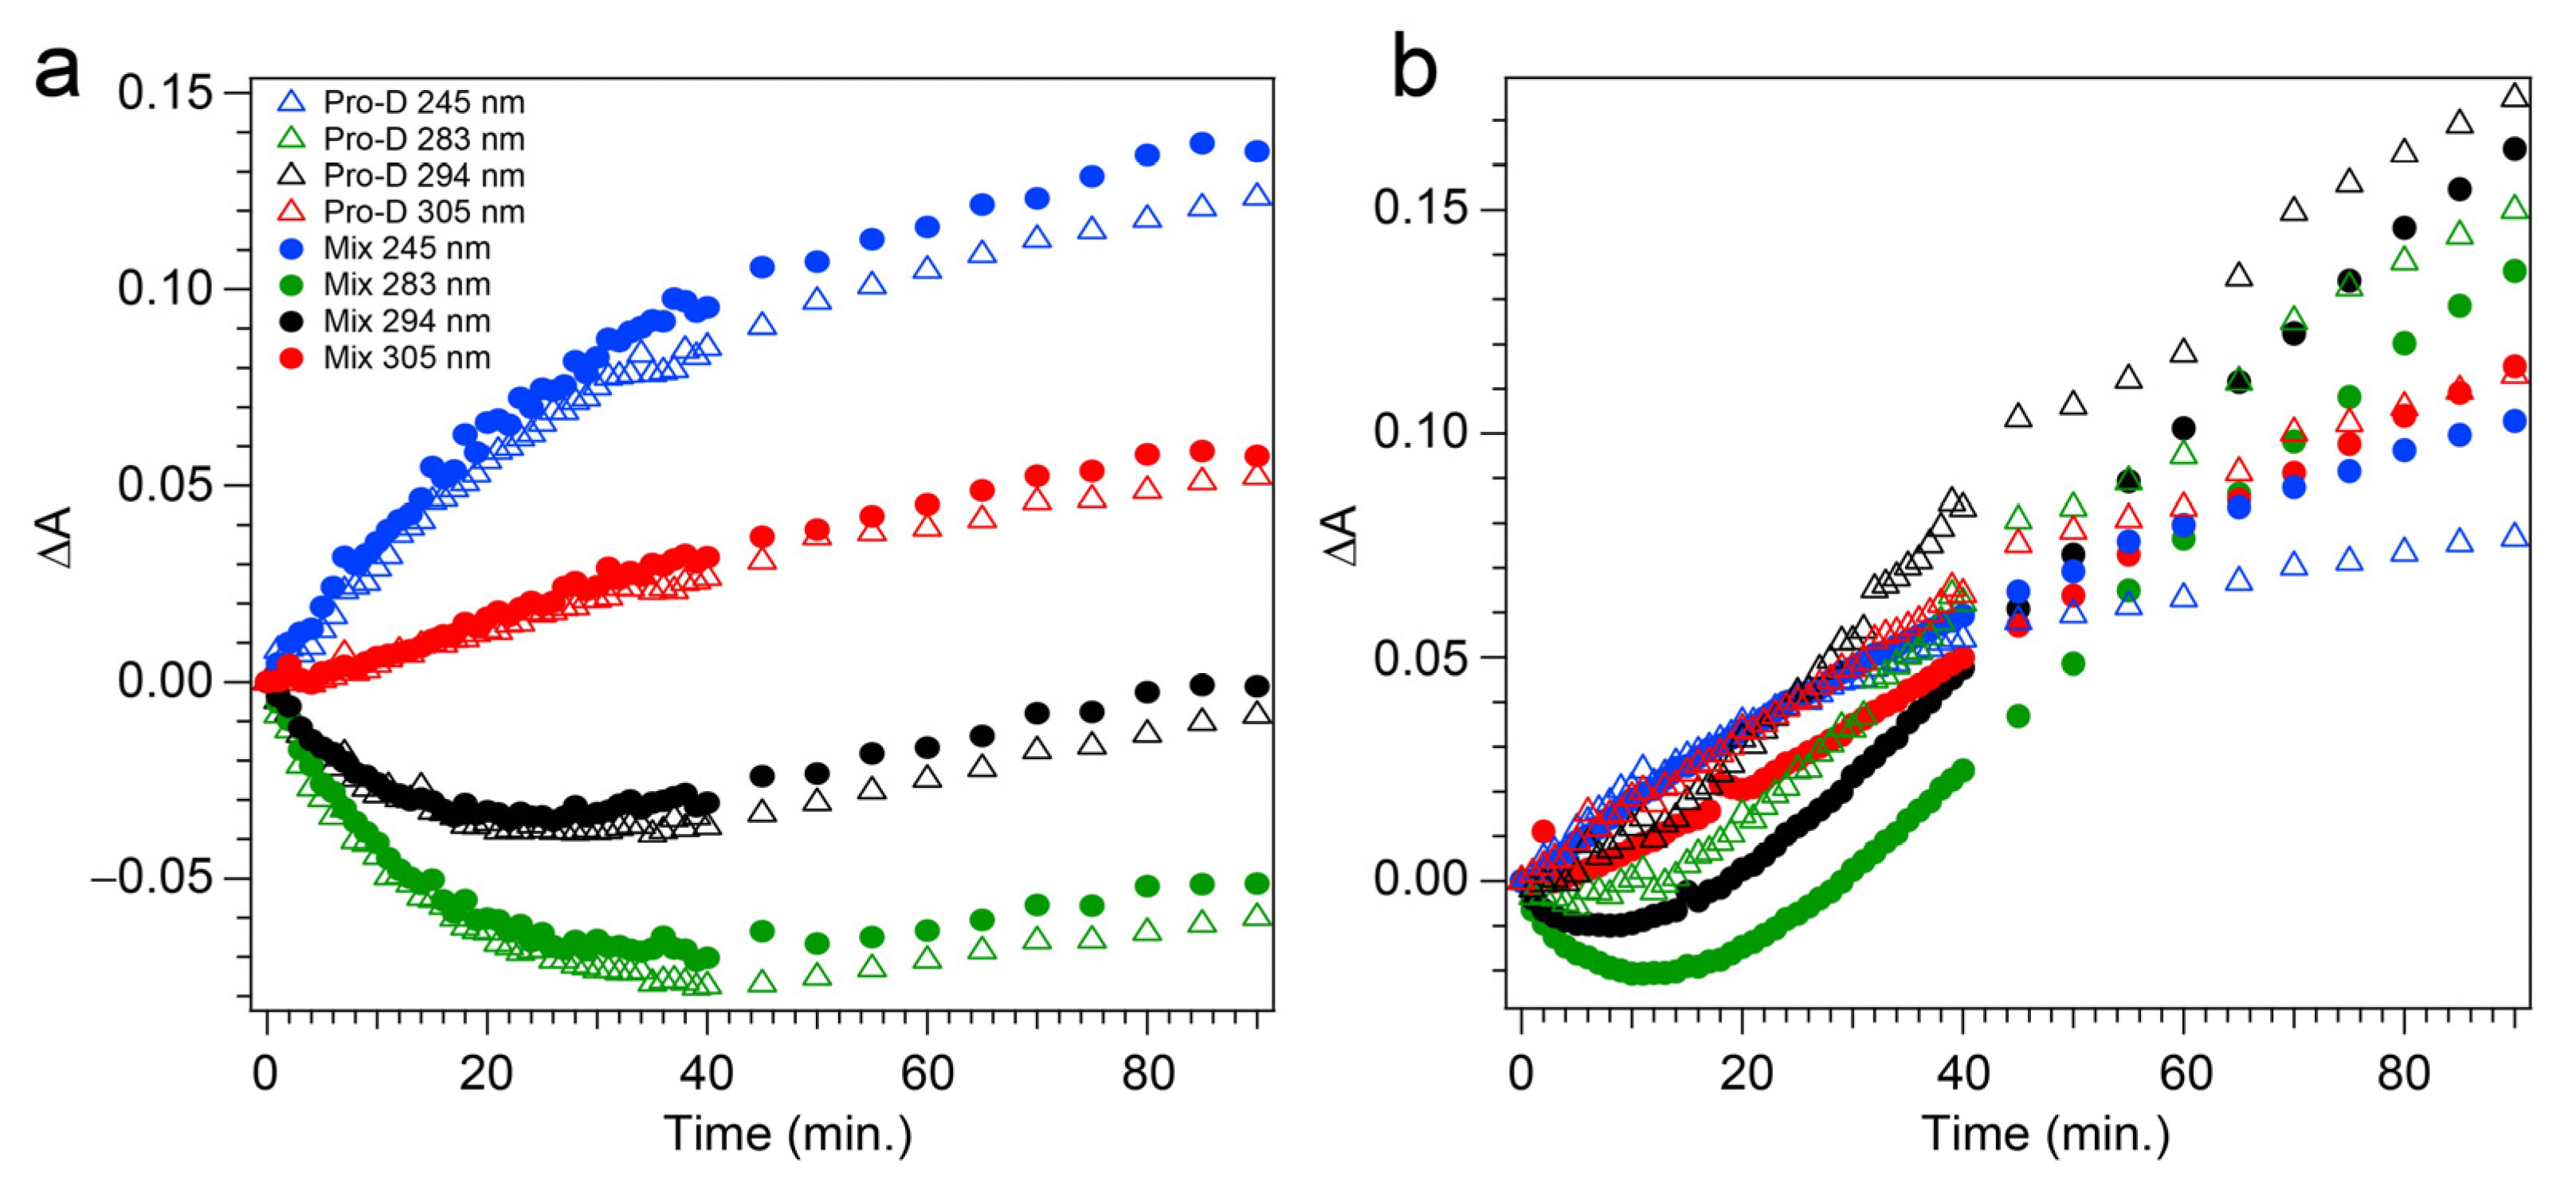
The transients taken from four different wavelengths are shown as open triangles in
Figure 5a. At 283 and 294 nm, traces of the Pro-D depletion are clearly shown as an early-time exponential decay, before “recovering” and gradually increasing throughout the rest of the experiment. The slow growth at those wavelengths tracks similarly with the growth rate of features to the blue (245 nm) and red (305 nm) of the Pro-D absorption, indicating spectral overlap within the Pro-D absorption region and predominantly sequential kinetics of Pro-D→Pre-D (+trace Tachy). These results are in agreement with former works that have shown that excitation at the red edge of the Pro-D absorption spectrum helps to maximize Pre-D concentration.
Figure 4c,d shows the same measurement on a 1:1 Pro-D:Phe mixture to investigate the effects of Phe’s presence in solution on the photochemical reaction. In this case, the signals and time evolution are found to be nearly indistinguishable from a Pro-D solution. A closer comparison is found by inspecting the transients (
Figure 5a) where solid circles represent the mixture with Phe, and the signal progression is found to be nearly identical. Despite the parity in kinetics between the experiments, a slight difference in Pro-D concentration between the two measurements yields a minor difference in the magnitude of ∆
A signals. Nevertheless, the concentration ratio for products remains very similar for the entirety of the experiment, indicating little to no effect on the photochemical mechanism by the simple presence of ground-state Phe. Importantly, 294 nm exposure excludes excitation of Phe altogether and therefore any effects of excited Phe.
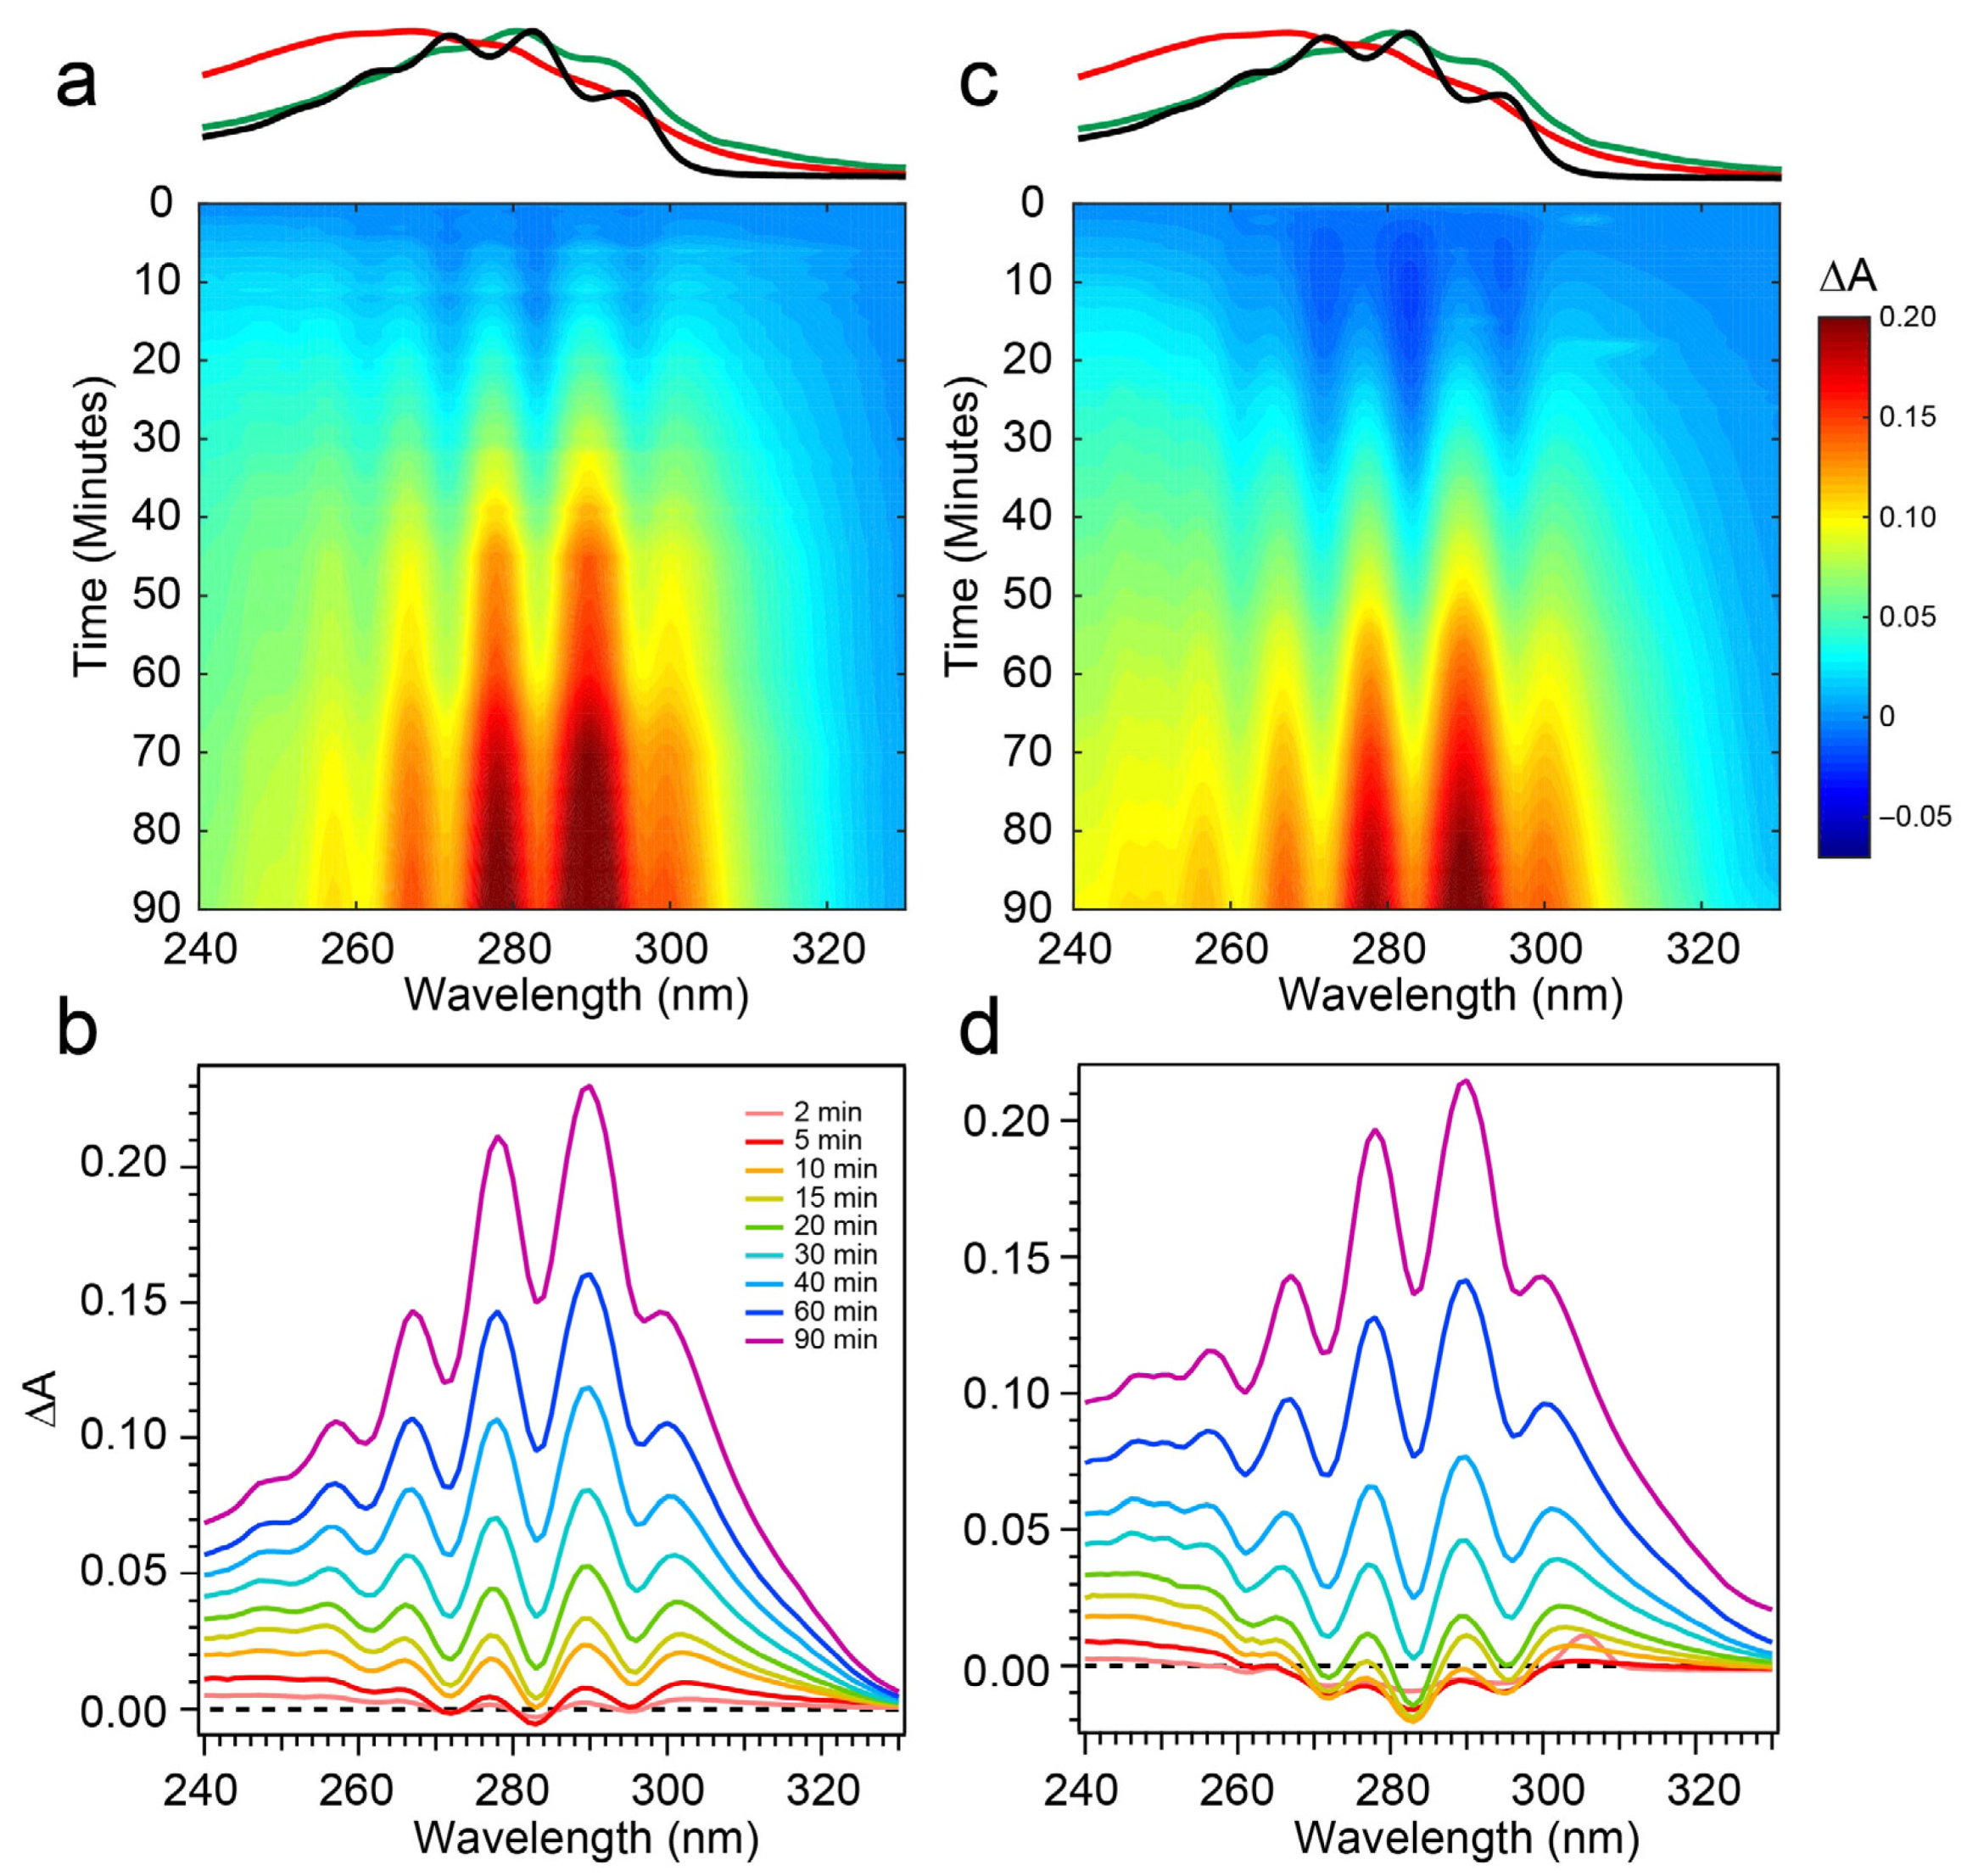
To address those aforementioned exclusions in the 294 nm experiments, time-resolved absorption spectra were recorded while exposing the two samples to 258 nm light (Phe λ
max) of the same intensity. The results are shown in
Figure 6. The wavelength dependence of the product branching is evident, as the differential spectra are remarkably different than those found in
Figure 4. While the negative-going Pro-D depletion is detected at very early times in
Figure 6a,b, it fades into a large growth spanning the entire 240–320 nm region, the center of which reveals vivid vibronic signatures with characteristic peaks at 300 nm, 290 nm, and 278 nm. These features are very close to the first three vibronic bands of the Tachy spectrum, and the nearly 2× increase in ∆
A further reinforces that assignment given the >2× molar extinction coefficient of Tachy compared to Pro-D [
28]. Inspection of the transients in
Figure 5b (open triangles) reiterates the dramatic variability in concentrations as a function of UV wavelength, showing very different signal evolution compared to
Figure 5a. Importantly, we find a significantly faster growth at 283 and 294 nm following a brief Pro-D decay, representative of primarily Tachy formation. Similarly, the signal at 305 nm is enhanced in this experiment, again very near the first distinguishable Tachy feature. Another notable difference is that the total growth at the blue edge of the spectrum where Pre-D is identified (blue triangles) is reduced nearly a factor of two compared to 294 nm excitation, indicating less overall Pre-D formation in this case.
Repeating the same measurement on a Pro-D solution incorporating Phe rendered distinct differences in the progression of signals in the difference absorption spectrum, as well as the final signal strength (
Figure 6c,d). Comparing the spectrum to the Pro-D solution reveals an apparently prolonged and more dramatic depletion of Pro-D concentration reaching a minimum ∆
A around 15 min before transitioning into the buildup of product absorption throughout the remainder of the experiment. At first glance, it appears that again, Tachy formation dominates the product mixture; however, close inspection to the red and blue edge of the spectrum reveals additional signals not present in the pure Pro-D solution excited at this wavelength. Those signals can confidently be assigned to the buildup of a concomitant Pre-D population not observable without the presence of Phe.
The prolonged decay of Pro-D, the buildup of Tachy, and the enhancement in Pre-D concentration are illuminated in a comparison of the transients taken at wavelengths characteristic of those species (
Figure 5b). Most notably, the transient at 245 nm (blue) shows a difference of about 0.03 OD at 90 min, and the absorbance there is plateauing in the Pro-D solution while continuing to increase in the 1:1 Pro-D:Phe solution. Furthermore, the final Tachy absorbance is noticeably less in the mixture. While the relative absorbance of the Pre-D and Tachy features still appears to favor Tachy, it must be noted that the molar extinction coefficients of the two species are dramatically different, perhaps indicating a more significant change in their relative concentrations, comparing the two experiments.
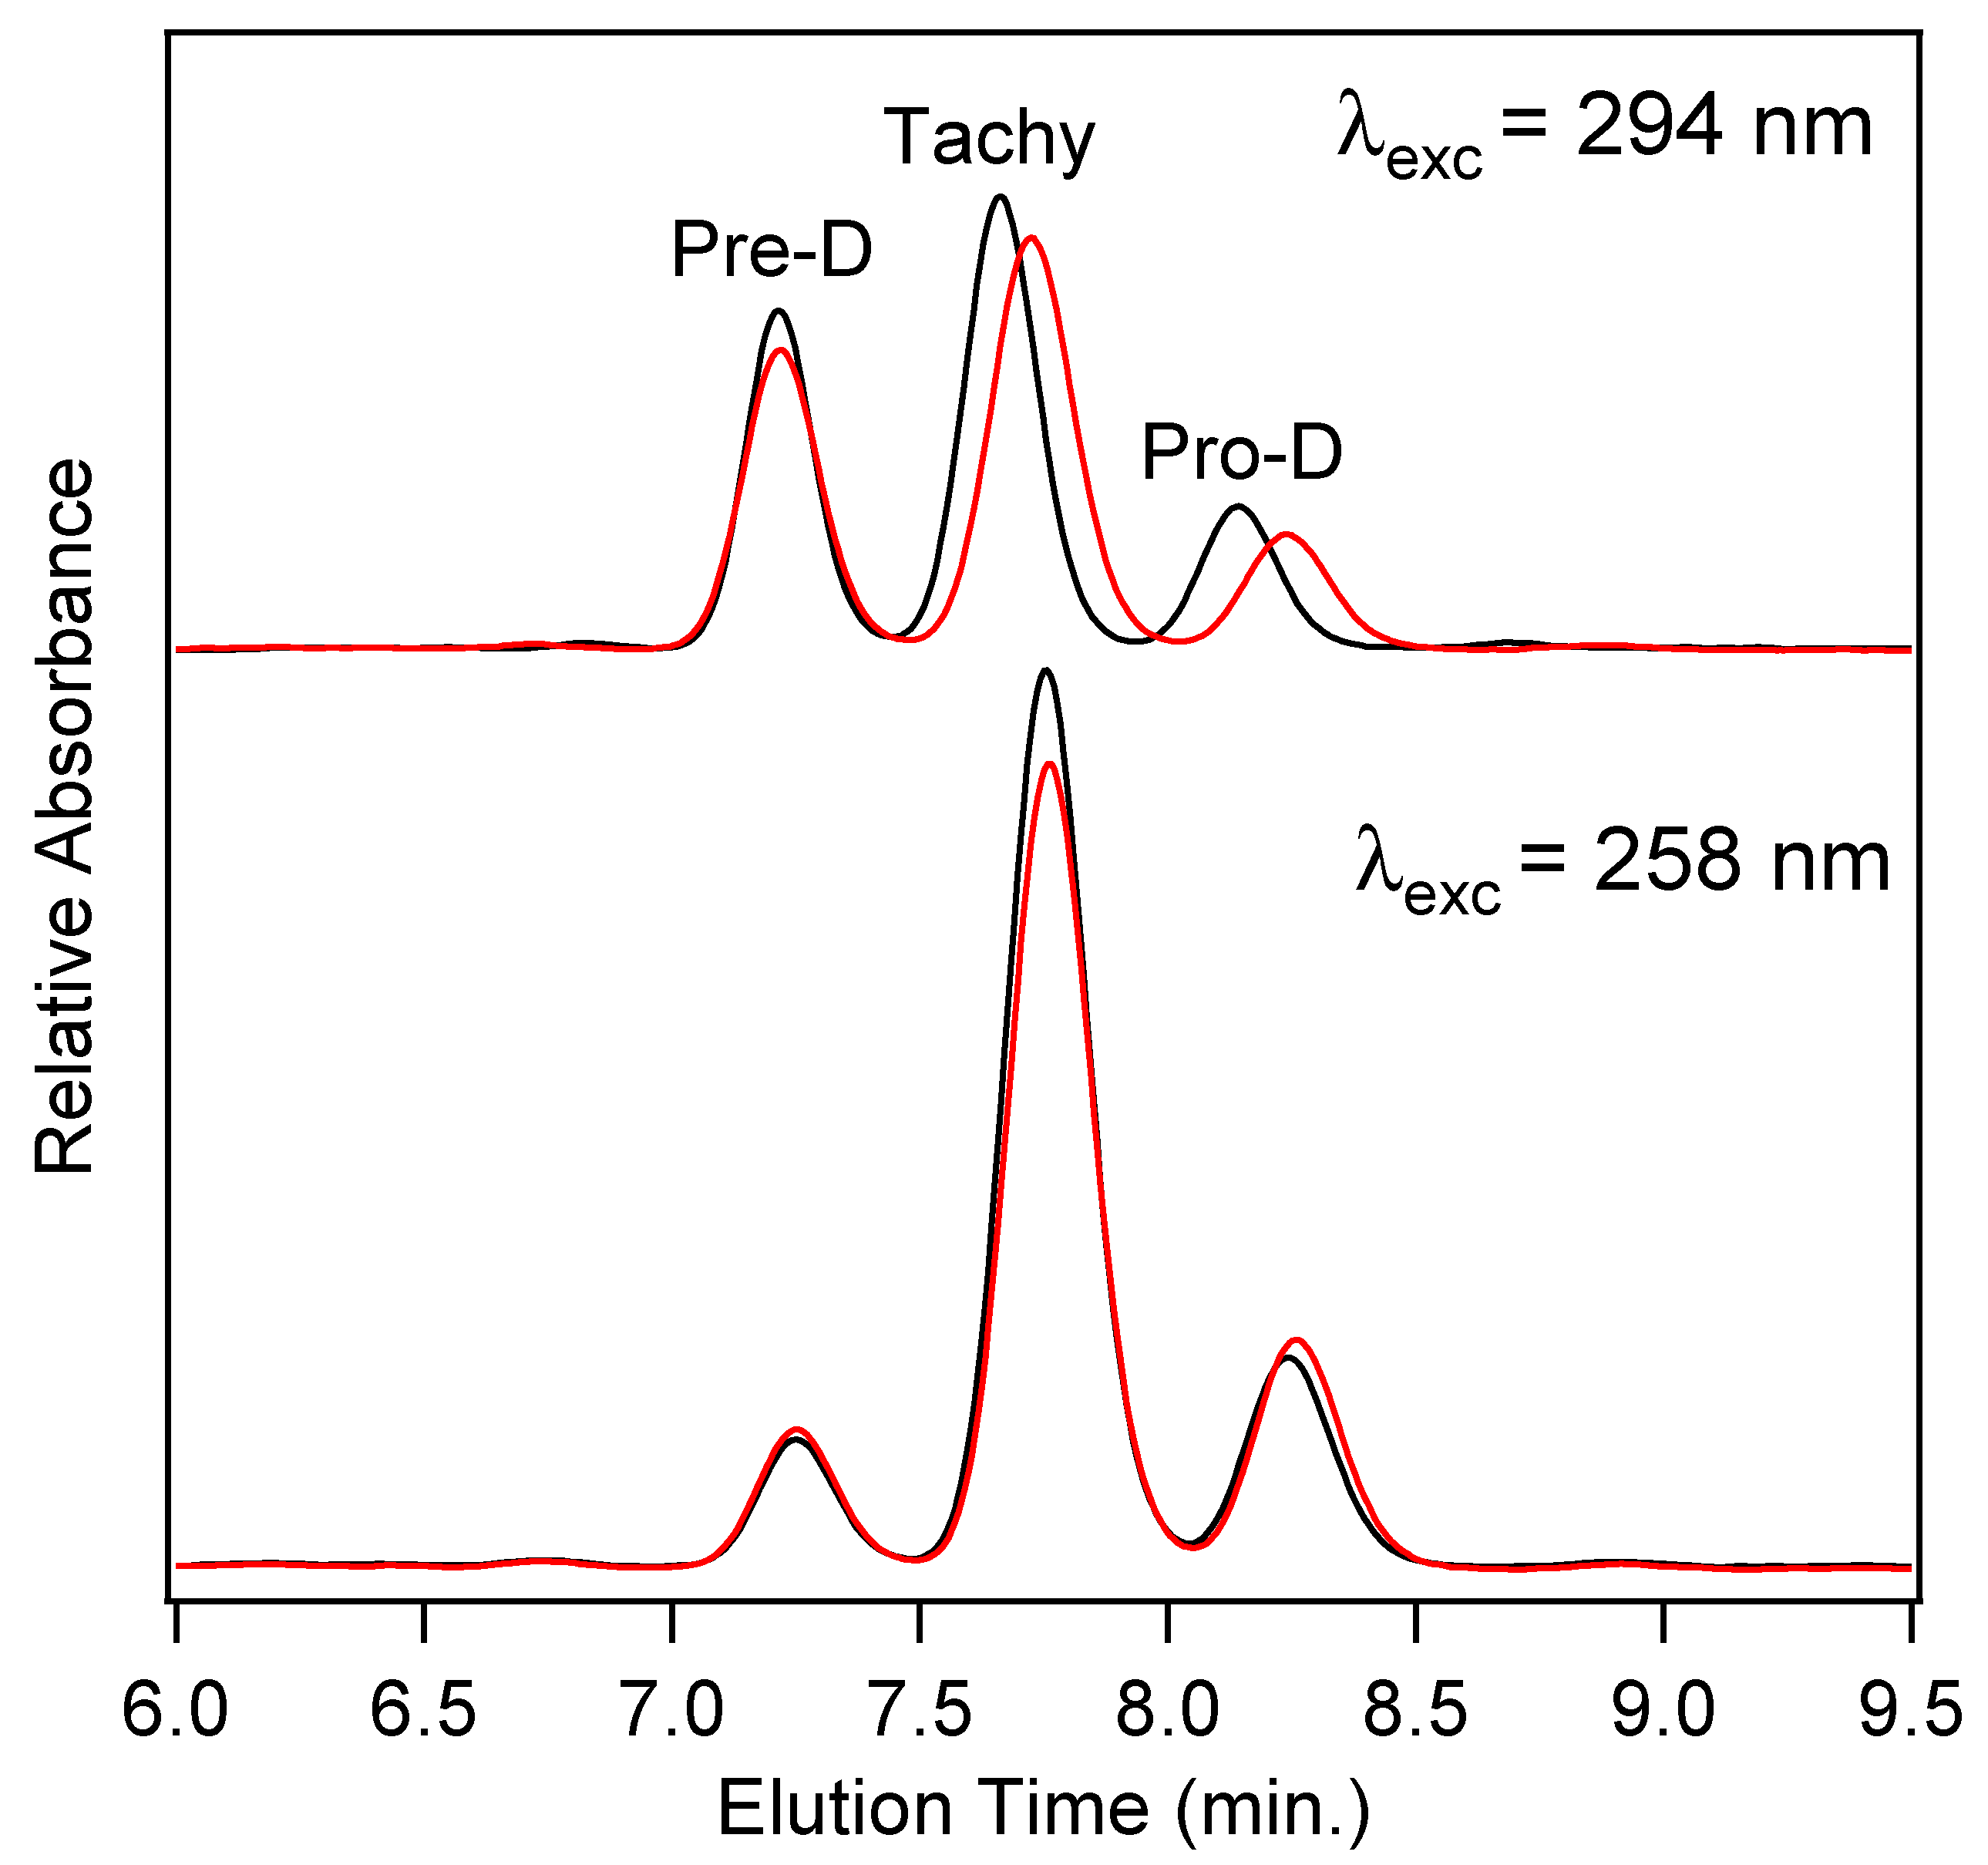
In order to quantify the final concentrations of Pro-D products among the four photochemical experiments, high-performance liquid chromatography (HPLC) utilizing diode-array detection (DAD) was employed.
Figure 7 shows the chromatograms measured at 280 nm for product solutions extracted after a 90 min illumination time for Pro-D solutions (black) and 1:1 Pro-D:Phe mixtures (red) under 294 nm (top) and 258 nm (bottom) illumination. We note that the detection wavelength is near the Tachy absorbance maximum. The slightly higher pre-illumination concentration of the Pro-D solution is again apparent in the chromatogram for 294 nm excited solutions, showing a similar difference in peak height between the pure Pro-D and Pro-D:Phe mixture for all three eluted species. However, their concentration ratios appear to remain nearly the same in agreement with difference absorption measurements (
Figure 4). However, for the 258 nm illuminated solutions, a clear decrease in Tachy is found along with a slight increase in Pre-D and Pro-D concentrations. These results are consistent across all other detection wavelengths in the DADS as shown in
Figure S3 in the Supplementary Material.
To quantify the relative concentrations of Pre-D:Tachy in the two sets of experiments, the chromatograms were fit with a sum of three gaussians and integrated to yield a total absorbance for each species, then corrected for their approximate molar extinction at 280 nm according to Norval et. al. [
28] These fits can be found in the
Supplementary Material in Figure S3. We find a [Pre-D]:[Tachy] ratio of 1.96 and 1.92 for the Pro-D and 1:1 Pro-D:Phe mixtures, respectively, at 294 nm excitation wavelength, yielding a percent difference of −1.89%. However, for solutions illuminated at 258 nm, a [Pre-D]:[Tachy] ratio of 0.36 and 0.458 were found, respectively, yielding a +27.2% difference in favor of Pre-D in the mixture. Taking these results together, it would seem that the presence of Phe enables a reduction of Tachy generation, or at least a slowdown of Tachy formation prior to reaching a photostationary state. The outcome is, therefore, a simple form of “photoprotection” of the metastable Pre-D intermediate necessary for eventual vitamin D formation. The potential mechanism of this photoprotection is explored in what follows.
5. Conclusions
The effects of proximal Phe on the photochemistry of Pro-D was investigated through time-resolved absorption spectroscopy, in tandem with global kinetic analysis, HPLC analysis of photochemical product ratios, and computational predictions of aggregation. Illuminating solutions of Pro-D and a Pro-D:Phe mixture at 294 nm resulted in nearly identical evolution of the absorption spectrum and product branching in both solutions. Importantly, illumination at 294 nm almost exclusively led to the excitation of Pro-D at the red edge of its absorption spectrum, while excluding excitation of Phe due to its blue-shifted spectrum. However, illuminating the two solutions at 258 nm at the peak of the Phe absorption spectrum overlapped with the blue-most absorption of Pro-D, revealed significant differences in both the absorption spectrum evolution and product concentrations upon the incorporation of Phe in solution.
Global analysis, utilizing a three-component sequential model, yielded an excellent fit to the time-resolved absorption spectra, and only the time scale pertaining to the decay of Pre-D was altered between a Pro-D solution and a Pro-D:Phe mixture. Specifically, the incorporation of Phe significantly prolonged the Pre-D intermediate, yielding a time constant nearly twice that of a Pro-D solution. Surprisingly, however, the Pro-D decay timescale was unchanged by the presence of Phe, hinting at a more complex mechanism of photoprotection by Phe compared to simple light screening.
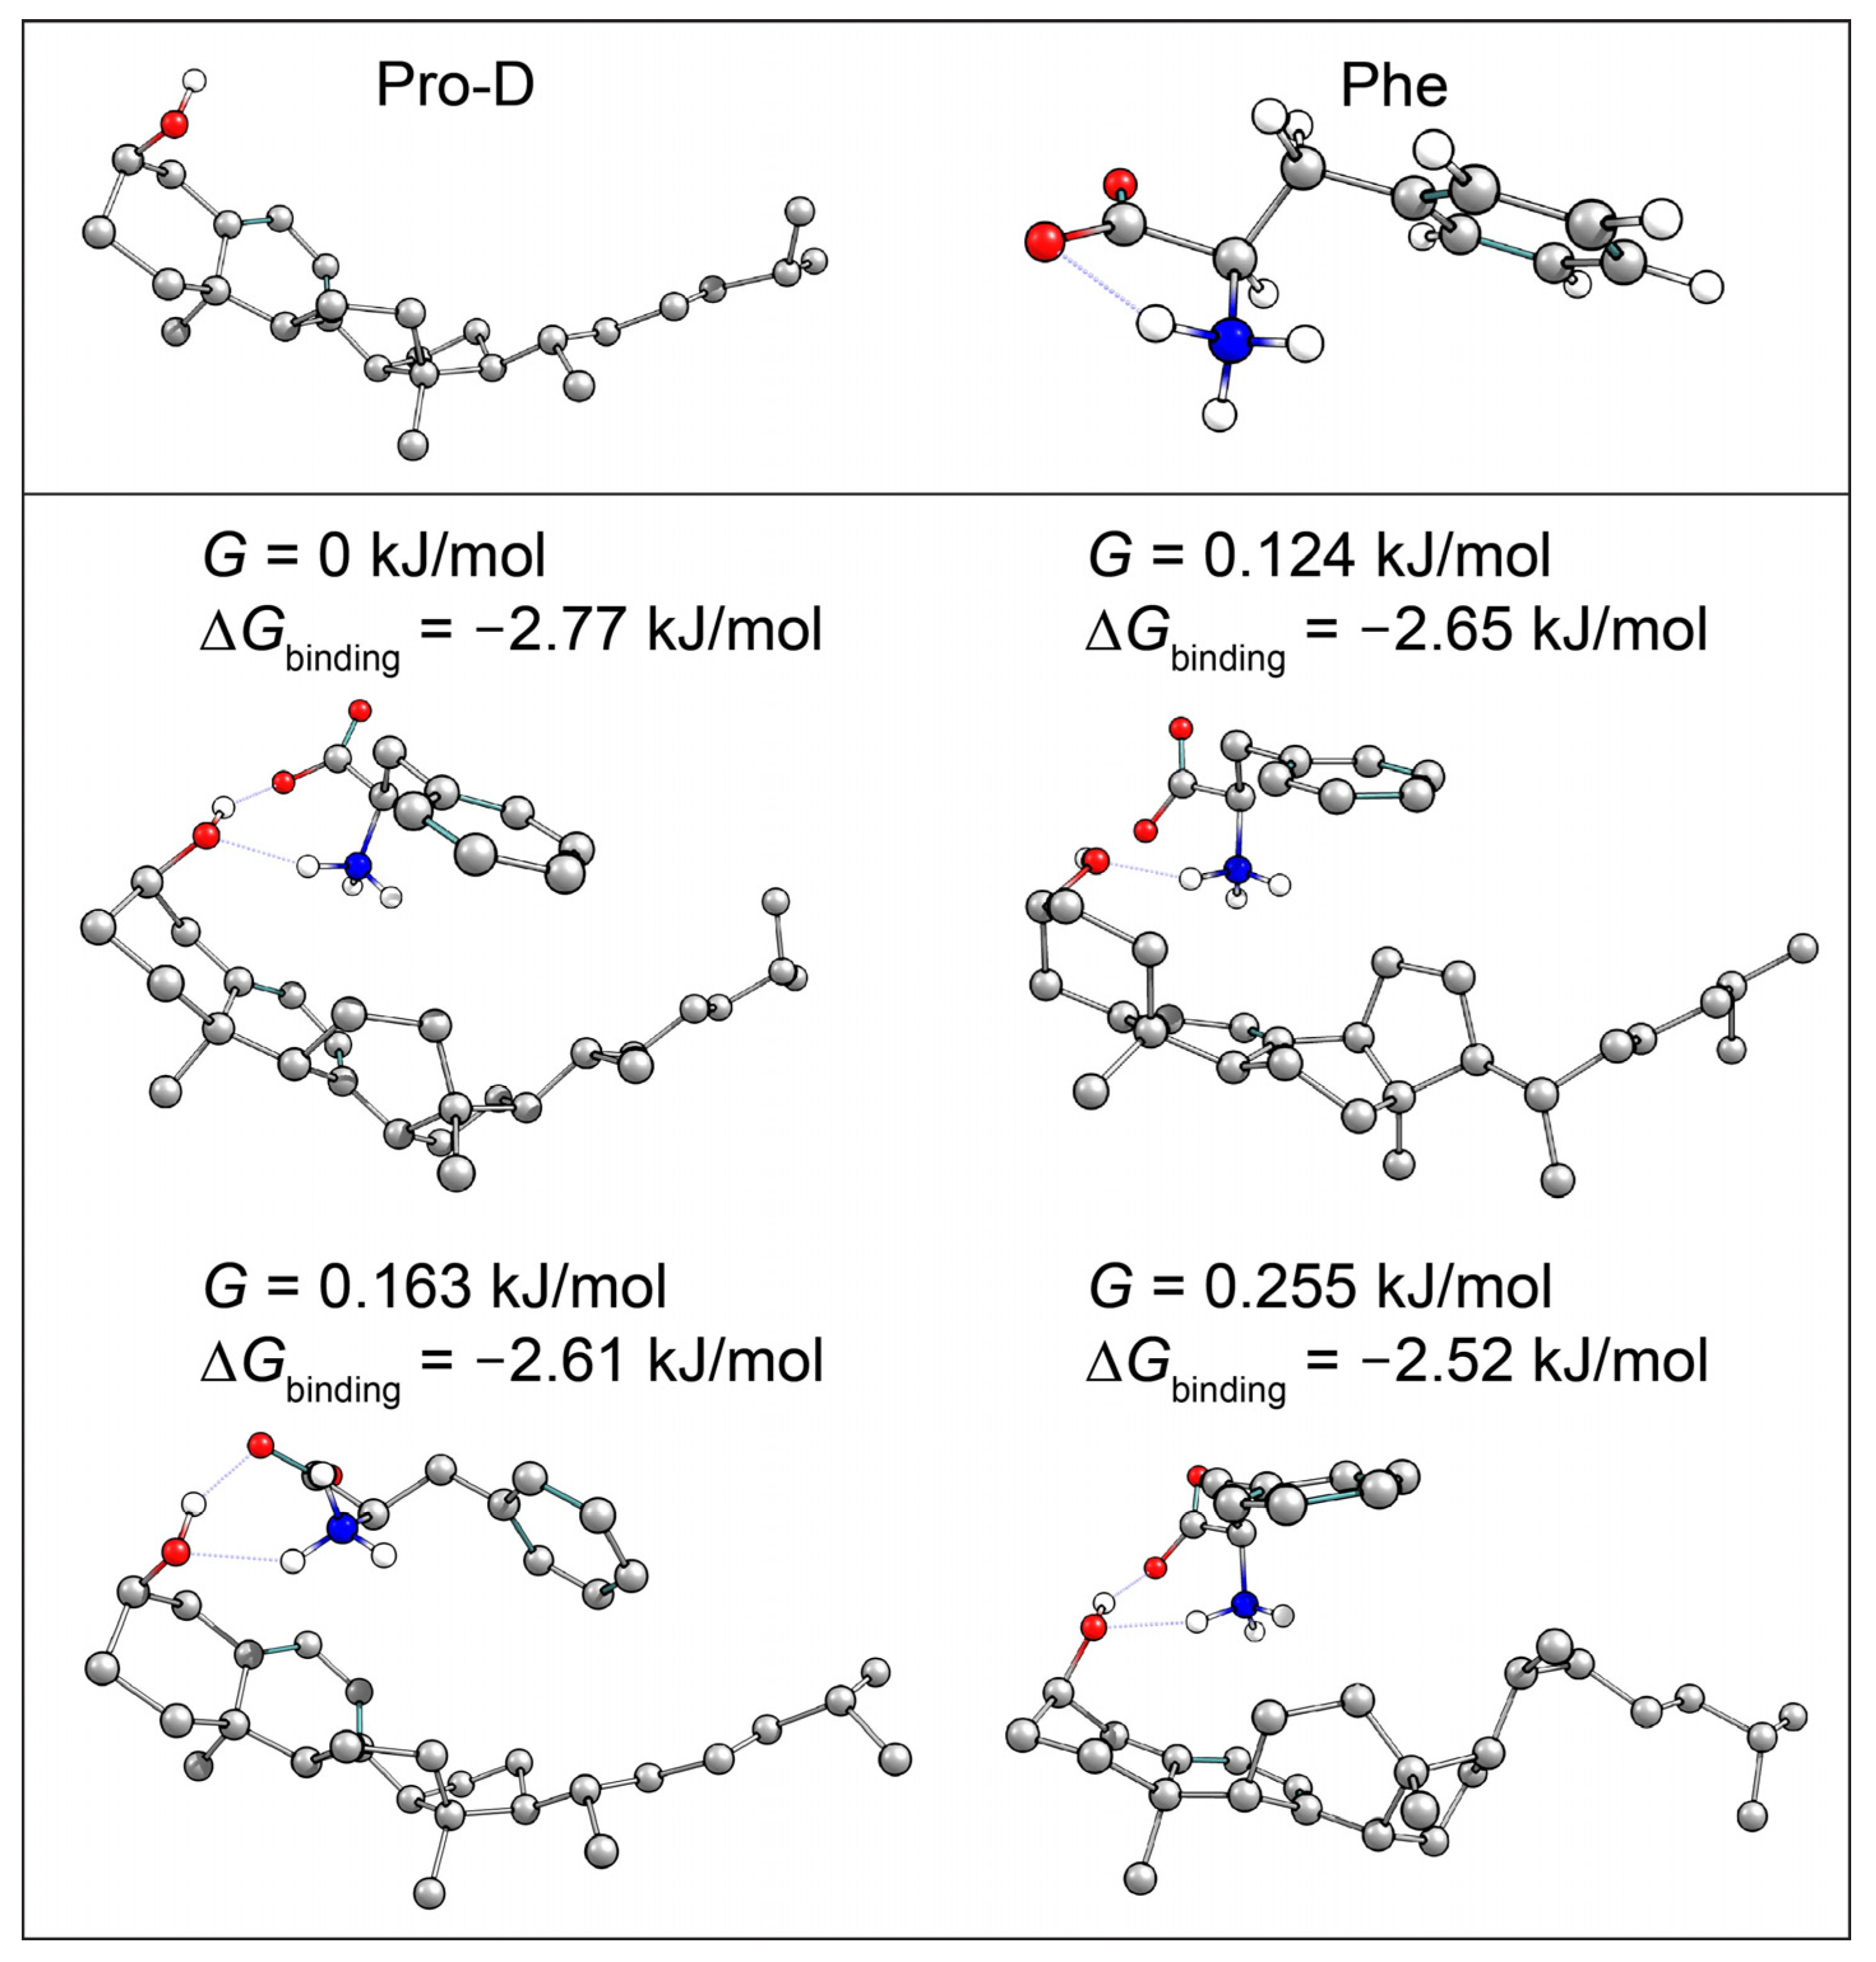
Pro-D•••Phe H-bonded dimer structures were calculated with DFT to investigate whether the pair would show favorable interactions, leading to potential aggregation in solution. Several structures were predicted to be stable at room temperature, indicating likely non-random pairwise interactions between the two molecules in solution, lending them the ability to undergo resonance energy transfer. The complementary absorption and fluorescence features of Phe relative to Pro-D particularly enable the addition of an energy transfer event from Phe→Pro-D, triggering the ring-opening reaction leading to Pre-D. This added pathway ultimately compensates for the difference in absorption by Pro-D at those blue wavelengths, yielding a similar concentration of excited Pro-D despite the significant screening by Phe in that region. Importantly, since the Phe absorption spectrum spans the wavelengths that generate high concentrations of undesired products such as Tachy, and its fluorescence spectrum yields a spectral overlap toward the red region of the Pro-D absorption, it serves as an ideal energy transfer donor to maximize an intermediate population of Pre-D. Therefore, we propose that Phe exhibits dual photoprotection properties for Pro-D. Firstly, it screens parasitic wavelengths that render undesired photochemical products from Pre-D, such as Tachy, while simultaneously down-converting absorbed energy to energies more amenable to Pro-D excitation, leading to a greater overall Pre-D yield.


