Article

Photolytic Degradation of the Insecticide Clothianidin in Hydrochar Aquatic Suspensions and Extracts

by
Artemis Pappa
1,
Feidias Bairamis
1 and
Ioannis Konstantinou
1,2,*
1
Department of Chemistry, University of Ioannina, 45110 Ioannina, Greece
2
Institute of Environment and Sustainable Development, University Research and Innovation Center of Ioannina, 45110 Ioannina, Greece
*
Author to whom correspondence should be addressed.
Photochem 2023, 3(4), 442-460; https://doi.org/10.3390/photochem3040027
Submission received: 24 July 2023 / Revised: 12 October 2023 / Accepted: 31 October 2023 / Published: 7 November 2023

Abstract

:
In this study, the aqueous photolytic degradation of the neonicotinoid pesticide clothianidin was studied in suspensions and aqueous extracts of hydrochar produced from olive kernels. A slight and nonsignificant decrease in the photodegradation rate of clothianidin in aqueous extracts of hydrochar (HCw) with an initial concentration of hydrochar ranged from 50 to 400 mg L−1 (rate constants ranged between k = 0.0034 and 0.0039 min−1) was observed in comparison to the respective rate in the bi-distilled water (k = 0.0040 min−1). On the contrary, in the presence of hydrochar suspensions (HCp), a significant decrease was observed for 50 mg L−1 hydrochar particle concentration (k = 0.020 min−1), while for higher concentrations (100 to 400 mg L−1), rate constants increased but with nonsignificant differences compared with the kinetics followed in the absence of them. Generally, the photodegradation rate of clothianidin, in the presence of HCw and HCp, is reduced compared to the photodegradation rate in bi-distilled aqueous solutions, except in the case of the aqueous suspension with an HCp concentration of 200 mg L−1. The transformation products (TPs) of clothianidin formed in the photolytic degradation processes were identified using ultrahigh-performance liquid chromatography coupled with accurate high-resolution mass spectrometry technique (UHPLC-LTQ-ORBITRAP). The formation profiles of TPs varied according to the matrix showing different degrees of participation of direct and indirect (photosensitized) phototransformation pathways. Photolytic degradation of clothianidin takes place mainly through denitration, hydroxylation and dechlorination pathways. Finally, the toxicity of the identified TPs was studied using the Vibrio fischeri bioassay. Toxicity was slightly reduced after 300 min of irradiation while maximum value was observed after 180–240 min of irradiation showing the formation of more toxic TPs along the photochemical degradation.

1. Introduction

Hydrochar is the final high-carbon solid product obtained by the hydrothermal carbonization (HTC) of biomass, which consists of thermochemical conversions taking place in water, usually at temperatures 180–260 °C and pressures 2–6 MPa for 5–240 min [1,2]. Hydrochar applications present positive effects on the environment such as CO2 capture, reduction in greenhouse gas emissions, etc.; amelioration of physicochemical characteristics; and fertility of the soil through the growth in organic matter. In addition, they can also be used as low-cost adsorbents to reduce pollution or remediate soils from pollutants such as heavy metals, phenolics, pesticides, etc. Hydrochar particles contain oxygen-functional groups (OFGs) on their surfaces [3,4,5,6], which are helpful for the production of the reactive oxygen species (ROS) that ultimately lead to the decomposition of pollutants in the environment [2].
Clothianidin ((E)-1-(2-chloro-1,3-thiazol-5-ylmethyl)-3-methyl-2-nitroguanidine) is an insecticide widely used in agriculture, belonging to the neonicotinoid group. Clothianidin is applied to target plants but can also reach other environmental substrates as a large percentage of the applied doses is dispersed in the environment [7]. Surface runoff appears to be the major route of transport of clothianidin to surface waters in agricultural areas [8,9,10,11]. In addition to surface runoff, vertical leaching through the soil zone profile is also probable. Clothianidin has moderate water solubility (340 mg L−1 at 20 °C, pH = 7) as well as low adsorption (logKoc = 2.08) and very high leaching potential with the Groundwater Ubiquity Score, GUS, equal to 4.91 [12]. As a result, clothianidin has been detected in surface waters and groundwater. It is also worth noting that clothianidin presents significant toxicity to bees and other organisms [13,14,15,16,17]. Clothianidin physicochemical characteristics and toxicity effects have resulted in the inclusion of clothianidin in priority lists of pollutants for aquatic systems.
Dissolved organic matter (DOM), derived primarily from the decomposition products of plant material, microorganisms, etc., plays a significant role in the abiotic processes affecting the fate of micropollutants in soil and water systems. Interest in the role of DOM originating from different sources has increased over the last few years. Char particles, such as biochar and hydrochar, and related DOM, play substantial roles in abiotic processes like photolysis in soil and aquatic environments [18,19]. Hydrochar presented less stable structure compared with biochar while containing more oxygen-functional groups. Both hydrochar and biochar can generate reactive oxygen species (ROS) (such as superoxide anion, hydroxyl radicals, singlet oxygen) during photolytic and/or photocatalytic processes [20,21]. The participation of ROS or energy transfer processes from DOM and char particles can play a significant role in the removal of priority pollutants in aquatic systems [22,23,24].
Based on the above, this study examined the effect of hydrochar particles and extracts on the photolytic degradation of the insecticide clothianidin, a priority pollutant, in aqueous suspensions and solutions, respectively. Focus is given to the kinetics under different concentrations of hydrochar and the formation of transformation products using LC high-resolution orbitrap mass spectrometry. According to the current state of knowledge, the effect of hydrochar on the photolytic fate of clothianidin has not been studied so far, while scarce studies have been reported on the effect of hydrochar particles and DOM on the photolytic degradation of environmental pollutants.

2. Materials and Methods

2.1. Materials and Chemicals

Clothianidin (CLOTH) (99.0% purity) was purchased from Dr. Ehrenstorfer GmbH (Augsburg, Germany). Formic acid (˃95% purity) was obtained from Sigma Aldrich (St. Louis, MO, USA). HPLC-grade solvent, acetonitrile (˃99.0% chromatographic purity), was supplied from Fisher Scientific (Loughborough, UK). Hydrochar (HC) was produced by HTC from dried olive pomace feedstock based on a previous publication [25]. Briefly, the feedstock of dried olive pomace (10 g) was homogenized with 40 mL of distilled water to obtain a biomass/water ratio of 1/4 (w/v). The HTC process was conducted in a 100 mL stainless steel autoclave reactor with a stirrer (Parr Instrument, Moline, IL, USA) at 220 °C. The target temperature was reached by heating at 7 °C min−1 and the final carbonization conditions were held for 40 min. At the end of the process, the reactor was left to cool down naturally at room temperature. The hydrochar was separated using vacuum filtration through 2.5 μm Whatman filters (Whatman, Little Chalfont, UK) and the obtained hydrochar was washed with distilled water and finally dried at 105 °C for 24 h. Bi-distilled water was used for all experiments.

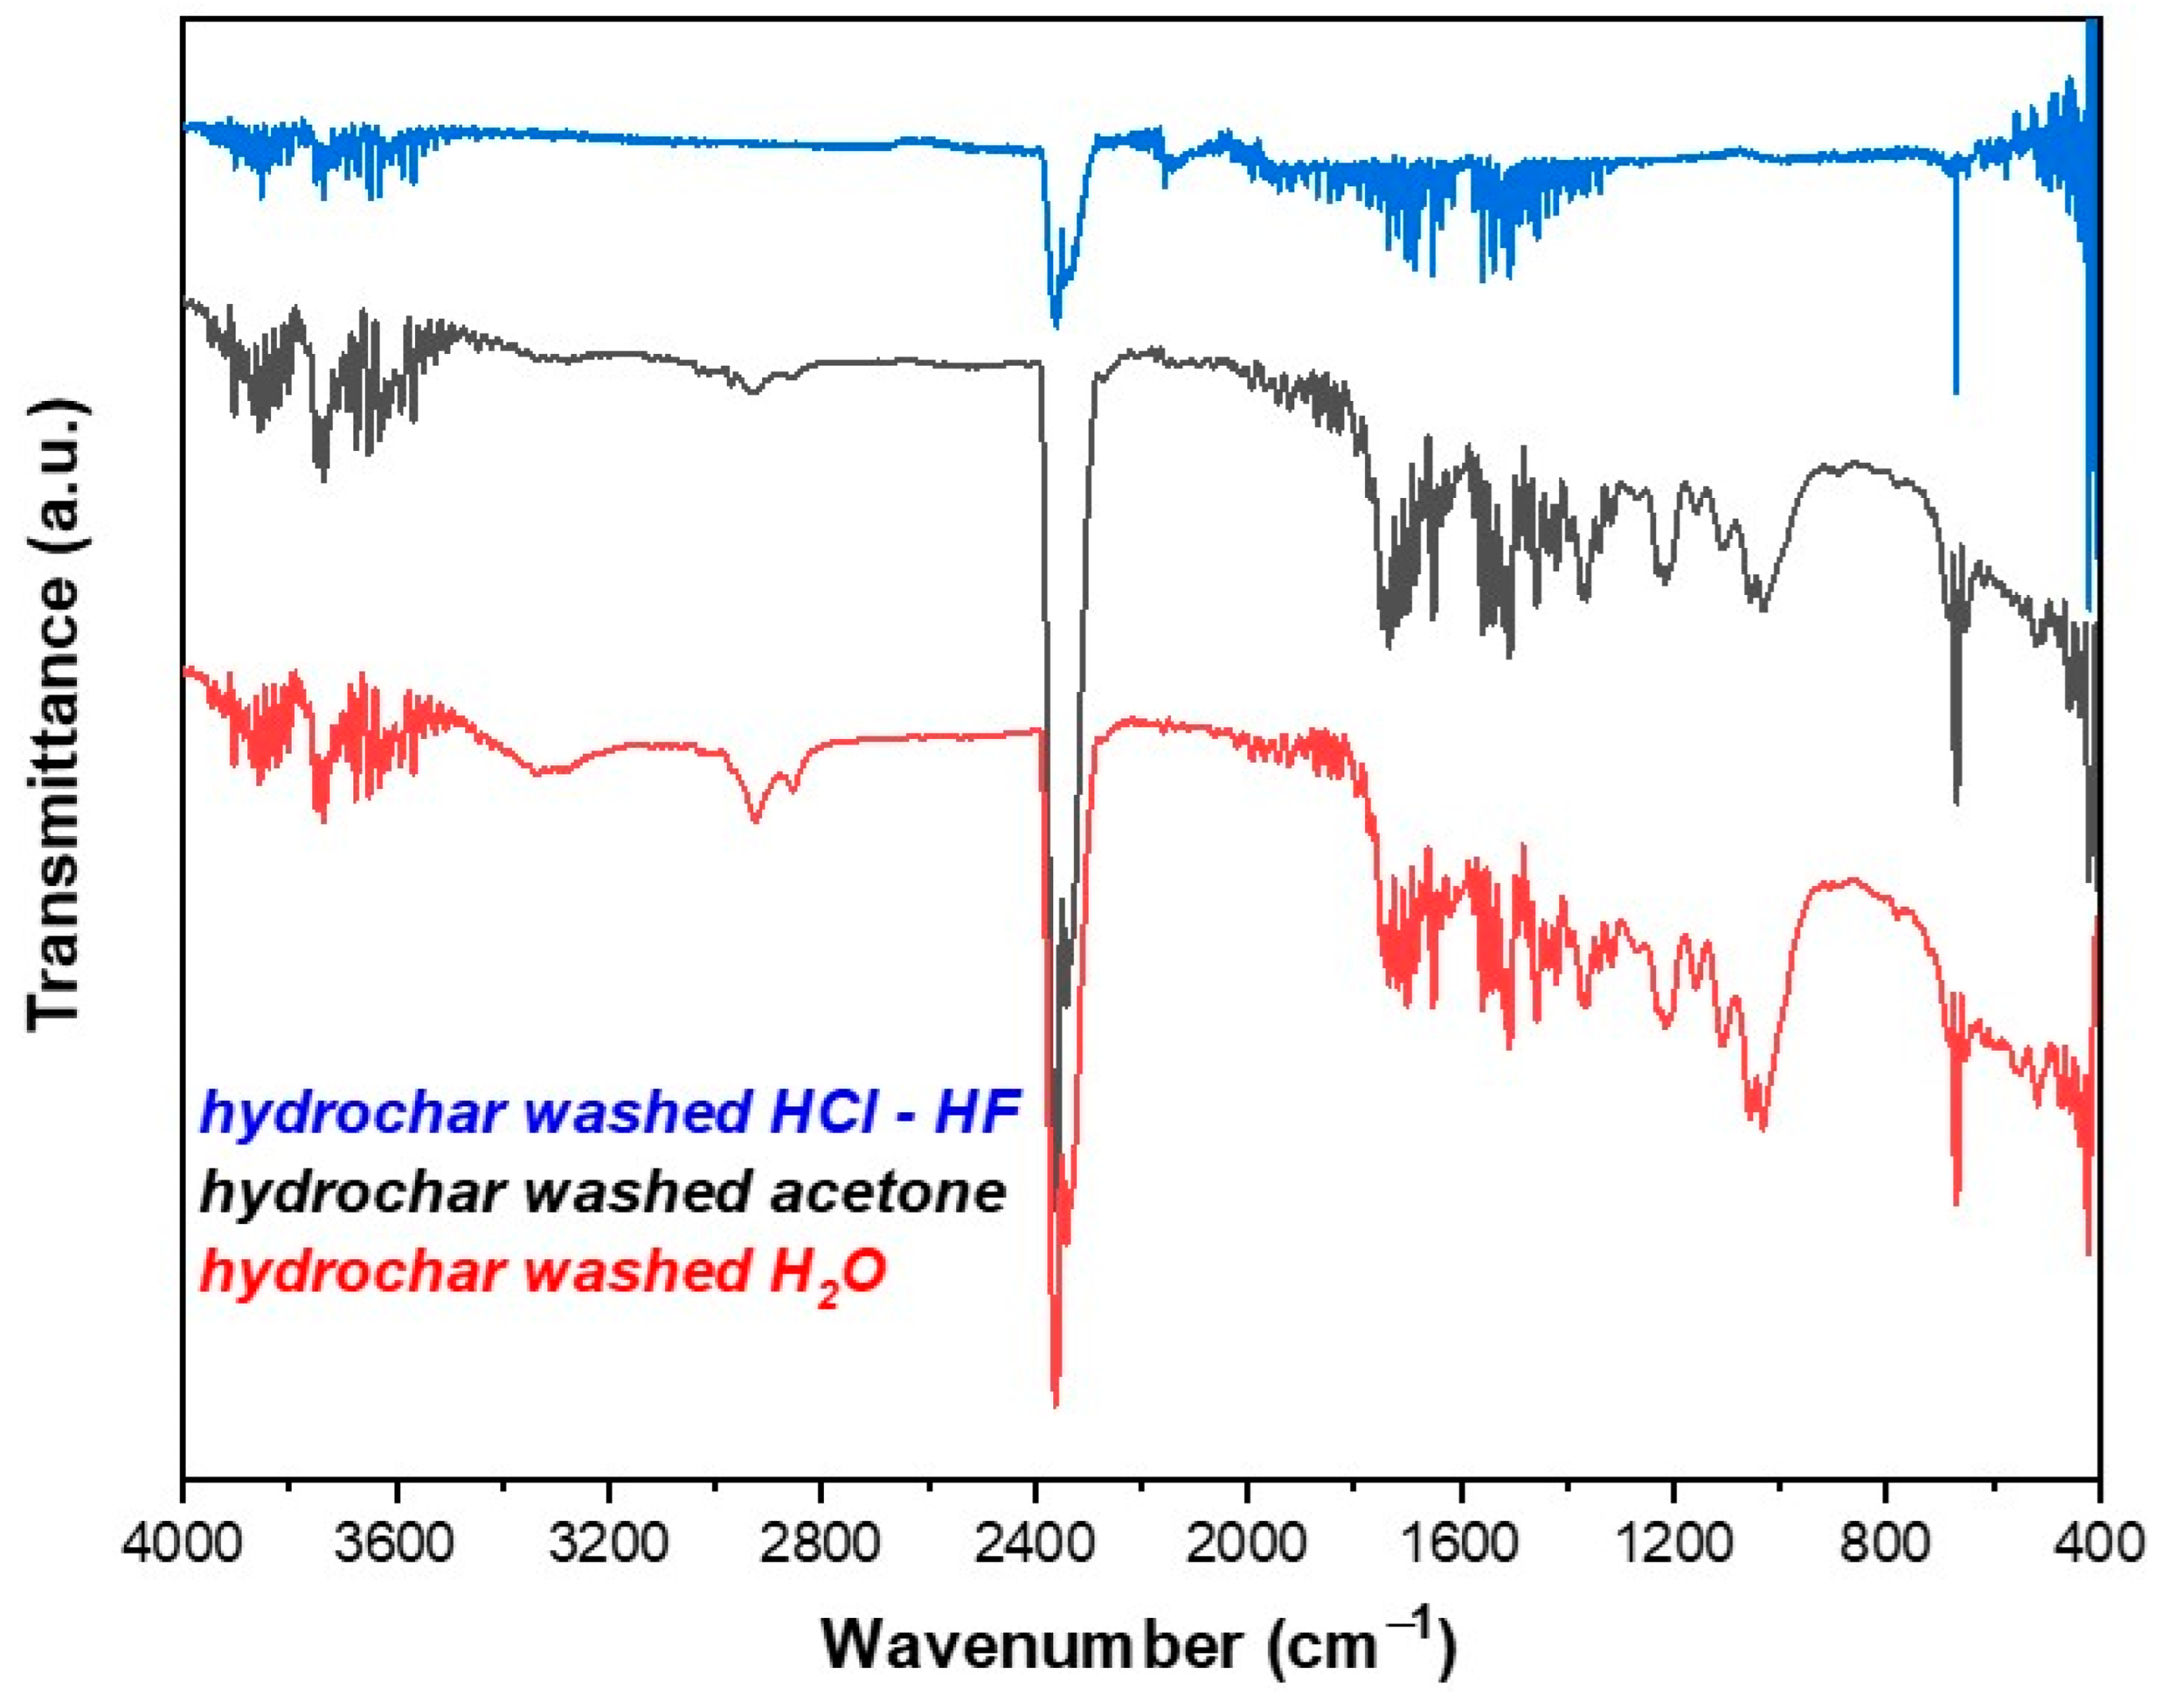
2.2. Structural Characterization of Hydrochar

The structural characterization of hydrochar was performed using attenuated total reflectance–Fourier transform infrared spectroscopy (ATR-FTIR). The IR spectra were recorded using the Shimadzu IR Spirit-T spectrophotometer (Kyoto, Japan) with a QATR-S single-reflection ATR equipped with a diamond prism in the range of 400–4000 cm−1. Firstly, the background was scanned before the measurements of the samples. The spectrums of the synthesized materials were scanned 45 times. Three experiments were performed with hydrochar particles washed with water, acetone and HCl-HF. Further characterization of hydrochar particles was reported elsewhere [18].
Specific surface area (SSA) was measured using a Quantachrome Autosorb-1 instrument (Bounton Beach, FL, USA) at 77 K. Amount of hydrochar (≈100 mg) was degassed at 150 °C for 3 h. SSA was determined at 5 m2 g−1 using the Brunauer–Emmett–Teller (BET) method. The elemental composition (C/N/H/S) of hydrochar was determined using a Eurovector EA 3100—Elemental Analyzer (Pavia, Italy). The analysis was carried out at 950 °C in the presence of oxygen (7 mL). The precent composition of hydrochar was 53.12% C, 1.32% N and 5.63% H. The pH of the hydrochar was measured using an 1:10 suspension and the pH of the supernatant after filtration (0.22 μm) was 5.2. The pH of hydrochar suspension at 400 mg L−1 concentration level was 5.8.

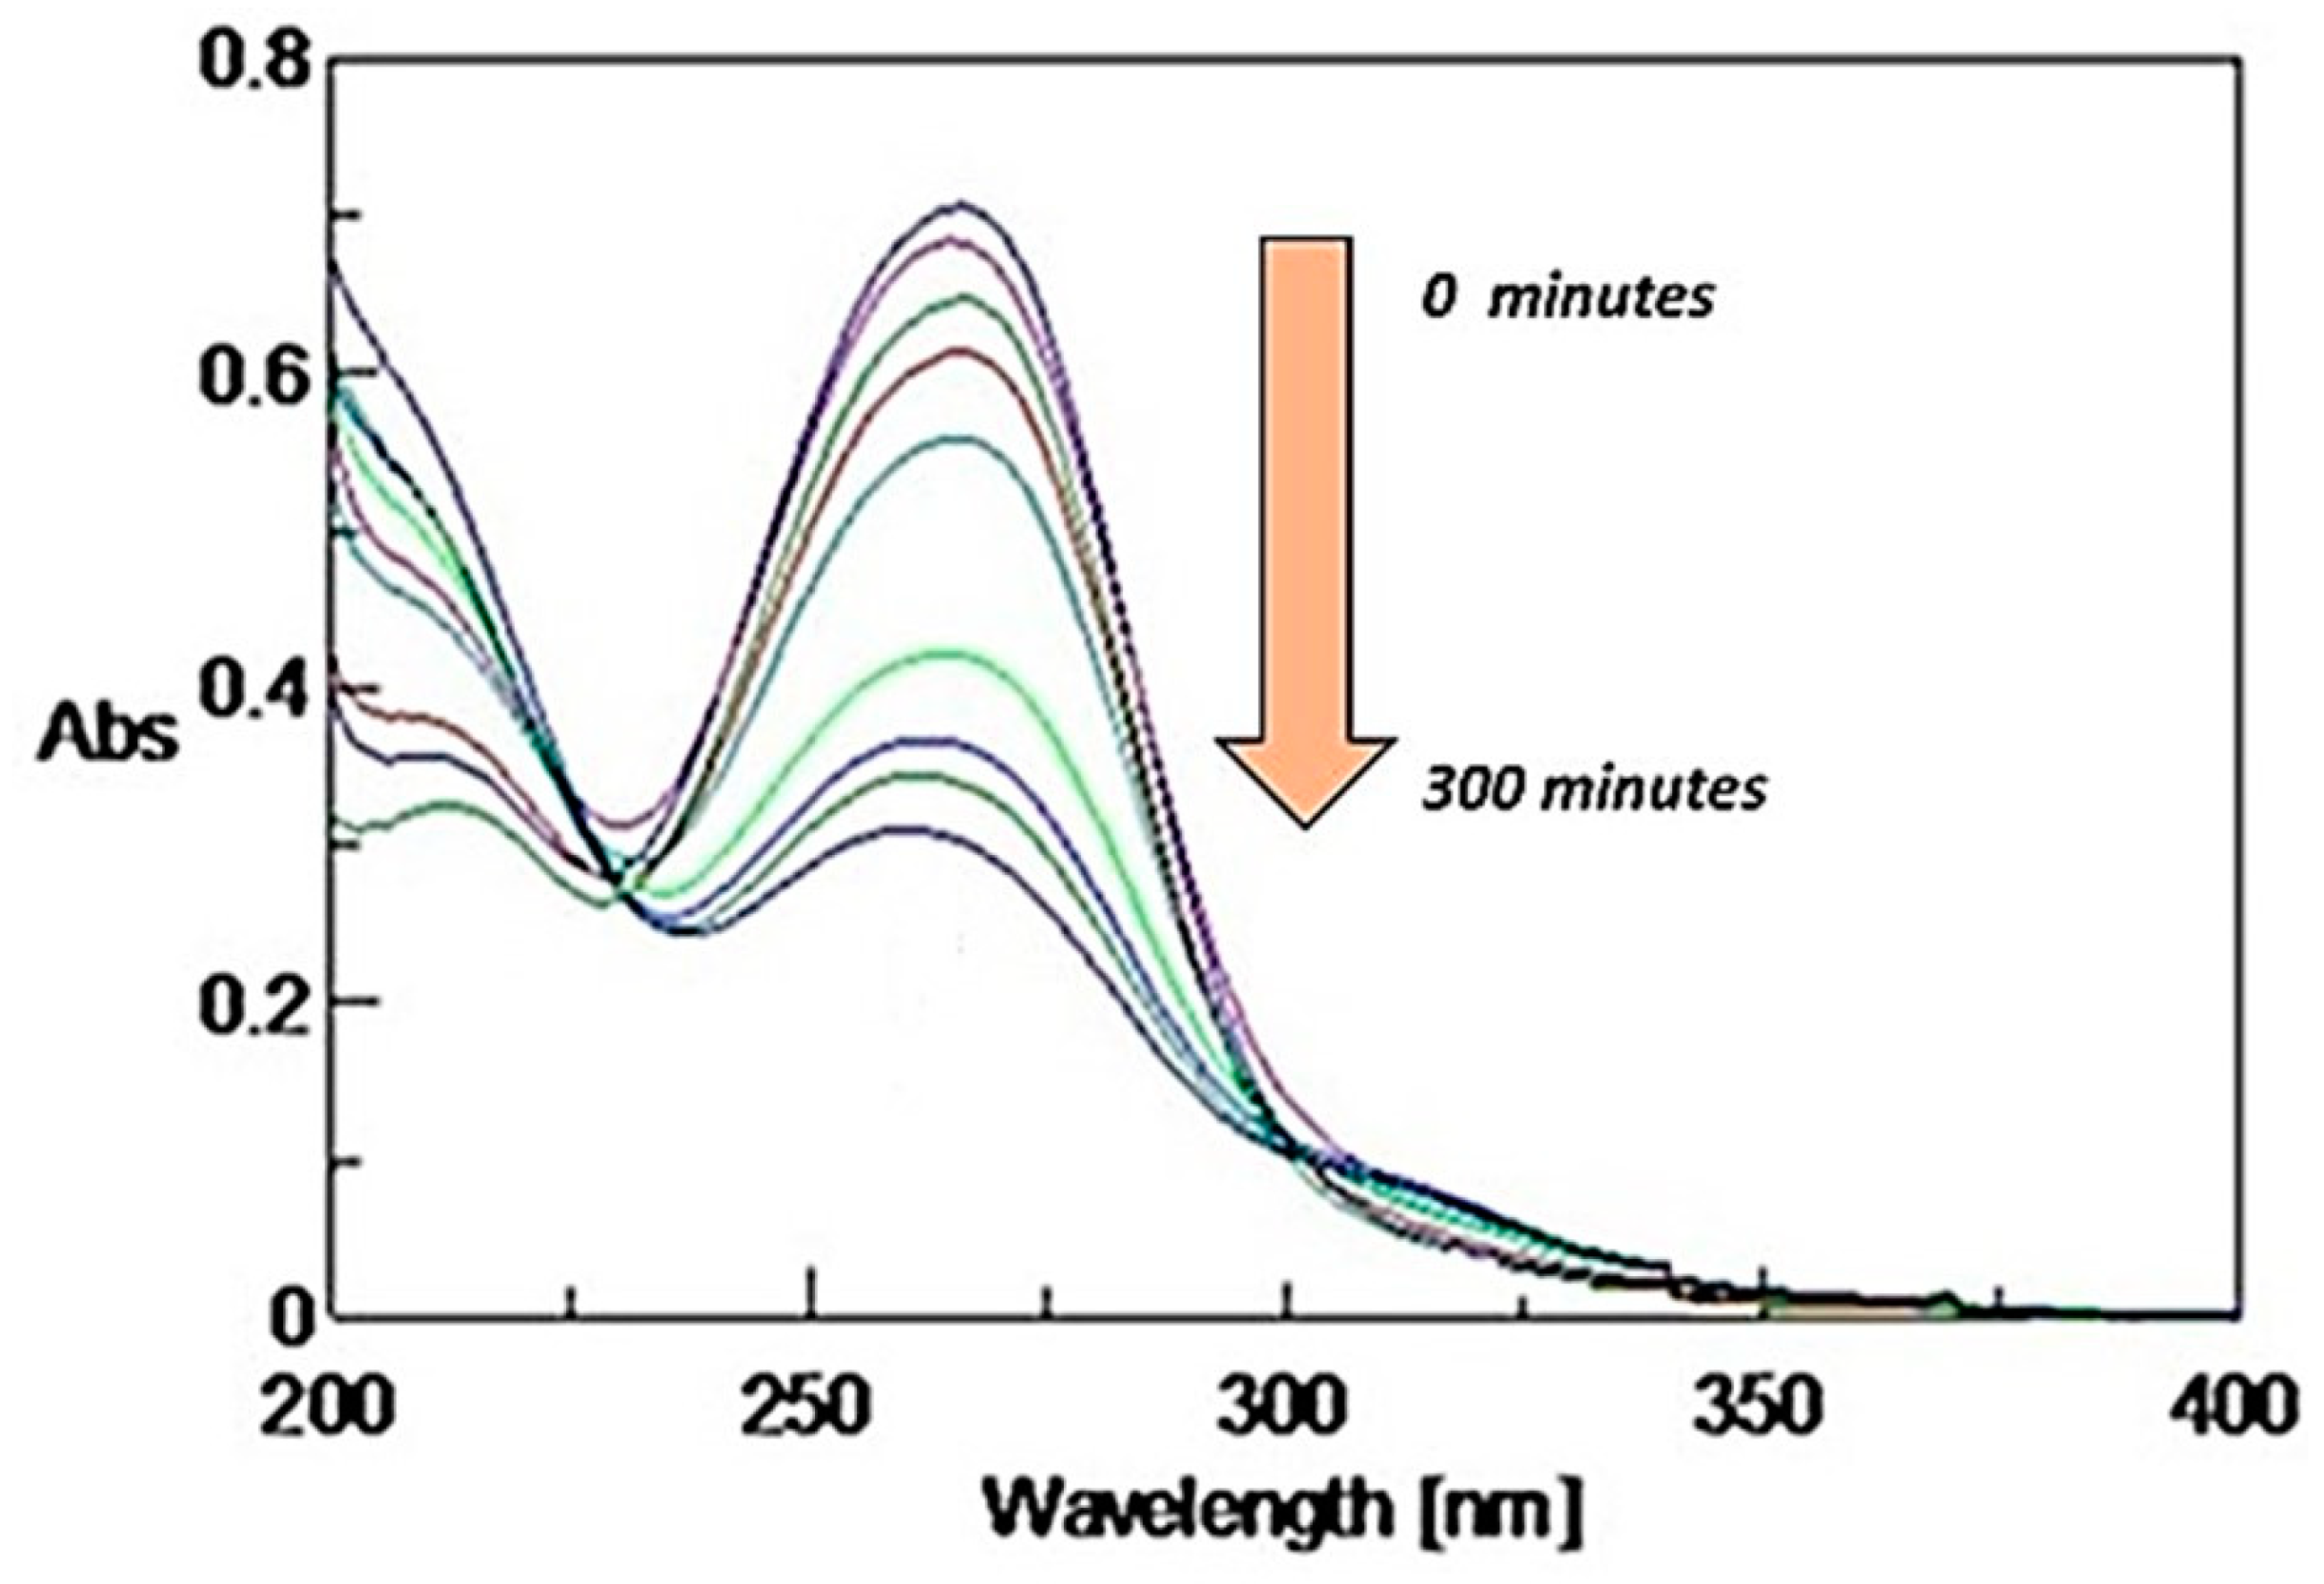
2.3. UV–Vis Spectroscopy Measurements

The absorption spectra of the samples during the photolytic process of clothianidin were obtained on a Jasco-V630 (Tokyo, Japan) dual-beam spectrophotometer. Bi-distilled water was used as the blank sample and spectra were recorded in the 200 to 400 nm wavelength range for all irradiated samples (0, 15, 30, 45, 60, 120, 180, 240, 300 and 360 min of irradiation).

2.4. Photodegradation Experiments

For the photodegradation experiments, appropriate amounts of hydrochar particles were added in bi-distilled water in order to prepare four different suspensions (HCp) (particle concentrations: 50, 100, 200 and 400 mg L−1). In addition, in order to assess the contribution of hydrochar-dissolved organic matter (DOM) to clothianidin photodegradation, aqueous extracts (HCw) of hydrochar particles using the same initial concentrations (50, 100, 200 and 400 mg L−1) were prepared by agitation for 3 h on a laboratory plate shaker (SM shaker, Bodelshausen, Germany), centrifuged for 15 min at 4000 rpm (Megafuge8, Thermo Scientific, Bremen, Germany) and filtered using 0.45 μm Durapore Membrane filters (Merck, Burlington, MA, Ireland). An aliquot of clothianidin aqueous stock solution was added to hydrochar suspensions (HCp) or water extracts (HCw) to obtain an initial concentration of 10 mg L−1.
Photodegradation experiments of clothianidin under simulated solar light (SSL) were performed on a SUNTEST XLS+ (Atlas, Linsengericht, Germany) solar simulator. The simulator is equipped with a Xenon (Xe) lamp, power 2.2 kW, respectively, and special glass filters to prevent the transmission of wavelengths below 290 nm and the intensity of the irradiation was adjusted to 750 Wm−2. A double-walled Duran® reactor was placed in the center of the chamber, thermostated at ambient conditions (≈21 ± 1 °C) by water circulation. The samples were placed in the glass reactor under magnetic and continuous stirring (Velp, Scientifica, Usmate, Italy) and aliquots were taken at 0, 15, 30, 45, 60, 120, 180, 240 and 300 min and filtered through syringe filters (0.45 μm) for the separation of hydrochar particles. Reference photodegradation experiments also took place in bi-distilled aqueous solutions without hydrochar particles or extracted DOM under the same irradiation conditions.

2.5. Analytical Methods

The concentrations of clothianidin were determined using high-performance liquid chromatography (HPLC) (LC-10AD, Shimadzu, Kyoto, Japan) equipped with a diode array detector (SPD-M10A), C18 column (Discovery 150 mm length × 4.6 mm ID and 5 μm particle size) and thermostated at 30 °C (column oven, CTO-10A, Shimadzu, Kyoto, Japan). The mobile phase was a mixture (H2O with 0.1% formic acid): acetonitrile (80:20) and isocratic elution at a flow rate of 1 mL min−1. The clothianidin was detected at a wavelength of 267 nm.
The determination and identification of transformation products of clothianidin during the photolytic degradation were performed using an ultrahigh-performance liquid chromatography (UHPLC) Accela LC system coupled with a hybrid LTQ-FT Orbitrap XL 2.5.5 SP1 mass spectrometer, which was equipped with an electrospray ionization source (ESI) (Thermo Fisher Scientific, Inc., GmbH, Bremen, Germany). The separation of CLOTH and its TPs was performed using a reversed phase Hypersil Gold C18 (Thermo Fisher Scientific) analytical column (100 × 2.1 mm, 1.9 μm). Both chromatograms and mass spectra were monitored and processed with Xcalibur 1.2 software. To achieve the desired operation of the instrument, the mass spectrometry detector was calibrated externally (mass accuracy ≤ ±5 ppm). The analysis was performed using a mass range scan m/z 90–600, resolution of 60,000 in full scan mode and 15,000 in MS/MS mode with automatic ion selection (data-dependent mode). The injection volume was 20 μL, the column temperature was adjusted to 35 °C while for the mobile phase, water with formic acid (0.1% v/v) was used as solvent A and methanol with formic acid (0.1% v/v) as solvent B. The elution program was set as follows: 0–2 min 95/5 A/B, 2–3 min 90/10 A/B and stay for 2 min, 5–10 min 50/50 A/B, 10–13 95/5 A/B, where it stays for 2 min. The flow rate was 250 μL min−1 and each sample’s assay time was set at 18 min.
The degree of mineralization of clothianidin along the photolytic degradation treatments was followed by ion chromatography (Shimadzu, Kyoto, Japan) equipped with a conductivity detector (CDD-6A) and a Shim-pack IC-A3 column (15 mm × 4.6 mm, 5 μm particle size). An aqueous solution of phthalic acid and TRIS (tris (hydroxymethyl) aminomethane) was used as the mobile phase. Elution was performed isocratically at a flow rate of 1.2 μL min−1 while the oven temperature was set at 40 °C and the injection volume set at 100 μL. The total analysis time for each sample was 15 min.

2.6. Determination of Toxicity with the Microtox Technique

The toxicity of the samples during the photolytic process of clothianidin was determined using the bioassay of Vibrio fischeri bacteria. These bacteria emit bioluminescence as a result of their cellular respiration and metabolic process. Inhibition of their bioluminescence indicates a reduced respiration rate and therefore suggests their coexistence with toxic compounds that inhibit their normal cellular activity.
The Microtox 500 Analyzer (Azur Environmental, Carlsbad, CA, USA) luminometer was used for the analysis. The instrument was operated with Microtox Omni v1.18 software and sample evaluation was performed according to the 81.9% Basic Test protocol following the manufacturer’s instructions. Both the bacteria in solid frozen form (acute reagent) and the reconstitution solution used to activate them were purchased from Modern Water (New Castle, DE, USA).

3. Results

3.1. Characterization of Hydrochar

Figure 1 shows the ATR-FT-IR spectra of the hydrochar. The broad peak at 3340 cm−1 is attributed to stretching vibrations of hydroxyl groups. The double peak in the range 2800–3000 cm−1 is assigned to stretching vibrations of the aliphatic bond C–H of aromatic compounds while the peak at 2380 cm−1 is attributed to the carbon dioxide (CO2) in the laboratory environment. The peaks in the range of 1800–1600 cm−1 and 1600–1500 cm−1 are attributed to asymmetric stretching vibrations of the C=O bond of carboxylic groups and to stretching vibrations of the C=C bond of aromatic rings, respectively. The peaks between the range of 1450–1200 cm−1 are associated with the bending vibrations of the C–H bond of aliphatic carbon atoms while the peak at 1030 cm−1 is associated with stretching vibrations of the C–O bond. Finally, the peak located between 600–800 cm−1 is attributed to bending vibrations of the C–H bond of aromatic compounds [19,20,25]. Comparing the spectrum of hydrochar particles washed with water with those of the particles washed with acetone and hydrochloric–hydrofluoric acid, it can be observed that in all cases, the peaks of these spectra are reduced or completely eliminated due to the elimination of organic matter from the surface of the hydrochar.

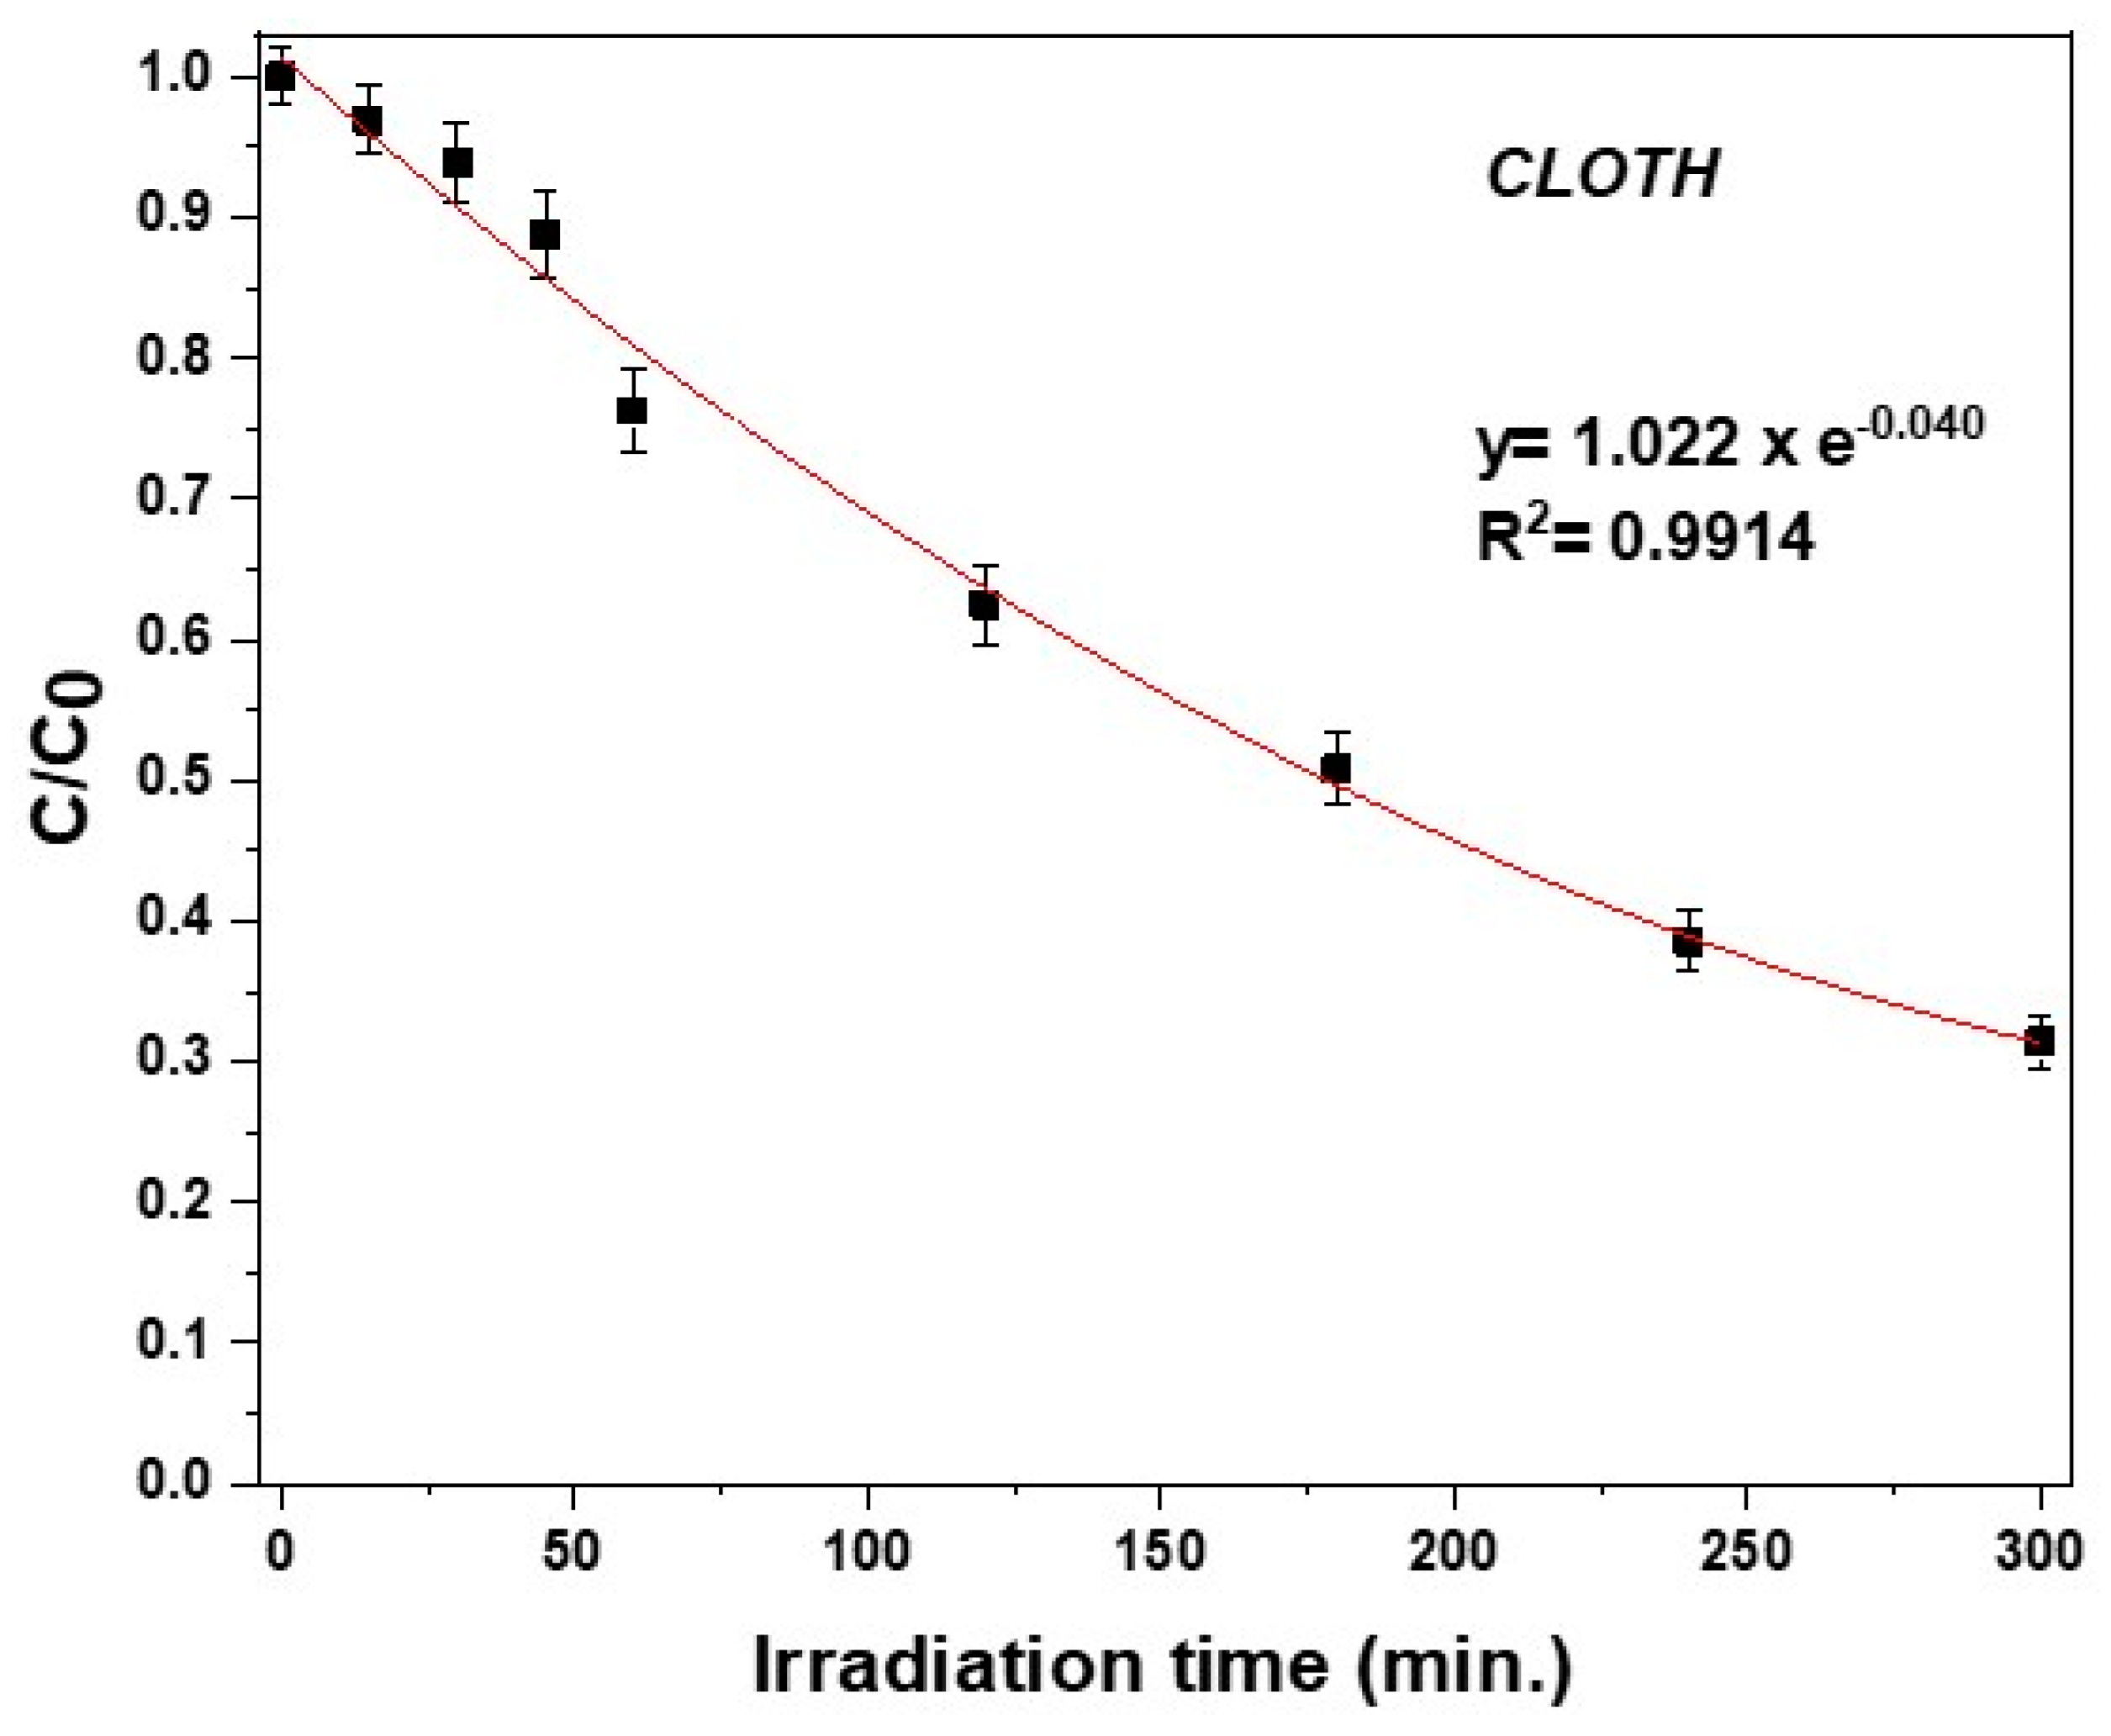
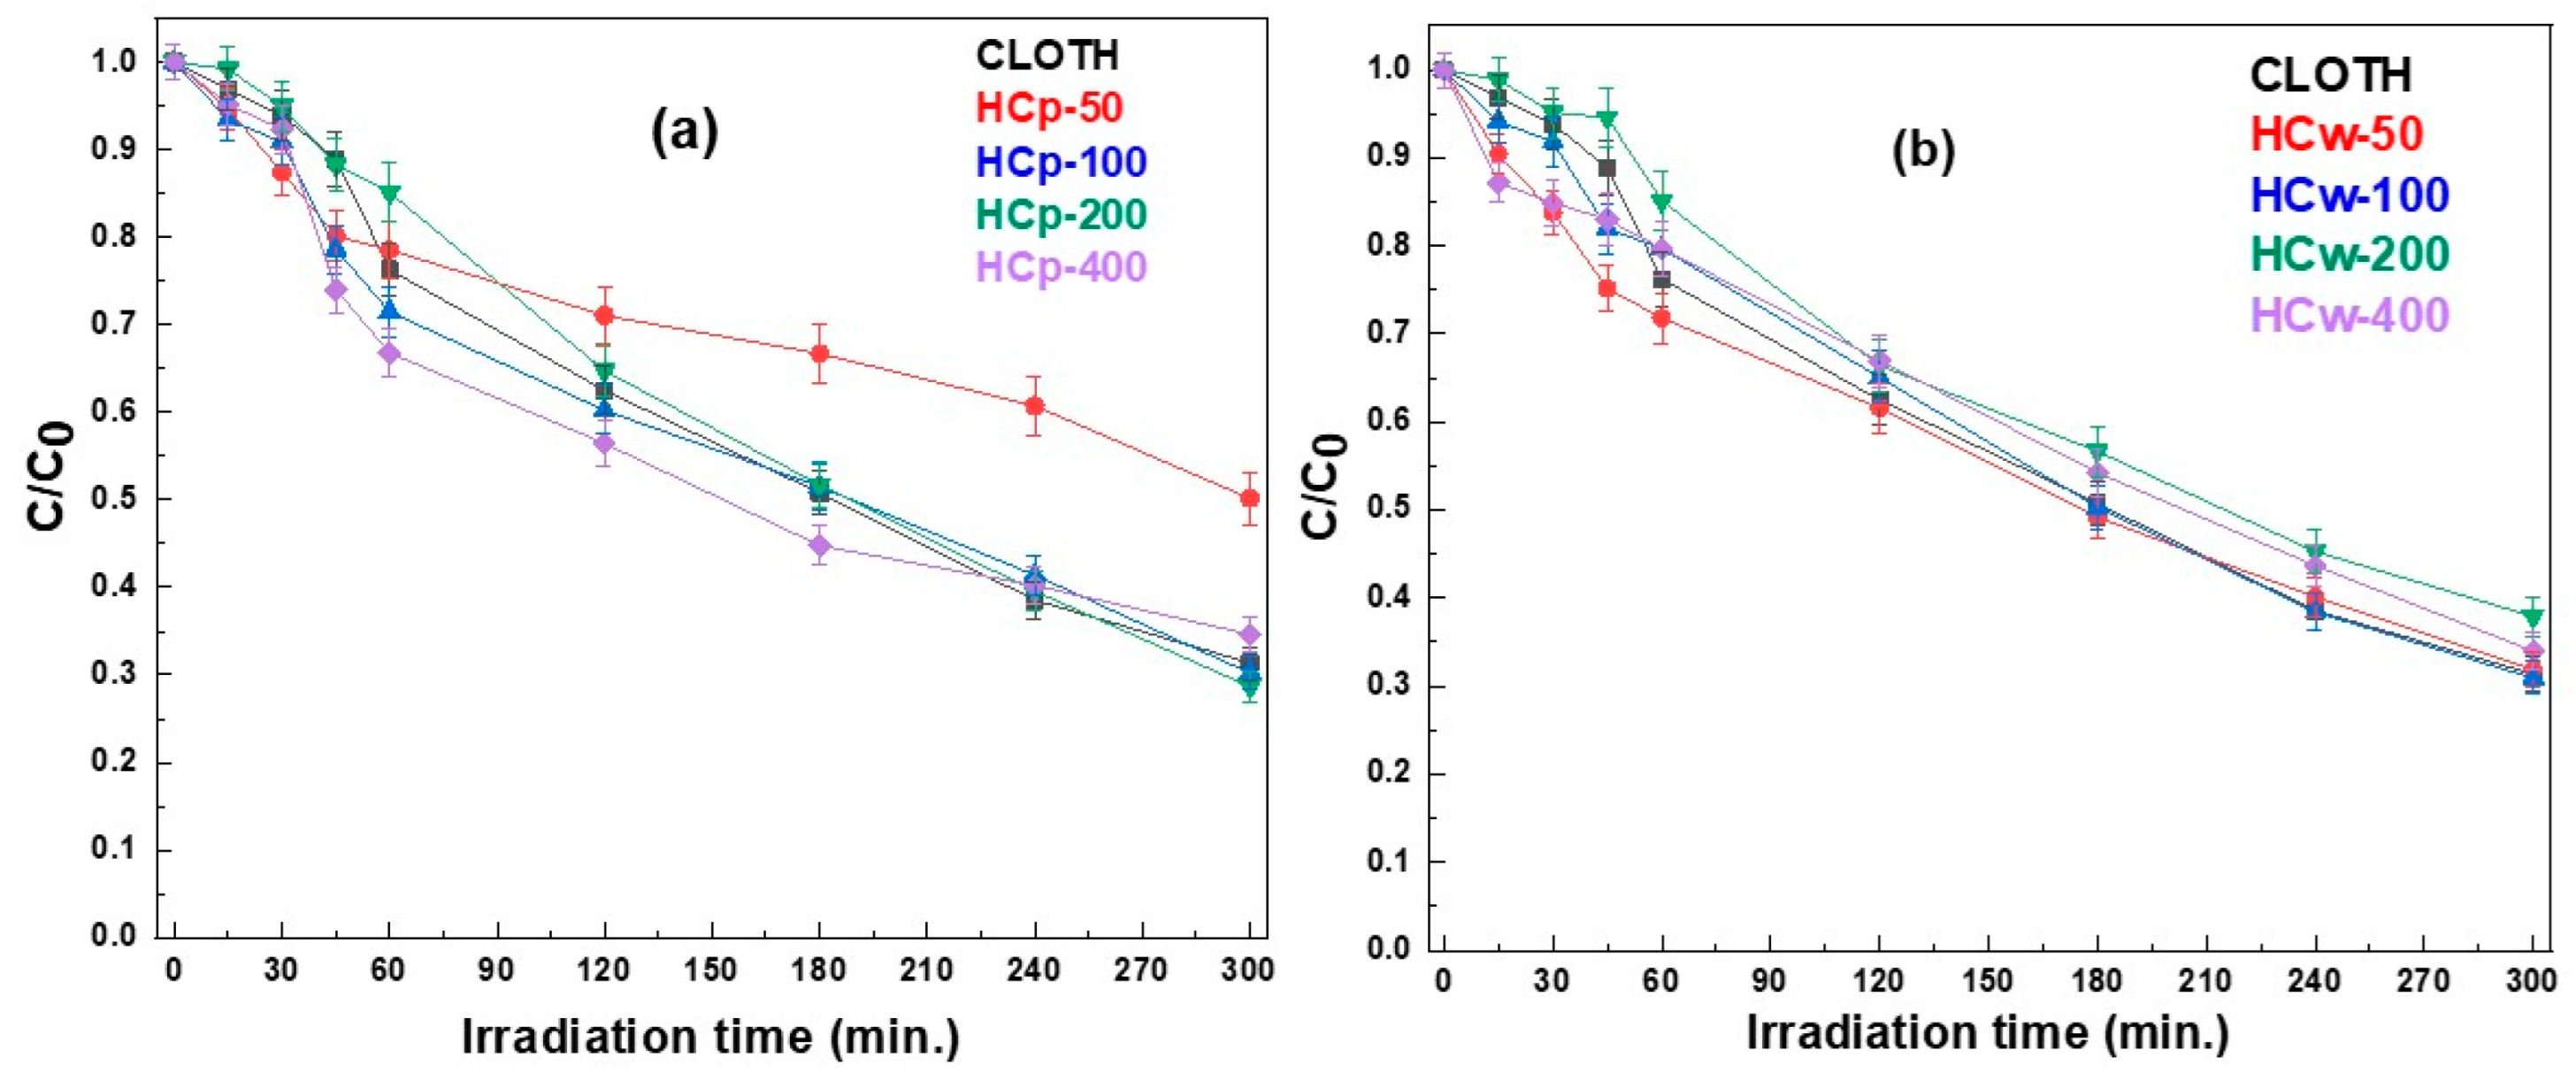
3.2. Photodegradation of Clothianidin in Hydrochar Aqueous Suspensions and Aqueous Extracts

Firstly, a preliminary photodegradation experiment of clothianidin in bi-distilled aqueous solutions (C0 = 10 mg L1) (without the presence of hydrochar) was carried out in order to compare the effect, either positive or negative, of hydrochar particles and dissolved organic matter (DOM). Dark adsorption of clothianidin in hydrochar particles was <7.5% for the higher concentration of hydrochar particles (400 mg L1). The photolytic degradation kinetics of clothianidin in bi-distilled water followed first-order kinetics, as shown in Figure 2. The half-life (t1/2) calculated using the equation t1/2= ln2/k was 173.3 min (Table 1).
The degradation kinetics of clothianidin in the presence of hydrochar aqueous suspensions and aqueous extracts are presented in Figure 3. The experimental degradation also data fitted well with first-order kinetics in all cases. The model equations, parameters, correlation coefficients (R2) and estimated half-life are shown in Table 1.
In the presence of hydrochar suspensions, the slowest degradation rate of clothianidin was observed for the suspension with the lower hydrochar particle concentration (HCp-50, 50 mg L1) with a half-life of 346.5 min (Figure 3a and Table 1). An increase in photocatalytic degradation kinetics was observed with increasing hydrochar concentration to a concentration level of 200 mg L1 (HCp-200) (DT50 = 165 min) followed by a decrease for the concentration level of 400 mg L1 (HCp-400) (DT50 = 267.5 min). Compared with the direct photolysis of clothianidin (DT50 = 173.3 min), all kinetics were slower (half-lives at 346.5, 182.3 and 267.5 min for the HCp-50, HCp-100 and HCp-400, respectively) with the exception of kinetics in the presence of hydrochar with a concentration of 200 mg L1, which was found to be slightly but not significantly increased.
Regarding the degradation of clothianidin in the presence of hydrochar DOM (water extracts), slower but non-significantly different rates were observed compared with the direct photolysis kinetics in bi-distilled water. In more detail, there was a slight increase in the photolytic degradation kinetics when increasing hydrochar concentrations from 50 mg L1 (HCw-50) to 100 mg L1 (HCw-100) with a half-life of 192.5 and 177.7 min, respectively. Afterwards, for the solutions prepared with the higher concentrations of hydrochar particles, i.e., 200 and 400 mg L1 (HCw-200, HCw-400), a further decrease was observed with a half-life of 203.8 min for both of them (Figure 3b and Table 1). Based on the above trends, the DOM from the hydrochar could be suggested to mainly play the role of an optical filter, contributing to the reduction in degradation. Comparison of the degradation rates of clothianidin in the presence of aqueous extracts and suspensions, in pairs, led to the observation that the photodegradation rate in aqueous extracts provided from hydrochar concentrations of 50 mg L1 was higher compared to the degradation rate in aqueous suspension with the same concentration. However, for hydrochar concentrations equal to or larger than 100 mg L1, the degradation rate became practically identical or slightly lower in extracts than in the respective suspensions (Table 1).
Summarizing the above results, we conclude that there is a decrease in the rate of photolytic degradation of clothianidin in aqueous suspensions and extracts compared to in the absence of hydrochar. The dissolved organic matter resulting from the hydrochar particles in the aqueous suspensions and extracts slows down the photodegradation of clothianidin. Thus, indirect photolysis does not play a significant role in clothianidin photodegradation, as also reported elsewhere [17]. Based on the observed kinetics (Table 1), it seems that the hydrochar particles have a dual effect on the photolytic degradation, a negative one with the absorption of part of the irradiation acting as optical filters and a positive one with the production of reactive oxygen species (ROS) (e.g., OH, 1O2, etc.) or through photosensitization with energy transfer [19]. The observed kinetics is the result of the contribution of direct and/or indirect photolysis compared to the attenuation of light due to the presence of hydrochar particles and DOM.
Chen and coworkers reported that hydrochar could generate much more H2O2 and OH under daylight irradiation than in dark light and compared with pyrochar for the sulfadimidine (SM2) degradation. In particular, they found that the undissolved hydrochar could generate H2O2 and OH under daylight irradiation but the generation of ROS by dissolved hydrochar was poor [19]. Serelis et al. identified major ROS involved in the photolytic process depending on the aqueous matrix. Specifically, they investigated the effect of biochar and hydrochar particles and/or dissolved organic matter under solar simulated light irradiation during the photolysis of metribuzin. According to scavenging experiments, they concluded that the main reactive intermediates photogenerated by biochar, hydrochar suspensions and hydrochar DOM extracts are the hydroxyl radicals (OH) in combination with singlet oxygen (1O2). It also resulted that char suspensions produced a higher (OH) than the corresponding char DOM extracts solutions, but less (1O2) than them [25].
Clothianidin (C0 = 10 mgL−1; I = 750 Wm−2) degradation was also followed in terms of UV-Vis spectra evolution along photolysis time (0, 15, 30, 45, 60, 120, 240, 300 min) (Figure 4). The clothianidin characteristic absorption peak at 267 nm was continuously decreased along the irradiation treatment, consistent with photolytic degradation kinetics.
Table 2 presented photodegradation data of clothianidin reported previously. All kinetics were reported to follow a pseudo-first-order model. Different light sources and conditions were thus used, as direct comparison cannot be made.

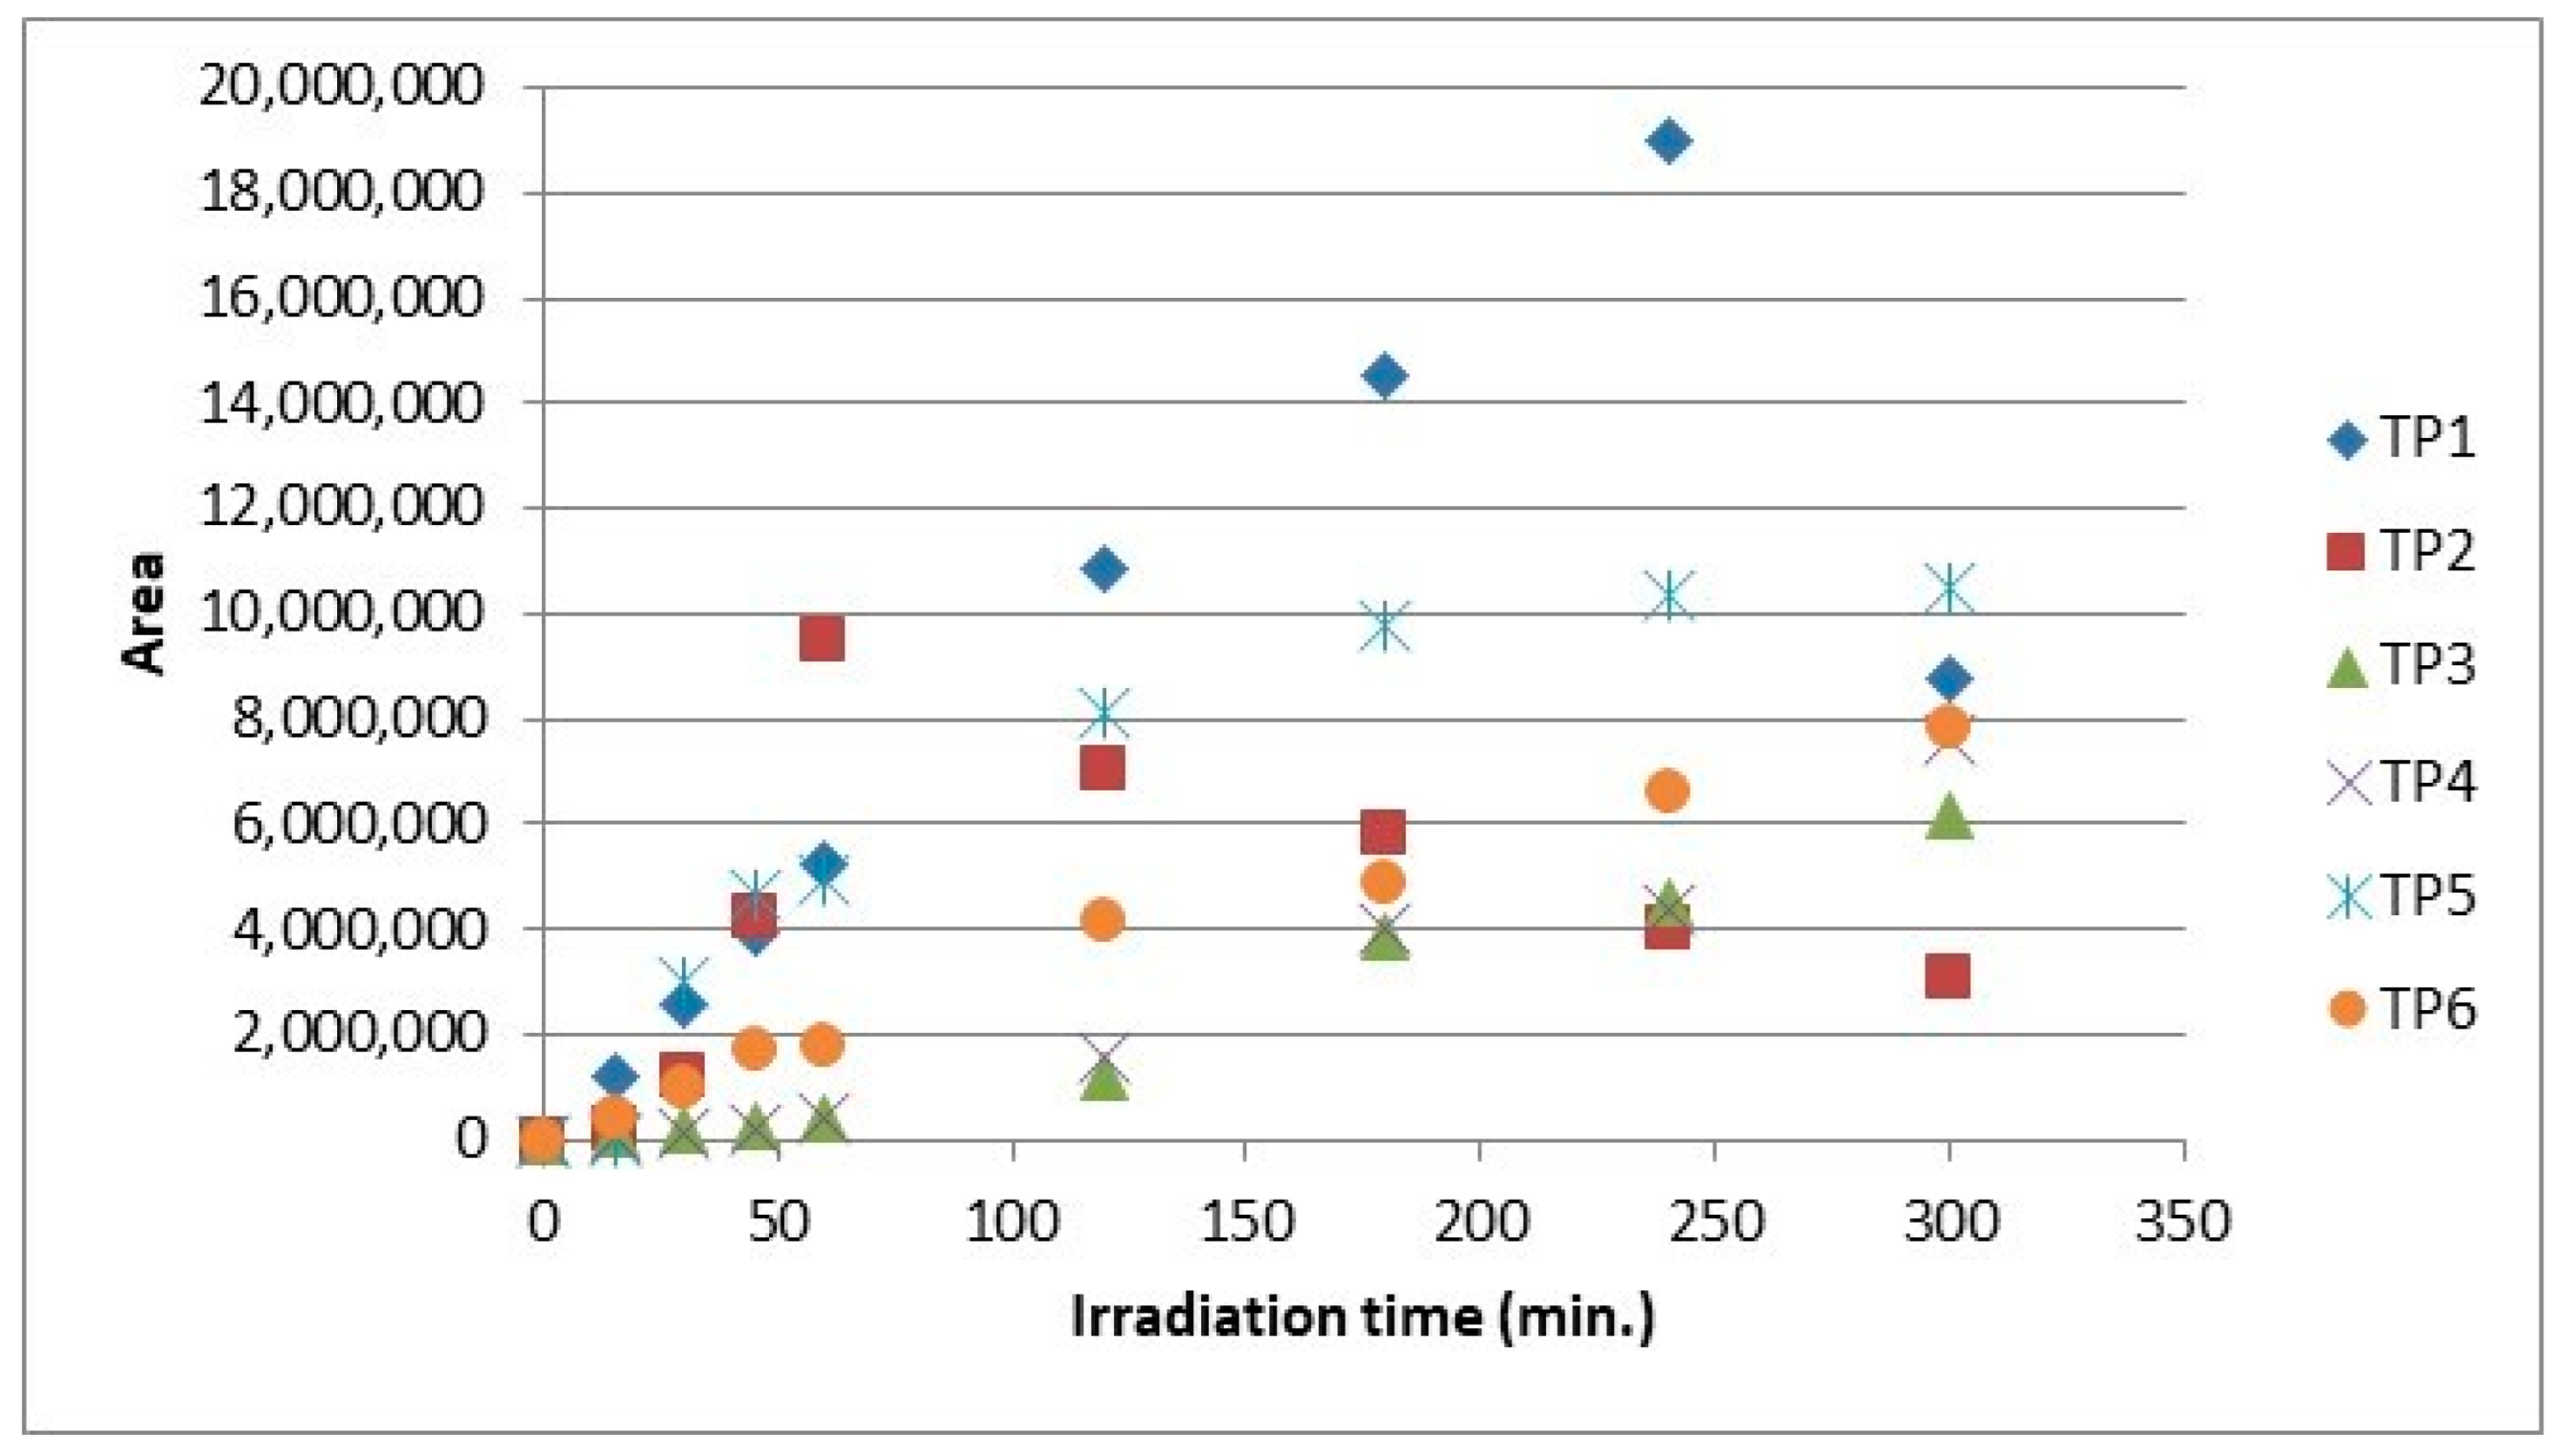
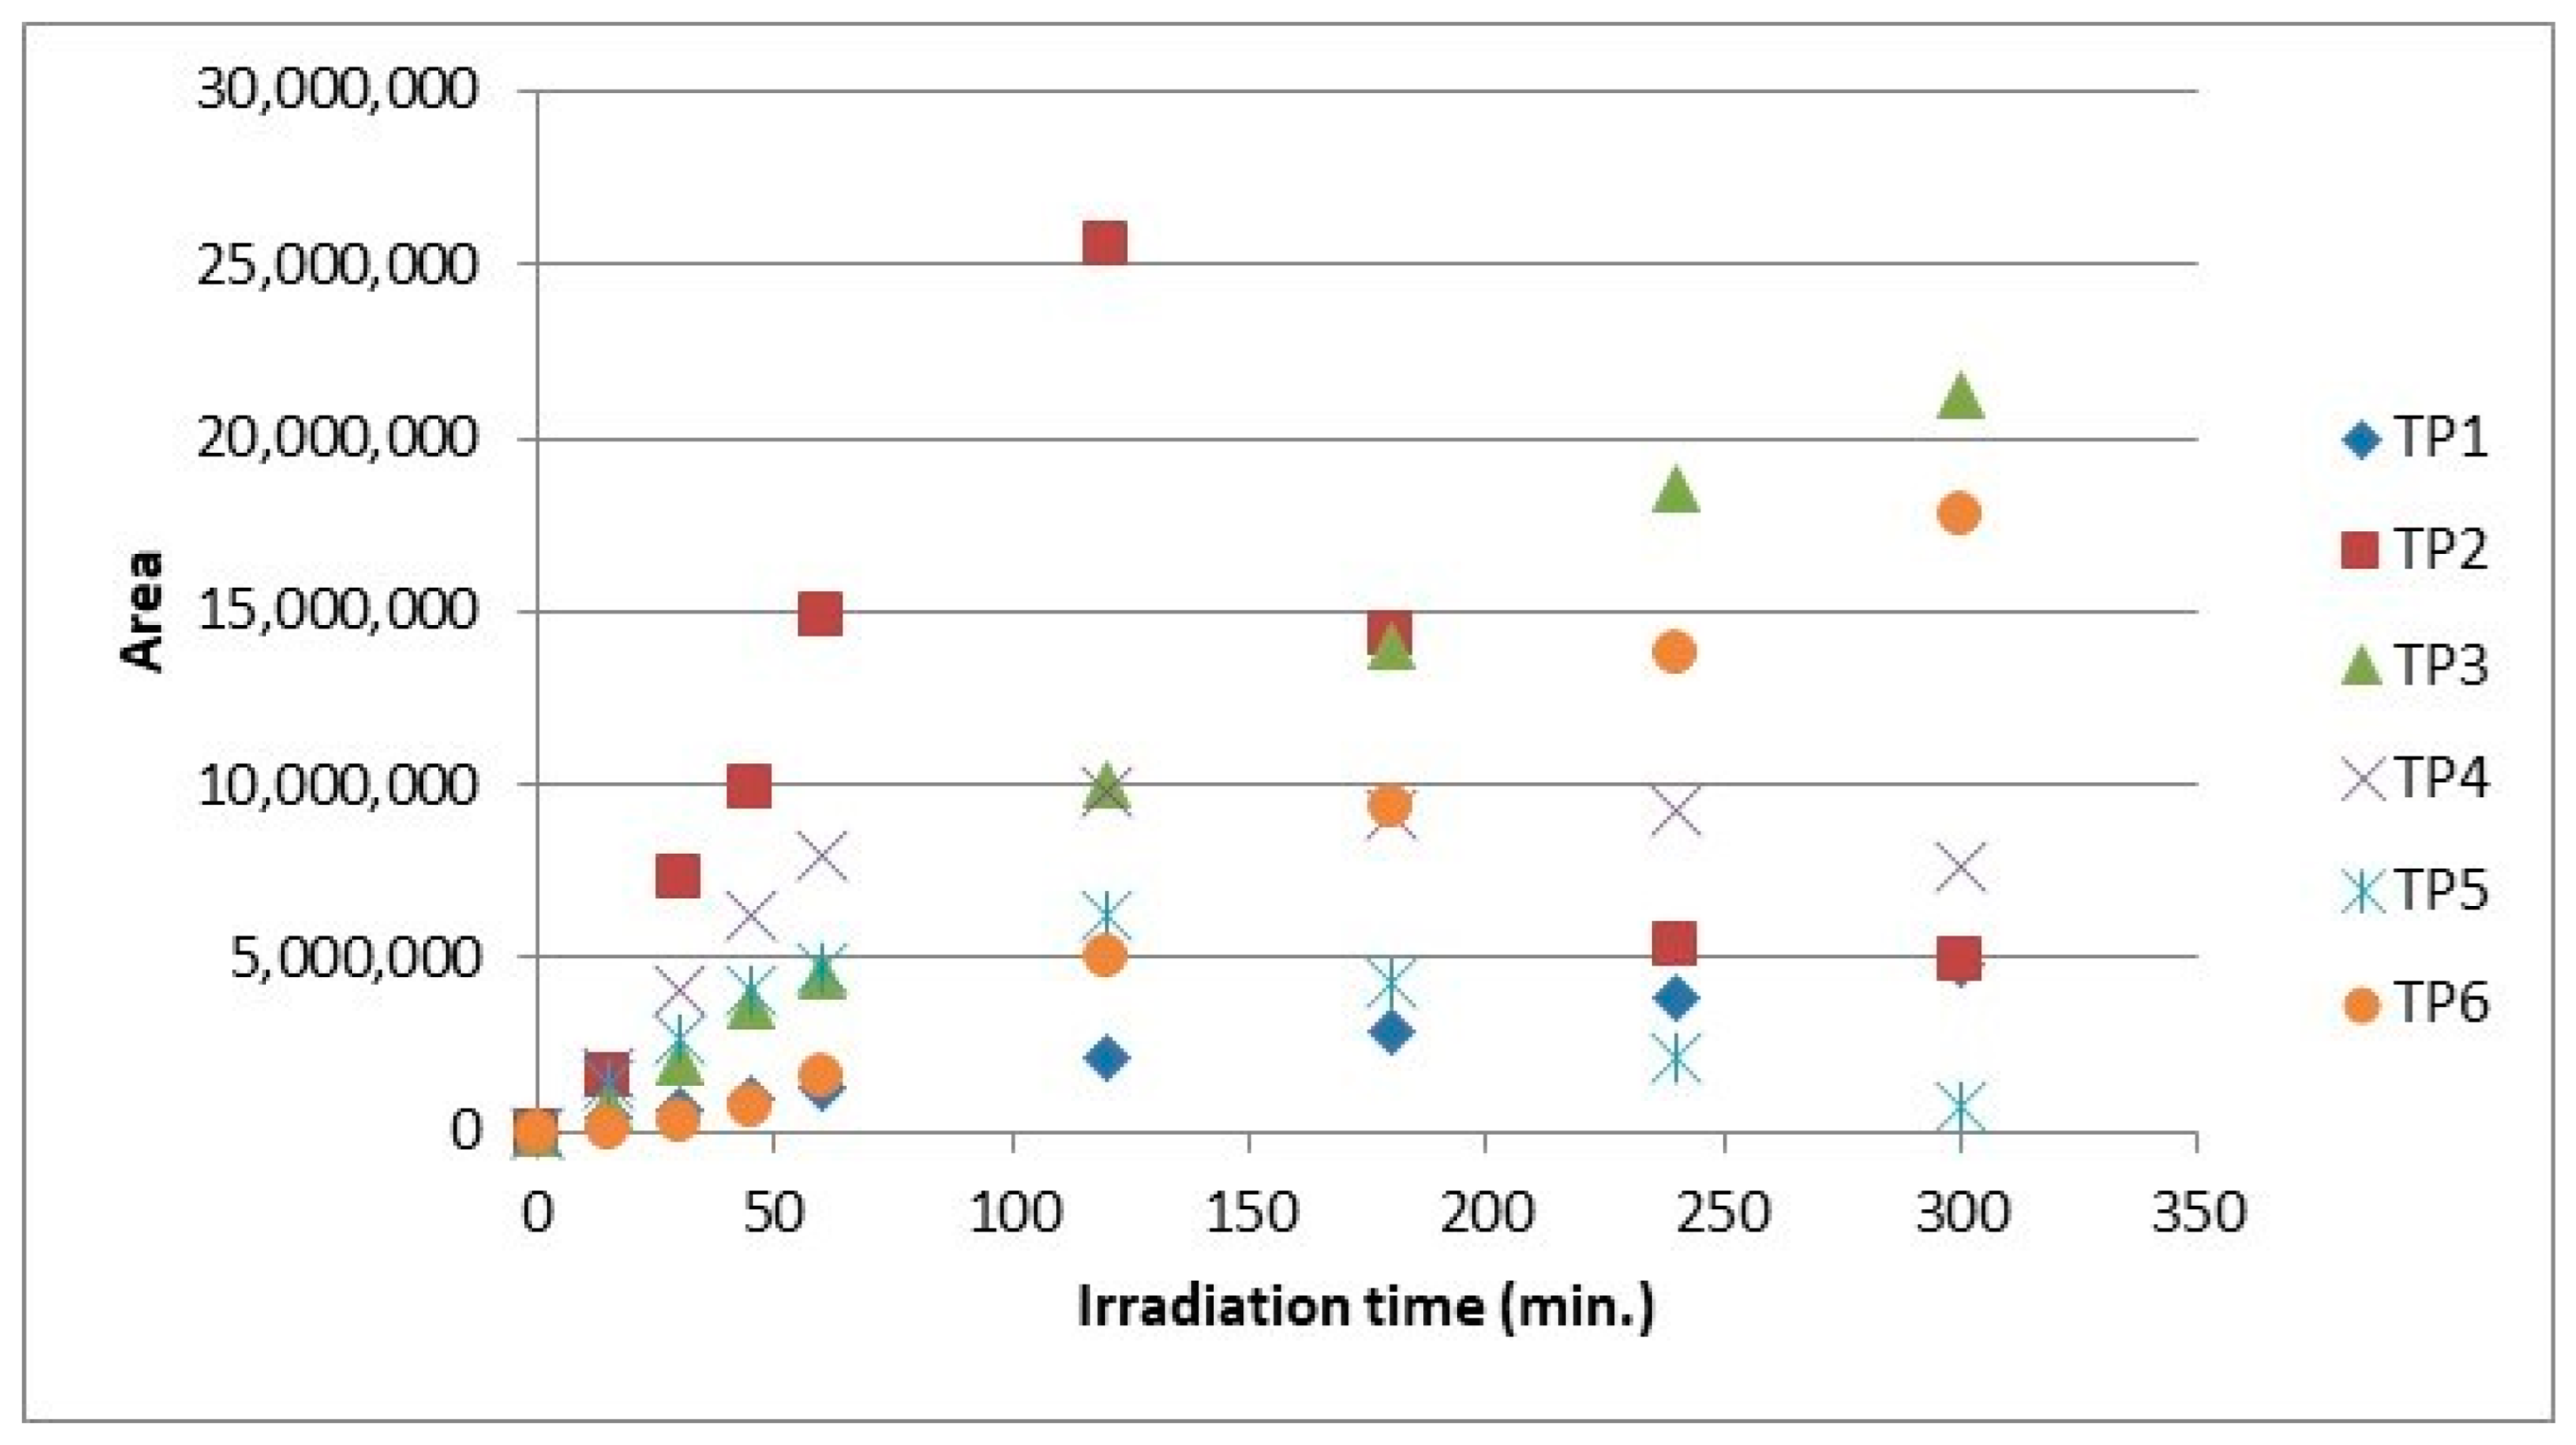
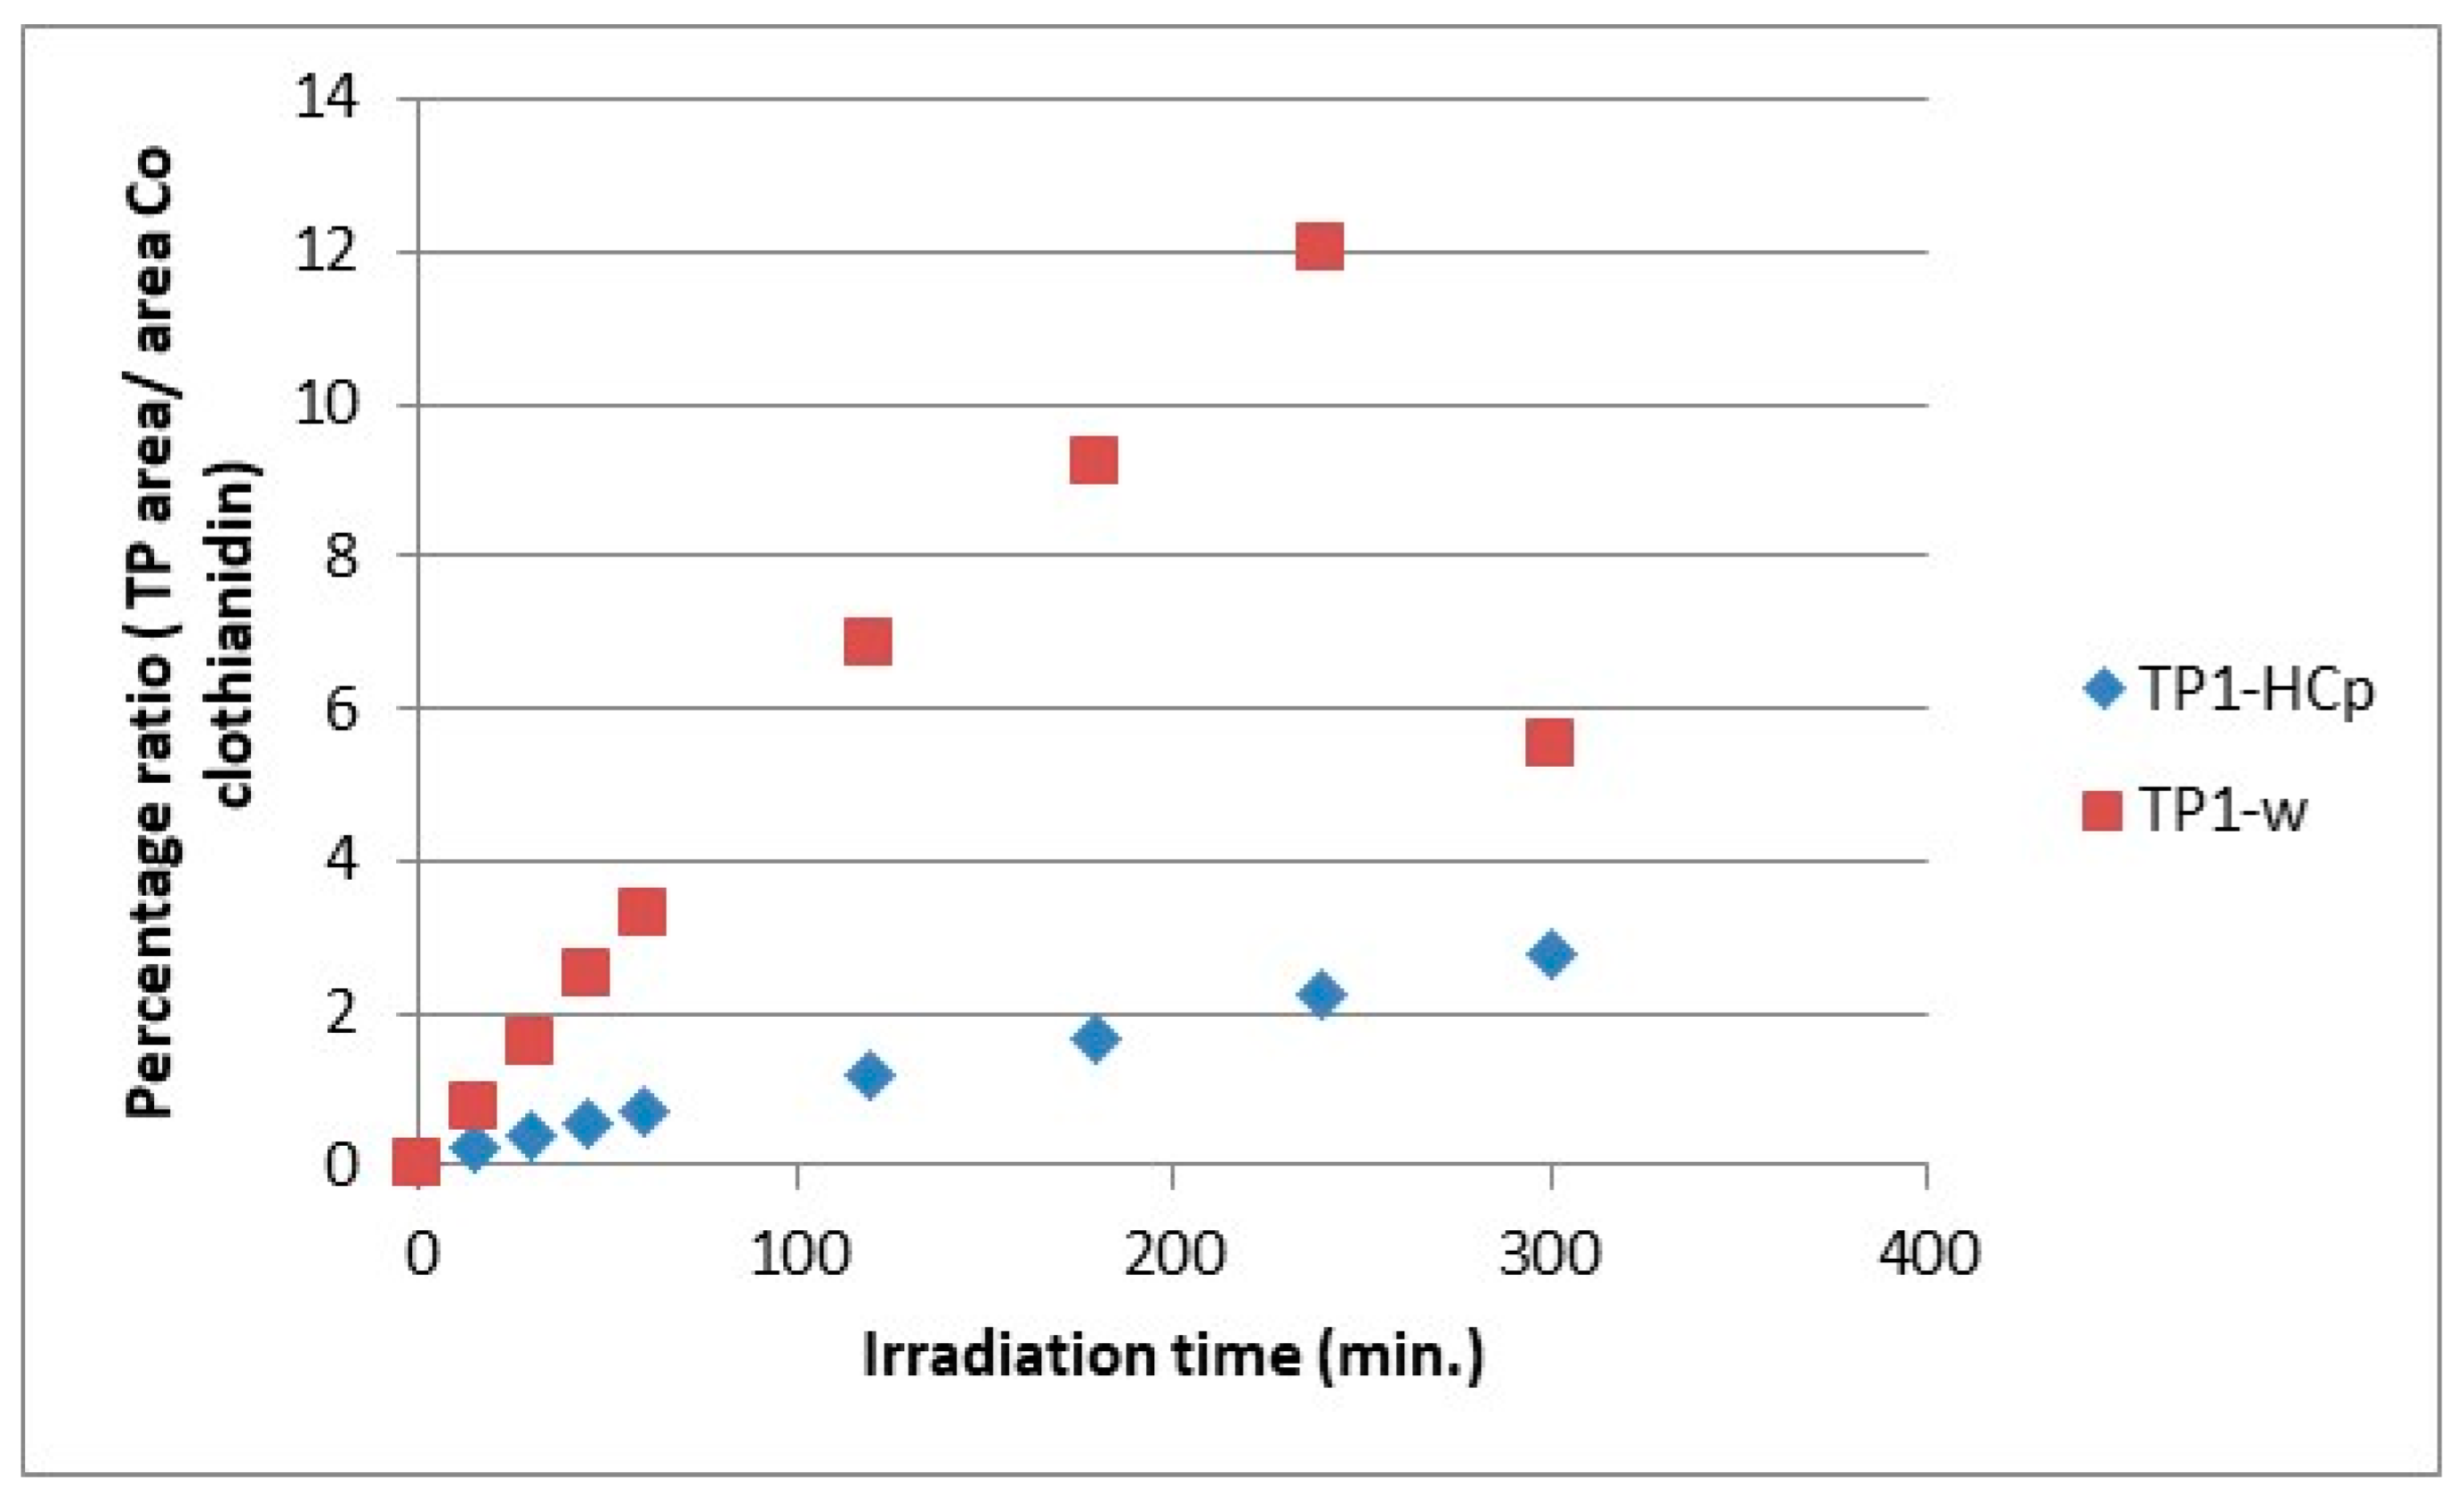
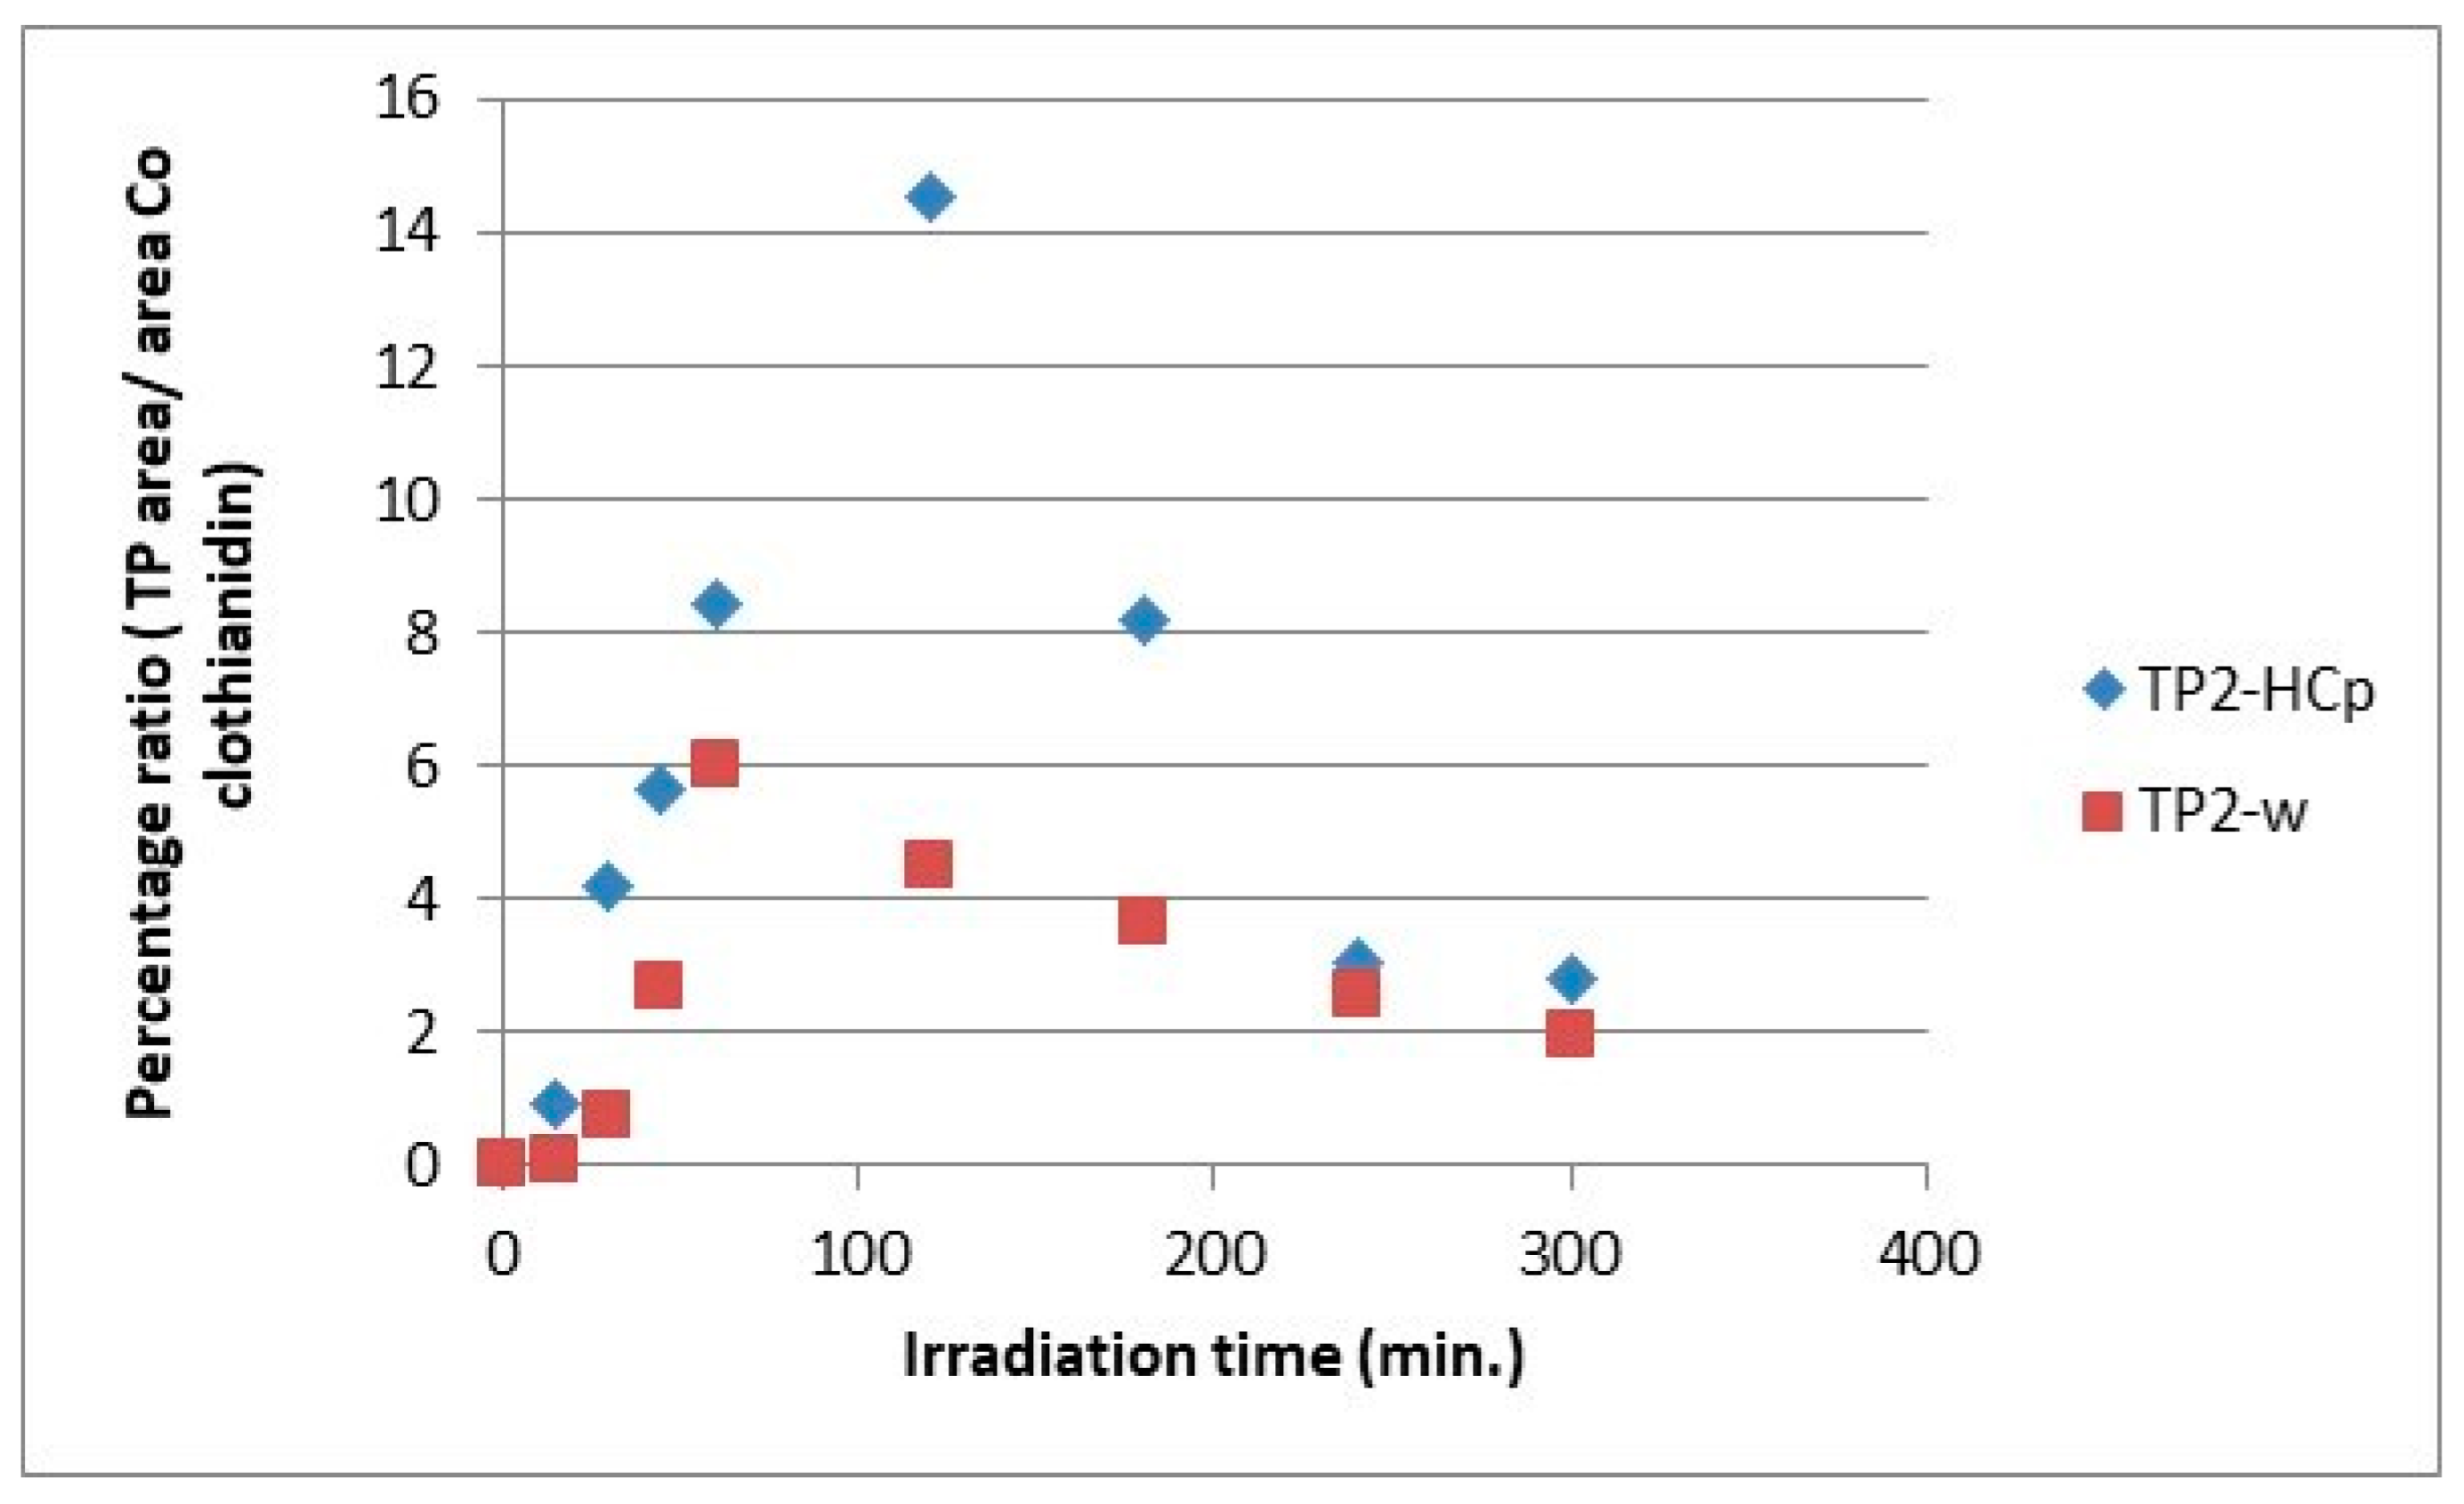
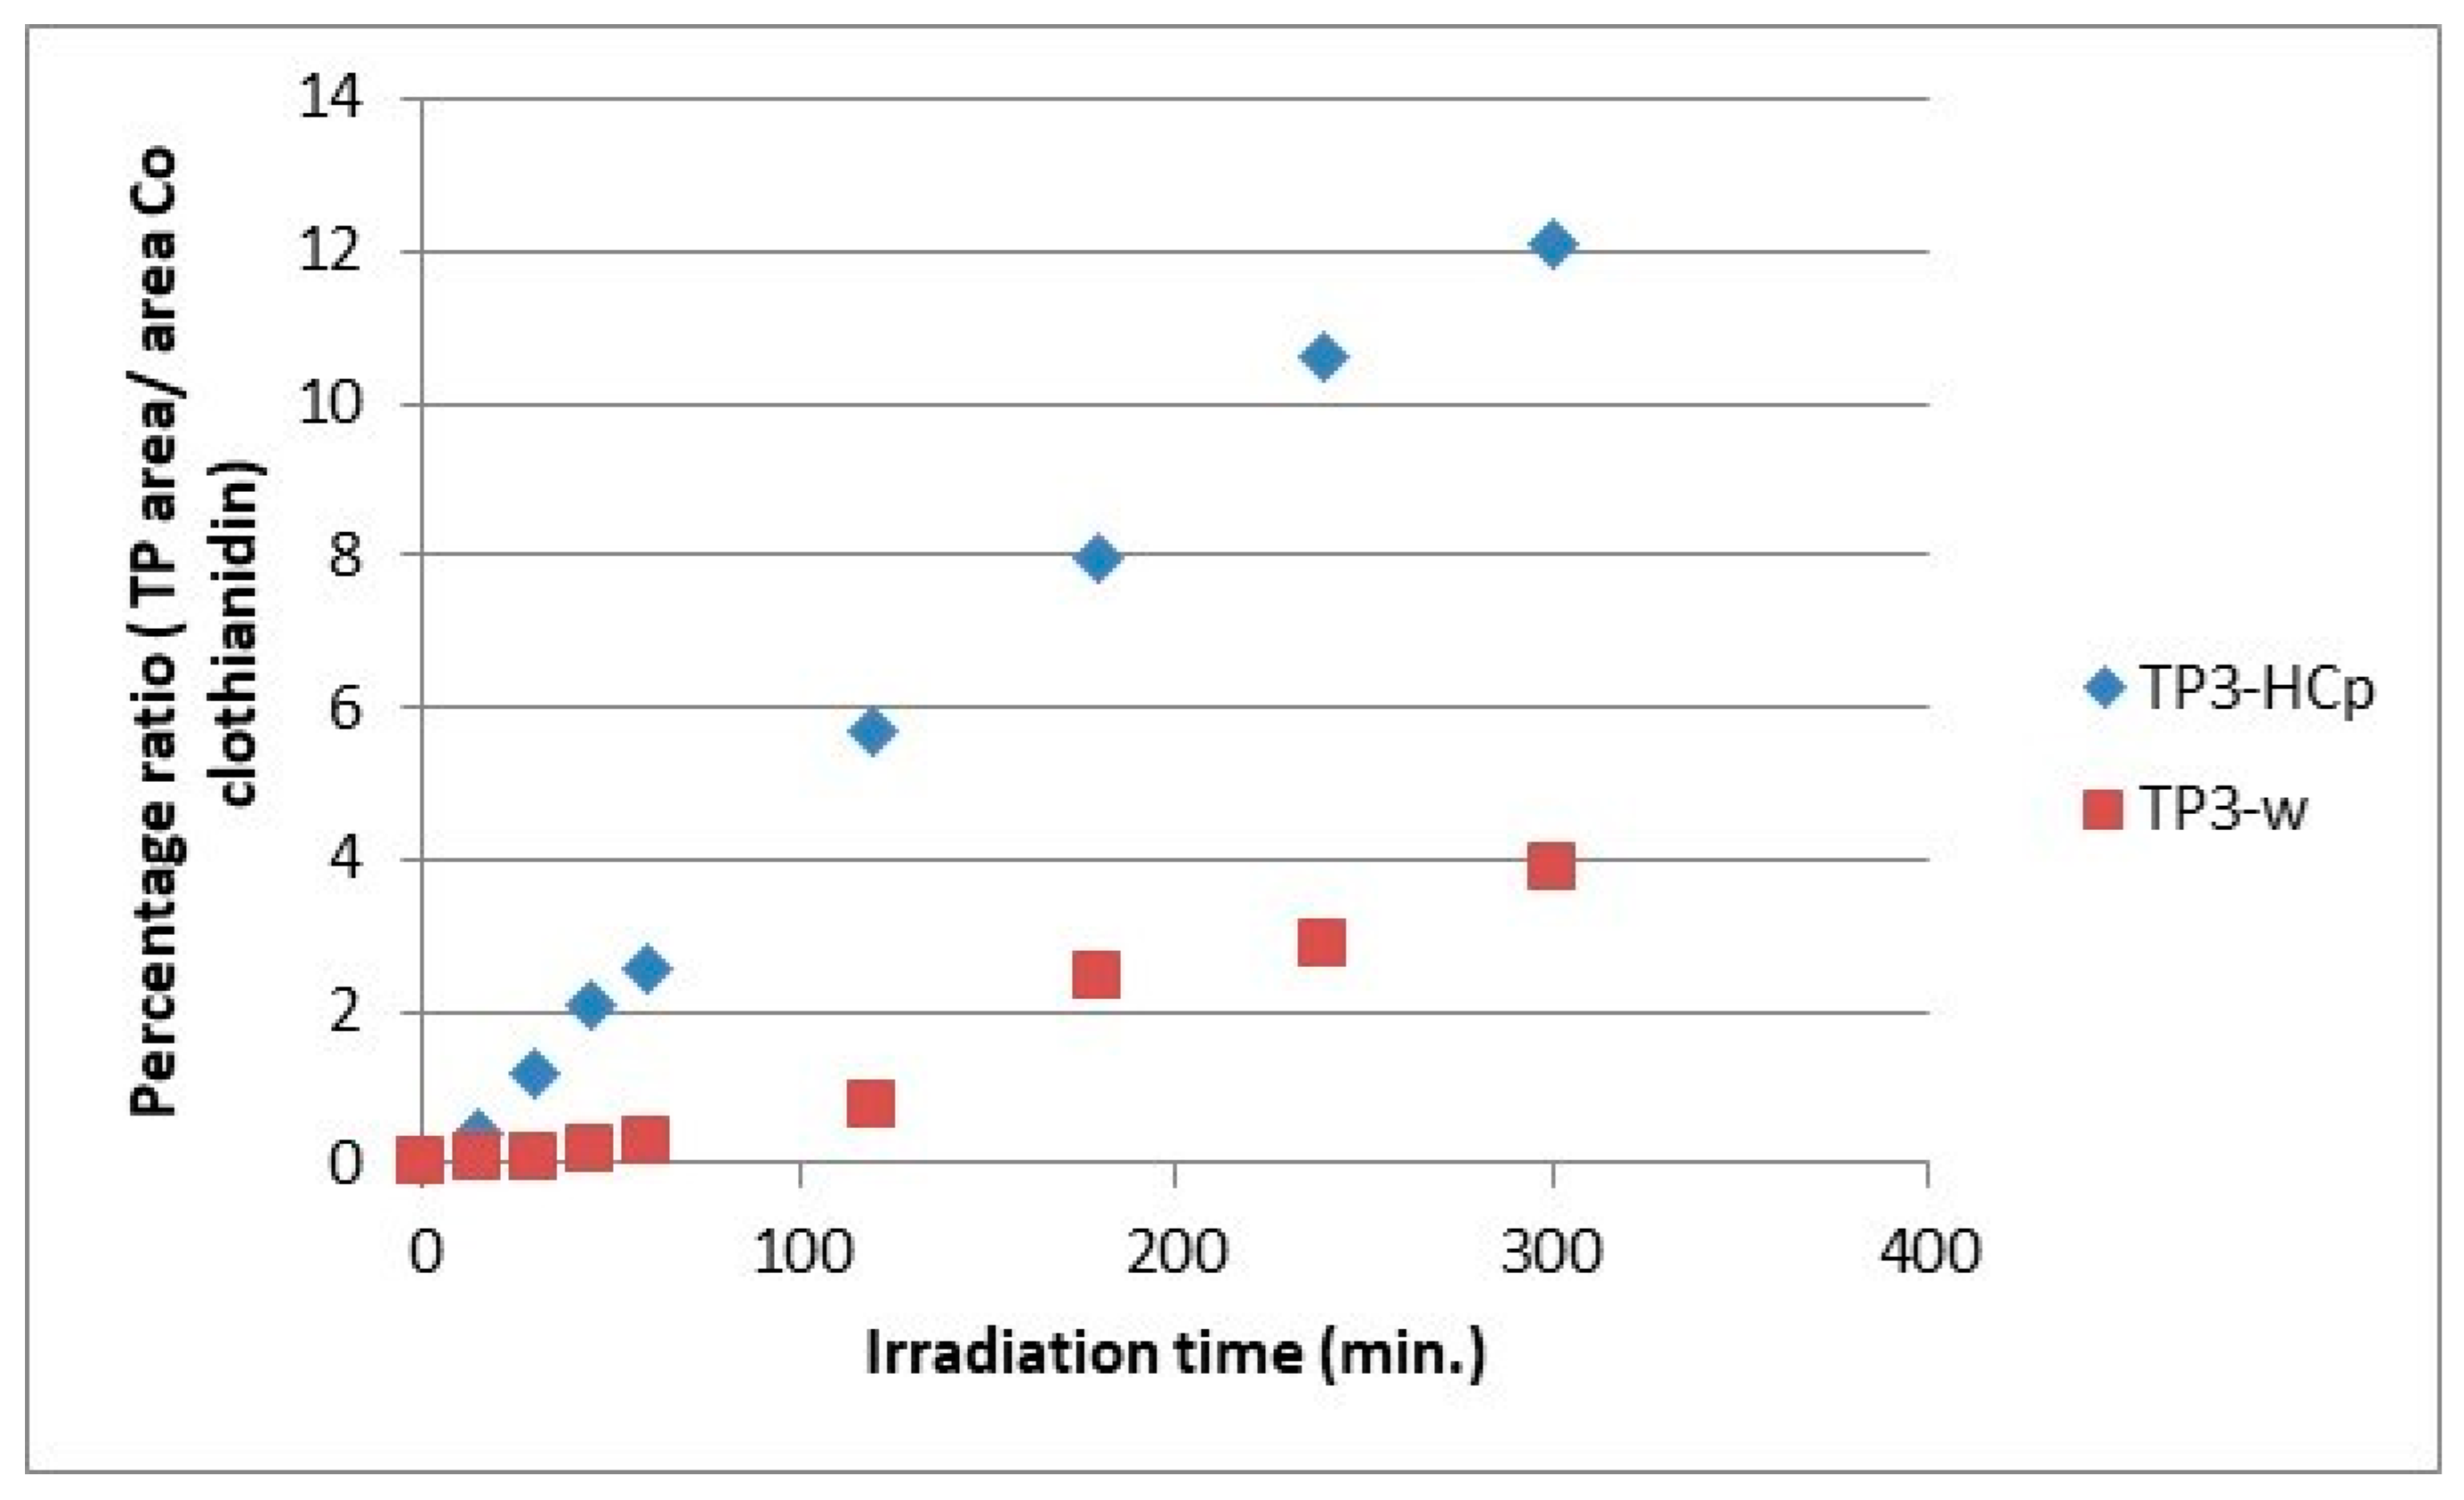
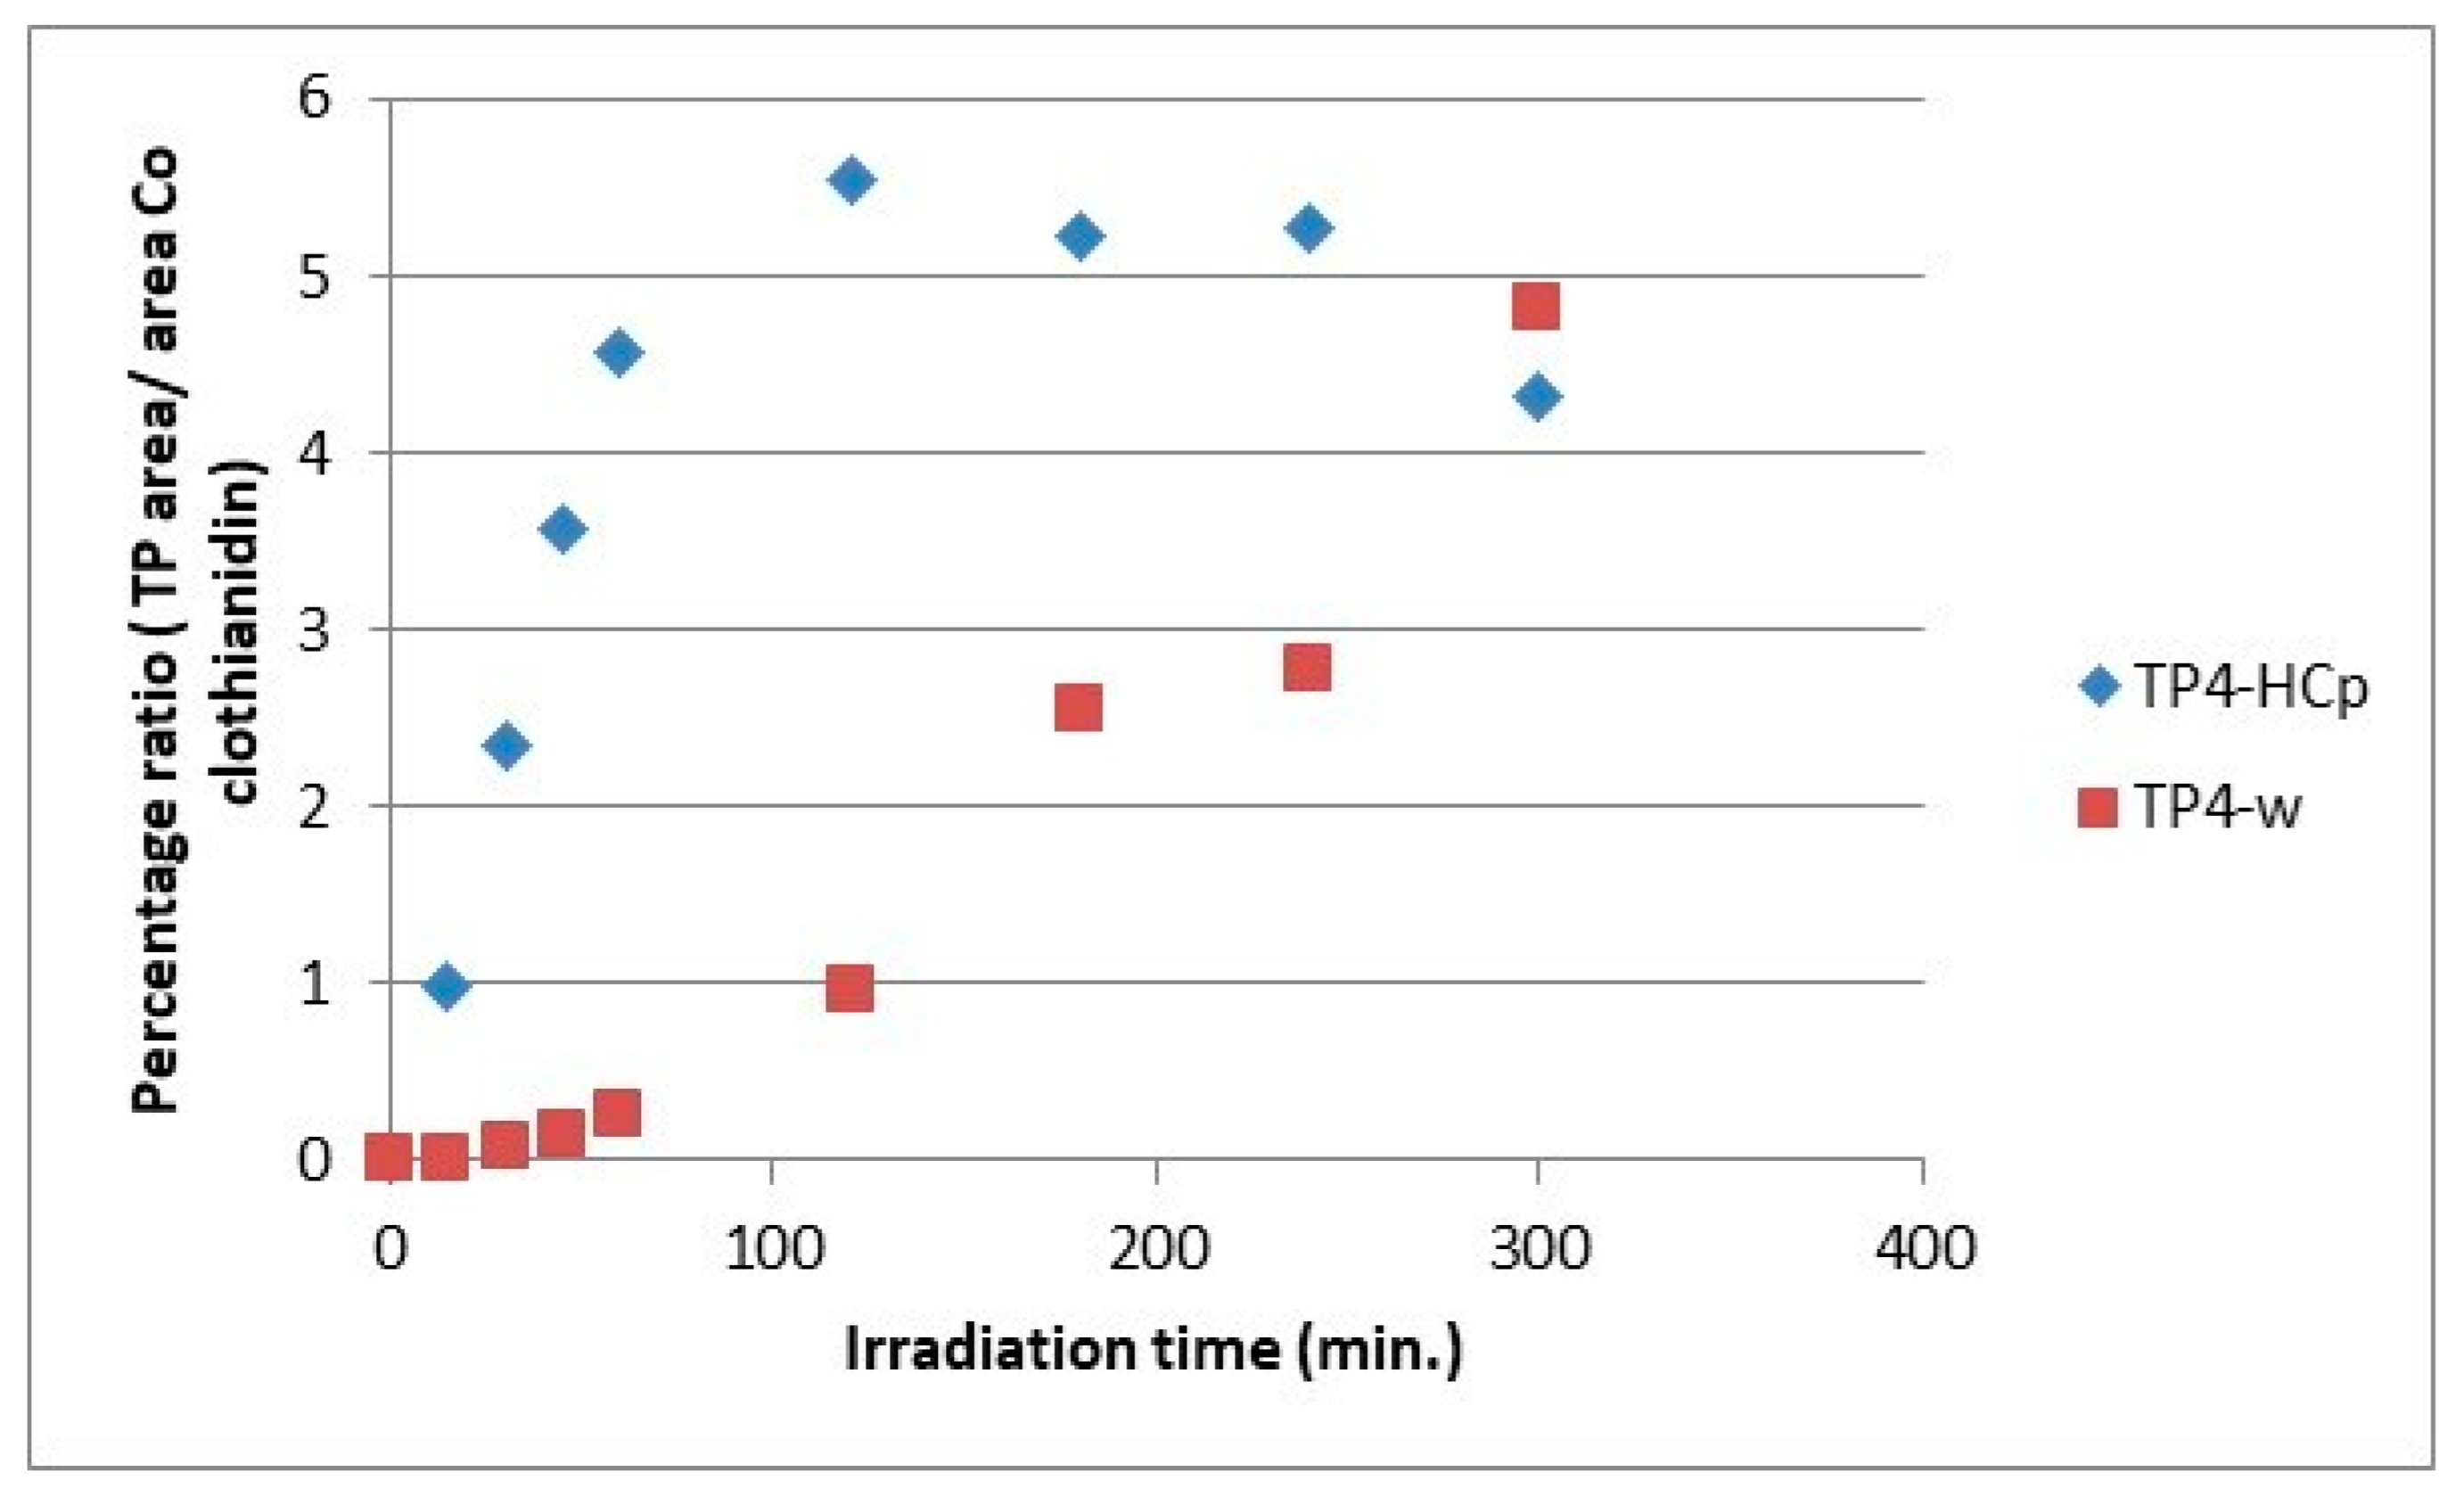
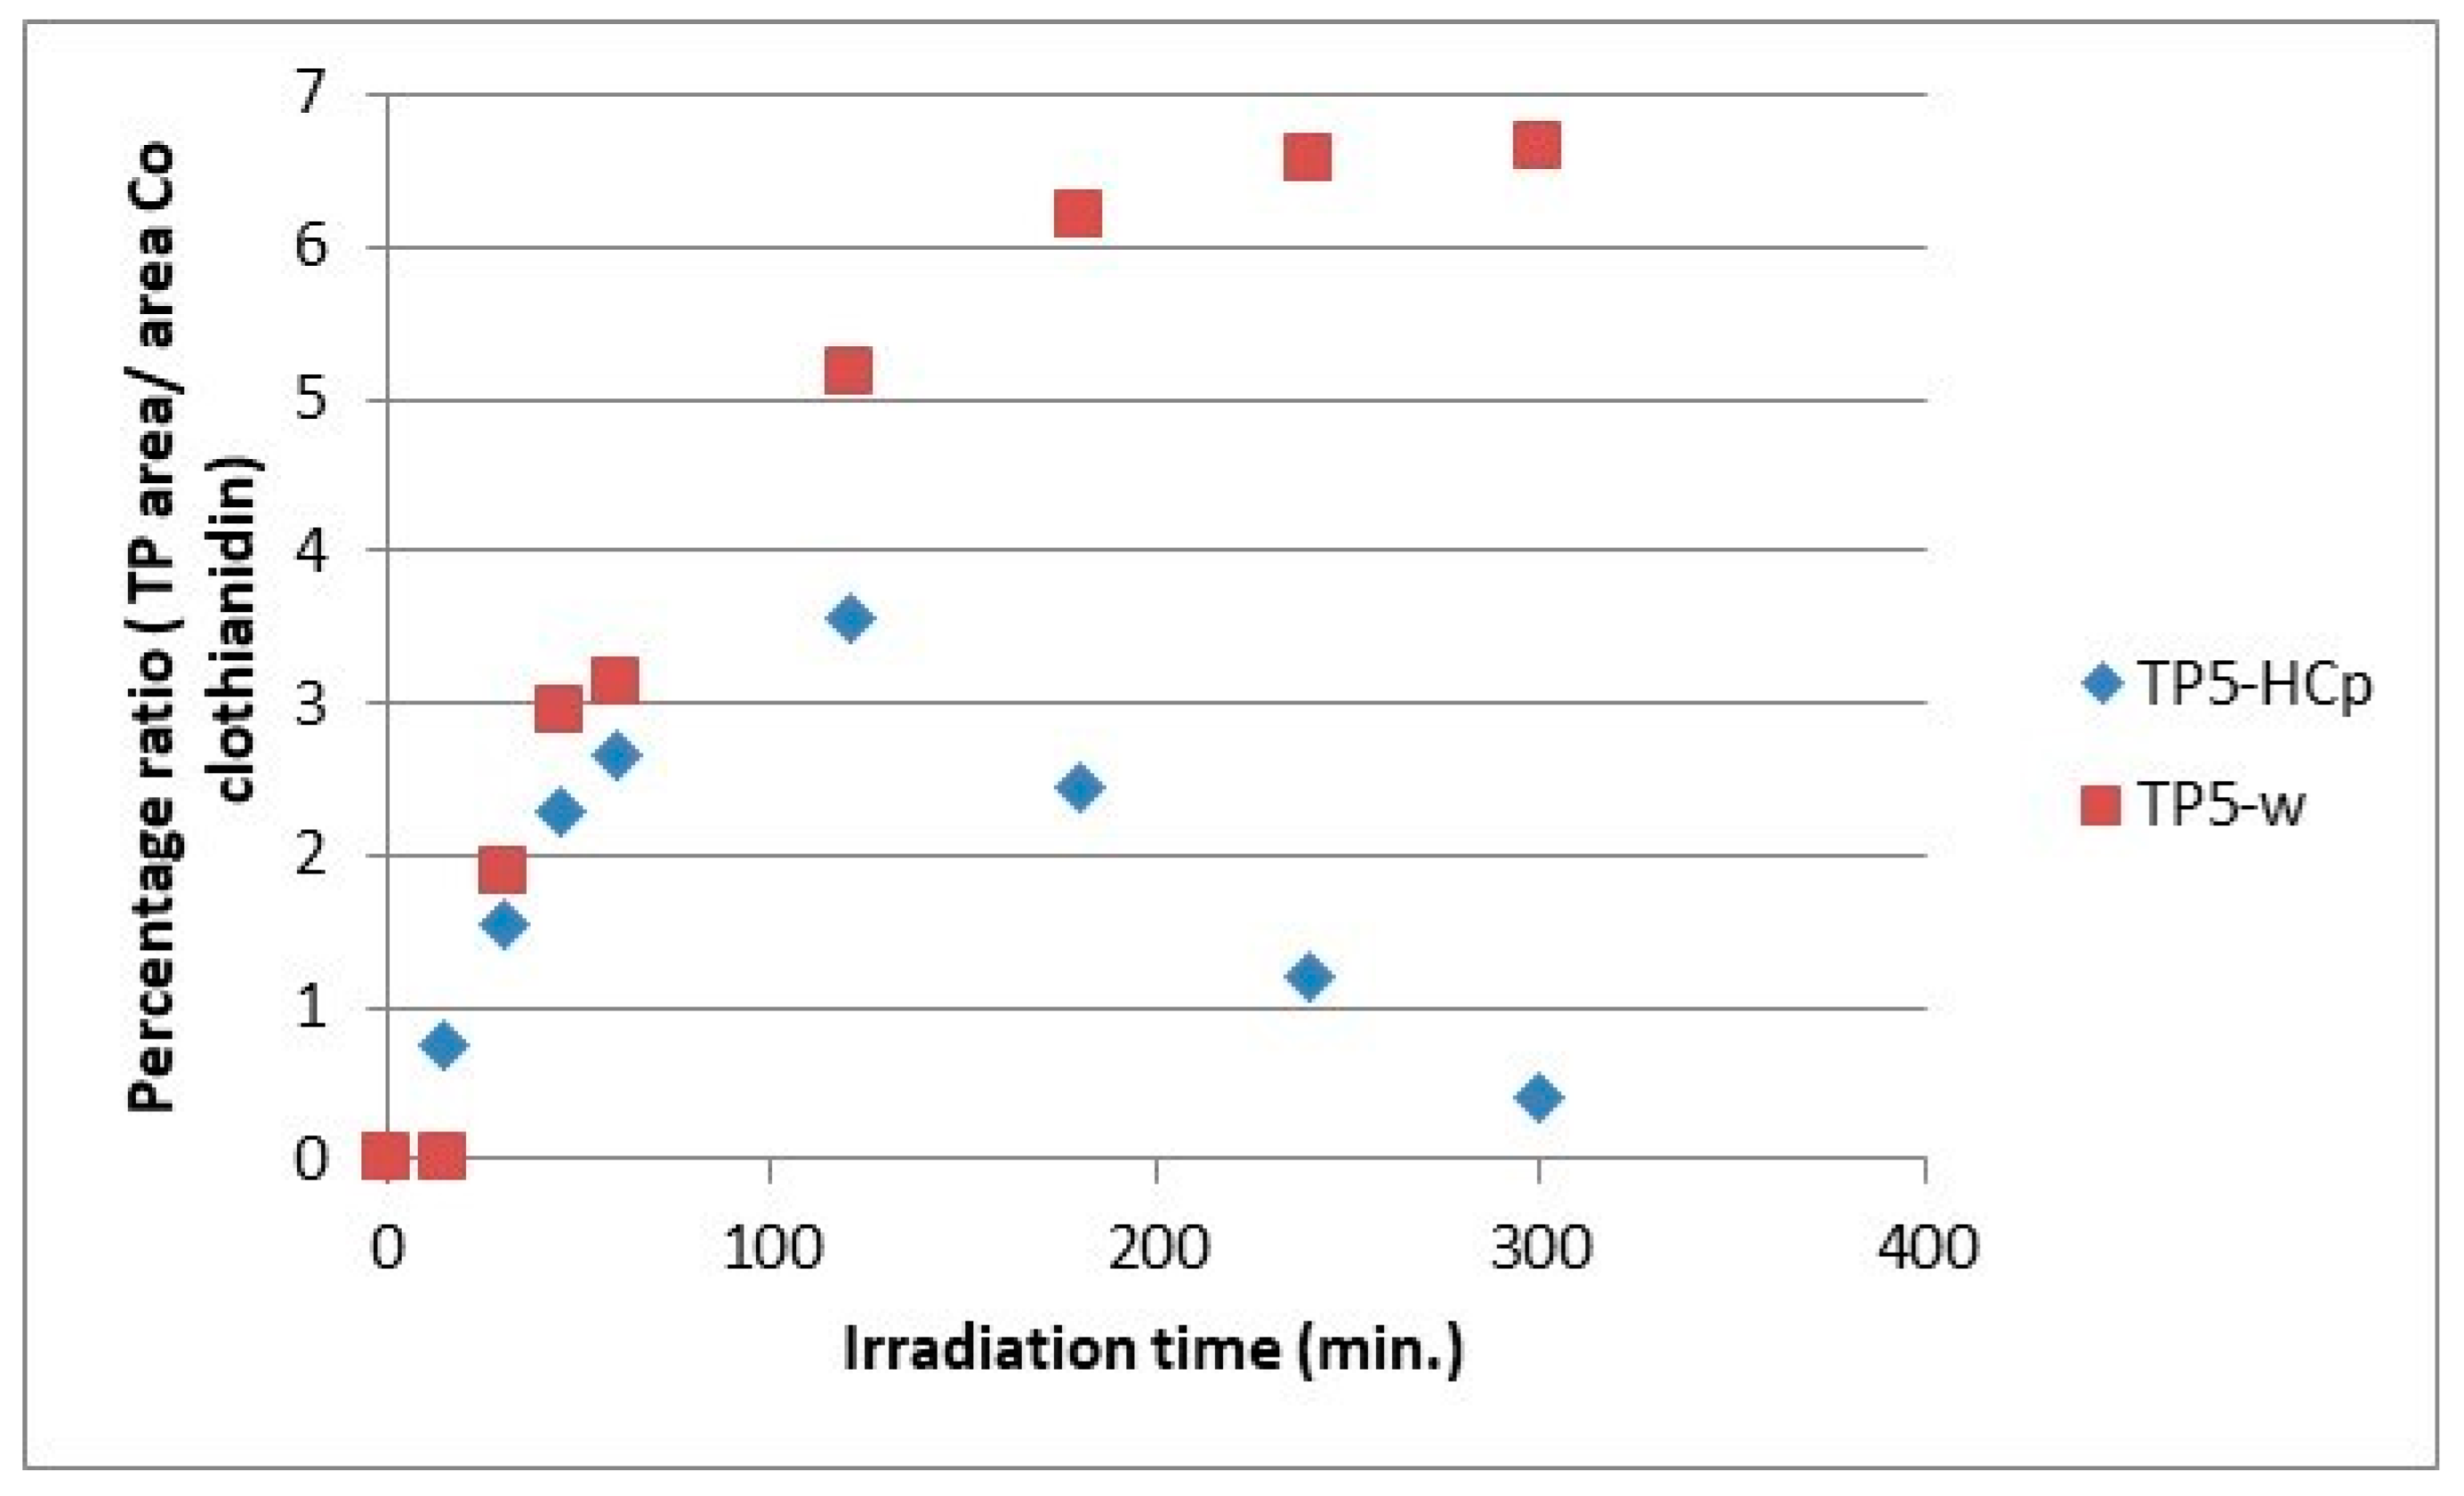
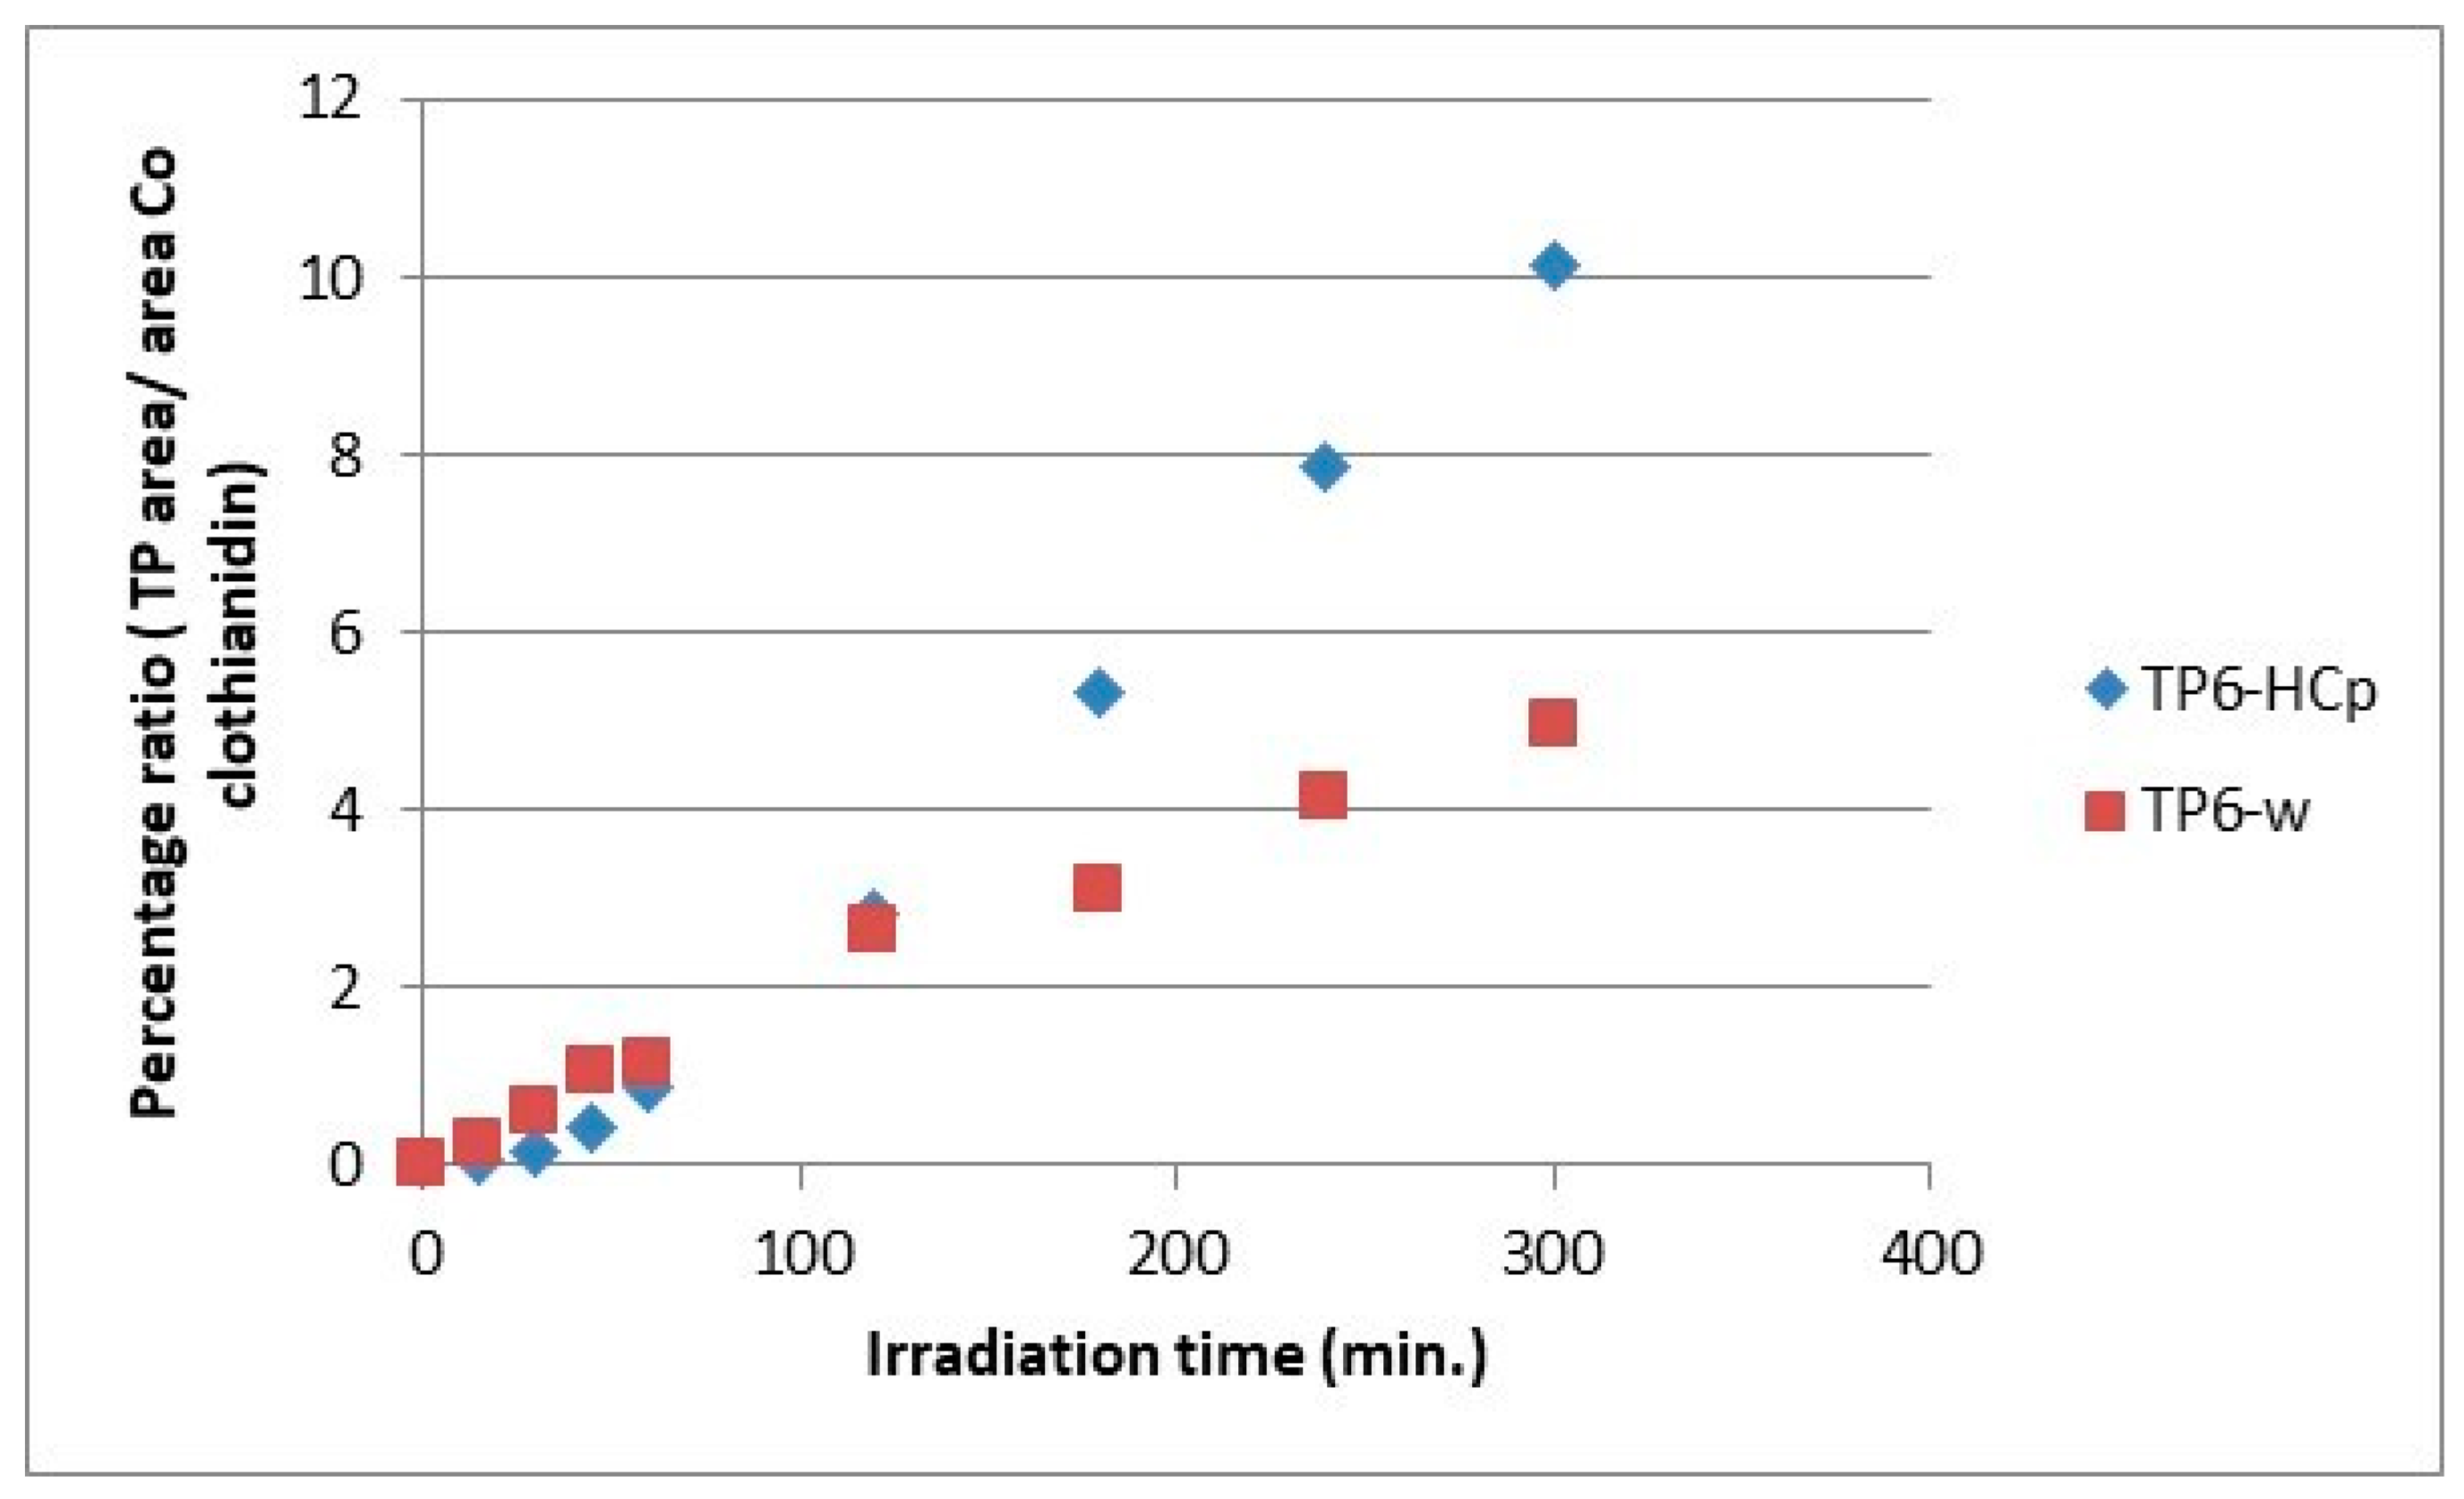
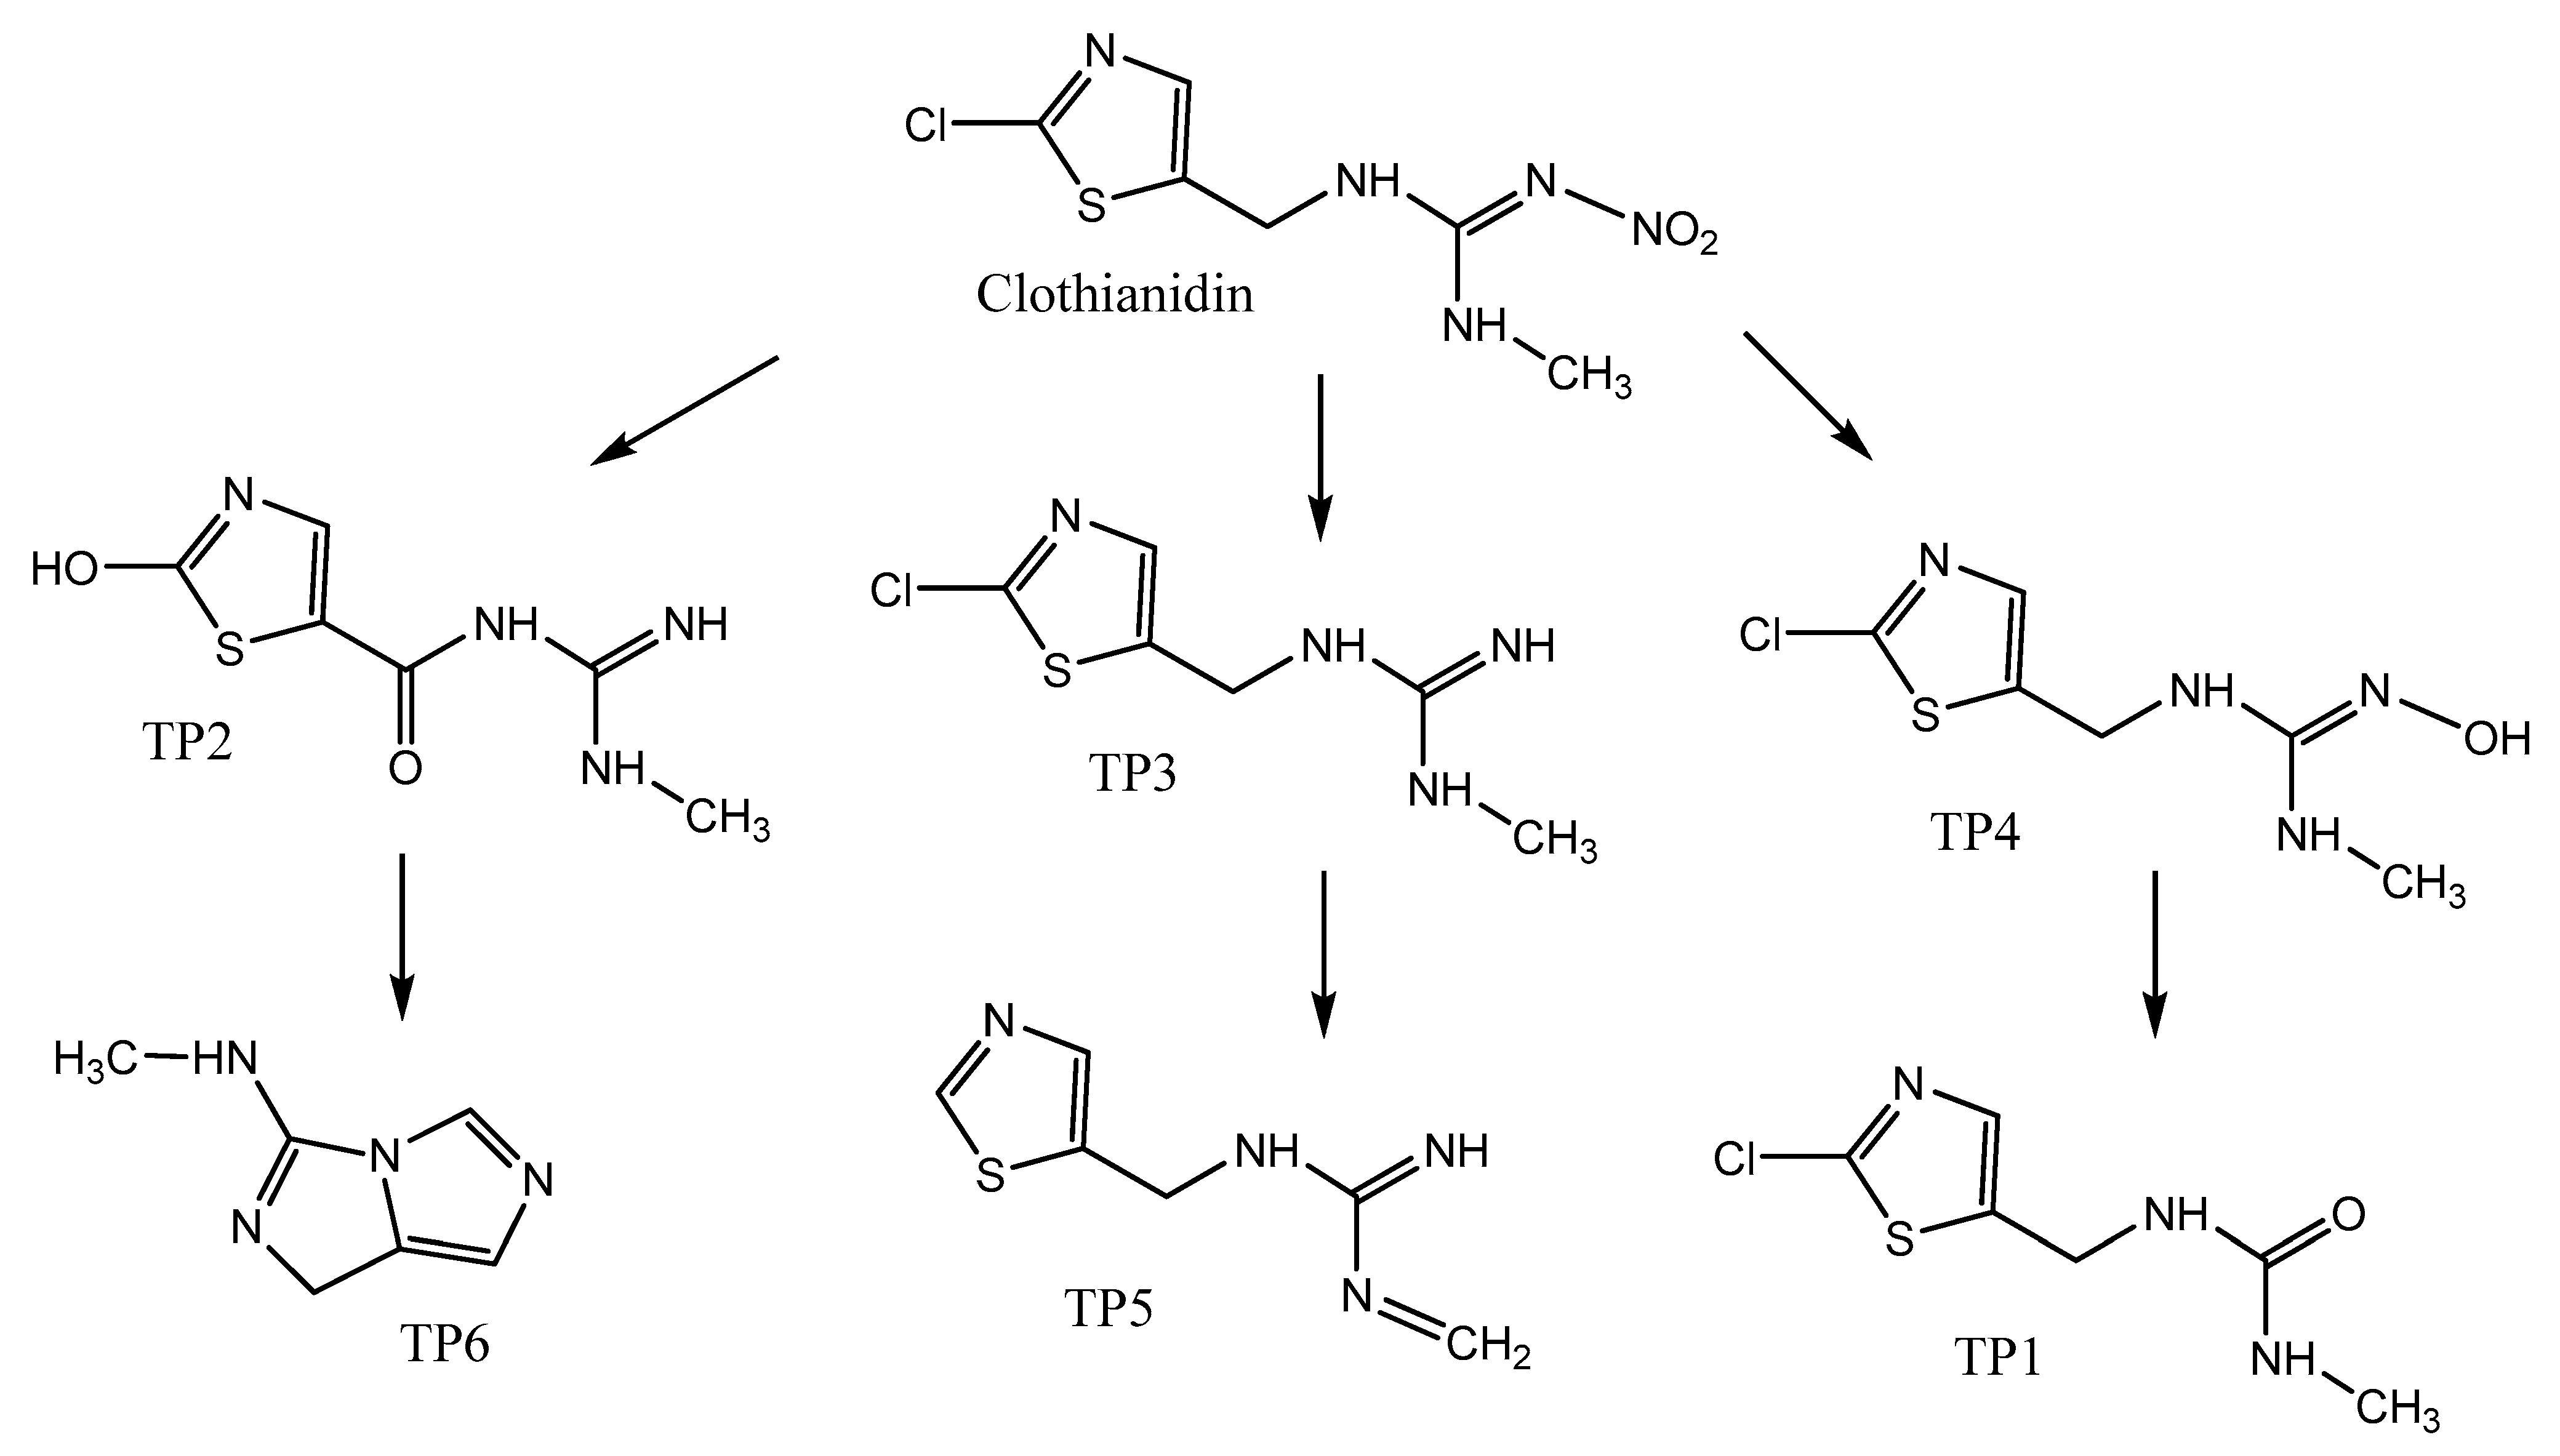
3.3. Identification of Photolytic Degradation Products of Clothianidin by Ultrahigh-Performance Liquid Chromatography—Coupled Mass Spectrometry (UHPLC-ESI-LIT-Orbitrap-MS)

For the detection and identification of the transformation products during the photolytic degradation of clothianidin in hydrochar aqueous suspensions and extracts, the samples taken at different irradiation times (0, 15, 30, 45, 60, 120, 180, 240 and 300 min) were analyzed using ultrahigh-pressure liquid chromatography–high-resolution mass spectrometry (UHPLC-ESI-LIT-orbitrap-MS). The processing of the chromatograms and the mass spectra resulted in the identification of 6 transformation products with molecular ions at m/z (M + H)+: 206.0146 (TP1), 201.0431 (TP2), 205.0307 (TP3), 221.0249 (TP4), 169.0539 (TP5) and 137.0817 (TP6). The identification data (retention time (Rt), pseudo-molecular ions (M + H)+, molecular formulas, fragmentation ions MS2, ring double bond equivalents (RDB) and mass error (ppm)) are summarized in Table 3. The identification was based on the interpretation of mass spectra data and additionally, for some of them, was based on their previous identification in degradation processes in the environment. Figure S1 shows the extracted ion chromatograms of clothianidin and transformation products at an irradiation time of 120 min and Figure S2 the corresponding mass spectra. Table 4 presents the proposed structures of clothianidin photodegradation products identified using LC-MS-LIT-orbitrap as well as the transformation processes previously reported in the literature to generate the identified TPs.
The pseudo-molecular ions of the parent compound (CLOTH) (M + H)+ and (M + Na)+ were observed respectively at m/z 250.0154 (C6H9O2N5ClS+) and 271.9972 (C6H8O2N5ClSNa+). Also, the MS2 fragments at m/z 158.0263, 153.0224, 127.0192 and 110.0706 were identified with the following chemical formulas C6H8O2NS, C5H5N4S, C4H5N3S and C5H8N3, respectively.
TP1 with (M + H)+ at m/z 206.0146 has a difference of 44.0008 amu from clothianidin indicating the simultaneous loss of the =N-NO2 group and the addition of oxygen in its place. The MS2 m/z fragment 174.9723 indicates a loss of the methylamine (CH5N) chain from the TP1 molecule [29]. From the literature, TP1 has been found to result from the photocatalytic cleavage of clothianidin using TiO2 in aqueous solutions with the addition of humic acids (natural organic matter) [30]. Similar results were shown by Žabar et. al. [31], where TP1 was obtained from the photocatalytic cleavage of clothianidin with the TiO2 catalyst in aqueous solutions of bi-distilled water. TP2 with (M + H)+ at m/z 201.0431 with a difference of 48.9723 amu from the parent compound of clothianidin indicates the replacement of chlorine by a hydroxyl group in the same position in the clothianidin aromatic ring and the loss of the nitro group by concomitant oxidation of the carbon joining the nitroguanidine group to the thiazole ring. There are no previous references to this transformation product in the literature.
TP3 with (M + H)+ at m/z 205.0307 has a difference of 44.9847 amu from the molecule of clothianidin indicating the loss of nitro group (-NO2). The MS2 fragment at m/z 188.0038 corresponds to ammonia (NH3) loss. According to the literature, TP3 has been reported as a result of the photodegradation of clothianidin in aqueous solutions of ultrapure water [32]. TP4 with (M + H)+ at m/z 221.0249 with a difference of 28.9905 amu from the molecule of clothianidin indicates the replacement of the nitro group by a hydroxyl group. The MS2 fragment m/z 185.0486 corresponds to the loss of hydrogen chloride. The literature refers to the transformation of TP4 through the photodegradation of the parent compound in aqueous soil suspensions [32]. Moreover, an MS3 fragment at m/z 86.0055 was detected with the chemical formula C3H4NS.
TP5 with (M + H)+ at m/z 169.0539 with a difference of 80.9615 amu from the molecule of clothianidin indicates the loss of the -Cl atoms and -NO2 group. The MS2 fragment m/z 113.0161 corresponds to the loss of methyl cyanamide (-C2H4N2). The literature reports that TP5 results from the photodegradation of clothianidin in aqueous solutions of deionized water [32]. TP6 with (M + H)+ at m/z 137.0817 with a mass difference of 112.9337 amu from clothianidin indicates the loss of -Cl and -NO2 groups and the opening of the thiazole ring with loss of sulfur to the formation of the final bicyclic compound. The MS2 fragment at m/z 81.0440 corresponds to the loss of methyl cyanamide (-C2H4N2). The TP6 transformation product of clothianidin photodegradation in water has been reported in the literature [33,34].
The evolution profiles of the transformation products during the photolytic process of clothianidin in hydrochar suspensions and in bi-distilled water are provided in Figure 5 and Figure 6, respectively. According to the maximum intensities of the mass spectra, with the presence of hydrochar particles (HCp), the formation of TPs followed the trend TP2 > TP3 > TP6 > TP4 > TP5 > TP1. The maximum concentrations of TP2, TP4 and TP5 were determined after 120 min of the photolytic process, while for TP1, TP3 and TP6 after 300 min, respectively (Figure 6).
In the case of the photolytic process of clothianidin with the presence of aqueous extracts (HCw), the formation of TPs followed the trend TP1 > TP5 > TP2 > TP6 > TP4 > TP3. The maximum concentrations of TP1 and TP5 were determined after 240 min of the photolytic process, while for TP3, TP4 and TP6 after 300 min and for TP2 after 60 min, respectively (Figure 5).
The evolution profiles of the transformation products, comparing the two substrates for the formation of the same product, are presented in Figure 7, Figure 8, Figure 9, Figure 10, Figure 11 and Figure 12. As can be observed, the formation of the products is significantly dependent on the substrate. The formation of TP1 and TP5 products seems to be favored in direct photolysis processes while TP2, TP3, TP4 and TP6 products are formed either faster or to a greater extent in in the presence of hydrochar particles where both direct and indirect photolysis processes took place. According to the literature, the TP1, TP3, TP4, TP5 and TP6 have been reported as degradation products in processes that participate different reactive oxygen species (ROS) like OH, 1O2 and O2•− [30,31,32,33,35]. The results on the evolutionary profiles of TPs are in agreement with the ion determination at the end of the 300 min irradiation period with the percentage release of heteroatoms being 4%, 11% and 13% for sulfates, nitrates and chlorides, respectively. The structure of transformation products (TPs) and the tentative degradation pathways are shown in Figure 13.

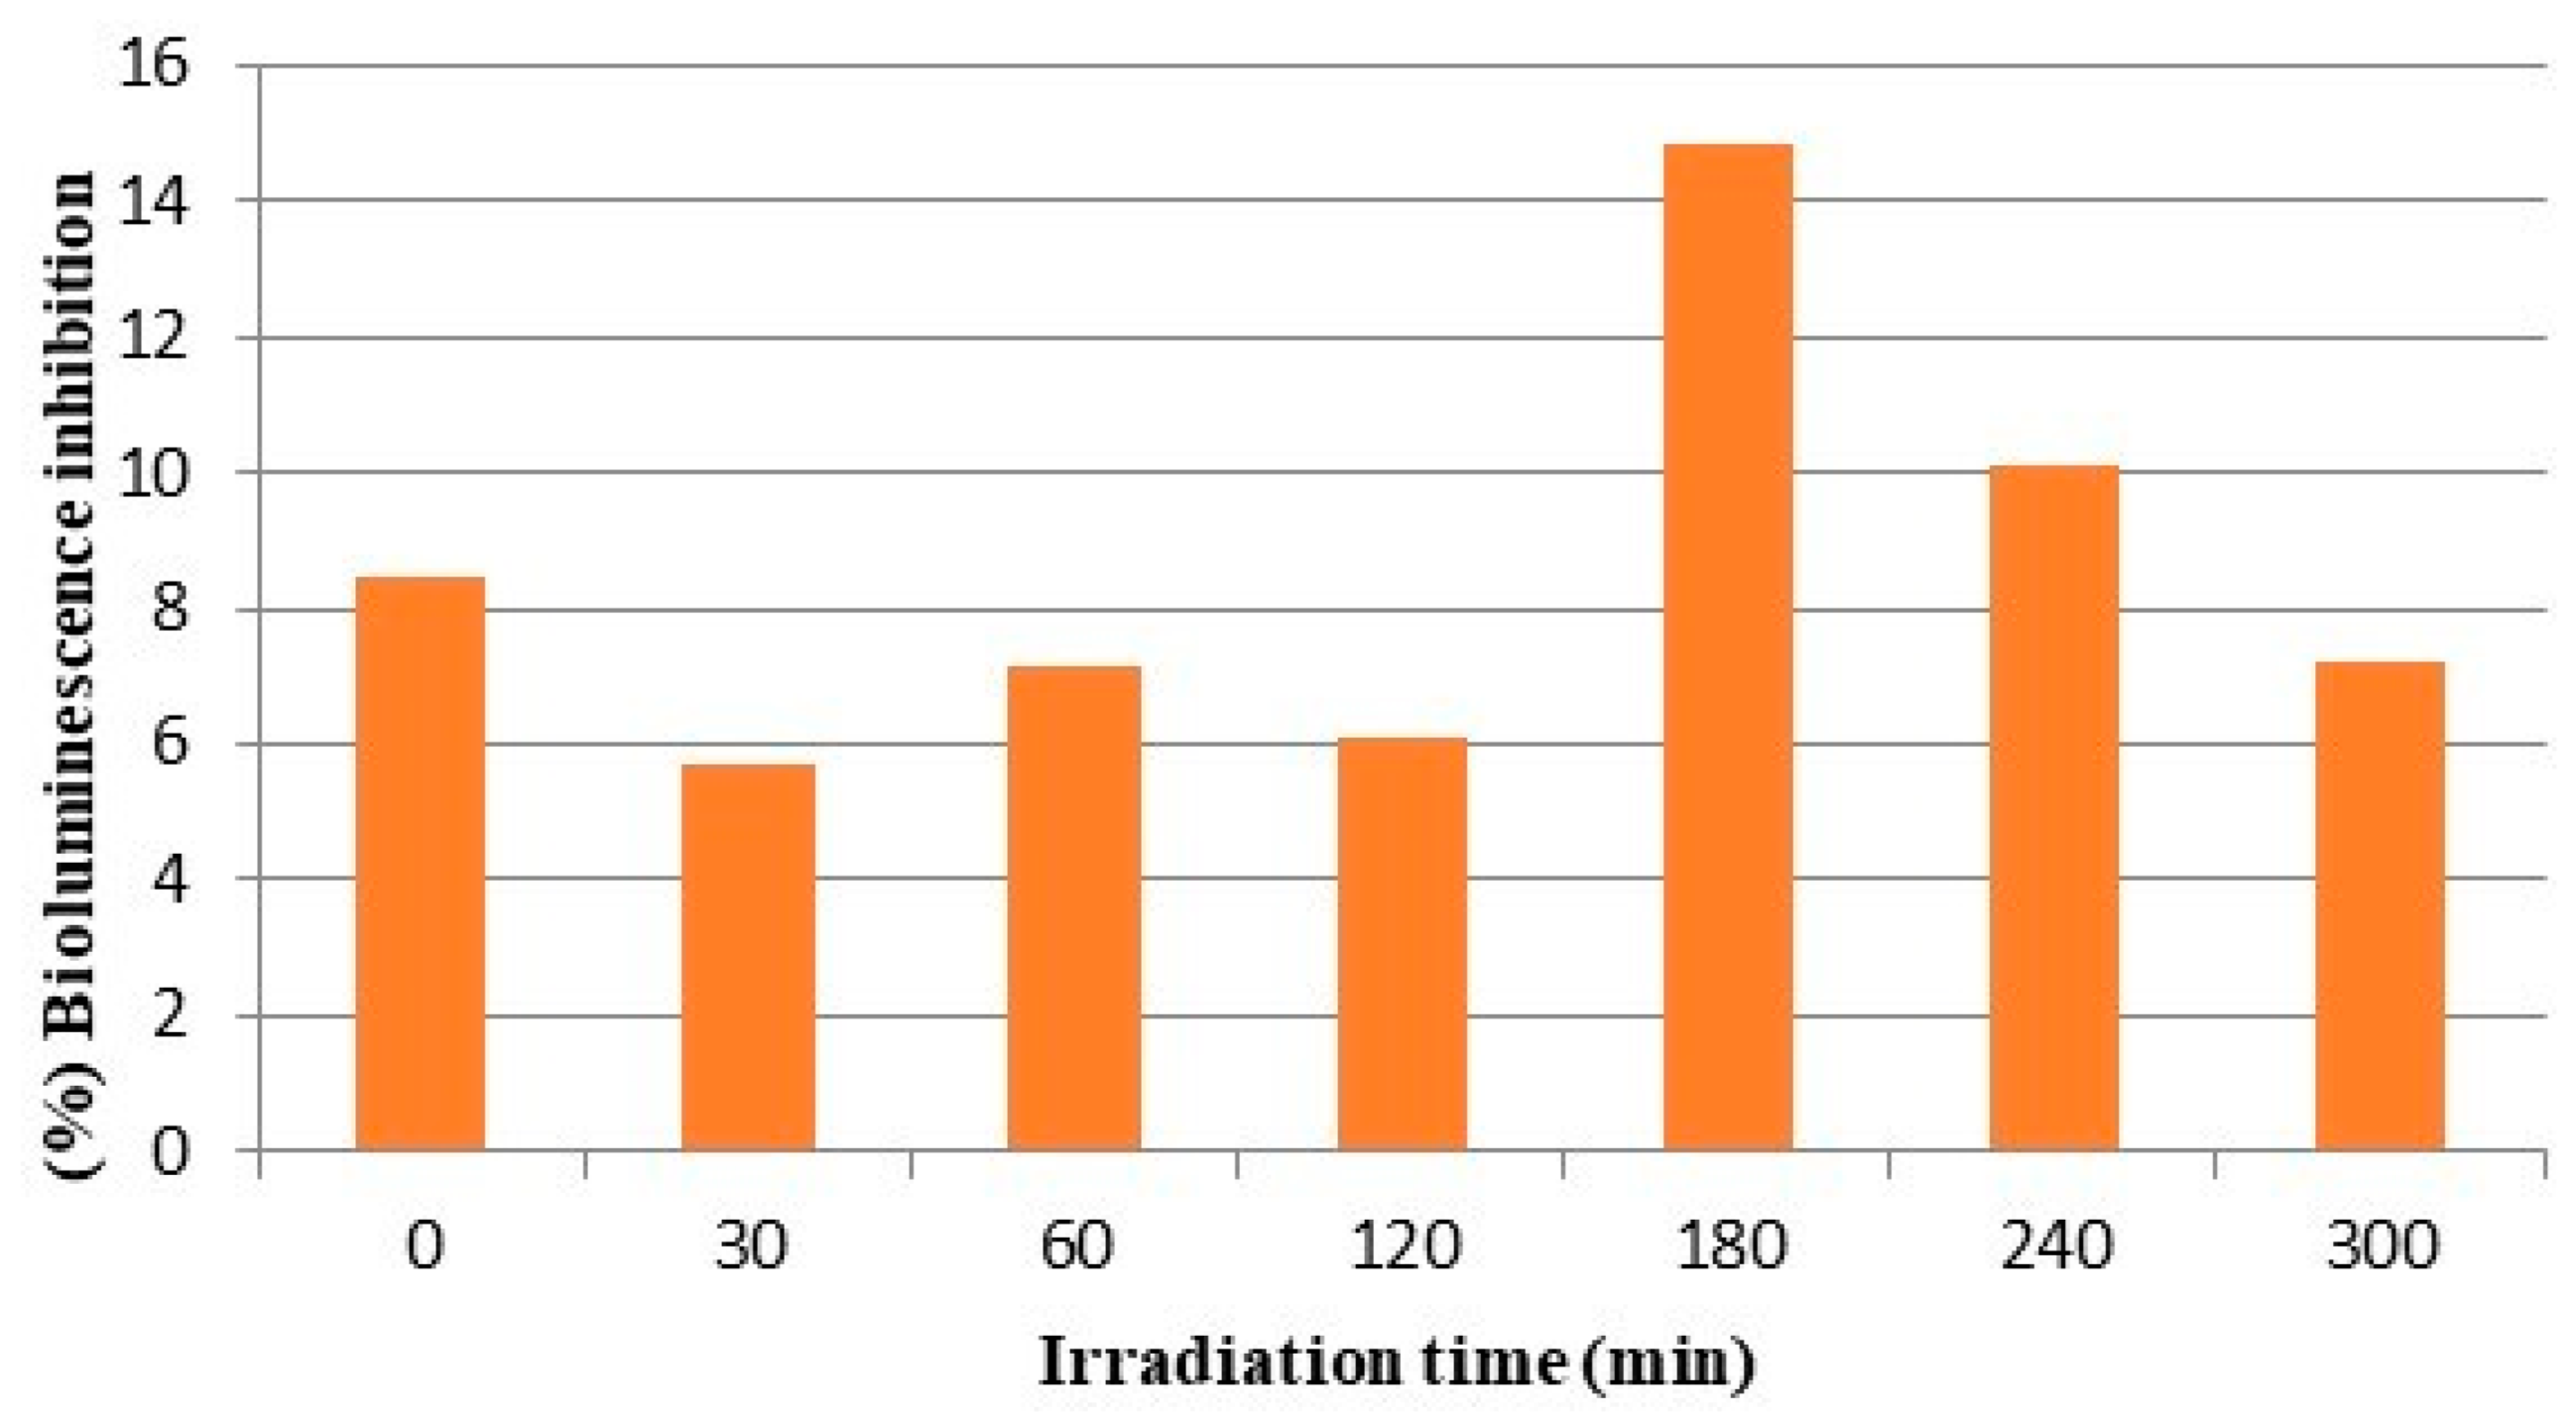
3.4. Monitoring of Ecotoxicity during Photodegradation of Clothianidin

The ecotoxicological impact of the photolytic processes in relation to the formation of TPs was investigated by evaluating the ecotoxicity changes throughout the irradiation treatment. Toxicity assessment was performed using the Microtox bioassay and the results are summarized in Figure 14. The percentage of inhibition in the initial solution is 8.5% while after the photolytic process, it is 7.2%, showing a slight decrease. The greatest inhibition of bioluminescence and therefore the greatest toxicity was observed at 180 and 240 min of irradiation and corresponded to 14.8% and 10.1% bioluminescence inhibition. These findings are in agreement with the findings of evolutionary profiles of the transformation products showing peak concentrations of most TPs around 180 and 240 min after the beginning of the photolytic processes.
Voigt et al. studied the toxicity of photoproduced transformation products of four neonicotinoids, including clothianidin, by applying a QSAR methodology. The predictions were carried out using the Ecological Structure Activity Relationships (ECOSAR) v.2.0 tool developed by the US Environmental Protection Agency (EPA). In the study of Voigt et al., TP1, TP3, TP4 and TP5 were also observed during the photolytic process of clothianidin. The authors concluded that the loss of nitrile or nitro groups seems to increase the toxicity. Moreover, and according to QSAR analysis of clothianidin, TP1, TP3 and TP4 were associated with higher toxicities than the parent compound [32]. The above results are consistent with the results of the present study showing an increase in the toxicity during the process. According to Krajl et. al., the photocatalytic degradation products of clothianidin exhibit lower toxicity in the presence of humic acid compared to toxicity observed in deionized water and water with added NO3 [30].
Overall, some of the transformation products identified in this study tend to be more toxic than the parent compound, thus leading to increased toxicity during the photolytic processes or the generated TPs presenting synergistic effects, resulting in increased toxicity.

4. Conclusions

In summary, the photolytic degradation kinetics and pathways of the neonicotinoid pesticide clothianidin were studied in the presence of aqueous suspensions (HCp) and extracts of hydrochar (HCw) using LC-MS-orbitrap high-resolution accurate mass spectrometry. In the presence of hydrochar DOM (HCw), slower but non-significantly different rates were observed compared with the direct photolysis kinetics in bi-distilled water. On the other hand, in the presence of hydrochar particles (HCp), a significant decrease in the photolytic degradation rate of clothianidin was observed for the low concentration level (HCp-50) while for higher concentrations, nonsignificant differences were observed, demonstrating that the char matrix can exert a dual role as optical filter and sensitizer. The formation of six transformation products of clothianidin was identified during the photolytic processes. By comparing the formation and evolution kinetics of the degradation products in the presence of hydrochar and in bi-distilled water, it was observed that the formation and evolution kinetics depend significantly on the substrate. The formation of products TP1 and TP5 seems to be favored in direct photolysis processes while products TP2, TP3, TP4 and TP6 seem to be formed either faster or to a greater extent in the presence of hydrochar particles including both direct and indirect photolysis processes. The proposed degradation pathways for clothianidin included three main routes: denitration, hydroxylation and dechlorination. During clothianidin degradation, some more toxic products are considered to be formed after 180 and 240 min; however, at the end of the photolytic process, the toxicity was slightly decreased.

Supplementary Materials

The following supporting information can be downloaded at: https://www.mdpi.com/article/10.3390/photochem3040027/s1, Figure S1: Chromatograms of selected ions of clothianidin and its transformation products (TPs) formed after 120 min of simulated solar irradiation in the presence of hydrochar particles; Figure S2: Mass spectra of clothianidin and its transformation products (TPs).

Author Contributions

Conceptualization, I.K.; methodology, A.P. and I.K.; formal analysis, A.P. and F.B.; investigation, A.P. and F.B.; resources, I.K.; writing—original draft preparation, A.P., F.B. and I.K.; writing—review and editing A.P., F.B. and I.K.; visualization, A.P.; supervision, I.K. All authors have read and agreed to the published version of the manuscript.

Funding

This research received no external funding.

Data Availability Statement

Data are included in the manuscript.

Acknowledgments

The authors acknowledge the XRD and SEM units and the unit of Environmental, Organic and Biochemical High Resolution–Orbitrap–LC–MS analysis of the University of Ioannina for providing access to the instrumentation facilities.

Conflicts of Interest

The authors declare no conflict of interest.

References

  1. Heilmann, S.M.; Jader, L.R.; Sadowsky, M.J.; Schendel, F.J.; von Keitz, M.G.; Valentas, K.J. Hydrothermal carbonization of distiller’s grains. Biomass Bioenergy 2011, 35, 2526–2533. [Google Scholar] [CrossRef]
  2. Qin, Y.; Li, G.; Gao, Y.; Zhang, L.; Ok, Y.S.; An, T. Persistent free radicals in carbon-based materials on transformation of refractory organic contaminants (ROCs) in water: A critical review. Water Res. 2018, 137, 130–143. [Google Scholar] [CrossRef] [PubMed]
  3. Zhang, C.; Li, F.; Wen, R.; Zhang, H.; Elumalai, P.; Zheng, Q.; Chen, H.; Yang, Y.; Huang, M.; Ying, G. Heterogeneous electro-Fenton using three-dimension NZVI-BC electrodes for degradation of neonicotinoid wastewater. Water Res. 2020, 182, 115795. [Google Scholar] [CrossRef] [PubMed]
  4. Wang, T.; Zhai, Y.; Zhu, Y.; Li, C.; Zeng, G. A review of the hydrothermal carbonization of biomass waste for hydrochar formation: Process conditions, fundamentals, and physicochemical properties. Renew. Sustain. Energy Rev. 2018, 90, 223–247. [Google Scholar] [CrossRef]
  5. Zhang, Z.; Zhu, Z.; Shen, B.; Liu, L. Insights into biochar and hydrochar production and applications: A review. Energy 2019, 171, 581–598. [Google Scholar] [CrossRef]
  6. Fang, J.; Zhan, L.; Ok, Y.S.; Gao, B. Minireview of potential applications of hydrochar derived from hydrothermal carbonization of biomass. J. Ind. Eng. Chem. 2018, 57, 15–21. [Google Scholar] [CrossRef]
  7. Pietrzak, D.; Kania, J.; Malina, G.; Kmiecik, E.; Wątor, K. Fate of selected neonicotinoid insecticides in soilewater systems: Current state of the art and knowledge gaps. Chemosphere 2020, 255, 126981. [Google Scholar] [CrossRef]
  8. Chretien, F.; Giroux, I.; Theriault, G.; Gagnon, P.; Corriveau, J. Surface runoff and subsurface tile drain losses of neonicotinoids and companion herbicides at edge-of-field. Environ. Pollut. 2017, 224, 255–264. [Google Scholar] [CrossRef]
  9. Main, A.R.; Michel, N.L.; Cavallaro, M.C.; Headley, J.V.; Peru, K.M.; Morrissey, C.A. Snowmelt transport of neonicotinoid insecticides to Canadian Prairie wetlands. Agric. Ecosyst. Environ. 2016, 215, 76–84. [Google Scholar] [CrossRef]
  10. Sánchez-Bayo, F.; Hyne, R.V. Detection and analysis of neonicotinoids in river waters—Development of a passive sampler for three commonly used insecticides. Chemosphere 2014, 99, 143–151. [Google Scholar] [CrossRef]
  11. Wood, T.J.; Goulson, D. The environmental risks of neonicotinoid pesticides: A review of the evidence post 2013. Environ. Sci. Pollut. Res. 2017, 24, 17285–17325. [Google Scholar] [CrossRef] [PubMed]
  12. Bonmatin, J.M.; Giorio, C.; Girolami, V.; Goulson, D.; Kreutzweiser, D.P.; Krupke, C.; Liess, M.; Long, E.; Marzaro, M.; Mitchell, E.A.; et al. Environmental fate and exposure; neonicotinoids and fipronil. Environ. Sci. Pollut. Res. Int. 2015, 22, 35–67. [Google Scholar] [CrossRef] [PubMed]
  13. Struger, J.; Grabuski, J.; Cagampan, S.; Sverko, E.; Mcgoldrick, D.; Marvin, C.H. Factors influencing the occurrence and distribution of neonicotinoid insecticides in surface waters of southern Ontario, Canada. Chemosphere 2017, 169, 516–523. [Google Scholar] [CrossRef]
  14. Anderson, J.C.; Dubetz, C.; Palace, V.P. Neonicotinoids in the Canadian aquatic environment: A literature review on current use products with a focus on fate, exposure and biological effects. Sci. Total Environ. 2015, 505, 409–422. [Google Scholar] [CrossRef] [PubMed]
  15. Huseth, A.S.; Groves, R.L. Environmental Fate of Soil Applied Neonicotinoid Insecticides in an Irrigated Potato Agroecosystem. PLoS ONE 2014, 9, e97081. [Google Scholar] [CrossRef] [PubMed]
  16. Morrissey, C.A.; Mineau, P.; Devries, J.H.; Sanchez-Bayo, F.; Liess, M.C.; Cavallaro, M.C.; Liber, K. Neonicotinoid contamination of global surface waters and associated risk to aquatic invertebrates: A review. Environ. Int. 2015, 74, 291–303. [Google Scholar] [CrossRef]
  17. Todey, S.A.; Fallon, A.M.; Arnold, W.A. Neonicotinoid insecticide hydrolysis and photolysis: Rates and residual toxicity. Environ. Toxicol. Chem. 2018, 37, 2797–2809. [Google Scholar] [CrossRef]
  18. Liu, Y.; Lonappan, L.; Brar, S.K.; Yang, S. Impact of biochar amendment in agricultural soils on the sorption, desorption, and degradation of pesticides: A review. Sci. Total Environ. 2018, 645, 60–70. [Google Scholar] [CrossRef]
  19. Chen, N.; Huang, Y.; Hou, X.; Ai, Z.; Zhang, L. Photochemistry of hydrochar: Reactive Oxygen Species Generation of Sulfadimidine Degradation. Environ. Sci. Technol. 2017, 51, 11278–11287. [Google Scholar] [CrossRef]
  20. Hao, S.; Zhu, X.; Liu, Y.; Qian, F.; Fang, Z.; Shi, Q.; Zhang, S.; Jianmin Chen, J.; Jason Ren, Z.J. Production Temperature Effects on the Structure of Hydrochar-Derived Dissolved Organic Matter and Associated Toxicity. Environ. Sci. Technol. 2018, 52, 7486–7495. [Google Scholar] [CrossRef]
  21. Fang, G.; Gao, J.; Liu, C.; Dionysiou, D.D.; Wang, Y.; Zhou, D. Key Role of Persistent Free Radicals in Hydrogen Peroxide Activation by Biochar: Implications to Organic Contaminant Degradation. Environ. Sci. Technol. 2014, 48, 1902–1910. [Google Scholar] [CrossRef] [PubMed]
  22. Fu, H.; Liu, H.; Mao, J.; Chu, W.; Li, Q.; Alvarez, P.J.J.; Qu, X.; Zhu, D. Photochemistry of Dissolved Black Carbon Released from Biochar: Reactive Oxygen Species Generation and Phototransformation. Sci. Technol. 2016, 50, 1218–1226. [Google Scholar] [CrossRef] [PubMed]
  23. Fang, G.; Liu, C.; Wang, Y.; Dionysiou, D.D.; Zhou, D. Photogeneration of reactive oxygen species from biochar suspension for diethyl phthalate degradation. Appl. Catal. B Environ. 2017, 214, 34–45. [Google Scholar] [CrossRef]
  24. Pinna, M.V.; Banonti, S.; Miglietta, F.; Pusino, A. Photooxidation of foramsulfuron: Effects of char substances. J. Photochem. Photobiol. A 2016, 326, 16–20. [Google Scholar] [CrossRef]
  25. Serelis, K.; Mantzos, N.; Meintani, D.; Konstantinou, I. The effect of biochar, hydrochar particles, and dissolved organic matter on the photodegradation of metribuzin herbicide in aquatic media. J. Environ. Chem. Eng. 2021, 9, 105027. [Google Scholar] [CrossRef]
  26. Liang, R.; Tang, F.; Wang, J.; Yue, Y. Photo-degradation dynamics of five neonicotinoids: Bamboo vinegar as a synergistic agent for improved functional duration. PLoS ONE 2019, 14, e0223708. [Google Scholar] [CrossRef]
  27. Mulligan, R.A.; Redman, Z.C.; Keener, M.R.; Ball, D.B.; Tjeerdemaa, R.S. Photodegradation of clothianidin under simulated California rice field conditions. Pest. Manag. Sci. 2016, 72, 1322–1327. [Google Scholar] [CrossRef]
  28. Gong, Y.; Jinhui Chen, J.; Wang, H.; Li, J. Separation and Identification of Photolysis Products of Clothianidin by Ultra-Performance Liquid Tandem Mass Spectrometry. Anal. Lett. 2012, 45, 2483–2492. [Google Scholar] [CrossRef]
  29. Li, Y.; Li, Y.; Liu, Y.; Ward, T.J. Photodegradation of clothianidin and thiamethoxam in agricultural soils. Environ. Sci. Pollut. Int. 2018, 25, 31318–31325. [Google Scholar] [CrossRef]
  30. Kralj, M.B.; Dilcanb, E.G.; Salihoğlub, G.; Mazurc, D.M.; Lebedevc, A.T.; Trebšea, P. Photocatalytic Degradation of Clothianidin: Effect of Humic Acids, Nitrates and Oxygen. J. Anal. Chem. 2019, 74, 1371–1377. [Google Scholar] [CrossRef]
  31. Žabar, R.; Komel, T.; Fabjan, J.; Kralj, M.B.; Trebše, P. Photocatalytic degradation with immobilised TiO2 of three selected neonicotinoid insecticides: Imidacloprid, thiamethoxam and clothianidin. Chemosphere 2012, 89, 293–301. [Google Scholar] [CrossRef] [PubMed]
  32. Voigt, M.; Jaeger, M. Structure and QSAR analysis of photoinduced transformation products of neonicotinoids from EU watchlist for ecotoxicological assessment. Sci. Total Environ. 2021, 751, 141634. [Google Scholar] [CrossRef] [PubMed]
  33. van der Velde-Koerts, T.; van Hoeven-Arentzen, P.H.; Mahieu, C.M. Clothianidin (238); Centre for Substances and Integrated Risk Assessment, National Institute of Public Health and the Environment (RIVM): Bilthoven, The Netherlands, 2010; Available online: https://www.fao.org/fileadmin/templates/agphome/documents/Pests_Pesticides/JMPR/Evaluation10/Chlotiahinidin.pdf (accessed on 20 October 2023).
  34. Zhang, S.; Zhu, X.; Zhou, S.; Shang, H.; Luo, J.; Tsang, D.C.W. Chapter 15—Hydrothermal Carbonization for Hydrochar Production and Its Application. In Biochar from Biomass and Waste; Elsevier: Amsterdam, The Netherlands, 2019; pp. 275–294. [Google Scholar] [CrossRef]
  35. Mohanta, D.; Ahmaruzzaman, M. A novel Au-SnO2-rGO ternary nanoheterojunction catalyst for UV-LED induced photocatalytic degradation of clothianidin: Identification of reactive intermediates, degradation pathway and in-depth mechanistic insight. J. Hazard. Mater. 2020, 397, 122685. [Google Scholar] [CrossRef] [PubMed]
Figure 1. ATR-FTIR spectra of hydrochar after washing with water, acetone and acid (HCl–HF).
Photochem 03 00027 g001
Figure 2. Photodegradation kinetics of clothianidin in bi-distilled water (C0 = 10 mg L−1; Ιntensity = 750 W m2).
Photochem 03 00027 g002
Figure 3. Photodegradation kinetics of clothianidin (CLOTH) in hydrochar suspensions (HCp) (a) and hydrochar DOM water extracts (HCw) (b).
Photochem 03 00027 g003
Figure 4. UV-Vis spectra of clothianidin (C0 = 10 mgL−1, Intensity = 750 Wm−2) during the photolytic process (0–300 min).
Photochem 03 00027 g004
Figure 5. Evolution profiles of TPs during photolysis of clothianidin (10 mg L−1) in bi-distilled water.
Photochem 03 00027 g005
Figure 6. Evolution of the photolytic degradation products of clothianidin (10 mg L−1) in aqueous suspension (200 mg L−1) of hydrochar (HCp).
Photochem 03 00027 g006
Figure 7. Relative ratio of TP1 formation and evolution to clothianidin parent compound in hydrochar suspensions (HCp) and bi-distilled water (w).
Photochem 03 00027 g007
Figure 8. Relative ratio of TP2 formation and evolution to clothianidin parent compound in hydrochar suspensions (HCp) and bi-distilled water (w).
Photochem 03 00027 g008
Figure 9. Relative ratio of TP3 formation and evolution to clothianidin parent compound in hydrochar suspensions (HCp) and bi-distilled water (w).
Photochem 03 00027 g009
Figure 10. Relative ratio of TP4 formation and evolution to clothianidin parent compound in hydrochar suspensions (HCp) and bi-distilled water (w).
Photochem 03 00027 g010
Figure 11. Relative ratio of TP5 formation and evolution to clothianidin parent compound in hydrochar suspensions (HCp) and bi-distilled water (w).
Photochem 03 00027 g011
Figure 12. Relative ratio of TP6 formation and evolution to clothianidin parent compound in hydrochar suspensions (HCp) and bi-distilled water (w).
Photochem 03 00027 g012
Figure 13. Proposed photolytic degradation pathways for clothianidin in aqueous hydrochar suspensions and bi-distilled water.
Photochem 03 00027 g013
Figure 14. Monitoring of the bioluminescence inhibition of Vibrio fischeri during photolytic degradation of clothianidin in bi-distilled water.
Photochem 03 00027 g014
Table 1. First-order equations, rate constants (k), half-lives (t1/2) and determination coefficients (R2) for CLOTH photodegradation in bi-distilled water, in hydrochar water suspensions (HCp) and hydrochar DOM water extracts (HCw).
TreatmentsEquationsk (min−1)t1/2 (min)R2
Controly = 1.022 × e−0.0040x0.0040173.30.9951
HCp-50y = 0.935 × e−0.0020x0.0020346.50.9538
HCp-100y = 0.971 × e−0.0038x0.0038182.30.9862
HCp-200y = 1.062 × e−0.0042x0.00421650.9945
HCp-400y = 0.932 × e−0.0036x0.0036267.50.9523
HCw-50y = 0.937 × e−0.0036x0.0036192.50.9910
HCw-100y = 1.009 × e−0.0039x0.0039177.70.9976
HCw-200y = 1.040 × e−0.0034x0.0034203.80.9934
HCw-400y = 0.966 × e−0.0034x0.0034203.80.9919
Table 2. The literature data regarding the photolytic degradation of clothianidin.
Matrix/
Reactor/
Lamp
Initial Concentration
of Clothianidin
(mgL−1)
Rate Constant/
DT50
Degradation
Efficiency
(%)
Irradiation
Time (min)
Ref.
Vinegar bamboo/Quartz/High pressure Hg 10-80180[26]
Deionized water/-/UV-light1.10.0167 min−1/42 min93160[27]
Milli Q water/Quartz/Xe lamp9.80.187 h−1/3.7 h59300[28]
Hydrochar suspension/Duran glass/Xe lamp100.0042 min−1/165 min70300this work
Table 3. UHPLC-ESI-HR-MS data (pseudo-molecular ions (M + H)+; molecular formula; mass error Δ (ppm); and ring double bond equivalents (RDB)) of clothianidin transformation products in aqueous suspensions and hydrochar extracts.
TPRtm/z (M + H)+Molecular FormulaMass Error (ppm)RDBMS2Molecular FormulaMass Error (ppm)RDB
CLOTH11.12250.0154
271.9972
C6H9O2N5ClS
C6H8O2N5ClSNa
−2.3584.5220.0174C6H9ON4ClS−2.8674.0
206.0145C6H9ON3ClS−2.1213.5
169.0537C6H9N4S−3.0384.5
168.0462C6H8N4S−1.0035.0
131.9665C4H3NSCl−3.1383.5
TP19.93206.0146C6H9ON3ClS−1.6353.5174.9723C5H4ON2ClS−2.7304.5
148.9929C4H6N2ClS−3.7132.5
131.9664C4H3NClS−3.8203.5
119.9663C3H3NClS−5.0352.5
113.0162C4H5N2S−5.2693.5
TP27.12201.0431C6H9N4O2S−5.0874.5
TP36.09205.0307C6H10N4ClS−1.2743.5188.0038C6H7N3ClS−2.8844.5
169.0537C6H9N4S−2.9794.5
163.0086C5H8N2ClS−3.0872.5
148.9930C4H6N2ClS−3.3772.5
131.9664C4H3NClS−3.9713.5
113.0162C4H5N2S−5.6233.5
TP44.93221.0249C6H10ON4ClS−4.2803.5185.0486C6H9ON4S−2.9624.5
168.0458C6H8N4S−3.9785.0
164.9879C4H6ON2ClS−2.8352.5
131.9663C4H3NClS−4.8053.5
129.0112C4H5ON2S−4.3413.5
113.0161C4H5N2S−6.2423.5
TP51.66169.0539C6H9N4S−2.0914.5113.0161C4H5N2S−5.8003.5
TP61.37137.0817C6H9N4−3.454.581.0440C4H5N2−8.4493.5
Table 4. Proposed structures of clothianidin photodegradation products identified using LC-MS-LIT-Orbitrap and transformation processes reported in the literature.
Compound/TPStructure/Proposed StructureTransformation Process/SubstrateReferences
ClothianidinPhotochem 03 00027 i001Photodegradation/water methanol[29]
ΤΡ1Photochem 03 00027 i002Photocatalysis (TiO2)/water[17,30,31]
ΤΡ2Photochem 03 00027 i003--
ΤΡ3Photochem 03 00027 i004Photodegradation/water[32]
ΤΡ4Photochem 03 00027 i005Photodegradation/water[32]
ΤΡ5Photochem 03 00027 i006Photodegradation/soil[32]
ΤΡ6Photochem 03 00027 i007Photodegradation/water[33]
Disclaimer/Publisher’s Note: The statements, opinions and data contained in all publications are solely those of the individual author(s) and contributor(s) and not of MDPI and/or the editor(s). MDPI and/or the editor(s) disclaim responsibility for any injury to people or property resulting from any ideas, methods, instructions or products referred to in the content.

