Author Contributions
Conceptualization, P.M., M.S. and T.R.; methodology, P.M., M.S., T.R. and A.K.; software, P.M.; validation and formal analysis, P.M., M.S. and T.R.; resources, N.M., F.F., R.O. and A.D.-S.; data curation, P.M., T.R. and A.K.; writing—original draft preparation, P.M.; writing—review and editing, all authors; supervision, N.M., F.F., R.O. and A.D.-S.; project administration, A.D.-S. All authors have read and agreed to the published version of the manuscript.
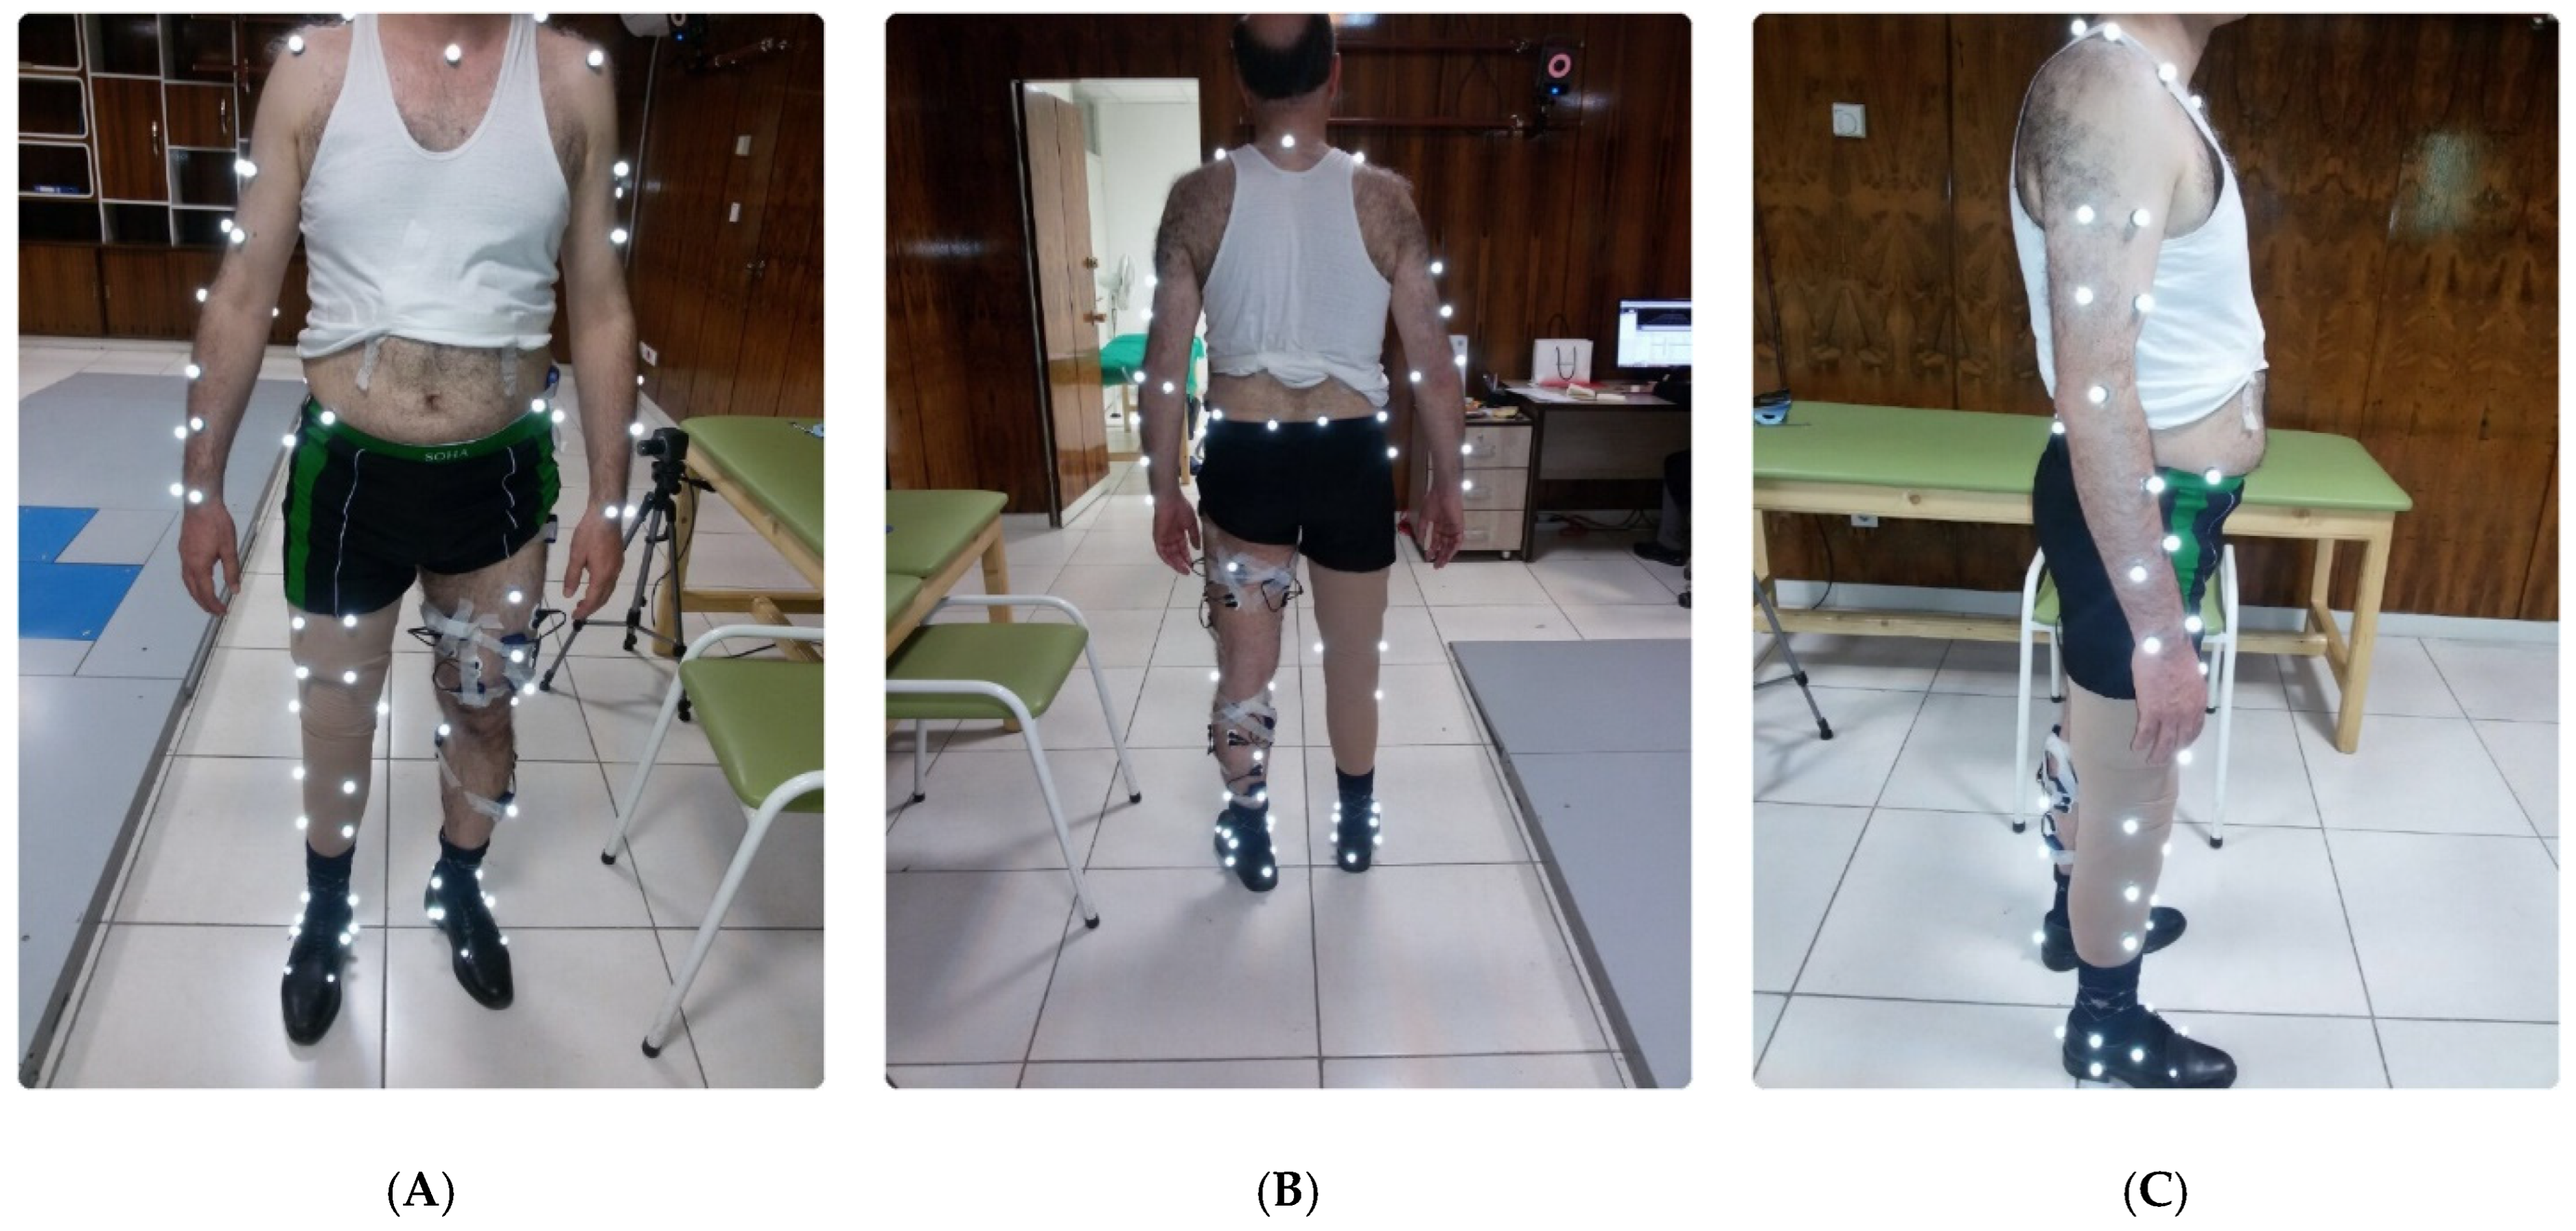
Figure 1.
EMG and reflective marker attachments on TFA (A) front, (B) back, and (C) side view.
Figure 1.
EMG and reflective marker attachments on TFA (A) front, (B) back, and (C) side view.
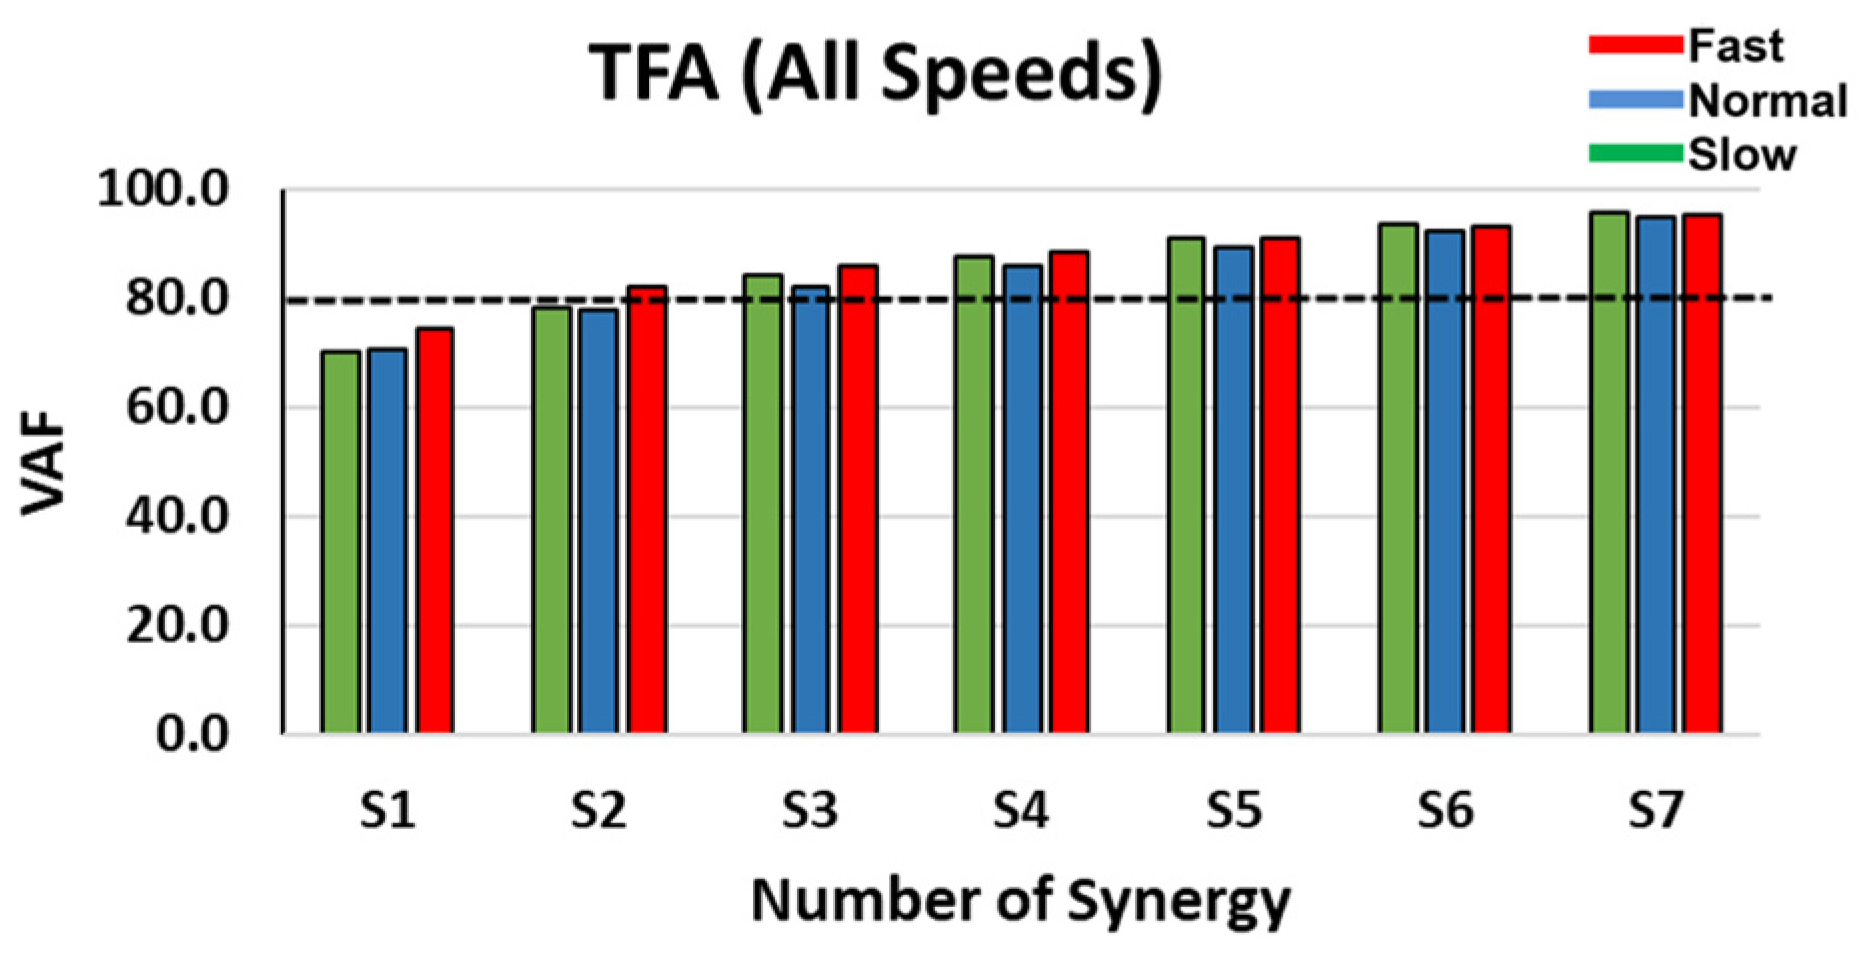
Figure 2.
VAF comparison as a function of the number of synergies in TFA at slow, normal, and fast speeds.
Figure 2.
VAF comparison as a function of the number of synergies in TFA at slow, normal, and fast speeds.
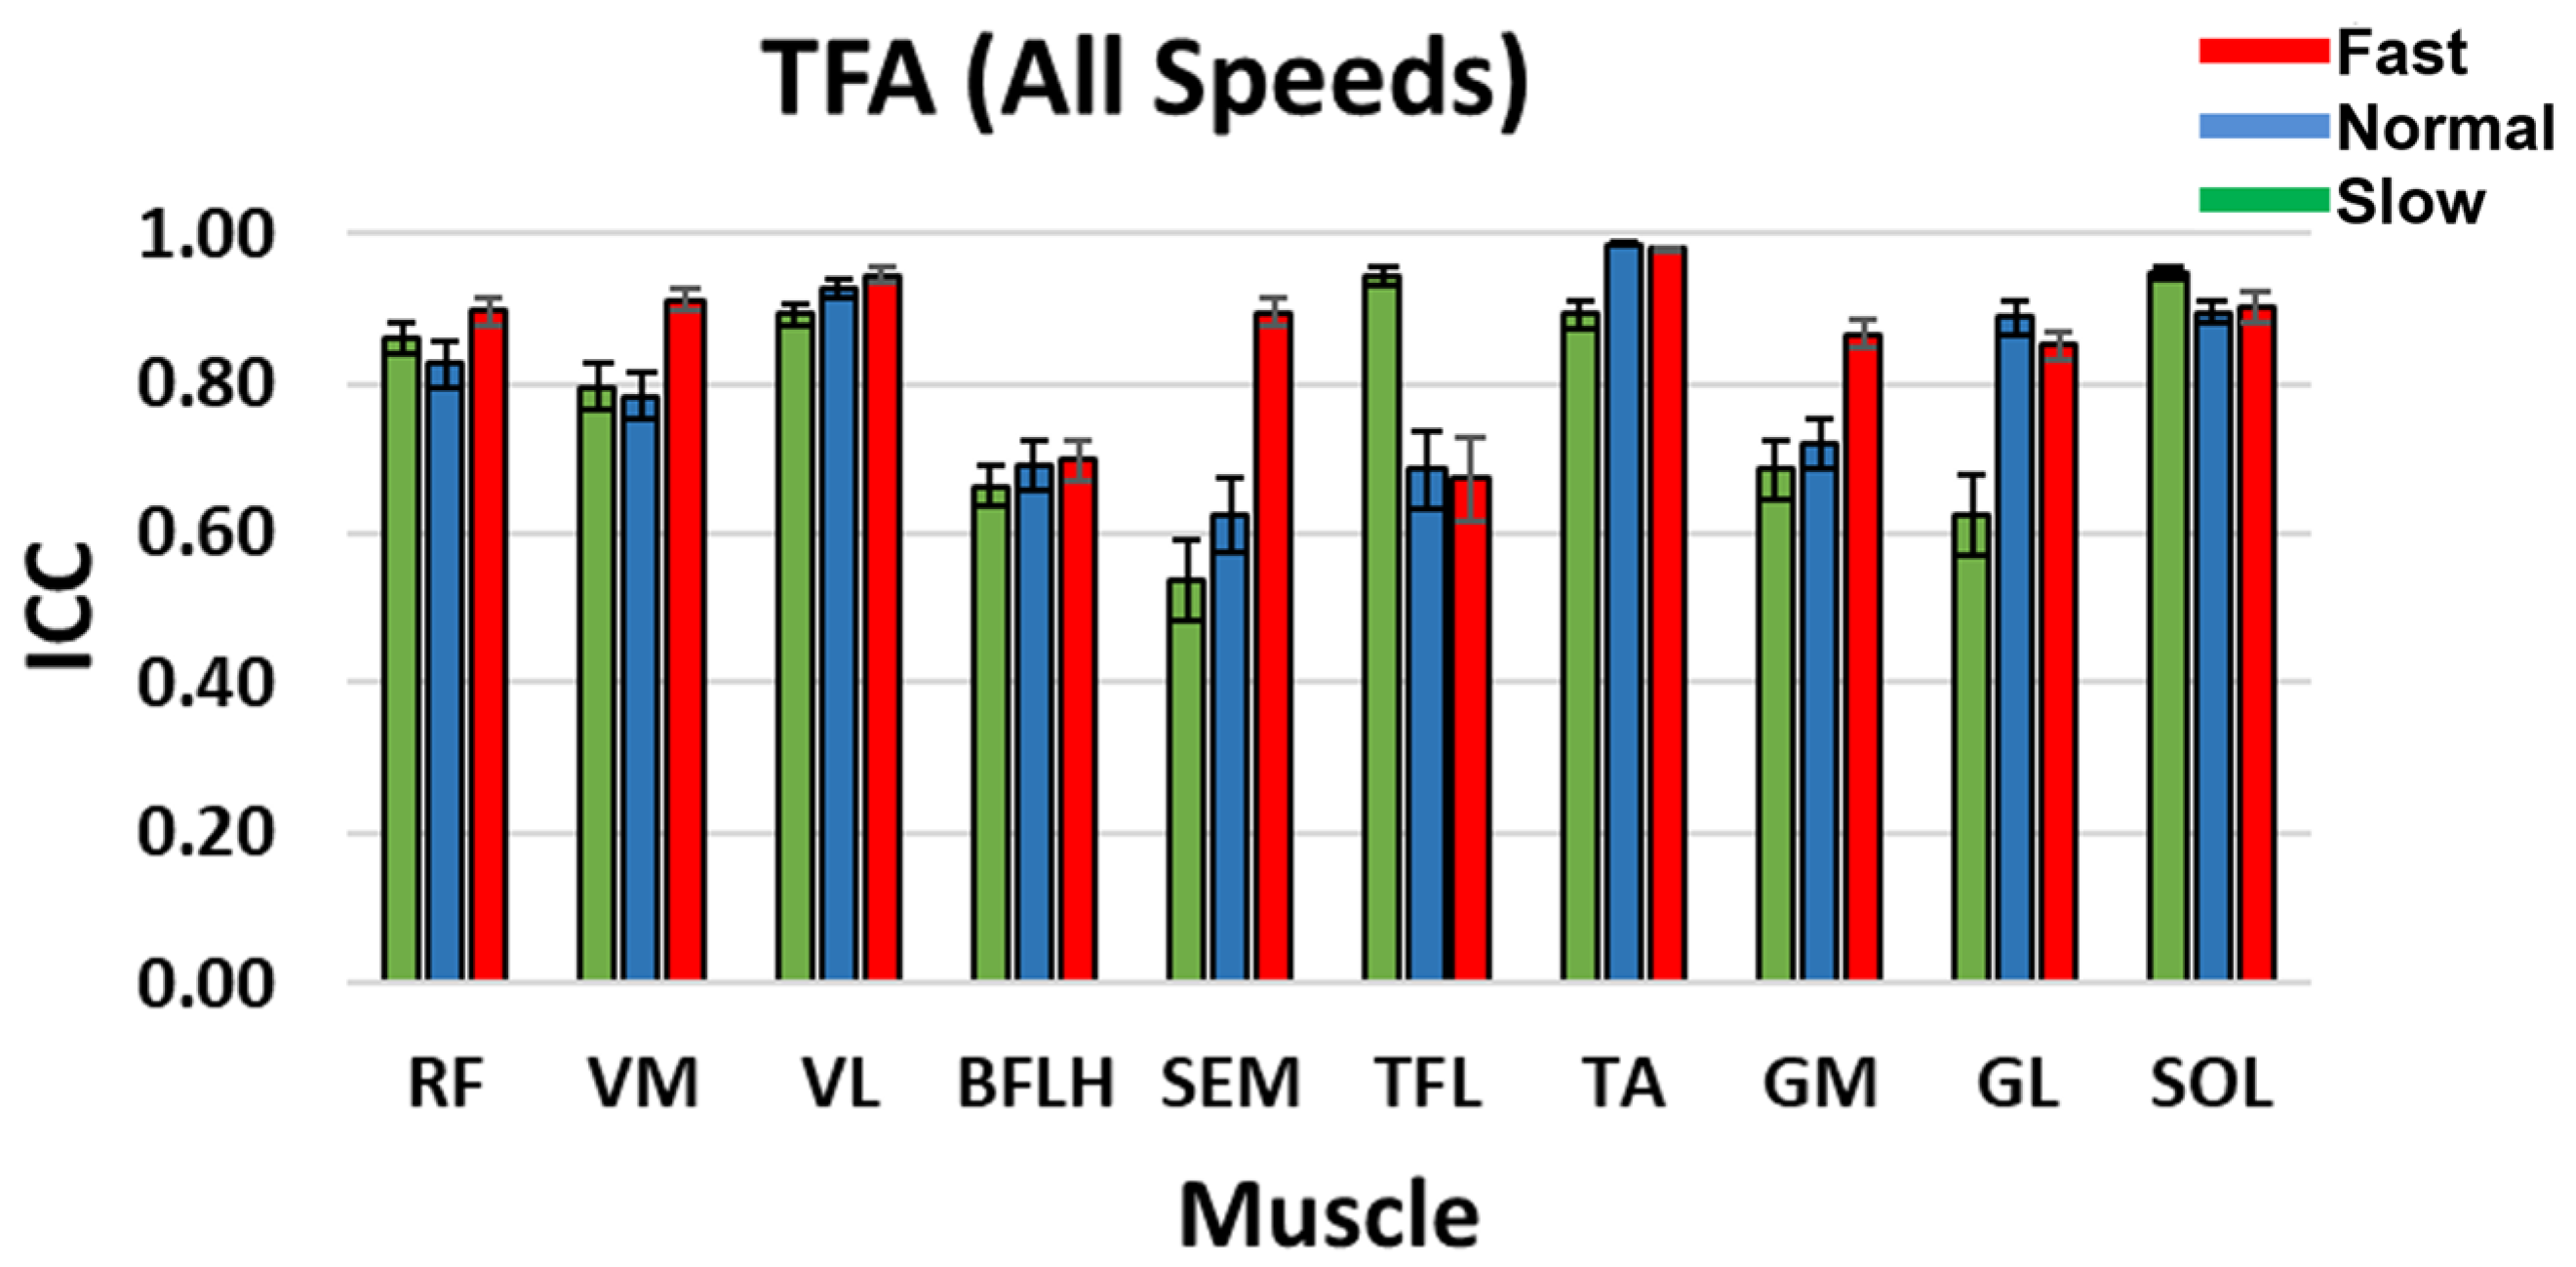
Figure 3.
TFA ICC between the reconstructed and original muscle signal when four synergy groups were selected during slow, normal, and fast speeds. Standard error bars indicate ± one.
Figure 3.
TFA ICC between the reconstructed and original muscle signal when four synergy groups were selected during slow, normal, and fast speeds. Standard error bars indicate ± one.
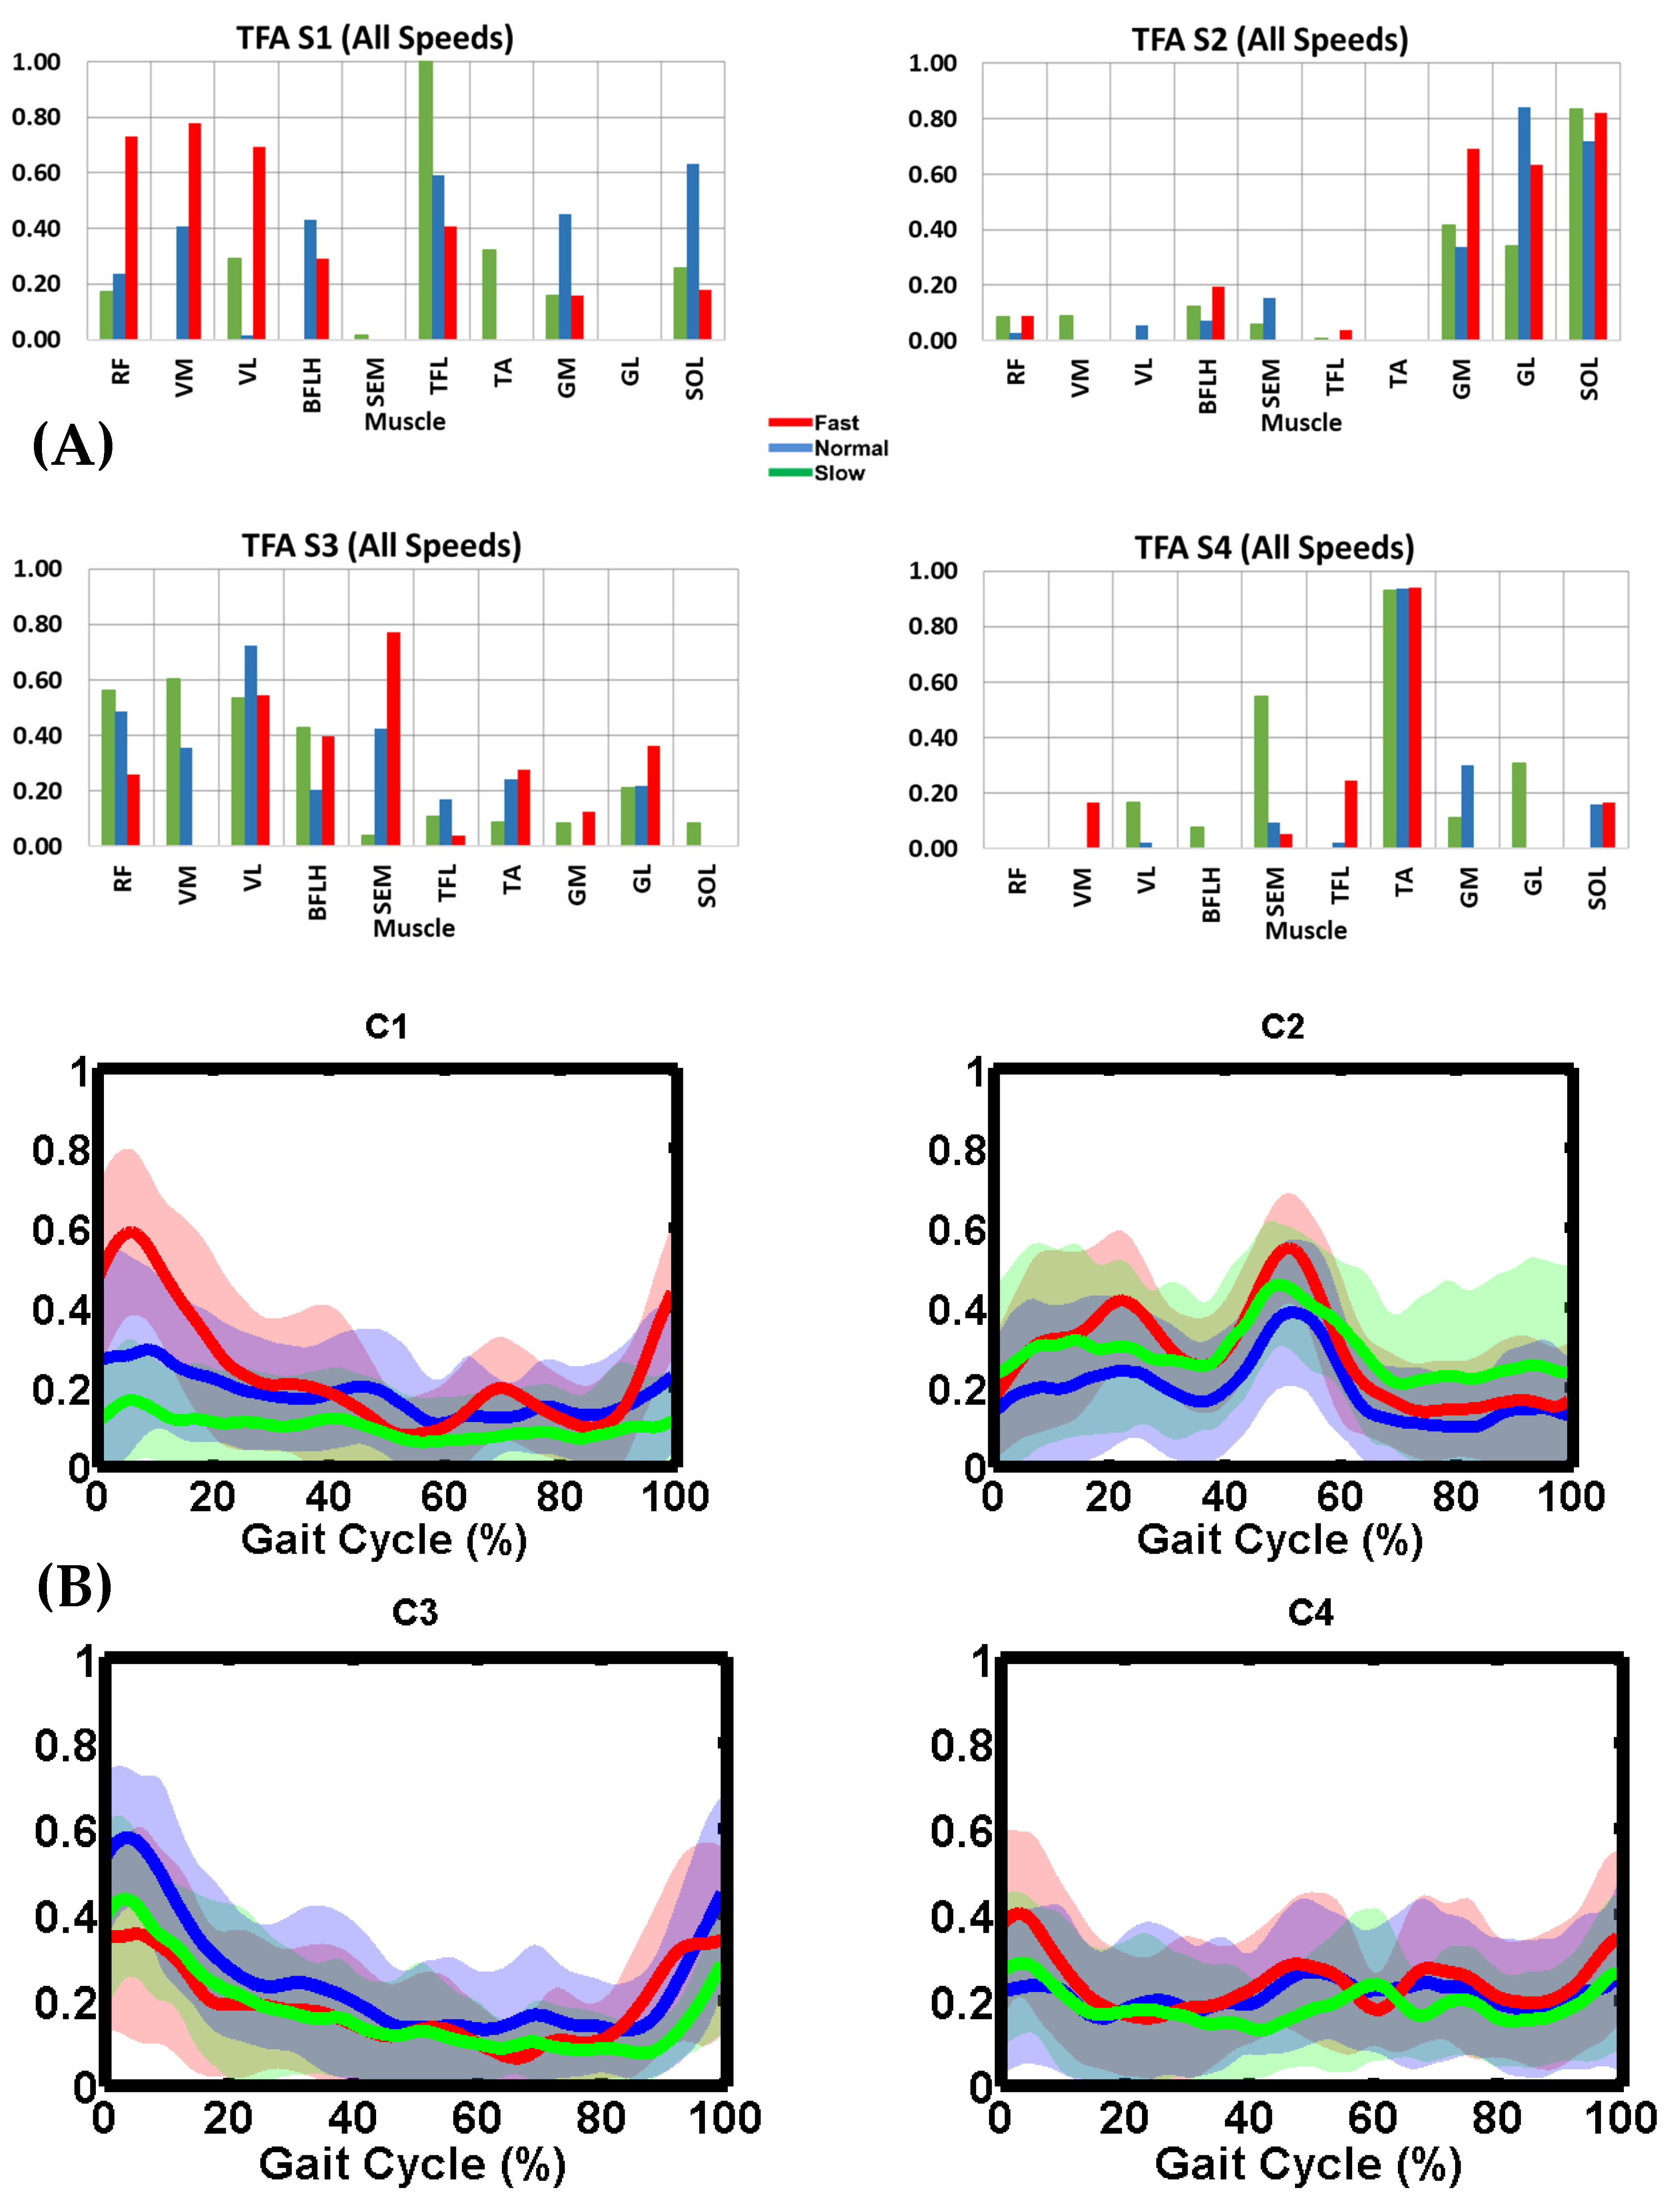
Figure 4.
TFA (A) muscle synergy vectors (S1–S4) and (B) activation coefficient profiles (C1–C4) during slow, normal, and fast speeds. In (A), the bars represent muscle weightings within each synergy group. In (B), the thick lines represent the mean trajectory of activation coefficient profiles, and the shaded area is ± one standard deviation from the mean. TFA slow speed was 0.61 ± 0.09 m/s (stance: 73.4 ± 3.1% and swing: 26.6 ± 3.1%). TFA normal speed was 0.76 ± 0.16 m/s (stance: 70.8 ± 3.6% and swing: 29.2 ± 3.6%). TFA fast speed was 0.97 ± 0.14 m/s (stance: 69.8 ± 2.6% and swing: 30.2 ± 2.6%). Slow, normal, and fast illustrated in green, blue and red, respectively.
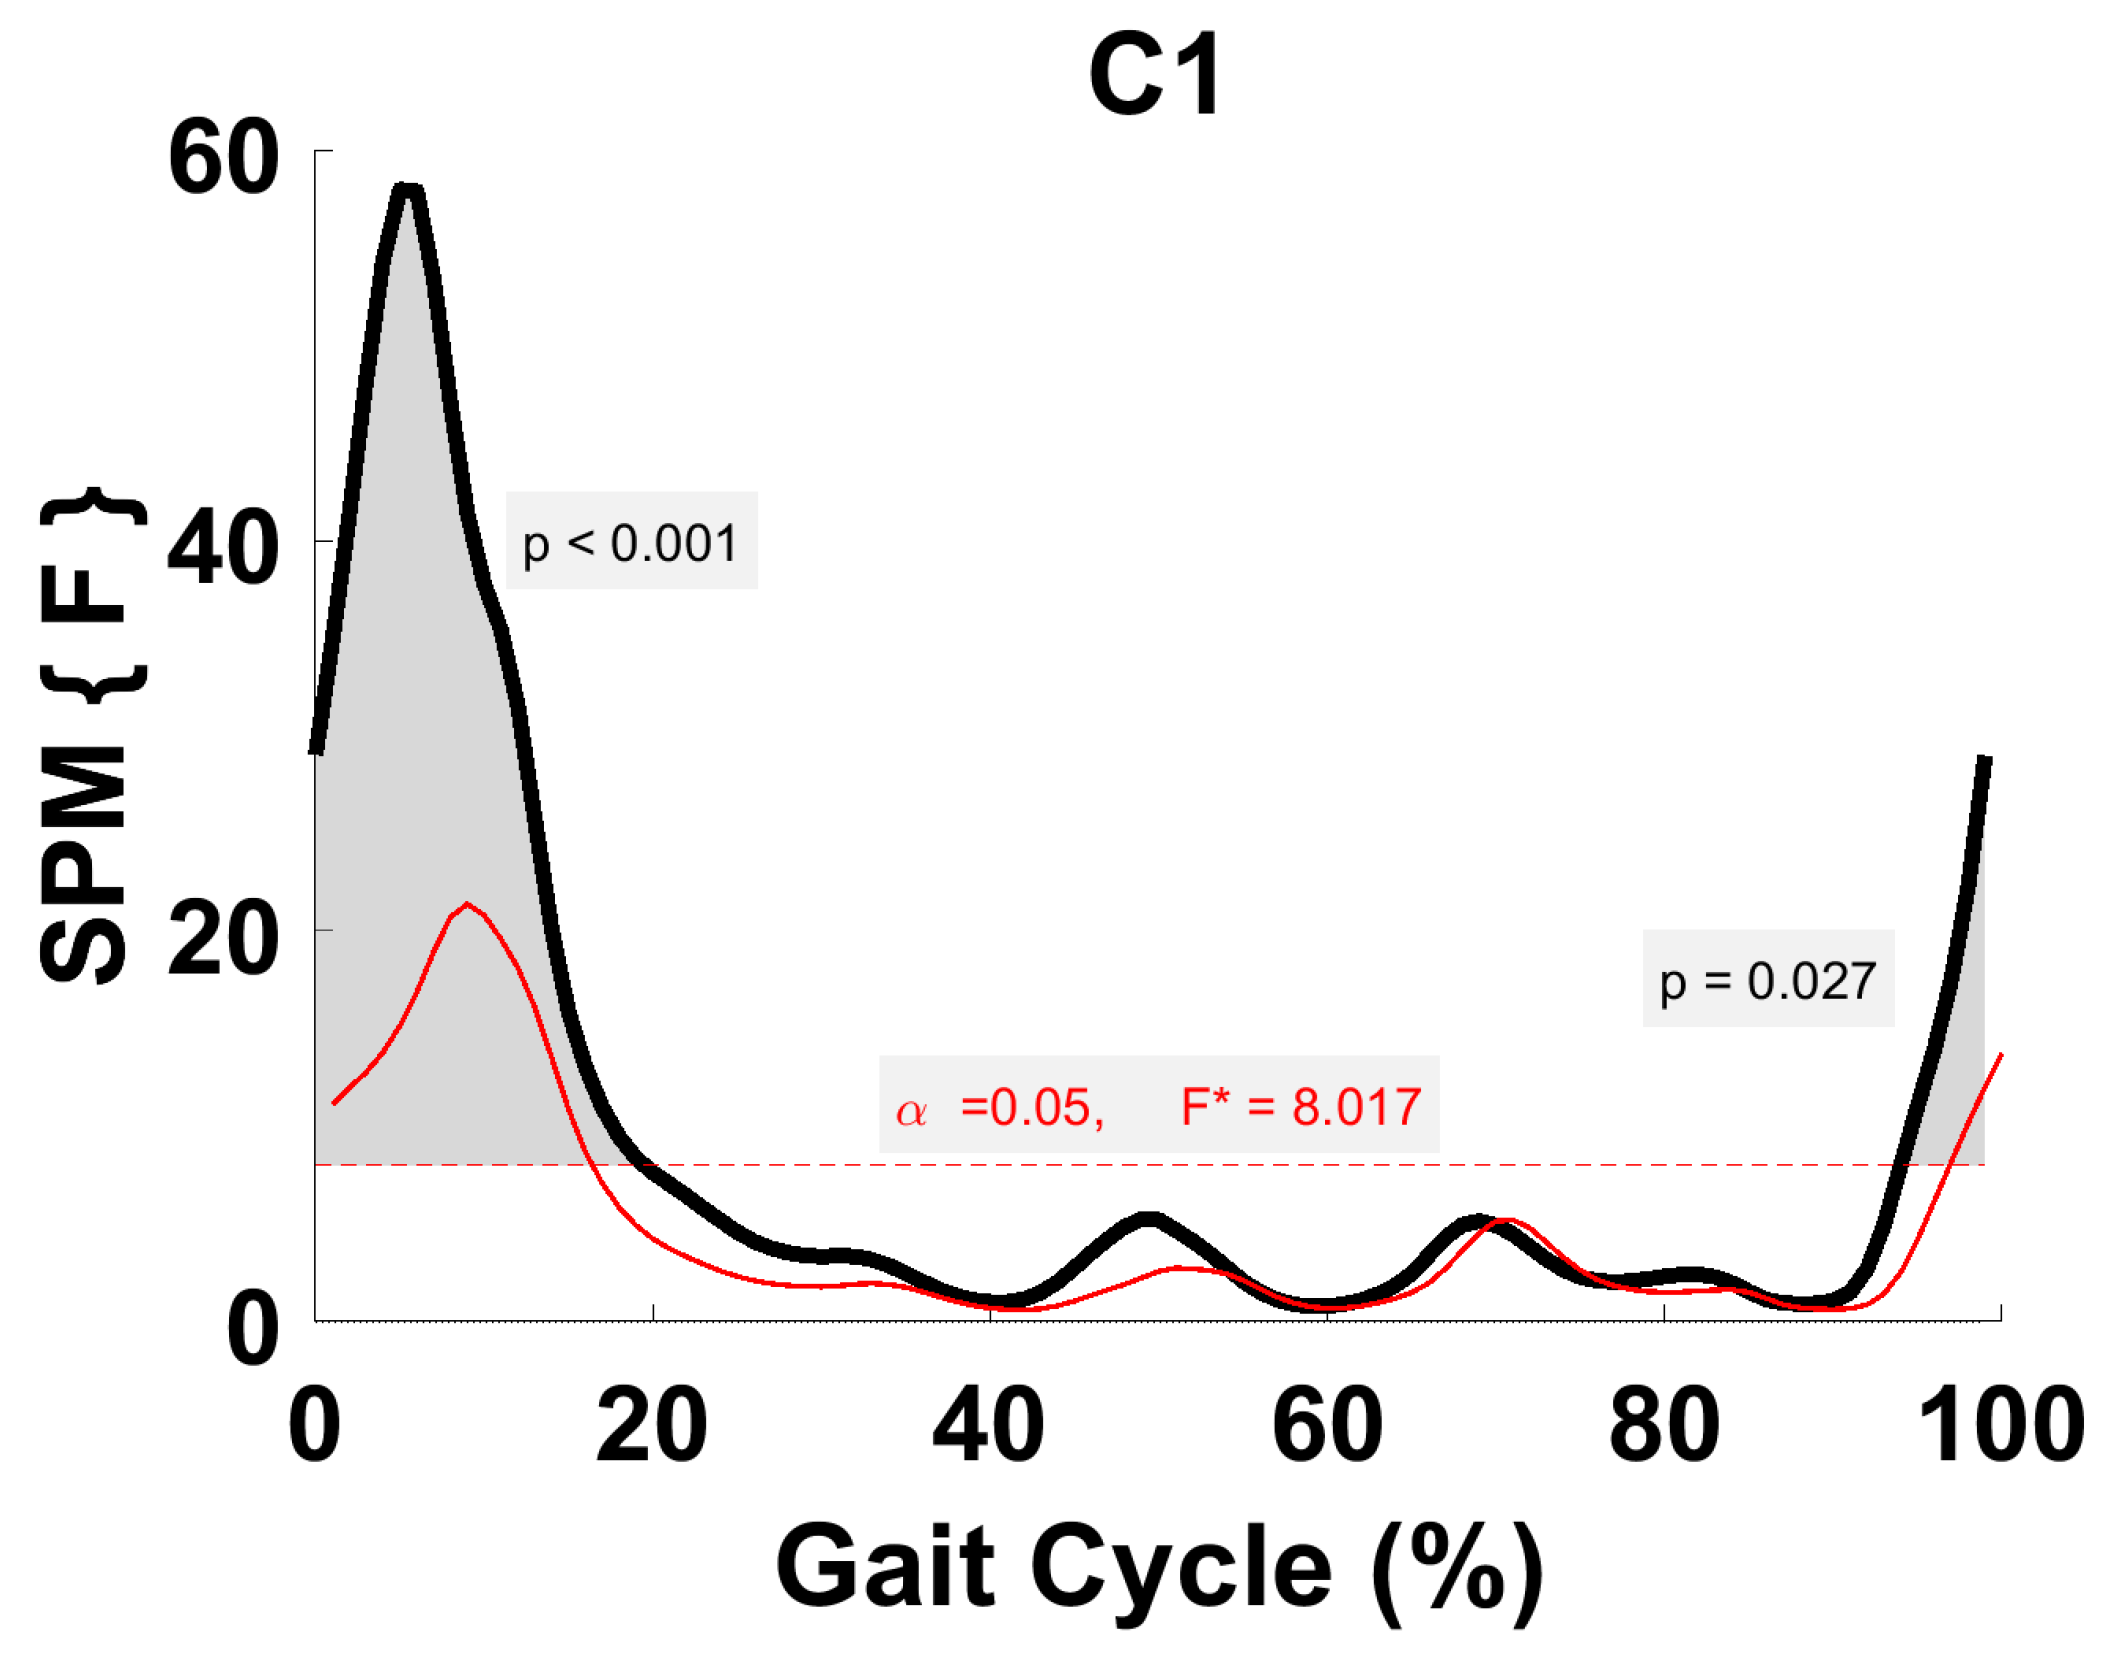
Figure 5.
TFA C1 parametric RM ANOVA within- and between-subjects, depicting significant differences between speeds. The horizontal red dotted line indicates the critical threshold of 8.02. Suprathreshold clusters are shown in gray where p < 0.05. Black line is RM ANOVA (Within) and red line is ANOVA (Between).
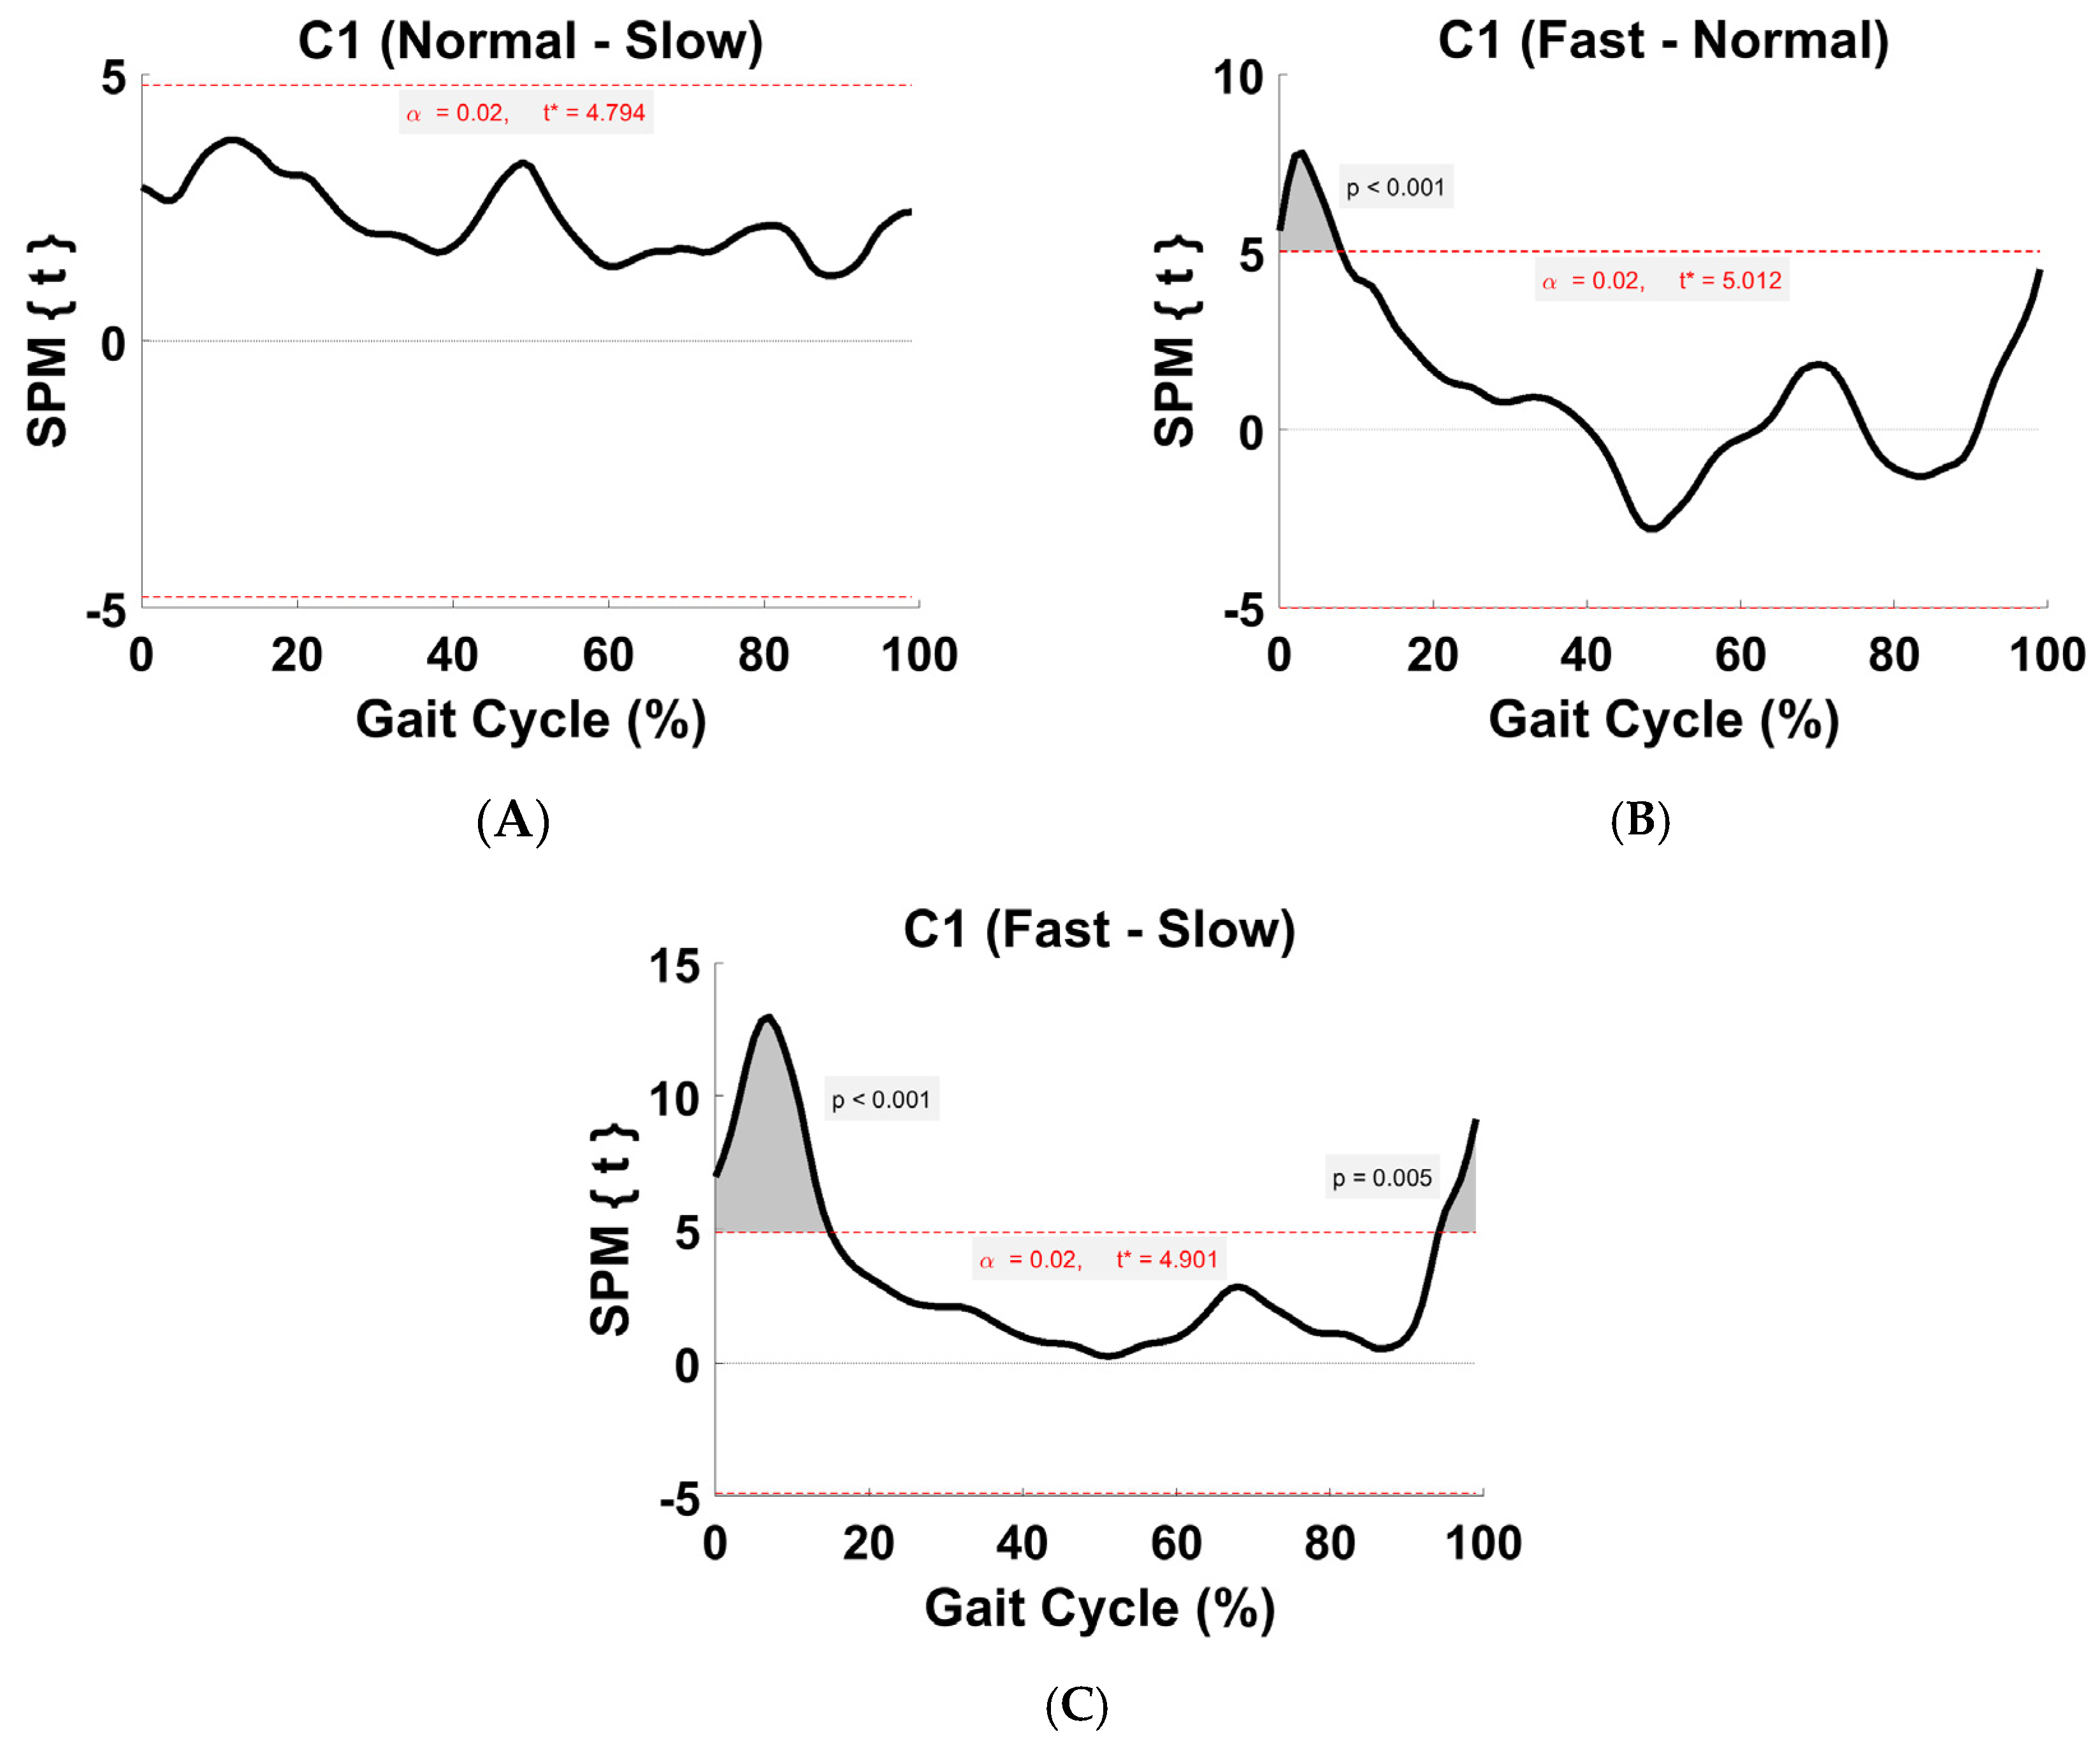
Figure 6.
TFA C1 within-subject post hoc paired t statistic between pairs of walking speeds. The red dashed lines indicate critical thresholds of t* = 4.79, 5.01, and 4.9 for (A–C), respectively. Suprathreshold clusters are shown in gray where p < 0.02.
Figure 6.
TFA C1 within-subject post hoc paired t statistic between pairs of walking speeds. The red dashed lines indicate critical thresholds of t* = 4.79, 5.01, and 4.9 for (A–C), respectively. Suprathreshold clusters are shown in gray where p < 0.02.
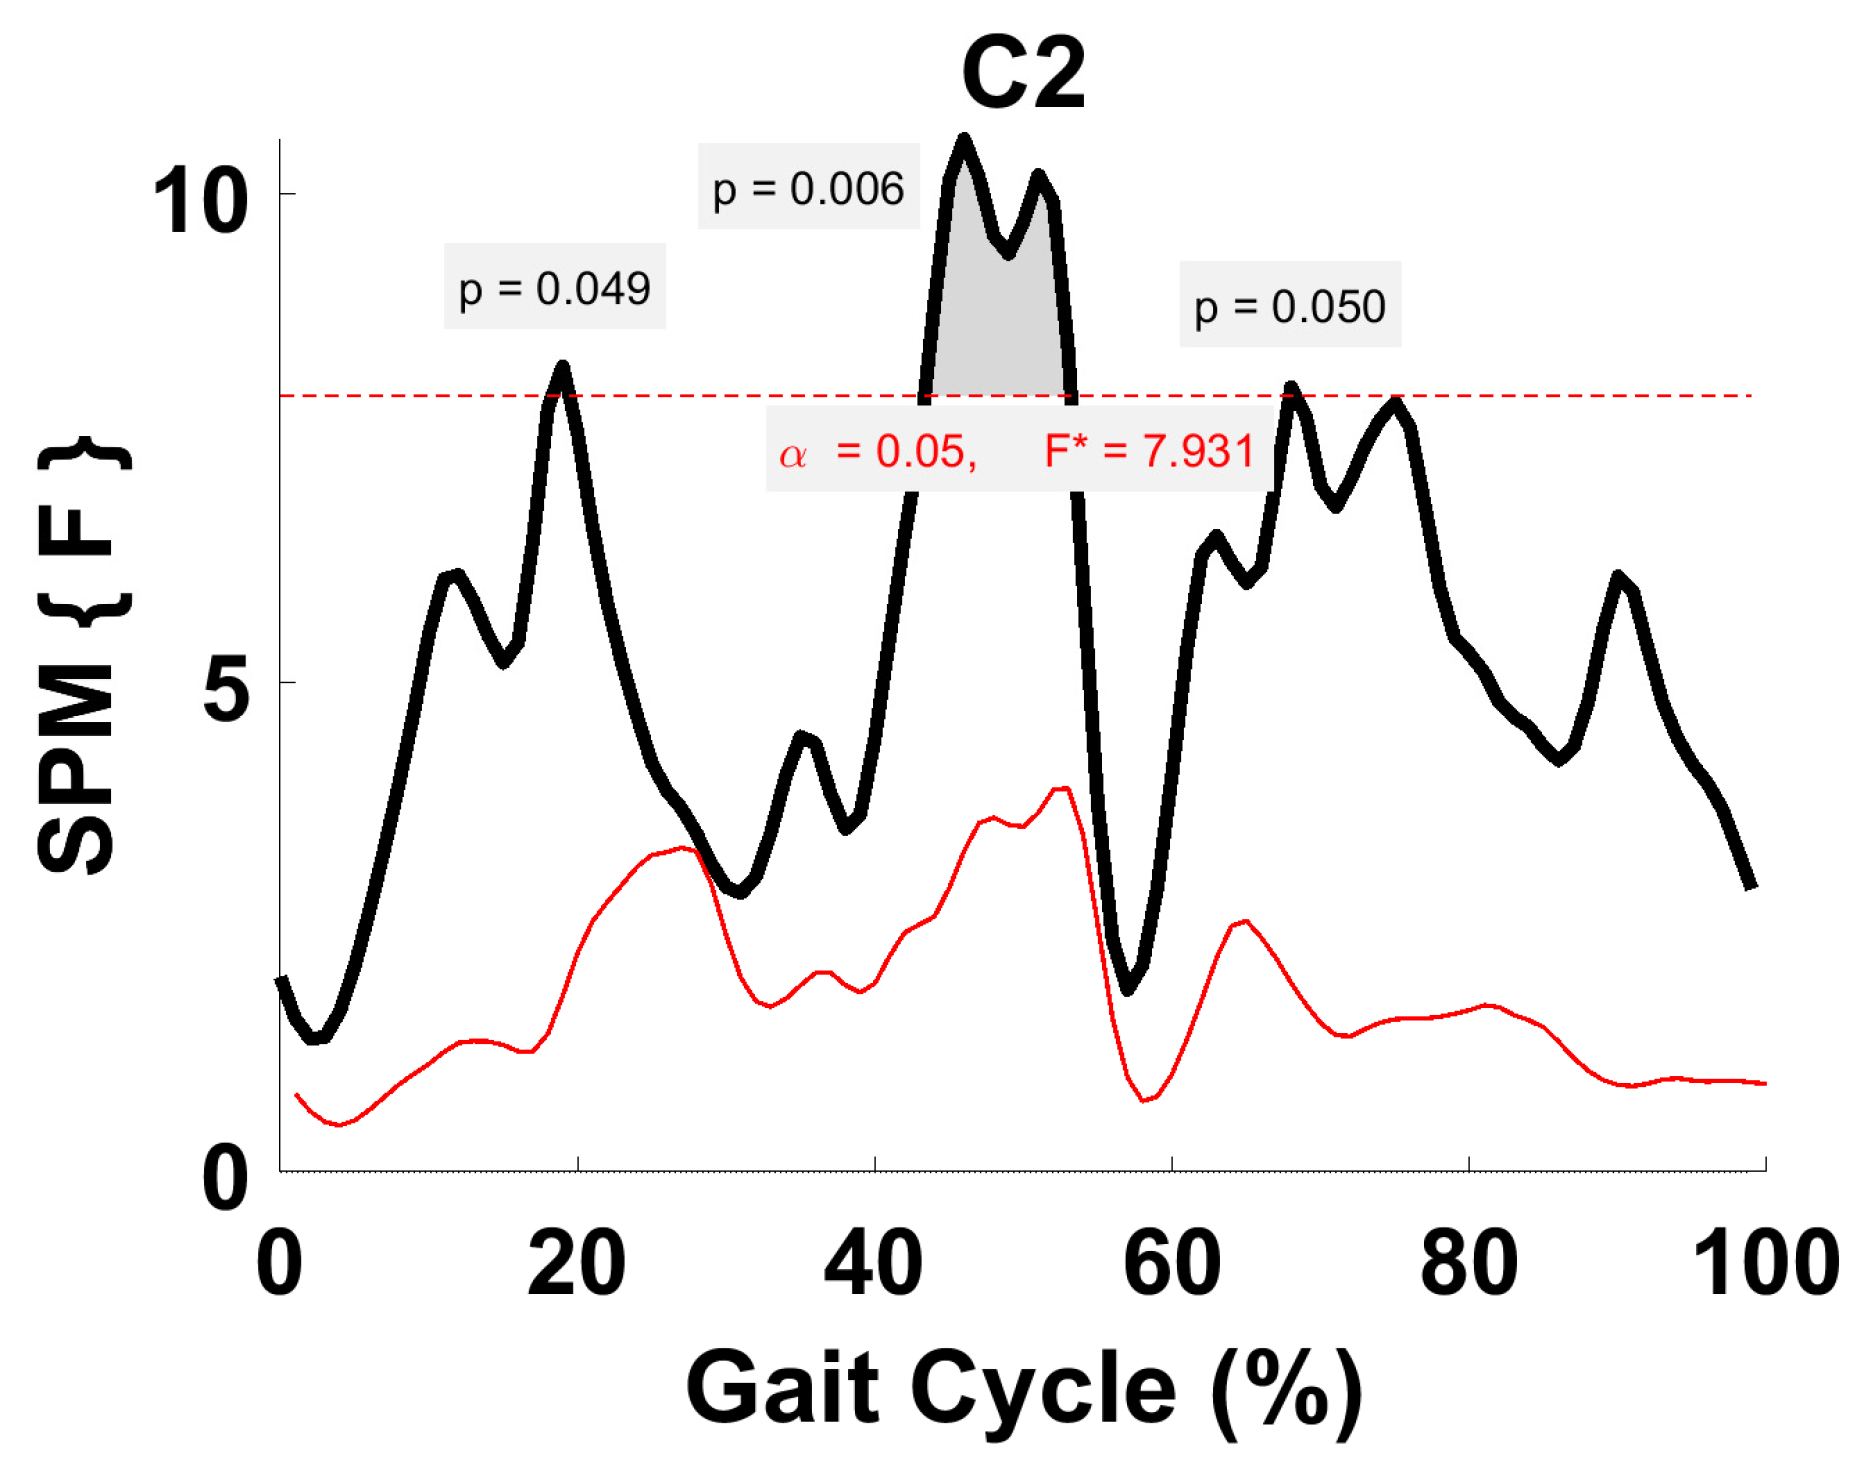
Figure 7.
TFA C2 parametric RM ANOVA within- and between-subjects, depicting significant differences between speeds. The horizontal red dotted line indicates the critical threshold of 7.93. Suprathreshold clusters are shown in gray where p < 0.05. Black line is RM ANOVA (Within) and red line is ANOVA (Between).
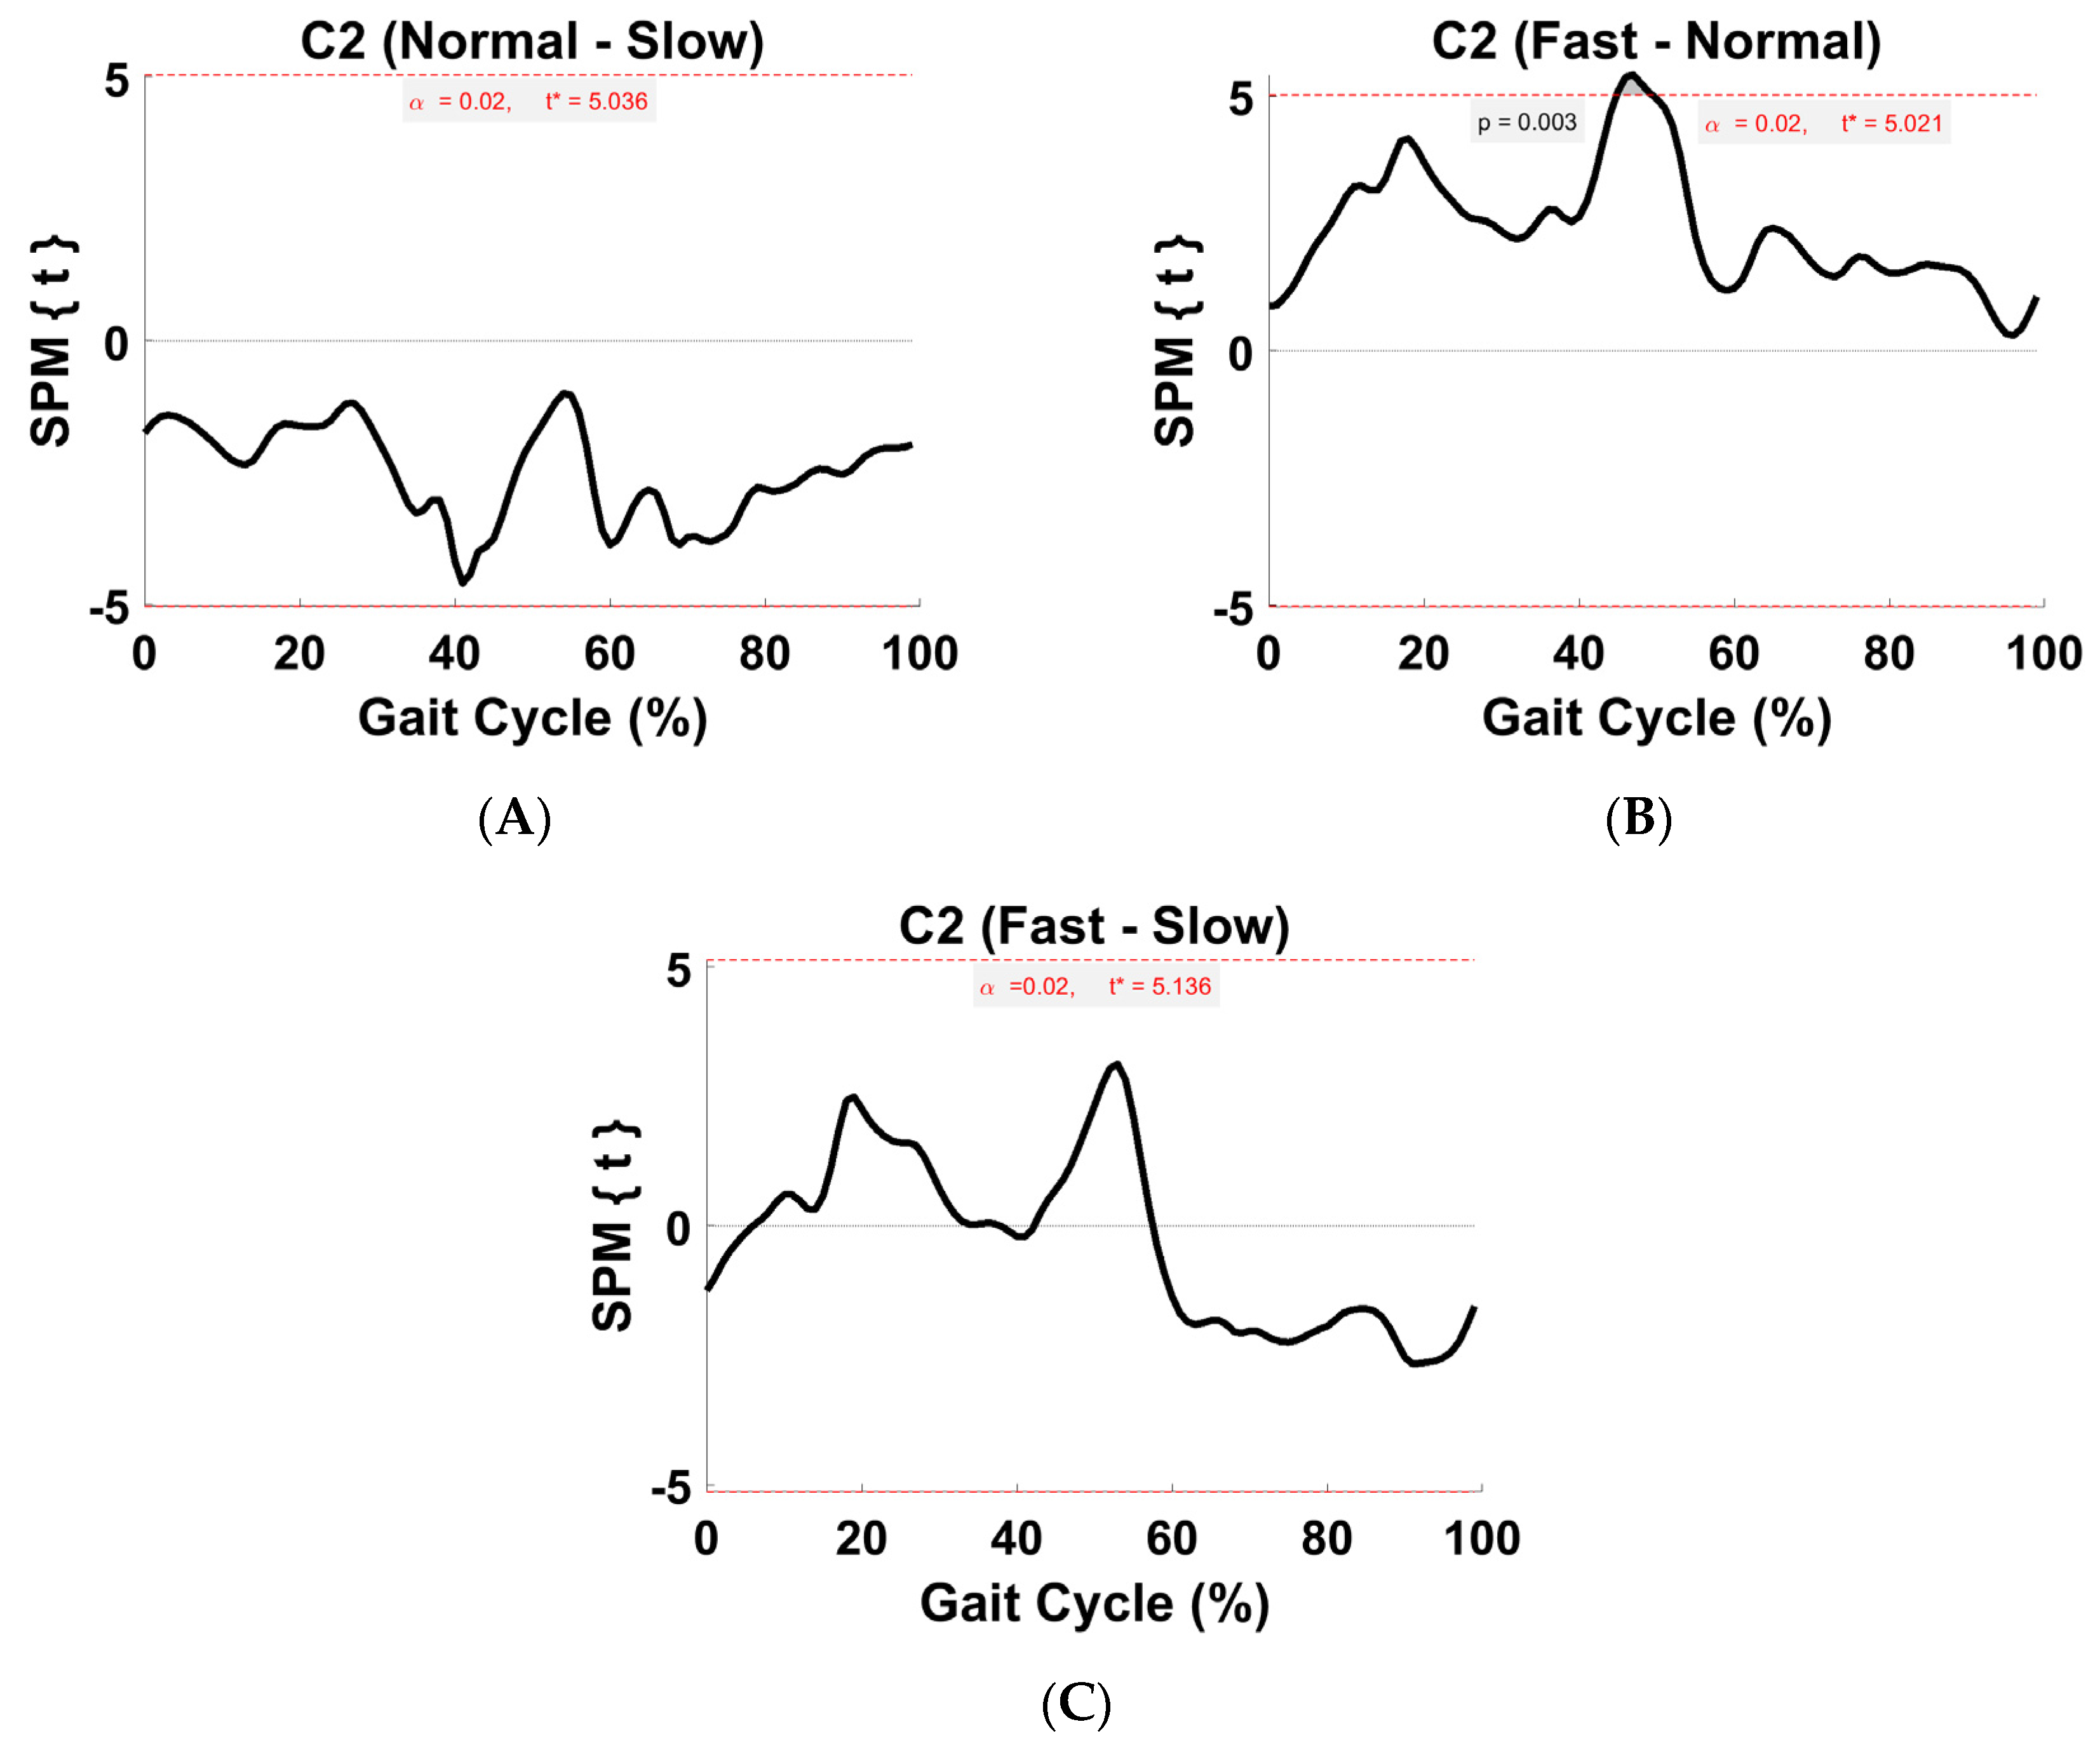
Figure 8.
TFA C2 within-subject post hoc paired t statistic between pairs of walking speeds. The red dashed lines indicate critical thresholds of t* = 5.04, 5.02, and 5.14 for (A–C), respectively. Suprathreshold clusters are shown in gray where p < 0.02.
Figure 8.
TFA C2 within-subject post hoc paired t statistic between pairs of walking speeds. The red dashed lines indicate critical thresholds of t* = 5.04, 5.02, and 5.14 for (A–C), respectively. Suprathreshold clusters are shown in gray where p < 0.02.
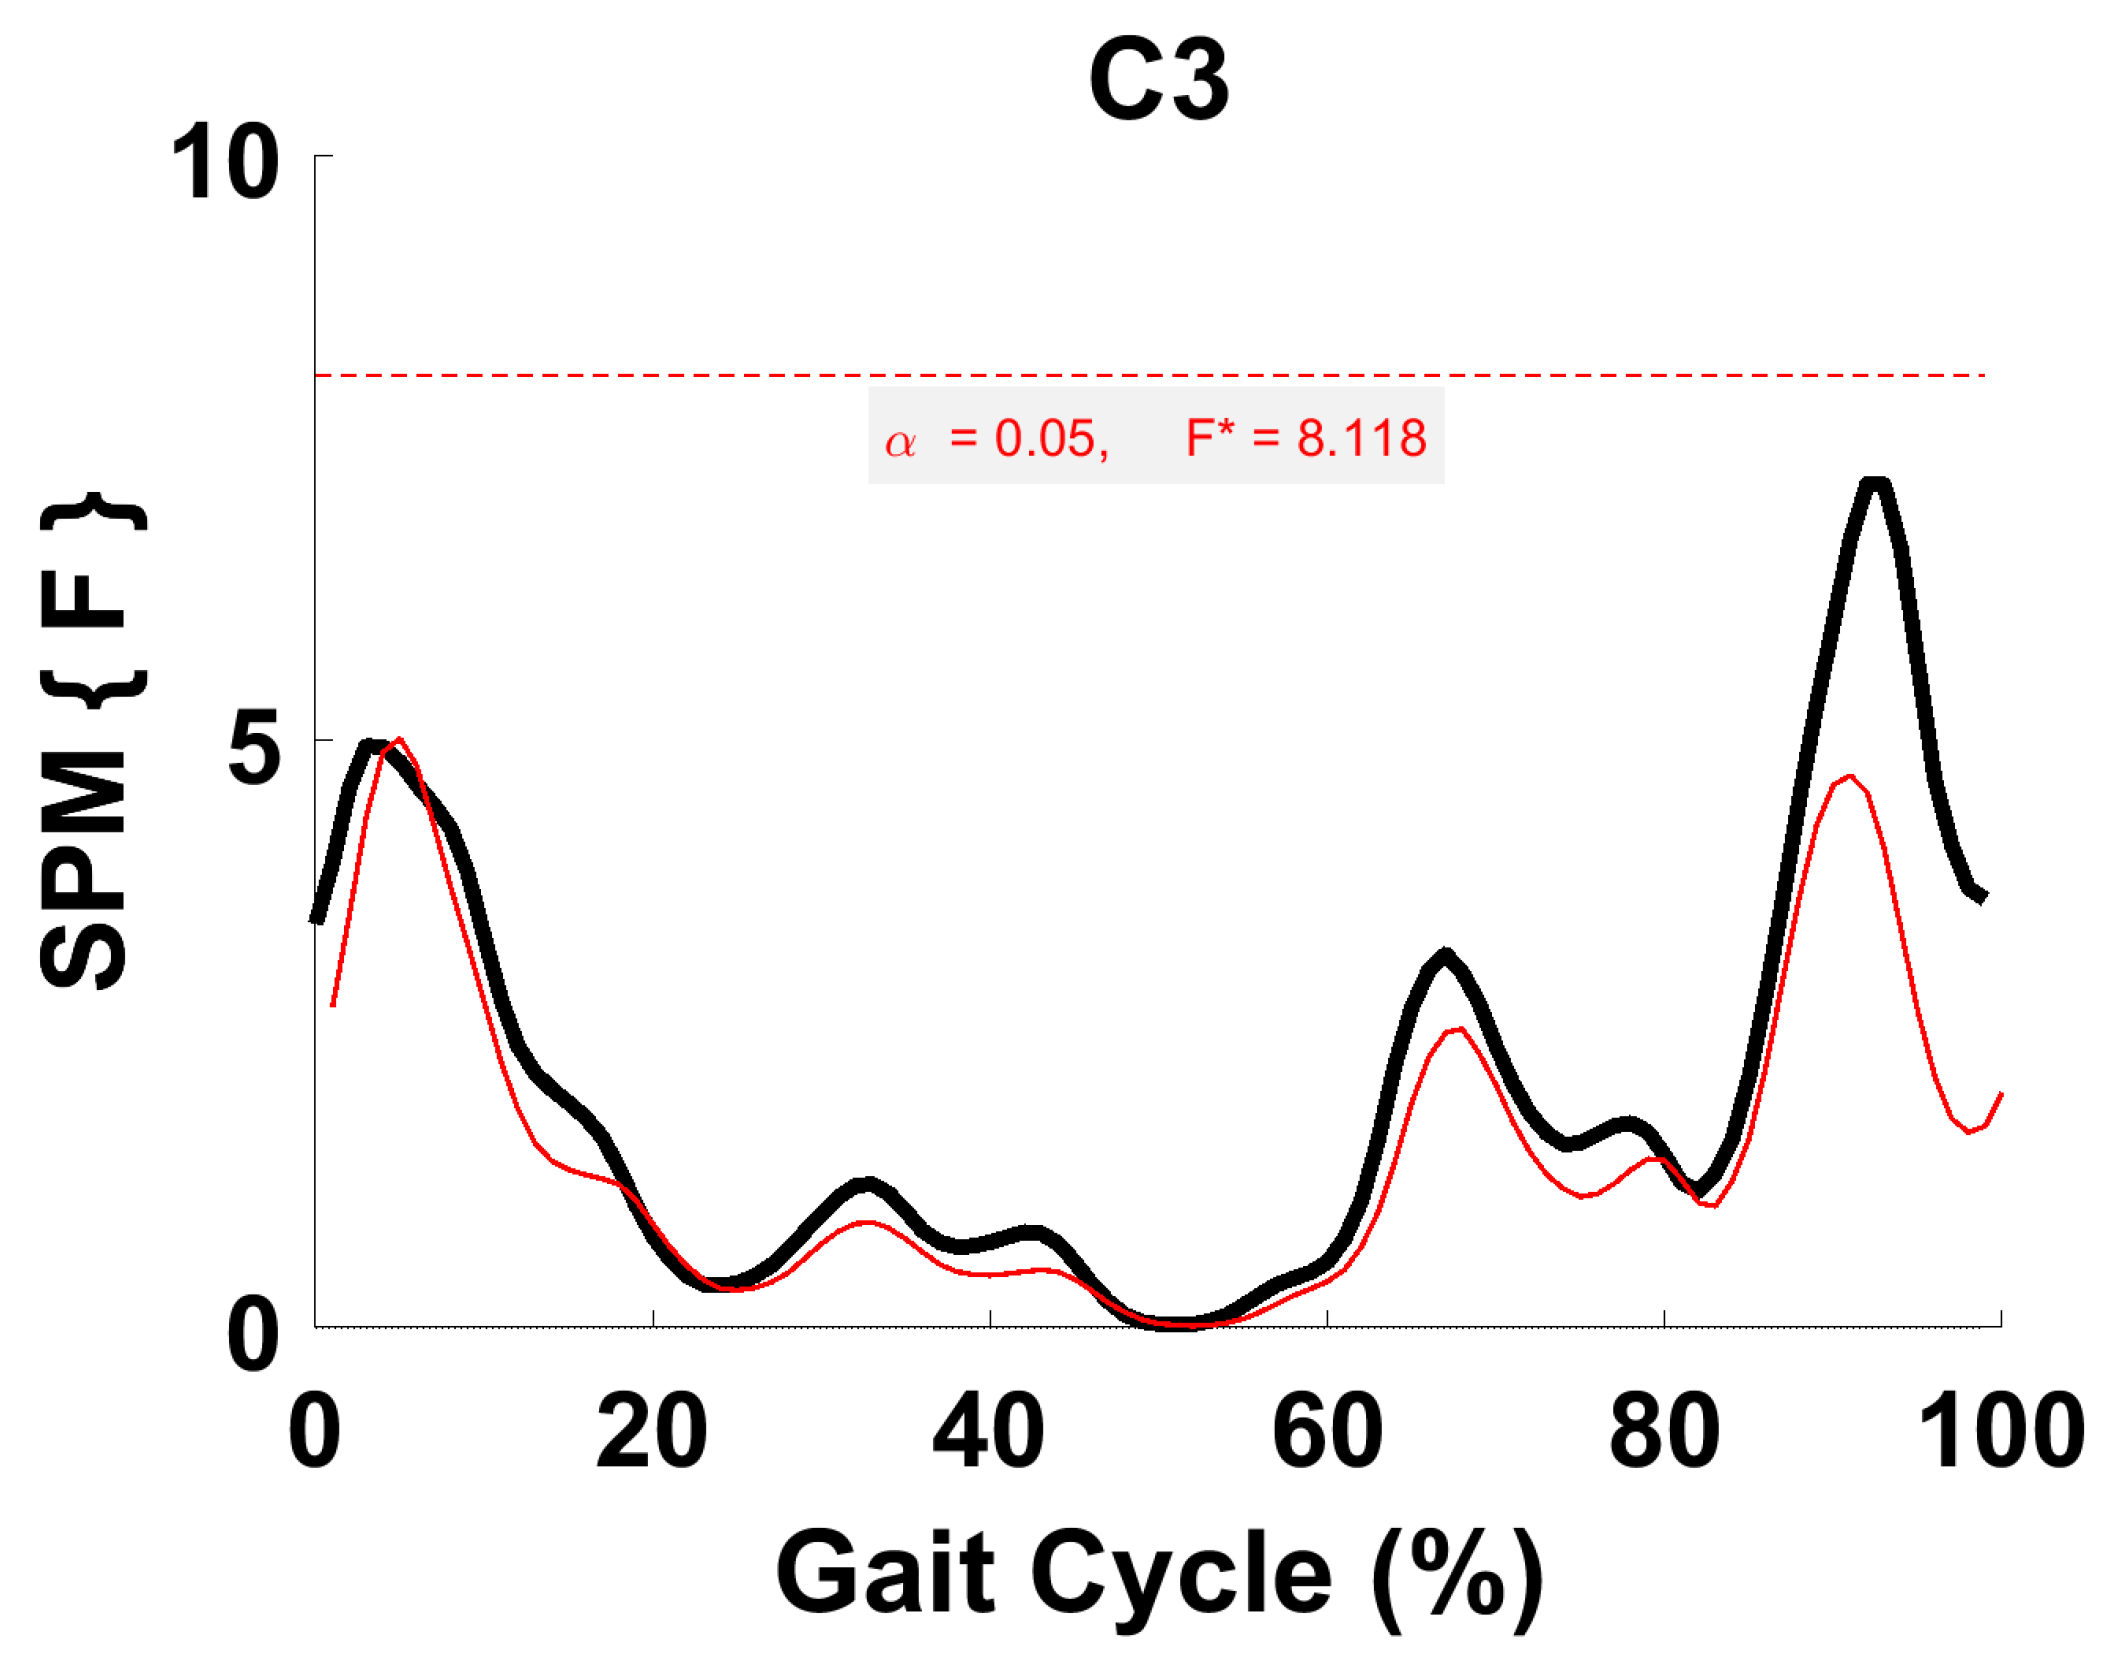
Figure 9.
TFA C3 parametric RM ANOVA within- and between-subjects, depicting significant differences between speeds. The horizontal red dotted line indicates the critical threshold of 8.12. Suprathreshold clusters are shown in gray where p < 0.05. Black line is RM ANOVA (Within) and red line is ANOVA (Between).
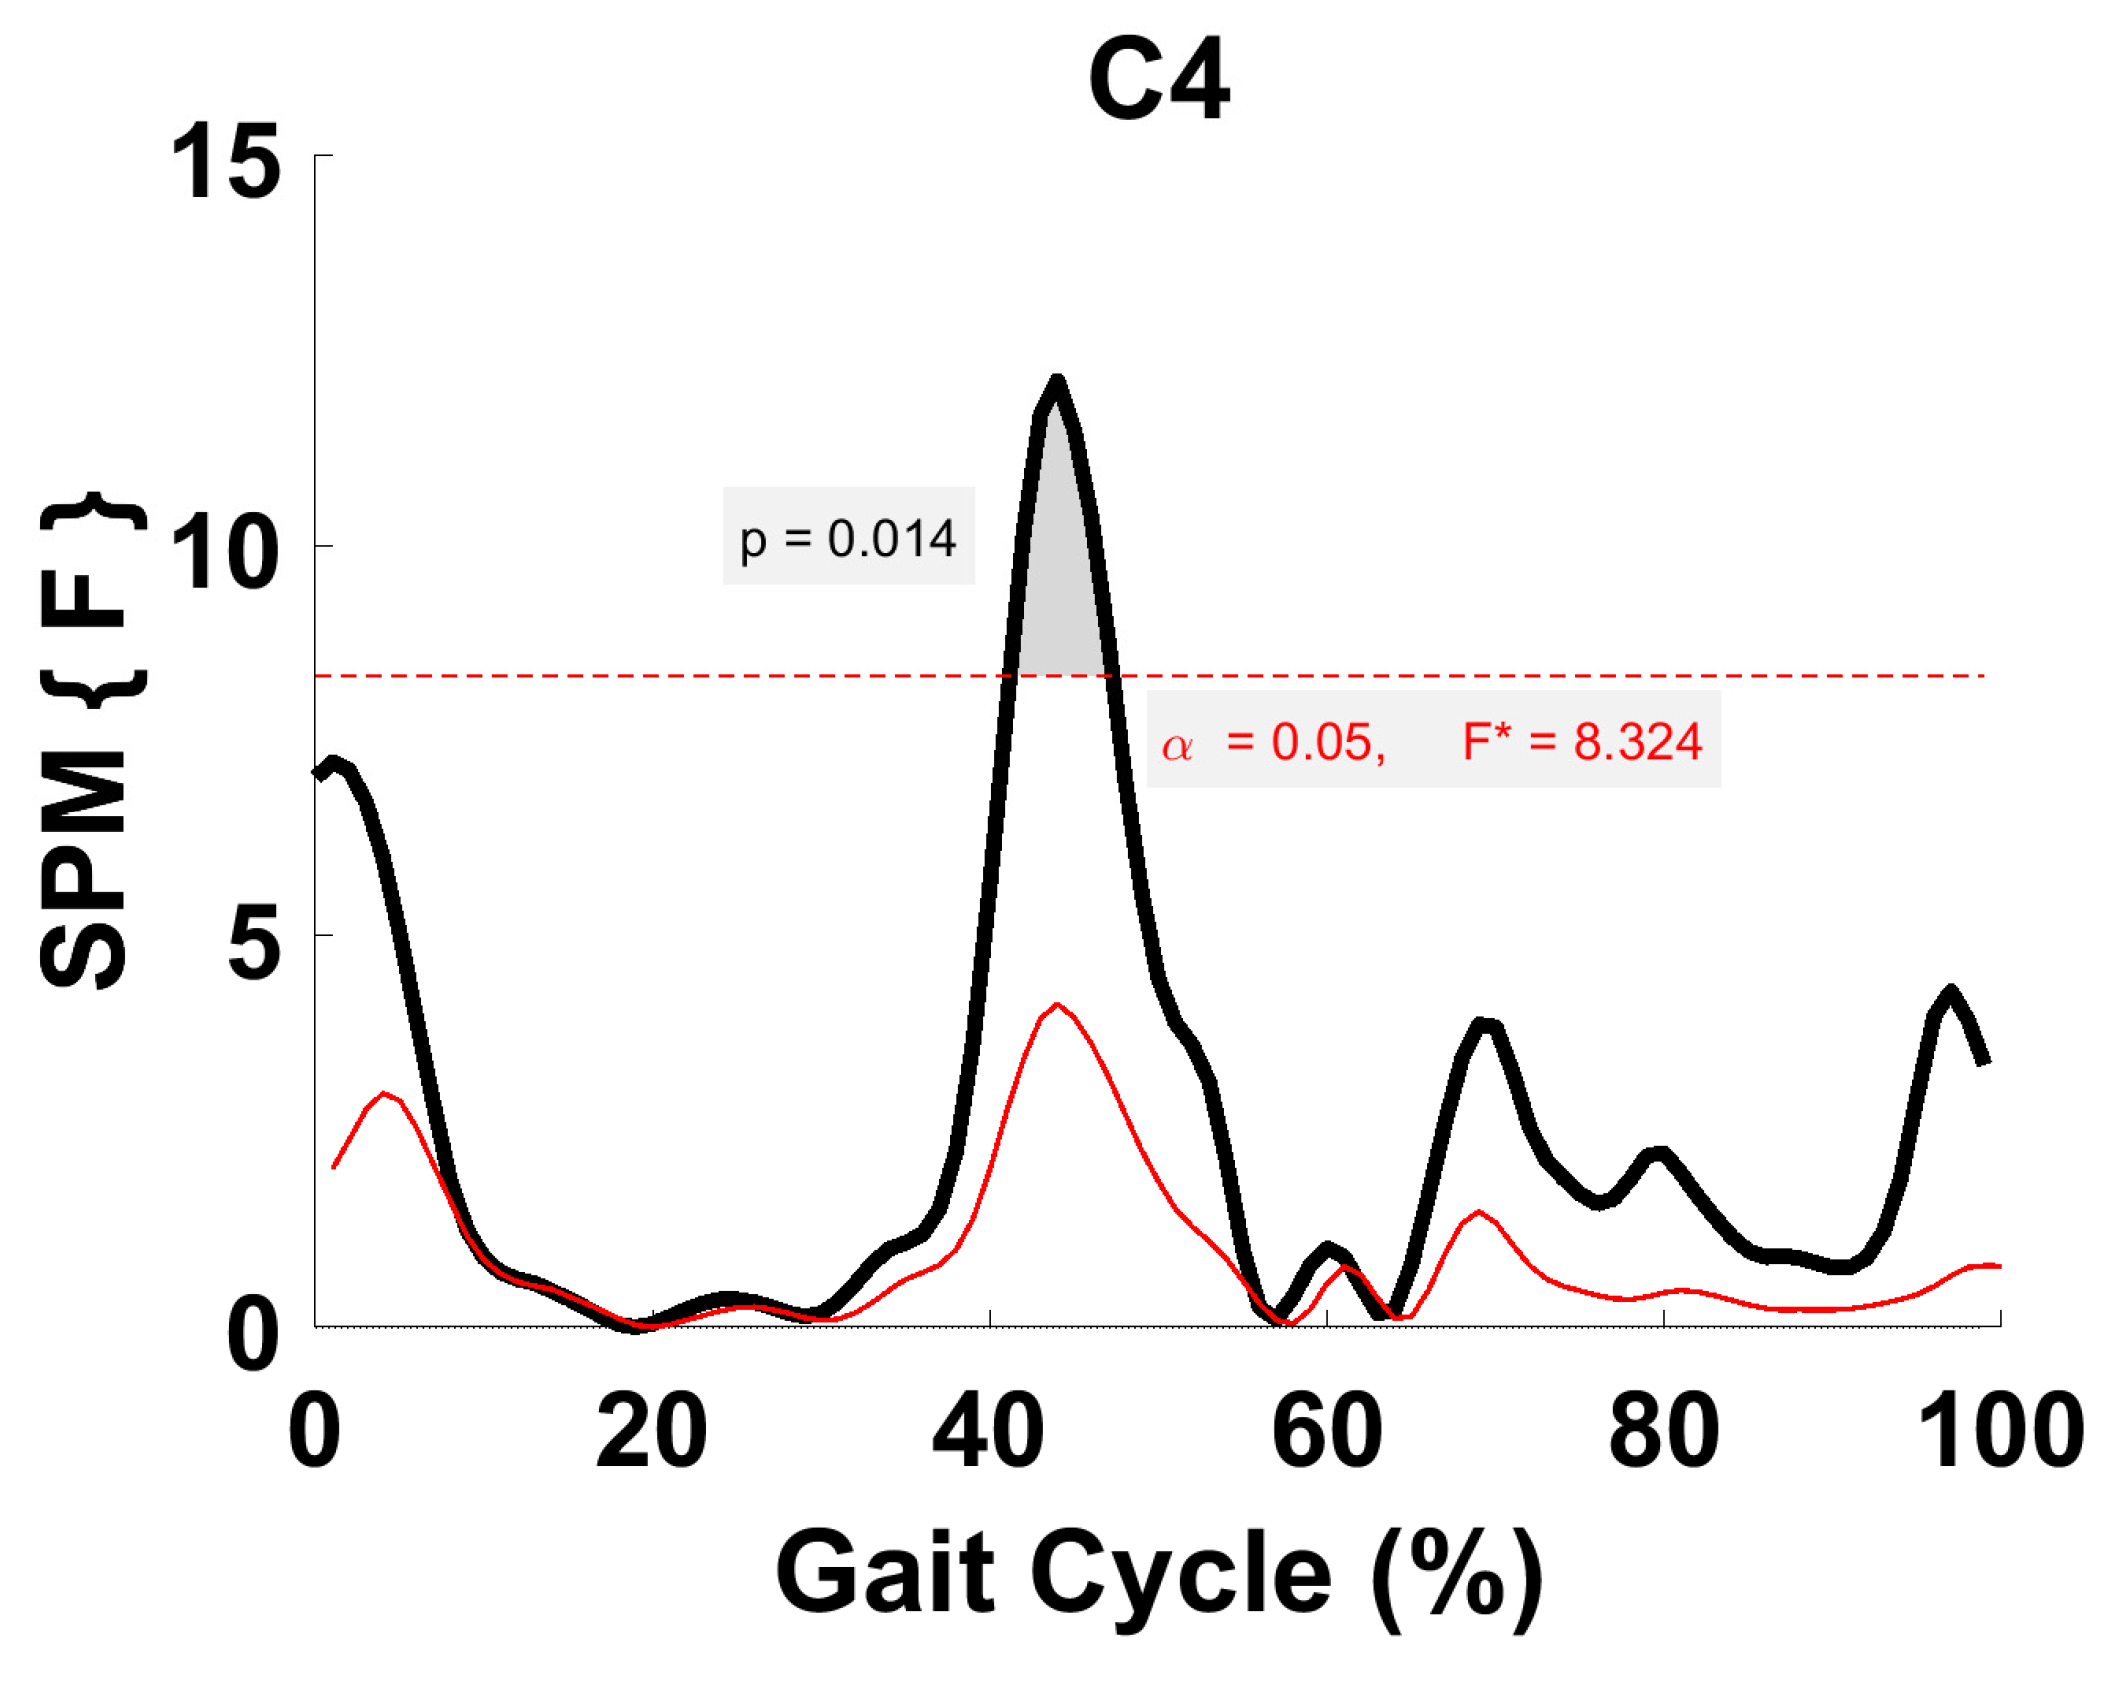
Figure 10.
TFA C4 parametric RM ANOVA within- and between-subjects, depicting significant differences between speeds. The horizontal red dotted line indicates the critical threshold of 8.32. Suprathreshold clusters are shown in gray where p < 0.05. Black line is RM ANOVA (Within) and red line is ANOVA (Between).
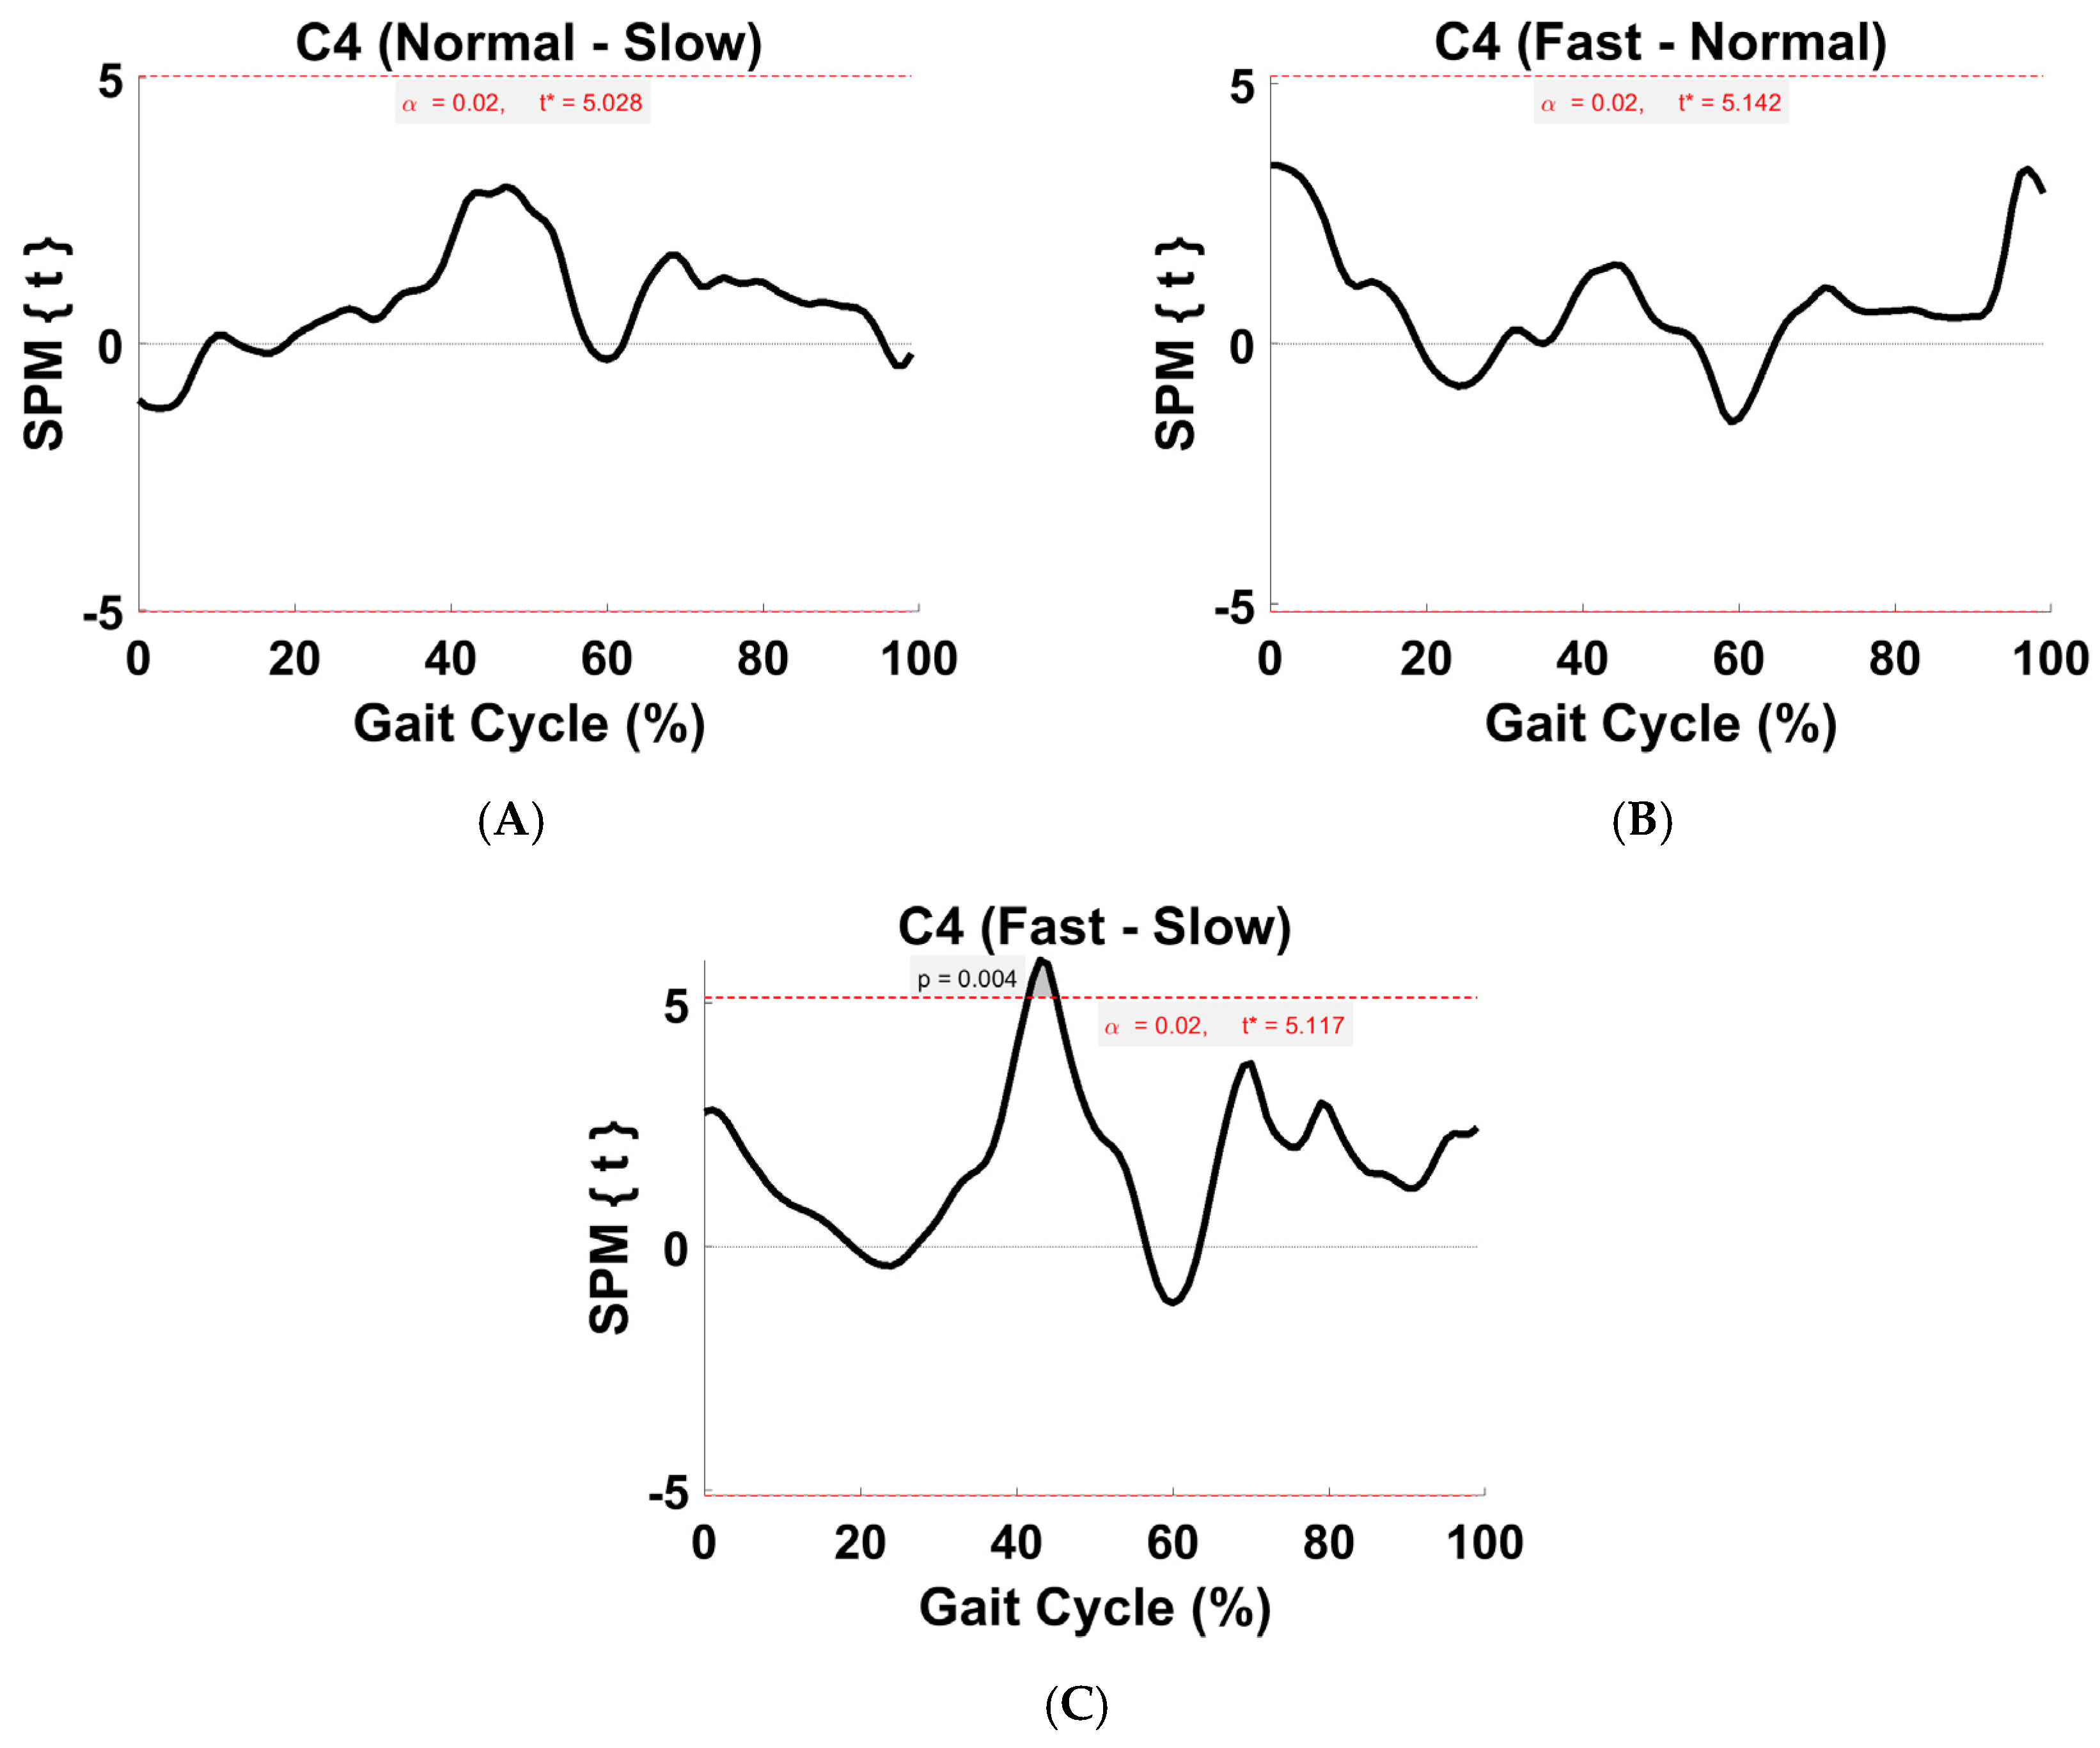
Figure 11.
TFA C4 within-subject post hoc paired t statistic between pairs of walking speeds. The red dashed lines indicate critical thresholds of t* = 5.03, 5.14, and 5.12 for (A–C), respectively. Suprathreshold clusters are shown in gray where p < 0.02.
Figure 11.
TFA C4 within-subject post hoc paired t statistic between pairs of walking speeds. The red dashed lines indicate critical thresholds of t* = 5.03, 5.14, and 5.12 for (A–C), respectively. Suprathreshold clusters are shown in gray where p < 0.02.
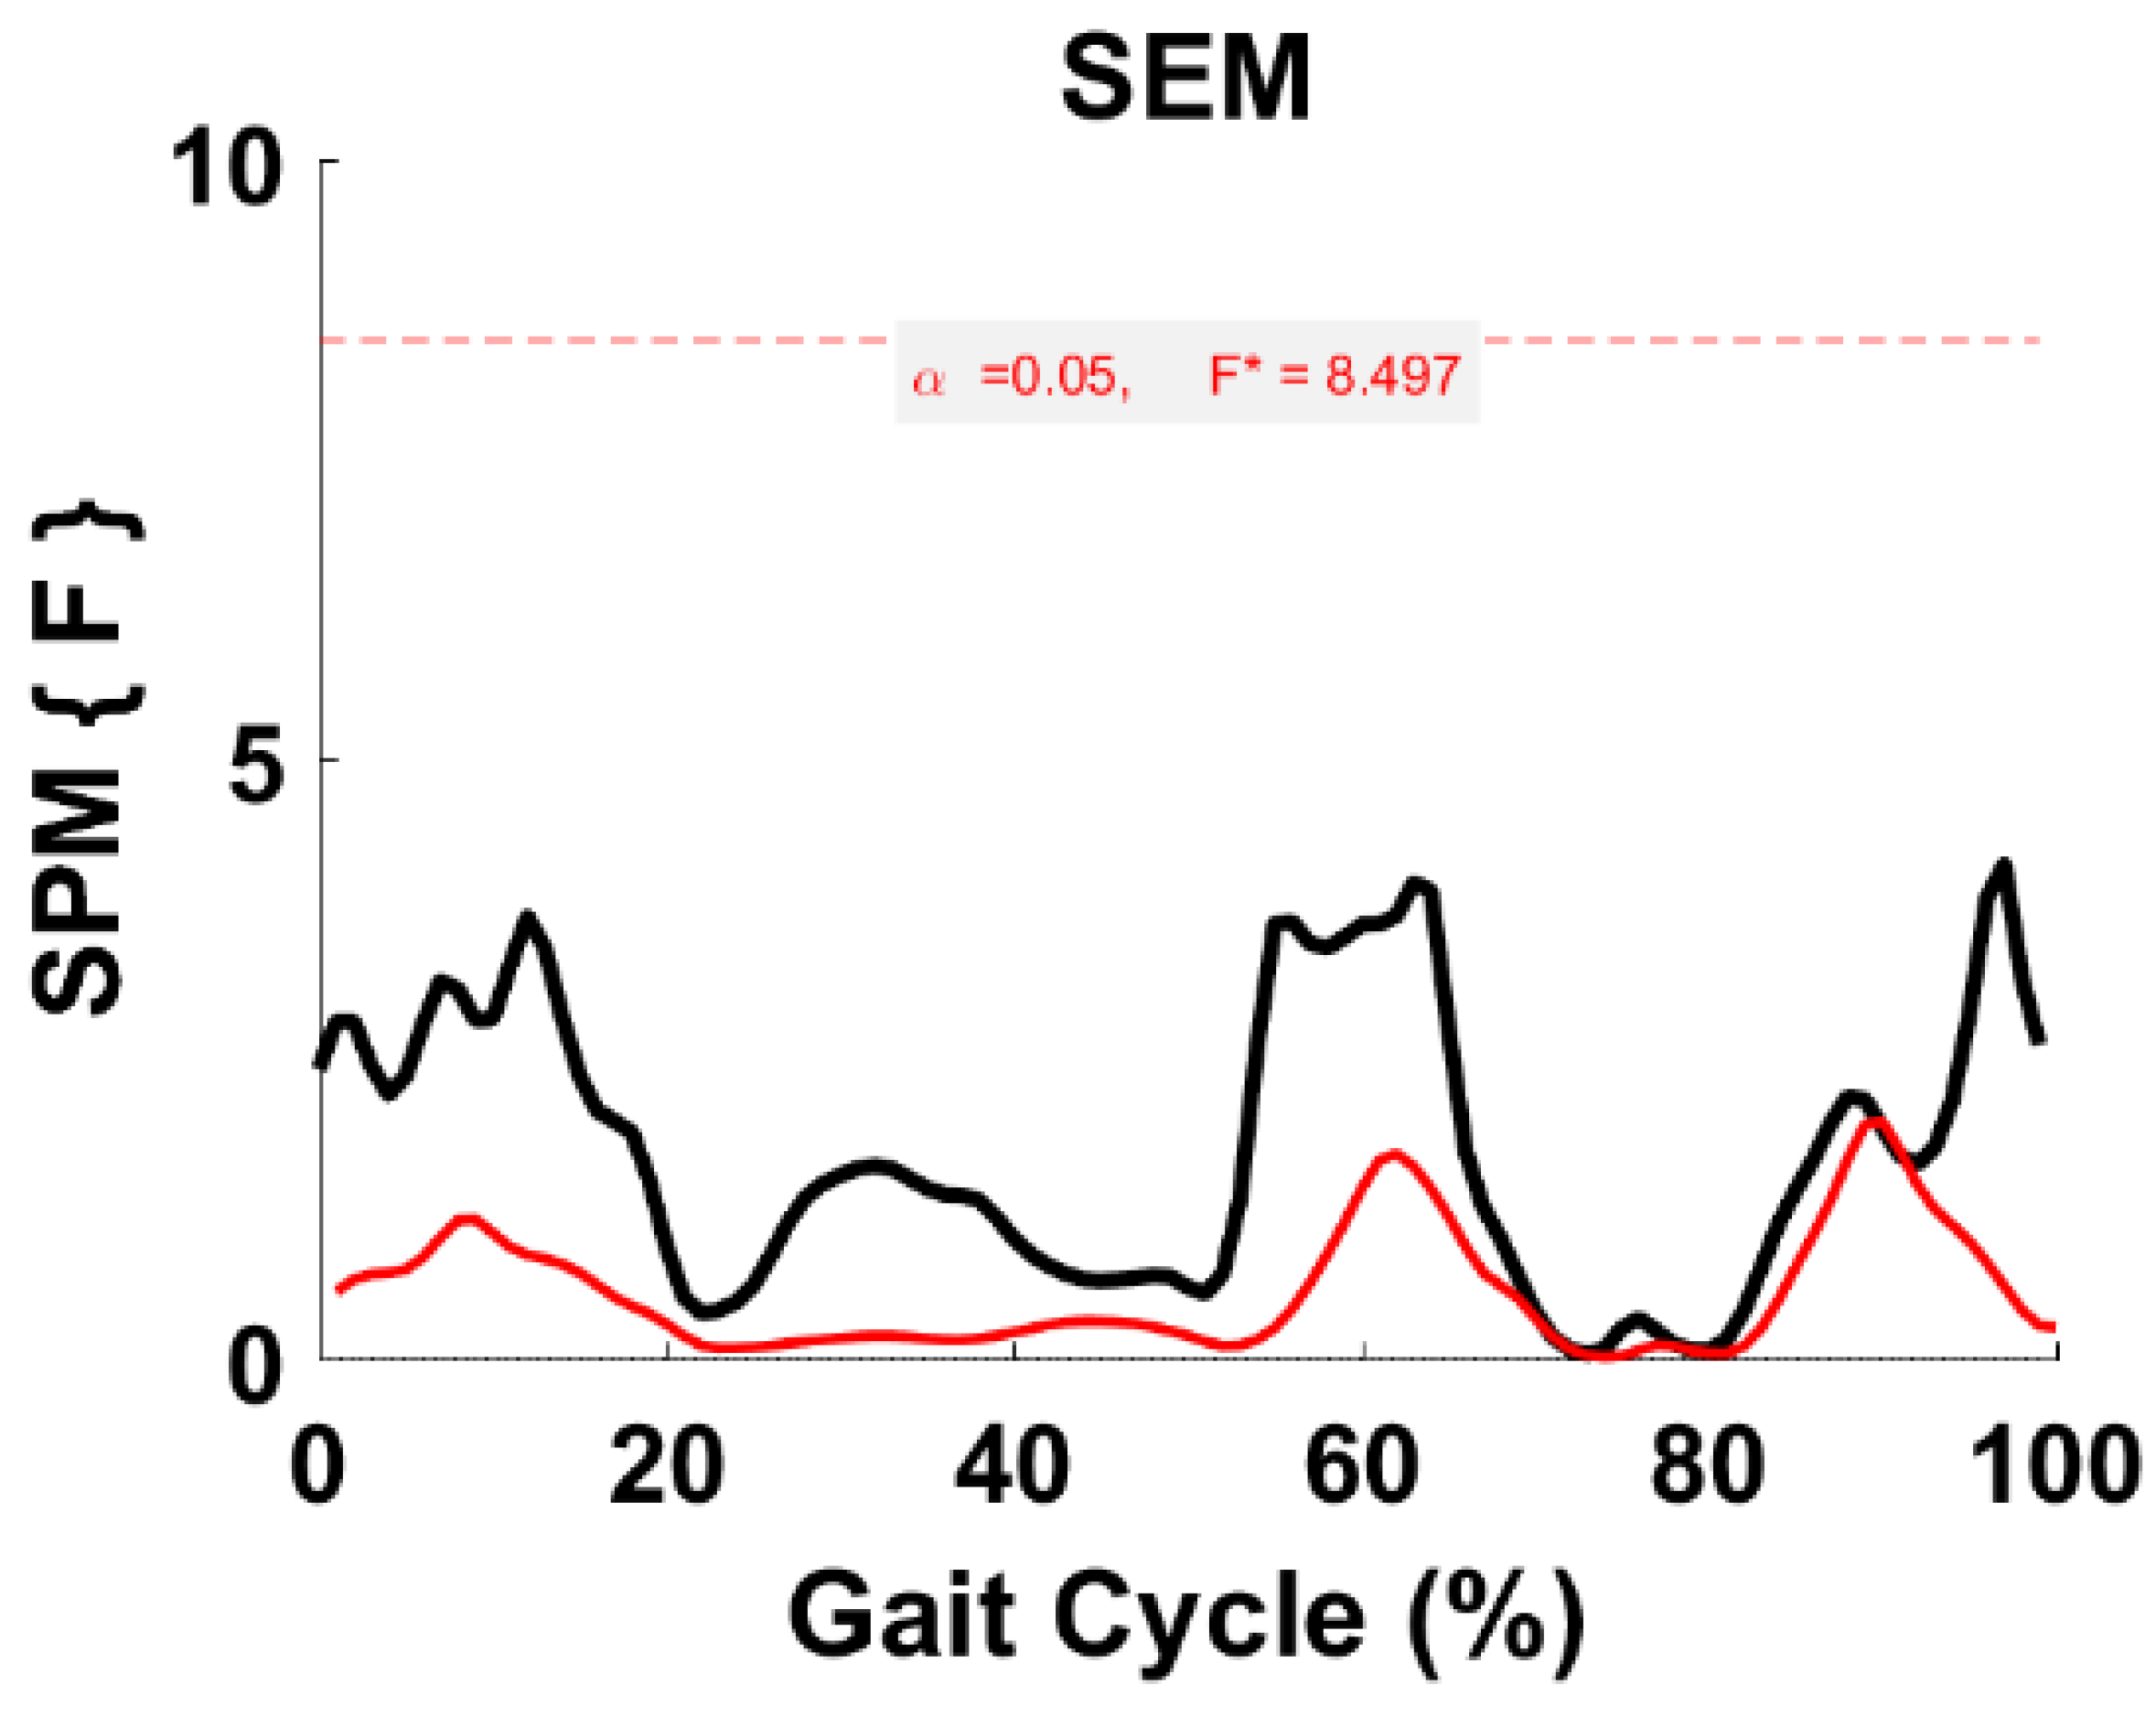
Figure 12.
TFA SEM parametric RM ANOVA within- and between-subjects, depicting significant differences between speeds. The horizontal red dotted line indicates the critical threshold of 8.497. Suprathreshold clusters are shown in gray where p < 0.05. Black line is RM ANOVA (Within) and red line is ANOVA (Between).
Table 1.
TFA activation coefficient profiles (C1–C4) repeatability between trials/subjects using ICC.
Table 1.
TFA activation coefficient profiles (C1–C4) repeatability between trials/subjects using ICC.
| TFA Intra-Class Correlation Coefficient |
|---|
| | C1 | C2 | C3 | C4 |
|---|
| Slow | 0.89 | 0.80 | 0.97 | 0.87 |
| Normal | 0.98 | 0.94 | 0.90 | 0.29 |
| Fast | 0.98 | 0.97 | 0.94 | 0.85 |
Table 2.
TFA muscle weighting contribution and corresponding activation timing profile of S1 across speeds. Abbreviations: Rectus femoris (RF) and vasti (vastus medialis (VM) and vastus lateralis (VL)), biceps femoris long head (BFLH), semitendinosus (SEM), tensor fascia latae (TFL), tibialis anterior (TA), and triceps surae (gastrocnemius medialis (GM), gastrocnemius lateralis (GL), and soleus (SOL)). Initial contact (IC), loading response (LR), early stance (ES, i.e., (IC-LR)), midstance (MS), terminal stance (TS), initial swing (ISW), midswing (MSW), and terminal swing (TSW).
| TFA Synergy 1 (All Speeds) |
|---|
| Module | Muscle | Activation |
|---|
| | Primary (>0.5) * | Secondary (<0.5) * | |
| Fast | VM, RF, VL | TFL, BFLH, SOL, GM | ES, TSW |
| Normal | SOL, TFL | GM, BFLH, VM, RF, VL | ES-MS, TS, TSW |
| Slow | TFL | TA, VL, SOL, RF, GM, SEM | IC-LR, MS |
Table 3.
TFA muscle weighting contribution and corresponding activation timing profile of S2 across speeds (Refer to
Table 2 for abbreviations).
Table 3.
TFA muscle weighting contribution and corresponding activation timing profile of S2 across speeds (Refer to
Table 2 for abbreviations).
| TFA Synergy 2 (All Speeds) |
|---|
| Module | Muscle | Activation |
|---|
| | Primary (>0.5) | Secondary (<0.5) | |
| Fast | SOL, GM, GL | BFLH, RF, TFL | MS, TS |
| Normal | GL, SOL | GM, SEM, BFLH, VL, RF | MS, TS |
| Slow | SOL | GM, GL, BFLH, RF, VM, SEM | MS, TS |
Table 4.
TFA muscle weighting contribution and corresponding activation timing profile of S3 across speeds (Refer to
Table 2 for abbreviations).
Table 4.
TFA muscle weighting contribution and corresponding activation timing profile of S3 across speeds (Refer to
Table 2 for abbreviations).
| TFA Synergy 3 (All Speeds) |
|---|
| Module | Muscle | Activation |
|---|
| | Primary (>0.5) | Secondary (<0.5) | |
| Fast | SEM, VL | BFLH, GL, TA, RF, GM, TFL | ES, MSW-TSW |
| Normal | VL | RF, SEM, VM, TA, GL, BFLH, TFL | IC-LR, TSW |
| Slow | VM, RF, VL | BFLH, GL, TFL, TA, GM, SOL, SEM | IC-LR, TSW |
Table 5.
TFA muscle weighting contribution and corresponding activation timing profile of S4 across speeds (Refer to
Table 2 for abbreviations).
Table 5.
TFA muscle weighting contribution and corresponding activation timing profile of S4 across speeds (Refer to
Table 2 for abbreviations).
| TFA Synergy 4 (All Speeds) |
|---|
| Module | Muscle | Activation |
|---|
| | Primary (>0.5) | Secondary (<0.5) | |
| Fast | TA | TFL, VM, SOL, SEM | IC-LR, TS, ISW, TSW |
| Normal | TA | GM, SOL, SEM, VL, TFL | IC-LR, TS-PSW-ISW, TSW |
| Slow | TA, SEM | GL, VL, GM, BFLH | IC-LR, PSW-ISW, TSW |
Table 6.
R2 values for four muscle synergies (S1–S4) in TFA at different speeds; the module average obtained column-wise represents the average correlation of each module with respect to all paired-wise speed comparisons. The overall average value obtained row-wise represents the average correlation of all muscle synergies with respect to each pair-wise speed comparison.
| | S1 | S2 | S3 | S4 |
Overall Average
|
|---|
| Normal vs. Slow | 0 | 0.78 | 0.72 | 0.61 | 0.53 |
| Normal vs. Fast | 0.13 | 0.83 | 0.66 | 0.83 | 0.61 |
| Fast vs. Slow | 0 | 0.89 | 0.2 | 0.5 | 0.40 |
|
Module Average
| 0.04 | 0.83 | 0.53 | 0.65 | |

 ,
, 


