Article

Spatiotemporal Gait Variability in Children Aged 2 to 10 Decreases throughout Pre-Adolescence

by
Bryon C. Applequist
1,*,
Zachary L. Motz
2 and
Anastasia Kyvelidou
3
1
Department of Kinesiology, Texas A&M University-Corpus Christi, Corpus Christi, TX 78412, USA
2
Department of Biomechanics, University of Nebraska at Omaha, Omaha, NE 68182, USA
3
Department of Physical Therapy, Creighton University, Omaha, NE 68178, USA
*
Author to whom correspondence should be addressed.
Biomechanics 2023, 3(4), 571-582; https://doi.org/10.3390/biomechanics3040046
Submission received: 25 October 2023 / Revised: 30 November 2023 / Accepted: 1 December 2023 / Published: 3 December 2023
(This article belongs to the Special Issue Effect of Neuromuscular Deficit on Gait)

Abstract

:
Background: Children’s gait is traditionally understood to mature as young as three years old through pre-adolescence. Studies looking at gait biomechanics suggest that gait matures around three years old, while studies investigating gait variability propose a much later maturation. The studies that have examined children’s gait variability did so while the children walked around a track or down hallways that created a discontinuous gait, potentially affecting the measures of variability and the efficacy of the results. Purpose: Therefore, the purpose of our study was to investigate the development of gait dynamics and gait variability in children in a more continuous fashion, in this case, by walking on a treadmill. Methods: To accomplish this, we included four age groups of children, ranging 2–10 years old, walking on a treadmill for at least three minutes while stride time and stride length were collected. Stride time and stride length’s variability was then analyzed using linear (mean, standard deviation, coefficient of variation) and nonlinear (sample entropy, detrended fluctuation analysis) measures across the varying ages of our participants. Results: Interestingly, both the linear and nonlinear variabilities of the stride time and stride length measures decreased as the groups of children got older. Specifically, CV ST (2–3 (9.3 ± 4%), 8–10 (3.6 ± 0.7%), p < 0.05) and CV SL (2–3 (11.4 ± 3%), 8–10 (4.6 ± 1%), p < 0.05) were our strongest linear measures, and DFA α ST (2–3 (0.97 ± 0.12), 8–10 (0.82 ± 0.10), p < 0.05) and DFA α SL (2–3 (0.91 ± 0.04), 8–10 (0.81 ± 0.03), p < 0.05) were our strongest nonlinear measures, particularly between the youngest and oldest groups. This trend of variability decreasing with age suggests that as children’s gait matures, their gait becomes more stable and reliable. Significance: Our study rejects the notion that children’s gait is mature by the age of three, as some would suggest. By analyzing the variability of stride time and stride length, we can see that even later into childhood, children’s gait continues to change and evolve.

1. Introduction

Historically, the maturation of children’s gait has been stated to occur around three years of age [1]. However, the stride time dynamics and variability of children’s gait are not thought to mature and become more adult-like until at least seven years of age and potentially even older [2]. While the skeletal system and neuromuscular system grow and mature, children’s physical behavior, including their gait and inherent gait variability, is emergent and self-organizing. Characterizing children’s gait and gait variability is essential to understanding the typical trajectory of development to better understand neurological issues and gait pathology in children.
When comparing children’s gait to that of adults, observationally, it is easy to see that children walk differently. However, when studying parameters such as gait speed, children and adults walk similarly. As expected, children and adults come to the same gait speed solution through very different means. Children take shorter, smaller strides at a higher cadence than adults to achieve a similar speed [3]. The spatiotemporal aspects of children’s gait are generally smaller in magnitude for children compared to adults [4]. This includes step and stride times as well as step and stride lengths. When these measures are normalized to leg length or height, however, the discrepancies wane. This indicates that most of the time–distance parameters are highly influenced by and related to musculoskeletal dissimilarities, including height, leg length, and mass [5].
Differences between children and adult gait biomechanics present themselves in the lower extremity kinematics and kinetics of walking as well [6]. This is especially the case in the ankle and knee joints, but is not as prevalent at the hip joint. Specifically, at the ankle, initial contact with the ground occurs with the forefoot, and the heel strike is absent in early walkers and does not begin to emerge until around the age of two [7]. This could point to how important the foot–ground interface is for this age group. At the knee joint, the typical knee flexion–extension time series has the first peak during loading and a second peak that occurs before toe-off and prepares the body for propulsion and forward advancement. Early on, during the development of walking in children, the first peak in knee flexion–extension is very faint and not fully present until around the age of four [7]. The second peak in knee flexion–extension remains fairly consistent throughout development until age 7 [7]. Thus, the age of maturation of the joint kinematics of children’s gait is considered to occur around 4 years of age [7].
The fluctuations in the stride-to-stride dynamics during gait, or gait variability, are important and can be used to assess the overall health of the system and how gait changes throughout development. Hausdorff et al. examined the stride dynamics of children of different age groups, compared to adults, while walking around a track and examined the timings of their forefoot and heel ground contacts [2]. Interestingly, children’s gait variability decreased with age, meaning younger children had greater gait variability compared to older children, who exhibited less variability. Manicolo et al. examined the age dependence of gait variability in children with and without attention-deficit/hyperactivity disorder, and their findings identified a steady state of both stride time coefficient of variation (CV) and stride length CV in their healthy control subjects [8]. However, the mean age in the study was over ten years old and their subjects merely walked on a 7 m walkway. Adults have even less gait variability compared to older children [2]. The inverse relationship between gait variability and age points to an attainment of better neuromuscular and motor control as children age.
This is even more evident when examining gait variability through detrended fluctuation analysis (DFA α). DFA α can be used to measure how correlation properties change over different time scales or observation windows. A DFA α close to 0.5 indicates a more random and less correlated walking pattern compared to a DFA α of 1.5, which indicates a dominantly low frequency with slowly changing trends. In Hausdorff et al.’s study, younger children had an increased DFA α that decreased with age and was even lower in adults. Their results indicate that younger children have more correlated gait patterns and may have stronger attractor properties within their gait patterns, which would indicate that they are less capable of adapting to external perturbations. Children’s dynamic balance control improves with age, thus pointing to an improvement in their gait dynamics [9].
The evaluation of gait variability in children is still not without flaws. Children were required to walk around a track with curves while also being able to fluctuate speed as they pleased. The curves in the path as well as the fluctuations in gait speed throughout the trial could lead to increased variance when evaluating stride times. The spatial aspect of walking variability was not examined. A continuous bout of walking while evaluating both stride times and stride lengths could provide a more thorough examination of gait variability in children relative to adults. Therefore, the purpose of this study was to understand the development of gait dynamics and gait variability throughout childhood. To do this, we had children aged 2–10 years old walk on a treadmill. We then measured the variability of their stride-time and stride-length time series. We hypothesized that as children age, their gait becomes less variable and more regular, as was determined by Hausedorff et al. We designed this study to provide the children with a continuous walking environment on a treadmill while evaluating both the stride time and stride length dynamics of their gait.

2. Methods

2.1. Study Design

The current study employed a cross-sectional design to assess the differences in gait variability in pre-adolescent children.

2.2. Subjects

Twenty-eight boys and girls who were recruited from the local community participated in this study. Parents of children aged 2–10 years old were asked if they would be willing to have their children participate in this study. If the child and parent were willing to participate, parental informed consent and child assent were obtained as approved by the university’s Institutional Review Board. Children were excluded from our study if they had any neurological disorders or musculoskeletal injuries that may affect gait, such as autism, cerebral palsy, or lower leg injuries. Children were classified into four age groups: 2–3-year-olds (n = 7; 3 females, 4 males), 4–5-year-olds (n = 7; 4 females, 3 males), 6–7-year-olds (n = 7; 4 females, 3 males), and 8–10-year-olds (n = 7; 4 females, 3 males). Power analysis was conducted to determine that groups of 4 subjects were necessary to achieve adequate power [8]. Anthropometrics can be found in Table 1.

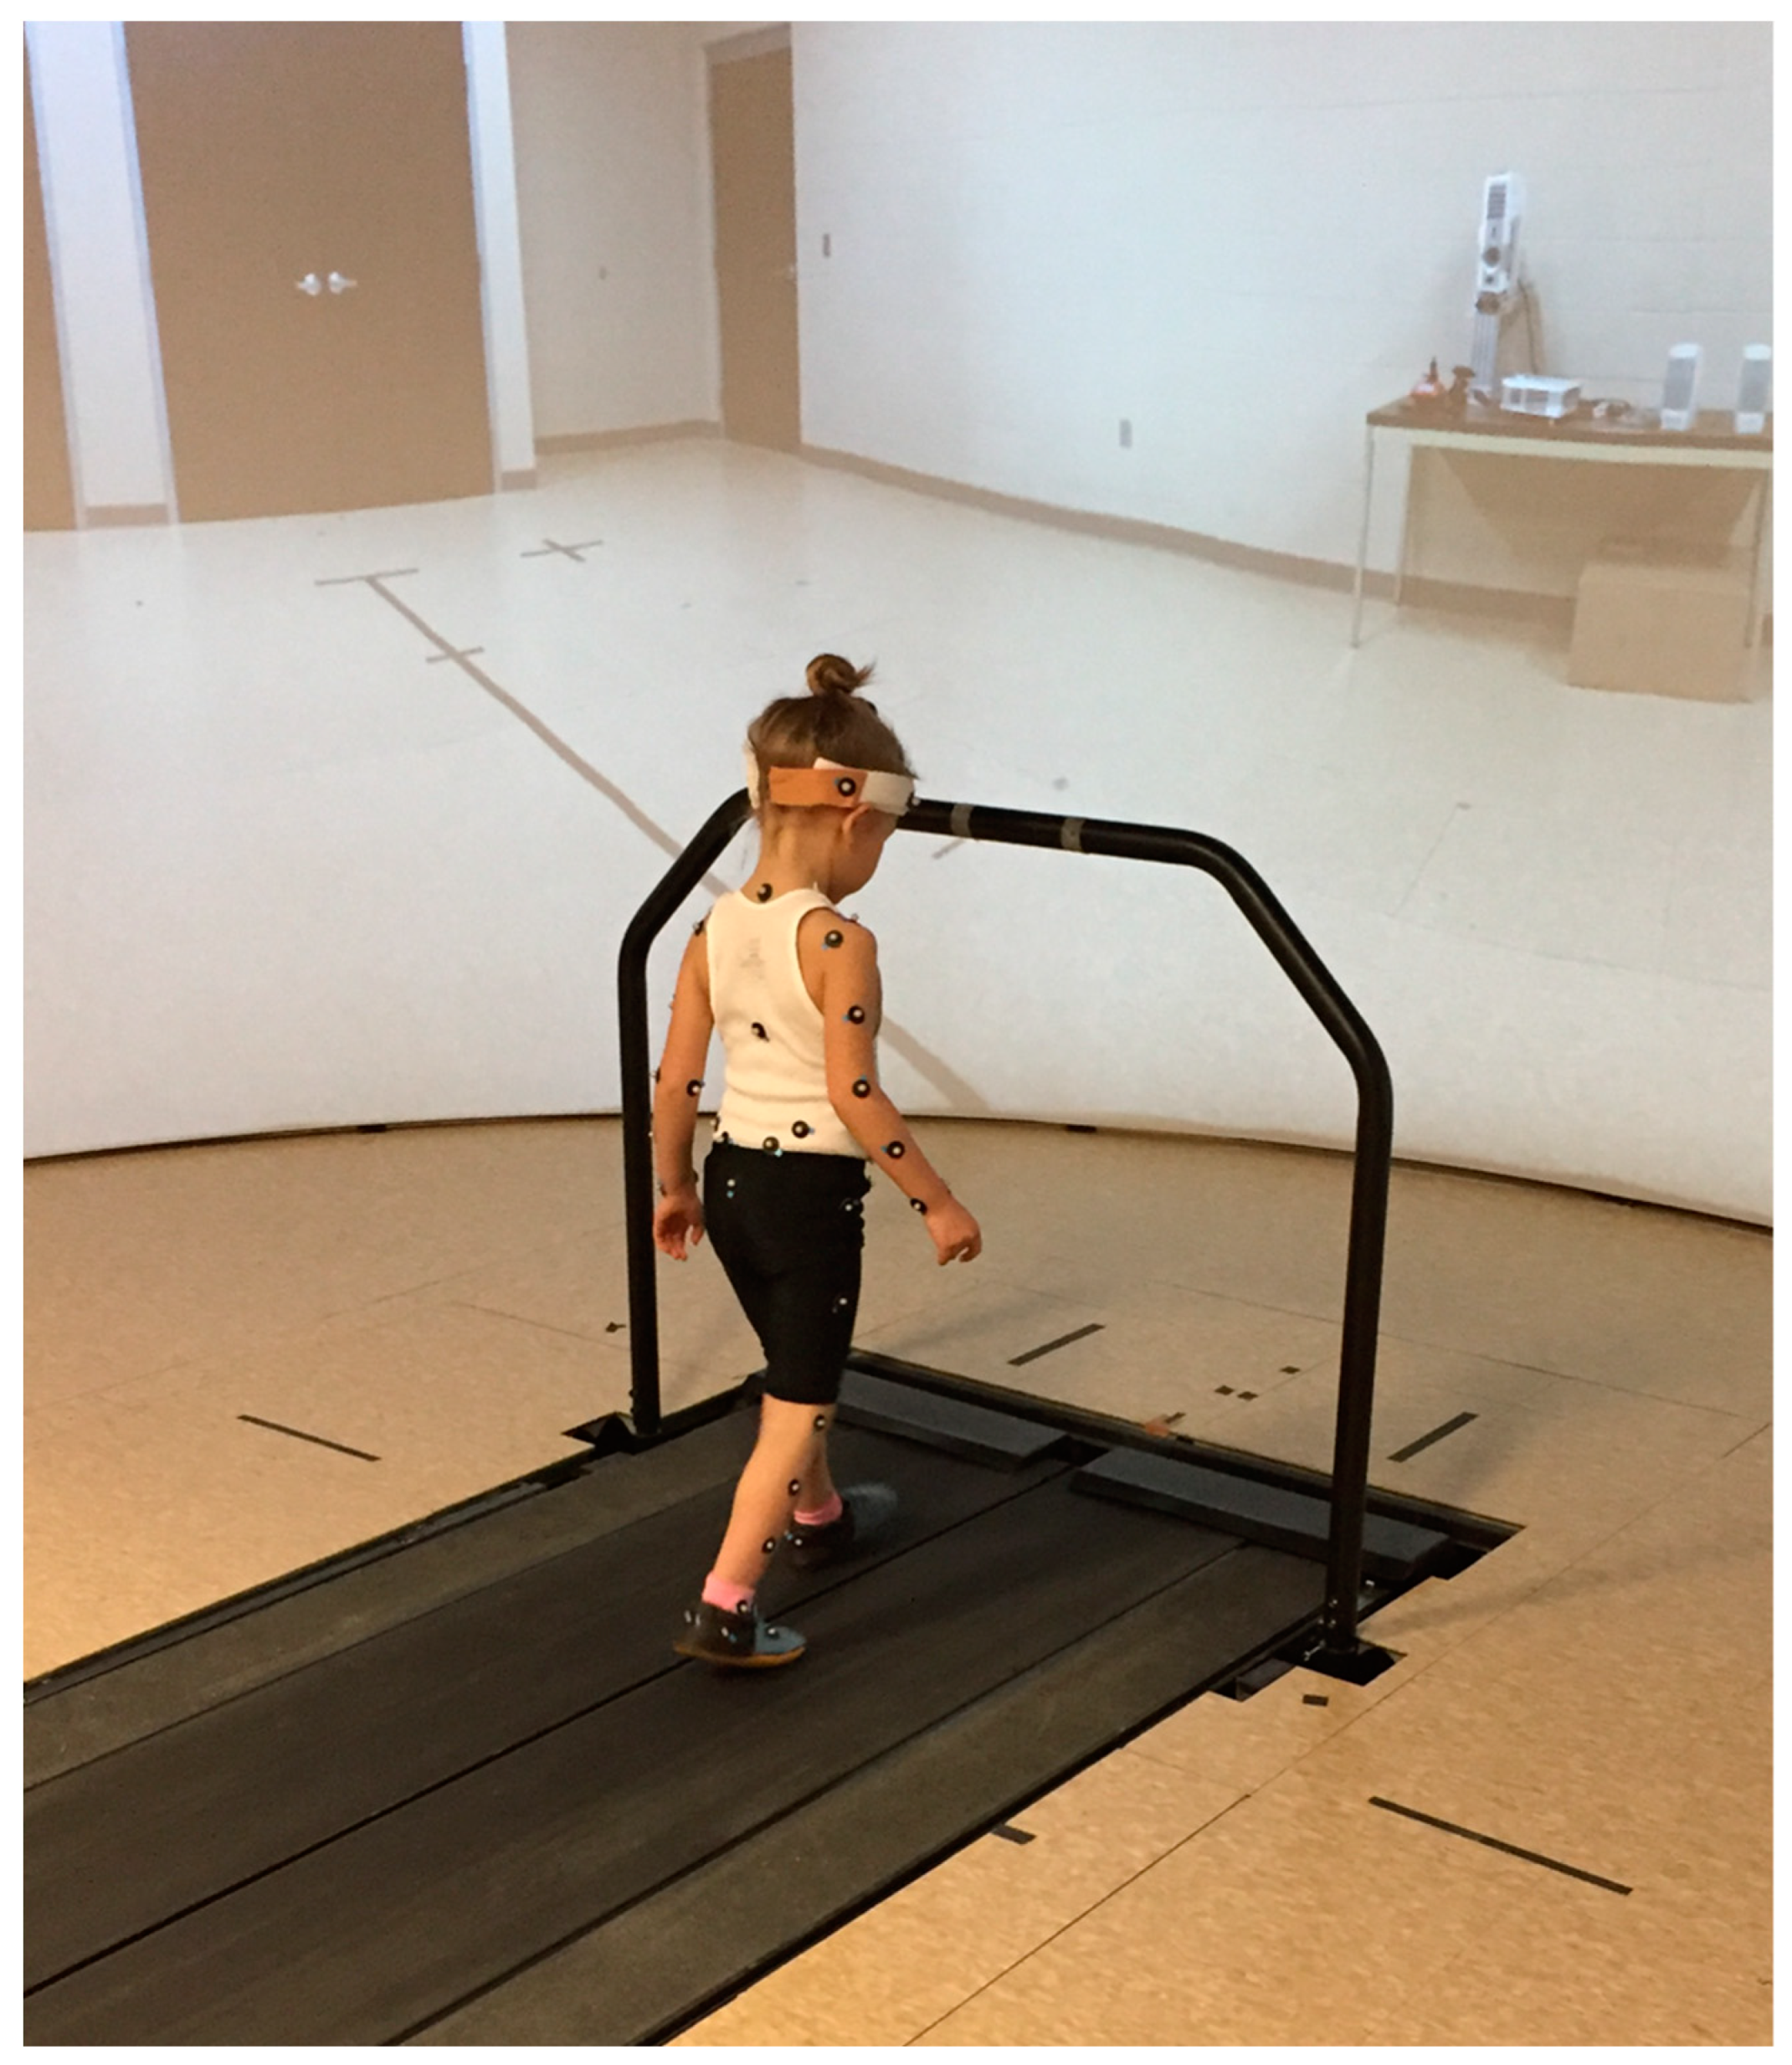
2.3. Experimental Procedures

After arriving at the laboratory, all subjects were outfitted with form-fitting athletic shorts. The tight-fitting shorts allowed for accurate marker placement on the lower extremity segments and pelvis. The subject’s shoe size was then determined, and they were provided with standard laboratory shoes (Nike Free 5.0, Nike Inc., Beaverton, OR, USA). Retro-reflective markers were then placed on the whole body of the subject, though only the specific anatomical locations of the foot, shank, thigh, and pelvis, according to the marker systems established by Nigg et al. [10] and Vaughan et al. [11], were used for analysis of lower extremity gait. Subjects wore skin-tight clothing, and only the PI palpated and placed markers on the subjects to ensure accurate and reliable placement of the markers, minimizing the risk of unreliable motion capture data [12]. Markers were placed on the right and left anterior superior iliac spine, the right and left posterior superior iliac spine, the sacrum, and bilaterally on the greater trochanter, lateral thigh (midway between the greater trochanter and knee joint marker), anterior thigh (1 inch above the patella), lateral knee (joint space between the femur and the tibia on lateral side), medial knee (joint space between the femur and tibia on medial side), tibial tuberosity, lateral shank (midway between the lateral knee and the lateral malleolus), lateral malleolus, medial malleolus, heel (posterior-most calcaneus at a vertical height equal to the toe marker), toe (on the metatarsal–phalangeal joint of the 2nd toe, 5th metatarsal–phalangeal joint (on the lateral side), 1st metatarsal–phalangeal joint (on the medial side)), and lateral calcaneus. Participants were acclimated to the treadmill (Bertec Corp, Columbus, OH, USA) while a self-selected comfortable walking speed was determined. Heel and toe marker locations were acquired for one three-minute walking trial at 100Hz using an 8-camera motion capture system (Vicon Motion Systems, Oxford, UK) (Figure 1). Participants performed walking trials of 2 m in front of a screen in a virtual reality environment. However, to simulate walking on a stationary treadmill with static optic-flow stimulation, a picture of the static room surroundings was projected on the virtual reality screens. Subjects were asked to focus their attention on the image of the table directly in front of them while walking to control their varying gazes during walking. The walking trail consisted of at least 3 min of walking at a self-selected comfortable walking speed while wearing the lab-provided footwear. Data were left unaltered and unfiltered to avoid interfering with potential biological signals within the data, as data filtering can lead to altered nonlinear results [13].

2.4. Data Analysis

Data processing was performed using custom Matlab code (Mathworks Inc., Natick, MA, USA). For the calculation of stride time and stride length, we used the methods described by Zeni et al. [14] to estimate the stride-to-stride variability; the mean, standard deviation (SD), and CV were calculated for the stride-time and stride-length time series. The SD and CV provide a measure of the overall variations in gait during the walk, or the magnitude of the variability within the time series. Sample entropy (SE) was calculated to determine the variability of the stride-time and stride-length time series. Smaller values of SE reflect more rigidity and less variability in the time series. Larger values of SE reflect more randomness and increased variability in the time series. To quantify the stride time and stride length correlations and the structure of the dynamics of gait, we applied DFA α to each subject’s stride-time and stride-length time series. DFA α is a modified random walk analysis that can be used to quantify how correlation properties change over different time scales or observation windows [15,16]. The DFA α method assumes that, within the scale of interest, the correlation decays in a power-law manner; thus, a single exponent (α) can quantify the scaling. A DFA α close to 0.5 would indicate more random stride-to-stride fluctuations and less correlation, while a DFA α close to 1.5 would indicate fluctuations with a brown noise quality and low frequency with slowly changing trends [15].

2.5. Statistical Analysis

A one-way ANCOVA with four factors (age groups) was performed to determine statistical significance and effect size (ηp2) for the ten dependent variables—mean, SD, COV, SE, and DFA α for the stride-time and stride-length time series with covariates of leg length and gait speed. An ηp2 of 0.01 indicates a small effect, an ηp2 of 0.06 indicates a medium effect, and an ηp2 of 0.14 indicates a large effect. When significant effects were determined, post hoc comparisons were performed using the Tukey method. To determine linear relationships among the age groups for the various dependent variables, regression analysis was performed. Statistical analysis was completed in PASW 18.0 (SPSS Inc., Chicago, IL, USA).

3. Results

Table 2 displays the means and standard deviations of all the dependent variables by group. To determine if the results were age-dependent and not a function of biomechanical changes related to growth, we investigated the linear relationship between both age and leg length and age and gait speed. In the present study, both leg length (r = 0.966, p < 0.001) and gait speed (r = 0.839, p < 0.001) increased linearly with age. Thus, we controlled for leg length and gait speed by conducting an ANCOVA with covariates of leg length and gait speed.

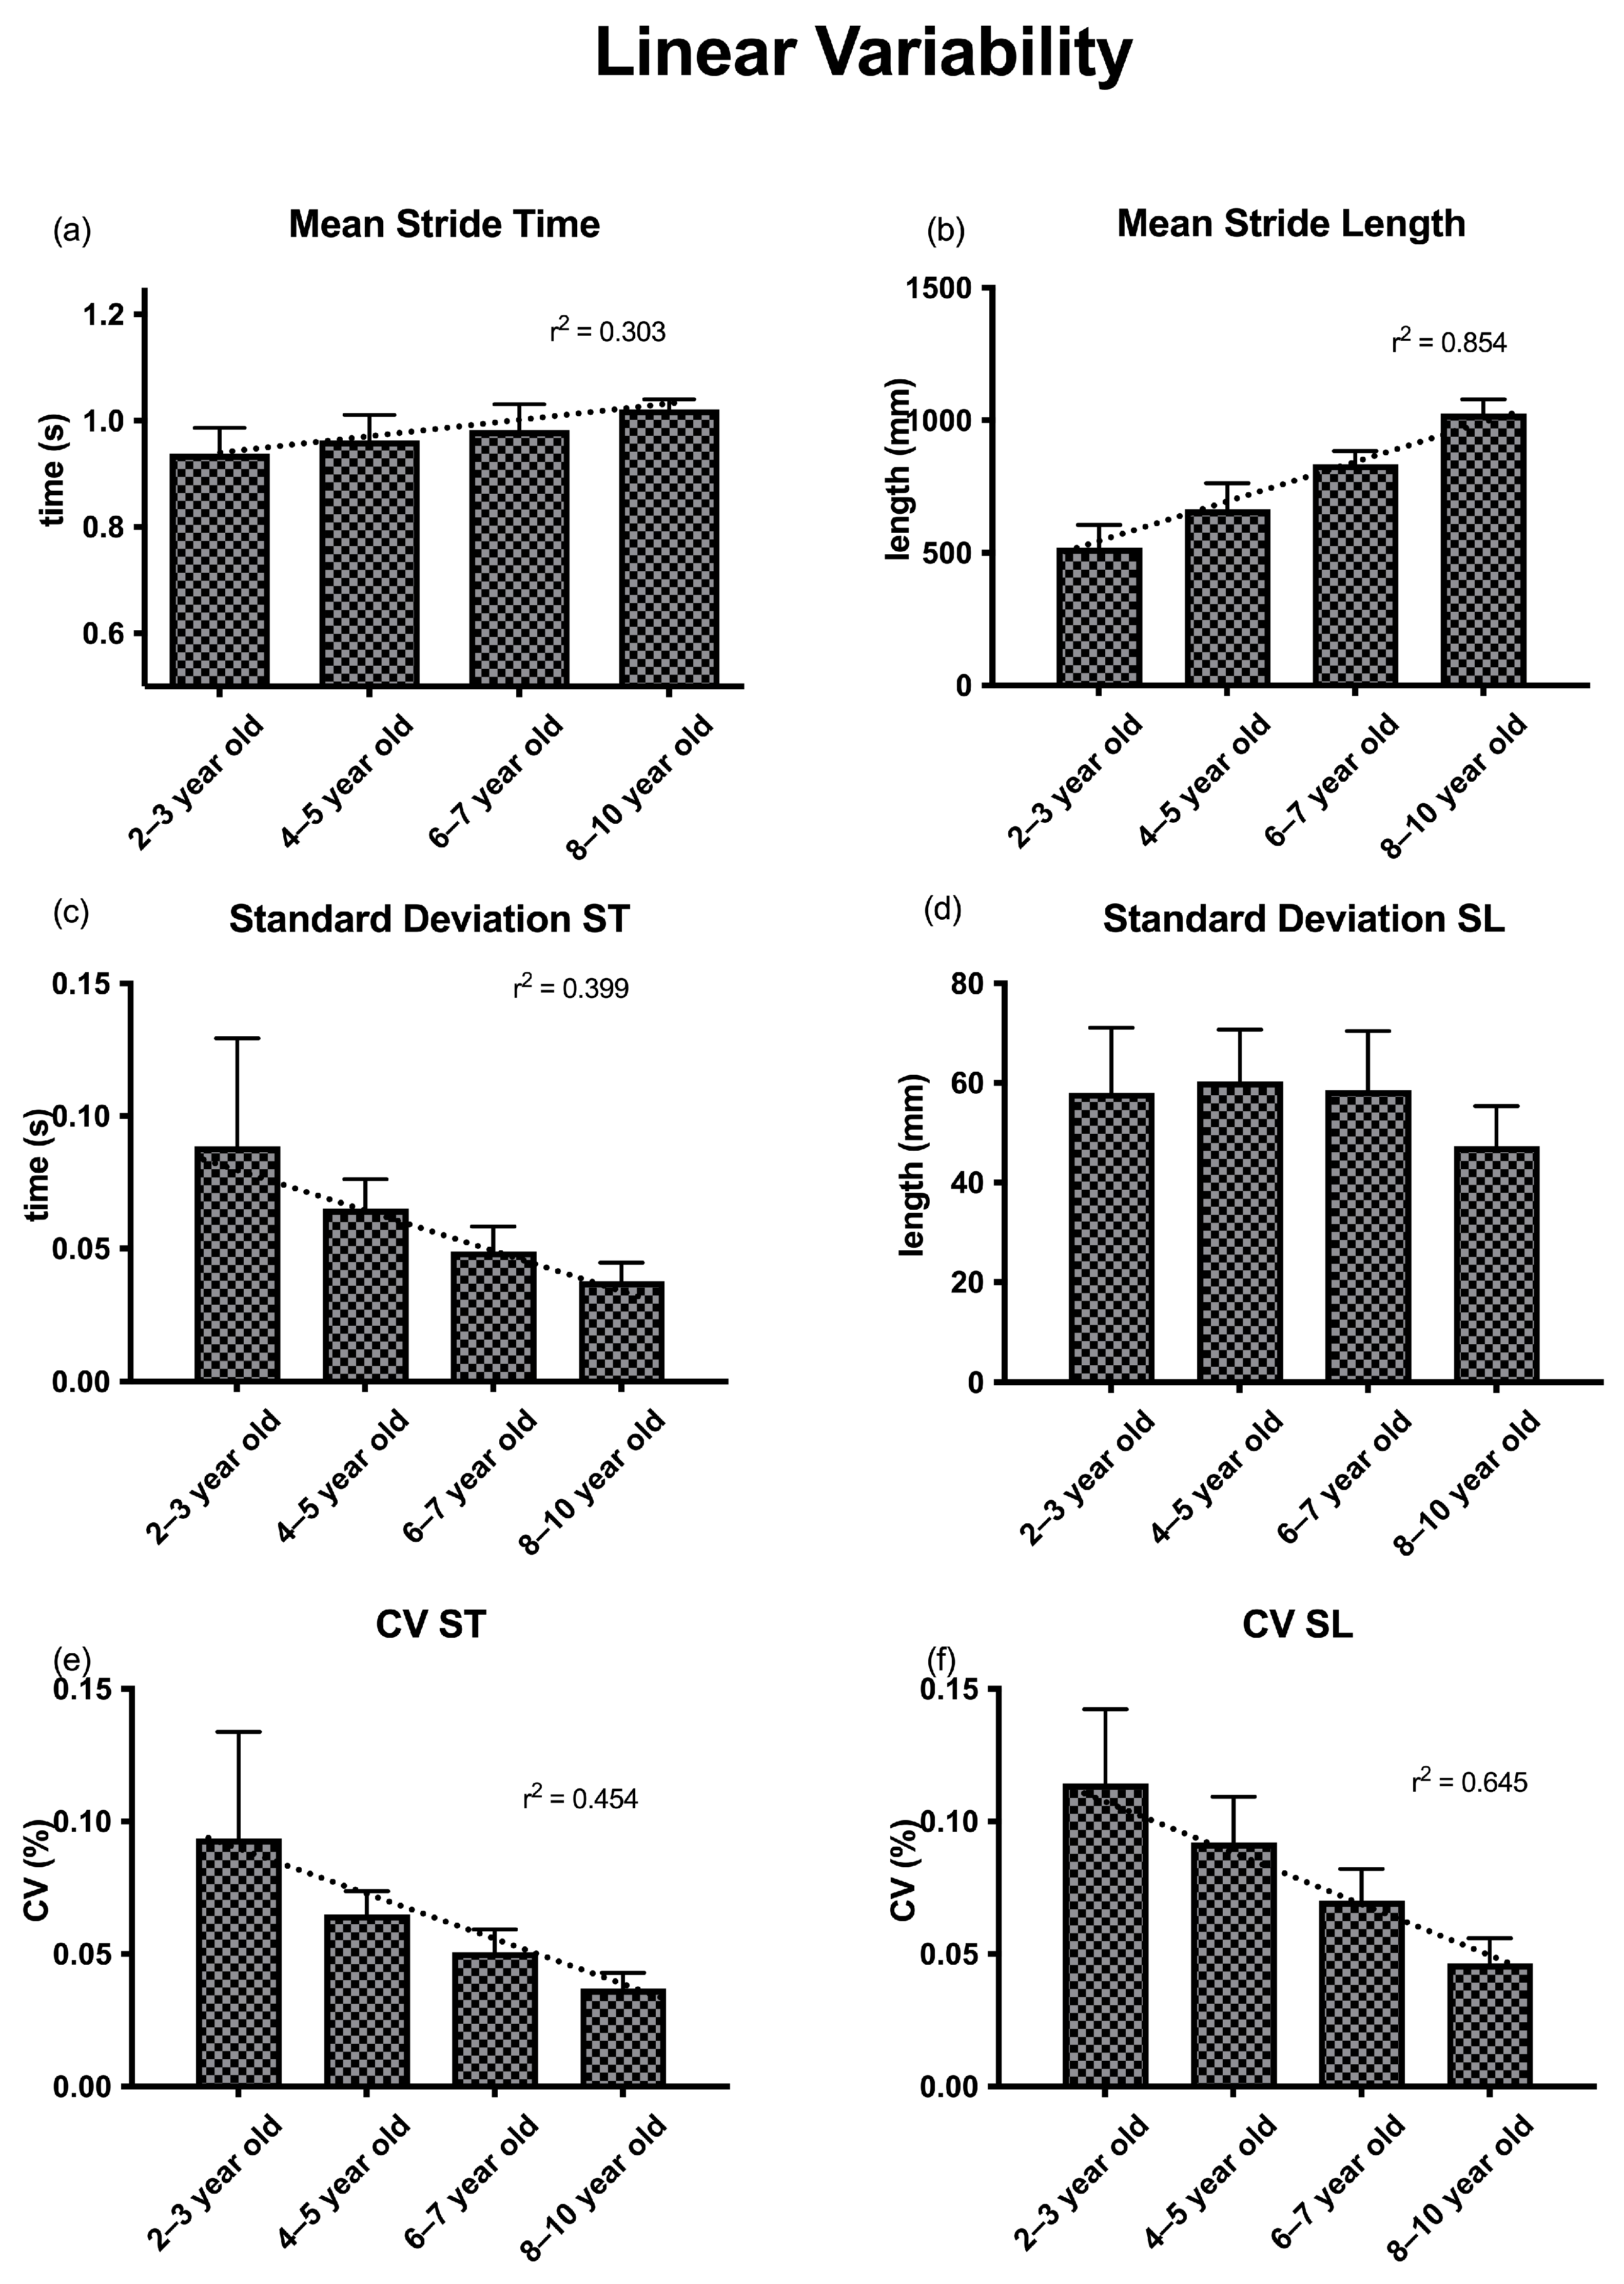
3.1. Mean Stride Time and Stride Length

There was a significant effect of age group on mean stride time after controlling for both leg length and gait speed (F (3,22) = 5.63, p = 0.003, ηp2 = 0.495). Post hoc comparisons revealed significantly greater stride times in the 6–7-year-old group compared to the 4–5-year-old group (p < 0.05). There was a significant effect of age group on mean stride length after controlling for both leg length and gait speed (F (3,22) = 36.46, p < 0.001, ηp2 = 0.864). The planned contrasts revealed a significant increase in mean stride length with age (p < 0.05). Specifically, each age group had significantly greater mean stride length compared to the groups younger than it (Table 2). There was a moderate-to-strong significant linear relationship for age and mean stride time (r = 0.574, p < 0.05), and a very strong significant linear relationship for age and mean stride length (r = 0.927, p < 0.05).

3.2. SD Stride Time and Stride Length

There was a significant effect of age group on SD stride time after controlling for both leg length and gait speed (F (3,22) = 4.42, p = 0.009, ηp2 = 0.435) (Table 2). The planned contrasts revealed significantly greater SD stride time for the 2–3-year-old group compared to both the 6–7-year-old and 8–10-year-old groups (p < 0.05). The 4–5-year-old group also had significantly greater SD stride time compared to the 8–10-year-old group (p < 0.05). There was not a significant effect of age group on SD stride length after controlling for both leg length and gait speed (p > 0.05). There was a strong significant linear relationship between age and SD stride time (r = 0.649, p < 0.05), but no linear relationship was found for SD stride length (p > 0.05).

3.3. CV Stride Time and Stride Length

There was a significant effect of age group on CV stride time after controlling for both leg length and gait speed (F (3,22) = 5.58, p = 0.003, ηp2 = 0.493) (Table 2). The planned contrasts revealed that the 2–3-year-old group had significantly greater CV stride time compared to the other three groups (p < 0.05). There was a significant effect of age group on CV stride length after controlling for both leg length and gait speed (F (3,22) = 11.07, p < 0.001, ηp2 = 0.658). The planned contrasts revealed that CV stride length significantly decreased as the groups got older (p < 0.05). Specifically, the 2–3-year-old group had the largest CV stride time, which was significantly greater than the 4–5-year-old, 6–7-year-old, and 8–10-year-old groups (p < 0.05). The 4–5-year-old group also had significantly greater CV stride length than the 6–7-year-old and the 8–10-year-old groups (p < 0.05). The 6–7-year-old group also had significantly greater CV stride length compared to the 8–10-year-old group (p < 0.05). A regression analysis showed that there was in fact a very strong significant linear relationship (r = 0.867, p < 0.001), with CV stride length decreasing as children aged. There was a strong significant linear relationship between age and CV stride time (r = 0.689, p < 0.05), as well as a very strong relationship between age and CV stride length (r = 0.811, p < 0.05).

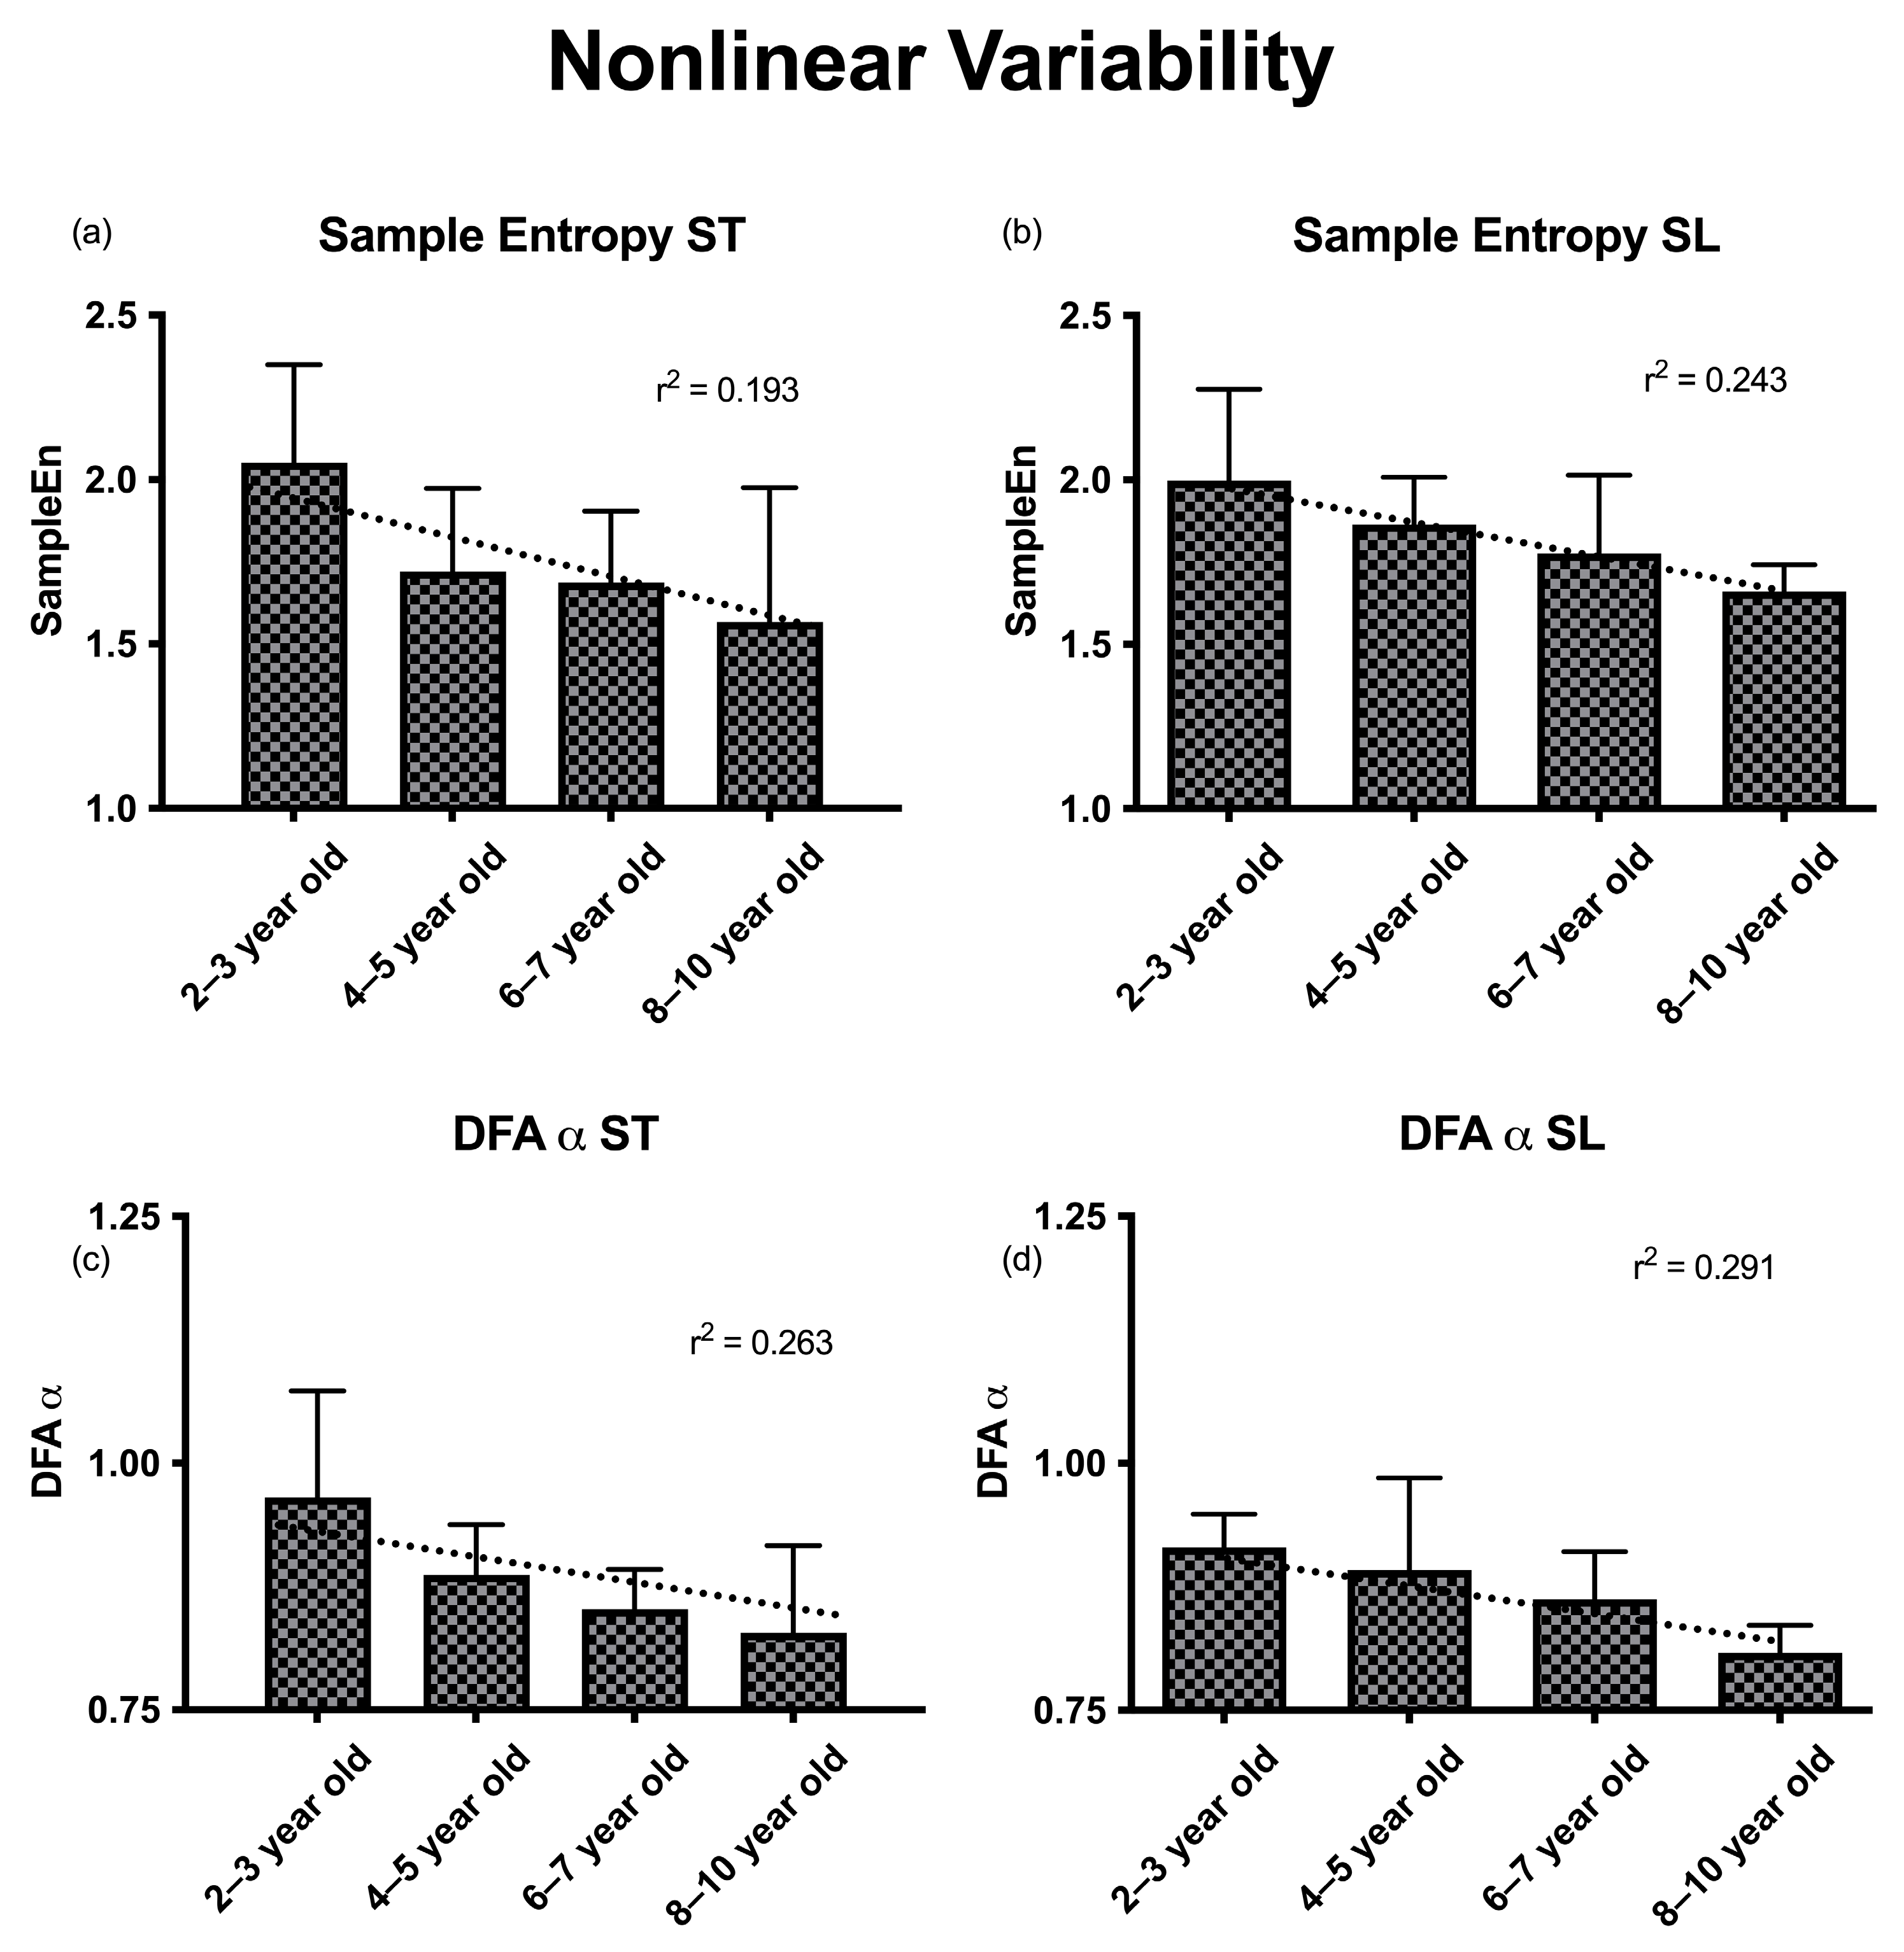
3.4. SE Stride Time and Stride Length

There was not a significant effect of age group on SE stride time after controlling for leg length and gait speed (F (3,22) = 2.13, p = 0.109, ηp2 = 0.271). There was not a significant effect of age group on SE stride length after controlling for leg length and gait speed (F (3,22) = 2.19, p = 0.103, ηp2 = 0.275). There was a moderate significant linear relationship between age and SE stride time (r = 0.472, p < 0.05), as well as a moderate significant linear relationship between age and SE stride length (r = 0.520, p < 0.05).

3.5. DFA α Stride Time and Stride Length

There was a significant effect of age group on DFA α stride time after controlling for leg length and gait speed (F (3,22) 3.034, p = 0.038, ηp2 = 0.345). The planned contrasts determined that DFA α stride time was significantly greater in the 2–3-year-old group than the 8–10-year-old group (Table 2). Interestingly, DFA α stride time decreased with age across all the age groups. There was a significant effect of age group on DFA α stride length after controlling for leg length and gait speed (F (3,22) = 2.933, p = 0.043, ηp2 = 0.338). The planned contrasts revealed that the DFA α stride length for the 2–3-year-old group was significantly greater than that of both the 6–7-year-old and 8–10-year-old groups (p < 0.05). Like DFA α stride time, DFA α stride length also decreased with age for all of the age groups. There was a moderate-to-strong significant linear relationship between age and DFA α stride time (r = 0.538, p < 0.05), as well as a moderate-to-strong significant linear relationship between age and DFA α stride length (r = 0.563, p < 0.05).

4. Discussion

We investigated the trajectory of stride dynamics and gait variability in four groups of children from 2 to 10 years old. We measured the stride time and stride length of children walking at a self-selected speed for 3 min on a treadmill. We used both amount and structure measures of variability to investigate gait dynamics. We hypothesized that children’s gait variability would decrease with age, which was supported by the results of this study. Our results agree with previous research that found a significant age effect on both linear and nonlinear variability measures of stride time dynamics in children’s gait [2]. As expected, mean stride time and stride length are age-dependent and increase with age. Our data showed an extremely age-dependent relationship among all the variability measures except for stride time SD and stride length SD. However, the stride time and stride length amount of variability (CV) significantly decreased with age; the stride time and stride length nonlinear variability (SE) and structure of variability (DFA α) also decreased with age. This is also in agreement with the application of the Gait Variability Index (GVI), with which authors observe decreases in gait variability with stability not achieved until around 11 years old [17].

4.1. Linear Variability

Our results indicate that the stride-to-stride dynamics of children’s gait and the amount of gait variability are extremely age-dependent. As is evidenced in Figure 2, there is a decreased amount of variability as children age in their respective groups. As children get older and potentially gain more experience walking, their variability decreases without as much fluctuation in their gait, as evidenced by the CV time-series results. Interestingly, the increased amount of variability in children is minimized in adulthood before returning again in older adult walkers to form a U-shaped curve over the lifespan [18]. The source of the increased amount of variability could be very different in children and older adults. Children have a developing neuromuscular system that produces unrefined movements that contribute to the increased amount of variability [19], which is interestingly further augmented when considering the gestational age of birth [20]; meanwhile, older adults experience a degradation of their neuromuscular system with age and could be influenced by various pathologies [21]. Overall, it is interesting to observe this change in children as they refine their neuromuscular control and produce a more effective gait.

4.2. Nonlinear Variability

The youngest children exhibited the greatest SE and DFA α by far, while the oldest children easily had the lowest. This points to a refining of the structure of variability in older children to better mimic adult gait. Younger children seemingly had more random gait characteristics, resulting in increased SE values while having more correlated long-range gait properties and an increased DFA α. To draw back to the continuum of gait from children to adults and older adults, these results point to differing mechanisms driving the amount of variability in children and older adults.
Our results showed that SE values decreased with age, with the younger groups showing higher values of SE and the older groups showing lower values of SE. Children are continuously developing their motor control and, in particular, their movement strategies as they gain more experience walking. This allows them to refine their preferred movements as they attain more control over their degrees of freedom of movement. This finding is interesting as it agrees with the literature and points to the development of motor control and possibly complexity [22], as well as a refining of the smoothness and harmonic ratio of gait [23] as children age. Interestingly, at the other end of the spectrum of aging, as one advances into older adulthood, SE also decreases, potentially because of a loss of complexity. Our results showed that the DFA α values of the stride-time and stride-length time series decreased with age, as expected (Figure 3). Children’s gait is continually refined through maturation and development. A trend towards more stability and less variability that mimics adult gait is observed. These results of continuous, though subtle, changes in stride dynamics and gait variability follow the Dynamical Systems Theory (DST) [24,25].

4.3. Theoretical Application

Within DST, biomechanical degrees of freedom within the motor system can be greatly reduced with the introduction of constraints by individuals. As children get older and gain more experience, the motor system has better control through the application of increased constraints through muscle and motor control. Younger children have fewer applied constraints and thus exhibit greater variability compared to older children. In a sense, older children have deeper attractor wells, facilitated by their constraints, that allow for a sturdier movement pattern that is not as affected by small perturbations. Meanwhile, younger children have shallower wells because they have gained less experience and had less time to develop mature movement patterns of walking, leading to greater gait fluctuations from perturbations. This could explain the linear reduction in variability with age in the children in this experiment. This finding is further augmented by periods of time where adolescents experience gait variability changes after growth spurts [26]. Our data can be viewed theoretically through the Complexity Loss Theory. The Complexity Loss Theory states that aging can be defined as a progressive loss of complexity in the dynamics of physiological systems [27]. We can view our data as part of this progression of loss of complexity, starting with children exhibiting the highest complexity and slowly losing complexity throughout their lifetime. We can then attribute aging to a further loss of complexity.
The current study is not without limitations. We sampled children between the ages of 2 and 10 with varying degrees of experience walking on the treadmill as a cross-sectional design. A longitudinal study could have provided greater insights into the developmental changes in gait in children; however, the practical application of following children for 10 years of development would be incredibly difficult. The novelty of walking on the treadmill could also have influenced gait during the testing. To minimize this limitation, we included an adaptation period of walking prior to any testing that allowed the children to gain comfort with the treadmill and us to establish normal gait patterns observationally. The use of the treadmill allowed us to sample an incredible amount of data compared to typical overground or gait runway types of collections, strengthening our data outcomes. Another potential limitation of this study is that, by controlling for the type of footwear worn, children had to wear shoes they had not worn before. To minimize the effect that the new shoes could have on the gait of the children during testing, they were worn during the adaptation period on the treadmill. It would also be of note to further investigate the subcomponents of gait that influence the decrease in gait variability as children age [28].

5. Conclusions

In sum, we were able to develop an understanding of the trajectory of the development of gait dynamics and variability in children. As expected, children’s gait seems to go through a maturation process, refining its way through development until it resembles adult gait. This is true for both the amount and the structure of variability, even after normalizing for leg length and gait speed. Children lose the randomness of their walk with age and stride towards less complex and adaptable patterns that they carry on into adulthood. Further investigation into the stride-to-stride fluctuations of gait in children using other nonlinear variability parameters should be considered. An investigation into the changes in neuromuscular control should also be evaluated. These studies will allow us to acquire a better understanding of children’s developing gait dynamics, which can be applied to the understanding of gait pathology and atypical development.

Author Contributions

Conceptualization, B.C.A. and A.K.; methodology, B.C.A. and A.K.; software, B.C.A. and Z.L.M.; validation, B.C.A., Z.L.M. and A.K., formal analysis, B.C.A. and A.K.; investigation, B.C.A., Z.L.M. and A.K.; resources, B.C.A.; data curation, B.C.A. and Z.L.M.; writing—original draft preparation, B.C.A.; writing—review and editing, B.C.A., Z.L.M. and A.K.; visualization, B.C.A.; supervision, B.C.A. and A.K.; All authors have read and agreed to the published version of the manuscript.

Funding

This research received no external funding.

Institutional Review Board Statement

The study was conducted in accordance with the Declaration of Helsinki, and approved by the Institutional Review of The University of Nebraska Medical Center (IRB #682-14-EP).

Informed Consent Statement

Informed consent was obtained from all subjects involved in the study.

Data Availability Statement

Data are available upon request due to privacy restrictions.

Conflicts of Interest

The authors declare no conflict of interest.

References

  1. Sutherland, D.; Olshen, R.; Biden, E. The Development of Mature Walking; Cambridge University Press: Cambridge, UK, 1988; ISBN 0-521-41221-8. [Google Scholar]
  2. Hausdorff, J.M.; Zemany, L.; Peng, C.-K.; Goldberger, A.L. Maturation of gait dynamics: Stride-to-stride variability and its temporal organization in children. J. Appl. Physiol. 1999, 86, 1040–1047. [Google Scholar] [CrossRef] [PubMed]
  3. Ganley, K.J.; Powers, C.M. Gait kinematics and kinetics of 7-year-old children: A comparison to adults using age-specific anthropometric data. Gait Posture 2005, 21, 141–145. [Google Scholar] [CrossRef] [PubMed]
  4. Fukuchi, C.A.; Fukuchi, R.K.; Duarte, M. Effects of walking speed on gait biomechanics in healthy participants: A systematic review and meta-analysis. Syst. Rev. 2019, 8, 153. [Google Scholar] [CrossRef] [PubMed]
  5. Todd, F.N.; Lamoreux, L.W.; Skinner, S.R.; Johanson, M.E.; St Helen, R.; Moran, S.A.; Ashley, R.K. Variations in the gait of normal children. A graph applicable to the documentation of abnormalities. JBJS 1989, 71, 196–204. [Google Scholar] [CrossRef]
  6. Rose, V.L.; Arellano, C.J. Simple models highlight differences in the walking biomechanics of young children and adults. J. Exp. Biol. 2021, 224, jeb243040. [Google Scholar] [CrossRef] [PubMed]
  7. Sutherland, D. The development of mature gait. Gait Posture 1997, 6, 163–170. [Google Scholar] [CrossRef]
  8. Manicolo, O.; Grob, A.; Lemola, S.; Arx, P.H. Age-related decline of gait variability in children with attention-deficit/hyperactivity disorder: Support for the maturational delay hypothesis in gait. Gait Posture 2016, 44, 245–249. [Google Scholar] [CrossRef]
  9. Hallemans, A.; Verbecque, E.; Dumas, R.; Cheze, L.; Van Hamme, A.; Robert, T. Developmental changes in spatial margin of stability in typically developing children relate to the mechanics of gait. Gait Posture 2018, 63, 33–38. [Google Scholar] [CrossRef]
  10. Nigg, B.M.; Cole, G.K.; Nachbauer, W. Effects of arch height of the foot on angular motion of the lower extremities in running. J. Biomech. 1993, 26, 909–916. [Google Scholar] [CrossRef]
  11. Vaughan, C.L.; Davis, B.L.; O’connor, J.C. Dynamics of Human Gait; Human Kinetics Publishers: Champaign, IL, USA, 1992; ISBN 0873223683. [Google Scholar]
  12. Fonseca, M.; Gasparutto, X.; Leboeuf, F.; Dumas, R.; Armand, S. Impact of knee marker misplacement on gait kinematics of children with cerebral palsy using the Conventional Gait Model—A sensitivity study. PLoS ONE 2020, 15, e0232064. [Google Scholar] [CrossRef]
  13. Rapp, P.E.; Albano, A.M.; Schmah, T.I.; Farwell, L.A. Filtered noise can mimic low-dimensional chaotic attractors. Phys. Rev. E 1993, 47, 2289–2297. [Google Scholar] [CrossRef]
  14. Zeni, J.A.; Richards, J.G.; Higginson, J.S. Two simple methods for determining gait events during treadmill and overground walking using kinematic data. Gait Posture 2008, 27, 710–714. [Google Scholar] [CrossRef]
  15. Peng, C.-K.; Havlin, S.; Stanley, H.E.; Goldberger, A.L. Quantification of scaling exponents and crossover phenomena in nonstationary heartbeat time series. Chaos Interdiscip. J. Nonlinear Sci. 1995, 5, 82–87. [Google Scholar] [CrossRef] [PubMed]
  16. Hausdorff, J.M.; Mitchell, S.L.; Firtion, R.; Peng, C.K.; Cudkowicz, M.E.; Wei, J.Y.; Goldberger, A.L. Altered fractal dynamics of gait: Reduced stride-interval correlations with aging and Huntington’s disease. J. Appl. Physiol. 1997, 82, 262–269. [Google Scholar] [CrossRef]
  17. Gouelle, A.; Leroux, J.; Bredin, J.; Mégrot, F. Changes in Gait Variability From First Steps to Adulthood: Normative Data for the Gait Variability Index. J. Mot. Behav. 2016, 48, 249–255. [Google Scholar] [CrossRef]
  18. Hausdorff, J.M.; Edelberg, H.K.; Mitchell, S.L.; Goldberger, A.L.; Wei, J.Y. Increased gait unsteadiness in community-dwelling elderly fallers. Arch. Phys. Med. Rehabil. 1997, 78, 278–283. [Google Scholar] [CrossRef]
  19. Granata, K.P.; Padua, D.A.; Abel, M.F. Repeatability of surface EMG during gait in children. Gait Posture 2005, 22, 346–350. [Google Scholar] [CrossRef] [PubMed]
  20. Albesher, R.A.; Spittle, A.J.; Dobson, F.L.; Mentiplay, B.F.; FitzGerald, T.L.; Cameron, K.L.; Zannino, D.; Josev, E.K.; Doyle, L.W.; Cheong, J.L.Y.; et al. Spatiotemporal gait variables and step-to-step variability in preschool-aged children born < 30 weeks’ gestation and at term in preferred speed, dual-task paradigm, and tandem walking. Gait Posture 2022, 92, 236–242. [Google Scholar] [CrossRef] [PubMed]
  21. McGibbon, C.A. Toward a Better Understanding of Gait Changes With Age and Disablement: Neuromuscular Adaptation. Exerc. Sport Sci. Rev. 2003, 31, 102. [Google Scholar] [CrossRef]
  22. Arif, M.; Ohtaki, Y.; Nagatomi, R.; Inooka, H. Estimation of the Effect of Cadence on Gait Stability in Young and Elderly People using Approximate Entropy Technique. Meas. Sci. Rev. 2004, 4, 29–40. [Google Scholar]
  23. Leban, B.; Cimolin, V.; Porta, M.; Arippa, F.; Pilloni, G.; Galli, M.; Pau, M. Age-Related Changes in Smoothness of Gait of Healthy Children and Early Adolescents. J. Mot. Behav. 2020, 52, 694–702. [Google Scholar] [CrossRef] [PubMed]
  24. Kelso, J.A.S. Dynamic Patterns: The Self-Organization of Brain and Behavior; MIT Press: Cambridge, MA, USA, 1995; ISBN 978-0-262-61131-2. [Google Scholar]
  25. Scholz, J.P. Dynamic Pattern Theory—Some Implications for Therapeutics. Phys. Ther. 1990, 70, 827–843. [Google Scholar] [CrossRef] [PubMed]
  26. Bisi, M.C.; Stagni, R. Development of gait motor control: What happens after a sudden increase in height during adolescence? Biomed. Eng. OnLine 2016, 15, 47. [Google Scholar] [CrossRef] [PubMed]
  27. Lipsitz, L.A.; Goldberger, A.L. Loss of “Complexity” and Aging: Potential Applications of Fractals and Chaos Theory to Senescence. JAMA 1992, 267, 1806–1809. [Google Scholar] [CrossRef]
  28. Kraan, C.M.; Tan, A.H.J.; Cornish, K.M. The developmental dynamics of gait maturation with a focus on spatiotemporal measures. Gait Posture 2017, 51, 208–217. [Google Scholar] [CrossRef]
Figure 1. Example of child subject walking on the split-belt treadmill. The image depicts a full marker set; however, for this study, only the heel and toe markers on each foot were used to quantify the stride length and stride time for each subject.
Biomechanics 03 00046 g001
Figure 2. Bar charts showing the group and footwear means for mean, standard deviation (SD), and coefficient of variation (CV) in the stride-time and stride-length time series by age group and footwear, as well as the relationship between age and the respective variables.
Biomechanics 03 00046 g002
Figure 3. Bar charts showing the mean differences for sample entropy (SE) and DFA α for the stride-time and stride-length time series by age group and footwear.
Biomechanics 03 00046 g003
Table 1. Subject demographics by age group for child participants.
2–3-Year-Olds
(n = 7)
4–5-Year-Olds
(n = 7)
6–7-Year-Olds
(n = 7)
8–10-Year-Olds
(n = 7)
Sex (male/female)4/3 3/4 3/4 3/4
Age (months)35.9±7.358.57±5.781.57±6.37115.6±6.02
Body mass (kg)13.67±2.517.31±1.425.99±4.9738.44±5.23
Body height (m)0.92±0.081.04±0.031.22±0.061.38±0.03
Onset of walking (months)12.14±0.6912.572.1512.21±1.3013.29±0.95
Walking speed (m)0.56±0.160.78±0.140.92±0.081.07±0.11
Note: values are shown as mean ± standard deviation.
Table 2. Group means for linear (SD, CV) and nonlinear (SE, DFA α) variability-dependent measurements for the 2–3-, 4–5-, 6–7-, and 8–10-year-old groups.
2–3-Year-Olds
(n = 7)
4–5-Year-Olds
(n = 7)
6–7-Year-Olds
(n = 7)
8–10-Year-Olds
(n = 7)
Significance
Stride time (s)0.938 ± 0.050.963 ± 0.050.982 ± 0.051.022 ± 0.02§
Stride length (mm)519.3 ± 93.8664.4 ± 106.7834.5 ± 53.41025.4 ± 58.9*, †, ‡, §, ‖, ¶
Stride time SD (s)0.09 ± 0.040.07 ± 0.20.049 ± 0.010.038 ± 0.01† ‡, ‖
Stride length SD (mm)58.0 ± 14.160.2 ± 11.258.6 ± 12.847.3 ± 8.7
Stride time CV (%)9.3 ± 46.5 ± 15.1 ± 13.6 ± 0.7*, †, ‡
Stride length CV (%)11.4 ± 39.2 ± 1.87.0 ± 1.34.6 ± 1*, †, ‡, §, ‖, ¶
Stride time SE (bits)2.05 ± 0.31.72 ± 0.031.69 ± 0.21.57 ± 0.04
Stride length SE (bits)2.00 ± 0.31.86 ± 0.161.77 ± 0.31.66 ± 0.1
Stride time DFA α0.97 ± 0.120.89 ± 0.050.85 ± 0.40.82 ± 0.10
Stride length DFA α0.91 ± 0.040.89 ± 0.100.86 ± 0.050.81 ± 0.03†, ‡
Note: values are shown as mean ± standard deviation. * p < 0.05, significant differences between groups 2–3 and 4–5.  p < 0.05, significant differences between groups 2–3 and 6–7.  p < 0.05, significant differences between groups 2–3 and 8–10. § p < 0.05, significant differences between groups 4–5 and 6–7.  p < 0.05, significant differences between groups 4–5 and 8–10.  p < 0.05, significant differences between groups 6–7 and 8–10.
Disclaimer/Publisher’s Note: The statements, opinions and data contained in all publications are solely those of the individual author(s) and contributor(s) and not of MDPI and/or the editor(s). MDPI and/or the editor(s) disclaim responsibility for any injury to people or property resulting from any ideas, methods, instructions or products referred to in the content.

