Article

Intra-Day and Inter-Day Reliability and Usefulness of Performance, Kinetic and Kinematic Variables during Drop Jumping in Hurling Players

1
Department of Health and Sport Sciences, South East Technological University, Kilkenny Road Campus, R93 V960 Carlow, Ireland
2
School of Sport and Health Sciences, Cardiff Metropolitan University, Cardiff CF5 2YB, UK
3
School of Physical Education and Sports, Nisantasi University, Istanbul, Turkey
4
Exercise and Rehabilitation Sciences Institute, School of Physical Therapy, Faculty of Rehabilitation Sciences, Universidad Andres Bello, Santiago 7591538, Chile
*
Author to whom correspondence should be addressed.
Biomechanics 2024, 4(1), 1-13; https://doi.org/10.3390/biomechanics4010001
Submission received: 27 November 2023 / Revised: 27 December 2023 / Accepted: 8 January 2024 / Published: 10 January 2024

Abstract

:
The aim of this study was to estimate the intra-day and inter-day reliability and usefulness of performance (Jump height (JH), ground contact time (GCT) and reactive strength index (RSI)), kinetic (force, power, eccentric rate of force development [E-RFD] and leg stiffness [LS]) and kinematic (velocity) variables during drop jumping (DJ) in hurling players. Seventeen (n = 17; mean ± SD; age = 23.35 ± 5.78 years, height = 178.35 ± 6.30 cm, body mass = 78.62 ± 8.06 kg) male club-level hurling players completed two maximal DJs from 0.20, 0.30, 0.40, 0.50 and 0.60 m drop heights on three testing days separated by 5–9 days of rest. Reliability was assessed using the coefficient of variation percentage (CV% ≤ 15%) and intraclass correlation coefficient (ICC > 0.70). For intra-day reliability, GCT (0.40 m, 0.50 m and 0.60 m), peak force (absolute and relative) (0.40 m and 0.50 m) and leg stiffness (0.40 m and 0.50 m) were found to be unreliable (ICC = 0.32–0.68 and CV% = 3.67–11.83%) from those specific drop heights. All other variables were found to be reliable (ICC = 0.72–0.98 and CV% = 1.07–14.02%) intra-day. All variables were found to be reliable (ICC = 0.72–0.96 and CV% = 2.57–14.68%) inter-day except for relative peak force and absolute and relative eccentric RFD (0.30 m and 0.40 m) (ICC = 0.68–0.90 and CV% = 7.76–16.47%). Practitioners have multiple reliable DJ performance, kinetic and kinematic variables for performance testing and training purposes.

1. Introduction

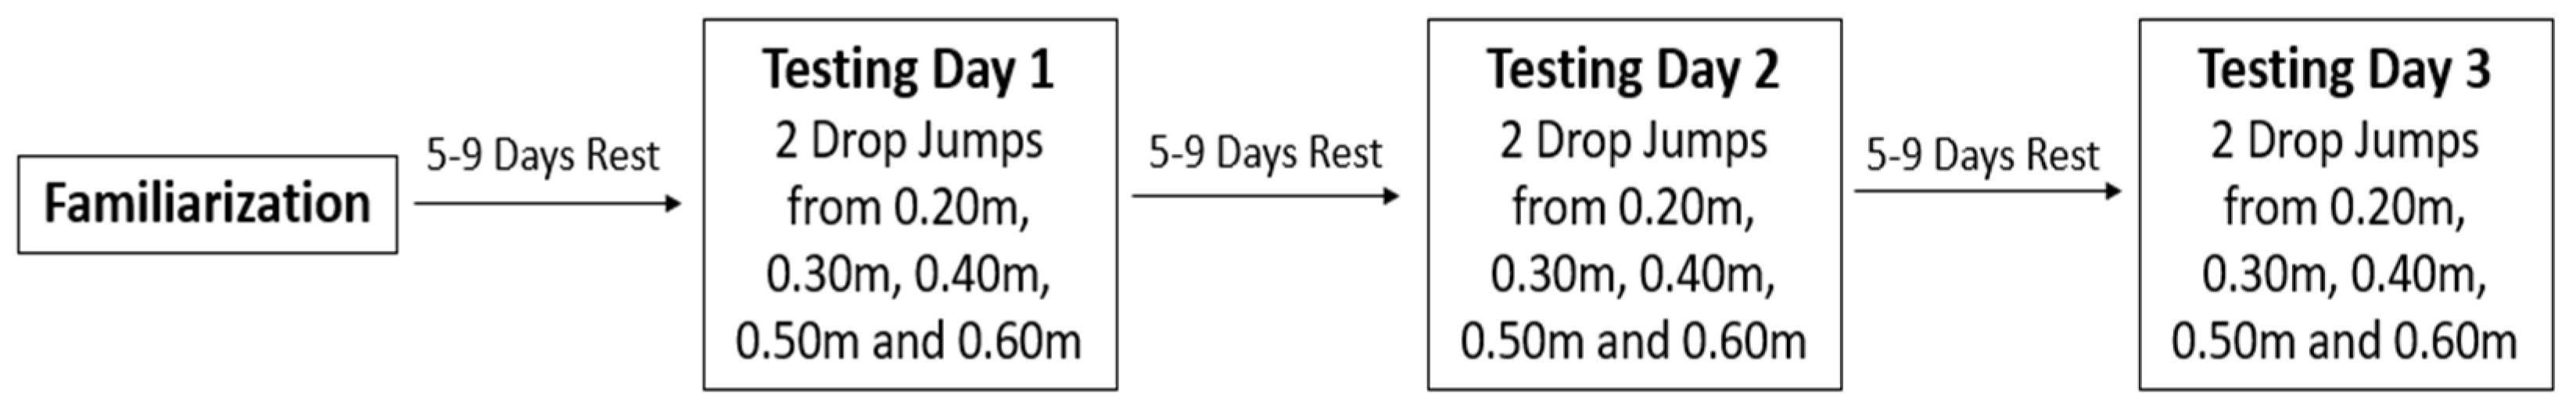
The sport of hurling is an intermittent field sport that incorporates a variety of different explosive actions such as jumping to compete for possession in both offensive and defensive situations, performing sprint accelerations and cutting motions to change direction quickly to evade the opposition (see Figure 1) [1,2]. These aforementioned explosive actions can be crucial as they often occur close to the ball, potentially determining the outcome of key events during match-play [3]. Jump, sprint and change in direction performance are related to reactive strength performance [4]. The drop jump (DJ) exercise in a strength and conditioning program may improve reactive strength performance, and to measure reactive strength performance, a DJ exercise test is usually employed [5,6,7].
The DJ is a plyometric exercise that utilizes the stretch-shortening cycle (SSC), which is activated via a preloading countermovement [8]. The DJ requires a subject to drop off a pre-selected height and, on landing on the ground, perform a maximal vertical jump while attempting to minimize ground contact time (GCT) [8]. In addition to its role in athlete assessment, the DJ is a popular plyometric training exercise and has been used to enhance a variety of performance indicators, both acutely and chronically, in addition to muscle force, power, strength and rate of force development [9,10,11,12,13,14,15,16]. Given the benefits of the DJ in terms of performance training and athlete monitoring and as a performance test, the reliability of performance variables in hurling players is of upmost importance.
Previous research on the DJ has emphasized the reliability of variables such as reactive strength index (RSI), jump height (JH) and GCT. Previous research in professional basketball players showed that when performing DJs from 0.20 m to 0.50 m drop heights, the coefficient percentages (CV%) for the RSI and JH were ~2.0–4.5% and 2.5–3.5%, respectively [17]. Similar findings were reported for RSI (ICC = 0.93, CV% = 8.47%), GCT (ICC = 0.89, CV% = 8.93%) and JH (ICC = 0.84, CV% = 8.96) on international level rugby union players from a 0.40 m drop height [18]. RSI (ICC = 0.99), GCT (ICC = 0.98) and JH (ICC = 0.99) have also been shown to be reliable measures from a standardized drop height of 0.30 m in track and field athletes [8]. When considering kinetic variables for the DJ, mean force (MF: ICC = 0.93; CV% = 4.5%) and peak force (PF: ICC = 0.86; CV% = 8.4%) met appropriate standards of reliability, although time to peak force (TTPF) was deemed unreliable (ICC = 0.77; CV% = 9.1%) from a 0.30 m drop height [19]. Unreliable results have been previously found (ICC = 0.67 and CV% = 0.66) for mean power in a DJ from 0.20 m and 0.40 m drop heights [20]. This study concluded that mean power was unreliable (ICC = 0.67, r = 0.66) when using the MyJump2 smartphone application. In addition to the contrasting findings between studies regarding reliable DJ performance, kinetic and kinematic measures, there is a dearth of studies of hurling players. Establishing the reliability of performance, kinetic and kinematic variables in the DJ exercise may contribute to the body of knowledge of the mechanisms underpinning different intervention protocols.
Therefore, the aim of this study was to estimate the intra-day and inter-day reliability and usefulness of performance (JH, GCT and RSI), kinetic (force, power, eccentric rate of force development [E-RFD] and leg stiffness [LS]) and kinematic (velocity) variables in hurling players. Based on the key references in the field, the authors hypothesize that all kinetic and kinematic DJ variables were reliable, both for intra-day and inter-day [17,18].

2. Materials and Methods

2.1. Experimental Approach to the Problem

A repeated measures design was used to estimate the intra- and inter-day reliability of force–time measures from the DJ. Subjects completed an incremental DJ protocol from five different drop heights (0.20 m–0.60 m at 0.10 m intervals), performing two DJs from each height, which were recorded, and the DJ with the highest RSI was used for analysis. This protocol was used on three separate occasions 5–9 days apart (Figure 2). Intra-day reliability was estimated for each testing occasion. Inter-day reliability was estimated across the three separate testing sessions.

2.2. Subjects

Subjects (n = 17; mean ± SD; age = 23.35 ± 5.78 years, height = 178.35 ± 6.30 cm, body mass = 78.62 ± 8.06 kg) competing in the Irish club hurling league season of 2021 (initial part of in-season) volunteered to participate in this study. Subjects were training ~3 times per week, playing 1 match per week and taking part in 1 or 2 other sessions per week (e.g., resistance, endurance, plyometric). Subjects were required to have a minimum of 12 months of resistance training experience and 6 months plyometric training experience. Subjects had a minimum of 15 years of experience playing the sport of hurling. No orthopedic or musculoskeletal injuries to the lower extremities were reported during medical screening in this study. Written consent was obtained from all subjects prior to their enrolment in this study. Ethical approval was provided by the institutional ethics committee.

2.3. Procedures

Subjects were familiarized with the test protocol and procedures in one familiarization session. Subjects were tested at the same time of day and requested to wear the same footwear for all test sessions, as well as maintain their normal dietary habits. Subjects were asked to abstain from vigorous exercise in the 48 h preceding the test sessions. While performing all DJs, subjects were instructed to keep their hands akimbo and “jump as high as possible as fast as possible”. A dynamic warm-up was completed before all test sessions and consisted of 5 min of low-intensity self-paced jogging and a series of dynamic stretches targeting the hamstrings, quadriceps, calves, adductors, and gluteal muscles [21]. Following the warm-up, the subjects completed an incremental DJ protocol where they completed two DJs from five different drop heights (0.20 m, 0.30 m, 0.40 m, 0.50 m and 0.60 m). Two practice jumps were provided at each drop height before two maximal and valid test jumps were recorded. The best test jump in terms of RSI was used for subsequent inter-day data analysis. Between individual jumps, 15 s rest was provided, as well as 3 mins between each drop height [17,22]. To be included in this study, the GCTs were required to be below 250 ms across all DJs.

Data Analysis for Drop Jump Testing

A portable dual-force plate with a built-in charge amplifier (ForceDecks, VALD, Newstead QLD 4006, Australia) was used to measure the force–time measures at a sampling frequency of 1000 Hz, and data were saved and analysed using the accompanying software (Version 2.0 8000). The independent variables of jump height, peak velocity, peak force and peak power were recorded and analysed for both the CMJ and DJ tests. Furthermore, E-RFD was recorded and analysed for the CMJ. For the DJ, GCT and RSI were recorded and analysed. All measures were calculated relative to body mass (kg), except for jump height, GCT, RSI, peak velocity and leg stiffness.
Jump height for each DJ trial was calculated using the following equation [23]: H = (g × t2)/8, where H = jump height (m); g = gravity (9.81 m/s−2); and t = flight time (s). Ground contact time was defined as the time between the initial foot-contact and take-off. The RSI was calculated based on the following equation: RSI = flight time (s)/ground contact time (s).
Concentric peak velocity (m/s) was determined from the highest velocity in the vertical component prior to take-off. Concentric peak force (N) was the peak ground reaction force during the concentric phase. Concentric peak power was the product of peak concentric force and peak concentric velocity. E-RFD was determined during the eccentric phase of the DJ from the force–time curve and commenced from peak negative velocity and ended when velocity equalled zero [24]. Leg stiffness was calculated by dividing the peak force by the displacement of the subject from the initial contact with the force plate to the lowest point of the center of mass during recovery from each DJ [25]. All variables were derived from the VALD ForceDecks software (Version 2.0 8000).

2.4. Statistical Analyses

All statistical analyses were carried out in SPSS (IBM Corp. Released 2020. IBM SPSS Statistics for Windows, Version 27.0, IBM Corp, Armonk, NY, USA). Descriptive statistics are reported as mean ± SDs. Paired samples t-tests were used to assess significant differences between trials occurring on the same day. One-way repeated measures AVOVAs were used to assess significant differences between trials at the same height across the three different testing sessions 5–9 days apart.
Trial to trial reliability was calculated for RSI, JH, GCT, PV, PF (absolute and relative), PP (absolute and relative), E-RFD (absolute and relative) and LS. Reliability was assessed with the use of the coefficient of variation (CV) and intraclass correlation coefficient (ICC 3,1 2-way mixed model with consistency and average measure) [26]. The CV was calculated as a percentage: CV% = (within subject SD/mean × 100). The data were said to be reliable if they met the criteria of CV ≤ 15% and ICC > 0.70 [27,28,29,30].
Usefulness was determined by comparing the typical error (TE) to the smallest worthwhile change (SWC) using a Microsoft Excel (version 2013) spreadsheet designed by the lead author. Intra-day TE was calculated by dividing the SD by the square root of 2. SWC was calculated by multiplying the SD by 0.2 and 0.5 to detect good and moderate changes in performance. Inter-day TE was calculated from the mean square error (MSE) from a one-way repeated measures ANOVA, which was reported to 3 decimal places. The test was rated as ‘good’ if the TE was below the SWC, ‘okay’ if the TE was similar to the SWC and ‘marginal’ in detecting meaningful change if the TE was higher than the SWC [31].

3. Results

The means and SDs of JH, GCT, RSI, PV, PF (absolute and relative), PP (absolute and relative), E-RFD (absolute and relative) and LS from the best DJ that produced the highest RSI for days 1, 2 and 3 for all drop heights (0.20 m, 0.30 m, 0.40 m, 0.50 m and 0.60 m) are displayed in Table 1 and Table 2.
Reliability and usefulness statistics for all performance variables (JH, GCT and RSI) and kinetic and kinematic measures are shown in Table 3 and Table 4 (intra-day). No significant differences were present for all variables intra-day in any of the test sessions, except for absolute (Power = 0.56) and relative E-RFD (Power = 0.50) from a 0.3 m drop height on day 1.
Reliability and usefulness statistics for all performance variables (JH, GCT and RSI) and kinetic and kinematic measures are shown in Table 5 and Table 6 (inter-day). No significant differences were present for all variables from all drop heights inter-day.

4. Discussion

The intra-day results of this study found the JH and RSI performance variables, as well as the kinetic and kinematic variables of PV, PP (absolute and relative) and E-RFD (absolute and relative), to be reliable from all drop heights as the ICC and CV% values achieved the required criteria of >0.70 and <15%, respectively (Table 2 and Table 3). However, the GCT performance variable was found to be reliable from drop heights of 0.20 m and 0.30 m only. Similarly, the PF (absolute and relative) and kinetic and kinematic variables were estimated to be reliable from 0.20 m, 0.30 m and 0.60 m drop heights only.
The JH and RSI findings are in agreement with previous research, where they were found to be reliable across drop heights ranging from 0.20 m to 0.50 m in athletic populations [8,17,31]. Conversely, the GCT finding is conflicting with the previous literature, as GCT has also been found to be reliable across the same range of drop heights [8,17,32]. However, in this study, the GCT variable only achieved the required criteria to be considered reliable from drop heights of 0.20 m and 0.30 m. The authors suggest that the lack of reliability in the GCT variable from 0.40 m, 0.50 m and 0.60 m drop heights may be due to the subjects’ training experience. Although all subjects in this study had a minimum of 1 year of plyometric training experience, they may have been unfamiliar with the DJ exercise, leading to the low ICC reliability of GCT from the highest three drop heights. Another possible explanation for this could be the increase in stretch load in the higher drop heights as greater eccentric demand occurs as a result of the higher drop heights, which could potentially cause the subjects to become overloaded, thus leading to the GCT and LS variables becoming unreliable from 0.40 m to 0.60 m and 0.40 m to 0.50 m drop heights, respectively [33]. The lack of reliability of the PF (absolute and relative) and LS variables from the 0.40 m and 0.50 m drop heights may be caused by differences in jump strategy between trials. Significant differences have been shown in RSI, GCT, JH and take-off time when using two different jump strategies [34]. Hence, it is possible that an altered jump strategy, along with the unfamiliarity of the subjects with the DJ exercise, may lead to low reliability in PF and LS from specific drop heights [32]. An altered jump strategy may also explain the significant difference observed between trials for the E-RFD (absolute and relative) variables from a 0.30 m drop height. These variables should be interpreted with caution due to low reliability levels.
When comparing the TE to the SWC (0.2), performance variables were found to be ‘marginal’ to ‘okay’ at detecting a small change in JH, GCT and RSI from all drop heights. However, all variables were deemed ‘good’ at detecting a moderate change (SWC [0.5]) in performance from the same five drop heights. This finding suggests that the DJ test may not be an appropriate daily monitoring tool for this population due to its inability to detect SWC. However, the usefulness of a performance test may depend on the familiarity of the subjects with the testing protocol, and the TE may be reduced as a result [35]. This could result in making the DJ test more sensitive to detecting the SWC and, hence, making it a more appropriate athlete monitoring tool due to its more consistent results in performance test trials [35].
The Inter-day results show that all performance variables (JH, GCT and RSI) were estimated to be reliable from all five drop heights, as they achieved the desired reliability criteria of ICC > 0.70 and CV% < 15% (Table 5). Similarly, all kinetic and kinematic variables were estimated to be reliable based on the same criteria, except for relative PF from 0.40 m and 0.60 m drop heights, E-RFD (absolute and relative) from 0.30 m and 0.40 m drop heights and LS from a 0.60 m drop height (Table 6).
The results of the performance variables are in agreement with the previous literature, where JH, GCT and RSI were deemed reliable inter-day from a range of drop heights (from 0.30 m to 0.60 m) in hurling players [32]. Similarly, high levels of reliability have been reported in elite-level rugby players for all performance variables from a standardized 0.40 m drop height inter-day [18]. Therefore, DJ performance variables are reliable and can be used by practitioners for performance testing or training reasons. Similarly, the kinetic and kinematic variables of PV, absolute PF and PP (absolute and relative) also met the reliability criteria set from all five drop heights. Relative PF (0.20 m, 0.30 m and 0.50 m), E-RFD (absolute and relative) (0.20 m, 0.50 m and 0.60 m) and LS (0.20 m, 0.30 m, 0.40 m and 0.50 m) also met the reliability criteria for these specific drop heights. The lack of reliability of these kinetic and kinematic variables from specified drop heights may be due to athlete motivation. Athlete motivation may have been altered by either individual or team performance levels over the course of the in-season period. This may have had an effect on the intra-day reliability of these variables due to the ~14–18-day time period between the first and last testing sessions. Altered levels of motivation throughout this period may have influenced the subjects’ performance during a testing session, thus influencing the inter-day reliability of certain DJ variables. Hence, these variables should be interpreted with caution for the specific drop heights due to low reliability levels.
The usefulness of inter-day reliability statistics follows similar trends to intra-day, where most variables are unable to detect the SWC, hence making them not useful as weekly monitoring tools. The GCT variable was rated as ‘good’ at detecting the SWC. However, the TE for GCT from all five drop heights was zero. This was because the mean square error (MSE) used to calculate the TE from the one-way repeated measures ANOVA was reported to three decimal places, thus giving a value of zero for MSE, which consequently provided a TE of zero. Hence, the usefulness of GCT at detecting the SWC inter-day is still unknown.
A limitation of this study was that it took place during the players’ in-season period. Although subjects were asked to abstain from vigorous exercise in the 48 h prior to testing sessions, it is unknown if the subjects adhered to this instruction. It is also possible that accumulation of fatigue occurred due to in-season training demands and match scheduling, which could decrease jump performance up to 72 h later, thus potentially influencing the results of this study [36]. Future research could aim to estimate the reliability of performance, kinetic and kinematic variables during countermovement and DJ performance in hurling players in a well-rested state from their previous training session or competition. This could be conducted by measuring psychobiological markers or performance outcomes, such as CMJ height, isometric force or RFD.
All variables met reliability criteria intra-day except for GCT (0.40 m, 0.50 m and 0.60 m), PF (absolute and relative; 0.40 m and 0.50 m) and LS (0.40 m and 0.50 m) from those specific drop heights. In terms of usefulness, all intra-day variables were rated ‘marginal’ to ‘okay’ at detecting a small change and ‘good’ at detecting a moderate change. Similarly, all variables achieved the required criteria inter-day except for the relative PF (0.40 m and 0.60 m), E-RFD (absolute and relative; 0.30 m and 0.40 m) and LS (0.60 m) from these specific drop heights. In terms of usefulness, all inter-day variables were rated ‘marginal’ to ‘okay’ at detecting a small change, except for GCT, which was rated ‘good’. The relative peak force and leg stiffness variables rated were ‘marginal’ at detecting a moderate change. JH, GCT, PV and peak power (absolute) were rated ‘good’ at detecting a moderate change, and RSI, peak force (absolute), peak power (relative) and E-RFD (absolute and relative) were rated ‘marginal’ to ‘good’ at detecting a moderate change. In conclusion, practitioners have multiple reliable performance, kinetic and kinematic DJ measures for performance testing and training purposes. These variables could also provide the mechanisms underpinning SSC changes in relation to jumping and sprinting in club-level hurling players.

5. Conclusions

This study has outlined a multitude of reliable performance, kinetic and kinematic variables during DJ performance across a range of drop heights (0.20 m–0.60 m), both for intra-day and inter-day. Practitioners may wish to record and analyze specific variables for training, testing and monitoring purposes. The authors suggest that the drop height used should be selected based on the reliability of the variables of interest from that specific drop height. Based upon the reliability criteria and significant differences between trials, the author suggests the use of a 0.20 m or 0.30 m drop height intra-day, as well as a 0.20 m or 0.50 m drop height inter-day for hurling players, assuming all variables used in this study are of interest to the practitioner. The author also suggests familiarising athletes with DJ procedures in at least two familiarisation sessions before using a DJ for monitoring purposes, as athlete familiarisation may reduce the TE in each repetition, making it more useful as a monitoring tool, as it may be able to detect the SWC in each variable [35].

Author Contributions

Conceptualisation, L.A. and P.J.B.; methodology, L.A., C.C. and P.J.B.; software, L.A.; validation, L.A., C.C., J.M. and P.J.B.; formal analysis, L.A.; investigation, L.A.; resources, P.J.B.; data curation, L.A.; writing—original draft preparation, L.A.; writing—review and editing, C.C., J.M., R.R.-C. and P.J.B.; visualisation, L.A.; supervision, C.C., J.M. and P.J.B.; project administration, P.J.B. All authors have read and agreed to the published version of the manuscript.

Funding

This research received no external funding.

Institutional Review Board Statement

This study was conducted in accordance with the Declaration of Helsinki and approved by the Institutional Ethics Committee of Institute of Technology Carlow, Ireland (Application number 280 and date of approval: 27 November 2020).

Informed Consent Statement

Informed consent was obtained from all subjects involved in the study.

Data Availability Statement

Data from this study are available from the corresponding author.

Acknowledgments

The authors thank the hurling players that volunteered to participate in this study.

Conflicts of Interest

The authors declare no conflicts of interest.

References

  1. Mullane, M.; Turner, A.; Bishop, C.J. Strength and conditioning considerations for hurling: An amateur Gaelic Games sport. Strength Cond. J. 2018, 40, 72–84. [Google Scholar] [CrossRef]
  2. Reilly, T.; Collins, K. Science and the Gaelic sports: Gaelic football and hurling. Eur. J. Sport Sci. 2008, 8, 231–240. [Google Scholar] [CrossRef]
  3. Collins, D.K.; McRobert, A.; Morton, J.P.; O’Sullivan, D.; Doran, D.A. The work-rate of elite hurling match-play. J. Strength Cond. Res. 2018, 32, 805–811. [Google Scholar] [CrossRef]
  4. Jarvis, P.; Turner, A.; Read, P.; Bishop, C. Reactive strength index and its associations to measures of physical and sports performance: A systematic review with meta-analysis. Sports Med. 2022, 52, 301–330. [Google Scholar] [CrossRef]
  5. Dello Iacono, A.; Martone, D.; Milic, M.; Padulo, J. Vertical- vs. horizontal-oriented drop jump training: Chronic effects on explosive performances of elite handball players. J. Strength Cond. Res. 2017, 31, 921–931. [Google Scholar] [CrossRef]
  6. Matavulj, D.; Kukolj, M.; Ugarkovic, D.; Tihanyi, J.; Jaric, S. Effects of plyometric training on jumping performance in junior basketball players. J. Sports Med. Phys. Fitness 2001, 41, 159–164. [Google Scholar]
  7. Young, W.; James, R.; Montgomery, I. Is muscle power related to running speed with changes of direction? J. Sports Med. Phys. Fitness 2002, 42, 282–288. [Google Scholar]
  8. Flanagan, E.P.; Ebben, W.P.; Jensen, R.L. Reliability of the reactive strength index and time to stabilization during depth jumps. J. Strength Cond. Res. 2008, 22, 1677–1682. [Google Scholar] [CrossRef]
  9. Byrne, P.J.; Moody, J.A.; Cooper, S.-M.; Farrell, E.; Kinsella, S. Short-term effects of “composite” training on strength, jump, and sprint performance in hurling players. J. Strength Cond. Res. 2022, 36, 2253–2261. [Google Scholar] [CrossRef]
  10. Byrne, P.J.; Kenny, J.; O’ Rourke, B. Acute potentiating effect of depth jumps on sprint performance. J. Strength Cond. Res. 2014, 28, 610–615. [Google Scholar] [CrossRef]
  11. Hewett, T.E.; Stroupe, A.L.; Nance, T.A.; Noyes, F.R. Plyometric training in female athletes. Decreased impact forces and increased hamstring torques. Am. J. Sports Med. 1996, 24, 765–773. [Google Scholar] [CrossRef]
  12. Kyröläinen, H.; Avela, J.; McBride, J.M.; Koskinen, S.; Andersen, J.L.; Sipilä, S.; Takala, T.E.S.; Komi, P.V. Effects of power training on muscle structure and neuromuscular performance. Scand. J. Med. Sci. Sports 2005, 15, 58–64. [Google Scholar] [CrossRef]
  13. Luebbers, P.E.; Potteiger, J.A.; Hulver, M.W.; Thyfault, J.P.; Carper, M.J.; Lockwood, R.H. Effects of plyometric training and recovery on vertical jump performance and anaerobic power. J. Strength Cond. Res. 2003, 17, 704–709. [Google Scholar]
  14. Masamoto, N.; Larson, R.; Gates, T.; Faigenbaum, A. Acute effects of plyometric exercise on maximum squat performance in male athletes. J. Strength Cond. Res. 2003, 17, 68–71. [Google Scholar]
  15. Miller, M.G.; Herniman, J.J.; Ricard, M.D.; Cheatham, C.C.; Michael, T.J. The effects of a 6-week plyometric training program on agility. J. Sports Sci. Med. 2006, 5, 459–465. [Google Scholar]
  16. Walsh, M.; Arampatzis, A.; Schade, F.; Brüggemann, G.-P. The effect of drop jump starting height and contact time on power, work performed, and moment of force. J. Strength Cond. Res. 2004, 18, 561–566. [Google Scholar]
  17. Markwick, W.; Bird, S.; Tufano, J.; Seitz, L.; Haff, G. The intraday reliability of the reactive strength index (RSI) calculated from a drop jump in professional men’s basketball. Int. J. Sports Physiol. Perform. 2014, 10, 482–488. [Google Scholar] [CrossRef]
  18. Beattie, K.; Flanagan, E. Establishing the reliability & meaningful change of the drop-jump reactive-strength index. J. Aust. Strength Cond. 2015, 23, 12–18. [Google Scholar]
  19. Cronin, J.B.; Hing, R.D.; McNair, P.J. Reliability and validity of a linear position transducer for measuring jump performance. J. Strength Cond. Res. 2004, 18, 590–593. [Google Scholar]
  20. Haynes, T.; Bishop, C.; Antrobus, M.; Brazier, J. The validity and reliability of the My jump 2 app for measuring the reactive strength index and drop jump performance. J. Sports Med. Phys. Fitness 2019, 59, 253–258. [Google Scholar] [CrossRef]
  21. Turki, O.; Chaouachi, A.; Behm, D.G.; Chtara, H.; Chtara, M.; Bishop, D.; Chamari, K.; Amri, M. The effect of warm-ups incorporating different volumes of dynamic stretching on 10- and 20-m sprint performance in highly trained male athletes. J. Strength Cond. Res. 2012, 26, 63–72. [Google Scholar] [CrossRef]
  22. Read, M.M.; Cisar, C. The influence of varied rest interval lengths on depth jump performance. J. Strength Cond. Res. 2001, 15, 279–283. [Google Scholar]
  23. Bosco, C.; Luhtanen, P.; Komi, P.V. A simple method for measurement of mechanical power in jumping. Eur. J. Appl. Physiol. Occup. Physiol. 1983, 50, 273–282. [Google Scholar] [CrossRef]
  24. Merrigan, J.J.; Stone, J.D.; Galster, S.M.; Hagen, J.A. Analyzing force-time curves: Comparison of commercially available automated software and custom MATLAB analyses. J. Strength Cond. Res. 2022, 36, 2387–2402. [Google Scholar] [CrossRef]
  25. Comyns, T.M.; Harrison, A.J.; Hennessy, L.K. An investigation into the recovery process of a maximum stretch-shortening cycle fatigue protocol on drop and rebound jumps. J. Strength Cond. Res. 2011, 25, 2177–2184. [Google Scholar] [CrossRef]
  26. Shrout, P.E.; Fleiss, J.L. Intraclass correlations: Uses in assessing rater reliability. Psychol. Bull. 1979, 86, 420–428. [Google Scholar] [CrossRef]
  27. DeVellis, R.F. Scale Development: Theory and Applications; SAGE Publications: Southend Oaks, CA, USA, 2016. [Google Scholar]
  28. Stokes, M. Reliability and Repeatability of Methods for Measuring Muscle in Physiotherapy. Physiother. Pract. 1985, 1, 71–76. [Google Scholar] [CrossRef]
  29. Weir, J.P.; Vincent, W.J. Statistics in Kinesiology; Human Kinetics: Champaign, IL, USA, 2020. [Google Scholar]
  30. Byrne, P.J.; Moody, J.A.; Cooper, S.-M.; Kinsella, S. The reliability of countermovement jump performance and the reactive strength index in identifying drop-jump drop height in hurling Players. OAJ Exerc. Sports Med. 2017, 1, 004. [Google Scholar]
  31. Hopkins, W.G. Measures of reliability in sports medicine and science. Sports Med. 2000, 30, 1–15. [Google Scholar] [CrossRef]
  32. Byrne, D.; Browne, D.; Byrne, P.; Richardson, N. The inter-day reliability of reactive strength index and optimal drop height. J. Strength Cond. Res. 2016, 31, 721–726. [Google Scholar] [CrossRef]
  33. Bishop, C.; Turner, A.; Jordan, M.; Harry, J.; Loturco, I.; Lake, J.; Comfort, P. A framework to guide practitioners for selecting metrics during the countermovement and drop jump tests. Strength. Cond. J. 2022, 44, 95–103. [Google Scholar] [CrossRef]
  34. Struzik, A.; Juras, G.; Pietraszewski, B.; Rokita, A. Effect of drop jump technique on the reactive strength index. J. Hum. Kinet. 2016, 52, 157–164. [Google Scholar] [CrossRef]
  35. Comyns, T.; Flanagan, E.; Fleming, S.; Fitzgerald, E.; Harper, D. Inter-day reliability and usefulness of reactive strength index derived from two maximal rebound jump tests. Int. J. Sports Physiol. Perform. 2019, 14, 1–17. [Google Scholar] [CrossRef]
  36. Nedelec, M.; McCall, A.; Carling, C.; Legall, F.; Berthoin, S.; Dupont, G. The influence of soccer playing actions on the recovery kinetics after a soccer match. J. Strength Cond. Res. 2014, 28, 1517–1523. [Google Scholar] [CrossRef]
Figure 1. The game of hurling in action.
Biomechanics 04 00001 g001
Figure 2. Schematic diagram of the study design.
Biomechanics 04 00001 g002
Table 1. Means and SDs for the performance variables and absolute and relative forces across the five drop heights for the three testing days.
Drop HeightDay 1 Day 2 Day 3
Jump Height (cm)
0.2 m28.66 ± 5.9728.69 ± 6.3128.73 ± 6.56
0.3 m29.42 ± 5.5829.29 ± 5.7829.37 ± 6.56
0.4 m29.99 ± 6.3129.95 ± 5.0930.08 ± 6.25
0.5 m28.95 ± 6.4229.29 ± 5.4329.71 ± 6.37
0.6 m29.51 ± 5.8329.11 ± 6.4029.28 ± 6.06
Ground Contact Time (s)
0.2 m0.189 ± 0.0240.190 ± 0.0220.189 ± 0.027
0.3 m0.188 ± 0.0180.194 ± 0.0250.186 ± 0.021
0.4 m0.195 ± 0.0180.196 ± 0.0230.193 ± 0.024
0.5 m0.198 ± 0.0220.197 ± 0.0210.195 ± 0.022
0.6 m0.203 ± 0.0140.199 ± 0.0210.197 ± 0.019
Reactive Strength Index (ms−1)
0.2 m1.50 ± 0.311.50 ± 0.401.49 ± 0.42
0.3 m1.54 ± 0.311.51 ± 0.401.60 ± 0.46
0.4 m1.48 ± 0.271.50 ± 0.311.56 ± 0.38
0.5 m1.43 ± 0.351.48 ± 0.331.49 ± 0.33
0.6 m1.44 ± 0.311.47 ± 0.371.47 ± 0.33
Absolute Peak Force (N)
0.2 m4251 ± 7504106 ± 6324155 ± 631
0.3 m4508 ± 6934325 ± 7064477 ± 874
0.4 m4546 ± 7634600 ± 7854578 ± 920
0.5 m4685 ± 11954723 ± 10254691 ± 812
0.6 m4860 ± 12805224 ± 13434938 ± 1115
Relative Peak Force (N/kg)
0.2 m54.02 ± 8.0752.35 ± 5.6352.85 ± 5.87
0.3 m57.24 ± 6.5755.40 ± 8.2656.92 ± 9.20
0.4 m57.67 ± 6.9758.92 ± 10.0158.26 ± 10.44
0.5 m59.29 ± 12.0960.56 ± 13.1259.90 ± 10.35
0.6 m61.10 ± 11.7966.75 ± 16.6463.46 ± 15.83
Table 2. Means and SDs for peak velocity, power, eccentric rate of force development and leg stiffness across the five drop heights for the three testing days.
Drop HeightDay 1Day 2Day 3
Peak Velocity (m/s)
0.2 m2.46 ± 0.232.46 ± 0.252.46 ± 0.26
0.3 m2.62 ± 0.312.49 ± 0.222.50 ± 0.24
0.4 m2.52 ± 0.232.54 ± 0.232.51 ± 0.23
0.5 m2.48 ± 0.252.50 ± 0.372.50 ± 0.24
0.6 m2.50 ± 0.222.34 ± 0.602.49 ± 0.23
Absolute Peak Power (W)
0.2 m10,487 ± 180410,224 ± 182710,297 ± 1914
0.3 m12,109 ± 171711,792 ± 178311,957 ± 2257
0.4 m13,557 ± 162413,512 ± 147013,419 ± 2283
0.5 m13,850 ± 204313,779 ± 166113,689 ± 2166
0.6 m15,044 ± 215015,031 ± 195515,106 ± 2081
Relative Peak Power (W/kg)
0.2 m133.21 ± 18.05130.19 ± 17.14130.55 ± 18.76
0.3 m152.31 ± 16.08150.68 ± 18.30152.02 ± 23.16
0.4 m172.69 ± 16.12172.94 ± 13.78170.81 ± 23.35
0.5 m175.76 ± 20.00176.35 ± 17.44176.35 ± 19.68
0.6 m191.55 ± 21.66192.78 ± 24.08192.76 ± 22.76
Absolute Eccentric Rate of Force Development (N/s)
0.2 m54,985 ± 20,90451,212 ± 20,58554,790 ± 22,884
0.3 m62,120 ± 23,93556,961 ± 23,60564,233 ± 26,570
0.4 m68,711 ± 23,70067,287 ± 26,44168,901 ± 25,178
0.5 m79,915 ± 28,21974,380 ± 26,64275,501 ± 25,057
0.6 m98,559 ± 24,81299,145 ± 31,873100,509 ± 25,501
Relative Eccentric Rate of Force Development (N/kg)
0.2 m702 ± 279654 ± 256698 ± 300
0.3 m789 ± 296738 ± 314816 ± 328
0.4 m878 ± 310877 ± 389889 ± 349
0.5 m1019 ± 350963 ± 369968 ± 352
0.6 m1260 ± 3241283 ± 4471286 ± 333
Leg Stiffness (N/m)
0.2 m47,932 ± 15,46846,719 ± 16,11948,371 ± 16,417
0.3 m41,674 ± 11,03739,104 ± 15,38144,570 ± 14,661
0.4 m33,560 ± 851134,378 ± 10,54435,479 ± 11,913
0.5 m33,048 ± 11,41133,946 ± 11,92333,933 ± 9936
0.6 m29,866 ± 905634,004 ± 11,86631,982 ± 10,187
Table 3. Intra-day reliability and usefulness statistics (ICC, CV%, TE, SWC (0.2) and SWC (0.5) and ratings) for all performance measures across all 5 drop heights across all 3 days.
Drop HeightICCCV%TESWC (0.2)RatingSWC (0.5)Rating
Jump Height (m)
0.2 m0.982.290.410.34Marginal0.84Good
0.3 m0.962.80.470.39Marginal0.98Good
0.4 m0.933.970.740.61Marginal1.53Good
0.5 m 0.934.560.740.61Marginal1.52Good
0.6 m0.972.590.420.35Marginal0.87Good
Ground Contact Time (s)
0.2 m0.893.370.0040.003Marginal0.008Good
0.3 m0.843.160.0040.003Marginal0.007Good
0.4 m0.573.670.0060.005Marginal0.011Good
0.5 m 0.654.790.0060.005Marginal0.013Good
0.6 m0.603.640.0050.004Marginal0.009Good
Reactive Strength Index (ms−1)
0.2 m0.965.480.030.03Okay0.06Good
0.3 m0.945.410.030.03Okay0.07Good
0.4 m0.866.890.050.04Marginal0.10Good
0.5 m 0.936.540.040.03Marginal0.09Good
0.6 m0.935.830.040.03Marginal0.08Good
Absolute Peak Force (N)
0.2 m0.923.7393.8777.41Marginal193.52Good
0.3 m0.933.4983.4068.78Marginal171.94Good
0.4 m0.587.43195.14160.91Marginal402.29Good
0.5 m 0.608.25281.74232.33Marginal580.81Good
0.6 m0.915.26162.01133.60Marginal333.99Good
Relative Peak Force (N/kg)
0.2 m0.853.731.271.04Marginal2.61Good
0.3 m0.903.491.070.88Marginal2.21Good
0.4 m0.037.432.522.08Marginal5.19Good
0.5 m 0.428.253.382.79Marginal6.97Good
0.6 m0.845.261.961.62Marginal4.04Good
ICC = intraclass correlation coefficient; CV% = coefficient of variation percentage; TE = typical error; SWC (0.2) = smallest worthwhile change − SD multiplied by 0.2; SWC (0.5) = smallest worthwhile change − SD multiplied by 0.5.
Table 4. Intra-day reliability and usefulness statistics (ICC, CV%, TE, SWC (0.2) and SWC (0.5) and ratings) for all kinetic and kinematic measures across all 5 drop heights across all 3 days.
Drop HeightICCCV%TESWC (0.2)RatingSWC (0.5)Rating
Peak Velocity (m/s)
0.2 m0.971.070.020.01Marginal0.03Good
0.3 m0.951.270.020.02Okay0.04Good
0.4 m0.931.770.030.02Marginal0.06Good
0.5 m0.912.150.030.03Okay0.07Good
0.6 m0.971.160.020.01Marginal0.03Good
Absolute Peak Power (W)
0.2 m0.972.50142117Marginal294.79Good
0.3 m0.962.03159131Marginal329.61Good
0.4 m0.912.49213176Marginal440.99Good
0.5 m0.913.31282233Marginal582.82Good
0.6 m0.933.05256211Marginal528.60Good
Relative Peak Power (W/kg)
0.2 m0.952.501.901.57Marginal3.92Good
0.3 m0.842.582.722.24Marginal5.61Good
0.4 m0.822.482.872.36Marginal5.91Good
0.5 m0.853.193.632.99Marginal7.48Good
0.6 m0.893.053.182.63Marginal6.57Good
Absolute Eccentric Rate of Force Development (N/s)
0.2 m0.9010.0533092729Marginal6823Good
0.3 m0.939.1927462264Marginal5662Good
0.4 m0.909.9334042807Marginal7019Good
0.5 m0.7714.0157584748Marginal11871Good
0.6 m0.729.8654004453Marginal11134Good
Relative Eccentric Rate of Force Development (N/s/kg)
0.2 m0.9810.0544.2236.46Marginal91.16Good
0.3 m0.949.1933.9027.95Marginal69.88Good
0.4 m0.909.9345.6237.62Marginal94.05Good
0.5 m0.8014.0271.5358.99Marginal147.47Good
0.6 m0.779.8666.7955.07Marginal137.68Good
Leg Stiffness (N/m)
0.2 m0.907.9621051736Marginal4340Good
0.3 m0.888.2017551447Marginal3618Good
0.4 m0.3210.4823651950Marginal4876Good
0.5 m0.6811.8326032146Marginal5366Good
0.6 m0.848.0815431272Marginal3181Good
ICC = intraclass correlation coefficient; CV% = coefficient of variation percentage; TE = typical error; SWC (0.2) = smallest worthwhile change − SD multiplied by 0.2; SWC (0.5) = smallest worthwhile change − SD multiplied by 0.5.
Table 5. Inter-day reliability and usefulness statistics (ICC, CV%, TE, SWC (0.2) and SWC (0.5) and ratings) for all performance measures across all 5 drop heights across all 3 days.
Drop Height ICCCV%TESWC (0.2)Rating SWC (0.5)Rating
Jump Height (m)
0.2 m0.946.182.321.23Marginal 3.08Good
0.3 m0.946.032.001.17Marginal 2.93Good
0.4 m0.954.891.451.16Marginal 2.90Good
0.5 m0.936.912.501.20Marginal 2.99Good
0.6 m 0.936.322.671.20Marginal 2.99Good
Ground Contact Time (s)
0.2 m0.904.580.000.005Good0.012Good
0.3 m0.736.030.000.004Good 0.011Good
0.4 m0.824.950.000.004Good 0.011Good
0.5 m0.854.410.000.004Good 0.011Good
0.6 m 0.764.620.000.004Good 0.009Good
Reactive Strength Index (ms−1)
0.2 m0.958.000.020.08Good 0.20Good
0.3 m0.949.570.030.08Good 0.19Good
0.4 m0.929.110.020.06Good0.16Good
0.5 m0.909.400.030.07Good0.17Good
0.6 m 0.948.140.020.07Good0.17Good
ICC = intraclass correlation coefficient; CV% = coefficient of variation percentage; TE = typical error; SWC (0.2) = smallest worthwhile change − SD multiplied by 0.2; SWC (0.5) = smallest worthwhile change − SD multiplied by 0.5.
Table 6. Inter-day reliability and usefulness statistics (ICC, CV%, TE, SWC (0.2) and SWC (0.5) and ratings) for all kinetic and kinematic measures across the 5 drop heights for the 3 days of testing.
Drop Height ICCCV%TESWC (0.2)Rating SWC (0.5)Rating
Peak Velocity (m/s)
0.2 m0.922.830.100.05Marginal 0.12Good
0.3 m0.932.80.080.04Marginal 0.11Good
0.4 m0.932.570.050.05Okay0.11Good
0.5 m0.923.150.100.05Marginal 0.11Good
0.6 m 0.813.20.110.04Marginal 0.11Okay
Absolute Peak Force (N)
0.2 m0.895.46367.18132.62Marginal331.55Marginal
0.3 m0.906.52349.46150.34Marginal375.86Good
0.4 m0.817.84527.10161.97Marginal404.92Marginal
0.5 m0.838.24706.41200.52Marginal501.29Marginal
0.6 m 0.7011.45 969.82247.04Marginal617.60Marginal
Relative Peak Force (N/kg)
0.2 m0.765.444.941.30Marginal3.26Marginal
0.3 m0.836.454.421.59Marginal3.98Marginal
0.4 m0.687.766.461.82Marginal4.55Marginal
0.5 m0.808.238.582.34Marginal5.84Marginal
0.6 m 0.6011.51 12.492.96 Marginal7.39 Marginal
Absolute Peak Power (W)
0.2 m0.964.26720.41363.10Marginal 907.76Good
0.3 m0.954.35782.04380.02Marginal 950.05Good
0.4 m0.934.03802.39358.23Marginal 895.57Good
0.5 m0.943.92854.27386.05Marginal 965.12Good
0.6 m 0.943.99715.56404.55Marginal 1011.38Good
Relative Peak Power (W/kg)
0.2 m0.914.169.963.54Marginal 8.86Marginal
0.3 m0.904.510.643.81Marginal 9.51Marginal
0.4 m0.883.9210.013.57Marginal 8.93Marginal
0.5 m0.923.479.063.74Marginal 9.35Marginal
0.6 m 0.914.059.214.48Marginal 11.20Good
Absolute Eccentric Rate of Force Development (N/s)
0.2 m0.9014.4799194224Marginal 10560Good
0.3 m0.9016.45115324825Marginal 12063Good
0.4 m0.8615.37154264926Marginal 12317Marginal
0.5 m0.8614.14159945248Marginal 13121Marginal
0.6 m 0.8213.24161185406Marginal 13517Marginal
Relative Eccentric Rate of Force Development (N/s/kg)
0.2 m0.9014.68130.3654.95Marginal 137.38Good
0.3 m0.9016.47143.5361.76Marginal 154.40Good
0.4 m0.8815.31193.9368.87Marginal 172.17Marginal
0.5 m0.8914.14187.270.22Marginal 175.55Marginal
0.6 m 0.8513.4206.0873.06Marginal 182.66Marginal
Leg Stiffness (N/m)
0.2 m0.8712.0585483139Marginal 7849Marginal
0.3 m0.8614.0473992746Marginal 6866Marginal
0.4 m0.8512.8458762047Marginal 5118Marginal
0.5 m0.8312.8271402181Marginal 5452Marginal
0.6 m 0.7215.5380212072Marginal 5182Marginal
ICC = intraclass correlation coefficient; CV% = coefficient of variation percentage; TE = typical error; SWC (0.2) = smallest worthwhile change − SD multiplied by 0.2; SWC (0.5) = smallest worthwhile change − SD multiplied by 0.5.
Disclaimer/Publisher’s Note: The statements, opinions and data contained in all publications are solely those of the individual author(s) and contributor(s) and not of MDPI and/or the editor(s). MDPI and/or the editor(s) disclaim responsibility for any injury to people or property resulting from any ideas, methods, instructions or products referred to in the content.

