1. Introduction
A radar satellite survey has considerable potential for identifying quantitative and qualitative forest characteristics since it does not depend on cloudiness, the weather, and illumination. Several studies have demonstrated the possibility of using radar imagery to describe and estimate forest vegetation, in particular the biomass [
1,
2,
3,
4,
5,
6,
7,
8]. Our previous studies concerning the development of forest inventory interpretation methods showed the possibility of determining standing volume, forest density, and canopy closeness from radar satellite images. For an even-aged forest stand, which is formed under intense anthropogenic (forest cuttings) or natural (wildfires) impacts on the forest, it is possible to determine the age and quality of the stand as radar image textural features allow for the identification the forest age class. When forests have high species diversity, to develop forest inventory interpretation algorithms, it is necessary to establish a significant number of sampling plots, taking into account the regional forest features and growing conditions. A vast sampling plots network is essential for verification of various forest inventory methods based on satellite imagery. This research analyzes a dataset from 360 sampling plots; it aims to design and approve methods of forest inventory interpretation using radar survey data. These methods create a fundament for elaborating automated services for processing radar satellite imagery to obtain forest characteristics and further transition to digital, intelligent production technologies in the field of forestry.
2. Materials and Methods
The fieldwork was conducted in the taiga zone of the European part of Russia and Western Siberia, including the territories of Kostroma, Vologda, Arkhangelsk, Nizhny Novgorod, and Tyumen regions, and the Udmurt Republic. We established 360 sampling plots in forest formations of various species compositions, ages, standing volumes, and densities.
The places for laying the sampling plots were determined according to forest inventory materials and an optical survey in two steps. In the first step, forest inventory materials were analyzed to identify differences in standing volume, density, and age. The second step was the analysis of optical survey materials. The territory was classified into forest and non-forest lands according to the NDVI index in the winter imagery. For non-forest lands, the NDVI values vary within 0.08–0.1 and depend on the regional forest features, shrub and trees’ growing rate, and reforestation on clearcut areas. The classification was implemented in Envi 5.2 software applying the decision tree method. Afterwards, a mask of forest lands was created. Settlements, roads, and shelterbelts were excluded from the forest lands. Thus, the territory covered by forest vegetation was revealed.
The determined places for the sampling plots were analyzed with an unsupervised classification algorithm (IsoData) and the territory was estimated on moisture content by the MSI index (moisture stress index) using images from July–August. The moisture content index in vegetation is a crucial indicator of the forest ecosystems’ diversity. In general, the range of the MSI index for forest vegetation is from 0.08 to 0.4. Its value depends on the species composition of forest stands and reaches 0.07–0.08 for medium-aged, ripe and overmature coniferous stands, and more than 0.10 for soft-wooded broadleaved stands.
The design of the methods for obtaining the characteristics of mixed forest stands and their testing were carried out on the basis of Sentinel-1 imagery data aged less than three years from the date of establishing sampling plots. The data were processed with multiple regression algorithms in the Statistica 13 software (StatSoft, Tulsa, Oklahoma, USA).
3. Results
According to data from radar images for the January–February period on the territory of the Western Siberia taiga zone, for pure pine stands, correlation dependences were revealed between standing volume and forest density and the following radar indicators: specific radar cross-section (SRCS) values in gamma-zero on the VV-polarization (GammaVV) and VH-polarization (GammaVH); the sum of the ERCS of objects in the value of gamma-zero on VV- and VH-polarizations (Sum), textural features “total mean” (GLCMMean), which is the cup product of the pixel value and the frequency of its occurrence with the neighboring pixel (GLCMM). The highest correlation coefficients (0.4–0.5) between the observed and predicted values were found for the winter months—January and February. According to the previous studies, for the summer months, the correlation did not exceed 0.2 [
9].
In order to improve the accuracy of determining forests’ characteristics, significant experimental work was performed to refine the analysis methods using various algorithms for suppressing speckle noise. Filtering methods of incoherent accumulation (Multilooking) and Frost were applied; images without filtering were processed as well.
The calculation of the radar indices and the Haralik texture characteristics was implemented for each dataset obtained from three options of amplitude radar image pre-processing (incoherent accumulation, Frost, no filtering). No changes were made to the algorithms for obtaining the characteristics of the radar images.
The data were processed in the open-source SNAP software provided by the European Space Agency. The radar images were processed with Graph Builder and Batch Processing modules that enabled us to make and apply prepared processing algorithms (graphs) with customizable parameters. The calculation of the NRVI radar index was executed in Matlab. For suppressing speckle noise by the incoherent accumulation procedure, materials and graphs from our previous research on taiga forests were used [
10].
Based on the selected radar imagery data, correlations of radar indicators with forest characteristics were calculated. The results obtained from the selected images are compared with the ones developed for all of the radar images for the entire observation period. At the end of the study, we identified whether excluding radar images with unfavorable conditions from analysis affects the correlation coefficient increase.
The first link in the statistical data processing system is the correlation analysis of the relationships between the quantitative and qualitative forest characteristics and the radar survey indicators. Preliminary data analysis allowed us to identify correlating features, which were later used to build relationship models between the standing volume and forest density with radar indicators based on multiple regression models. Correlation analysis showed the weak dependences of standing volume, forest density, the number of trees, age, and species composition on the survey indicators only for the winter months with stable snow cover.
In order to obtain the quantitative and qualitative characteristics of forests according to radar survey data, a single algorithm of multiple factor regression was applied. Relationships between the forest characteristics and the following indicators were found:
specific radar cross-section (SRCS) values in gamma-zero on the VV-polarization (GammaVV);
a radar index representing the ratio of four SRCS objects in gamma-zero at VH-polarization to the sum of SRCS objects in gamma-zero value at VV- and VH-polarizations (RVI);
textural features “total mean” (GLCMMean), which is the cup product of the pixel value and frequency of its occurrence with the neighboring pixel (GLCMM);
the scatter of the mean value of reference and neighboring pixels combinations (GLCMVariance);
the linear connection value of the pixel pairs brightness levels (GLCMCCorrelation).
This approach helped us to select the most appropriate method from the considered options of radar survey data pre-processing by various speckle noise filtering methods.
The efficiency analysis of defining forest inventory indicators based on radar survey data applying various methods of preliminary image processing demonstrated close results (
Table 1). Despite the high correlation coefficients of the observed and predictive features, the significance level for most analysis options is high (
p > 0.05), which can cause forecast errors outside the analyzed statistical pool.
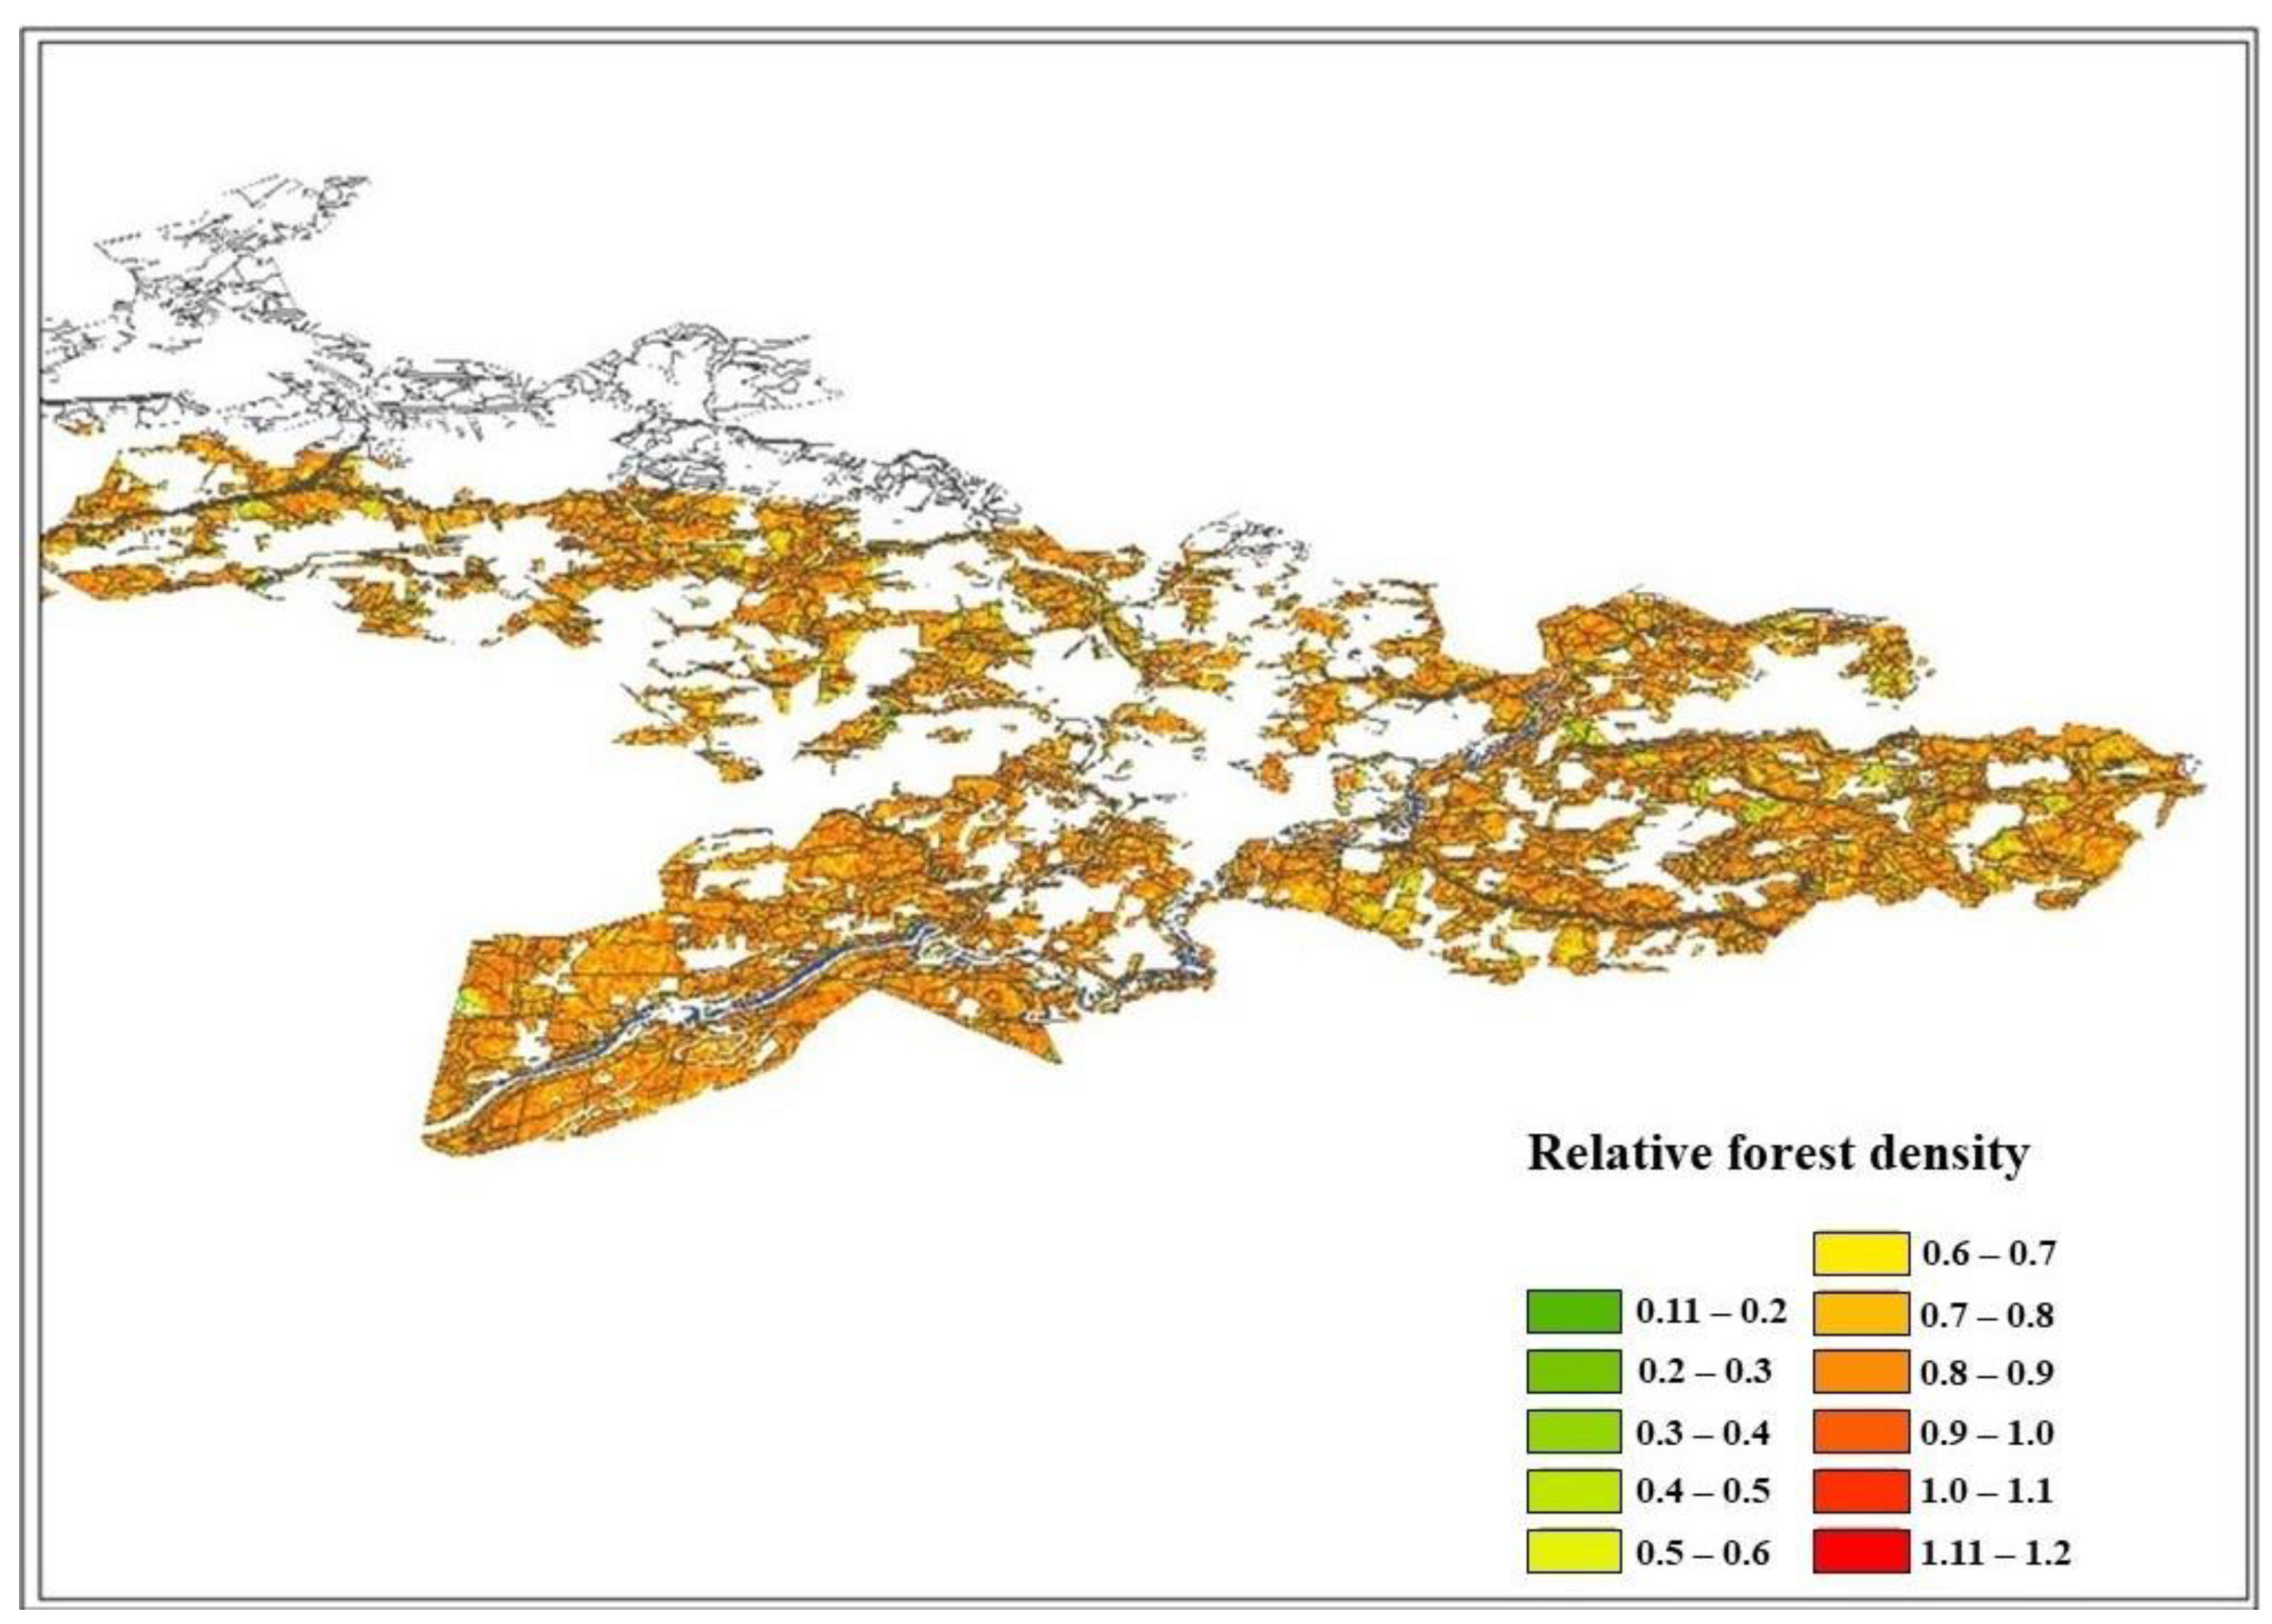
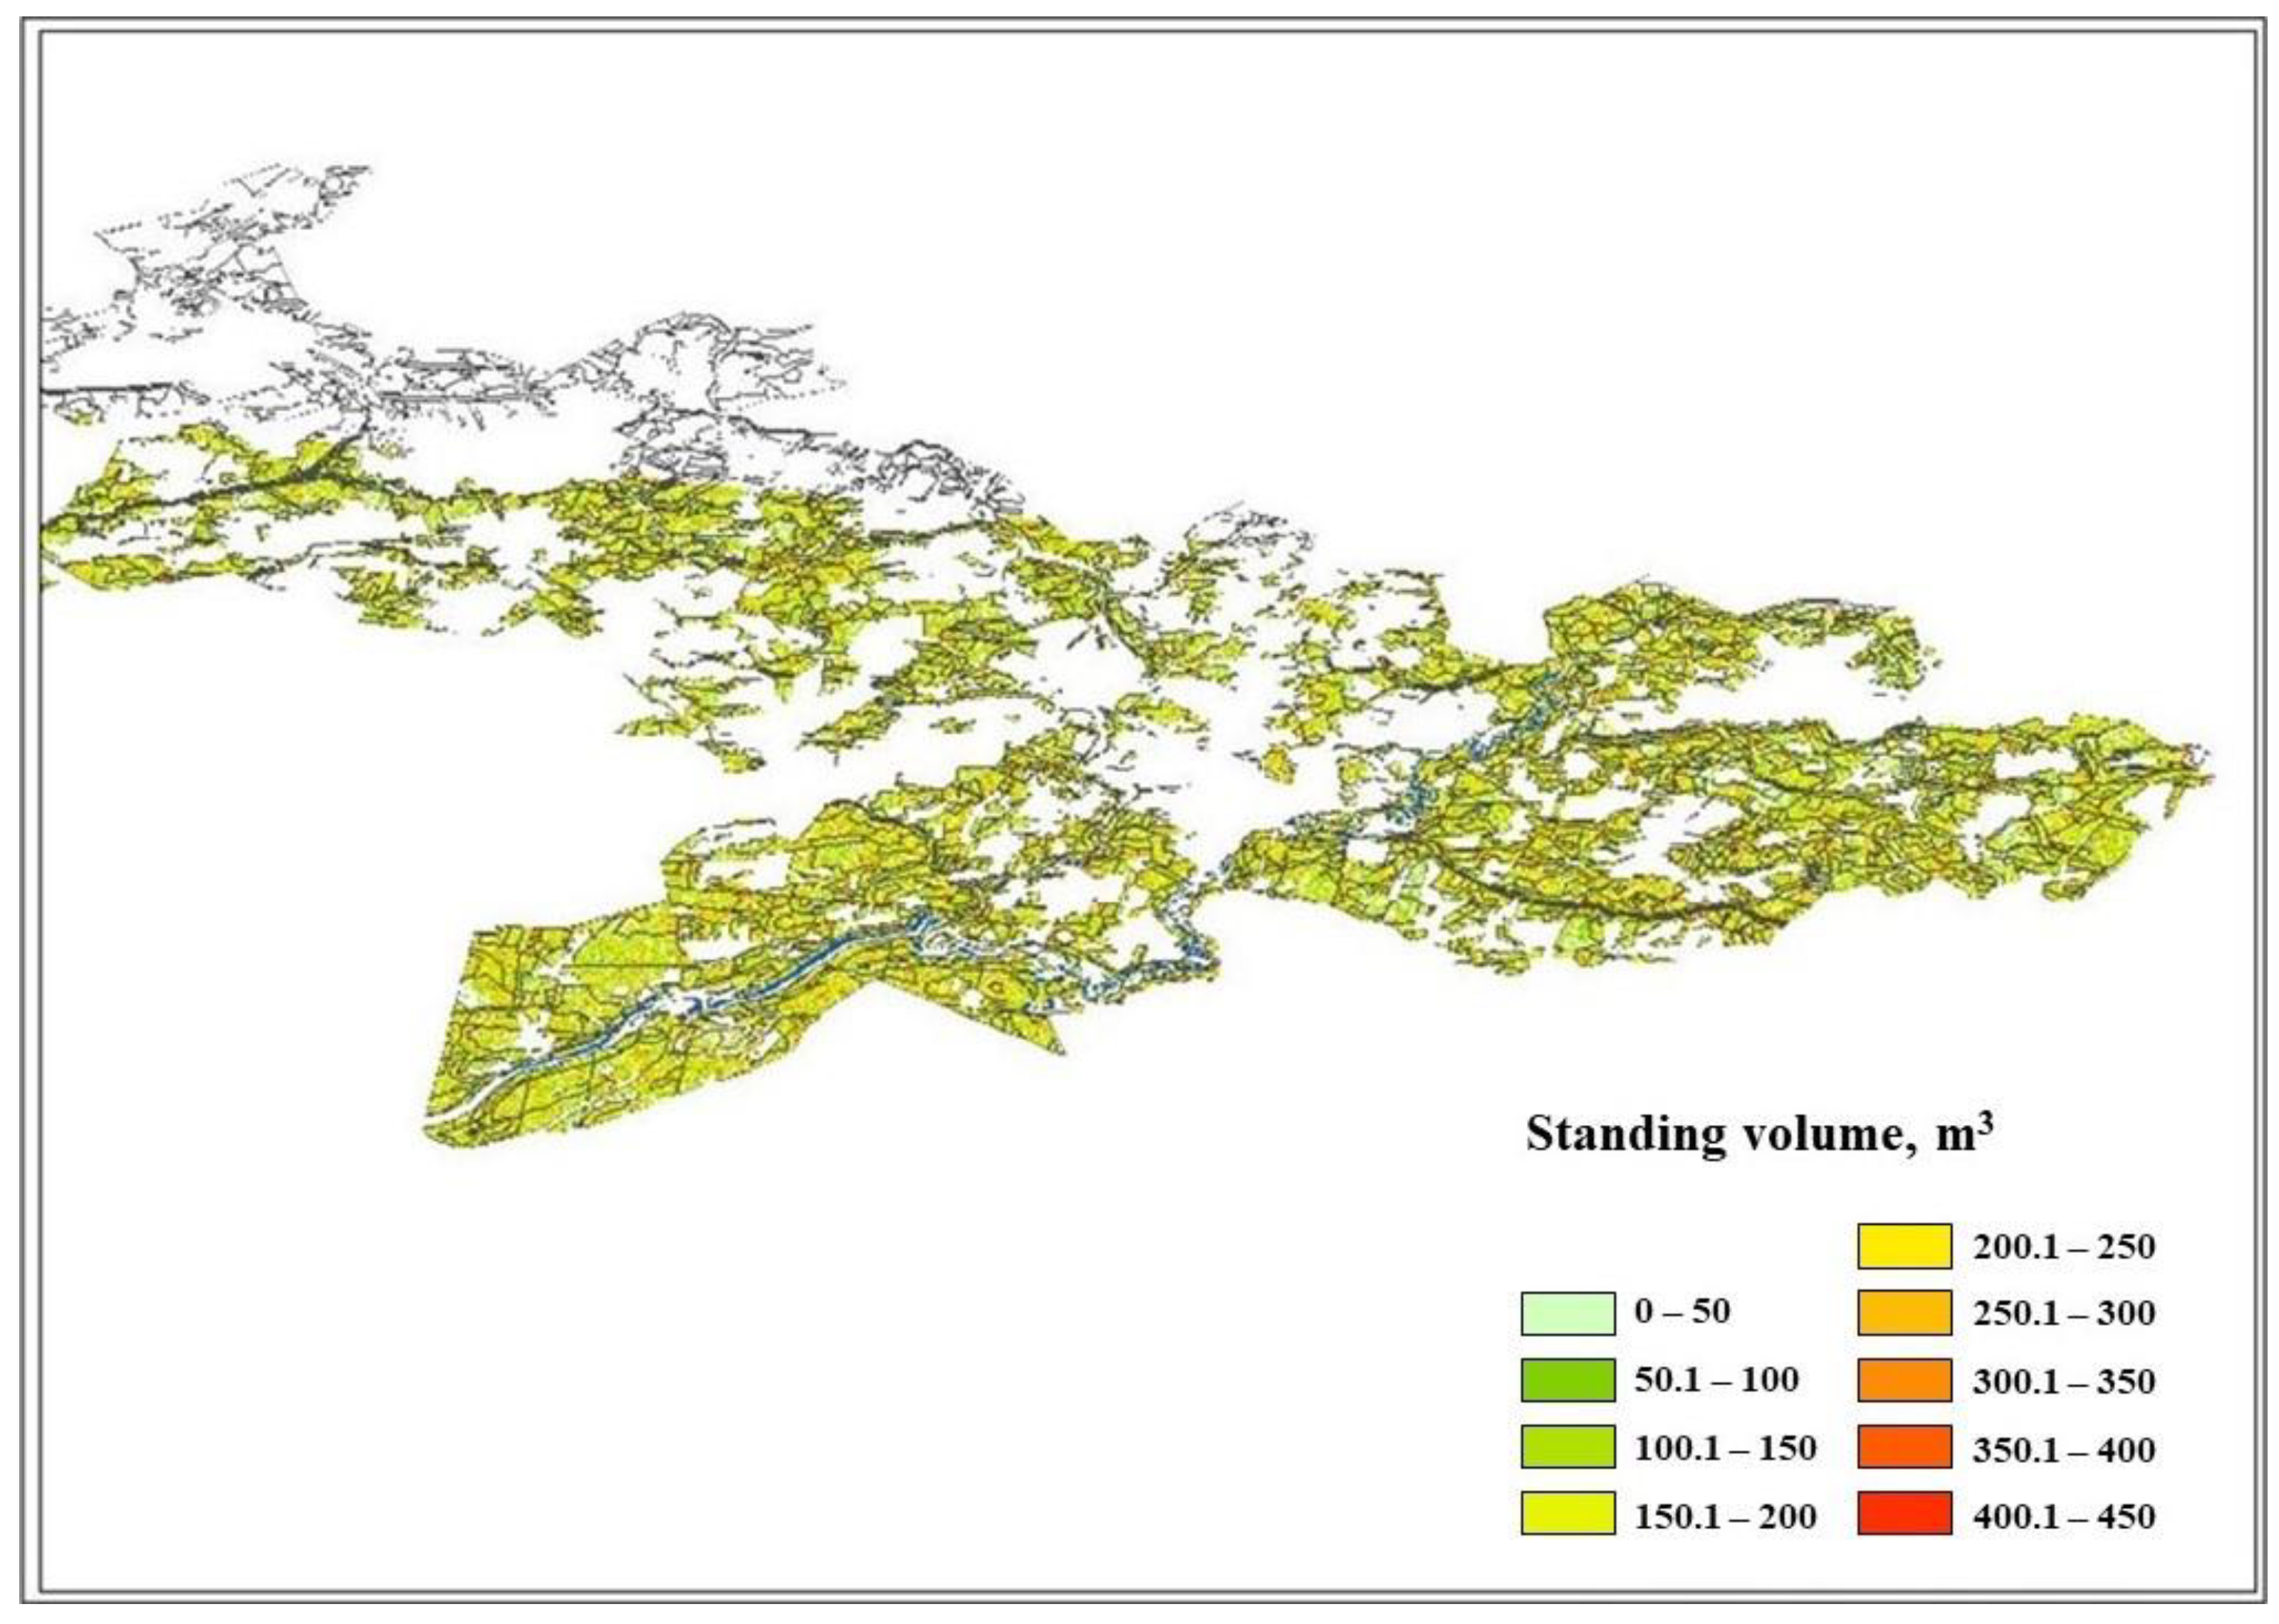
The obtained relationships were tested for the territory of Oktyabrsky forestry in the Kostroma region (
Figure 1 and
Figure 2).
4. Discussion
The study results showed that applying the imagery pre-processing method with the incoherent accumulation provides the most accurate determination of the quantitative forest characteristics. Reliable values of standing volume and forest density can be obtained by models based on multiple regression. The relationships between standing volume, forest density, age, and the number of trees with the following radar indicators were revealed: specific radar cross-section (SRCS) values in gamma-zero on the VV-polarization (GammaVV), VH-polarization (GammaVH); textural features “total mean” (GLCMMean); the scatter of the mean value of reference and neighboring pixels combinations (GLCMVariance); the linear connection value of the pixel pairs brightness levels (GLCMCCorrelation); GammaVH—GammaVV radar index (Diff), and GammaVH + GammaVV radar index (Sum). The results were compared with the forest inventory materials for a part of the study area. For most forest stands, there is a similarity in the definition of standing volume and forest density. The discrepancies may be caused by both the developed models’ errors and the forest inventory data inaccuracy (usually about 20–30%, which is acceptable).
Author Contributions
Conceptualization, V.S. and I.A.; methodology, V.S.; software, V.S.; validation, V.S., D.A. and I.A.; formal analysis, D.A.; investigation, V.S., I.A and D.A.; resources, O.R.; data curation, V.S.; writing—original draft preparation, V.S; writing—review and editing, I.A.; visualization, V.S.; supervision, V.S. All authors have read and agreed to the published version of the manuscript.
Funding
This research received no external funding.
Institutional Review Board Statement
The study did not involve humans or animals.
Informed Consent Statement
Not applicable.
Data Availability Statement
Not applicable.
Conflicts of Interest
The authors declare no conflict of interest.
References
- Hoscilo, A.; Lewadowska, A.; Ziolkowski, D.; Sterenczak, K.; Lisanczuk, M.; Schmullius, C.; Pathe, C. Forest Aboveground Biomass Estimation Using a Combination of Sentinel-1 and Sentinel-2 Data; IGARSS: New York, NY, USA, 2018; pp. 9026–9029. [Google Scholar]
- Kuplish, T.M.; Curran, P.J. Temporal analysis of JERS-1/SAR images over regenerating forests in Brazilian Amazonia. In Proceedings of the IGARSS-99, Hamburg, Germany, 28 June–2 July 1999. [Google Scholar]
- Le Toan, Т.; Beadoin, A.; Riom, J.; Guyon, D. Relating forest biomass to SAR data. IEEE Trans. Geosci. Remote Sens. 1992, 30, 403–411. [Google Scholar] [CrossRef]
- Ulaby, F.T.; El-Rayes, M.A. Microwave dielectric spectrum of vegetation—Part II: Dual-dispersion model. IEEE Trans. Geosci. Remote Sens. 1987, GE-25, 550–557. [Google Scholar] [CrossRef]
- Frost, V.S.; Stiles, J.A.; Shanmugan, K.S.; Holtzman, J.C. A Model for Radar Images and Its Application to Adaptive Digital Filtering of Multiplicative Noise. IEEE Trans. Pattern Anal. Mach. Intell. 1982, 157–166. [Google Scholar] [CrossRef] [PubMed]
- Tsydypov, B.Z.; Kirbizhekova, I.I.; Dorzhiev, B.C.; Ochirov, O.N. Determination of forest biomass using satellite radar data. Bull. Buryat State Agric. Acad. 2010, 3, 79–86. [Google Scholar]
- Zakharov, A.I.; Yakovlev, O.I.; Smirnov, V.M. Satellite Monitoring of the Earth: Radar Sounding of the Surface; KRASAND: Moscow, Russia, 2012; 248p. [Google Scholar]
- Kirbizhekova, I.I.; Chimitdorzhiev, T.N.; Garmaev, A.M.; Gusev, M.A. Application of radar data for mapping the biomass of forest vegetation in conditions of complex terrain. Izv. High. Educ. Inst. Phys. 2013, 56, 201–202. [Google Scholar]
- Sidorenkov, V.M.; Astapov, D.O.; Badak, L.A.; Achikolova, I.S. Possibilities of implementing forest inventory based on radar satellite imagery data on the example of ribbon forests in the Altai Territory. In Modern Problems of Remote Sensing of the Earth from Space; IKI RAN: Moscow, Russia, 2021; p. 329. [Google Scholar]
- Sidorenkov, V.M.; Kushnyr, O.V.; Badak, L.A.; Astapov, D.O.; Bukas, A.V. Possibilities of forest inventory on the basis of radar satellite imagery data. Res. Earth Space 2021, 5, 72–84. [Google Scholar] [CrossRef]
| Publisher’s Note: MDPI stays neutral with regard to jurisdictional claims in published maps and institutional affiliations. |
© 2022 by the authors. Licensee MDPI, Basel, Switzerland. This article is an open access article distributed under the terms and conditions of the Creative Commons Attribution (CC BY) license (https://creativecommons.org/licenses/by/4.0/).


 ,
, 

