Proceeding Paper

Employing a Nondestructive Method for the Estimation of Foliar Area of Quina (Cinchona officinalis) †

by
Andrea Sueldo
1,
Sheyla Chumbimune
2,
Erik Mendoza
2,
Wilian Salazar
2,
Benjamin Minaya
2 and
Carlos I. Arbizu
2,*
1
Facultad de Ciencias Forestales, Universidad Nacional Agraria La Molina. Av. La Molina S/N, Lima 15024, Peru
2
Dirección de Desarrollo Tecnológico Agrario, Instituto Nacional de Innovación Agraria (INIA), Av. La Molina 1981, Lima 15024, Peru
*
Author to whom correspondence should be addressed.
Presented at the 3rd International Electronic Conference on Forests—Exploring New Discoveries and New Directions in Forests, 15–31 October 2022; Available online: https://iecf2022.sciforum.net/.
Environ. Sci. Proc. 2022, 22(1), 63; https://doi.org/10.3390/IECF2022-13051
Published: 15 October 2022

Abstract

:
Leaf area is related to tree growth, water balance, and mechanical resistance to physical and biotic agents. Given its importance, the purpose of the study was to compare two nondestructive methods of leaf area estimation using the free software ImageJ vs. graph paper in seedlings of quina tree. Three young and mature leaves were evaluated on 18 quina seedlings. Descriptive statistics were obtained, and both methods were compared using the Kruskal–Wallis test, and a regression equation was estimated based on leaf width and length.

1. Introduction

Maximum adult tree height, seed volume, wood density, and specific leaf area are essential factors in explaining tree growth and mortality rates. Likewise, wood density and leaf area are related to water balance, mechanical resistance to physical and biotic agents, and tree architecture [1].
Leaf area is the surface where energy and matter are exchanged between the plant and the atmosphere, and it is an essential factor in vegetation structure in agriculture, ecology, and forestry to model tree growth. There are several challenges in leaf area estimation methods to seek efficiency and feasibility [2], as they must be simple, fast, and accurate [3]. In [4], the authors pointed out that leaf area measurements are used to evaluate plant growth, photosynthetic rates, and plant transpiration, constituting an important indicator of productivity.
There are several methods to determine leaf area, which are classified as destructive and nondestructive, as well as direct and indirect methods [5]. The most common leaf area measurement methods are gravimetry, manual planimetry, photoelectric, and graph paper [6]. Measurements are generally performed by direct methods, which involve the destruction of the material [7] through methods and equipment that are time-consuming and not feasible for practice, and there may be inexpensive and fast methods, such as the use of free image processing [8].
The methods in which digital imaging is used can be destructive or nondestructive, and some software packages can be downloaded for free, which can contribute to the development of research projects [9]. There are several studies where the uses of software and other methods have been compared, obtaining favorable results for the use of programs [9,10,11].
Leaf area estimation has also been developed from models based on linear measurements, such as leaf length and width [12]; there are several studies for agronomic species, but there are very few studies for forest species [13]. Linear measurements performed on leaf blades are nondestructive, easy to perform, and repeatable over time, and the high correlation between leaf dimensions makes them appropriate and reliable for estimation procedures [14].
Cinchona officinalis is a species known as “quina tree”, and is represented in the national coat of arms of Peru as a symbol of the plant kingdom. It has cultural, medicinal, environmental–forestry, and economic importance within the country. This species possesses metabolites and alkaloids that have contributed to the treatment of malaria, provides ecosystem services as a hydrobiological and climate regulator, and has a good wood quality for boards and housing construction [15]. Due to its wide range of benefits, its population has been threatened, which caused a reduction in its population and low natural regeneration [16]. It is currently listed as a vulnerable species in the IUCN (International Union for Conservation of Nature) red book [17].
Therefore, the objective of this study was to determine a fast and reliable method to characterize quina seedlings’ leaf area. We employed digital images processed with the ImageJ software and the standard millimeter paper method.

2. Materials and Methods

2.1. Location of the Study

The study was conducted at the La Molina Agricultural Experiment Station of the National Institute for Agrarian Innovation (INIA in Spanish) in Lima, Peru. Measurements were made on 108 plant leaves of 18 seedlings of quina from the Department of Cajamarca.

2.2. Procedure

Leaf area estimation of three young and three mature leaves of each seedling was carried out using two nondestructive methods, the ImageJ software (https://imagej.net/, accessed on 15 August 2022) and an A4 mm paper.

2.2.1. Leaf Area Estimation with the ImageJ Software

The leaves of the seedlings were photographed at an average perpendicular distance of 30 cm with a Canon Rebel EOS T5 digital camera of 18-megapixel resolution, placing the leaf blades on top of an A4 bond sheet. After the photographic work, the images were subjected to width, length, and leaf area measurements using the ImageJ software. Following the methodology used by [9], in which (1) the leaf was photographed with the camera in a horizontal position, the leaf completely flat on the work surface and a reference scale, (2) the image was opened in ImageJ: File > Open, (3) Remove Superfluous Targets: Image > Crop, (4) Set Scale: Analyze > Adjust Scale, (5) Adjust Contrast: Image > Type > 8-Bit Image > Adjust > Threshold, (6) Calculate Area: Analyze > Analyze Particles.

2.2.2. Estimation of Leaf Area in A4 Millimeter Sheets

Leaf area estimation measurements were taken through millimetric sheets, delimiting the contour of the plant leaves on A4 millimetric sheets positioned at the back. The data of width, length, and leaf area taken were stored in an Excel spreadsheet, where they were later analyzed by descriptive statistics and statistical tests.

2.2.3. Comparison of Both Measurement Methods

The Kruskal–Wallis test, a nonparametric statistic where the following hypotheses will be put forward, will be implemented:
H0. 
There is no difference in area measurements between the two methods.
H1. 
There are differences in area measurements between the two methods.
Considering a significance level of 5%, the test statistic:
H = 1 S 2 [ R i 2 n i n ( n + 1 ) 2 4 ] ~   X ( 1 α , k 1 ) 2
where:
  • n: total number of the sample;
  • Ri: sum of the ranks of each sample;
  • ni: number of observations for each sample;
  • k: number of treatments or groups;
  • S2: total variance of the sample.

2.3. Data Analysis

Descriptive statistics were developed using the Minitab 19 program, where the total number of leaves evaluated (N), the arithmetic mean, the standard deviation (SD), and the minimum and maximum values found in young and mature leaves were determined.
The data collected did not meet the criteria of normality and homoscedasticity, so it was decided to perform a nonparametric test, where it was corroborated that there is no significant difference in the use of both methods. Finally, the design of linear and quadratic models was used for the estimation of leaf area, developed from measurements of leaf length and width.

3. Results and Discussion

The total number of leaves evaluated for quina in the present study was 108 (54 young leaves and 54 mature leaves). Measurements of length, width, and leaf area estimation were taken using two methodologies: ImageJ and graph paper.
Table 1 shows leaf dimensions measured by leaf type and method used according to the ImageJ software and the millimeter leaves. We here found the variables of total number (N), mean, standard deviation, minimum, and maximum. We also found that the range of the mean of the leaf area estimation is greater in mature leaves than in young leaves; this may be because it was observed that mature leaves had pests that caused a decrease in leaf area and thus a greater variation in the measurement.
Likewise, it was observed that the mean in relation to its length is out of that established in [18], which mentions that the length of the single leaf varies from 6 to 11 cm, and the width from 3 to 5 cm. This may be due to the seedlings being in different environmental conditions and exposed to different substrates compared with their original habitat.
In relation to the coefficient of variation, in the case of leaf area, it ranged from 65.44 (ImageJ) to 60.67 (graph paper) in young leaves and 38.67 to 38.75 in mature leaves. The highest value was for young leaves; this may be due to the variability of the size of quina leaves in each method. On the other hand, these values were within those found by [9], where he studied the comparison between the LI-COR 3100 and ImageJ methods in oat leaves.
The statistical comparison was performed using a nonparametric test since the data collected are not normally distributed and do not meet the assumption of homoscedasticity through constant variance.
H0. 
There is no difference in area measurements between the two methods.
H1. 
There are differences in area measurements between the two methods.
Under the above hypothesis, using the Kruskal–Wallis test, a p-value = 0.986 was obtained, so we can conclude that sufficient statistical evidence was found to not reject Ho; that is, there are no significant differences in the area measurements between the ImageJ method and the millimeter method. In [19], the authors performed a comparison between a LI-COR 3000 integrator and Macf-IJ and found that the regression analysis (R2) between both methods was 0.999. Additionally, they indicated that Macf-IJ is a fast and accurate method to measure leaf area, dimensions, and color using scanned images and digital photographs.

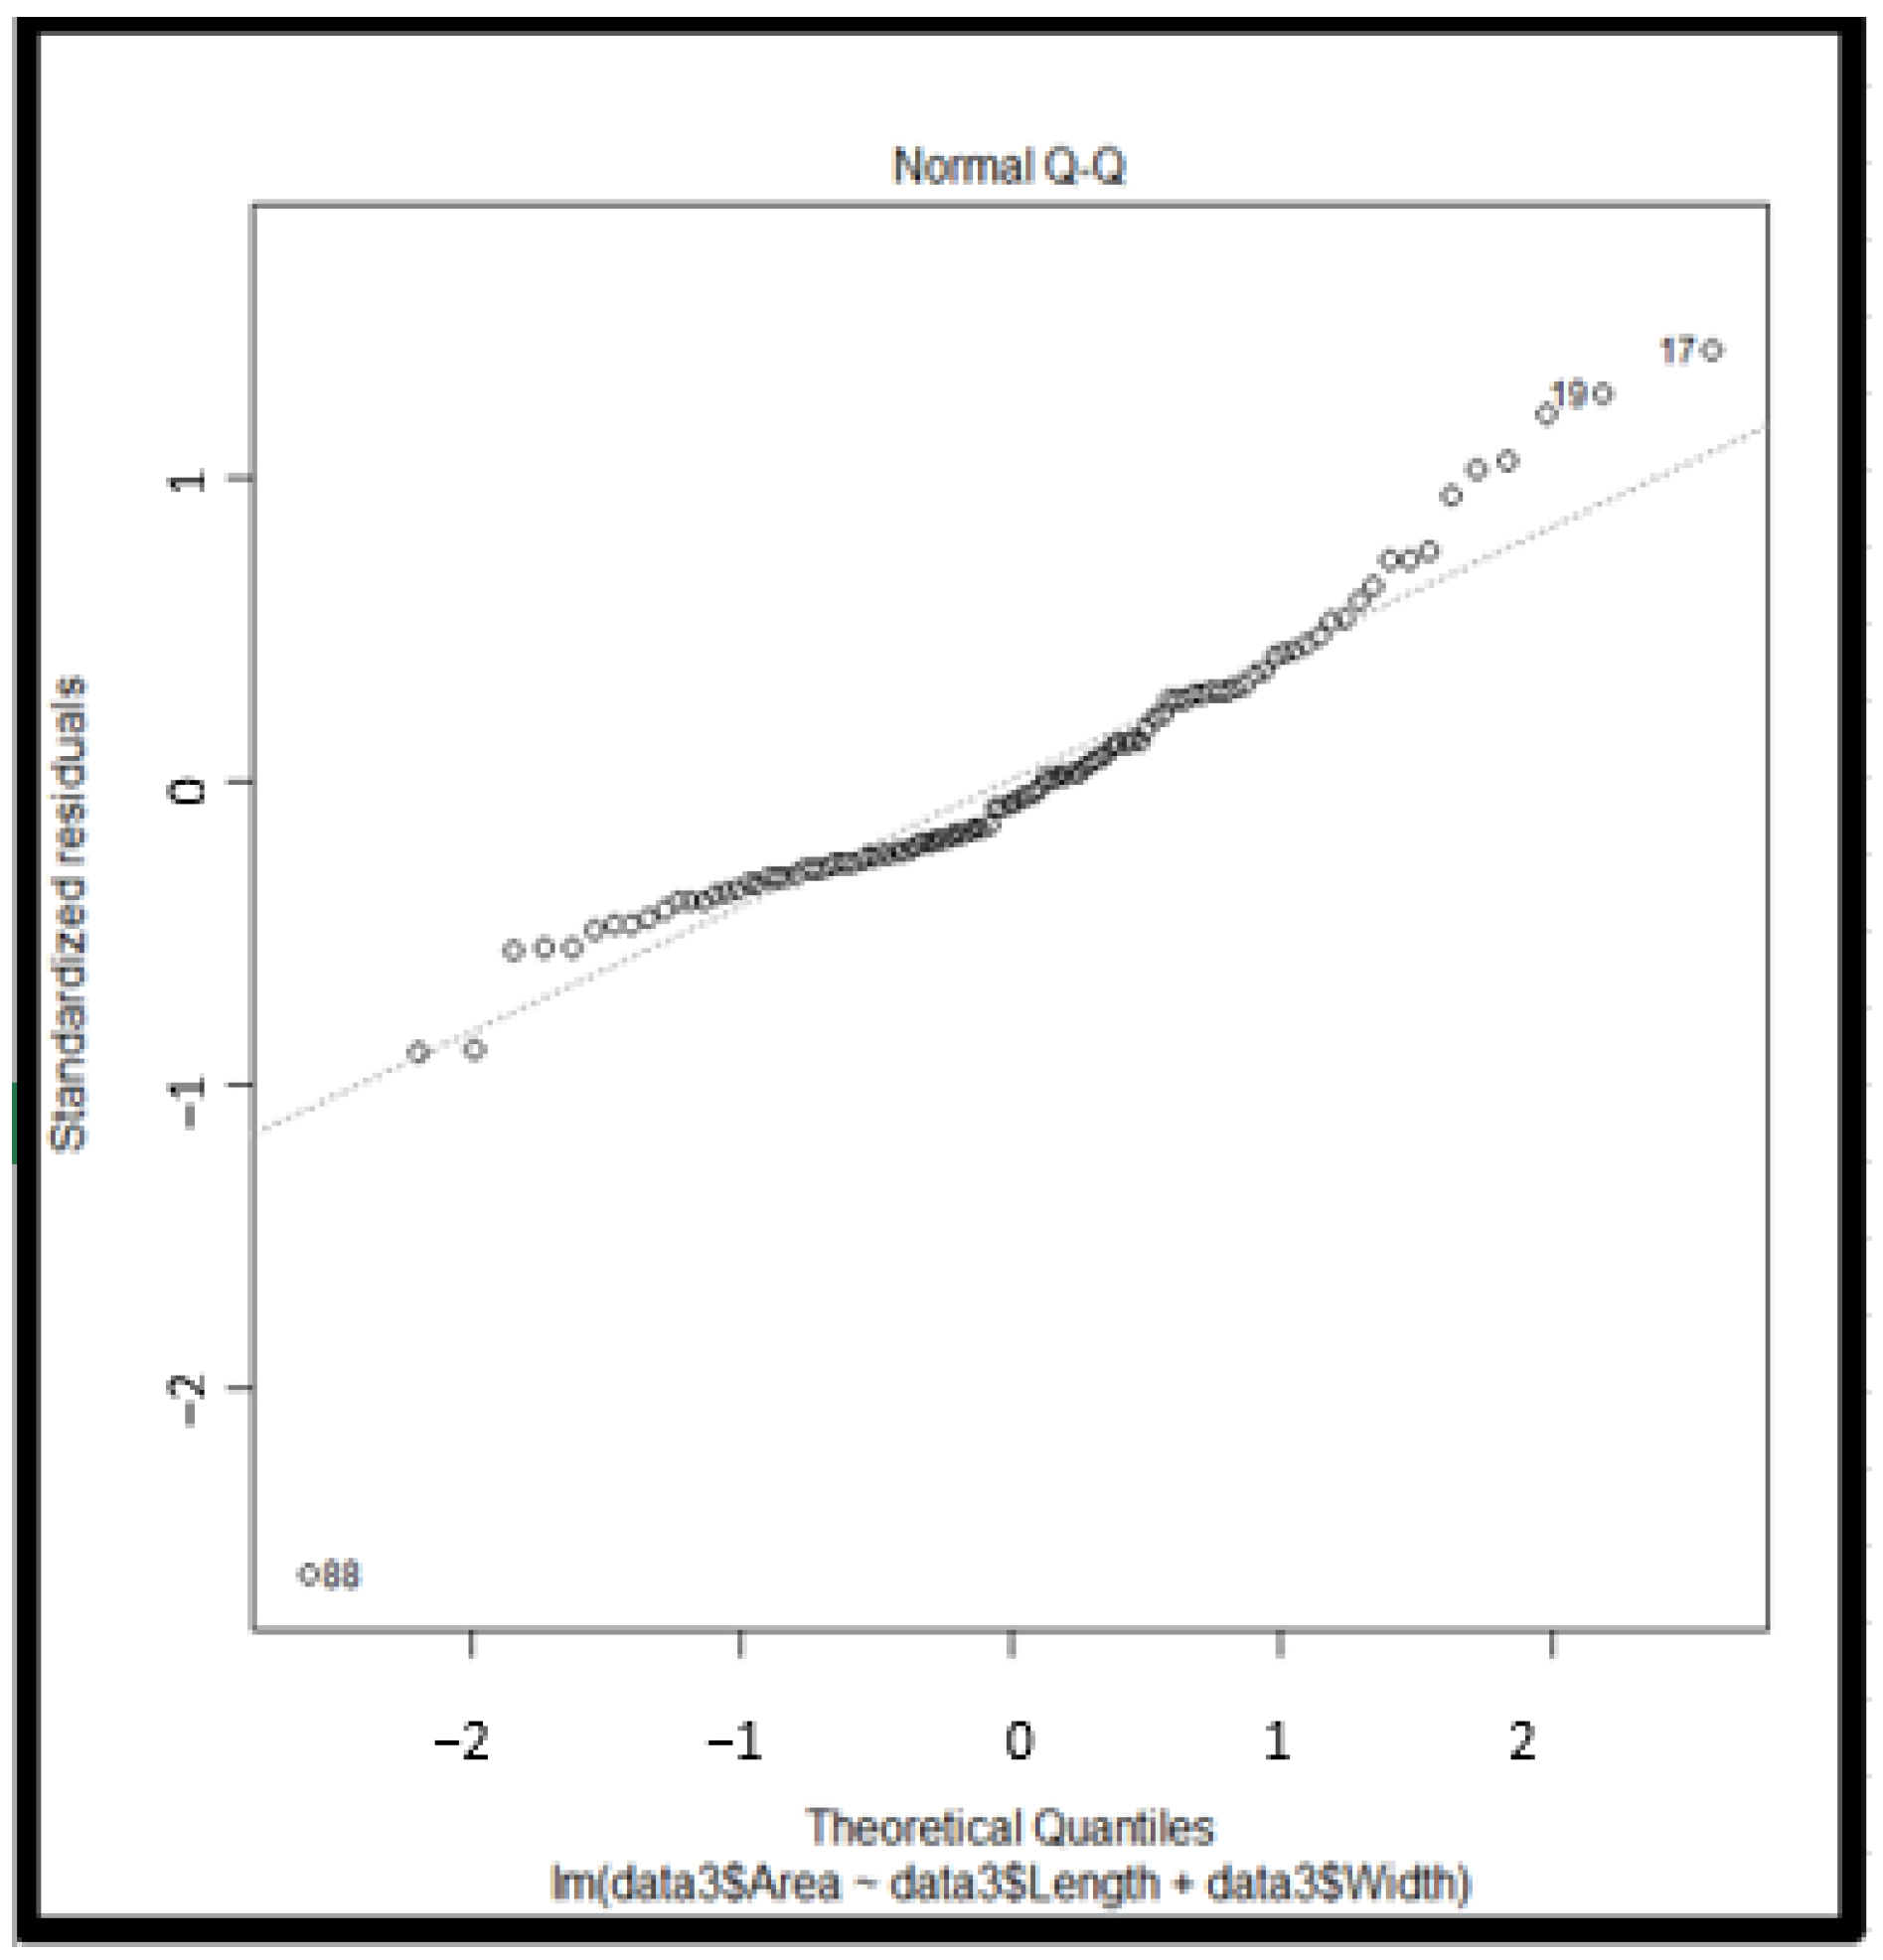
3.1. Leaf Area Estimation Model

Table 2 indicates the regression model used in the present work for the estimation of quina leaf area (R2 = 0.9486). It considers the length (L) and width (W) of the leaf.

3.2. Interpretability of the Model

Figure 1 and Table 3 shows a strong relationship between the independent variables (width and length) and the dependent variable (leaf area). The behavior of both independent variables with leaf area is shown below:
Length: For every centimeter of leaf length, the final area increases by 7.371 cm2.
Width: For each centimeter of leaf width, the final area increases by 13.37 cm2.
A linear model was implemented with the variables length and width, finding favorable results when estimating the leaf area. This model explains 94.86% (Table 2) of the total information of the variable in question as the independent variables are strongly related to the target variable. These adjustments with linear and quadratic models were also studied in the potato variety “agata”, where an equation adjusted with the length of the leaves evaluated was determined [20].
ImageJ has been compared with other paid software, where it has been concluded that it is possible to find leaf area and leaf lamina dimensions using the free ImageJ software, with practical and efficient results. According to [11], ImageJ is fast and simple to use and does not lose precision compared with Image-Pro PLUS and AFSoft.
In [9], the authors compared the methods of ImageJ and LI-COR 3100 leaf area meter on white and black oats and concluded that there is no significant difference between the two methods. They also indicated that ImageJ can be used instead of the meter. Similarly, in [10], the authors compared the ImageJ software method and the LI-3100 LI-COR leaf area integrator in two bean genotypes (black CHP 99-54 and carioca SCS 202 Guará), proving that the ImageJ program can be used as a substitute for the leaf area integrator, the digital image method being an easy, fast, economical, and nondestructive way to perform leaf area evaluations.

4. Conclusions

There is no significant difference between leaf area estimations using the ImageJ software and graph paper. ImageJ is an excellent option for leaf area estimation, being a nondestructive, free, practical, and efficient method, allowing significant savings in time and cost. The allometric model that best fits in the case of leaf area estimation for quina is the quadratic one.

Author Contributions

Conceptualization, A.S., S.C. and C.I.A.; methodology, A.S., S.C. and E.M.; software, A.S., S.C. and E.M.; formal analysis, A.S., S.C. and E.M.; investigation, W.S., B.M. and C.I.A.; resources, C.I.A.; data curation, A.S., S.C. and E.M.; writing—original draft preparation, A.S., S.C. and B.M.; writing—review and editing, W.S. and C.I.A.; supervision, C.I.A.; project administration, W.S. and C.I.A.; funding acquisition, C.I.A. All authors have read and agreed to the published version of the manuscript.

Funding

This research was funded by the project “Creación del servicio de agricultura de precisión en los Departamentos de Lambayeque, Huancavelica, Ucayali y San Martín 4 Departamentos” of the Ministry of Agrarian Development and Irrigation (MIDAGRI) of the Peruvian Government. C.I.A. was funded by PP068 “Reducción de la vulnerabilidad y atención de emergencias por desastres”.

Institutional Review Board Statement

Not applicable.

Informed Consent Statement

Not applicable.

Data Availability Statement

Not applicable.

Conflicts of Interest

The authors declare no conflict of interest.

References

  1. Rodriguez, S.; Campanello, P.; Oliva, L.; Goldstein, G.; Bucci, S. Functional Ecology, a Forest Management Tool. 2019. Available online: http://sedici.unlp.edu.ar/bitstream/handle/10915/130933/Documento_completo.pdf?sequence=1 (accessed on 10 August 2022).
  2. Guangjian, Y.; Ronghai, H.; Jinghui, L.; Marie, W.; Hailan, J.; Xihan, M.; Donghui, X.; Wuming, Z. Review of indirect optical measurements of leaf area index: Recent advances, challenges, and perspectives. Agric. For. Meteorol. 2019, 265, 390–411. [Google Scholar] [CrossRef]
  3. Macedo, R.; De Vasconcelos, T.; Dollabona, J.; Rangel, W.; De Oliveira, G. Measuring leaf area of Acerola. Rev. Caatinga 2011, 24, 40–45. [Google Scholar]
  4. Leite, M.; De Moura, G.; De Moura, E.; De Lucena, L.; Sales, A.; Sampaio, E. Comparação de métodos para estimar a área foliar em pornunça (Manihot sp.). Rev. Bras. Eng. Agrícola Ambient. 2021, 25, 733–740. [Google Scholar] [CrossRef]
  5. Valverde, J.; Arias, D. Evaluation of leaf area index with indirect and direct method in different environmental conditions in dendroenergetic plantations of Eucalyptus tereticornis Sm. Wood For. 2020, 26, e2621953. [Google Scholar] [CrossRef]
  6. Pandey, S.; y Singh, H. A simple, Cost-Effective Method for Leaf Area Estimation. J. Bot. 2011. [Google Scholar] [CrossRef] [Green Version]
  7. Casierra-Posada, F.; Zapata-Casierra, V.; Cutler, J. Comparison of direct and indirect methods for leaf area estimation in peach (Prunus persica) and plum (Prunus salicina) trees. Rev. Colomb. Cienc. Hortícolas 2017, 11, 30–38. [Google Scholar] [CrossRef]
  8. Tomaz, F.; De Souza, L.; Pivetta, F.; De Souza, J. Área do limbo foliar de diferentes plantas estimada por medidas lineares e máteria seca, calibrated as ImageJ software. Interscience 2015, 40, 570–575. Available online: https://www.redalyc.org/pdf/339/33940176011.pdf (accessed on 12 August 2022).
  9. Newton, T.; Moncon, G.; Minussi, J.; Abramo, J. ImageJ software as an alternative method for estimating leaf area in oats. Acta Agron. 2020, 69, 162–169. Available online: https://revistas.unal.edu.co/index.php/acta_agronomica/article/view/69401 (accessed on 8 August 2022). [CrossRef]
  10. Newton, T.; Abramo, J.; Fernandes, A.; Luiz, G.; Fogolari, H.; Dos Santos, V. Uso do software imageJ na estimativa de área foliar para a cultura do feijao. Interciencia 2013, 38, 843–848. [Google Scholar]
  11. Zárate, J.; Natália, M.; Nailson, J.; Lozano, F. Comparison of image analysis softwares for the determination of leaf area. Rev. Bras. Meio Ambiente 2018, 3, 24–32. [Google Scholar]
  12. Mollericona, M.; Laime, E.; Merma, E. Non-destructive estimation of the foliar area in cacao (Theobroma cacao L.) plantules from linear leaf measurements, Sapecho Experimental Station. Apthapi 2022, 8, 2310–2319. [Google Scholar]
  13. Cabezas-Gutiérrez, M.; Peña, F.; Duarte, H.; Colorado, J.; Lora, R. A model for non-destructive leaf area estimation in three forest species. Rev. UDCA Actual. Divulg. Cient. 2009, 12, 121–130. Available online: http://www.scielo.org.co/scielo.php?script=sci_arttext&pid=S0123-42262009000100013&lng=en&tlng=es (accessed on 10 May 2022).
  14. Chumbe, A.; Zárate, R.; Ruiz, L.; Mozombite, L.; Dávila, H. Leaf area of Caraipa utilis Vasquez in a varillal of the Allpahuayo Mishana National Reserve, Loreto, Peru. Cienc. Amaz. 2016, 6, 124–135. Available online: https://ojs.ucp.edu.pe/index.php/cienciaamazonica/article/view/116 (accessed on 6 August 2022). [CrossRef]
  15. INIA. Silvicultural study of Quina Cinchona officinalis L. 2018. Available online: https://repositorio.inia.gob.pe/handle/20.500.12955/889 (accessed on 15 March 2022).
  16. Yucta, M. Structure and Floristic Composition Associated with the Growth Habitat of Cinchona officinalis L. in the Province of Loja. Thesis Submitted for the Degree in Forestry Engineering, Universidad Nacional de Loja, Loja, Ecuador, 2016. [Google Scholar]
  17. Pino, D.; Taylor, C. Rubiaceae endemics of Peru. Rev. Peru. Biol. 2006, 13, 586–599. [Google Scholar] [CrossRef]
  18. Reynel, C.; Pennington, T.D. ; Pennington. R.T. Árboles del Perú; Imprenta Bellido: Lima, Peru, 2016; 1047p, ISBN 987-612-00-2232-0. [Google Scholar]
  19. Sauceda, C.; Gonzáles, V.; Sánchez, B.; Sauceda, R.; Ramírez, H.; Quintana, J. MACF-IJ, Automated method to measure color and leaf area using digital images. Agrociencia 2017, 51, 409–423. [Google Scholar]
  20. Jadoski, S.; Lopes, E.; Maggi, M.; Suchoronezek, A.; Saito, L.; Denega, S. Método de Determinação da Área Foliar da Cultivar de Batata Ágata a Partir de Dimensões Lineares. Universidade Estadual de Londrina, Brasil. 2012. Available online: https://www.redalyc.org/articulo.oa?id=445744117007 (accessed on 5 August 2022).
Figure 1. Fitted line graph of the leaf area of quina.
Environsciproc 22 00063 g001
Table 1. Summary statistics of young and mature leaf dimensions measured by the ImageJ software and millimeter leaves.
VariableMethodYoung LeavesMature Leaves
AverageStand. Dev.Min.Max.MediaStand. Dev.Min.Max.
AreaImageJ80.7252.827.62257.21255.2898.73100.3590.55
Graph paper80.7548.9913251.75245.8695.2889.75555
LengthImageJ11.723.724.2320.9121.663.7314.7630.3
Graph paper12.243.4252121.433.9311.929
WidthImageJ8.593.032.6417.5816.173.528.8925.98
Graph paper9.173.093.51915.763.32823
Table 2. Expression of the regression model in the estimation of leaf area.
Expression of the ModelCoefficients of Determination
R2Radj2
AF = −122.469 + 7.371L + 13.37W 0.94860.9476
Table 3. Results obtained from the linear model implemented in R.
EstimatorSDt-ValueSignificance
Intercept−122.4697.260−16.869***
Length7.3711.3805.341***
Width13.3701.7347.710***
(*) insignificant, (**) regularly significant, (***) highly significant. R-squared = 0.9486, adjusted R squared = 0.9476.
Publisher’s Note: MDPI stays neutral with regard to jurisdictional claims in published maps and institutional affiliations.

