Article

End-Point Predictors of Water Quality in Tropical Rivers

by
Thomas Shahady
1,* and
José Joaquín Montero-Ramírez
2,3
1
Department of Environmental Sciences, University of Lynchburg, Lynchburg, VA 24501, USA
2
Biophilia, Butterfly Research Lab, Puntarenas 60601, Costa Rica
3
Escuela de Biología, Universidad Latina de Costa Rica, San José 11501, Costa Rica
*
Author to whom correspondence should be addressed.
Pollutants 2023, 3(4), 461-476; https://doi.org/10.3390/pollutants3040032
Submission received: 4 April 2023 / Revised: 26 June 2023 / Accepted: 18 September 2023 / Published: 12 October 2023

Abstract

:
End-point evaluation of stream health is essential for the quantification of water quality. To this end, many Multi-Metric Indices (MMIs) have been developed to quantify water quality. The most extensive work has occurred in North America and Europe, while other areas of the world are in development. In this study, we compared the use of relevant physical, chemical and biological parameters in MMIs to various other stream health indicators to assess water quality throughout a three-river corridor along the north central Pacific slope of Costa Rica. Analysis of the data suggested MMIs were the best indicators of water quality and, more specifically, insect MMIs were the most predicative. MMIs were also best at pinpointing anthropomorphic impact throughout the corridor. Further, less complex insect MMIs such as compilations of family diversity using Ephemeroptera, Plecoptera and Trichoptera (EPT) orders were equally as predictive as the more complex models. With a need to better understand and use citizen monitors to predict water quality in these tropical environments, less complex insect MMIs show promise as a solution.

1. Introduction

End-point evaluation of stream health is essential for the quantification of water quality [1]. While water quality determiners are often communicated in somewhat subjective terms such as “swimmable” or “good”, measures supporting these declarations are scientific. Often, legislation specifies specific pollutant levels needed for clean water [2], yet such specific end-points may not encompass stream health, because in reality it is much more complex than any one-point measure. Good end-points need to incorporate various chemical, physical and biological properties to be effective [3,4]. Deriving good measures and then communicating these critical end-points to the public and policymakers fulfills societal needs and expectations [5].
To this end, researchers have developed and evaluated a multitude of water quality indices to describe stream health using physical [6], chemical [7] and biological [8] parameters. More recently, parameters have been incorporated into Multi-Metric Indices (MMIs) to encompass aggregate aspects of the entire stream environment [4,9]. While this task can be cumbersome, and in some instances even daunting [10], research suggests MMIs provide good predictors of disturbance and are certainly preferable over single metrics alone [11].
Within the literature, there are commonalities among parameters used to create MMIs. In stream physical assessment, discharge and stream morphology are often used [12]. Quantification of the physical stream environmental was pioneered by Rogsen [13], then further developed to incorporate essential habitat qualities into a useable index [14,15]. Chemical water quality parameters are compiled into various Multi-Metric Indices. The most prominent is the Water Quality Index (WQI) based on the work of 142 water-quality scientists [16]. This group compiled nine prominent water chemistry parameters (dissolved oxygen, fecal coliform/E. coli, pH, biochemical oxygen demand (5-day BOD), temperature change (from 1 mile upstream), total phosphate, nitrate, turbidity and total solids) into an index defining water quality. Multiple variations of the WQI have evolved (reviewed by Bharti and Katyal [17]) and are effective based on local conditions and parameters selected. Lastly, biological assemblages (primarily insects and fish) are well established as water quality predictors. Karr and Chu [8] developed the Index of Biological Integrity (IBI) allowing quantification of various fish or insect assemblages into an MMI. Various iterations of indices have evolved through time (reviewed by Herman and Nejadhashemi [18]), with organism diversity and sensitivity to pollution the most popular for use in water quality determinations.
While MMIs have demonstrated success in predicting water quality in the US and Europe [19,20], use in Latin America has been less robust [21,22,23]. The universal transferability of MMIs into the tropics is difficult because these environments are rugged, exhibit strong seasonality and present unique logistical difficulties. Heavy seasonal rains may be the most difficult problem to overcome as this phenomenon generates annual disturbances and seasonally influences stream morphology, physiochemistry and the ecological structure of the ecosystem [24,25,26]. Yet, even with these limitations, many MMIs have been developed for general regional use [27,28], and recent research suggests simple MMIs based on key species richness or sensitivity may work well in the tropics [29]. Concerns over climate change coupled with land use and population impacts suggest an urgency to develop good MMIs to predict water quality in these regions [30,31].
In Costa Rica, water quality end-points have been established to meet criteria set forth by government decree. Executive order 33903 [32] states that it is imperative to recover and preserve the physical, chemical and biological integrity of surface water bodies so these waters can be used for various social, economic and environmental purposes that contribute to the development of the country ensuring a better quality of life for all its citizens. Within this decree, clear end-points using a Chemical Water Quality Index (WQI-CR) and benthic macroinvertebrate MMIs adapted from the Biological Monitoring Workers Party (BMWP-CR) for use in Costa Rica are specified. Qualitative descriptors of water quality such as “good” or “poor” accompany each MMI. While these indices provide policymakers and scientists with end-point assessments, critical baseline water quality monitoring along with rigorous testing and validation is needed to support and validate. Further, the collection and computational complexity of such indices limit accessibility for communities where local water boards (ASADAs) are tasked with improving sanitation and water quality [33,34].
Thus, scientific assessment of water quality while amassing the resources necessary to train and equip citizen scientists is a necessary societal factor needed to bridge this gap. Clean water is a basic human and environmental necessity, yet assessing its quality is an invisible subject requiring specific equipment and expertise that can be particularly challenging and complex [35]. And as the complexity of this problem increases, effective governance decreases [36]. This gap clearly exists between effective water quality quantification and citizenry use and understanding [34,37]. But studies suggest citizen volunteers are effective at collection and analysis of water quality data [38]. Therefore, generating useable indices for citizen science that are substantiated by technical and scientific verification is a much-needed endeavor, particularly in parts of the world where this work is most challenging.
In this study, we compared a suite of MMIs to other stream health indicators to assess the predictability of water quality throughout a three-river corridor in the north central Pacific slope of Costa Rica. The comparison and use of MMIs in Costa Rica is limited, therefore verification of WQI-CR and BMWP-CR effectiveness strengthens understanding of water quality in the region and use in the tropics. Secondly, successful equivocation of more complex MMIs using insects identified to families such as BMWP or water chemistries identified to simplified MMIs such as EPT and PMA fills a gap needed for use in local communities. Development and use of good and simplified MMIs that are able to encompass a diversity of ecosystems, land use, human impact and seasonality are suggested.

2. Materials and Methods
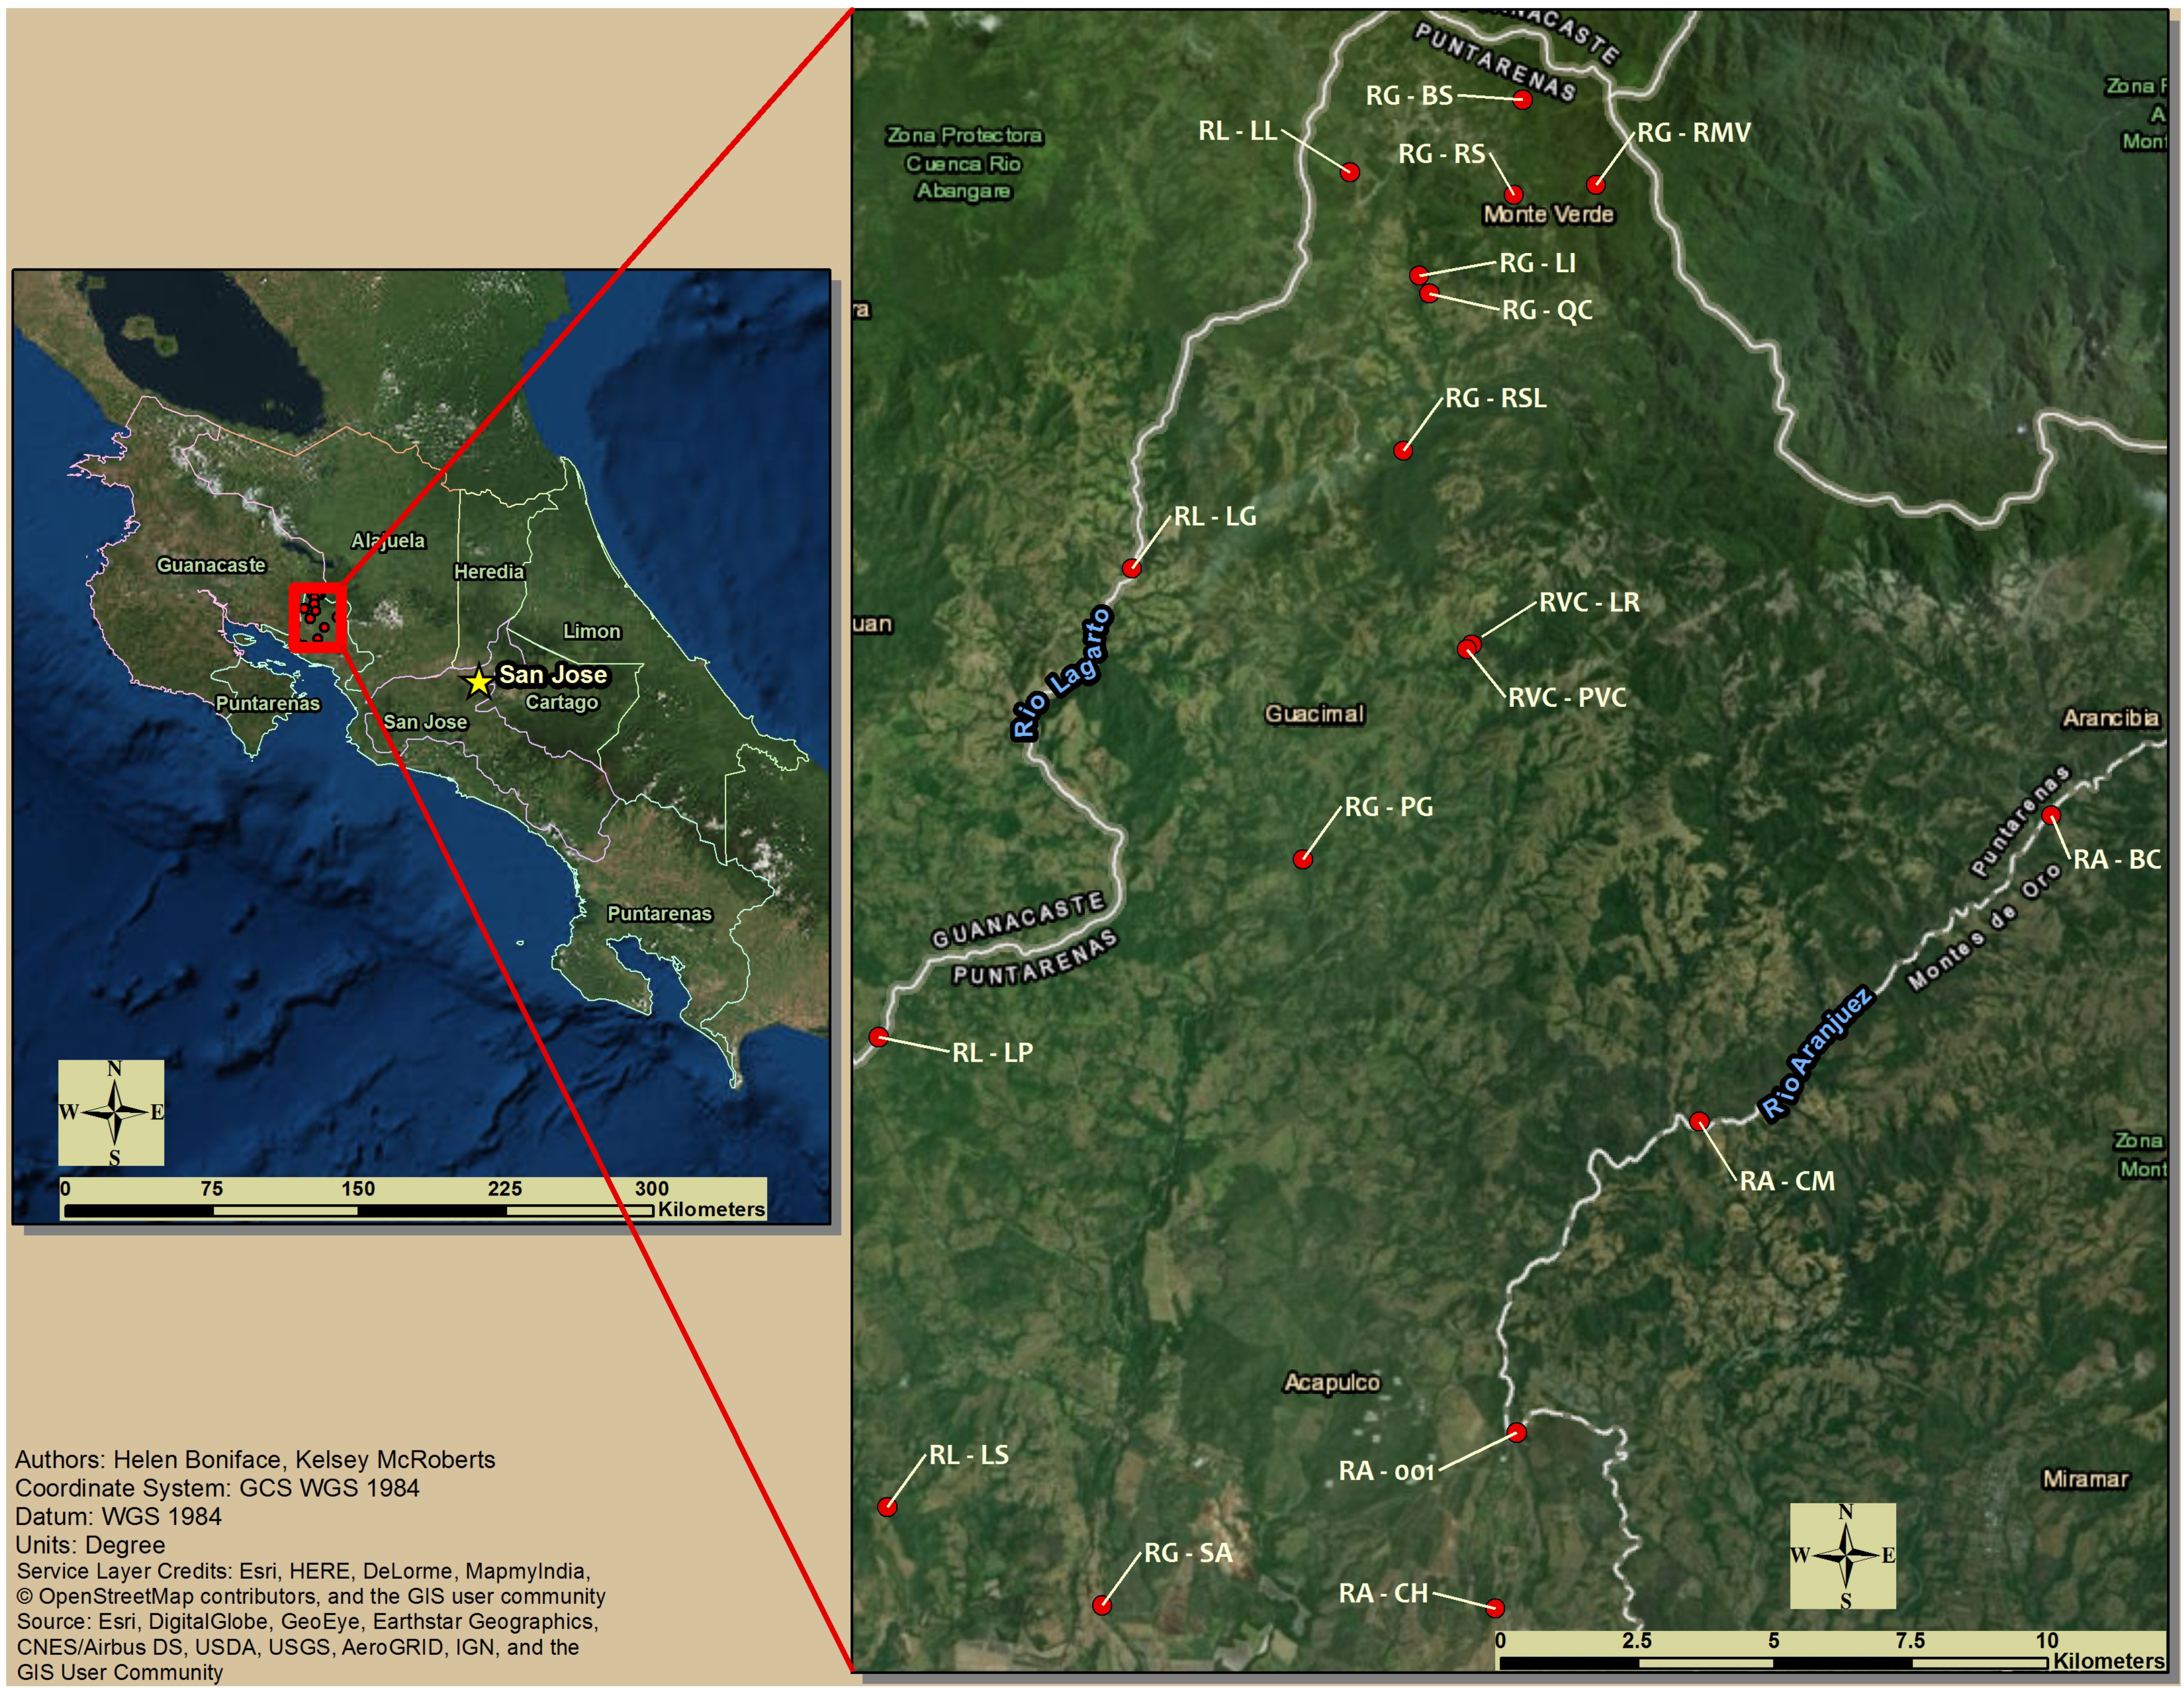
2.1. Study Design

This study is part of a larger water quality monitoring project established in the Bell Bird Biological Corridor (Corredor Biológico Pájaro Campana) and sanctioned by the corridor (http://www.cbpc.org, accessed on 20 April 2022). There are 16 sampling sites throughout the study area, spanning a diversity in elevation from near sea level close to the Gulf of Nicoya up through Monteverde to 1555 m elevation (Figure 1). The sites represent a variety of 11 life zones that are included within the corridor and belong to one of the 3 riverine watersheds: Aranjuez, Guacimal and Lagartos.
Each of the sampling sites are divided between elevations in each river basin and within the basins themselves. The upper sites include three differing areas in the headwaters of the Guacimal River. One site is in the Monteverde Reserve (RG-RMV), and another is outside the reserve near a biological station (RG-BS). The Monteverde Reserve is an area of biological conservation containing primary and secondary cloud forest originally established by Quaker families who founded the area. The biological station site is a secluded area away from the reserve. Two additional headwater sites are located in relation to the Monteverde Cheese Factory operation. Located in direct proximity to the Cheese Factory (RG-RS) is where wastewater has historically been discharged. Further down this river (RG-QC) is a site where a pig farm discharges waste from its factory operations. Several wastewater lagoons on the property directly discharge into this stream. A final headwater station (RG-RSL) captures all the water flowing through the area. In the headwaters of the Lagartos River, a site inside the neighborhood of Las Llanos (RL-LL) was selected. This area represents an urban dense land use for Costa Rica with abundant grey water and overland flow entering the streams. Another site below this neighborhood (RL-LI) captures all the water flowing from the town of Santa Elena. The other area selected as a headwater and upper station on the Aranjuez River (RA-BC) and just below another reserve is the Children’s Eternal Rainforest (Bosque Eterno de los Niños). While the location is much lower in elevation, the characteristics are similar to the headwaters of Guacimal River.
The mid-elevation sites are all located along pasture and other similar features in this watershed. Two sites are located along the Guacimal River. One site in the town of Guacimal (RG-PG) is situated among pastures and farming in this area. Two additional locations outside of town include a site located outside Guacimal (RG-PVC) and an additional site in the biological preserve of the Children’s Eternal Rainforest (RG-LR). RG-PVC is impacted by pasture, while RG-LR is not. Mid-elevation on the Lagartos River is located directly in a pasture (RL-LG) and the mid-elevation site on the Aranjuez flows from a hydroelectric plant (RA-CM). All lower elevation sites are located in disturbed areas. Two locations on Rio Lagartos include a developed neighborhood (RL-LP) and an agricultural site growing various crops (RL-LS). Along the Guacimal, the location is very manipulated by farms and the mining of rock material for construction (RG-SA), while, in the Aranjuez (RA-CH), there is a site next to a large pineapple planation. Characteristics of each site based on water quality measures appear in Table 1.
Water quality sampling took place during 4 distinct time periods from 2015 to 2019 at every site. We consistently sampled in March and early May (representing the dry season), during late August and early September (representing a lull in the wet season) and in November (representing the end of the wet season). During each sampling event, we collected aquatic insect samples using EPA rapid bioassessment protocols [39] modified by using a square net (Wildco Corporation) in place of a kick net. The square net was placed on the streambed directly below a riffle facing into the current, allowing dislodged insects to flow into the net. Substrate was disturbed by kicking up an area above the net to collect a representative sample of macroinvertebrates. A minimum of 3 and not to exceed 5 areas throughout multiple riffles were sampled and combined into 1 sample representing the stream. All macroinvertebrates collected were sorted and identified to families using multiple identification aids [40,41].
All other biological, physical and chemical parameters were either directly measured on-site or taken back to the laboratory for analysis. Measures of discharge were calculated using a flowmeter (Hach FH 950 handheld meter) along with stream depth and width profiles. A sterile 100 mL water sample was collected and analyzed for E. coli. Water was filtered through sterile Nalgene filters using coli-blue agar methodology. All E. coli colony forming units were counted after a 24 h incubation at 37 °C. Total phosphorus samples were collected in acid-washed 125 mL Nalgene bottles and analyzed using an EasyChem auto analyzer (Systea Analytical Technologies, Oak Brook, IL, USA). The EasyChem analysis is compatible with Ascorbic Acid Total Phosphorus Analysis detailed in Standard Methods for Analysis of Water and Wastewater [42]. Each run of the analysis included both sample and laboratory duplicates for quality assurance and quality control. All duplicates within 10% error were to be included in the analysis. All reagents used in this analysis were reagent grade (up to 99% purity) purchased from Fisher Scientific.
We measured temperature (C), conductivity (μs/cm), pH, dissolved oxygen (mg/L) and ammonia (mg/L) with a YSI 556 multiprobe meter (Xylem, Yellow Springs, OH, USA) following pre- and post-calibration QA/QC procedures in accordance with EPA protocols [43].

2.2. Data Analysis

BMWP-CR was calculated using the Costa Rican Ministry of the Environment and Energy documentation [32]. Identified families of insects were assigned a tolerance value with the sum of the values producing an index of water quality. Percent Model Affinity (PMA) was calculated based on the methodology of Novak and Bode [44]. Here, we modified the percent of each insect order based upon our reference site collections (RVC-LR) over the sampling period. EPT was calculated using total Ephemeroptera, Plecoptera and Trichoptera unique families in each sample [45]. An Index of Biological Integrity Macroinvertebrate (IBIM) was calculated using multiple ecological parameters including degree of dominance (percentage in samples of the most dominate macroinvertebrate family), total number of macroinvertebrates captured, total number of families captured, percent tolerant, percent intolerant, total Ephemeroptera, total Plecoptera and total Trichoptera. All families were assigned tolerance values based on Costa Rican Ministry of the Environment and Energy documentation [32], with tolerance defined as families with a (1–5 value) and intolerance with a (6–10 value). The degree of dominance was calculated as the proportion of total individuals in each family distributed throughout the sample. The IBIM index was created by assigning a value from 1–5 depending on adherence to high or low quality based on a similar reference condition [7]. Finally, a Family Biotic Index (FBI) was generated using tolerance values from Hilsenhoff [46].
The National Science Foundation Water Quality Index (WQI) was calculated using data from Dissolved Oxygen (DO), Biochemical Oxygen Demand (BOD), pH, TSS, nitrates, phosphates, E. coli and temperature. A weighted value was assigned to each parameter to generate the WQI using methodology established in Brown et al. [15]. The Costa Rican Water Quality Index (WQI-CR) was calculated directly using three parameters: BOD, dissolved oxygen saturation and concentration of ammonia nitrogen [31]. This index assigns a value from 1 to 5 to each parameter based on the concentration of the measure and then assigns a water quality designation from 3 to 15 after addition of the values. Low values represent excellent water quality while high values represent poor water quality.

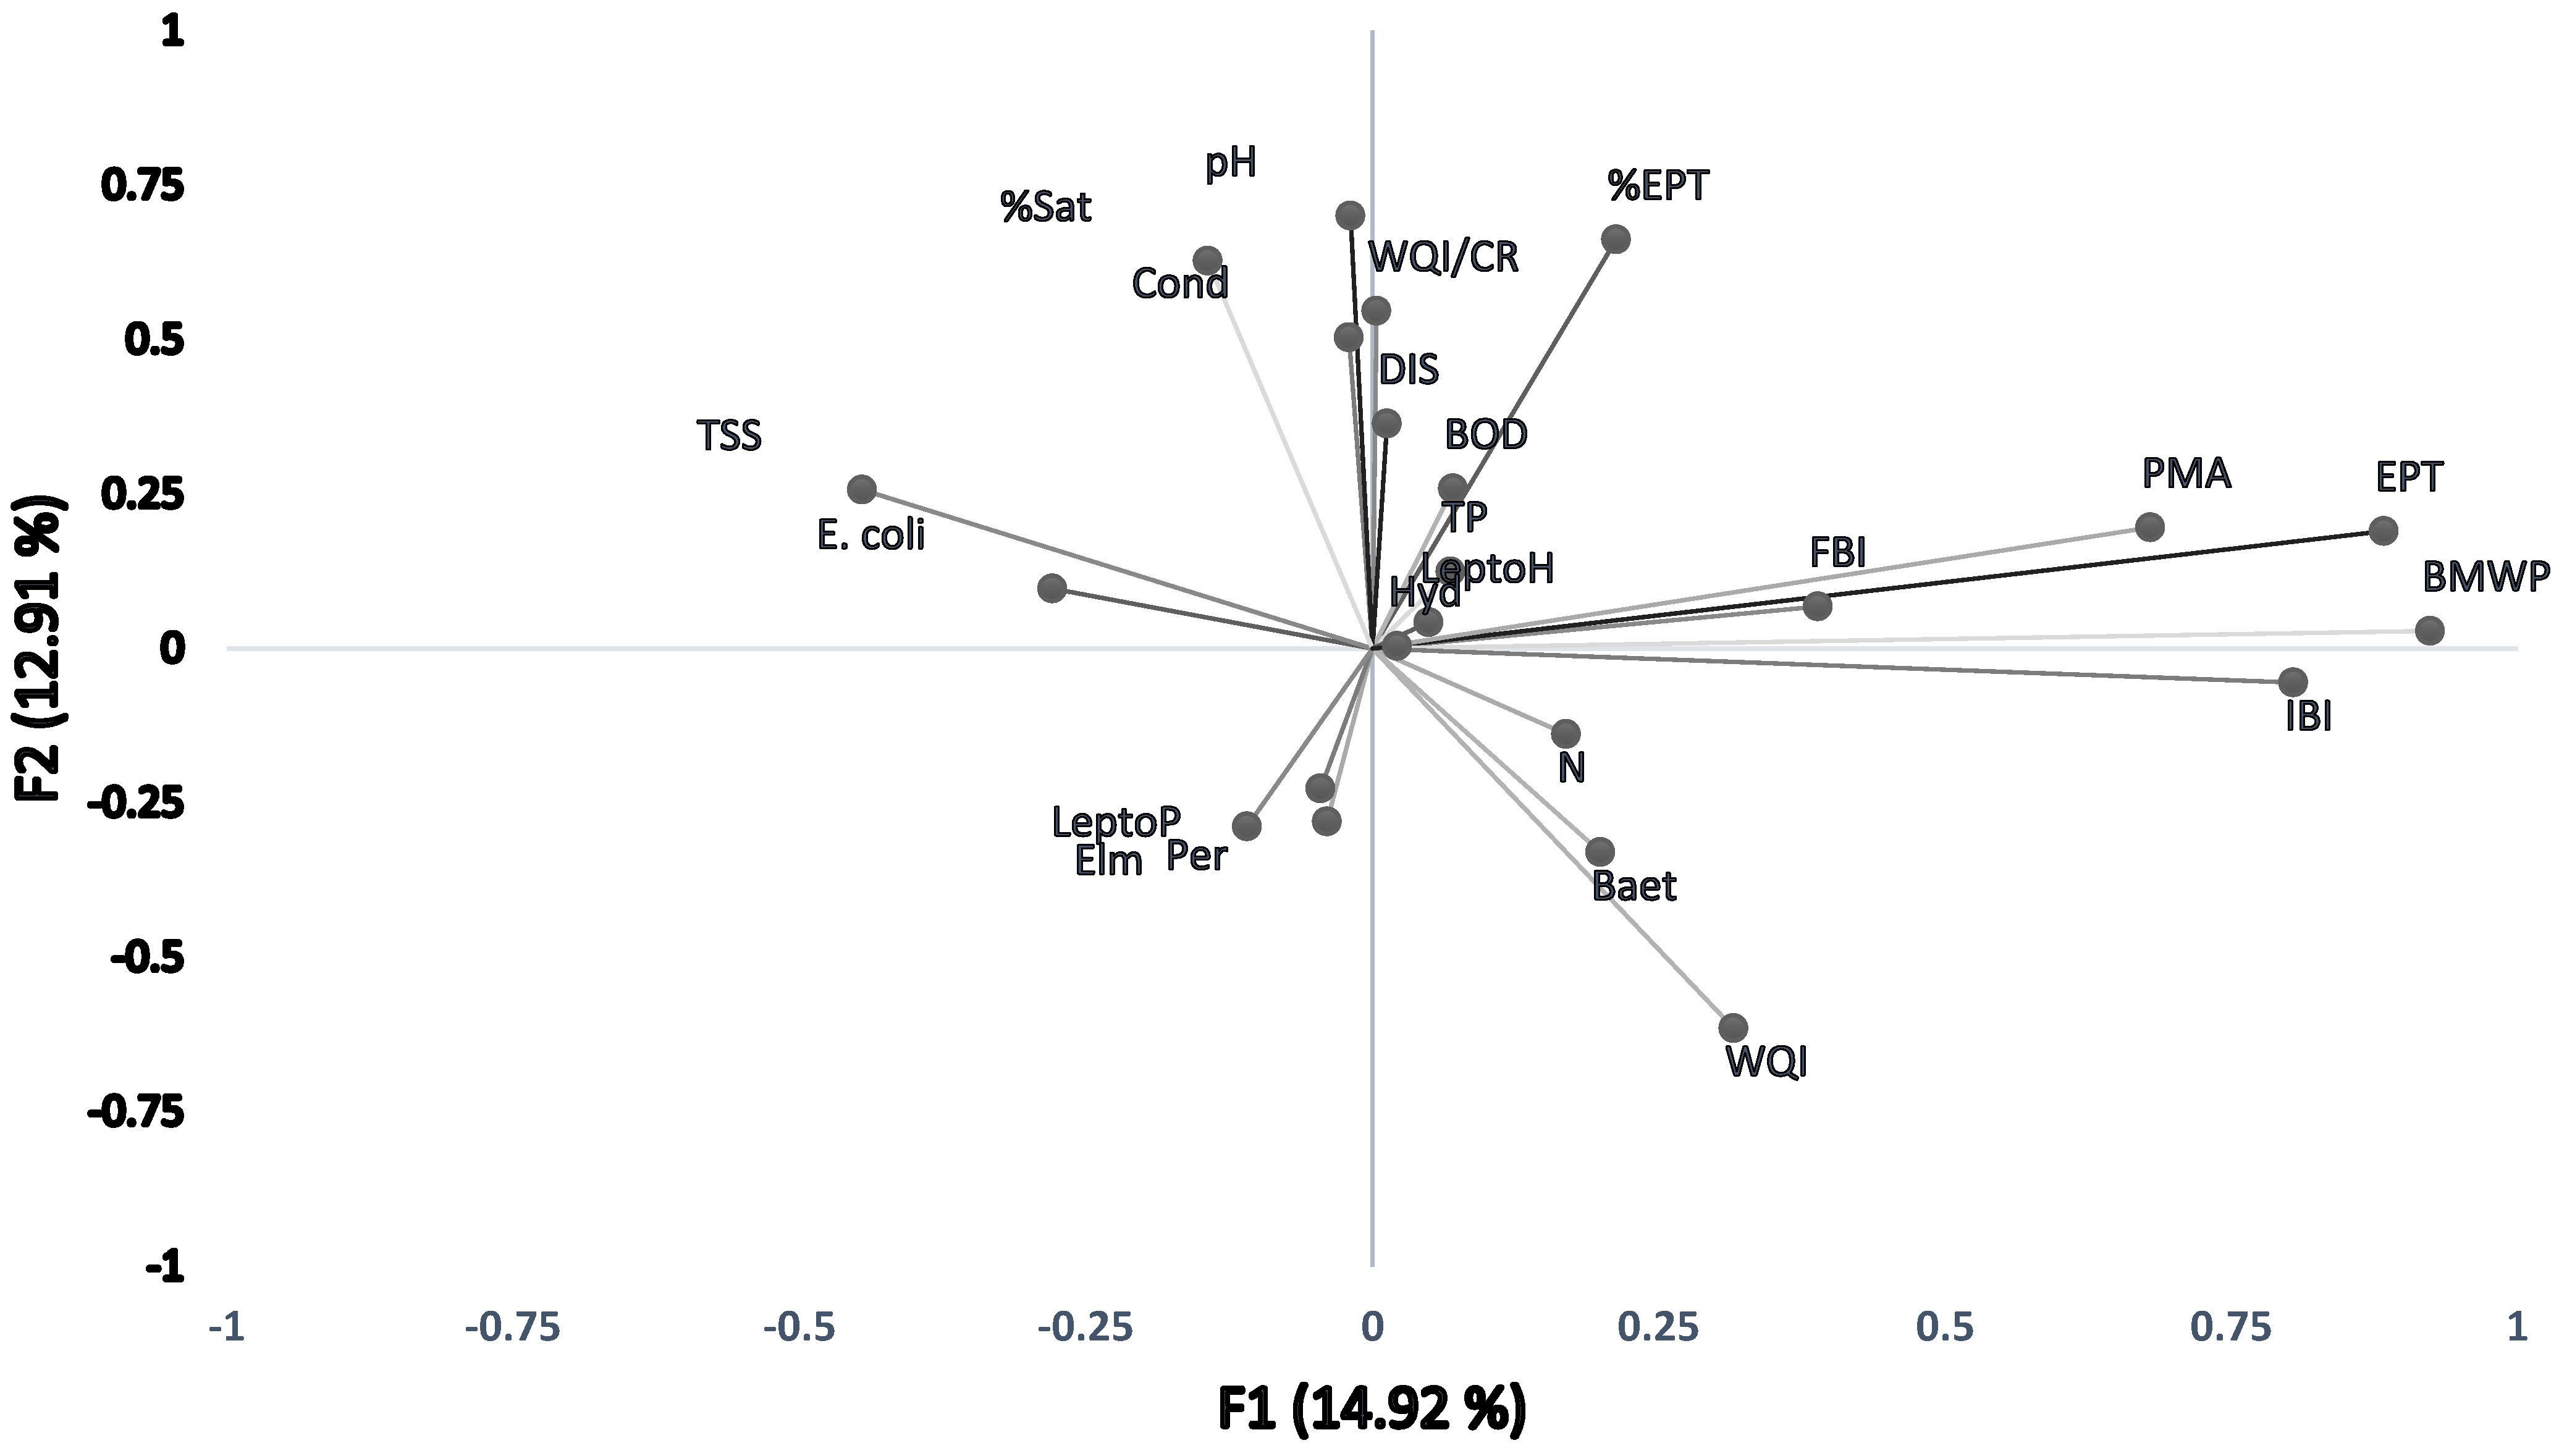
2.3. Statistical Analysis
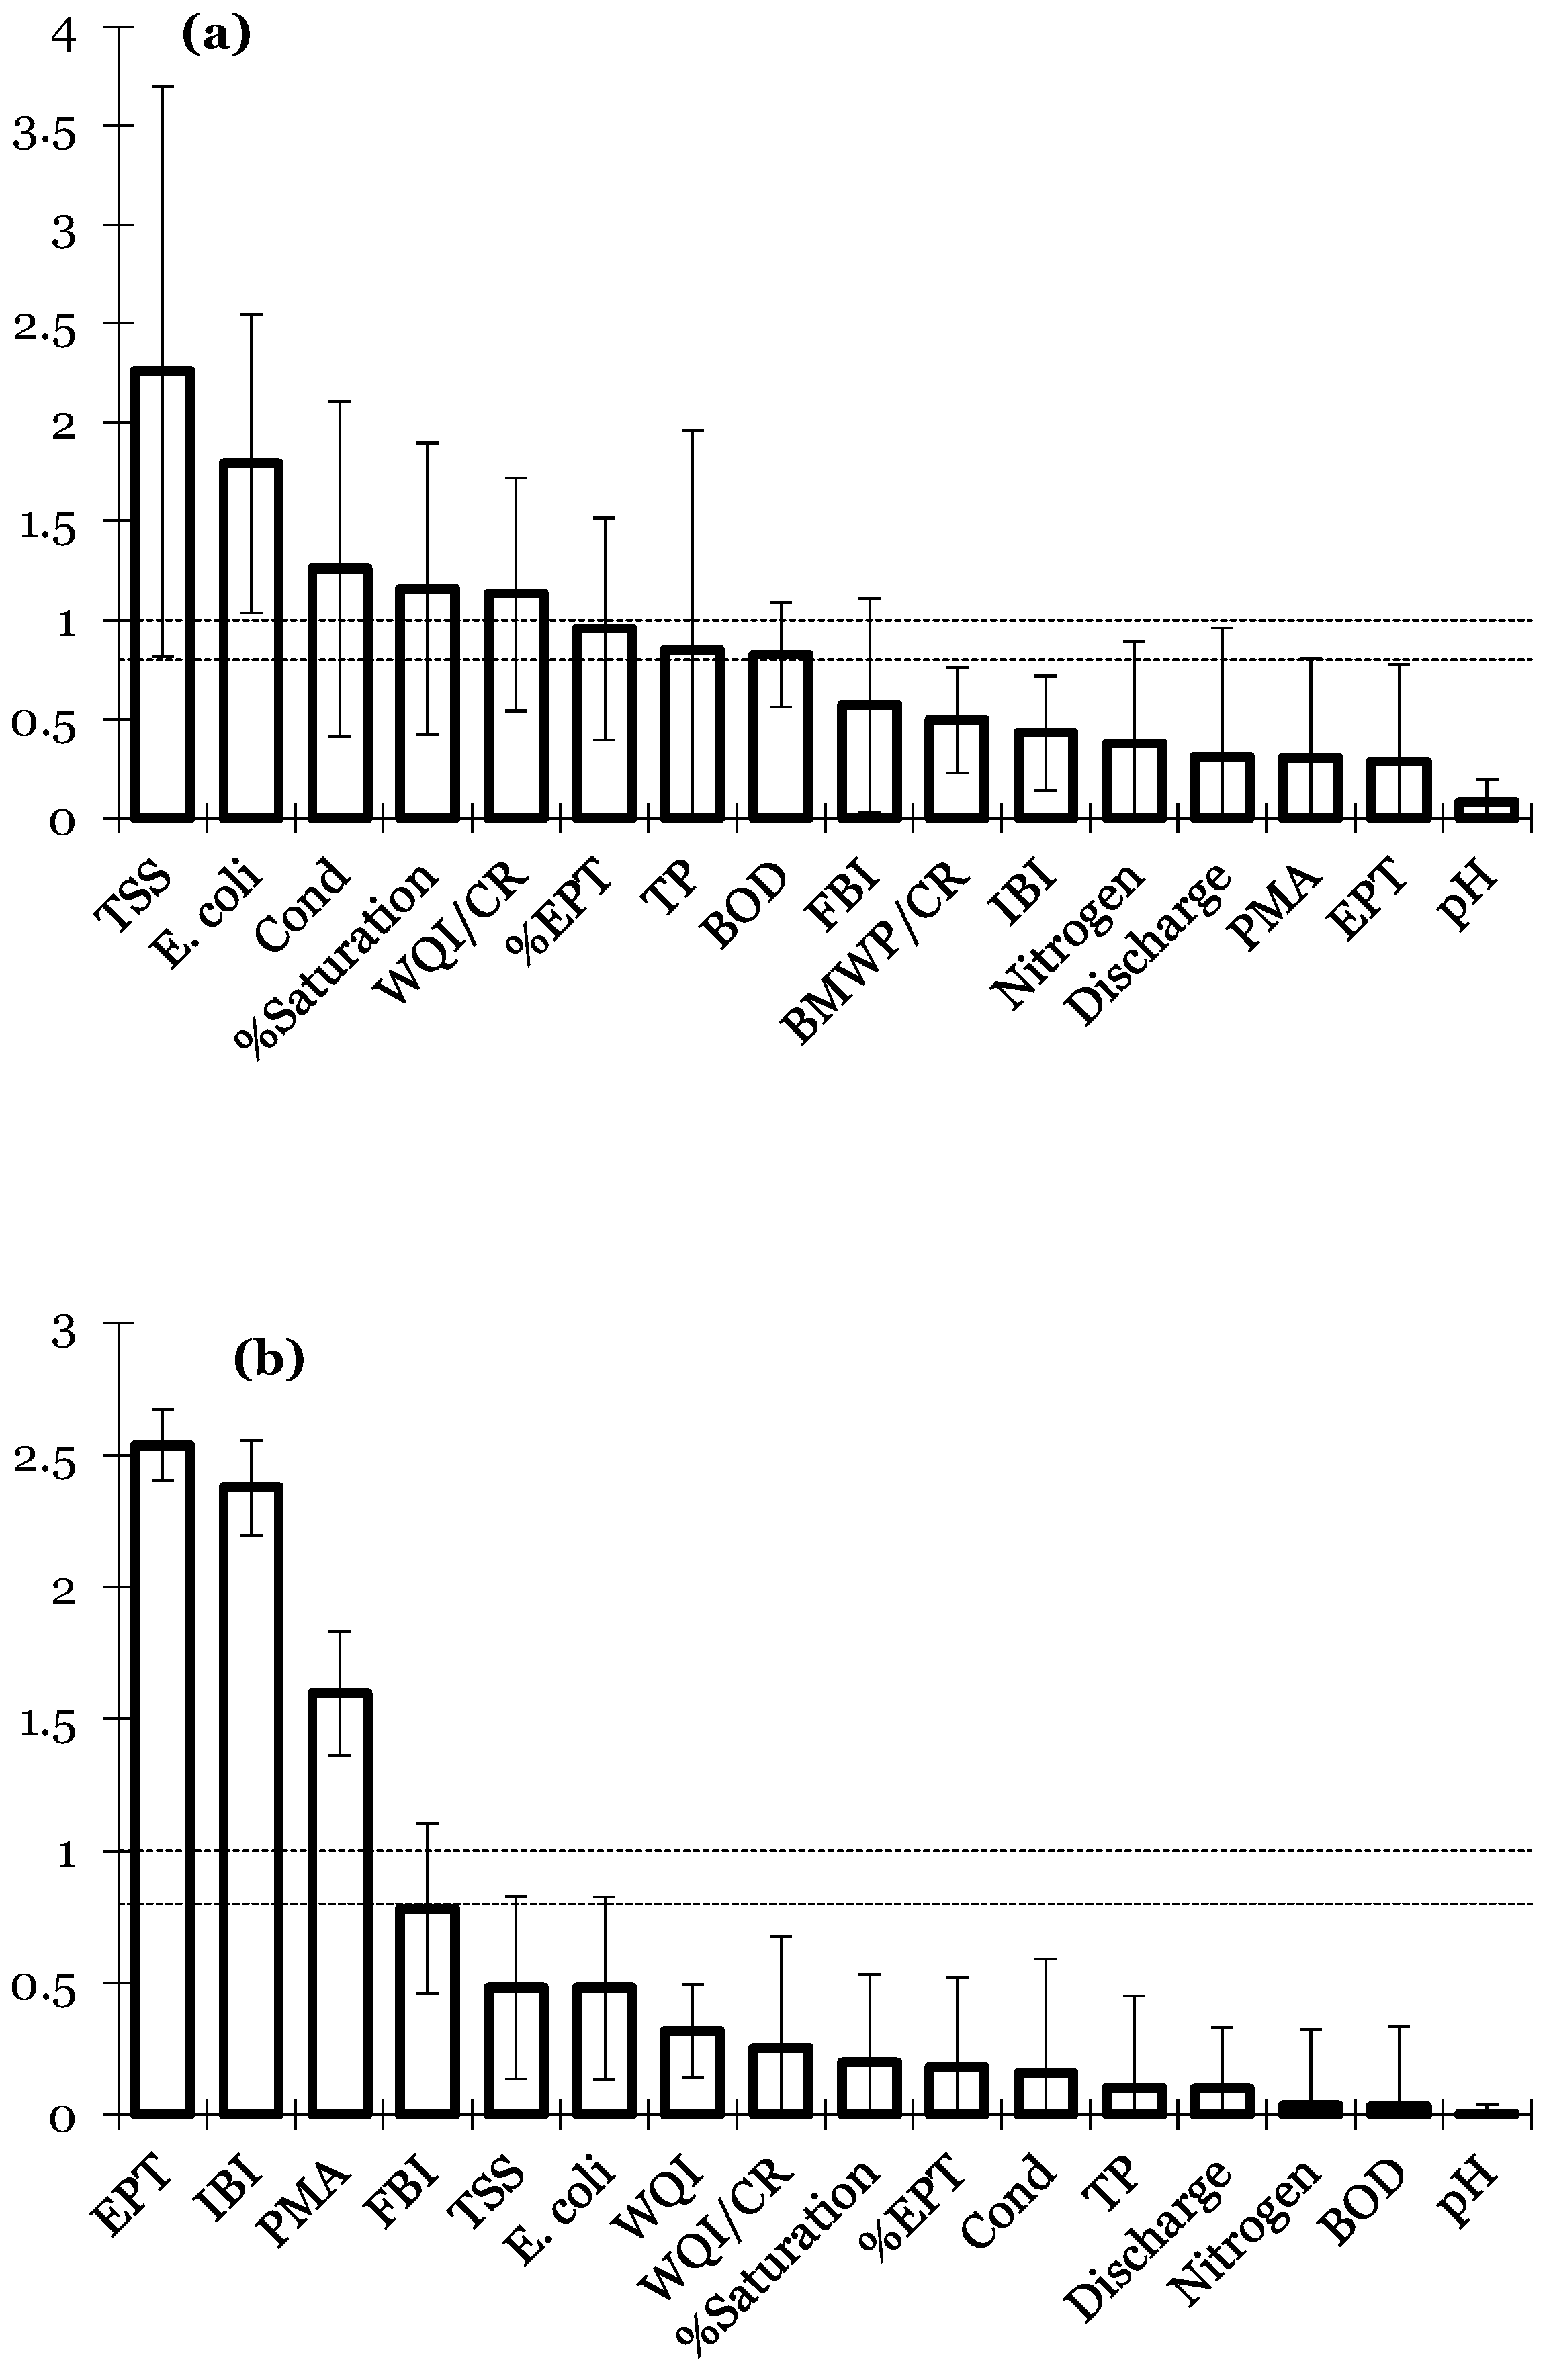
Results were compiled into a summary statistics table generating means and standard errors then analyzed using XLstat for all statistical analysis [47]. Principal Component Analysis (PCA) was used to identify the most influential parameters. Mahalanobis distances between the sites were calculated to determine the metrics of influence throughout the watershed. Mahalanobis distance is a statistical tool used to generate a measure of similarity or dissimilarity among data sets. The calculated distance is unitless, producing a scale invariant correlation between all the data [48]. As correlations move further from zero, they are assumed to be more dissimilar [49,50]. This technique has been used in ecological studies as an improved analysis over traditional rectilinear models [51] and in water quality studies to generate distribution maps comparing similarity or dissimilarity of various indicators of water quality [52]. Here, we used this technique to distinguish distances (similarities or dissimilarities) between stations throughout the watershed to demonstrate the relationship all stations have to each other.
Finally, we used a Partial Least Squares Regression Variable Importance in the Projection (PLS-VIP) to identify parameters of influence on each selected variable. The VIP scores provide a useful measure of which variables contribute most to variance explanation for a selected PLS model parameter [53]. Further, we used the greater-than-one rule as a criterion for variable selection of significance in the analysis.

3. Results

The means and standard errors of all measured variables demonstrated the variability of water quality throughout the corridor (Table 1). However, some patterns emerged. Discharge increased moving down the elevation of the slope, while nutrient concentrations were greatest at mid-slope. Many of the sites consisted of over 50% EPT (Ephemeroptera, Plecoptera and Trichoptera) in insect makeup. To properly analyze the trends in such a large data set, we used several multivariate approaches, including Principal Component Analysis (PCA) and Partial Least Squares Regression Variable of Importance in Projection (PLS-VIP). Overall, the PCA analysis (Figure 2) found loadings on the first and second components, with 27.83% of the total variance in the data set. All macroinvertebrate indices had the greatest factor loadings on F1. BMWP/CR was the most influential, with a factor loading of 0.92, followed by EPT at 0.88 and IBIM at 0.82. The other variables, influencing the first factor, included TSS with a loading value of −0.45 followed by WQI at 0.32. In all, the macroinvertebrate indices outperformed all the other parameters based on this analysis.
In further analysis, we used PLR-VIP to examine how each MMI performed. WQI (representing our chemical analysis) and BMWP/CR (representing our biological analysis) were analyzed to determine what other measured variables correlated with these MMIs (Figure 3). For the WQI index, the variables of greatest correlation (>1) were TSS and E. coli (Figure 3a). The percentage of EPT was the most influential of all the insect indices tested. For the BMWP/CR index (Figure 3b), the other insect indices were the most influential. Similar to WQI, TSS and E. coli were the most responsive of all water quality variables.
The analysis suggested that insect multi-metrics, WQI, E. coli and TSS were the most predictive parameters in this study. As the percent of EPT and other distributions of insects were important predictors, we further examined insect response to both elevation and station. First, six families overwhelmingly made up the predominance of insects between 60 and 80% at most stations (Figure 4). The higher elevations contained smaller numbers of total individuals, with peaks in collections mid-slope (Figure 4a). The most sensitive family (Perlidae) was very abundant in the mid-slope stations near the forest preserve and absent in areas impacted by poor water quality with high E. coli concentrations or in the lower portions of the corridor (Figure 4b). Further, Leptohyphidae was the most ubiquitous family throughout all stations and Hydropsychidae and Baetidae tended to increase down-slope and in areas with increasing organic pollution and declining Leptophlebiidae.
These patterns generated several working hypotheses relating the distributions of insect families to each MMI. To test these hypotheses, we conducted a series of analytical analyses again using PLR-VIP. Concerning both insect and chemical MMIs, Leptohyphidae was the most influential family (Table 2) strongly influencing (above 1 in the VIP statistic) both WQI and BMWP/CR. Perlidae, a very important EPT family, was most influential to the BMWP index. Perlidae was generally absent from sites with organic pollution, while Leptohyphidae was prevalent throughout all the stations. Hydropsychidae and Baetidae were influential in our measures of TP, suggesting these families responded to organic contamination in our study. Hydropsychidae was also influential toward the BMWP index. While this family is often associated with increasing organic pollution, it may also be important in these streams as a water quality indicator.
Ultimately, the usefulness of any water quality predictor is derived through its effectiveness as a measure of human-induced disturbance. Therefore, our final analysis examined each variable as a predictor of water quality due to land use and impact. Both WQI and BMWP/CR quantified differences between study sites (Table 3). BMWP/CR differentiated between good and poor water quality in the upper slope (differences from other sites and the polluted RL-LL) and throughout the entire corridor. WQI was only effective for differentiation in the lower corridor and hence where there was greater impact on water quality. A similar test using TSS and E. coli did not produce any significant or observable differences to land use. This suggests that the insect MMIs are clearly the best predictors of water quality throughout the corridor where WQI is useful in the more impacted and lower portions. Further, other insect MMIs, including EPT and IBIM, were just as predicative as BMWP/CR in similar tests. Thus, good end-point measures were possible with any of the macroinvertebrate MMIs.

4. Discussion

4.1. Predictability of the MMIs as End-Point Indicators

Analysis of the data suggests MMIs are better indicators of water quality than the other individual parameters. Tabachnick and Fidell [54] suggest factor loadings over 0.32 produce statistically meaningful variables in the PCA analysis. Here, all of the macroinvertebrate MMIs along with WQI met this threshold. TSS was the only individual parameter with predictive power based on this analysis. The more traditional water quality parameters such as oxygen saturation, nutrients (TP and nitrogen), pH and BOD (Table 1), along with individual abundances of macroinvertebrates (Figure 4), did not meet this threshold. The three parameters used for WQI/CR calculation (ammonia nitrogen, BOD and oxygen saturation) were ineffective predictors of water quality in the corridor. The incorporation of TSS and E. coli into our WQI strengthened its predictive ability and is suggested for inclusion in WQI/CR. Overall, our findings support many researchers’ uses of MMIs as a preferred end-point indicator in predicting water quality and suggests an accurate use of these indices in tropical watersheds if adjusted to reflect the most predictive parameters [55,56,57].
Our findings further suggest that all three areas of analysis—physical, chemical and biological—were responsive and useful measures of water quality when incorporated into an MMI. While the MMIs were constructed from various biological and chemical components, TSS was influential on both. TSS is a good measure of the physical condition representing the amount of sedimentation or other particulates derived from stream inputs [58]. Increasing TSS signals early stages of stream erosion [59] and land use changes or pollutant impacts [60,61]. The idea that TSS correlates strongly with the insect MMIs and improves the predictive ability of the WQI over WQI/CR suggests physical impacts are an important component to monitor in these streams. This finding is in agreement with Cornejo et al. [62], who showed that sedimentation impacted all measure water quality variables while nutrient enrichment had a variable impact. While seasonality was not a strong correlate using discharge, sedimentation inferred through TSS measures was. These findings suggest water quality studies in the tropics need to closely monitor sedimentation in a predictive parameter.
One expectation in this study was a response of the MMIs to discharge seasonal or physiochemical parameters. Rameriz et al. [25] found insect density and biomass (but not taxonomic composition) along with pH decreasing during the wet season in Costa Rica. We did not observe any correlations in our data with wet season discharge. Gutiérrez-Fonseca and Ramírez [63] found Ephemeroptera emergence unaffected by discharge or physiochemistry. Our overall findings were in general agreement that discharge did not impact water quality. This may explain why insect MMIs were better predictors than the individual chemical parameters. While WQI was a predictive index, it did not perform as well as the insect MMIs, likely due to changing physiochemistry from seasonal precipitation patterns. This further strengthens the idea that insect MMIs may be the best predictor of water quality in the tropics.

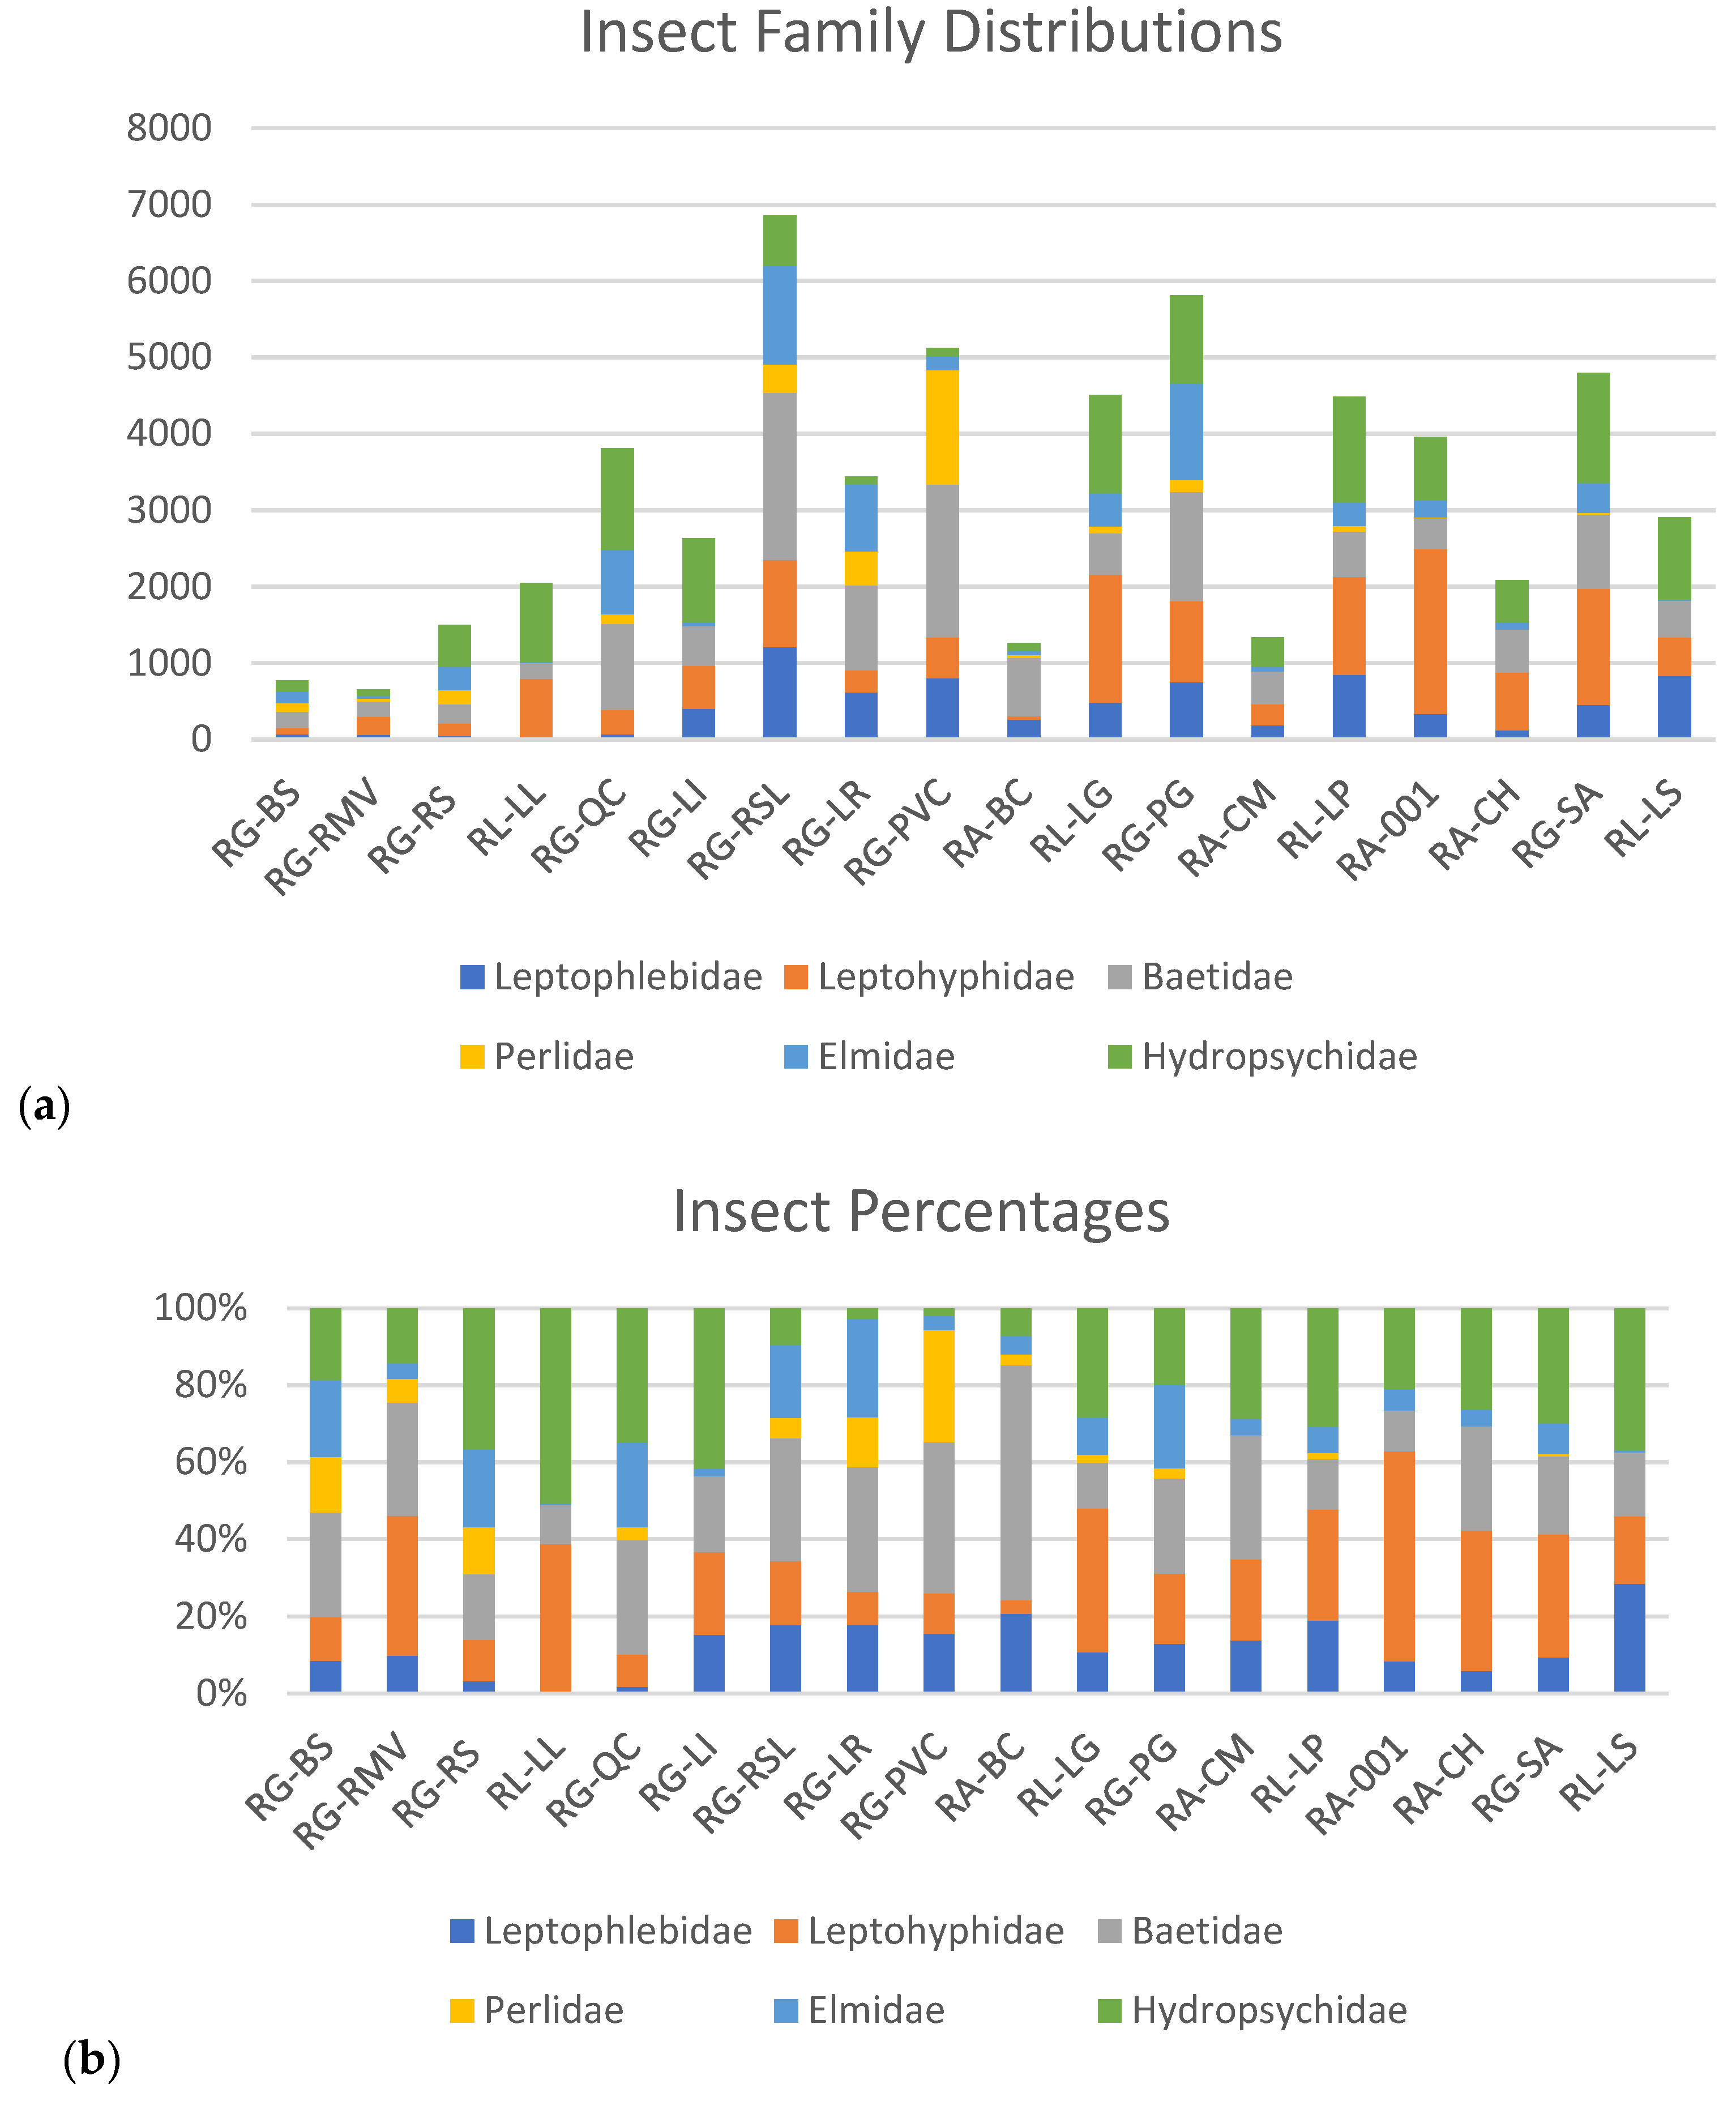
4.2. Insect Relationships to Physiochemical Parameters

The rivers in this corridor were dominated by aquatic insect communities representing Ephemeroptera (Baetidae, Leptophlebiidae and Leptohyphidae), Trichoperta (Hydropsychidae), Plecoptera (Perlidae) and Coleopotera (Elmidae). This is in general agreement with other researchers in Costa Rica. Mena-Rivera et al. [64] found that the occurrence of Leptohyphidae (83.7%), Hydropsychidae (81.6%) and Baetidae (91.5%) were the dominate insect families in the central valley of Costa Rica. Kohlmann et al. [65], in their study along the central Atlantic slope, found very similar results with Elmidae 15.9%, Baetidae 13.2%, Leptophlebiidae 7.3%, Leptohyphidae 15.9%, Perlidae 3.9% and Hydropsychidae 8.6%, accounting for 64.8% of all insects collected. Our insect family distribution results were similar to Kohlmann et al. [59]’s study, where Chironomids and Physidae were minimal, unlike Mena-Rivera et al. [64], who reported them as abundant. One additional family, Similidae, was abundant in our samples but only in the upper headwaters (where EPT was reduced). This result again agrees with Kohlmann et al. [65], additionally with Cornejo et al. [62] in Panama but not with Mena-Rivera et al. [64], suggesting some unique spatial distributions of insect families in Costa Rica or this mountain range that should be accounted for in the construction of any insect MMI.
Further, we found the greatest abundance of insects mid-slope, while other studies found greatest abundance in the headwater regions [66,67]. We know storm events are strong sorting mechanisms [68] and, in this corridor, the mid-slope is an area of collection from the steeper gradients above. Rainy season disturbance may explain insect abundance (but not necessarily taxonomic composition) mid-slope as insects drift into this location [62]. Relatively unimpacted headwaters had lower proportions of EPT (Table 1) than further down the slope, while up to 80% of all insects collected throughout the lower portions of this watershed were EPT. Seasonal wet–dry cycles may create a disturbance regime where only EPT insects predominate [69]. Lower insect productivity in the upper portions of the watershed may also influence water quality further down the watershed [70]. These factors need consideration in any water quality study.
Hydropsychidae and Baetids increase with phosphorus enrichment. Hydropsychidae and Baetids have been shown to increase in response to the introduction of nutrients from surrounding land uses [71,72]. These families are also seen as predictive for indices used in the tropics [73]. It is also common to find an abundance of these two families in polluted and nutrient-enriched areas [67,74,75]. Our findings support this idea. Conversely, Leptophlebiidae and Perlidae did not respond to phosphorus enrichment. Perlidae can be somewhat variable in water quality predictive ability and may be more abundant in cooler waters [76]. Our findings support this trend and suggest Perlidae is a good predictor in the upper and cooler water portions of the corridor. The abundance of Leptophlebiidae and Leptohyphidae can also be predictive [77]. Even with the ubiquitous abundance of Leptohyphidae in the study, the tendency to increase at sites with greater pollution and influence of MMIs suggests this family is predictive for water quality. Loss of Leptophlebiidae at polluted sites may also be a predictive trend for MMI development.

4.3. Use in Predicting Land-Use Impacts in Tropical River Systems

Our analysis demonstrated that both WQI based on chemical analysis and BMWP based on macroinvertebrates can be used as predictive indices across impacted land-use areas (Table 2). Yet, macroinvertebrate MMIs provided a better predictive tool than the chemical based WQI. This is consistent with other studies conducting comparisons [51], suggesting insect indices are better predictors. This is also consistent with the use of BMWP as a popular and frequently used MMI [78]. While tropical rivers are highly alluvial and subject to seasonal flooding with sediment impacting the abundance of macroinvertebrates [62,79], here we suggest insect composition is the best measure of water quality.
Across sites, we did find some patterns in macroinvertebrate distribution that suggested a clear response to enrichment. Plecoptera abundance was elevated at RG-QC, which had high nutrient pollution from a pig farm above, but was not abundant at RL-LL, which was clearly impacted by human waste and stormwater rather than agricultural pollution. While Perlidae was not necessarily suggestive of clean water [65], we found in this study that abundance may suggest direct human impacts rather than agricultural. We did find greater Coleoptera (Elmidae) in reference sites and those less impacted by disturbance. One of the strongest findings was the EPT taxa richness decline along a disturbance gradient, similar to Lorion and Kennedy [80]. Family numbers (not abundance) did remain consistent through disturbance, in agreement with Castillo et al. [30].
We found some instances where BMWP/CR was in agreement with Kohlmann et al. [65], suggesting that the index delivers higher values at sites with high organic pollution. Other indices, such as PMA and EPT, worked equally as well or better than BMWP when targeting anthropomorphic enrichment and may be better choices [81]. Most significantly, the insects responded to site disturbance and were better predictors of organic pollution in concert with the chemical and physical parameters measured. This is a unique finding of this research.

5. Conclusions: Monitoring Water Quality in Tropical Environments

The need for accurate analysis of water quality in the tropics is of continual importance [29]. There is a need to empower communities toward a more comprehensive understanding of water quality and environmental health useable on a wide scale. The ability of citizens and local water boards such as ASADAs in Costa Rica to fill data gaps will (1) generate data in areas that are not well monitored or understood and (2) help communities understand water quality and provide essential analysis that is currently lacking in these communities. This is critical for providing public participation in the governance of water. As reported in the Costa Rica News [82], water quality and its rational use and conservation by a participating public is one of the greatest needs countrywide.
This research identifies reliable Multi-Metric Indices (MMIs) capable of predicting human disturbance on water quality in tropical systems. It is also understood that insect MMIs are much better assessed by citizenry than comparable chemical MMIs [38]. And in this study (Table 3), insect MMIs were superior in predictive ability over the chemical-based WQI in various seasons and areas of disturbance. The idea that insect MMIs can be used in these communities as reliable predictors of water quality even in the presence of uncertainty is a good starting point [10]. Such an MMI is needed to engage communities in water health and produce results compatible with chemical testing procedures that can be very difficult and complex to measure and interpret.
Implications for these findings are widespread. Effective monitoring of water quality is critical for regulators and scientists but even more important for acceptance by the public. End users must have confidence that water is regulated to serve their best interests. The findings that WQI and BMWP-CR are predictive is a good result, but such MMIs are generally too complex for use by citizen science. The finding that a much easier calculation of other indices such as PMA or EPT working equally as well opens opportunities for much greater monitoring of water quality. Creating data collection among citizen scientists who live in these communities and developing a vast monitoring network will increase our understanding of water quality and effective management.
Further, using simplified MMIs such as EPT or other insect indices will only increase total watershed understanding. Simple tests to determine proportions of EPT over 50% and up to 70% may provide good presumptive information. Because EPT comprises so much of the total insect orders in these streams, it is proposed that such a model would be useful. Such information can determine how and where problems are occurring and provide long term data sets for comparisons to community health. It can mobilize communities into action to improve streams and limit waste beyond the capabilities of regulators. Successful monitoring of water quality by community groups is becoming more widespread and is providing an integral link to the overall understanding of stream water quality [35]. Here, we suggest further research and integration of these ideas into tropical stream water quality monitoring.

Author Contributions

T.S.: Conceptualization, methodology, formal analysis, investigation, writing—original draft preparation, writing—review and editing, visualization, supervision, project administration, funding acquisition. J.J.M.-R.: Conceptualization, methodology, formal analysis, investigation, writing—review and editing, visualization, supervision, project administration. All authors have read and agreed to the published version of the manuscript.

Funding

Programa de becas bosqueterno, S.A.

Data Availability Statement

The data presented in this study are available on request from the corresponding author. The data are not publicly available due to privacy concerns issued by the granting agency and University of Georgia Costa Rica.

Acknowledgments

The authors wish to acknowledge the University of Georgia Costa Rica that provided extensive logistical support, especially from Martha Garro Cruz for the duration of the project. Researchers Quint Newcomer and Fabricio Camacho were instrumental in helping us complete the project. Finally, many student interns located at the research station helped with our collections, along with University of Lynchburg intern Evy Brunelle, who processed many macroinvertebrate samples and helped with the background on the paper. We are very grateful for their support.

Conflicts of Interest

The authors declare no conflict of interest.

References

  1. Karr, J. Seven Foundations of Biological Monitoring and Assessment. Biol. Ambient. 2006, 20, 7–18. [Google Scholar]
  2. Keiser, D.; Shapiro, J. Consequences of the Clean Water Act and the demand for water quality. Q. J. Econ. 2019, 134, 349–396. [Google Scholar] [CrossRef]
  3. Karr, J. Assessment of biotic integrity using fish communities. Fisheries 1981, 6, 21–27. [Google Scholar] [CrossRef]
  4. Feio, M.; Hughes, R.; Callisto, M.; Nichols, S.; Odume, O.; Quintella, B.; Kuemmerlen, M.; Aguiar, F.; Almeida, S.; Alonso-EguiaLis, P.; et al. The biological assessment and rehabilitation of the world’s rivers: An overview. Water 2021, 3, 371. [Google Scholar]
  5. Harmsworth, G.; Young, R.; Walker, D.; Clapcott, J.; James, T. Linkages between cultural and scientific indicators of river and stream health. N. Z. J. Mar. Freshw. Res. 2011, 45, 423–436. [Google Scholar] [CrossRef]
  6. Kannan, N.; Anandhi, A.; Jeong, J. Estimation of stream health using flow-based indices. Hydrology 2018, 5, 20. [Google Scholar] [CrossRef]
  7. Noori, R.; Berndtsson, R.; Hosseinzadeh, M.; Adamowski, J.; Abyaneh, M. A critical review on the application of the national sanitation foundation water quality index. Environ. Pollut. 2013, 244, 575–587. [Google Scholar] [CrossRef]
  8. Karr, J.; Chu, E. Restoring Life in Running Waters: Better Biological Monitoring; Island Press: Washington, DC, USA, 1999. [Google Scholar]
  9. Sutadian, A.; Muttil, D.; Yilmaz, N.; Perera, B. Development of river water quality index a review. Environ. Monit. Assess. 2016, 188, 58. [Google Scholar] [CrossRef]
  10. Schoolmaster, D.; Grace, J.; Schweiger, E. A general theory of multimetric indices and their properties. Methods Ecol. Evol. 2012, 3, 773–781. [Google Scholar] [CrossRef]
  11. Miller, K.; Mitchell, B.; McGill, B. Constructing multimetric indices and testing ability of landscape metrics to assess condition of freshwater wetlands in the Northeastern US. Ecol. Indic. 2016, 66, 143–152. [Google Scholar] [CrossRef]
  12. Kannan, N. Stream Health Estimation for the Plum Creek Watershed. Hydrology 2021, 8, 13. [Google Scholar] [CrossRef]
  13. Rosgen, D. Applied River Morphology; Printed Media Companies: Minneapolis, MN, USA, 1996; 352p. [Google Scholar]
  14. Rosgen, D. A Practical Method of Computing Streambank Erosion Rate. In Proceedings of the 7th Federal Interagency Sedimentation Conference, Reno, NV, USA, 25–29 March 2001; Volume 2, pp. 9–15. [Google Scholar]
  15. Kitchell, A.; Schueler, T. Manual 10: Unified Stream Assessment: A User’s Manual; Urban Subwatershed Restoration Manual Series; Center for Watershed Protection: Ellicott City, MD, USA, 2005. [Google Scholar]
  16. Brown, R.; McClellan, N.; Deininger, R.; Tozer, G. A water quality index-do we dare? Water Sew. Work. 1970, 117, 339–343. [Google Scholar]
  17. Bharti, N.; Katyal, D. Water quality indices used for surface water vulnerability assessment. Int. J. Environ. Sci. 2011, 2, 154e173. [Google Scholar]
  18. Herman, M.; Nejadhashemi, A. A review of macroinvertebrate and fish-based stream health indices. Ecohydrol. Hydrobiol. 2015, 15, 53–67. [Google Scholar] [CrossRef]
  19. Abbasi, T.; Abbasi, S. Water quality indices based on bioassessment: The biotic indices. J. Water Health 2011, 9, 330–348. [Google Scholar] [CrossRef]
  20. Buss, D.; Carlisle, D.; Chon, T.; Culp, J.; Harding, J.; Keizer-Vlek, H.; Robinson, W.; Strachan, S.; Thirion, C.; Hughes, R. Stream biomonitoring using macroinvertebrates around the globe: A comparison of large-scale programs. Environ. Monit. Assess. 2015, 187, 4132. [Google Scholar] [PubMed]
  21. León, L. Índice de Calidad del Agua, Ica, Inf. # Sh-9101/01; Instituto Mexicano de Tecnología del Agua: Progreso, Mexico, 1991; 36p. [Google Scholar]
  22. Montoya, H.; Contreras, C.; García, Y. Estudio Integral De La Calidad Del Agua En El Estado De Jalisco; Comision Nacional del Agua, Gerencia Regional: Guadalajara, Mexico, 1997; 106p. [Google Scholar]
  23. Rubio, H.; Delgado, R.; Martínez, R.; Terán, R.; Rivero, J.; Burciaga, N. Indice de calidad de agua (ICA) en la presa la boquilla en Chihuahua, Mexico. J. Basic Sci. 2014, 1, 139–150. [Google Scholar]
  24. Resh, V.; Brown, A.; Covich, A.; Gurtz, M.; Li, H.; Minshall, G.; Reice, S.; Sheldon, A.; Wallace, J.; Wissmar, R. The role of disturbance in stream ecology. J. N. Am. Benthol. Soc. 1988, 7, 433–455. [Google Scholar] [CrossRef]
  25. Ramírez, A.; Pringle, C.; Douglas, M. Temporal and spatial patterns in stream physicochemistry and insect assemblages in tropical lowland streams. J. N. Am. Benthol. Soc. 2006, 25, 108–123. [Google Scholar] [CrossRef]
  26. Weliange, W.; Amarasinghe, U.; Vijverberg, J.; Leichtfried, M.; Fureder, L. A Comparative Analysis on the Effects of River Discharge on Trophic Interactions in Two Tropical Streams. Int. Rev. Hydrobiol. 2017, 102, 3–14. [Google Scholar] [CrossRef]
  27. Ruaro, R.; Gubiani, É. A scientometric assessment of 30 years of the Index of Biotic Integrity in aquatic ecosystems: Applications and main flaws. Ecol. Indic. 2013, 29, 105–110. [Google Scholar] [CrossRef]
  28. van Oosterhout, M.; van der Velde, G. An advanced index of biotic integrity for use in shallow lowland streams in Costa Rica: Fish assemblages as indicators of stream ecosystem health. Ecol. Indic. 2015, 48, 687–698. [Google Scholar] [CrossRef]
  29. Martins, I.; Macedo, D.; Hughes, R.; Callisto, M. Are multiple multimetric indices effective for assessing ecological condition in tropical basins? Ecol. Indic. 2020, 110, 105953. [Google Scholar] [CrossRef]
  30. Castillo, E.; Martínez, E.; Ruepert, C.; Savage, C.; Gilek, M.; Pinnock, M.; Solís, E. Water Quality and Macroinvertebrate Community Response Following Pesticide Applications in a Banana Plantation, Limón, Costa Rica. Sci. Total Environ. 2006, 367, 418–432. [Google Scholar] [CrossRef] [PubMed]
  31. Stan, K.; Sanchez-Azofeifa, A.; Calvo-Rodriguez, S.; Castro-Magnani, M.; Chen, J.; Ludwig, R.; Zou, L. Climate change scenarios and projected impacts for forest productivity in Guanacaste Province (Costa Rica): Lessons for tropical forest regions. Reg. Environ. Chang. 2020, 20, 14. [Google Scholar] [CrossRef]
  32. MINAE. Regulation for the Evaluation and Classification of the Quality of Surface Water Bodies; Executive Decree No. 33903; MINAE: San José, Costa Rica, 2007.
  33. Jovanelly, T.; Rodríguez-Montero, L.; Sánchez-Gutiérrez, R.; Mena-Rivera, L.; Thomas, D. Evaluating watershed health in Costa Rican national parks and protected areas. Sustain. Water Resour. Manag. 2020, 6, 76. [Google Scholar] [CrossRef]
  34. Shahady, T.; Boniface, H. Water quality management thorough community engagement in Costa Rica. J. Environ. Sci. Stud. 2018, 8, 488–502. [Google Scholar] [CrossRef]
  35. Capdevila, A.; Kokimova, A.; Ray, S.; Avellán, T.; Kim, J.; Kirschke, S. Success factors for citizen science projects in water quality monitoring. Sci. Total Environ. 2020, 728, 137843. [Google Scholar] [CrossRef]
  36. Kirschke, S.; Newig, J.; Völker, J.; Borchardt, D. Does problem complexity matter for environmental policy delivery? How public authorities address problems of water governance. J. Environ. Manag. 2017, 196, 1–7. [Google Scholar] [CrossRef]
  37. Conrad, C.; Hilchey, K. A review of citizen science and community-based environmental monitoring: Issues and opportunities. Environ. Monit. Assess. 2011, 176, 273–291. [Google Scholar] [CrossRef]
  38. Storey, R.; Wright-Stow, A.; Kin, E.; Davies-Colley, R.; Stott, R. Volunteer stream monitoring: Do the data quality and monitoring experience support increased community involvement in freshwater decision making? Ecol. Soc. 2016, 21, 32. [Google Scholar] [CrossRef]
  39. Barbour, M.; Gerritsen, J.; Snyder, B.; Stribling, J. Rapid Bioassessment for Use in Streams and Wadeable Rivers: Periphyton, Benthic Macroinvertebrates and Fish, 2nd ed.; EPA 841-B-99-002; U.S. Environmental Protection Agency, Office of Water: Washington, DC, USA, 1999.
  40. Springer, M.; Ramírez, A.; Hanson, P. Macroinvertebrados de agua dulce de Costa Rica I: Introducción a los grupos de macroinvertebrados, métodos, biomonitoreo, Ephemeroptera, Odonata, Plecoptera, Trichoptera. Rev. Biol. Trop. 2010, 58 (Suppl. 4), 1–200. [Google Scholar]
  41. Fernández, H.; Domínguez, E. Guia para la Determinacion de los Artropodos Bentonicos Sudamericanos; Universidad Nacional De Tucuman, Facultad De Ciencias Naturales e Instituto Miguel Lillo: Tucumán, Argentina, 2001. [Google Scholar]
  42. Baird, R.; Bridgewater, L. Standard Methods for the Examination of Water and Wastewater, 23rd ed.; American Public Health Association: Washington, DC, USA, 2017. [Google Scholar]
  43. EPA. Standard Operating Procedure Calibration of Field Instruments; Quality Assurance Unit, U.S. Environmental Protection Agengy: North Chelmsford, MA, USA, 2017.
  44. Novak, M.; Bode, R. Percent model affinity: A new measure of macroinvertebrate community composition. J. N. Am. Benthol. Soc. 1992, 11, 80–85. [Google Scholar] [CrossRef]
  45. Plafkin, J.; Barbour, T.; Porter, K.; Gross, S.; Hughes, R. Rapid Bioassessment Protocols for Use in Streams and Rivers: Benthic Macroinvertebrates and Fish; 444/4-89-001; United States Environmental Protection Agency EPA: Washington, DC, USA, 1989.
  46. Hilsenhoff, W. Use of Arthropods to Evaluate Water Quality of Streams; Technical Bulletin Number 100, Department of Natural Resources: Madison, WI, USA, 1977. [Google Scholar]
  47. Addinsoft. XLSTAT Statistical and Data Analysis Solution; Addinsoft: Long Island, NY, USA, 2019. [Google Scholar]
  48. Mahalanobis, P. On the generalized distance in statistics. Proc. Natl. Inst. Sci. India 1936, 2, 49–55. [Google Scholar]
  49. Sawyer, J.; Stewart, P.; Mullen, M.; Simon, T.; Bennett, H. Influence of habitat, water quality, and land use on macro-invertebrate and fish assemblages of a southeastern coastal plain watershed, USA. Aquat. Ecosyst. Health Manag. 2004, 7, 85–99. [Google Scholar] [CrossRef]
  50. Praus, P. Evaluation of biological wastewater treatment process using Mahalanobis distances in original and principal component space: A case study. Appl. Water Sci. 2018, 8, 167. [Google Scholar] [CrossRef]
  51. Farber, O.; Kadmon, R. Assessment of alternative approaches for bioclimatic modeling with special emphasis on the Mahalanobis distance. Ecol. Model. 2003, 160, 115–130. [Google Scholar] [CrossRef]
  52. Wang, Z.; Chen, H.; Li, F. Identifying spatial heterogeneity of groundwater and its response to anthropogenic activities. Environ. Sci. Pollut. Res. 2019, 26, 29435–29448. [Google Scholar] [CrossRef]
  53. Farres, M.; Platikanov, S.; Tsakovski, S.; Tauler, R. Comparison of the variable importance in projection (VIP) and of the selectivity ratio (SR) methods for variable selection and interpretation. J. Chemom. 2015, 29, 528–536. [Google Scholar] [CrossRef]
  54. Tabachnick, B.; Fidell, L. Using Multivariate Statistics, 5th ed.; Allyn & Bacon: Boston, MA, USA, 2007. [Google Scholar]
  55. Brooks, S.; Palmer, M.; Cardinal, B.; Swan, C.; Ribblett, S. Assessing stream ecosystem rehabilitation: Limitations of community structure data. Restor. Ecol. 2002, 10, 156–168. [Google Scholar] [CrossRef]
  56. Ghani, W.; Kutty, A.; Mahazar, M.; Al-Shami, S.; Hamid, S. Performance of Biotic Indices in Comparison to Chemical-Based Water Quality Index (WQI) in Evaluating the Water Quality of Urban River. Environ. Monit. Assess. 2018, 190, 297. [Google Scholar] [CrossRef]
  57. Herlihy, A.; Sifneos, J.; Hughes, R.; Peck, D.; Mitchell, R. The Relation of Lotic Fish and Benthic Macroinvertebrate Condition Indices to Environmental Factors Across the Conterminous USA. Ecol. Indic. 2020, 112, 105958. [Google Scholar] [CrossRef]
  58. Allen, J. The influence of land use on stream ecosystems. Annu. Rev. Ecol. Evol. Syst. 2004, 35, 257–284. [Google Scholar] [CrossRef]
  59. Wolman, M. A cycle of sedimentation and erosion in urban river channels. Geogr. Ann. 1967, 49, 385–395. [Google Scholar] [CrossRef]
  60. Chin, A. Urban transformation of river landscapes in a global context. Geomorphology 2006, 79, 460–487. [Google Scholar] [CrossRef]
  61. Maklin, M.; Lewin, J. River stresses in anthropogenic times: Large-scale global patterns and extended environmental timelines. Prog. Phys. Geogr. 2019, 43, 3–23. [Google Scholar] [CrossRef]
  62. Cornejo, A.; Tonin, A.; Checa, B.; Tuñon, A.; Pérez, D.; Coronado, E.; González, S.; Ríos, T.; Macchi, P.; Correa-Araneda, F.; et al. Effects of multiple stressors associated with agriculture on stream macroinvertebrate communities in a tropical catchment. PLoS ONE 2019, 14, e0220528. [Google Scholar]
  63. Gutiérrez-Fonseca, P.; Ramírez, A. Mayfly Emergence Production and Body Length Response to Hydrology in a Tropical Lowland Stream. PeerJ 2020, 8, e9883. [Google Scholar] [CrossRef] [PubMed]
  64. Mena-Rivera, L.; Vásquez-Bolaños, O.; Gomez-Castro, C.; Rodríguez-Rodríguez, A.; Sánchez-Gutiérrez, R. Ecosystemic assessment of surface water quality in the Virilla River: Towards sanitation processes in Costa Rica. Water 2018, 10, 845. [Google Scholar] [CrossRef]
  65. Kohlmann, B.; Arroyo, A.; Springer, M.; Vásquez, D. Chapter: 13. Agrorural effects on the macroinvertebrate assemblage in a tropical river. In Biodiversity in Ecosystems—Linking Structure and Function; Blanco, J.A., Ed.; InTech: London, UK, 2015; pp. 317–351. [Google Scholar]
  66. Ramírez, A.; Pringle, C. Structure and Production of a Benthic Insect Assemblage in a Neotropical Stream. J. N. Am. Benthol. Soc. 1998, 17, 443–463. [Google Scholar] [CrossRef]
  67. Mena-Rivera, L.; Salgado-Silva, V.; Benavides-Benavides, C.; Coto-Campos, J.; Swinscoe, T. Spatial and season surface water quality assessment in a tropical urban catchment: Burio River. Costa Rica Water 2017, 9, 558–568. [Google Scholar]
  68. Feeley, H.; Davis, S.; Bruen, M.; Blacklocke, S.; Kelly-Quinn, M. The impact of a catastrophic storm event on benthic macroinvertebrate communities in upland headwater streams and potential implications for ecological diversity and assessment of ecological status. J. Limnol. 2012, 71, 299–308. [Google Scholar] [CrossRef]
  69. Zamora-Munõz, C.; Sainz-Cantero, C.; Sanchez-Ortega, A.; Alba-Tercedor, J. Are biological indices BMPW and ASPT and their significance regarding water quality seasonally dependent? Factors explaining their variations. Water Res. 1995, 29, 285–290. [Google Scholar] [CrossRef]
  70. Alexander, R.; Boyer, R.; Smith, R.; Schwarz, G.; Moore, R. The role of headwater streams in downstream water quality. J. Am. Water Resour. Assoc. 2007, 43, 41–59. [Google Scholar] [CrossRef] [PubMed]
  71. Czerniawska-Kusza, I. Comparing modified biological monitoring working party score system and several biological indices based on macroinvertebrates for water-quality assessment. Limnologica 2005, 35, 169–176. [Google Scholar] [CrossRef]
  72. Deborde, D.; Hernandez, M.; Magbanua, F. Benthic Macroinvertebrate Community as an Indicator of Stream Health: The Effects of Land Use on Stream Benthic Macroinvertebrates. Sci. Diliman 2016, 28, 5–26. [Google Scholar]
  73. Dominguez-Granda, L.; Lock, K.; Goethals, P. Using multi-target clustering trees as a tool to predict biological water quality indices based on benthic macroinvertebrates and environmental parameters in the Chaguana watershed (Ecuador). Ecol. Infoma. 2011, 6, 303–308. [Google Scholar] [CrossRef]
  74. Ratia, H.; Vuori, K.; Oikari, A. Caddis larvae (Trichoptera, Hydropsychidae) indicate delaying recovery of a watercourse polluted by pulp and paper industry. Ecol. Indic. 2012, 15, 217–226. [Google Scholar] [CrossRef]
  75. Xu, M.; Wang, Z.; Duan, X.; Pan, B. Effects of pollution on macroinvertebrates and water quality bio-assessment. Hydrobiologia 2014, 729, 247–259. [Google Scholar] [CrossRef]
  76. Kohlmann, B.; Arroyo, A. Chapter 6. In Integrated Analytical Approaches for Pesticide Management; Maestroni, B., Cannavan, A., Eds.; Academic Press: Cambridge, MA, USA, 2018; pp. 83–106. [Google Scholar]
  77. Sanchez-Arguello, R.; Cornejo, A.; Pearson, R.; Boyero, L. Spatial and temporal variation of stream communities in a human-affected tropical watershed. Int. J. Limnol. 2010, 46, 149–156. [Google Scholar] [CrossRef]
  78. Pineda-Pinead, J.; Rosas-Acevedo, J.; Sigarreta-Almira, J.; Hernandez-Gomez, J.; Reyes-Umana, M. Biotic indices to evaluate water quality: BMWP. Int. J. Environ. Ecol. Fam. Urban Stud. 2018, 8, 23–36. [Google Scholar]
  79. Connolly, N.; Pearson, R. The effect of fine sedimentation on tropical stream macroinvertebrate assemblages: A comparison using flow-through artificial stream channels and recirculating mesocosms. Hydrobiologia 2007, 592, 423–438. [Google Scholar] [CrossRef]
  80. Lorion, C.; Kennedy, B. Relationship between Deforestation, Riparian Forest Buffers and Benthic Macroinvertebrates in Neotropical Headwater Streams. Freshw. Biol. 2009, 54, 165–180. [Google Scholar] [CrossRef]
  81. O’Callaghan, P.; Kelly-Quinn, M. Performance of Selected Macroinvertebrate-Based Biotic Indices for Rivers Draining the Merendón Mountains Region of Honduras. Cuad. Investig. UNED 2013, 5, 45–54. [Google Scholar] [CrossRef]
  82. TCRN Staff. Water Law in Costa Rica, Crime or Sin of Omission. Costa Rica Times. 4 December 2020. Available online: https://thecostaricanews.com/water-law-in-costa-rica-crime-or-sin-of-omission/ (accessed on 20 April 2022).
Figure 1. Area of study located on the Pacific Slope in the north-central region of Costa Rica. Each sampling station is denoted by initials indicating the river system (RA = Rio Arenjuez, RG= Rio Guacimal and RL = Rio Lagartos) with each sampling station indicated as a red dot. The tourist destination of Monteverde is located at the top of the study area with the upper most sampling sites in the forest reserve. Remaining study sites sample the rivers flowing through various land uses eventually into the Gulf of Nicoya.
Pollutants 03 00032 g001
Figure 2. PCA analysis of all parameters used in the analysis of water quality. Parameter de-criptions similar to Table 1 with the addition of macroinvertebrate families as total number collected in the study. These families are: LeptoP—Leptophlebdiidae, LeptoH—Leptohyphidae, Baet—Baetidae, Elm—Elmidae, Hyd—Hydropsychidae, Per—Perlidae.
Pollutants 03 00032 g002
Figure 3. Comparisons of WQI (panel (a)) and BMWP (panel (b)) to all variables of importance to each of the MMIs. Bars represent calculated VIP statistic from PLS-VIP analysis and error bars represent the 95% confidence interval. Values above 1 suggest significance to the MMI. Abbreviations descriptions as in Table 1.
Pollutants 03 00032 g003
Figure 4. Distributions of the Predominate Insect Families throughout the corridor. Sites on x axis are arranged by elevation. In (a), Bars represent total number of individuals in each family collected throughout the study period (2015–2019). In (b), same data as a percentage.
Pollutants 03 00032 g004
Table 1. Summary statistics (means and standard errors) for collected parameters over the study period (March 2015–March 2019). Sites are organized by elevation (meters). The following parameters are displayed: EPT—different number of Ephemeroptera, Plecoptera and Trichoptera families in samples; BMWP/CR—Biological Monitoring Workers Party Index modified for Costa Rica; PMA—Percent Model Affinity; WQI—Water Quality Index; WQI/CR—Water Quality Index modified for use in Costa Rica. Site name abbreviations are explained in site descriptions.
SiteElevation (M)EPTBMWP/CRPMAWQIWQI/CR
RG-BS15555.2 ± 0.481.7 ± 4.646.0 ± 5.281.6 ± 1.75.2 ± 0.4
RG-RMV14505.5 ± 0.473.7 ± 5.351.1 ± 2.183.3 ± 1.66.0 ± 0.4
RG-RS13724.5 ± 0.568.1 ± 6.137.2 ± 3.684.7 ± 1.75.7 ± 0.4
RL-LL12203.1 ± 0.249.1 ± 3.544.1 ± 2.179.8 ± 2.06.2 ± 0.4
RG-QC9035.6 ± 0.478.2 ± 4.656.5 ± 2.975.8 ± 1.76.4 ± 0.4
RG-LI8726.3 ± 0.587.8 ± 6.360.4 ± 3.177.9 ± 1.36.1 ± 0.4
RG-RSL6616.8 ± 0.493.2 ± 5.161.3 ± 3.377.9 ± 1.16.5 ± 0.4
RG-LR6536.8 ± 0.595.4 ± 6.767.6 ± 2.874.8 ± 4.16.1 ± 0.4
RG-PVC6447.1 ± 0.3100.6 ± 4.867.2 ± 3.580.6 ± 1.65.8 ± 0.4
RA-BC5684.4 ± 0.558.4 ± 6.443.0 ± 3.582.7 ± 1.35.5 ± 0.4
RL-LG3365.9 ± 0.386.9 ± 7.454.7 ± 2.577.7 ± 1.16.3 ± 0.4
RG-PG3066.8 ± 0.490.2 ± 5.058.2 ± 2.777.3 ± 1.16.9 ± 0.3
RA-CM2804.6 ± 0.454.2 ± 5.150.1 ± 1.880.0 ± 1.25.7 ± 0.3
RL-LP1136.2 ± 0.490.3 ± 7.251.4 ± 2.167.4 ± 3.55.8 ± 0.4
RG-0011015.3 ± 0.466.3 ± 5.546.5 ± 2.477.6 ± 1.65.8 ± 0.4
RA-CH334.2 ± 0.342.5 ± 4.446.6 ± 2.371.8 ± 2.56.1 ± 0.4
RG-SA235.6 ± 0.575.8 ± 6.251.1 ± 1.575.4 ± 1.36.2 ± 0.4
RL-LS155.1 ± 0.467.4 ± 6.943.0 ± 2.570.0 ± 1.76.8 ± 0.3
Table 2. Influence of macroinvertebrate families on MMIs. Each Variable of Importance in the Projection (VIP) statistic is shown, including error at the 95% confidence level. Each result highlighted in bold represents a value > 1 suggesting significance in the relationship.
FamilyWQITPBMWP
Leptohyphidae2.09 ± 0.260.10 ± 0.591.33 ± 1.56
Perlidae0.88 ± 0.500.35 ± 0.481.73 ± 1.15
Baetidae0.71 ± 0.811.36 ± 0.860.02 ± 1.42
Leptophlebiidae0.43 ± 0.570.27 ± 0.700.17 ± 1.49
Hydropsychidae0.34 ± 0.561.99 ± 0.711.01 ± 1.79
Elmidae0.19 ± 0.430.01 ± 0.740.42 ± 1.08
Table 3. MD analysis for BMWP (upper correlations) and WQI (lower correlations) showing relationships between these parameters and each stations. Bold correlations are significant at p < 0.05 and demonstrate the relationships between the stations. All stations are organized from the top of the corridor to the bottom representing greater development and impact.
RGBSRG RMVRG-RSRL-LLRG-QCRG-LIRG-RSLRG-LRRG-PVCRA-BCRL-LGRG-PGRA-CMRL-LPRG-001RA-CHRG-SARL-LS
RG-BS00.110.331.890.020.060.230.330.630.960.050.131.340.130.422.730.060.05
RG-RMV0.0400.061.080.040.350.670.841.280.410.310.490.670.490.091.730.080.31
RG-RS0.130.0300.640.180.691.121.311.880.170.010.870.340.880.011.160.110.63
RL-LL0.050.180.3401.512.653.453.814.710.162.533.010.053.010.530.081.262.53
RG-QC0.470.791.110.2200.160.390.520.880.690210.251.020.260.252.250.010.13
RG-LI0.190.410.630.050.0700.050.110.251.590.010.011.990.010.823.630.260.74
RG-RSL0.190.410.640.050.060.0000.010.102.140.070.022.670.021.284.560.541.18
RG-LR0.630.991.340.330.010.130.1300.052.530.130.053.020.051.514.970.691.39
RG-PVC0.010.100.230.010.330.100.110.4603.150.330.193.890.192.895.991.091.96
RA-BC0.020.010.060.120.680.320.320.850.0601.431.790.031.800.110.451.220.14
RL-LG0.210.440.680.060.450.000.000.110.120.3500.021.890.020.753.490.210.67
RG-PG0.260.500.760.080.030.000.000.080.150.400.0002.300.001.024.040.370.93
RA-CM0.040.160.310.000.240.060.060.360.010.101.360.1002.310.260.240.820.31
RL-LP2.793.521.522.120.971.541.540.772.443.251.471.362.1901.024.050.370.93
RG-0010.220.460.700.070.050.010.010.100.130.360.000.010.081.4401.000.160.01
RA-CH1.331.852.310.880.220.520.520.131.091.650.040.420.920.270.4601.961.10
RG-SA0.520.861.190.260.000.080.080.010.376.190.070.052.400.890.060.1900.125
RL-LS1.852.452.971.310.450.860.860.321.602.220.810.731.360.100.780.040.400
Disclaimer/Publisher’s Note: The statements, opinions and data contained in all publications are solely those of the individual author(s) and contributor(s) and not of MDPI and/or the editor(s). MDPI and/or the editor(s) disclaim responsibility for any injury to people or property resulting from any ideas, methods, instructions or products referred to in the content.

