
Fractal Dimension Analyses to Detect Alzheimer’s and Parkinson’s Diseases Using Their Thin Brain Tissue Samples via Transmission Optical Microscopy

 , , and
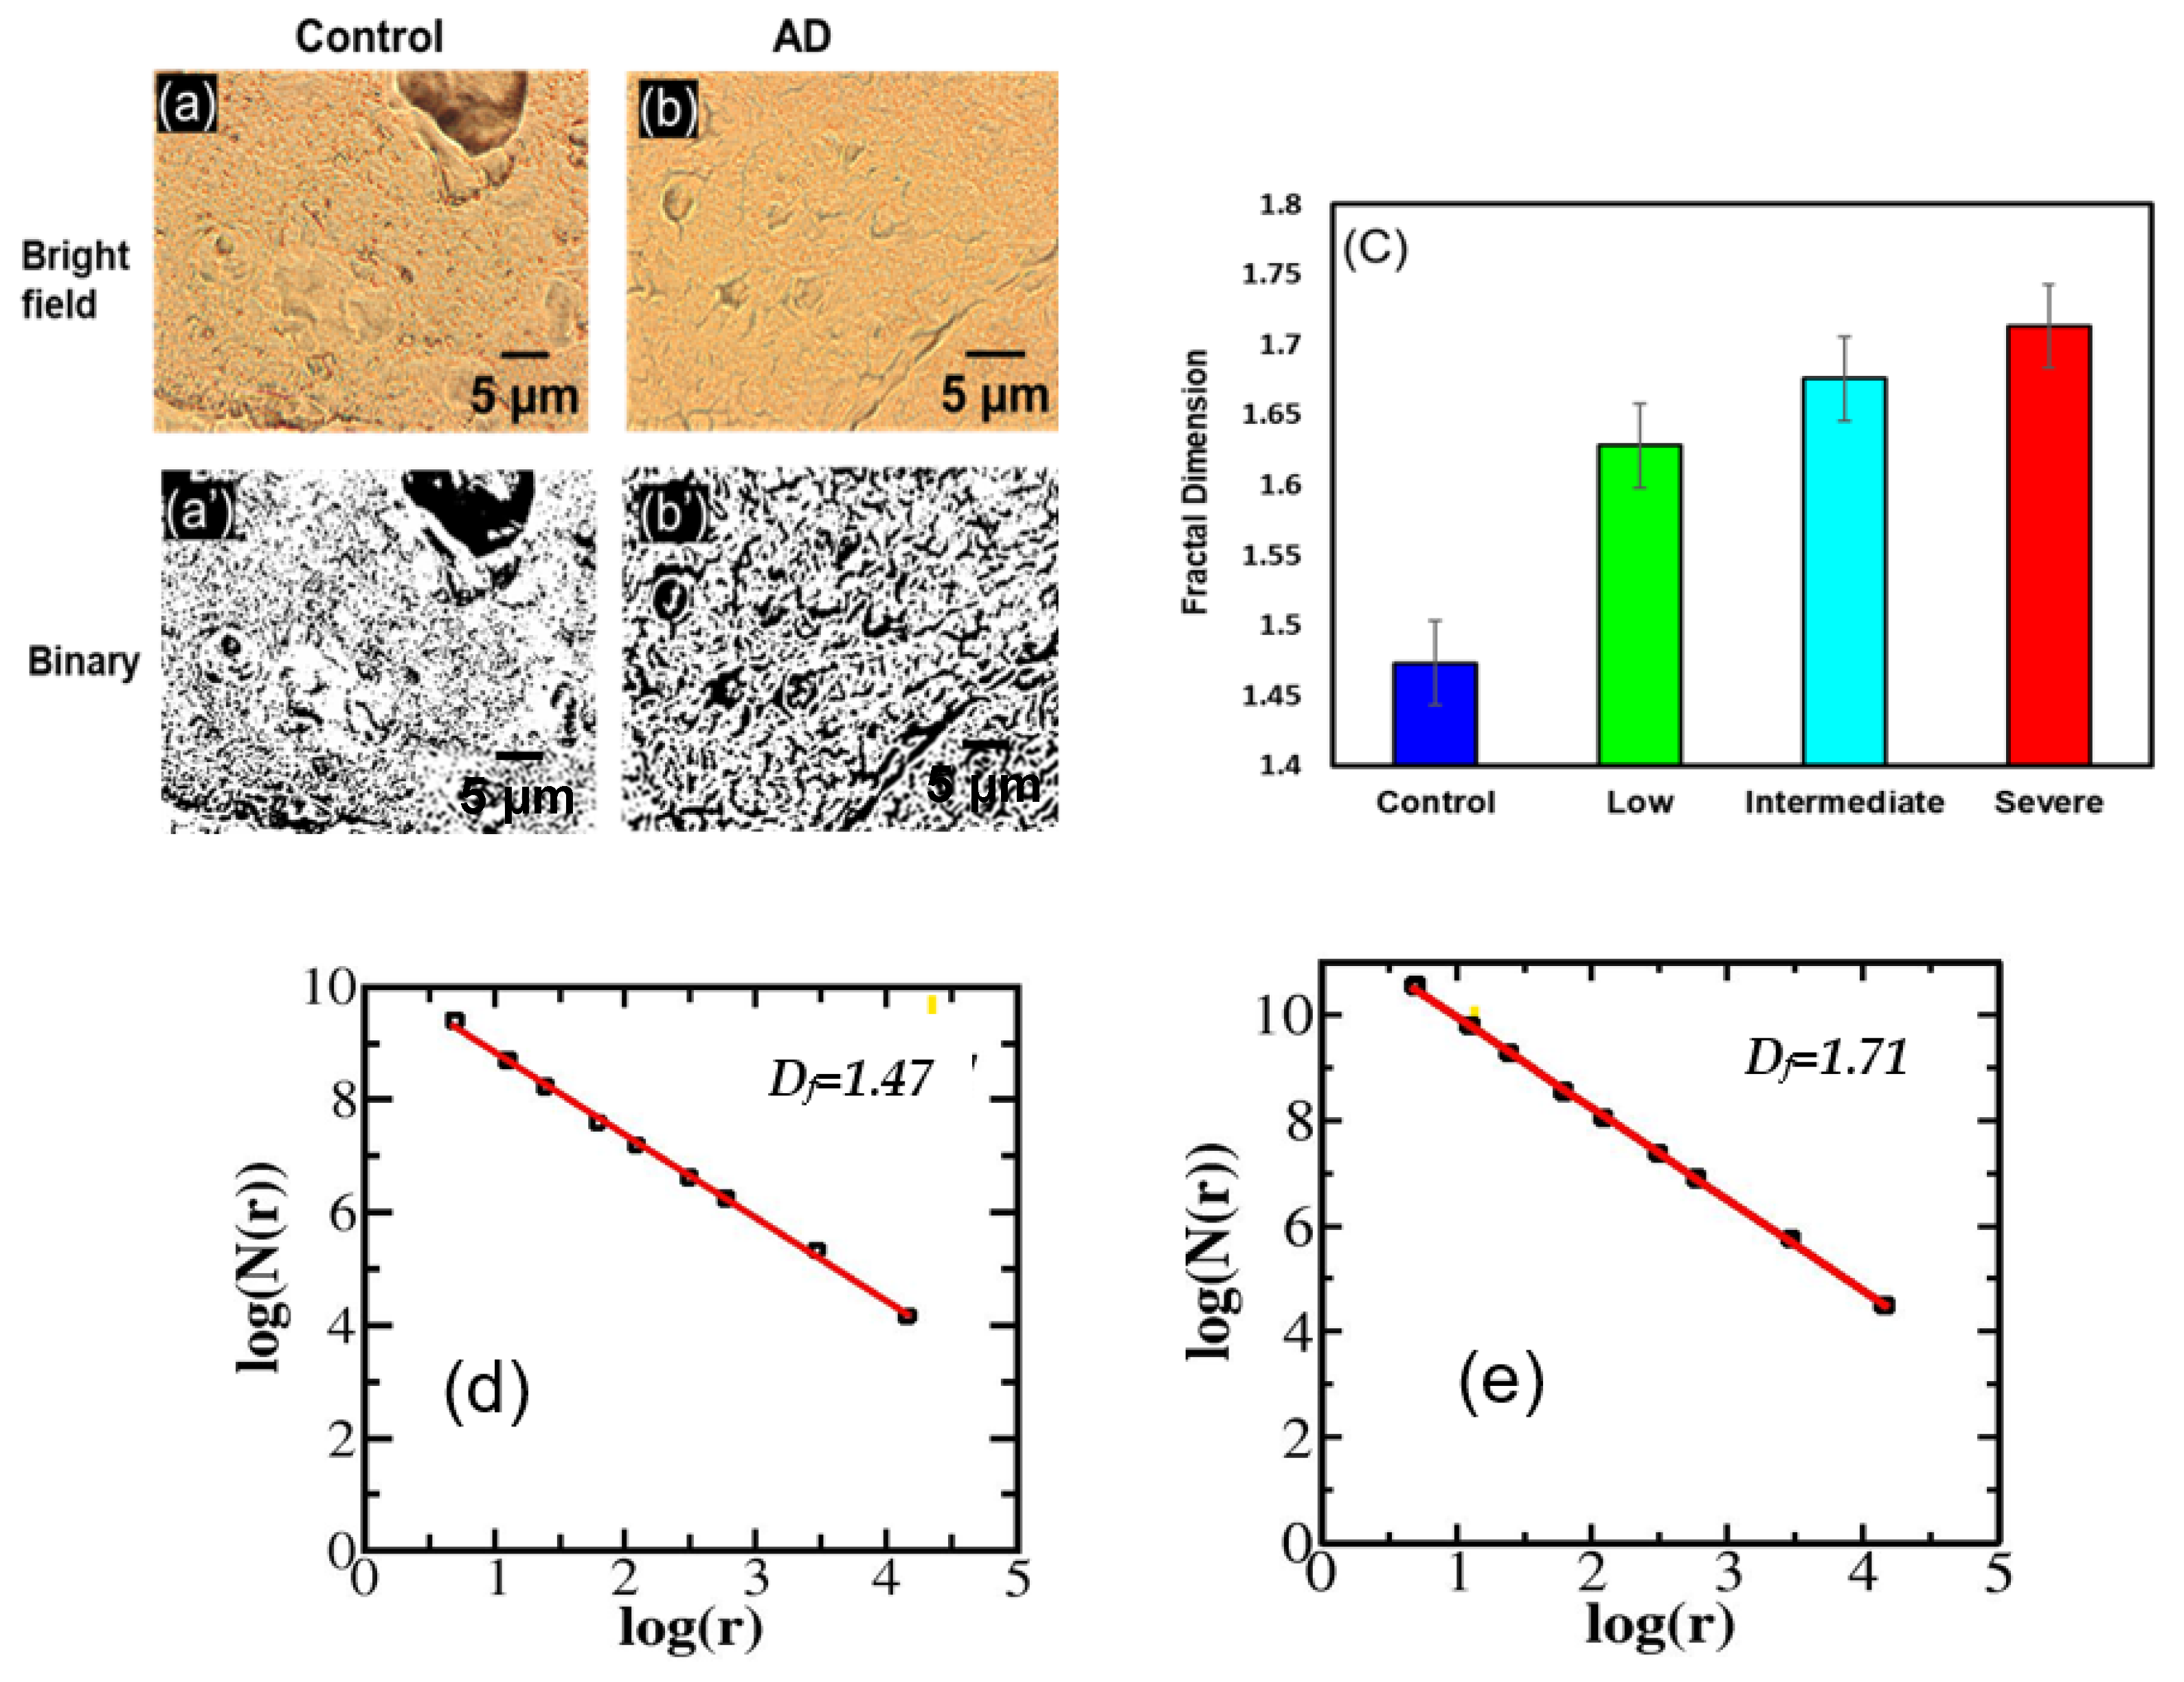
Abstract
:1. Introduction
2. Materials and Methods
2.1. Materials
2.2. Mathematical Methods
2.2.1. Fractals and Fractal Dimensions
2.2.2. Fractal Dimension Calculation from Microscopic Images
2.3. Experimental Setup
2.4. Analysis of Image Data
3. Results
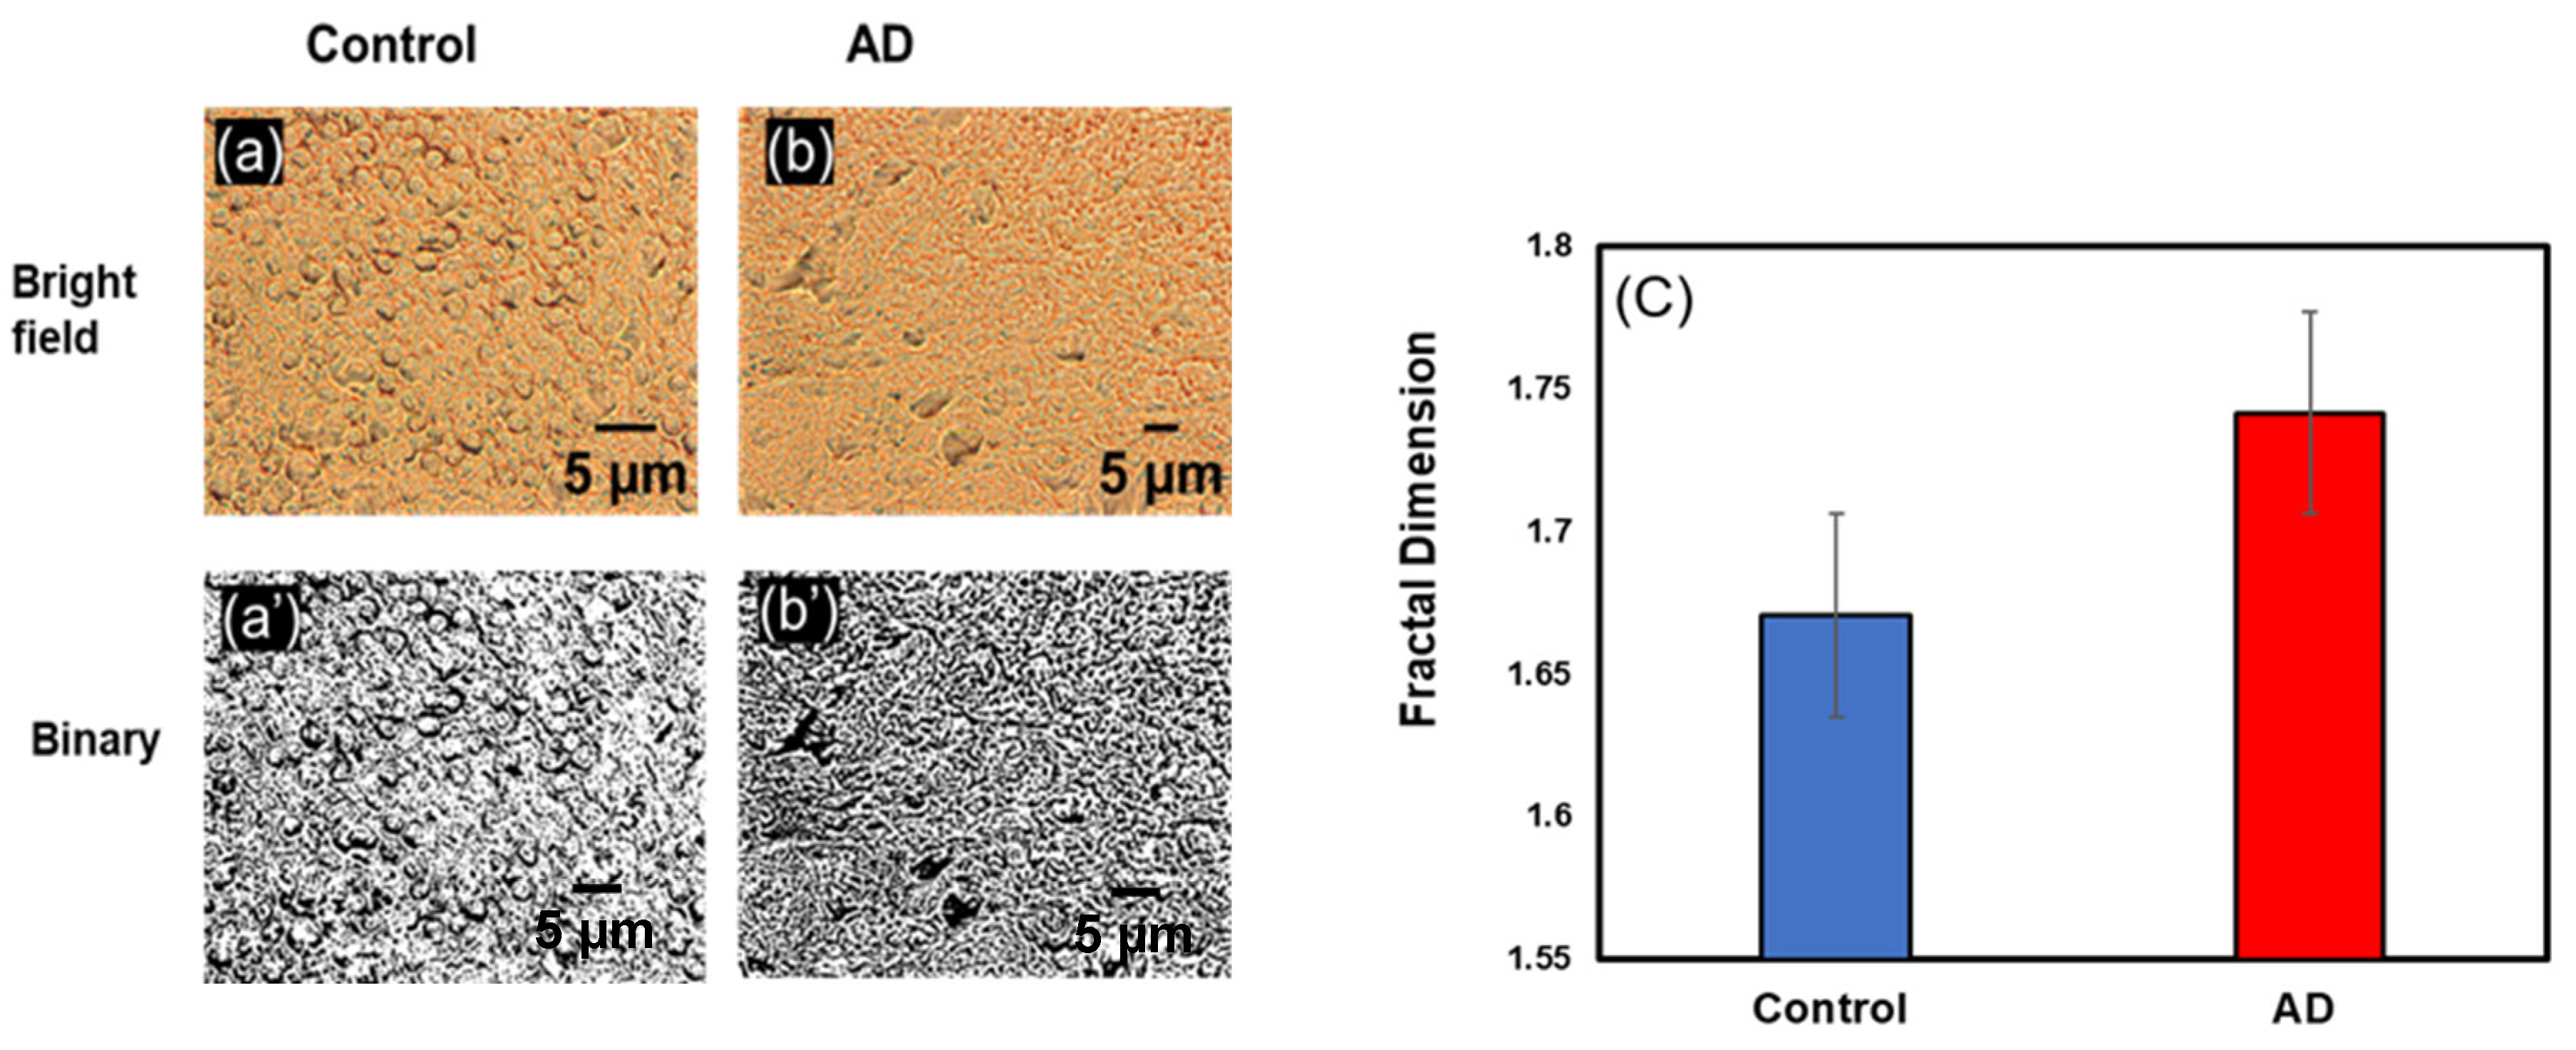
3.1. Change in Fractal Dimension (Df) in Alzheimer’s Disease
3.1.1. Change in Df in Hippocampus
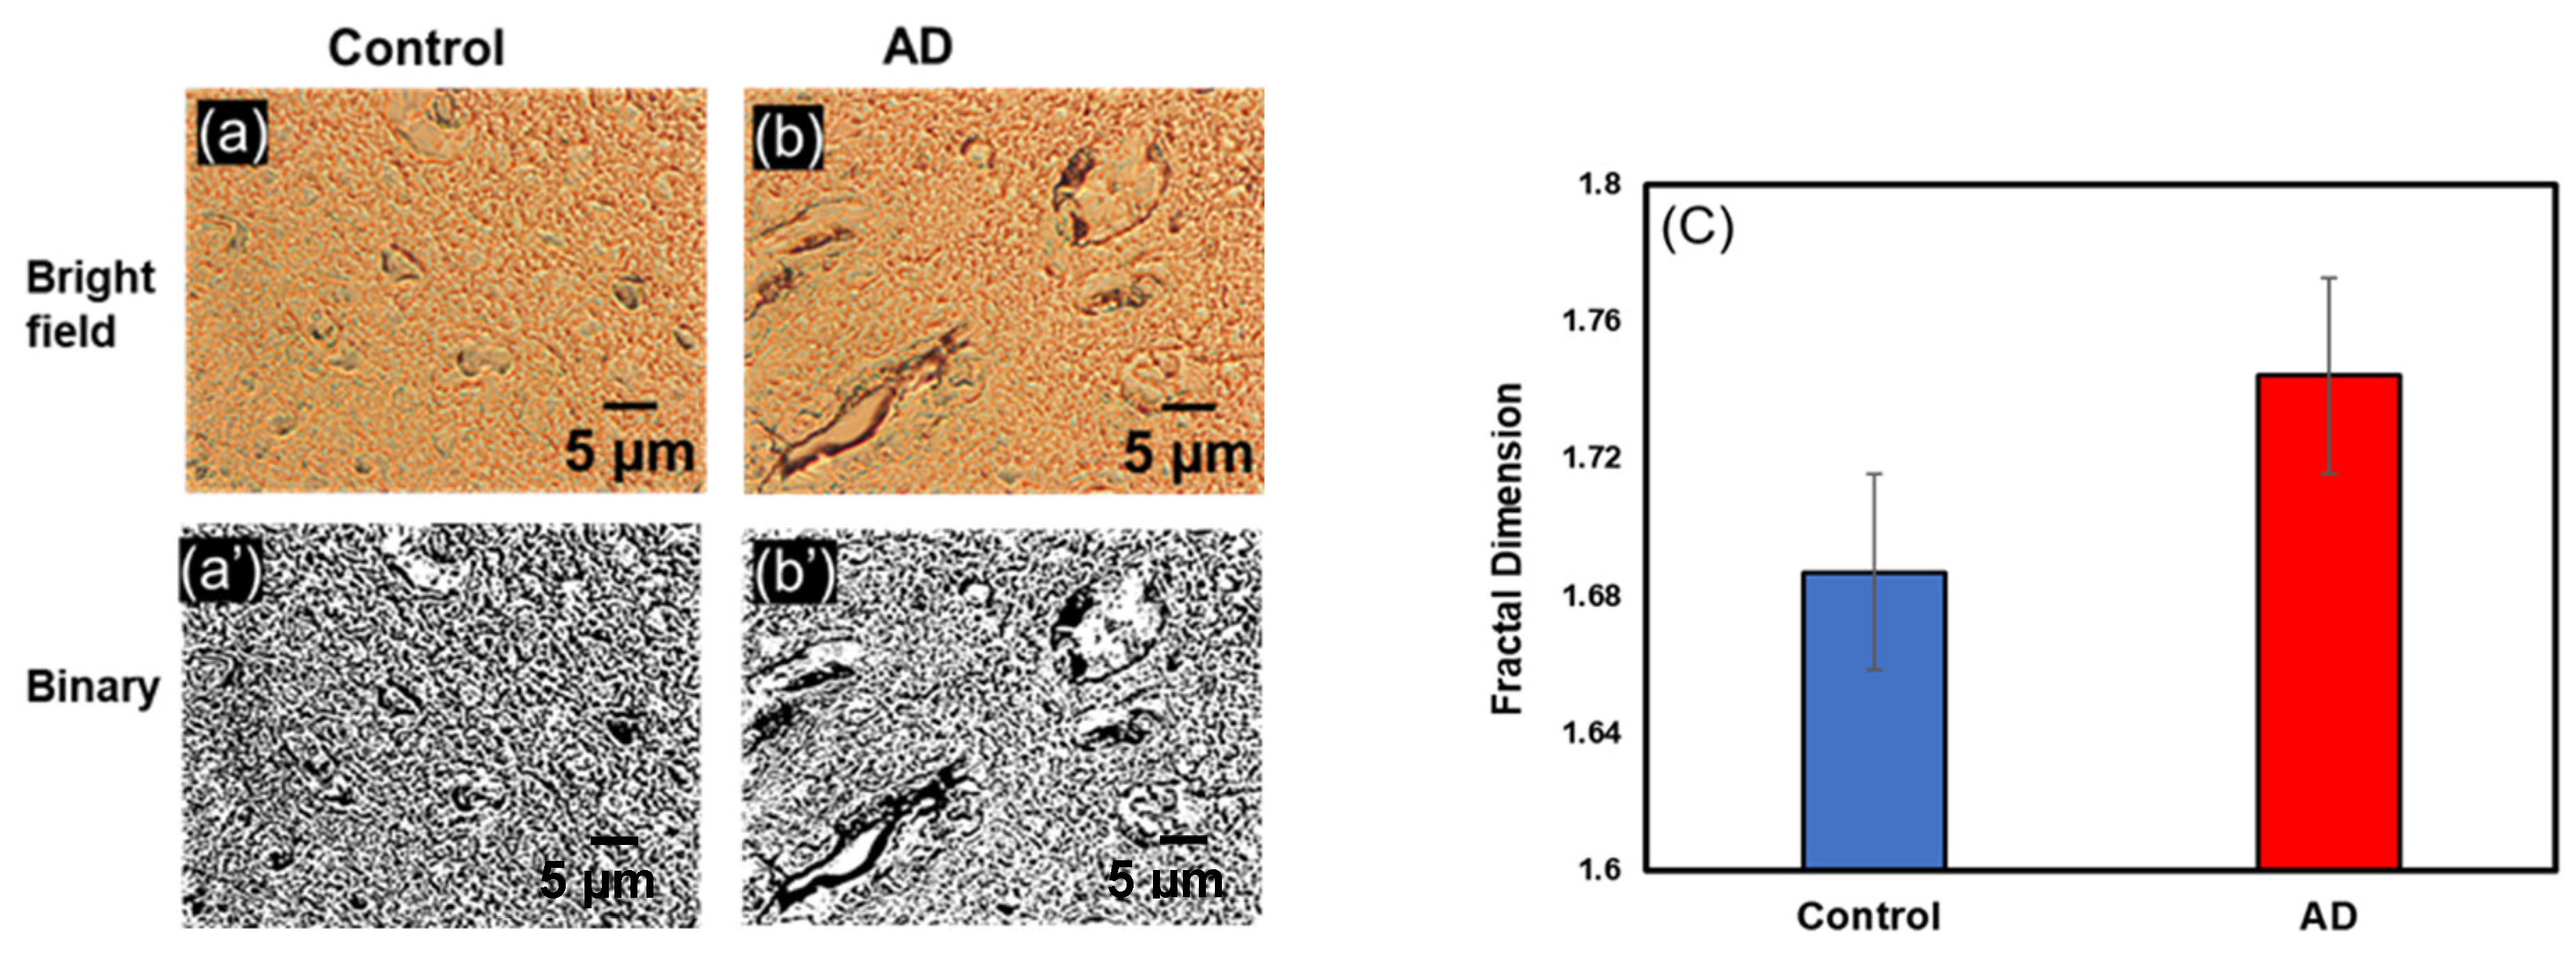
3.1.2. Change in Df in Precentral Gyrus
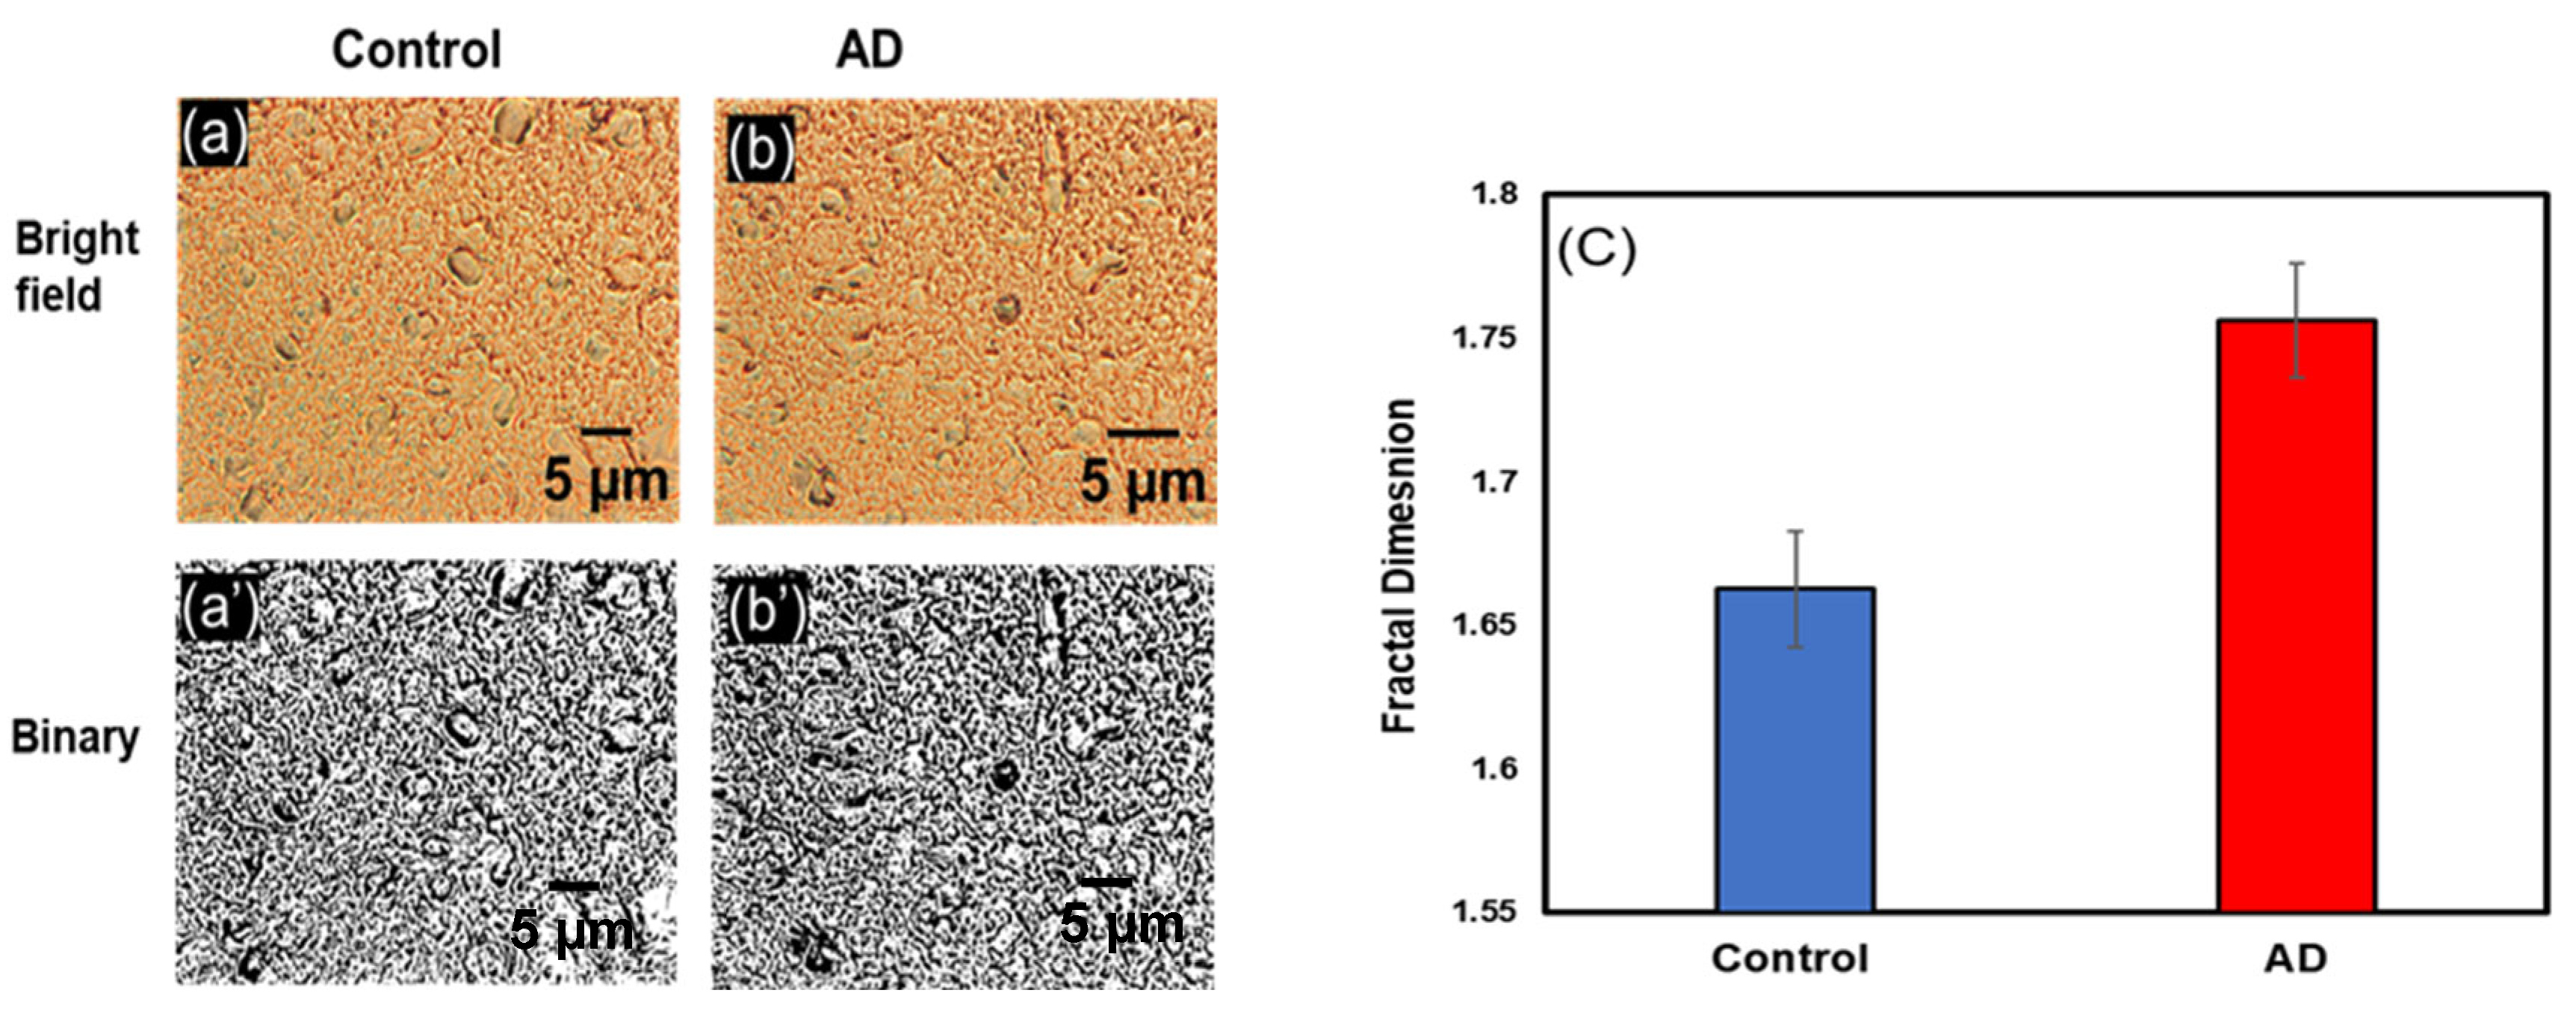
3.1.3. Change in Df in Postcentral Gyrus
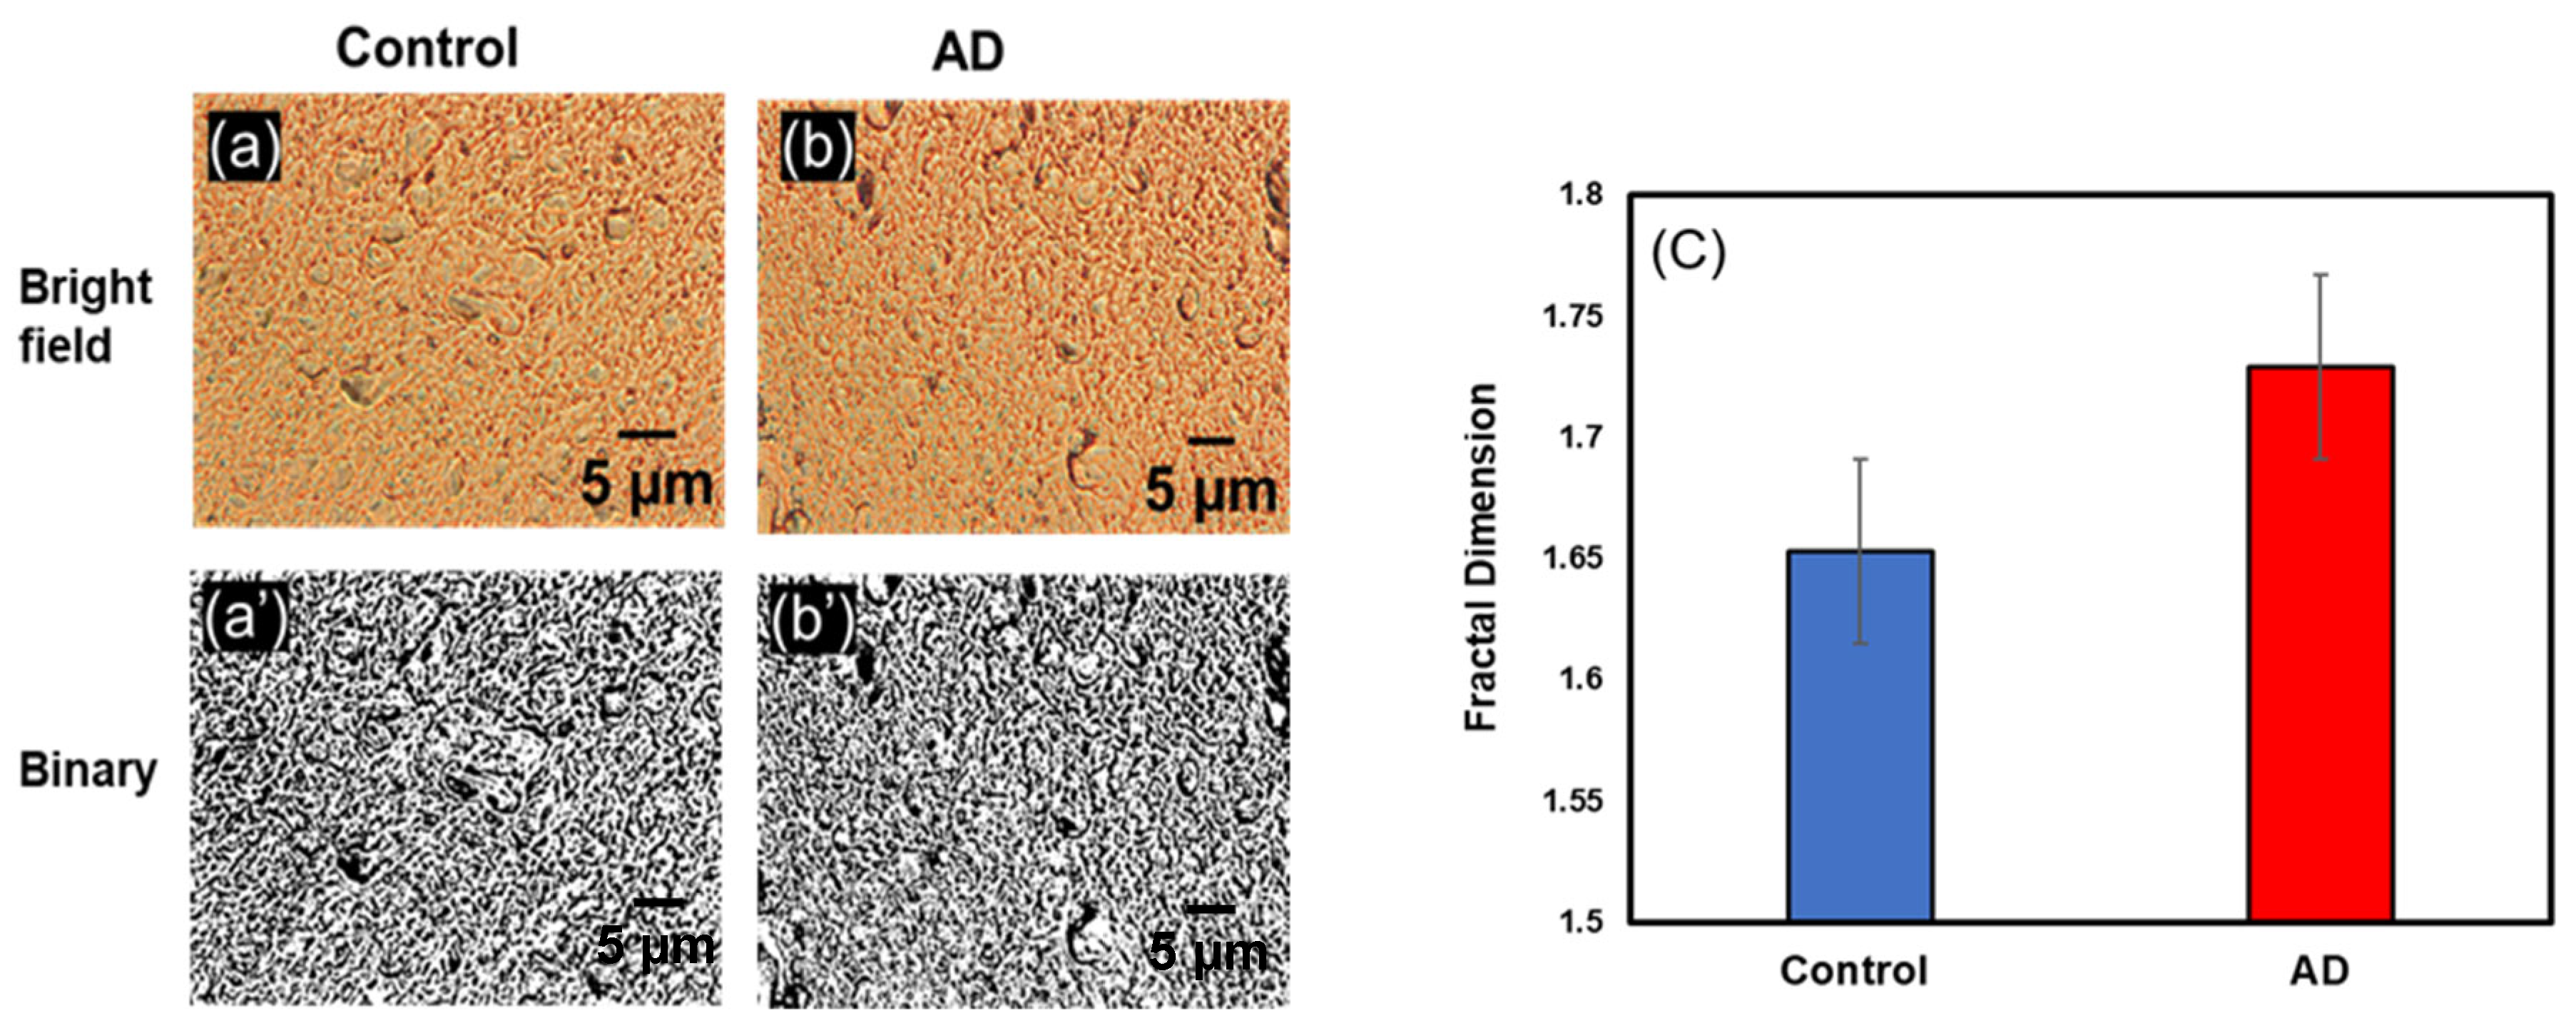
3.1.4. Change in Df in Occipital Lobe
3.1.5. Change in Df in Cerebellum
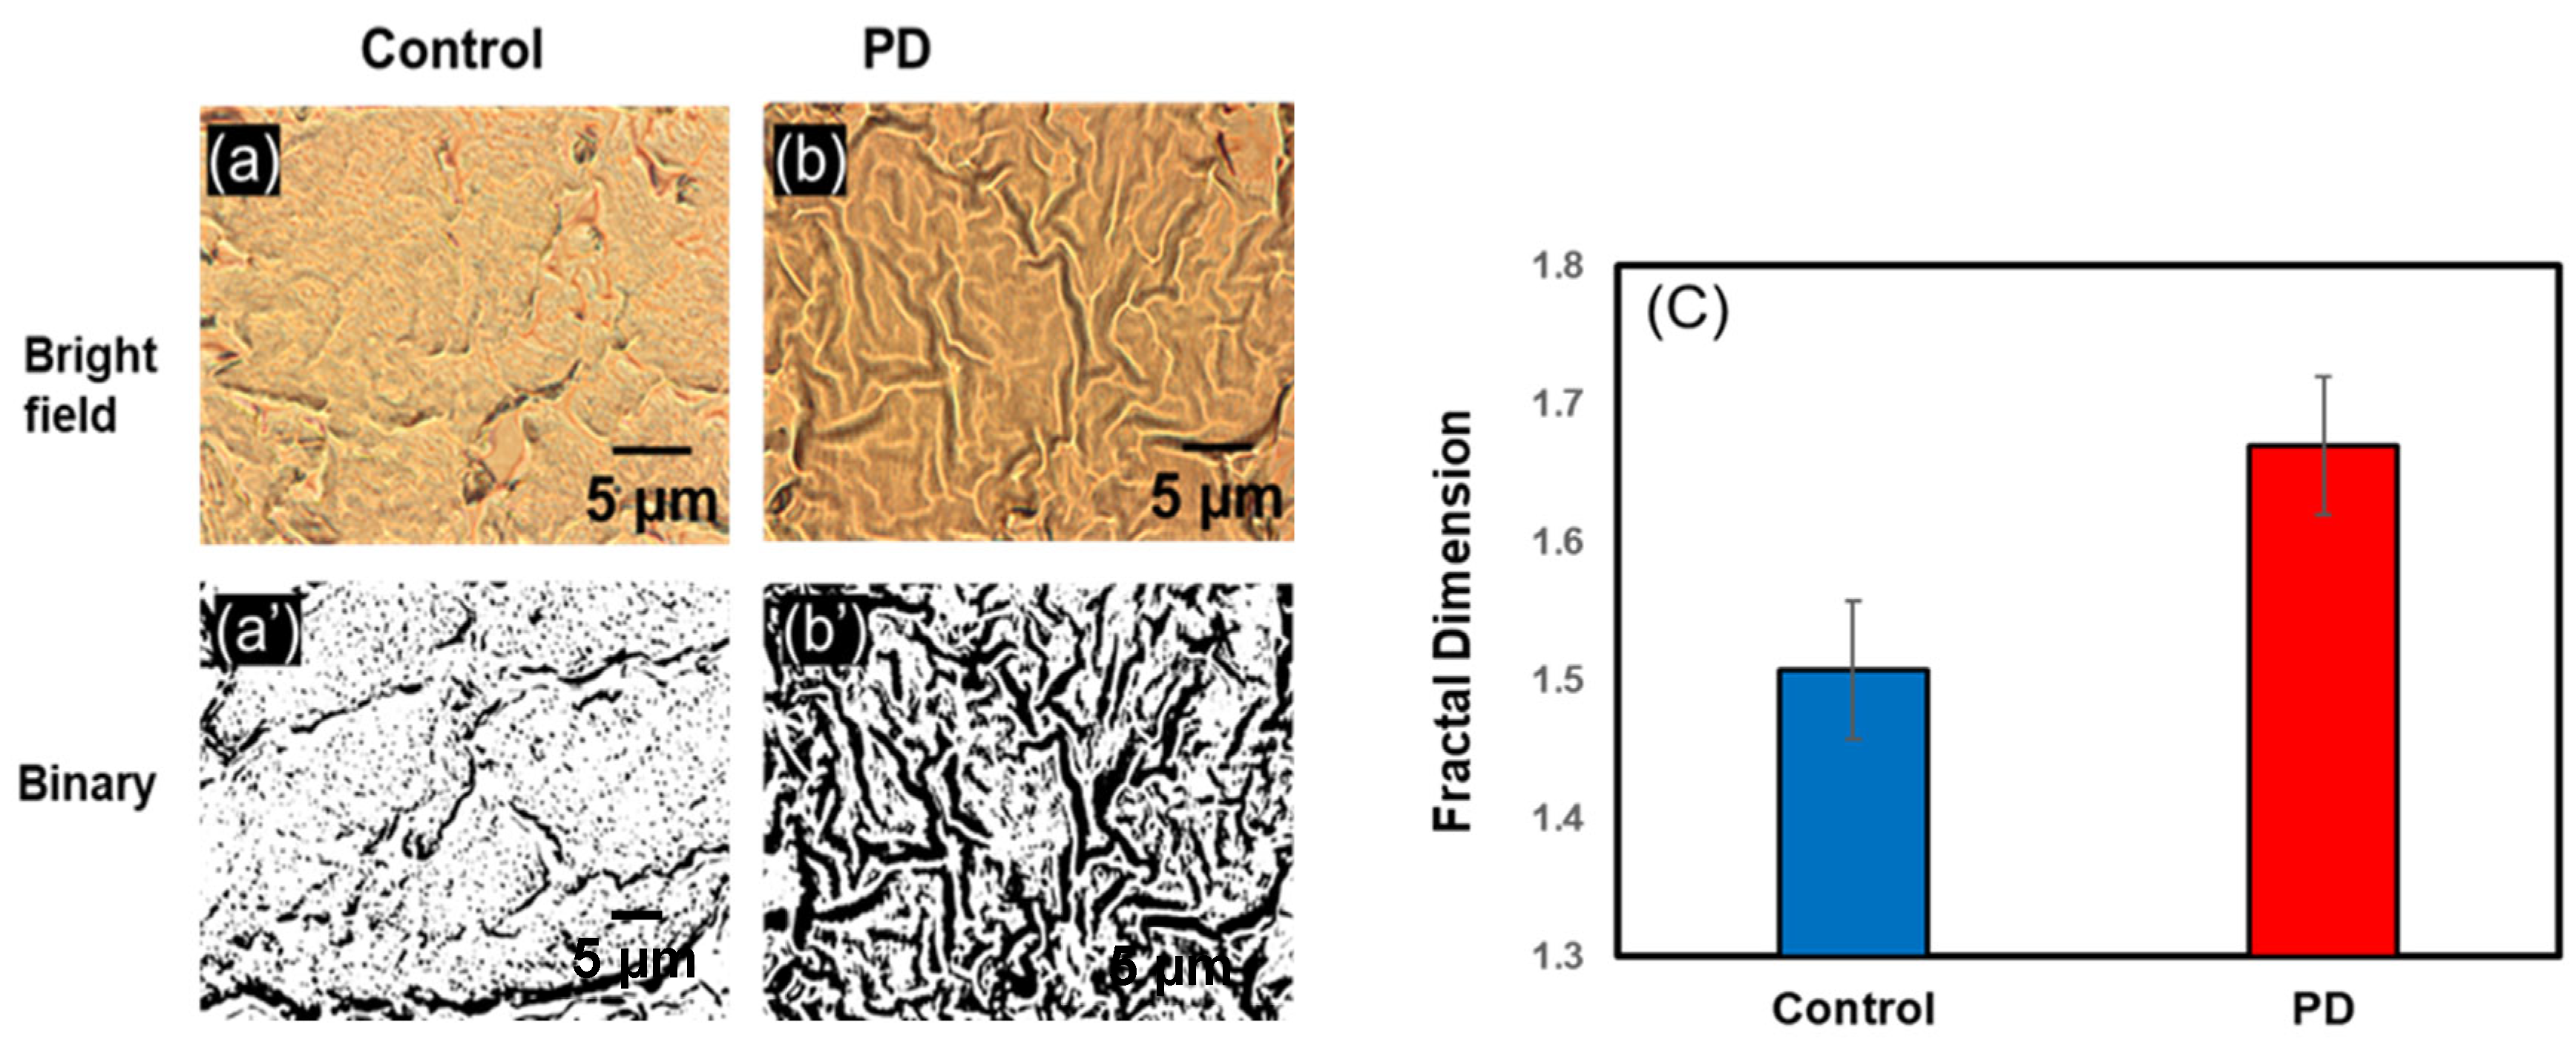
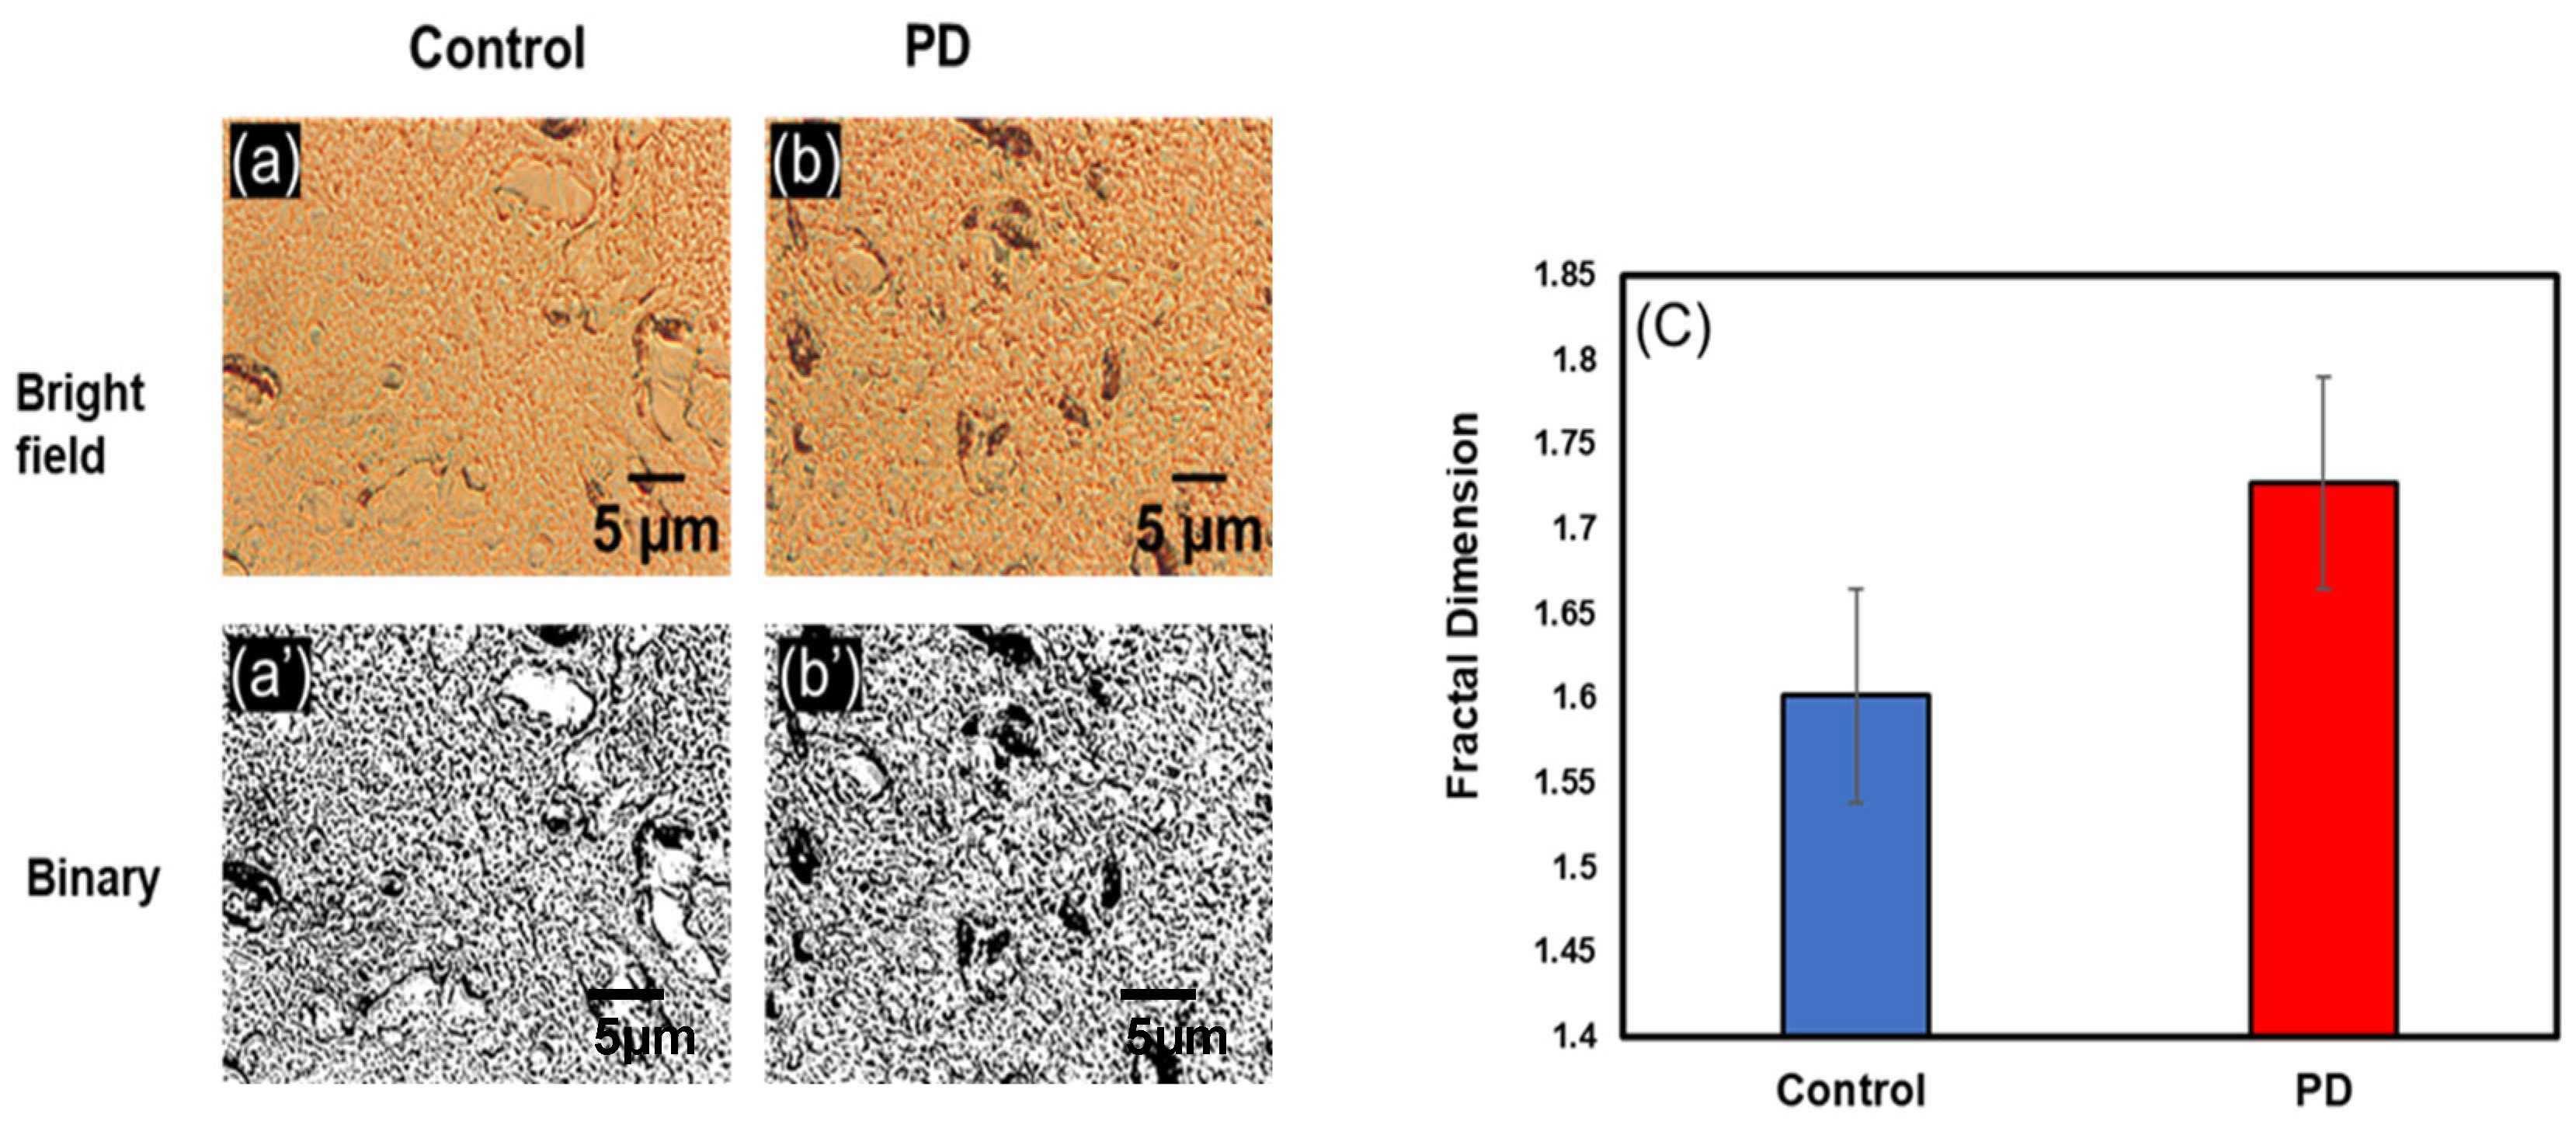
3.2. Change in Fractal Dimension (Df) in Parkinson’s Disease
3.2.1. Change in Df Substantia Nigra
3.2.2. Change in Df in Hippocampus
4. Discussion
5. Conclusions
Author Contributions
Funding
Data Availability Statement
Acknowledgments
Conflicts of Interest
References
- Glenny, R.W.; Robertson, H.T.; Yamashiro, S.; Bassingthwaighte, J.B. Applications of Fractal Analysis to Physiology. J. Appl. Physiol. 1991, 70, 2351–2367. [Google Scholar] [CrossRef]
- Mandelbrot, B.B. Stochastic Models for the Earth’s Relief, the Shape and the Fractal Dimension of the Coastlines, and the Number-Area Rule for Islands. Proc. Natl. Acad. Sci. USA 1975, 72, 3825–3828. [Google Scholar] [CrossRef]
- Cross, S.S. Fractals in Pathology. J. Pathol. 1997, 182, 1–8. [Google Scholar] [CrossRef]
- Tanabe, N.; Sato, S.; Suki, B.; Hirai, T. Fractal Analysis of Lung Structure in Chronic Obstructive Pulmonary Disease. Front. Physiol. 2020, 11, 1661. [Google Scholar] [CrossRef]
- Kato, C.N.; Barra, S.G.; Tavares, N.P.; Amaral, T.M.; Brasileiro, C.B.; Mesquita, R.A.; Abreu, L.G. Use of Fractal Analysis in Dental Images: A Systematic Review. Dentomaxillofac. Radiol. 2020, 49, 20180457. [Google Scholar] [CrossRef] [PubMed]
- Landini, G. Fractals in Microscopy. J. Microsc. 2011, 241, 1–8. [Google Scholar] [CrossRef] [PubMed]
- Pippa, N.; Dokoumetzidis, A.; Demetzos, C.; Macheras, P. On the Ubiquitous Presence of Fractals and Fractal Concepts in Pharmaceutical Sciences: A Review. Int. J. Pharm. 2013, 456, 340–352. [Google Scholar] [CrossRef] [PubMed]
- Husain, A.; Reddy, J.; Bisht, D.; Sajid, M. Fractal Dimension of Coastline of Australia. Sci. Rep. 2021, 11, 6304. [Google Scholar] [CrossRef] [PubMed]
- Grizzi, F.; Spadaccini, M.; Chiriva-Internati, M.; Hegazi, M.A.A.A.; Bresalier, R.S.; Hassan, C.; Repici, A.; Carrara, S. Fractal Nature of Human Gastrointestinal System: Exploring a New Era. World J. Gastroenterol. 2023, 29, 4036–4052. [Google Scholar] [CrossRef]
- Davies, N.A.; Harrison, N.K.; Morris, R.H.K.; Noble, S.; Lawrence, M.J.; D’Silva, L.A.; Broome, L.; Brown, M.R.; Hawkins, K.M.; Williams, P.R.; et al. Fractal Dimension (Df) as a New Structural Biomarker of Clot Microstructure in Different Stages of Lung Cancer. Thromb. Haemost. 2015, 114, 1251–1259. [Google Scholar] [CrossRef]
- Losa, G. Fractal Morphometry of Cell Complexity. Riv. Biol. 2013, 95, 239–258. [Google Scholar]
- Revittser, A.; Selin, I.; Negulyaev, Y.; Chubinskiy-Nadezhdin, V. The Analysis of F-Actin Structure of Mesenchymal Stem Cells by Quantification of Fractal Dimension. PLoS ONE 2021, 16, e0260727. [Google Scholar] [CrossRef]
- Lennon, F.E.; Cianci, G.C.; Cipriani, N.A.; Hensing, T.A.; Zhang, H.J.; Chen, C.-T.; Murgu, S.D.; Vokes, E.E.; Vannier, M.W.; Salgia, R. Lung Cancer—A Fractal Viewpoint. Nat. Rev. Clin. Oncol. 2015, 12, 664–675. [Google Scholar] [CrossRef] [PubMed]
- Bizzarri, M.; Giuliani, A.; Cucina, A.; D’Anselmi, F.; Soto, A.M.; Sonnenschein, C. Fractal Analysis in a Systems Biology Approach to Cancer. Semin. Cancer Biol. 2011, 21, 175–182. [Google Scholar] [CrossRef] [PubMed]
- Losa, G.A.; Nonnenmacher, T.F. Self-Similarity and Fractal Irregularity in Pathologic Tissues. Mod. Pathol. 1996, 9, 174–182. [Google Scholar]
- Di Ieva, A.; Esteban, F.J.; Grizzi, F.; Klonowski, W.; Martín-Landrove, M. Fractals in the Neurosciences, Part II: Clinical Applications and Future Perspectives. Neuroscientist 2015, 21, 30–43. [Google Scholar] [CrossRef]
- Esteban, F.J.; Sepulcre, J.; de Miras, J.R.; Navas, J.; de Mendizábal, N.V.; Goñi, J.; Quesada, J.M.; Bejarano, B.; Villoslada, P. Fractal Dimension Analysis of Grey Matter in Multiple Sclerosis. J. Neurol. Sci. 2009, 282, 67–71. [Google Scholar] [CrossRef]
- Free, S.L.; Sisodiya, S.M.; Cook, M.J.; Fish, D.R.; Shorvon, S.D. Three-Dimensional Fractal Analysis of the White Matter Surface from Magnetic Resonance Images of the Human Brain. Cereb. Cortex 1996, 6, 830–836. [Google Scholar] [CrossRef]
- King, R.D.; George, A.T.; Jeon, T.; Hynan, L.S.; Youn, T.S.; Kennedy, D.N.; Dickerson, B.; The Alzheimer’s Disease Neuroimaging Initiative. Characterization of Atrophic Changes in the Cerebral Cortex Using Fractal Dimensional Analysis. Brain Imaging Behav. 2009, 3, 154–166. [Google Scholar] [CrossRef]
- Bhandari, S.; Choudannavar, S.; Avery, E.R.; Sahay, P.; Pradhan, P. Detection of Colon Cancer Stages via Fractal Dimension Analysis of Optical Transmission Imaging of Tissue Microarrays (TMA). Biomed. Phys. Eng. Express 2018, 4, 065020. [Google Scholar] [CrossRef]
- Elkington, L.; Adhikari, P.; Pradhan, P. Fractal Dimension Analysis to Detect the Progress of Cancer Using Transmission Optical Microscopy. Biophysica 2022, 2, 59–69. [Google Scholar] [CrossRef]
- Avery, E.; Nanda, S.; Regmi, B.; Sahay, P.; Pradhan, P. Numerical Study of the Degree of Light Scattering Strength versus Fractal Dimension in Strong to Weak 2D and 3D Disordered Fractal Optical Media. OSA Contin. OSAC 2020, 3, 844–853. [Google Scholar] [CrossRef]
- Wang, Z.; Tangella, K.; Balla, A.; Popescu, G. Tissue Refractive Index as Marker of Disease. J. Biomed. Opt. 2011, 16, 116017. [Google Scholar] [CrossRef] [PubMed]
- DeTure, M.A.; Dickson, D.W. The Neuropathological Diagnosis of Alzheimer’s Disease. Mol. Neurodegener. 2019, 14, 32. [Google Scholar] [CrossRef]
- Ziukelis, E.T.; Mak, E.; Dounavi, M.-E.; Su, L.; T O’Brien, J. Fractal Dimension of the Brain in Neurodegenerative Disease and Dementia: A Systematic Review. Ageing Res. Rev. 2022, 79, 101651. [Google Scholar] [CrossRef]
- Alzheimer’s Disease Facts and Figures. 2022. Available online: https://alz-journals.onlinelibrary.wiley.com/doi/epdf/10.1002/alz.12638 (accessed on 26 September 2023).
- Bondi, M.W.; Edmonds, E.C.; Salmon, D.P. Alzheimer’s Disease: Past, Present, and Future. J. Int. Neuropsychol. Soc. 2017, 23, 818–831. [Google Scholar] [CrossRef]
- Förstl, H.; Kurz, A. Clinical Features of Alzheimer’s Disease. Eur. Arch. Psychiatry Clin. Neurosci. 1999, 249, 288–290. [Google Scholar] [CrossRef]
- Hampel, H.; Hardy, J.; Blennow, K.; Chen, C.; Perry, G.; Kim, S.H.; Villemagne, V.L.; Aisen, P.; Vendruscolo, M.; Iwatsubo, T.; et al. The Amyloid-β Pathway in Alzheimer’s Disease. Mol. Psychiatry 2021, 26, 5481–5503. [Google Scholar] [CrossRef]
- Querfurth, H.W.; LaFerla, F.M. Alzheimer’s Disease. N. Engl. J. Med. 2010, 362, 329–344. [Google Scholar] [CrossRef]
- Comas-Herrera, A.; Guerchet, M.; Karagiannidou, M.; Knapp, M.; Prince, M. World Alzheimer Report 2016: Improving Healthcare for People Living with Dementia: Coverage, Quality and Costs Now and in the Future; Alzheimer’s Disease International (ADI): London, UK, 2016. [Google Scholar]
- Selkoe, D.J.; Hardy, J. The Amyloid Hypothesis of Alzheimer’s Disease at 25 Years. EMBO Mol. Med. 2016, 8, 595–608. [Google Scholar] [CrossRef]
- Braak, H.; Braak, E. Pathoanatomy of Parkinson’s Disease. J. Neurol. 2000, 247, II3–II10. [Google Scholar] [CrossRef] [PubMed]
- de Lau, L.M.; Breteler, M.M. Epidemiology of Parkinson’s Disease. Lancet Neurol. 2006, 5, 525–535. [Google Scholar] [CrossRef] [PubMed]
- Jankovic, J. Parkinson’s Disease: Clinical Features and Diagnosis. J. Neurol. Neurosurg. Psychiatry 2008, 79, 368–376. [Google Scholar] [CrossRef] [PubMed]
- Ball, N.; Teo, W.-P.; Chandra, S.; Chapman, J. Parkinson’s Disease and the Environment. Front. Neurol. 2019, 10, 218. [Google Scholar] [CrossRef]
- Calne, D.B.; Snow, B.J.; Lee, C. Criteria for Diagnosing Parkinson’s Disease. Ann. Neurol. 1992, 32, S125–S127. [Google Scholar] [CrossRef]
- Radhakrishnan, D.; Goyal, V. Parkinson’s Disease: A Review. Neurol. India 2018, 66, 26. [Google Scholar] [CrossRef]
- Davie, C.A. A Review of Parkinson’s Disease. Br. Med. Bull. 2008, 86, 109–127. [Google Scholar] [CrossRef]
- Kalia, L.V.; Lang, A.E. Parkinson’s Disease. Lancet 2015, 386, 896–912. [Google Scholar] [CrossRef]
- Adhikari, P.; Shukla, P.K.; Alharthi, F.; Bhandari, S.; Meena, A.S.; Rao, R.; Pradhan, P. Photonics Probing of Pup Brain Tissue and Molecular-Specific Nuclear Nanostructure Alterations Due to Fetal Alcoholism via Light Scattering/Localization Approaches. JBO 2022, 27, 076002. [Google Scholar] [CrossRef]
- Subramanian, H.; Pradhan, P.; Liu, Y.; Capoglu, I.R.; Li, X.; Rogers, J.D.; Heifetz, A.; Kunte, D.; Roy, H.K.; Taflove, A.; et al. Optical Methodology for Detecting Histologically Unapparent Nanoscale Consequences of Genetic Alterations in Biological Cells. Proc. Natl. Acad. Sci. USA 2008, 105, 20118–20123. [Google Scholar] [CrossRef]
- Metze, K.; Adam, R.; Florindo, J.B. The Fractal Dimension of Chromatin–a Potential Molecular Marker for Carcinogenesis, Tumor Progression and Prognosis. Expert Rev. Mol. Diagn. 2019, 19, 299–312. [Google Scholar] [CrossRef] [PubMed]
- Bendler, J. Fractals in Science. J. Stat. Phys. 1995, 81, 857–860. [Google Scholar] [CrossRef]
- De Arruda, P.F.F.; Gatti, M.; Junior, F.N.F.; De Arruda, J.G.F.; Moreira, R.D.; Murta, L.O.; De Arruda, L.F.; De Godoy, M.F. Quantification of Fractal Dimension and Shannon’s Entropy in Histological Diagnosis of Prostate Cancer. BMC Clin. Pathol. 2013, 13, 6. [Google Scholar] [CrossRef]
- Losa, G.A.; Ristanović, D.; Ristanović, D.; Zaletel, I.; Beltraminelli, S. From Fractal Geometry to Fractal Analysis. Appl. Math. 2016, 7, 346–354. [Google Scholar] [CrossRef]
- Losa, G.A. The Fractal Geometry of Life. Biol. Forum/Riv. Biol. 2009, 102, 29–59. [Google Scholar]
- Ficker, T.; Benesovský, P. Deterministic Fractals. Eur. J. Phys. 2002, 23, 403. [Google Scholar] [CrossRef]
- Naguib, R.N.G.; Sharif, B.S.; Bennett, M.K.; Murray, A. Fractal Analysis in the Detection of Colonic Cancer Images. IEEE Trans. Inform. Technol. Biomed. 2002, 6, 54–58. [Google Scholar] [CrossRef]
- Pirici, D.; Mogoantă, L.; Mărgăritescu, O.; Pirici, I.; Tudorică, V.; Coconu, M. Fractal Analysis of Astrocytes in Stroke and Dementia. Rom. J. Morphol. Embryol. 2009, 50, 381–390. [Google Scholar]
- Nichita, M.-V.; Paun, M.-A.; Paun, V.-A.; Paun, V.-P. Fractal Analysis of Brain Glial Cells. Fractal Dimension and Lacunarity. Univ. Politeh. Buchar. Sci. Bull. Ser. A Appl. Math. Phys. 2019, 81, 273–284. [Google Scholar]
- Stankovic, M.; Pantic, I.; De Luka, S.R.; Puskas, N.; Zaletel, I.; Milutinovic-Smiljanic, S.; Pantic, S.; Trbovich, A.M. Quantification of Structural Changes in Acute Inflammation by Fractal Dimension, Angular Second Moment and Correlation. J. Microsc. 2016, 261, 277–284. [Google Scholar] [CrossRef]
- Pirici, D.; Van Cauwenberghe, C.; Van Broeckhoven, C.; Kumar-Singh, S. Fractal Analysis of Amyloid Plaques in Alzheimer’s Disease Patients and Mouse Models. Neurobiol. Aging 2011, 32, 1579–1587. [Google Scholar] [CrossRef] [PubMed]
- Rancu, A.; Chen, C.X.; Price, H.; Wax, A. Multiscale Optical Phase Fluctuations Link Disorder Strength and Fractal Dimension of Cell Structure. Biophys. J. 2023, 122, 1390–1399. [Google Scholar] [CrossRef] [PubMed]
- Smith, T.G.; Marks, W.B.; Lange, G.D.; Sheriff, W.H.; Neale, E.A. A Fractal Analysis of Cell Images. J. Neurosci. Methods 1989, 27, 173–180. [Google Scholar] [CrossRef] [PubMed]
- Beuthan, J.; Minet, O.; Helfmann, J.; Herrig, M.; Müller, G. The Spatial Variation of the Refractive Index in Biological Cells. Phys. Med. Biol. 1996, 41, 369. [Google Scholar] [CrossRef]
- Liu, P.Y.; Chin, L.K.; Ser, W.; Chen, H.F.; Hsieh, C.-M.; Lee, C.-H.; Sung, K.-B.; Ayi, T.C.; Yap, P.H.; Liedberg, B.; et al. Cell Refractive Index for Cell Biology and Disease Diagnosis: Past, Present and Future. Lab Chip 2016, 16, 634–644. [Google Scholar] [CrossRef]
- Wu, L.; Qu, X. Cancer Biomarker Detection: Recent Achievements and Challenges. Chem. Soc. Rev. 2015, 44, 2963–2997. [Google Scholar] [CrossRef]
- Punnoose, A.; Nanda, S.; Pradhan, P. Reflectance Statistics from a Thin Weakly Disordered Optical Media: Application to Detection of Structural Alterations in Cells/Tissues. Opt. Express 2021, 29, 43612. [Google Scholar] [CrossRef]
- Pradhan, P.; Damania, D.; Roy, H.K.; Joshi, H.; Taflove, A.; Backman, V. Quantification of Nanoscale Density Fluctuations in Biological Cells/Tissues: Inverse Participation Ratio (IPR) Analysis of Transmission Electron Microscopy Images and Implications for Early-Stage Cancer Detection. Bull. Am. Phys. Soc. 2010, 55. [Google Scholar]
- Tao, Y.; Ding, Z. Reflective Mesoscopic Spectroscopy for Noninvasive Detection of Reflective Index Alternations at Nano-Scale. J. Phys. Conf. Ser. 2011, 277, 012035. [Google Scholar] [CrossRef]
- Almabadi, H.M. Mesoscopic Light Scattering Approach for Structural Disorder Analysis of Biological Cells: Application in Cancer Diagnostics. 2018. Available online: https://digitalcommons.memphis.edu/etd/1909 (accessed on 22 July 2023).
- Subramanian, H.; Pradhan, P.; Liu, Y.; Capoglu, I.R.; Rogers, J.D.; Roy, H.K.; Brand, R.E.; Backman, V. Partial-Wave Microscopic Spectroscopy Detects Subwavelength Refractive Index Fluctuations: An Application to Cancer Diagnosis. Opt. Lett. 2009, 34, 518–520. [Google Scholar] [CrossRef]


Disclaimer/Publisher’s Note: The statements, opinions and data contained in all publications are solely those of the individual author(s) and contributor(s) and not of MDPI and/or the editor(s). MDPI and/or the editor(s) disclaim responsibility for any injury to people or property resulting from any ideas, methods, instructions or products referred to in the content. |
© 2023 by the authors. Licensee MDPI, Basel, Switzerland. This article is an open access article distributed under the terms and conditions of the Creative Commons Attribution (CC BY) license (https://creativecommons.org/licenses/by/4.0/).
Share and Cite
Apachigawo, I.; Solanki, D.; Tate, R.; Singh, H.; Khan, M.M.; Pradhan, P. Fractal Dimension Analyses to Detect Alzheimer’s and Parkinson’s Diseases Using Their Thin Brain Tissue Samples via Transmission Optical Microscopy. Biophysica 2023, 3, 569-581. https://doi.org/10.3390/biophysica3040039
Apachigawo I, Solanki D, Tate R, Singh H, Khan MM, Pradhan P. Fractal Dimension Analyses to Detect Alzheimer’s and Parkinson’s Diseases Using Their Thin Brain Tissue Samples via Transmission Optical Microscopy. Biophysica. 2023; 3(4):569-581. https://doi.org/10.3390/biophysica3040039
Chicago/Turabian StyleApachigawo, Ishmael, Dhruvil Solanki, Ruth Tate, Himanshi Singh, Mohammad Moshahid Khan, and Prabhakar Pradhan. 2023. "Fractal Dimension Analyses to Detect Alzheimer’s and Parkinson’s Diseases Using Their Thin Brain Tissue Samples via Transmission Optical Microscopy" Biophysica 3, no. 4: 569-581. https://doi.org/10.3390/biophysica3040039