Article

Dry and Hydrothermal Co-Carbonization of Mixed Refuse-Derived Fuel (RDF) for Solid Fuel Production

1
Mechanical Engineering and Resource Sustainability Center, Department of Chemistry, Faculty of Sciences and Technology, Campus de Caparica, NOVA University of Lisbon, 2829-516 Caparica, Portugal
2
CoLAB BIOREF—Collaborative Laboratory for Biorefineries, 4466-901 Sao Mamede de Infesta, Portugal
3
VALORIZA, Research Centre for Endogenous Resource Valorization, Polytechnic Institute of Portalegre, 7300-555 Portalegre, Portugal
4
Forest Research Centre, School of Agriculture, University of Lisbon, Tapada da Ajuda, 1349-017 Lisboa, Portugal
*
Author to whom correspondence should be addressed.
Reactions 2024, 5(1), 77-97; https://doi.org/10.3390/reactions5010003
Submission received: 7 November 2023 / Revised: 19 December 2023 / Accepted: 6 January 2024 / Published: 16 January 2024

Abstract

:
The present study aims to test several conditions of the thermochemical pretreatment of torrefaction and carbonization to improve the physical and combustible properties of the Portuguese RDF. Therefore, two different types of RDF were submitted alone or mixed in 25%, 50%, and 75% proportions to dry carbonization processes in a range of temperatures between 250 to 350 °C and residence time between 15 and 60 min. Hydrothermal carbonization was also carried out with RDF samples and their 50% mixture at temperatures of 250 and 300 °C for 30 min. The properties of the 51 chars and hydrochars produced were analyzed. Mass yield, apparent density, proximate and elemental analysis, ash mineral composition, and higher heating value (HHV), among others, were determined to evaluate the combustion behavior improvement of the chars. The results show that after carbonization, the homogeneity and apparent density of the chars were increased compared to the raw RDF wastes. The chars and hydrochars produced present higher HHV and lower moisture and chlorine content. In the case of chars, a washing step seems to be essential to reduce the chlorine content to allow them to be used as an alternative fuel. In conclusion, both dry and wet carbonization demonstrated to be important pretreatments of the RDF to produce chars with improved physical and combustion properties.

1. Introduction

The energy recovery of wastes is a relevant strategy to divert materials with high energetic content from landfills, reduce the consumption of fossil fuels, and consequently increase resource efficiency. In this context, the production of refuse-derived fuel (RDF) plays a promising role in replacing traditional energy sources with alternative and more sustainable forms. Several barriers hinder the production and marketing of RDFs for use in energy-intensive industrial activities, such as cement plants and thermoelectric power plants. Parameters such as moisture, chlorine, and mercury contents are fundamental to evaluating the quality of the RDF and, consequently, its certification to be used as an alternative fuel [1].
The RDF composition varies considerably according to its source and form of production, among others. The high heterogeneity of RDF concerning its composition and non-uniform particle size is an issue that can affect the burning intensity and heat transfer during the combustion process [2]. For instance, the RDFs produced from municipal solid wastes (MSW) usually present a large proportion of plastic that may represent high levels of chlorinated gas emissions during their combustion, which cause corrosion of equipment and are harmful to the environment and human health. On the other hand, RDFs produced from construction and demolition wastes are composed mainly of lignocellulosic material and usually present lower calorific values due to the high moisture content in raw biomass. In addition, the amount and composition of ash are also factors that influence the quality of RDF, and its combustion may be related to fouling and slagging problems in the reactors [3].
Thermochemical valorization of RDF is currently used to improve physical and chemical characteristics of the raw waste by increasing homogeneity and friability and enhancing combustible properties, but some implications, such as high volume, moisture content, and the melting of polymeric materials, increase concerns regarding the energetic valorization of this waste fraction. Thermochemical conversion processes of RDF, such as torrefaction and carbonization, have been reported as a pre-treatment to improve fuel properties before combustion or gasification [4,5,6].
Torrefaction is a thermal process under an inert atmosphere (200–300 °C) that may be applied as a pre-treatment to reduce water and volatile compounds, usually in lignocellulosic wastes, and turn them easier to be shredded, pelletized, stored, and transported [7]. Many works report the use of torrefaction to improve the physical and fuel characteristics of biomass [7,8,9,10]. Cahyanti et al. [11] report an increase in friability and energetic densification of chars after torrefaction, in addition to a reduction in crushing and transportation costs. Rago et al. [12] also reported that the torrefaction of mixtures of plastic and lignocellulosic wastes demonstrates a synergistic effect that increases the mass yield and energy content of chars.
Similarly, carbonization (300–500 °C) is also applied as a thermochemical treatment to improve the physical and combustible characteristics of wastes and is preferably used on wastes with a higher concentration of plastics that require higher temperatures for decomposition [13]. Umeda et al. [14] describe that low-temperature carbonization (300 °C) leads to the production of chars with better calorific value and lower tars content before being submitted to the gasification process. Alves et al. [15] concluded the viability of producing char with improved fuel characteristics from a waste composed of plastic and biomass mixtures (solid recovered fuel, SRF) by applying carbonization at 300 °C for minutes.
However, even with the improvement of the physical and combustible characteristics of the RDF after being submitted to thermochemical valorization processes, the concentration of chlorine in the biochar present in the polymeric fraction is still a problem to be addressed. In this context, the co-hydrothermal carbonization (co-HTC) of plastic waste with biomass has been tested and shown a positive effect on the dechlorination efficiency of the produced chars [16,17].
HTC is a thermochemical process that uses water as the reaction medium at relatively low temperatures (180–300 °C) under autogenic pressure and an inert atmosphere. One of the advantages of HTC is the possibility of using biomass with a high moisture content without the need for a drying pre-treatment. This allows lignocellulosic biomass with a high moisture content to be converted into hydrophobic chars with a higher calorific value [18]. On the other hand, the mass yield of the hydrochars is generally low due to the rapid degradation of biomass components under these conditions. Thus, the co-HTC of biomass and plastic has been applied in recent works to produce more homogeneous chars with improved fuel properties and higher mass yields [19,20]. According to Shen [21], the presence of lignin improves the physical quality of the chars, preventing the agglomeration of particles caused by melting plastic. In addition, the process removes chlorine from the polymeric fraction and, at the same time, reduces the alkali content of the lignocellulosic fraction, which can cause fouling problems in the reactors [22].
Therefore, due to the difference in the composition of the wastes, it becomes relevant to study and compare different thermochemical processes and recovery conditions (temperature and residence time), as well as the mixture of wastes from different sources to evaluate the synergistic effect of these interactions in the production of chars/hydrochars, with improved fuel properties and reduced levels of chlorine. In this context, co-carbonization appears as a promising treatment to valorize mixed waste more efficiently [22,23].
The main objective of this work was to evaluate the physical and chemical improvements on the chars produced by torrefaction, carbonization, and hydrothermal carbonization of raw industrial RDFs from a local waste management company and their mixtures in different proportions aiming waste valorization through thermochemical processes.

2. Materials and Methods

2.1. Raw Materials

Two types of refuse-derived fuel (RDF) provided by a local waste management company were used in the carbonization experiments. Even though they are produced by the same waste management company, they differ considerably in their composition. One of them is composed essentially of wood chips (81.5 ± 5.4%), with waste paper incorporation (12.9 ± 5.2%), as well as small proportions of textiles (1.4 ± 0.4%), plastic (1.3 ± 1.1%), and dust/miscellaneous (2.1 ± 0.7%), and was denominated as RDF-L (Figure 1a) The other is mainly composed of plastics (39.0 ± 6.4%), with a lesser amount of wood (16.5 ± 3.0%), textile (12.6 ± 2.1%), paper (9.9 ± 2.2%), and dust/miscellaneous (20.2 ± 3.6%), and was termed as RDF-P (Figure 1b). Before the sample preparation, both RDFs were crushed to obtain a lower granulometry (Supplementary Figures S1 and S2).

2.2. Low-Temperature Carbonization Experiments

Both RDFs were submitted to torrefaction/carbonization tests at temperatures of 250, 300, and 350 °C and residence times of 15, 30, and 60 min. The wastes were also mixed in different proportions and submitted to the same carbonization conditions. For dry carbonization, a total of five different mixtures were prepared with 0, 25, 50, 75, and 100% of RDF-P incorporation. The raw RDF samples were heated in covered porcelain crucibles using a muffle furnace (Nabertherm® L3/1106, Lilienthal, Germany). Also, hydrothermal carbonization was carried out for both wastes, and the mixture was composed of 50% of each of them. For each experiment, the raw RDF samples were submitted to 300 °C for 30 min in solid: liquid mass ratios (S/L) of 1:5 and 1:10. Afterwards, the produced hydrochars were left to dry at 105 °C for 12 h.
All chars and hydrochars produced in both carbonization ways were placed in a desiccator, weighed (Mettler Toledo AB204-S—0.1 mg, Columbus, OH, USA), and stored for further analysis. Chars, hydrochars, and raw wastes were analyzed regarding proximate, elemental, and mineral composition chlorine content, apparent density, and high heating value. Chars yield was calculated to evaluate the process yields.

2.3. Chemical Characterization and Fuel Properties

Both RDFs and corresponding chars were milled (DeLongui mill) to homogenize the particle size distribution. Before the HHV and the thermal degradation tests, the samples were sieved (Retsch, Newtown, PA, USA) into a particle size diameter < 500 µm. The proximate composition of the raw materials and corresponding chars were determined by assessing the moisture (CEN/TS 15414-3:2010), volatile matter (EN 15402:2011), and ash contents (EN 15403:2011), while fixed carbon was obtained by difference. The concentration of carbon, hydrogen, nitrogen, and sulfur on the raw wastes and corresponding chars were obtained using an elemental analyzer (Thermo Finnigan—CE Instruments Model Flash EA 112 CHNS series, San Jose, CA, USA), while oxygen content was calculated by difference on a dry ash-free basis. Apparent density was determined by measuring the volume of known sample masses and calculating the mass per volume ratio.
The HHV (calorimeter IKA® C200) and the mineral composition, including chlorine content (Thermo Scientific Niton XL3t GOLDD + XRF analyzer, Waltham, MA, USA), were measured for the raw RDF and corresponding chars.
Mass yield and energy density of the chars and hydrochars (in a dry basis, db) were calculated using Equations (1) and (2), respectively:
M a s s   y i e l d   ( % ,   db ) = m c h a r m R D F × 100
E n e r g y     d e n s i t y   ( % , db ) = H H V c h a r H H V R D F × 100
where mchar and HHVchar are the mass and HHV of the produced chars; mRDF and HHVRDF are the mass and HHV of raw RDF samples.

2.4. Thermal and Structural Analysis

The thermogravimetric analysis (TGA) of the chars and hydrochars was conducted using a thermogravimetric analyzer (Q50 TG, TA Instruments, New Castle, DE, USA). The samples were heated from 30 °C to 800 °C at a constant rate of 20 °C min−1 under an air atmosphere with a flow rate of 100 mL min−1.

2.5. Removal of Water-Soluble Chlorine

To assess the removal of water-soluble chlorine species from biochars, the biochars samples produced at 300 °C for 30 min were mixed with distilled water in open glass beakers, using a S/L ratio of 1:5 and heated to boiling point. Afterward, the biochar samples were left to cool at room temperature and filtered. The washed chars were oven-dried (Memmert, Schwabach, Germany) at 105 ± 2 °C for 12 h. Chlorine content and HHV were measured in the washed chars as described in Section 2.3.

3. Results

3.1. Raw Material Characterization

The raw wastes were characterized by their proximate composition, mineral composition, including chlorine content, and high calorific value, and the respective values are shown in Table 1. As can be seen, RDF-L presents higher moisture (11.0%) compared to RDF-P (5.2%) due to the higher proportion of lignocellulosic waste (wood) in its composition. In both wastes, the volatile matter presented expected values according to other works [24,25], being slightly higher in RDF-P (87.4%) when compared to RDF-L (84.5%) due to the greater presence of plastic.
The ash content showed higher values in RDF-P (11.0%) compared to RDF-L (2.1%) due to the higher amount of plastics and the presence of textiles, paper, and dust in its composition. As expected and inversely proportional to the ash content, the fixed carbon was higher in the RDF-L samples (13.4%) than in the RDF-P samples (1.6%). Ash content is an important parameter in the use of alternative fuels because it is directly related to the calorific value of the fuel. High ash contents can be determinant in making the use of RDF unfeasible [26]. Furthermore, the ash composition is also a determining factor for using raw RDF in direct combustion or thermochemical processes such as carbonization and gasification. In the case of RDF-P, the higher proportion of plastics can generate chlorine emissions that, in addition to being harmful to the environment and human health, cause equipment corrosion and, consequently, increased maintenance costs [27]. On the other hand, RDF-L, which has a large proportion of lignocellulosic waste, can bring some issues related to its ash mineral composition. Although the chlorine content is low in this waste (0.3%), the high concentration of calcium and potassium in the wood may cause the accumulation of these elements in the ash and lead to problems of clogging and slagging in the reactors [28]. Regarding HHV, this parameter is slightly higher for RDF-L (17.9 MJ/kg−1), which can be explained by the higher concentration of FC (13.4%) and lower content of ash (2.1%)

3.2. Dry Carbonization Experiments

3.2.1. Chars Characterization

Torrefaction and carbonization of the raw wastes and their blends in different proportions, under different conditions of temperature and residence time, has shown that these thermochemical treatments produce more friable chars with darker and more homogeneous aspects with increasing process severity. Figures S3–S7 of the Supplemental Material show the appearance of the chars produced under various conditions. The torrefaction/carbonization mass yield ranged between 90.6% and 91.1% at the mildest torrefaction condition (200 °C/15 min.) and 43.7% and 64.0% at 350 °C carbonization for 60 min for RDF-L and RDF-P, respectively (Table 2). Under torrefaction conditions up to 300 °C and 30 min, the highest mass loss occurred in RDF-P due mainly to the elimination of volatile compounds by the polymeric fraction present in larger proportion in this waste. It should also be considered that the moisture content in RDF-L is twice that of RDF-P, and part of the mass loss is the evaporation of moisture present in the wastes, which confirms the higher devolatilization of RDF-P. With increasing severity of temperature and residence time conditions, a more pronounced reduction in mass yield is observed in RDF-L due to the decomposition of the components present in the lignocellulosic materials (hemicellulose, cellulose, and lignin) at temperatures above 300 °C [10]. In turn, RDF-P is composed of a higher proportion of plastics, and its degradation occurs at higher temperatures [29]. Even though an increase in HHV may be observed at higher temperatures and residence times, the higher mass loss at more severe carbonization conditions reduces the energetic yield of the chars by increasing gas release and reducing the char production [30].
The energy density of the chars increases proportionally to the increase of the torrefaction/carbonization severity. Moreover, higher energy density was observed in the sample with a higher proportion of RDF-L. The highest value (133.3%) was observed in the sample composed of 75% RDF-L + 25% RDF-P in the highest carbonization condition (350 °C/60 min). In the medium range of the severity process (300 °C/30 min), a higher energy density was observed in the chars produced with 75% RDF-L + 25% RDF-P (122.8%). Improving the energy density of the chars is an important parameter when the main purpose is energetic valorization.
The raw waste samples and their mixtures showed an increase in apparent density with increasing torrefaction/carbonization conditions, namely with increasing temperature and residence time. This effect is related to the decomposition of the polymeric structures both in plastics and lignocellulosic materials and their replacement by carbonaceous structures, a transformation that is evident from the visual observation of the samples and the produced chars. The carbonization process also significantly decreases the particle size distribution of the chars relative to the raw materials; therefore, an important reduction of the interparticle volume is also observable. This pattern is particularly noticeable in the RDF-P and the samples with a higher proportion of this waste due to the low bulk density of the RDF-P. At a temperature of 350 °C, the apparent density of the chars decreases with increasing residence time, which may reflect a higher devolatilization of organic components adsorbed in the char pores that occurred at a higher rate at this higher temperature. Relatively to the raw materials, the chars showed higher friability, as well as higher energy density and apparent density, important modifications that increase the feasibility of the process concerning logistical issues of storage and the reduction of transportation costs [31]. Moreover, increasing the apparent density of chars reduces issues of agglomeration and clogging of the feeding systems by handling large volumes of raw RDF [32].
Regarding the proximate composition of the chars (Figure 2), a reduction of moisture and the volatile matter is observed in comparison to the raw waste since the torrefaction/carbonization process eliminates volatile organic molecules, concentrating the condensed carbonaceous structures, which makes the chars more hydrophobic [33]. The increase in moisture under more severe carbonization conditions must be related to the elimination of volatile compounds that were retained in the biochars after the carbonization process [34]. The increased hydrophobicity of the chars, when compared to the raw wastes, is also desirable since it reduces fuel degradation by oxidation or microbes and requires less energy to evaporate moisture [35]. On the other hand, the volatile matter reduction on the chars may bring some issues regarding temperature stabilization during the gasification process [36].
As expected, ash and fixed carbon contents exhibited an upward trend with increasing severity of torrefaction/carbonization. Except for the sample composed only of RDF-L, there was a significant increase in ash content and a decrease in volatile matter and fixed carbon in the condition 350 °C/15 min, which may be explained by the combined effect of three factors: variability in the composition of RDF-P, the high volatilization of the polymeric fraction at this temperature and the low degradation of the inorganic material due to the low residence time. This effect was proportional to the amount of RDF-P included in the sample subject to carbonization, increasing from the sample with 75% L to the sample with 0% L. In the sample composed exclusively of RDF-P, the ash content reached 37.6%, an increase of more than three times when compared to the raw waste (11.0%). In the case of fixed carbon, the higher incorporation of RDF-L led to a considerable increase in this parameter, reaching a value of 43.4% in the sample composed of 100% RDF-L. In the sample composed of 100% RDF-P, the fixed carbon value in the most severe condition of carbonization was 14.1%, a considerable increase when compared with the raw wastes (1.6%). As the increase in ash content is negatively correlated with the HHV and leads to heat transfer issues during combustion, the rise in fixed carbon is associated with the enhancement of the HHV of the chars [30].
Regarding the elemental composition (Table 3), the increase in the incorporation of RDF-P demonstrates an increase in the concentration of C in the produced chars. The difference in the concentration of C in the chars showed the same pattern observed in the raw wastes; however, it was in a less accentuated form. The chars produced from the sample composed only of RDF-L showed a C concentration of 51.1%, while the biochars produced from the sample composed exclusively of RDF-P showed a value of 56.5%. The other samples composed by mixing the two wastes in different proportions showed intermediate values for carbon concentration. A similar increase in the C concentration after torrefaction/carbonization of RDF in fluff form in the same temperature range was also reported by Recari et al. [5].
The incorporation of RDF-P did not show any significant change in the hydrogen content. The concentration of this element was between 5.1 and 5.6% of the total. Likewise, the increase in RDF-P incorporation led to a slight increase in N and S values, where they reached the highest concentration in RDF-P samples (1.0 and 0.2%), respectively. The increase in sulfur concentration is a harmful factor when it comes to energy recovery since this compound can be eliminated in the environment in the form of sulfur compounds (SOx) during biochar combustion [37].
The highest alteration observed in the constitution of the chars is related to the concentration of oxygen, which gradually decreases with the increase in the incorporation of RDF-P. The concentration of this element in chars ranged from 38.1% in RDF-L samples to 13.3% in chars samples produced from RDF-P. Consequently, chars presented lower H/C and O/C by the devolatilization of some hydrocarbons and oxygenated volatile compounds, which led to an improvement in their fuel properties. Moreover, and in general terms, one may observe a relationship of inverse proportionality between O/C and H/C ratios with the HHV measured for all chars, as presented in other works [38]. Figure 3 shows a Van Krevelen diagram of the raw wastes and biochars produced at 300 °C for 30 min comparing the O/C and H/C ratios to traditional fossil fuels.
The chars produced with a higher RDF-P incorporation showed a higher decrease in O/C and H/C ratios with values closer to lignite. Reducing these ratios is favorable for a fuel once it reduces energy loss and the production of smoke and water vapor during combustion [19]. The increase in the proportion of RDF-P demonstrated a greater effect on reducing the O/C ratio, being this reduction directly related to the higher concentration of this waste. A similar trend in O/C reduction for RDF chars was reported by Nobre et al. during carbonization at 300–350 °C [31]. This result may reflect the greater reduction of O in these samples due to devolatization reactions of the polymeric fraction [29]. The chars obtained close values for the H/C ratio, being slightly lower for the mixture of equal proportions of the two wastes. The highest value observed in RDF-L biochar may be related to the decomposition of hemicellulose from the lignocellulosic fraction in this temperature range [7]. Thus, carbonization at 300 °C for 30 min demonstrated a greater influence on improving the fuel properties of polymeric RDF compared to lignocellulosic RDF. Although a sharper reduction in O/C and H/C ratio was observed in the RDF-P sample, the higher increase in ash concentration on this waste hinders the effect of the HHV rise.
Ash mineral composition was determined for chars produced at 300 °C for 30 min, which is the intermediate condition of all carbonization experiments that were conducted in this work. As can be seen, the incorporation of RDF-P shows a tendency to reduce the concentration of calcium and potassium since these elements are present in greater proportions in lignocellulosic wastes [40]. High concentrations of these elements in the lignocellulosic fraction of RDF-L may impose some barriers during the energetic valorization of these wastes, suggesting that the incorporation of RDF-P as a way to reduce the risk of fouling and slagging in the reactors. The same pattern is observed for Si, possibly due to the presence of sand in RDF-L. As expected, the increase in RDF-P incorporation associated with the carbonization process increases the chlorine content in the chars, which may justify the co-combustion of these chars with biomass to reduce the value of this compound to lower levels.
The increase in carbon concentration directly reflects the high calorific value of chars. As can be seen in Figure 4, the highest values for this parameter were observed under the most severe carbonization conditions. The increase was shown gradually and with an abrupt reduction in the condition of 350 °C/15 min due to the higher concentration of ash in this condition, as described above. The highest values obtained were in samples composed of 100% RDF-L and 75% RDF-L + 25% RDF-P at the highest carbonization severity condition (350 °C/60 min), which were 23.4 MJ/kg. Han et al. [6] reported similar HHV values for RDF chars produced at the same temperature range and residence time. In the case of the sample composed exclusively of RDF-L, this increase represents 30.7% in comparison to the higher calorific value of the raw residue (17.9 MJ/kg). On the sample composed exclusively of RDF-P, the high calorific value of the biochar produced in the harshest condition of carbonization was 19.4 MJ/kg, which represents an increase of approximately 15.5% in the calorific value of the raw waste. Even with a higher calorific value of the chars produced under these conditions, the low mass yield observed in the samples with greater incorporation of RDF-L (43.7 and 47.6%) suggests that carbonization temperatures should not be efficient as a pre-treatment as a form of recovery of these wastes. In these samples, the torrefaction conditions also significantly improve the high calorific value with a mass yield above 65%. In the case of samples composed of a higher proportion of RDF-P, more severe carbonization conditions, both in temperature and residence time, did not significantly affect the mass yield or the high calorific value when compared to the more severe torrefaction conditions. However, increasing these parameters is necessary to ensure greater homogeneity and friability of the samples and complete decomposition of the polymeric fraction.

3.2.2. Thermal Degradation Behavior

The thermogravimetric profile of chars produced at 300 °C and 30 min shows that initially, the greatest mass loss occurs in samples composed only of RDF-P. This is probably due to the greater devolatilization of plastic waste up to a temperature of 300 °C. From this temperature onwards, mass loss is more prominent in the biochar produced from RDF-L due to the degradation of hemicellulose and cellulose present in a greater proportion of the lignocellulosic fraction. At 520 °C, the mass loss of the biochar produced from RDF-L was approximately 90%, while increasing incorporation of RDF-P showed greater resistance to thermal degradation of the chars. Thus, the mass loss of 90% of the biochar produced from RDF-P occurred around 720 °C. The sample composed of the mixture in equal proportions of the two wastes reached the same value of mass loss around 560 °C, as seen in Figure 5a. Figure 5b demonstrates that the highest rate of thermal degradation occurred in the temperature range of 330 °C in the biochar produced from RDF-L due to the total polysaccharide degradation at this temperature [7]. A more discreet peak was observed in the biochar produced from the mixture of the samples at approximately 320 °C, while in the RDF-P biochar, there was no prominent peak, and the highest rate of thermal degradation occurred in the temperature range between 300 and 500 °C.

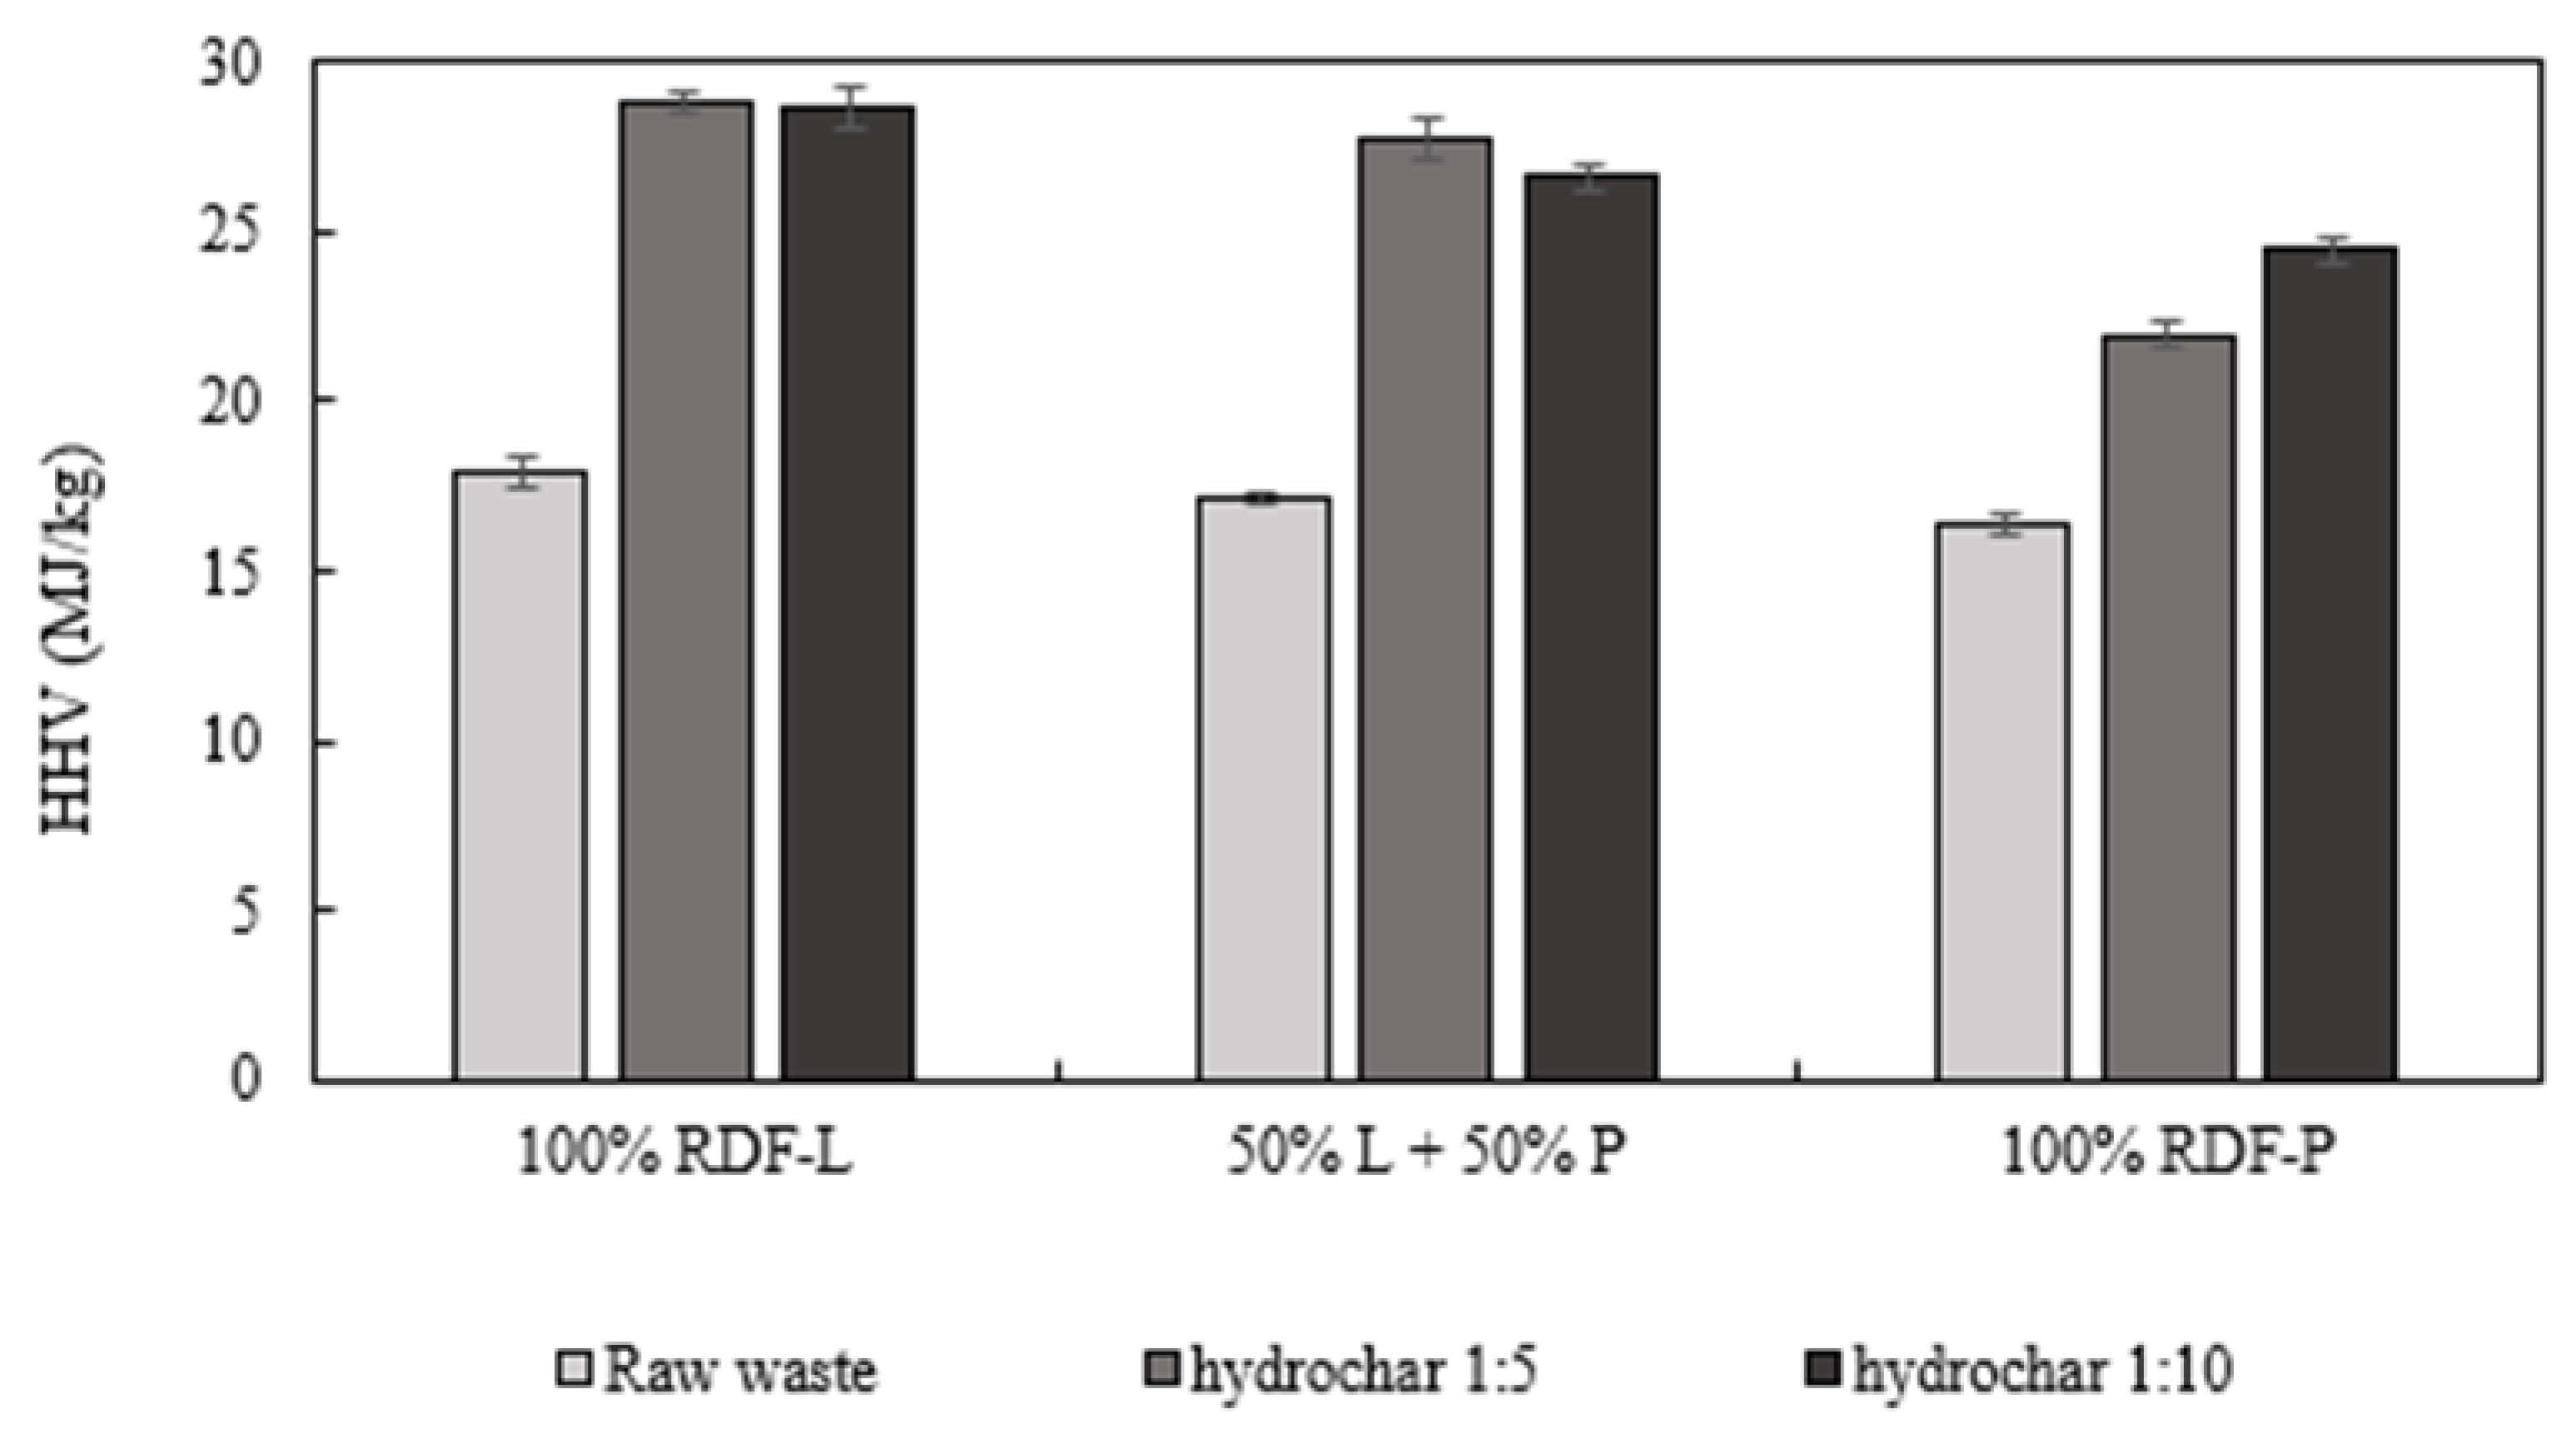
3.2.3. Effects of the Washing Process on the Chlorine Content and Higher Heating Value

As seen in Figure 6, the washing process led to a significant reduction in the chlorine content of the chars. In all conditions tested, the chlorine content after washing was less than 1%, in line with the permitted chlorine limit for the use of alternative fuels. The concentration of chlorine in the chars after the carbonization process has already been observed in other works [15,30]. As expected, the chars composed of a higher lignocellulosic fraction had the lowest chlorine contents after carbonization, although in all tested conditions, this value was greater than 1%.
After washing, the chars produced exclusively by the RDF-L sample had a chlorine content of only 0.2%. The increase in the incorporation of RDF-P led to an increase in the concentration of chlorine in the chars before washing, reaching 4.5% for those produced in the samples composed only of RDF-P. After washing, this value was approximately 0.5% of the total. High levels of chlorine in the produced chars bring technical and environmental concerns due to harmful emissions, which limits or even prevents its utilization in cement kilns as an alternative fuel [26]. During combustion, the chlorine species causes corrosion of the kilns and also negatively affects the clinker quality [27]. Thus, the washing step plays an important role in considerably reducing the chlorine content to acceptable levels whilst enhancing the char fuel properties.
Regarding HHV, the washing process does not negatively affect this parameter, as seen in Figure 7. Moreover, after washing, the chars presented a slight increase in the HHV compared to the unwashed chars. This behavior was more pronounced in the sample with a higher incorporation of RDF-P. The higher value of HHV was observed on the sample composed of 75% RDF-P and 25% RDF-L in the unwashed chars (21.1 MJ/kg) and the washed ones (28.5 MJ/kg).

3.3. Hydrothermal Carbonization Experiments

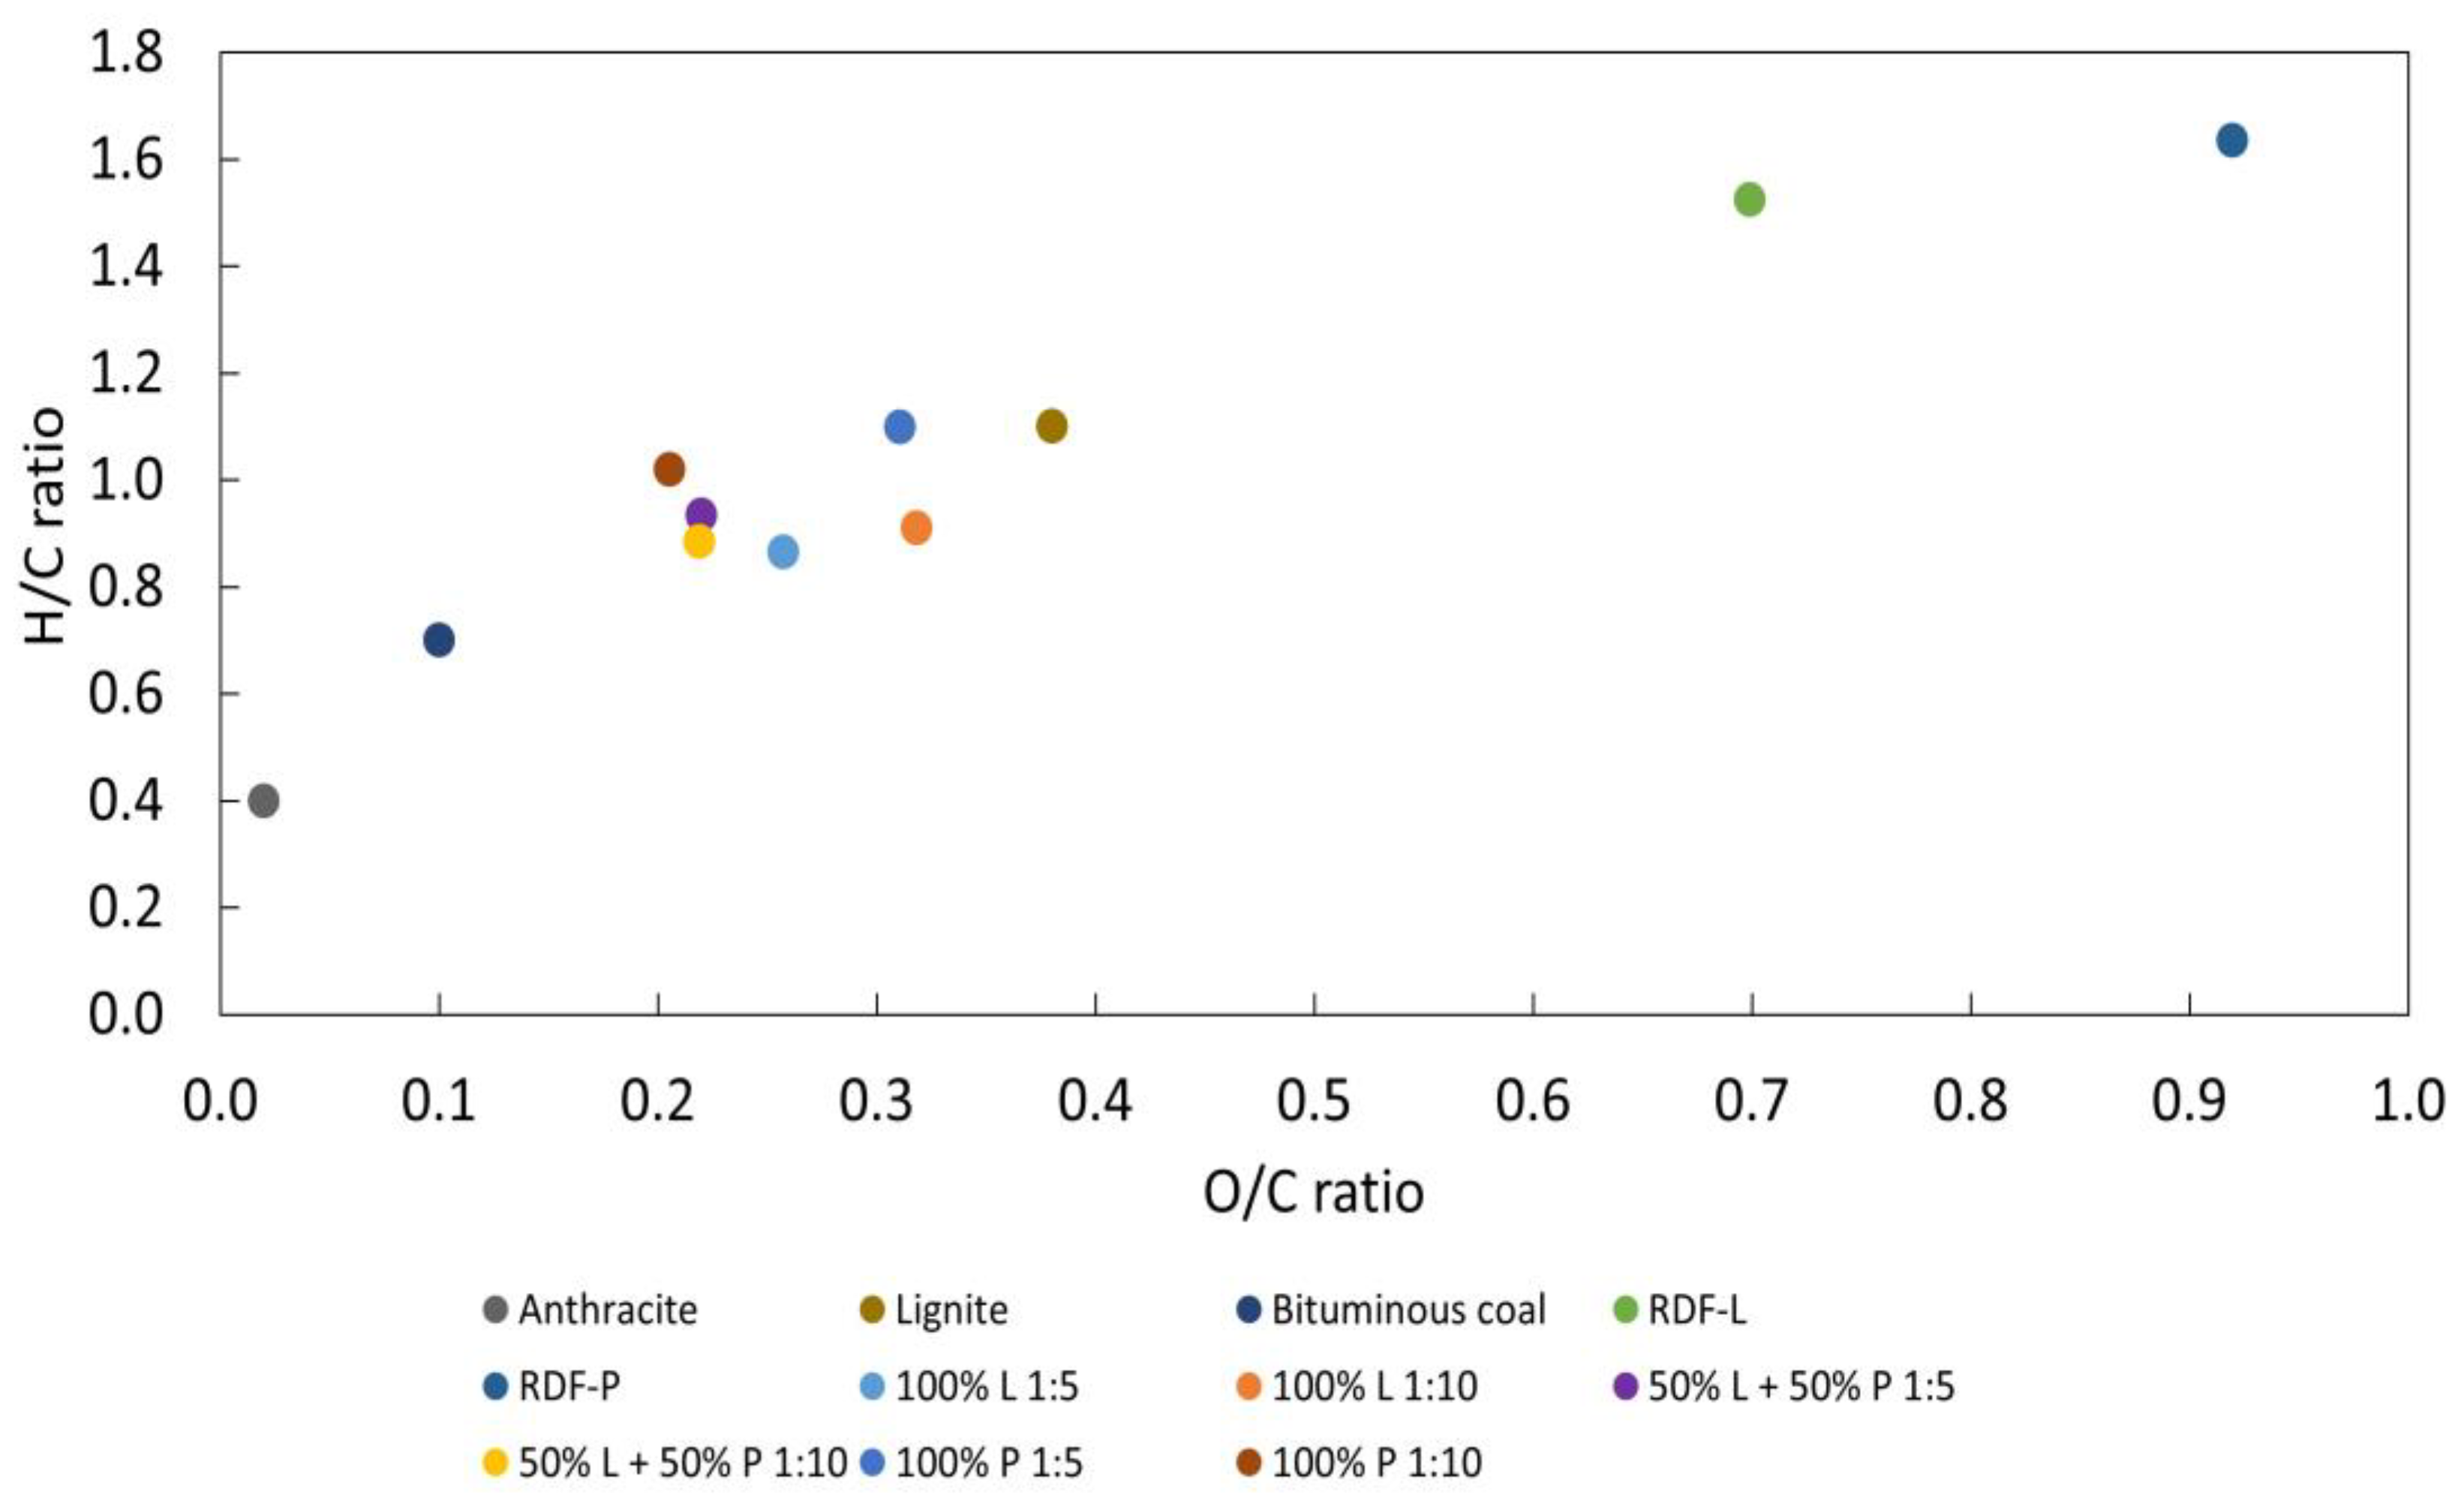
3.3.1. Hydrochars Characterization

The hydrochars produced at 300 °C for 30 min at S/L ratios of 1:5 and 1:10 showed a homogeneous appearance with black to dark brown color. The hydrochars obtained from the RDF with the highest proportion of lignocellulosic showed greater homogeneity compared to those produced from the polymeric RDF. The latter had some plastic clumps that were not fully carbonized. The appearance of hydrochars can be seen in Figure S8 in the Supplementary Materials. The mass yield of the hydrochars ranged from 35.8% for the sample composed only of RDF-L to 56.8% for the sample of RDF-P in the S:L ratio of 1:10. As shown in Figure 8, only the samples composed exclusively of RDF-P obtained a mass yield above 50%. The increase in the RDF-P incorporation in the samples leads to an increase in the mass yield since the degradation of the biomass components occurs in milder conditions of carbonization when compared to the polymeric fraction [29]. This explains the presence of some materials that are not completely carbonized in samples composed of RDF-P. The hydrochars presented an apparent density higher than the raw wastes in all tested conditions. The increase was more evident in the RDF composed mostly of plastics, although the highest value was for hydrochars produced from RDF with a higher lignocellulosic proportion in the ratio of 1:5 (0.426 g/cm3). In the case of the RDF-P, the apparent density increased from 0.130 g/cm3 to 0.418 g/cm3 in carbonization with a ratio of 1:5. Increasing the S/L ratio from 1:5 to 1:10 led to the production of finer and less dense hydrochars. Although this behavior was more evident in the hydrochars produced from RDF-L, it was also observed in the other samples.
As seen in Table 4, the moisture and fixed carbon contents tend to decrease with the incorporation of RDF-P. The increase in the S/L ratio from 1:5 to 1:10 showed a slight increase in the moisture content in the samples with RDF-P, while there was a reduction in this value in the sample composed exclusively of RDF-L. The reduction in moisture content was more significant in the RDF sample with the highest lignocellulosic fraction since the raw biomass tends to absorb more water than the other waste fractions. After hydrothermal carbonization, biomass wastes form more hydrophobic chars [41], which absorb less water and are easier to separate from the liquid fraction [42]. Due to the higher proportion of plastics in the RDF-P, the moisture content of the chars reached the lowest value in the tests for these samples, and in the ratio of 1:5, the hydrochars showed a 1.3% moisture content.
Volatile matter and ash content showed the opposite behavior and obtained the highest values in the hydrochars produced from the RDF-P sample. Volatile matter showed similar values in samples containing RDF-L in the two applied S/L ratios. In the case of the sample composed exclusively of RDF-P, the volatile matter content presented a more evident variation and obtained the highest value in the S/L ratio of 1:5 (74.1%). The incorporation of RDF-P has been shown to be directly related to the increase in ash content in chars. In the RDF-L samples, the ash content remained practically constant, while in the RDF-P samples, there was an increase of approximately 65% compared to the ash content of the raw waste. As a result, the fixed carbon content showed much higher values in hydrochars produced from RDF-L (47%) when compared to the highest value obtained for those produced from RDF-P (14%). The samples composed by mixing the two RDFs in equal proportions showed intermediate values (31%). The low value of fixed carbon in RDF-P hydrochars is due to the high volatile matter and ash content of these samples.
A higher carbon concentration was observed in hydrochars when compared to chars produced under the same conditions of temperature and residence time. Furthermore, the hydrochars produced from the lignocellulosic waste obtained a higher carbon concentration when compared to those produced from the polymeric waste. In the case of chars, an inverse trend was observed where the highest carbon concentration occurred in the RDF-P samples. Regarding the solid-liquid ratio and for the RDF-L sample, the 1:5 ratio showed a higher carbon concentration (67.9%) in the hydrochars when compared to the 1:10 ratio (64.6%), while in the chars, this value was 51.1%. The incorporation of 50% of the polymeric waste did not present significant changes in the carbon concentration of the hydrochars; however, it was slightly higher in the ratio 1:10 (66.5%) compared to the ratio 1:5 (65.5%) while in the chars was 56.1%. In the sample composed only of RDF-P, the carbon concentration was 52.4% in the ratio of 1:5 and 58.8% in the ratio of 1:10, while in the chars it was 56.5%.
Regarding the H/C and O/C ratios, hydrochars showed significantly lower average values (0.9 and 0.3) compared to chars (1.3 and 0.6) in the samples of lignocellulosic wastes. As the incorporation of polymeric wastes increased, the reduction in H/C and O/C ratios was smoother, being 1.0 and 0.2 for hydrochars and 1.2 and 0.2 for chars in the RDF-P sample. Lower values of these parameters indicate better fuel characteristics of hydrochars compared to chars [43], especially in samples that contain RDF-L in their composition. Figure 9 shows a Van Krevelen diagram of the raw wastes and hydrochars compared to traditional fossil fuels.
As observed in traditional carbonization, the hydrothermal carbonization process reduces the concentration of some alkali compounds, such as calcium and potassium, in the chars. In the case of RDF-L, the reduction is even more significant in the solid: liquid ratio of 1:10, where the calcium concentration reduces from 58% in the raw waste to 28% in the hydrochar while the potassium concentration went from 7.6% to 4.5%. Some elements, such as Fe, Ti, and Si, showed an increase in concentration compared to the raw waste. In the case of Fe, the concentration value was more than twice the original waste in the RDF-P hydrochars.
The hydrothermal carbonization process led to a significant increase in the energy density of the hydrochars, observed mainly in the RDF-L samples and the samples composed by the mixture of the two RDFs. The maximum value of energetic densification was observed in the mixed sample in the S/L ratio of 1:5 (161.4%). The increase in energetic densification explains the significant increase in the HHV of hydrochars when compared to raw wastes. The hydrochars produced from RDF-L showed HHV values around 28 MJ/kg, followed by the mixed samples (approximately 27 MJ/kg) and the RDF-P hydrochars with 22 and 24 MJ/kg in the S/L ratios of 1:5 and 1:10, respectively (Figure 10). The enhancement in HHV for hydrochars produced from RDF was also observed by Nobre et al. [44] at similar HTC conditions. Alves et al. also reported a greater improvement in the HHV of hydrochars when compared with chars at the same temperature and residence time [15].

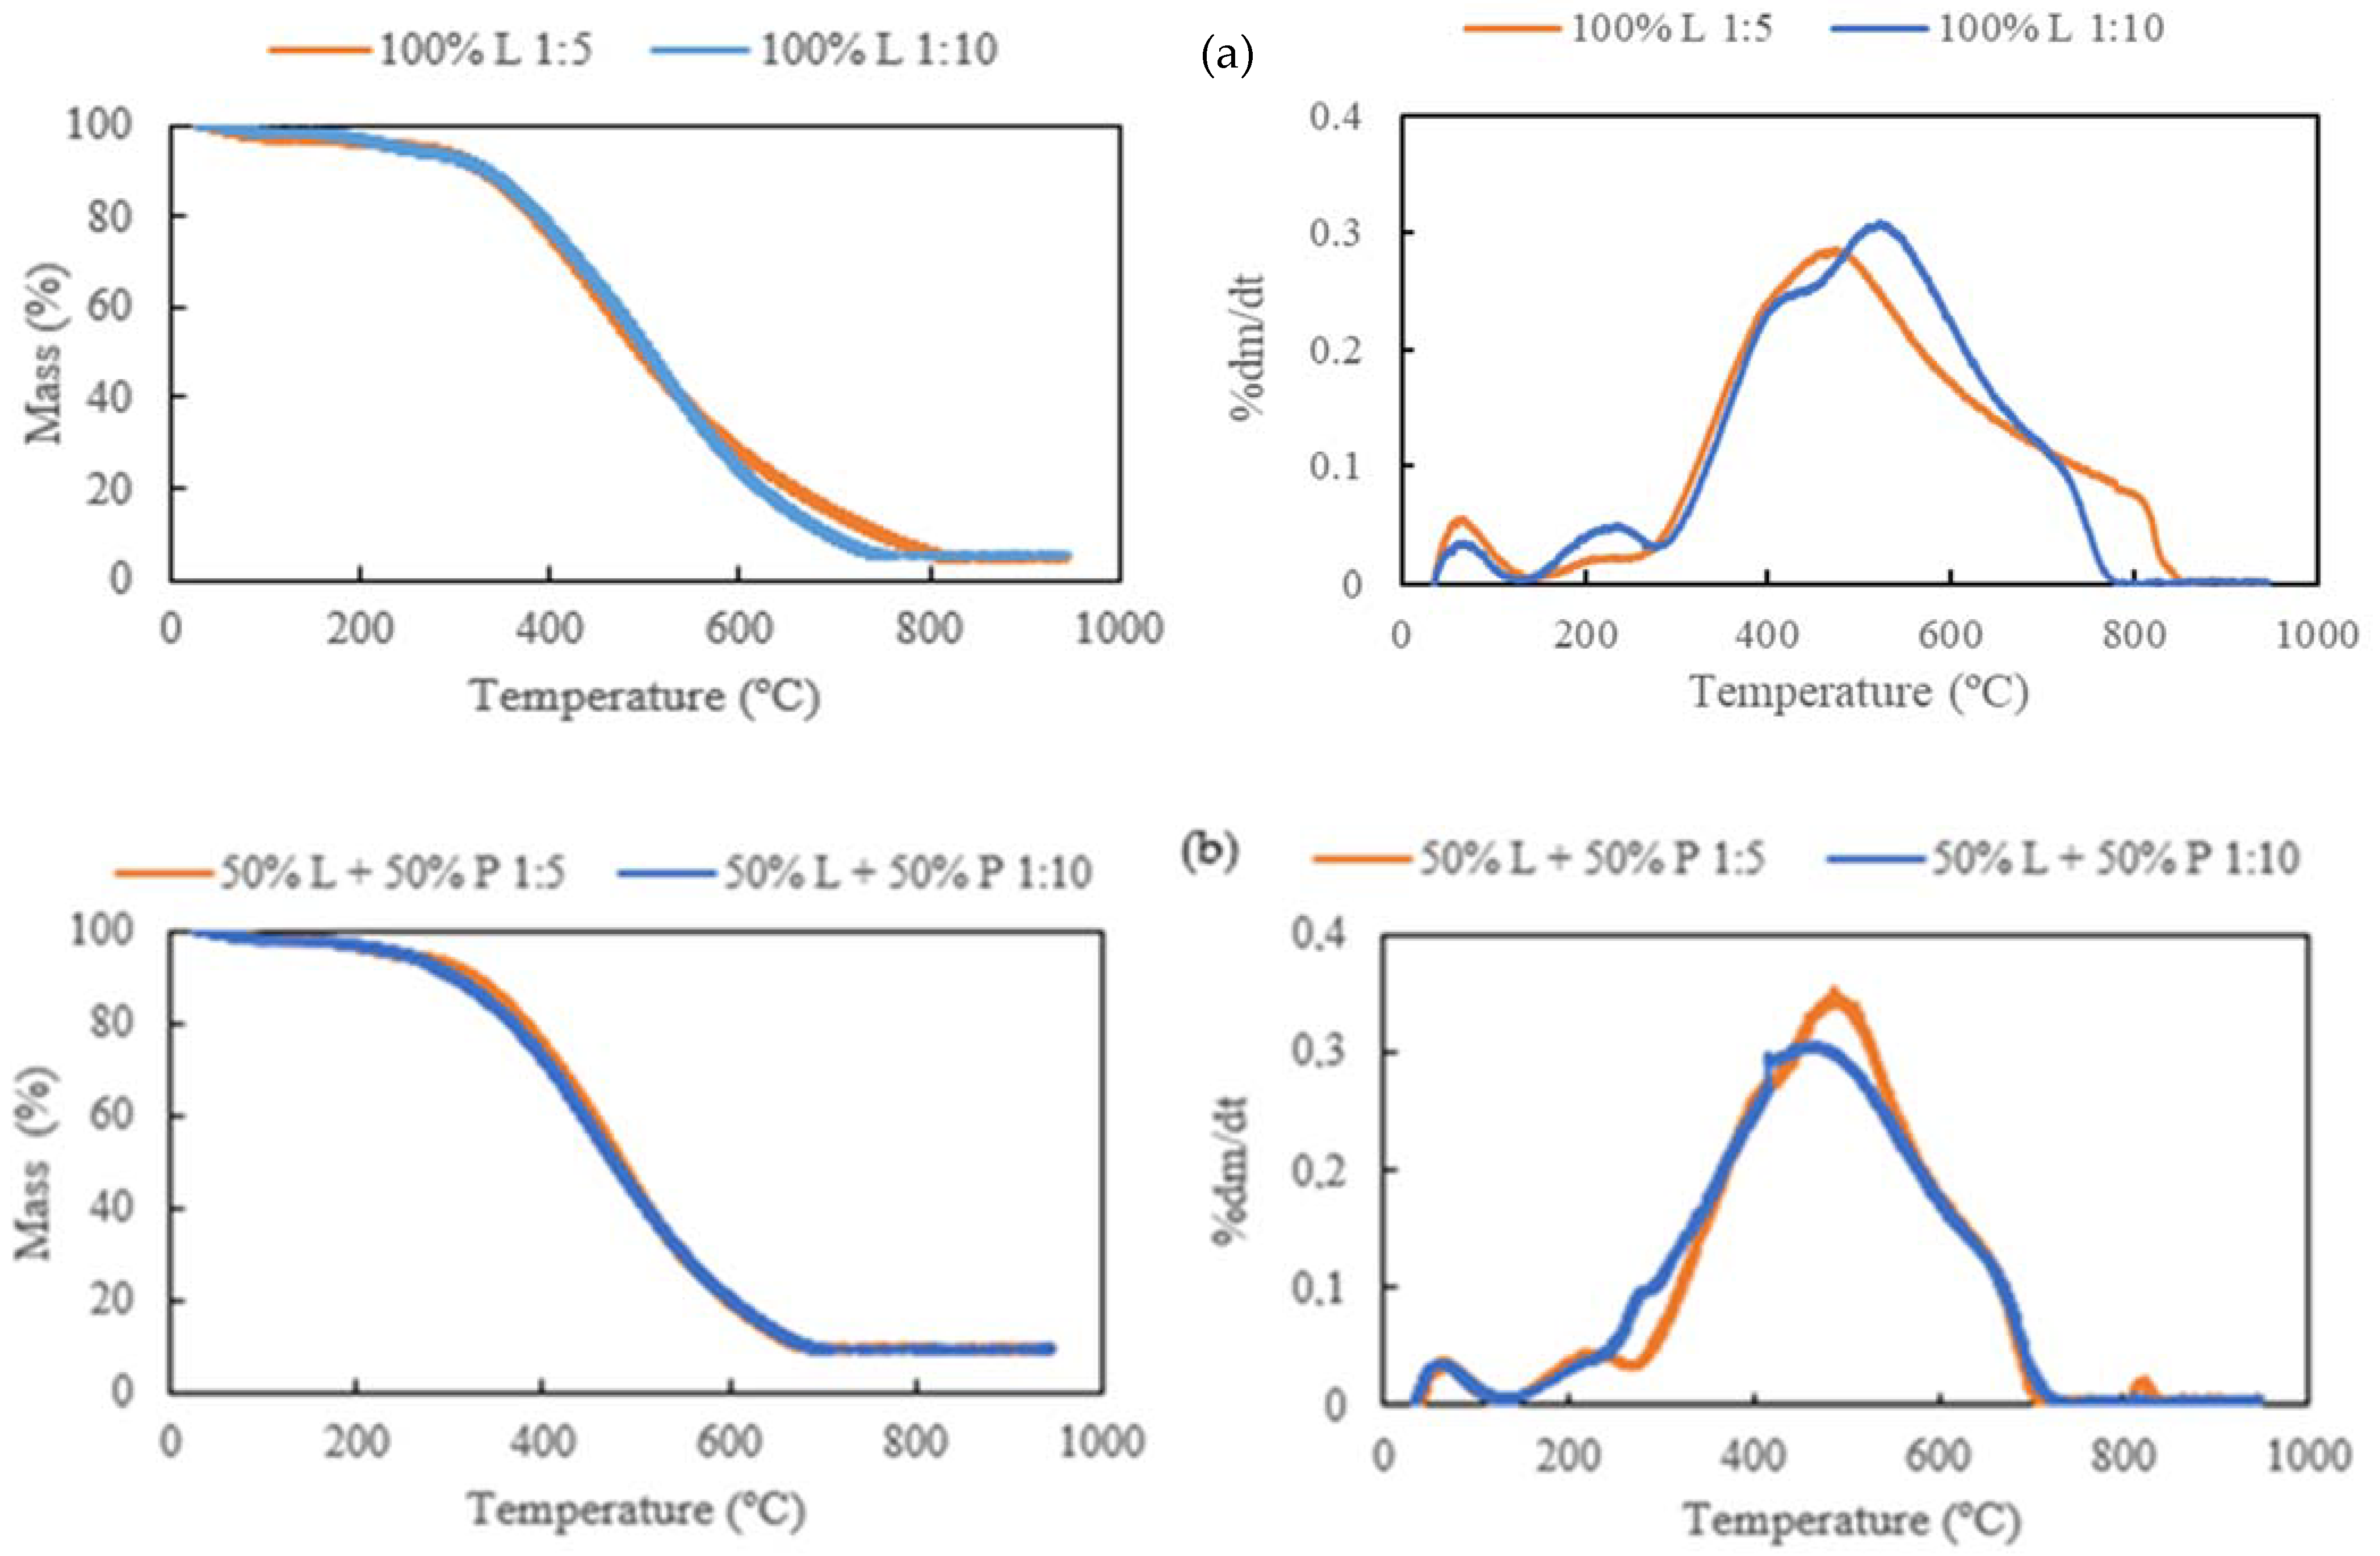
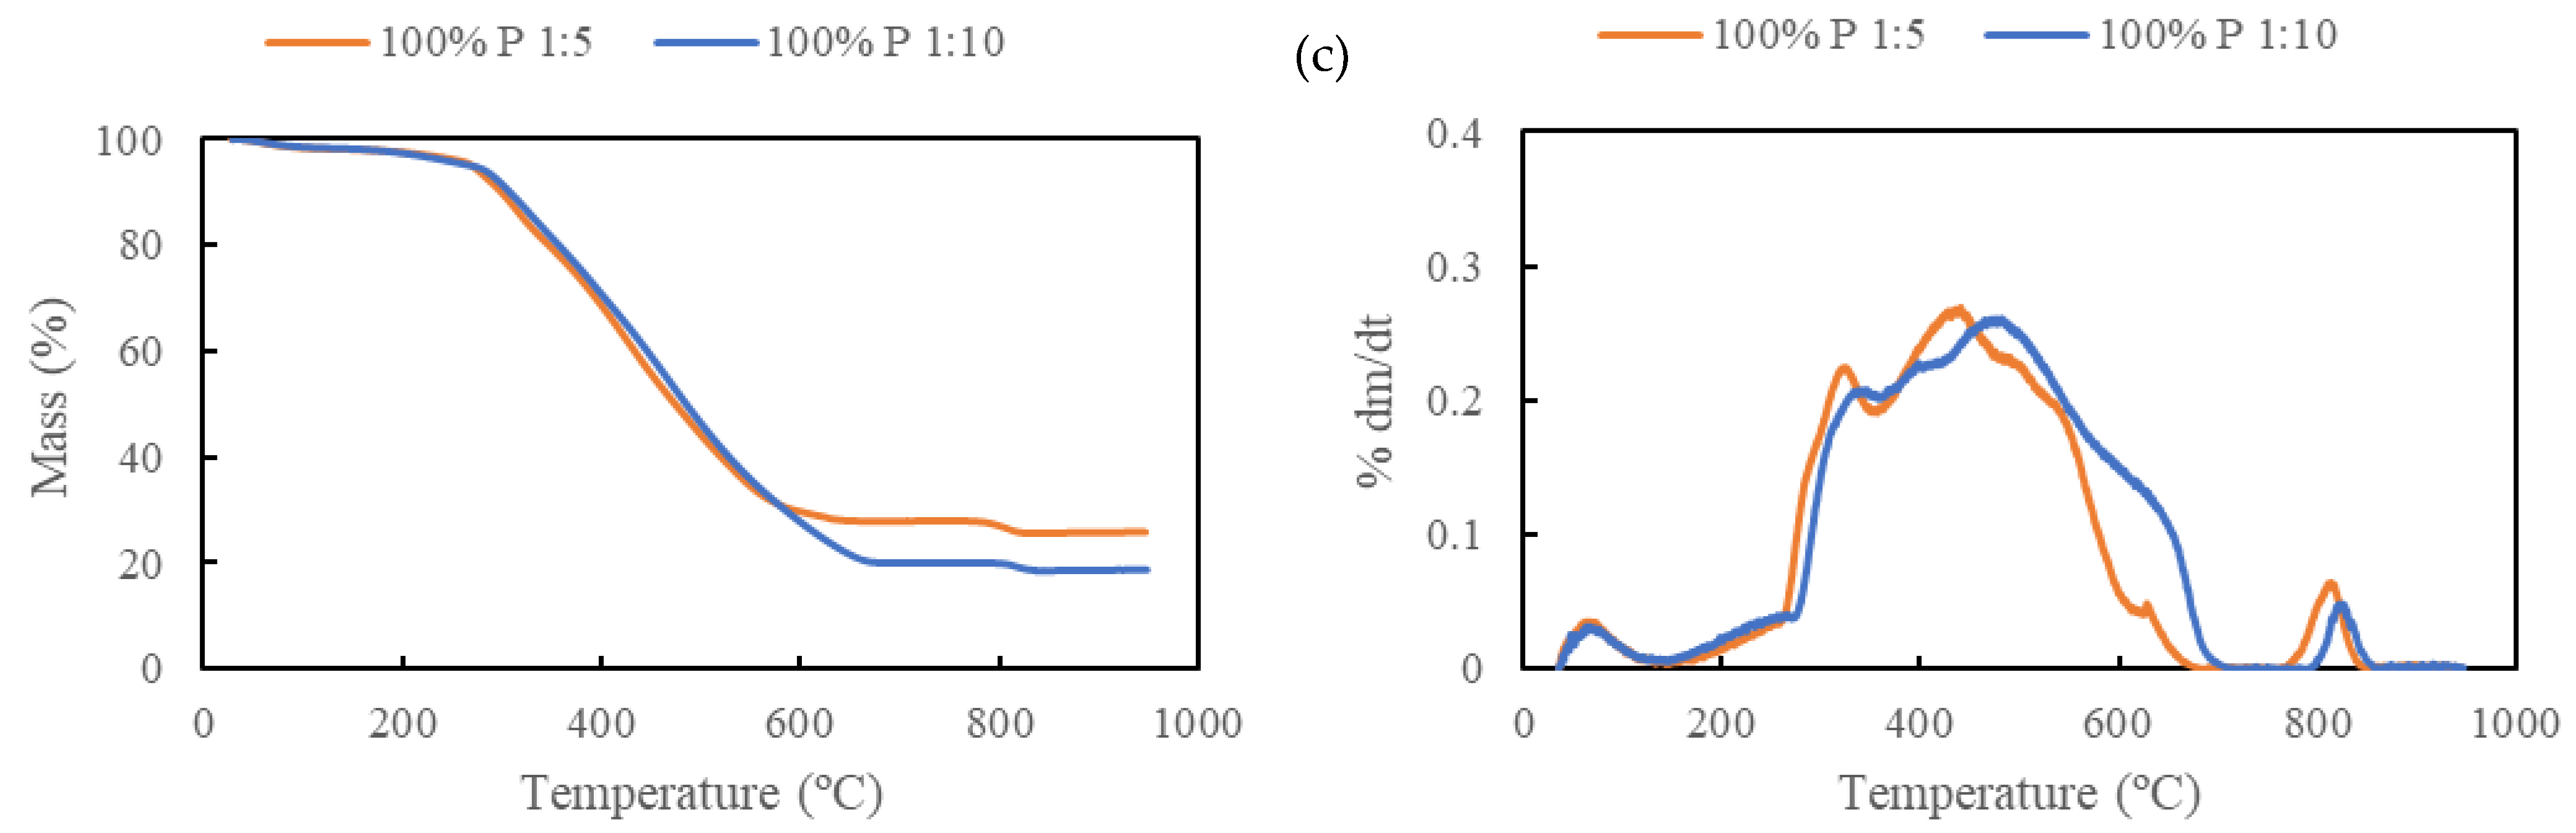
3.3.2. Thermal Degradation Behavior

The thermogravimetric profile of the hydrochars is represented in Figure 10. An initial peak was observed until 150 °C due to the moisture loss, being more pronounced in the RDF-L samples (Figure 11a) due to the hygroscopic characteristic of the biomass [29].
As observed in the chars, a sharper increase in mass loss took place between 200 and 500 °C in the hydrochars from RDF-L due to the total decomposition of the hemicellulose and cellulose and partial decomposition of lignin, leading to a gradual degradation of the hydrochars until 770 °C where the lignin is completely decomposed. As reported by Chen et al. [7], for a lignocellulosic biomass, the temperature zone of 30 °C to 200 °C represents only a slight weight loss due to the release of the moisture of the biomass. In the zone of 200–300 °C, the weight loss occurs gradually and represents the hemicellulose degradation. The main decomposition rate occurs at temperatures between 300 and 600 °C, where the total degradation of hemicellulose and cellulose takes places. Beyond this temperature, the decomposition rate decreases substantially, and the weight loss represents the slow degradation of lignin. The incorporation of RDF-P showed an increase in thermal resistance of the hydrochars observed after 700 °C (Figure 11b). A tiny peak was observed after 800 °C, which is more evident in the sample composed exclusively of RDF-P.
The decomposition of the hydrochars derived from the RDF-P sample occurs at the same temperature range but is less accentuated and reflects the decomposition of the polymeric fraction. A peak of degradation was observed on the hydrochars with RDF-P incorporation at 800 °C (Figure 11c), probably due to the decomposition of some fraction of plastics with higher thermal resistance [25]. Regarding the solid-liquid ratio, the influence of temperature seems to have a greater influence on the hydrochars produced at 1:10. This behavior was observed in both RDF samples and was more pronounced in the RDF-P hydrochar.

4. Conclusions

The results demonstrate that the pretreatment of torrefaction at 300 °C for 30 min is the most efficient carbonization for RDFs with a higher proportion of lignocellulosic fraction since it allows a greater mass yield with the increase in apparent density and high calorific value. However, the increase in the incorporation of the polymeric fraction in the RDFs leads to the need to increase the severity of carbonization since it provides greater homogeneity of the biochar, increases the mass yield in comparison to lignocellulosic wastes and provides an increase of approximately 15.5% in the higher calorific value of the biochar in comparison to the raw waste. Moreover, a washing step after the carbonization was demonstrated to be an effective process for reducing chlorine content to accepted values without interfering with the HHV of the chars. The hydrothermal carbonization experiments showed an increase in the HHV of the hydrochars at the same time as a substantial reduction in chlorine content (less than 0.2%), meaning that a washing step is therefore unnecessary. Furthermore, HTC as a pretreatment showed an increase in energy density, and the solid: liquid ratio of 1:10 yielded chars with lower ash content, which may reduce problems of fouling and slagging in boilers or reactors. Regarding waste sample composition, the co-carbonization of 25% RDF-L and 75% RDF-P at 300 °C for 30 min showed greater results for energy density (122.8%) and HHV (21.1 MJ/kg). In conclusion, torrefaction, carbonization, and HTC as pretreatments to enhance physical and combustible properties of RDF allow the production of chars that may be used as fuels for gasification or combustion, reducing their deposition in landfills and all the associated environmental impacts. Even if the chars are deposited in landfills, their higher apparent density and hydrophobicity reduce the necessary landfill volume and the production of landfill leachates. Other applications of the produced chars, such as soil amendment or use as adsorbents for effluent treatment or carbon capture, may be developed in the future to diversify the valorization processes and create a circular economy strategy based on RDF conversion and upgrading.

Supplementary Materials

The following supporting information can be downloaded at: https://www.mdpi.com/article/10.3390/reactions5010003/s1, Figure S1: Raw RDF-L before and after grinding; Figure S2: Raw RDF-P before and after grinding; Figure S3: Biochars produced from 100% RDF-L samples; Figure S4: Biochars produced from 75% RDF-L + 25% RDF-P samples; Figure S5: Biochars produced from 50% RDF-L + 50% RDF-P samples; Figure S6: Biochars produced from 25% RDF-L + 75% RDF-P samples; Figure S7: Biochars produced from 100% RDF-P samples; Figure S8: Hydrochars produced at 300 °C for 30 min.

Author Contributions

Conceptualization, A.L. and M.G.; formal analysis, A.L., O.A., A.U.S. and C.N.; resources, C.N. and P.B.; data curation, A.L.; writing—original draft preparation, A.L.; writing—review and editing, A.L., O.A. and A.U.S.; supervision, M.G. and P.B. All authors have read and agreed to the published version of the manuscript.

Funding

The present work was funded by the Fundação para a Ciência e Tecnologia, I.P. (Portuguese Foundation for Science and Technology), by the project (UIDB/04077/2020-2023 and UIDP/04077/2020-2023) of Mechanical Engineering and Resource Sustainability Center—MEtRICs, by the project UIDB/00239/2020 of Forest Research Centre—CEF, by the project UIDB/05064/2020 (VALORIZA—Research Centre for Endogenous Resource Valorization), and by the Regional Operational Program of Alentejo (Alentejo2020) under Portugal 2020 (Operational Program for Competitiveness and Internationalization), grant no. ALT20-05-3559-FSE-000035.

Data Availability Statement

The data presented in this study are available on request from the corresponding author.

Conflicts of Interest

The authors declare no conflicts of interest.

References

  1. Chavando, J.A.M.; Silva, V.B.; Tarelho, L.A.C.; Cardoso, J.S.; Eusébio, D. Snapshot review of refuse-derived fuels. Util. Policy 2022, 74, 101316. [Google Scholar] [CrossRef]
  2. Shehata, N.; Obaideen, K.; Sayed, E.T.; Abdelkareem, M.A.; Mahmoud, M.S.; El-Salamony, A.-H.R.; Mahmoud, H.M.; Olabi, H.M. Role of refuse-derived fuel in circular economy and sustainable development goals. Process. Saf. Environ. Prot. 2022, 163, 558–573. [Google Scholar] [CrossRef]
  3. Yu, J.; Guo, Q.; Gong, Y.; Ding, L.; Wang, J.; Yu, G. A review of the effects of alkali and alkaline earth metal species on biomass gasification. Fuel Process. Technol. 2021, 214, 106723. [Google Scholar] [CrossRef]
  4. Białowiec, A.; Pulka, J.; Stępień, P.; Manczarski, P.; Gołaszewski, J. The RDF/SRF torrefaction: An effect of temperature on characterization of the product—Carbonized Refuse Derived Fuel. Waste Manag. 2017, 70, 91–100. [Google Scholar] [CrossRef]
  5. Recari, J.; Berrueco, C.; Puy, N.; Alier, S.; Bartrolí, J.; Farriol, X. Torrefaction of a solid recovered fuel (SRF) to improve the fuel properties for gasification processes. Appl. Energy 2017, 203, 177–188. [Google Scholar] [CrossRef]
  6. Han, J.; Huang, Z.; Qin, L.; Chen, W.; Zhao, B.; Xing, F. Refused derived fuel from municipal solid waste used as an alternative fuel during the iron ore sinter process. J. Clean. Prod. 2021, 278, 123594. [Google Scholar] [CrossRef]
  7. Chen, W.H.; Lin, B.J.; Lin, Y.Y.; Chu, Y.-S.; Ubando, A.T.; Show, P.L.; Ong, H.C.; Chang, J.-S.; Ho, S.-H.; Culaba, A.B.; et al. Progress in biomass torrefaction: Principles, applications and challenges. Prog. Energy Combust. Sci. 2021, 82, 100887. [Google Scholar] [CrossRef]
  8. Barskov, S.; Zappi, M.; Buchireddy, P.; Dufreche, S.; Guillory, J.; Gang, D.; Hernandez, R.; Bajpai, R.; Baudier, J.; Cooper, R.; et al. Torrefaction of biomass: A review of production methods for biocoal from cultured and waste lignocellulosic feedstocks. Renew. Energy 2019, 142, 624–642. [Google Scholar] [CrossRef]
  9. Niu, Y.; Lv, Y.; Lei, Y.; Liu, S.; Liang, Y.; Wang, D.; Hui, S. Biomass torrefaction: Properties, applications, challenges, and economy. Renew. Sustain. Energy Rev. 2019, 115, 109395. [Google Scholar] [CrossRef]
  10. Mamvura, T.A.; Danha, G. Biomass torrefaction as an emerging technology to aid in energy production. Heliyon 2020, 6, e03531. [Google Scholar] [CrossRef] [PubMed]
  11. Cahyanti, M.N.; Doddapaneni, T.R.K.C.; Kikas, T. Biomass torrefaction: An overview on process parameters, economic and environmental aspects and recent advancements. Bioresour. Technol. 2020, 301, 122737. [Google Scholar] [CrossRef]
  12. Rago, Y.P.; Collard, F.X.; Görgens, J.F.; Surroop, D.; Mohee, R. Torrefaction of biomass and plastic from municipal solid waste streams and their blends: Evaluation of interactive effects. Fuel 2020, 277, 118089. [Google Scholar] [CrossRef]
  13. Chen, S.; Liu, Z.; Jiang, S.; Hou, H. Carbonization: A feasible route for reutilization of plastic wastes. Sci. Total Environ. 2020, 710, 136250. [Google Scholar] [CrossRef]
  14. Umeda, K.; Nakamura, S.; Lu, D.; Yoshikawa, K. Biomass gasification employing low-temperature carbonization pretreatment for tar reduction. Biomass Bioenergy 2019, 126, 142–149. [Google Scholar] [CrossRef]
  15. Alves, O.; Nobre, C.; Durão, L.; Monteiro, E.; Brito, P.; Gonçalves, M. Effects of dry and hydrothermal carbonisation on the properties of solid recovered fuels from construction and municipal solid wastes. Energy Convers. Manag. 2021, 237, 114101. [Google Scholar] [CrossRef]
  16. Xu, Z.; Qi, R.; Zhang, D.; Gao, Y.; Xiong, M.; Chen, W. Co-hydrothermal carbonization of cotton textile waste and polyvinyl chloride waste for the production of solid fuel: Interaction mechanisms and combustion behaviors. J. Clean. Prod. 2021, 316, 128306. [Google Scholar] [CrossRef]
  17. Zhang, X.; Zhang, L.; Li, A. Co-hydrothermal carbonization of lignocellulosic biomass and waste polyvinyl chloride for high-quality solid fuel production: Hydrochar properties and its combustion and pyrolysis behaviors. Bioresour. Technol. 2019, 294, 122113. [Google Scholar] [CrossRef]
  18. Wang, T.; Zhai, Y.; Zhu, Y.; Li, C.; Zeng, G. A review of the hydrothermal carbonization of biomass waste for hydrochar formation: Process conditions, fundamentals, and physicochemical properties. Renew. Sustain. Energy Rev. 2018, 90, 223–247. [Google Scholar] [CrossRef]
  19. Yao, Z.; Ma, X. Characteristics of co-hydrothermal carbonization on polyvinyl chloride wastes with bamboo. Bioresour. Technol. 2018, 247, 302–309. [Google Scholar] [CrossRef]
  20. Wei, Y.; Fakudze, S.; Zhang, Y.; Ma, R.; Shang, Q.; Chen, J.; Liu, C.; Chu, Q. Co-hydrothermal carbonization of pomelo peel and PVC for production of hydrochar pellets with enhanced fuel properties and dechlorination. Energy 2022, 239, 122350. [Google Scholar] [CrossRef]
  21. Shen, Y. Dechlorination of Poly(vinyl chloride) Wastes via Hydrothermal Carbonization with Lignin for Clean Solid Fuel Production. Ind. Eng. Chem. Res. 2016, 55, 11638–11644. [Google Scholar] [CrossRef]
  22. Huang, N.; Zhao, P.; Ghosh, S.; Fedyukhin, A. Co-hydrothermal carbonization of polyvinyl chloride and moist biomass to remove chlorine and inorganics for clean fuel production. Appl. Energy 2019, 240, 882–892. [Google Scholar] [CrossRef]
  23. Bardhan, M.; Novera, T.M.; Tabassum, M.; Islam, M.A.; Islam, M.A.; Hameed, B.H. Co-hydrothermal carbonization of different feedstocks to hydrochar as potential energy for the future world: A review. J. Clean. Prod. 2021, 298, 126734. [Google Scholar] [CrossRef]
  24. Yang, P.; Jia, D.; Lin, B.; Zhuang, X.; Bi, X. Microwave-assisted catalytic pyrolysis of refuse-derived fuel (RDF) to improve pyrolysis performance and biochar properties. Fuel Process. Technol. 2022, 227, 107129. [Google Scholar] [CrossRef]
  25. Kuspangaliyeva, B.; Suleimenova, B.; Shah, D.; Sarbassov, Y. Thermogravimetric study of refuse derived fuel produced from municipal solid waste of Kazakhstan. Appl. Sci. 2021, 11, 1219. [Google Scholar] [CrossRef]
  26. Tripathi, P.; Rao, L. Single particle and packed bed combustion characteristics of high ash and high plastic content refuse derived fuel. Fuel 2022, 308, 121983. [Google Scholar] [CrossRef]
  27. Özkan, M.; Özkan, K.; Bekgöz, B.O.; Yorulmaz, Ö.; Günkaya, Z.; Özkan, A.; Banar, M. Implementation of an early warning system with hyperspectral imaging combined with deep learning model for chlorine in refuse derived fuels. Waste Manag. 2022, 142, 111–119. [Google Scholar] [CrossRef]
  28. Teixeira, P.; Lopes, H.; Gulyurtlu, I.; Lapa, N.; Abelha, P. Evaluation of slagging and fouling tendency during biomass co-firing with coal in a fluidized bed. Biomass Bioenergy 2012, 39, 192–203. [Google Scholar] [CrossRef]
  29. Porshnov, D.; Ozols, V.; Ansone-Bertina, L.; Burlakovs, J.; Klavins, M. Thermal decomposition study of major refuse derived fuel components. In Energy Procedia; Elsevier Ltd.: Amsterdam, The Netherlands, 2018; pp. 48–53. [Google Scholar] [CrossRef]
  30. Nobre, C.; Alves, O.; Longo, A.; Vilarinho, C.; Gonçalves, M. Torrefaction and carbonization of refuse derived fuel: Char characterization and evaluation of gaseous and liquid emissions. Bioresour. Technol. 2019, 285, 121325. [Google Scholar] [CrossRef]
  31. Nobre, C.; Vilarinho, C.; Alves, O.; Mendes, B.; Gonçalves, M. Upgrading of refuse derived fuel through torrefaction and carbonization: Evaluation of RDF char fuel properties. Energy 2019, 181, 66–76. [Google Scholar] [CrossRef]
  32. Kukreja, K.; Soni, M.K.; Nainegali, M.S.; Mohapatra, B. Development of transfer chute design through Discrete Element Modelling for using Refused Derived fuel in Indian cement plants. Sustain. Energy Technol. Assess. 2022, 53, 102567. [Google Scholar] [CrossRef]
  33. Yang, Y.; Sun, M.; Zhang, M.; Zhang, K.; Wang, D.; Lei, C. A fundamental research on synchronized torrefaction and pelleting of biomass. Renew Energy 2019, 142, 668–676. [Google Scholar] [CrossRef]
  34. Vanapalli, K.R.; Bhattacharya, J.; Samal, B.; Chandra, S.; Medha, I.; Dubey, B.K. Inhibitory and synergistic effects on thermal behaviour and char characteristics during the co-pyrolysis of biomass and single-use plastics. Energy 2021, 235, 121369. [Google Scholar] [CrossRef]
  35. Medic, D.; Darr, M.; Shah, A.; Potter, B.; Zimmerman, J. Effects of torrefaction process parameters on biomass feedstock upgrading. Fuel 2012, 91, 147–154. [Google Scholar] [CrossRef]
  36. Nobre, C.; Longo, A.; Vilarinho, C.; Gonçalves, M. Gasification of pellets produced from blends of biomass wastes and refuse derived fuel chars. Renew Energy 2020, 154, 1294–1303. [Google Scholar] [CrossRef]
  37. Chen, W.H.; Lu, K.M.; Tsai, C.M. An experimental analysis on property and structure variations of agricultural wastes undergoing torrefaction. Appl. Energy 2012, 100, 318–325. [Google Scholar] [CrossRef]
  38. Prins, M.J.; Ptasinski, K.J.; Janssen, F.J.J.G. More efficient biomass gasification via torrefaction. Energy 2006, 31, 3458–3470. [Google Scholar] [CrossRef]
  39. Vassilev, S.V.; Baxter, D.; Andersen, L.K.; Vassileva, C.G. An overview of the chemical composition of biomass. Fuel 2010, 89, 913–933. [Google Scholar] [CrossRef]
  40. Lachman, J.; Baláš, M.; Lisý, M.; Lisá, H.; Milcák, P.; Elbl, P. An overview of slagging and fouling indicators and their applicability to biomass fuels. Fuel Process. Technol. 2021, 217, 106804. [Google Scholar] [CrossRef]
  41. Reza, M.T.; Andert, J.; Wirth, B.; Busch, D.; Pielert, J.; Lynam, J.G.; Mumme, J. Hydrothermal Carbonization of Biomass for Energy and Crop Production. Appl. Bioenergy 2014, 1, 11–29. [Google Scholar] [CrossRef]
  42. Zhao, X.; Zhan, L.; Xie, B.; Gao, B. Products derived from waste plastics (PC, HIPS, ABS, PP and PA6) via hydrothermal treatment: Characterization and potential applications. Chemosphere 2018, 207, 742–752. [Google Scholar] [CrossRef]
  43. Sun, Y.; He, Z.; Tu, R.; Wu, Y.-J.; Jiang, E.-C.; Xu, X.-W. The mechanism of wet/dry torrefaction pretreatment on the pyrolysis performance of tobacco stalk. Bioresour. Technol. 2019, 286, 121390. [Google Scholar] [CrossRef]
  44. Nobre, C.; Alves, O.; Durão, L.; Şen, A.; Vilarinho, C.; Gonçalves, M. Characterization of hydrochar and process water from the hydrothermal carbonization of Refuse Derived Fuel. Waste Manag. 2021, 120, 303–313. [Google Scholar] [CrossRef]
Figure 1. Raw wastes: (a) RDF-L and (b) RDF-P.
Reactions 05 00003 g001
Figure 2. Proximate composition of the chars produced at different temperatures and residence times.
Reactions 05 00003 g002
Figure 3. Van Krevelen diagram of the raw wastes and biochars and its comparison with fossil fuels [39].
Reactions 05 00003 g003
Figure 4. Higher heating value (MJ/kg) of the chars produced at all temperature and residence time conditions.
Reactions 05 00003 g004
Figure 5. (a) TGA and (b) DTG of the chars produced at 300 °C for 30 min.
Reactions 05 00003 g005
Figure 6. Effect of biochar washing on the chlorine content.
Reactions 05 00003 g006
Figure 7. Effect of biochar washing on the higher heating value (MJ/kg).
Reactions 05 00003 g007
Figure 8. Mass yield (%) and apparent density (g/cm3) of the hydrochars.
Reactions 05 00003 g008
Figure 9. Van Krevelen diagram of the raw wastes and hydrochars and its comparison with fossil fuels [39].
Reactions 05 00003 g009
Figure 10. Higher heating value (MJ/kg) of the raw wastes and the hydrochars produced at 300 °C for 30 min in solid: liquid ratio of 1:5 and 1:10.
Reactions 05 00003 g010
Figure 11. Thermal degradation behavior of the hydrochars produced at 300 °C for 30 min: (a) 100% RDF-L, (b) 50% RDF-L + 50% RDF-P, and (c) 100% RDF-P.
Reactions 05 00003 g011aReactions 05 00003 g011b
Table 1. Characterization of raw samples (± standard deviation).
CompositionRDF-LRDF-P
Proximate (wt.%)
Moisture11.0 ± 0.25.2 ± 1.0
Volatile matter a84.5 ± 0.987.4 ± 1.3
Ash a2.1 ± 0.511.0 ± 1.1
Fixed carbon a13.4 ± 1.11.6 ± 0.7
Ultimate (wt.%, db)
C47.2 ± 0.541.1 ± 1.4
H6.0 ± 0.15.6 ± 0.3
N0.7 ± 0.12.5 ± 0.0
S0.0 ± 0.00.4 ± 0.0
O b46.1 ± 1.450.4 ± 1.1
Mineral (mg/g, db)
Ca27.769.8
K3.66.1
Fe4.512.7
Ti0.96.9
Si5.210.1
Zn0.43.2
Cu0.10.5
Cl (%)0.31.0
Fuel properties
HHV (MJ kg−1)17.9 ± 0.516.4 ± 0.4
a Dry basis; b by difference, O (%) = 100-C-H-N-S.
Table 2. Mass yield (M.Y), energy density (E.D), and apparent density (A.D) of the raw wastes and respective chars.
Process Conditions100% RDF-L75% L + 25% P50% L + 50% P25% L + 75% P100% RDF-P
T (°C)t
(min)
M.Y
(%)
E.D (%)A.D
(g/cm3)
M.Y
(%)
E.D (%)A.D
(g/cm3)
M.Y
(%)
E.D (%)A.D
(g/cm3)
M.Y
(%)
E.D (%)A.D
(g/cm3)
M.Y
(%)
E.D (%)A.D (g/cm3)
Raw-1001000.2271001000.1881001000.1541001000.1471001000.130
2501590.6104.00.21390.7103.30.21891.2103.50.20090.995.90.20891.197.30.193
3087.9102.60.22888.6100.50.22888.7102.50.21585.7104.50.25787.795.10.250
6080.9109.80.25182.3107.00.28677.7112.00.31380.1113.90.28679.5103.70.295
3001586.9103.20.22787.3107.00.25387.3105.50.27485.9107.00.26783.8107.50.328
3076.5108.90.24474.4116.50.27872.1117.90.30871.6122.80.30873.4109.10.351
6065.1118.40.26066.2118.10.29965.2123.00.30367.0118.50.29069.3110.20.357
3501568.1115.60.27170.7107.00.34067.485.80.35874.580.90.37876.383.80.417
3049.1123.60.25754.6117.20.29457.2124.50.34564.8104.80.35167.9105.80.339
6043.7130.50.26447.6133.30.27851.6120.60.33461.7120.20.33464.4113.30.370
Table 3. Elemental composition, mineral composition, and fuel properties of the chars produced at 300 °C for 30 min (±standard deviation).
Composition100% RDF-L75% L + 25% P50% L + 50% P25% L + 75% P100% RDF-P
Ultimate (wt.%, db)
C51.1 ± 1.752.1 ± 1.156.1 ± 2.454.9 ± 0.956.5 ± 2.1
H5.5 ± 0.35.1 ± 0.25.3 ± 0.45.4 ± 0.15.6 ± 0.3
N0.5 ± 0.10.9 ± 0.10.7 ± 0.10.9 ± 0.01.0 ± 0.2
S0.0 ± 0.00.0 ± 0.00.1 ± 0.00.2 ± 0.00.2 ± 0.1
O38.1 ± 2.633.3 ± 2.424.2 ± 2.622.8 ± 1.213.3 ± 1.7
Mineral (mg/g, db)
Ca177.1211.4210.4175.8171.1
K27.224.114.817.114.1
Fe38.040.927.531.825.1
Ti7.77.615.112.911.8
Si71.371.165.959.759.1
Zn2.45.25.54.56.1
Cu1.31.30.92.31.1
Al9.521.617.011.814.8
Cl (%)1.13.53.34.14.4
Fuel properties
HHV (MJ/kg−1)19.5 ± 0.3 20.4 ± 0.320.2 ± 0.421.1 ± 0.718.7 ± 0.5
Table 4. Chemical composition and HHV of the hydrochars produced at 300 °C, 30 min, and S/L ratio 1:5 and 1:10 (±standard deviation).
Composition100% RDF-L50% L + 50% P100% RDF-P
Proximate
(wt.%)
1:51:101:51:101:51:10
Moisture3.9 ± 0.22.5 ± 0.12.4 ± 0.02.7 ± 0.11.3 ± 0.01.6 ± 0.1
Volatile matter a49.9 ± 0.750.6 ± 0.460.9 ± 1.860.2 ± 2.574.1 ± 1.367.8 ± 3.5
Ash a2.8 ± 0.12.3 ± 0.48.7 ± 0.47.7 ± 0.318.7 ± 0.618.0 ± 2.5
Fixed carbon a47.3 ± 0.747.0 ± 0.830.4 ± 2.232.1 ± 2.07.1 ± 1.114.2 ± 2.7
Ultimate
(wt.%, db)
C67.9 ± 1.8 64.6 ± 1.665.5 ± 3.066.5 ± 2.352.4 ± 1.658.8 ± 1.1
H4.9 ± 0.24.9 ± 0.25.1 ± 0.44.9 ± 0.34.8 ± 0.25.0 ± 0.1
N1.1 ± 0.10.7 ± 0.11.3 ± 0.31.4 ± 0.22.0 ± 0.21.9 ± 0.1
S0.0 ± 0.00.0 ± 0.00.1 ± 0.00.0 ± 0.00.3 ± 0.10.2 0.0
O b23.3 ± 2.127.4 ± 2.219.2 ± 2.119.4 ± 2.3 21.7 ± 2.216.1 ± 1.0
Mineral (mg/g, db)
Ca12.65.623.114.645.542.3
K1.20.90.91.41.90.8
Fe2.63.38.58.129.117.4
Ti1.13.13.46.19.35.7
Si2.24.94.74.912.29.0
Zn0.30.11.10.52.91.6
Cu0.20.30.50.6 1.1 1.6
Cl (%)0.10.10.10.2 0.2 0.1
Fuel properties
H/C0.870.910.940.891.111.03
O/C0.260.320.220.220.310.21
E.D (%)159.5160.2161.4155.3134.0149.2
HHV (MJ/kg)28.6 ± 0.428.7 ± 0.627.7 ± 0.626.6 ± 0.422.0 ± 0.424.5 ± 0.3
a Dry basis; b by difference, O (%) = 100-C-H-N-S.
Disclaimer/Publisher’s Note: The statements, opinions and data contained in all publications are solely those of the individual author(s) and contributor(s) and not of MDPI and/or the editor(s). MDPI and/or the editor(s) disclaim responsibility for any injury to people or property resulting from any ideas, methods, instructions or products referred to in the content.

