Article

Statistical Treatments of Chloride Threshold and Corrosion Propagation Rate

1
CIMNE—International Center for Numerical Methods in Engineering, 28010 Madrid, Spain
2
Faculty of Civil Engineering, UPM—Polytechnical University of Madrid, 28040 Madrid, Spain
*
Author to whom correspondence should be addressed.
Corros. Mater. Degrad. 2022, 3(4), 598-611; https://doi.org/10.3390/cmd3040032
Submission received: 18 August 2022 / Revised: 6 October 2022 / Accepted: 25 October 2022 / Published: 31 October 2022

Abstract

:
The variability found in real structures is a function of the “intrinsic” variability of the material itself, of its aging with time and of the external climatic conditions, and, therefore, it is normal that the chloride threshold and the corrosion rates could vary spatially in the same structure or temporarily as the concrete ages. In present communication, some statistical distributions of chloride threshold are discussed, as well as the variability of the corrosion rate in real exposure conditions. In all both cases, the values found in laboratory specimens are in the same range than those found in real structures. The chloride threshold can vary from 0.2% to around 3% by weight of cement depending on the corrosion potential, which, in turn, depends on the particular condition of the steel bar in each structure. The corrosion rates show to be below 0.1 µA/cm2 when the steel is passive and values above 1 µA/cm2 are seldom found in real structures. The high variability when considering all choices may impact in a prediction of residual life of several decades of difference which aims into the need for the assessment of a specialized engineering judgement in function of the quality of the concrete and the exposure class.

1. Introduction

Concrete is a material which evolves with time and almost never stops the evolution of its microstructure due not only to the age, but to the action of the environment where the structure is. This permanent evolution makes necessary that its characterization from the durability point of view is accompanied with the statistical variation of the input parameters of the models that will be used for prediction. Variation sources for concrete heterogeneity, apart from the fact that it is a composite material, may be produced by the variations: (a) of the quantities of the raw materials, (b) the mixing procedures and duration, (c) placing and compaction methods, (d) the curing regime and (e) the interaction with the environment after the curing time during the aging of the material. All these possible variables influence not only the mechanical strength, but all other concrete properties.
The variability has been very much studied on the mechanical strength, but much less on the durability properties. Thus, at laboratory level, the statistical treatment with a set of variables is not a common practice, one of the most studied being the effect in the gas or water permeability and absorption [1]. Studies of durability properties in real structures are also very scarce because, in general, few cores are drilled and then the statistical treatment cannot be made. Among the very few published data, those on the temperature inside the concrete (in order to know the volumetric variations) are the most published [2]. Fewer references are found on other parameters, such as the degree of saturation or the corrosion parameters [3,4]. Remarkable work, however, on the chloride ingress has been conducted in Norway [5,6,7], and on a few other more recently published studies [8,9]. Mention has to be made, as well, to the indications collected by the fib through [10,11], in which the statistical variation of the chloride threshold was identified, and one distribution was proposed [10].
For improvement of the predictions of service life, to be based in statistical distributions is the way to progress and it is necessary to start to collect values, either in the laboratory or in the real structures, in order to have a database enabling a better accuracy of present models of prediction, and their calibration by deducing their “model error”. In the present paper will be: (1) statistically analyzed previously published data of chloride threshold obtained on site and compared to those found in the laboratory, and (2) presented data of corrosion rates measured in real structures, either corroding by carbonation or by chlorides, which will be statistically analyzed. Next is a description of the results that will be considered as a bibliographic review with further analysis.

1.1. Previous Results on Chloride Threshold

1.1.1. Laboratory Results

It is worth mentioning that the first work made in the laboratory considering the statistical distribution of the chloride threshold is from Hausmann [12] who established an average value of Cl/OH = 0.66 as the limit above which corrosion likely starts, but with a statistical distribution up to Cl/OH ratio of 4 or higher. With this work in terms of Cl/OH, it has been difficult to translate the distribution proposed there to one with respect to weight of concrete or cement mass, due to the simultaneous effect of OH concentration.
Further relevant work, also from laboratory tests, that established a limiting value of the chloride concentration regarding steel corrosion is reported in [13] by suggesting as a threshold the value of 0.4% by weight of cement. This limiting value became popular and adopted in all the standards, but it was related to the average maximum chloride that a pure Portland cement can bind; that is, it is the maximum chloride content for a cement to be used without inducing active corrosion. As cements other than pure Portland cement have different composition, the maximum bound chloride is variable and then, this limit is a convention more than reflects a general chloride threshold.
Another work conducted in mortar specimens at the laboratory, in which the author of the present paper participated, is that of [14], which was later treated statistically [15]. In this work, it was concluded that it is the steel potential which controls the chloride threshold as illustrated by Pourbaix [16]. All the other variables identified first influence the steel potential, in particular, the oxygen content. As a consequence, it was found that for potential values more anodic than −200 mVSCE, the chloride threshold is more or less constant. These values more positive than −200 mVSCE follow a normal distribution [15] with a mean of 0.70% of chloride by cement weight with a standard deviation of 0.20%, which results in a CoV of 28.6%. For potential values more cathodic than the −200 mVSCE, a log-normal distribution with a mean value of 1.53% with a standard deviation of 0.53% (CoV = 34.6%) was found.
With respect to the chloride threshold, the work in the laboratory from [17], which was first cited in Duracrete project [18] with a distribution with a mean value of 0.48% by cement weight and a standard deviation of 0.15% (CoV = 31%), must be mentioned. This distribution was later incorporated into the fib Bulletin 34 [10] with the same standard deviation, but an averaged value of 0.6% [19], with no justification on the shift of the average value from 0.5% to 0.6%. The confusion created by the differences among authors when citing the work of [17] must also be remarked upon: thus, it is mentioned in [15] that [17] gives an averaged value of 0.5% and a standard deviation of 0.18% (CoV = 36%), in [20] that it gives an averaged value of 0.48% and a standard deviation of 0.15% (CoV = 0.31%) and in [21] an averaged value of 0.50 and standard deviation of 0.22 (CoV = 44%). Other relevant works were made at laboratory level and not repeated here because they can be found referred in [14]. More recently, data in the laboratory has been made by [8], finding a higher average value of the chloride threshold with a larger standard deviation, although the tests were made by natural diffusion testing. The reasons for these higher values were mentioned, but not explained.

1.1.2. Real Structures

The most comprehensive work to obtain chloride threshold values in bridges has been made in Norway [5]. A particular structure, where sensors were placed in a log-normal distribution with a mean value for critical chloride content of 0.77% by weight of cement (or 0.12% Cl by weight of concrete mass) and a coefficient of variation of 32%, was found in that work.
More recently, data from bridges in Switzerland have been reported in 2019 [21], which give an average value from the site testing higher and closer to the statistical distribution with potentials more cathodic than -200mVSCE. Surprisingly, these authors do not mention the previous work by [5,15]. Their data in the laboratory (just mentioned in previous paragraph [8]) also resulted in higher average threshold values, which could suggest that the differences may be due to the test conditions or the type of steel. In any case, the total range found by [21] confirms the previous observations that the statistical distribution of chloride thresholds can vary from case to case, within the total range until 3%.

1.2. Previous Results on Corrosion Rate

There were no found published corrosion rate values measured in real structures that could enable calculations of the spatial variation, apart from those of the authors [22,23], and of present the paper. More common are values in laboratory specimens, but in general, in fixed conditions of temperature and humidity, or in predetermined cycles in the laboratory.

2. Materials and Methods

2.1. Chloride Threshold

On chloride threshold, results were obtained by the authors or are taken from the literature. In the results from the authors, the chloride analyses were made following Rilem Recommendations [12,13] for total and water soluble chlorides. The method for testing the corrosion onset due to chlorides was a potentiostatic one well described in [14] and the statistical analysis in [15]. In any case, for better comprehension, some details of the procedures are repeated here.
In the laboratory samples [14], the work was made on 10 identical mortar specimens fabricated with different cement types and submitted to potentiostatic tests, in which the chlorides were forced to arrive to the rebar applying a voltage difference. In the experiments a sudden increase in the current indicated depassivation. The moment in which the specimens were broken and the concentration of chlorides neared the depassivated zone was analyzed for identifying the threshold value. Several potentials were tested confirming that it is the bar potential the controlling parameter of the chloride threshold.
In the real structures, each author [5,6,7,8,9] gives the manner in which they took the sample and analyzed the chloride content. They seem to have all followed Rilem Recommendations for the chloride analysis [23,24] As an example in [5], the critical chloride contents were determined by visual inspections of reinforcing bars after chiseling away the concrete cover and observing the corrosion levels. The critical content was associated to an even superficial incipient corrosion.

2.2. Corrosion Rate Determination

They were obtained in small specimens and in real structures. The corrosion rates were measured as described in Rilem Recommendation [25]. For the small specimens: the corrosion rate was obtained in the laboratory from the Polarization Resistance (Rp) or Linear Polarization method (LRP) [25]. The Rp is the ratio between a small electrical voltage (ΔE) imposed to the metal and the corresponding current response (ΔI). The Ecorr is simultaneously measured as first step. In the present results, a silver/silver chloride reference electrode was used. A potentiostatic method was used for the Rp recording with a waiting time for the response of 30 s. The measurements were made once per week. The ohmic drop due to the concrete is measured simultaneously at the moment of switching-off the voltage. It is removed by subtracting the value from that of the Rp. The corrosion rate was calculated using the expression:
I corr = B ( R p R c ) · A
where Rc = ohmic or concrete resistance, A = area exposed to attack that was of 23 cm2 and B = constant = 26 mV [20,21].
In the real structures, the corrosion rate was measured using the portable corrosion rate meter GECOR 8 or 10 that has a probe where the counter electrode has an electrically controlled guard ring for applying the “modulated confinement of the current” [26]. This method enables the local measurement of the current. The LRP is calculated through equation [1]. The reference electrode in the probe was of Cu/CuSO4.
The average data given here correspond to real structures that cannot be identified as the cases are confidential. The confidentiality is additionally preserved by presenting only an averaged value. Generic names have been given to each structure; these names can be found in the figures.
On the other hand, here, data that were collected around 30 years ago by the company Geocisa [27] are treated statistically, including a large survey in buildings suffering deterioration due to the use of aluminous cement (between 3500 and 4000 points). Data measured along around 30 years by the group of research of the authors [22,25,28,29] are also represented.

3. Results

Regarding the data to be analyzed, as mentioned in the Introduction, those of chloride threshold are previously published and a more elaborated discussion will be made in the present paper, which has not been found until now and it is necessary for the engineering practical application. The results on corrosion rates presented are non published data.

3.1. Chloride Theshold

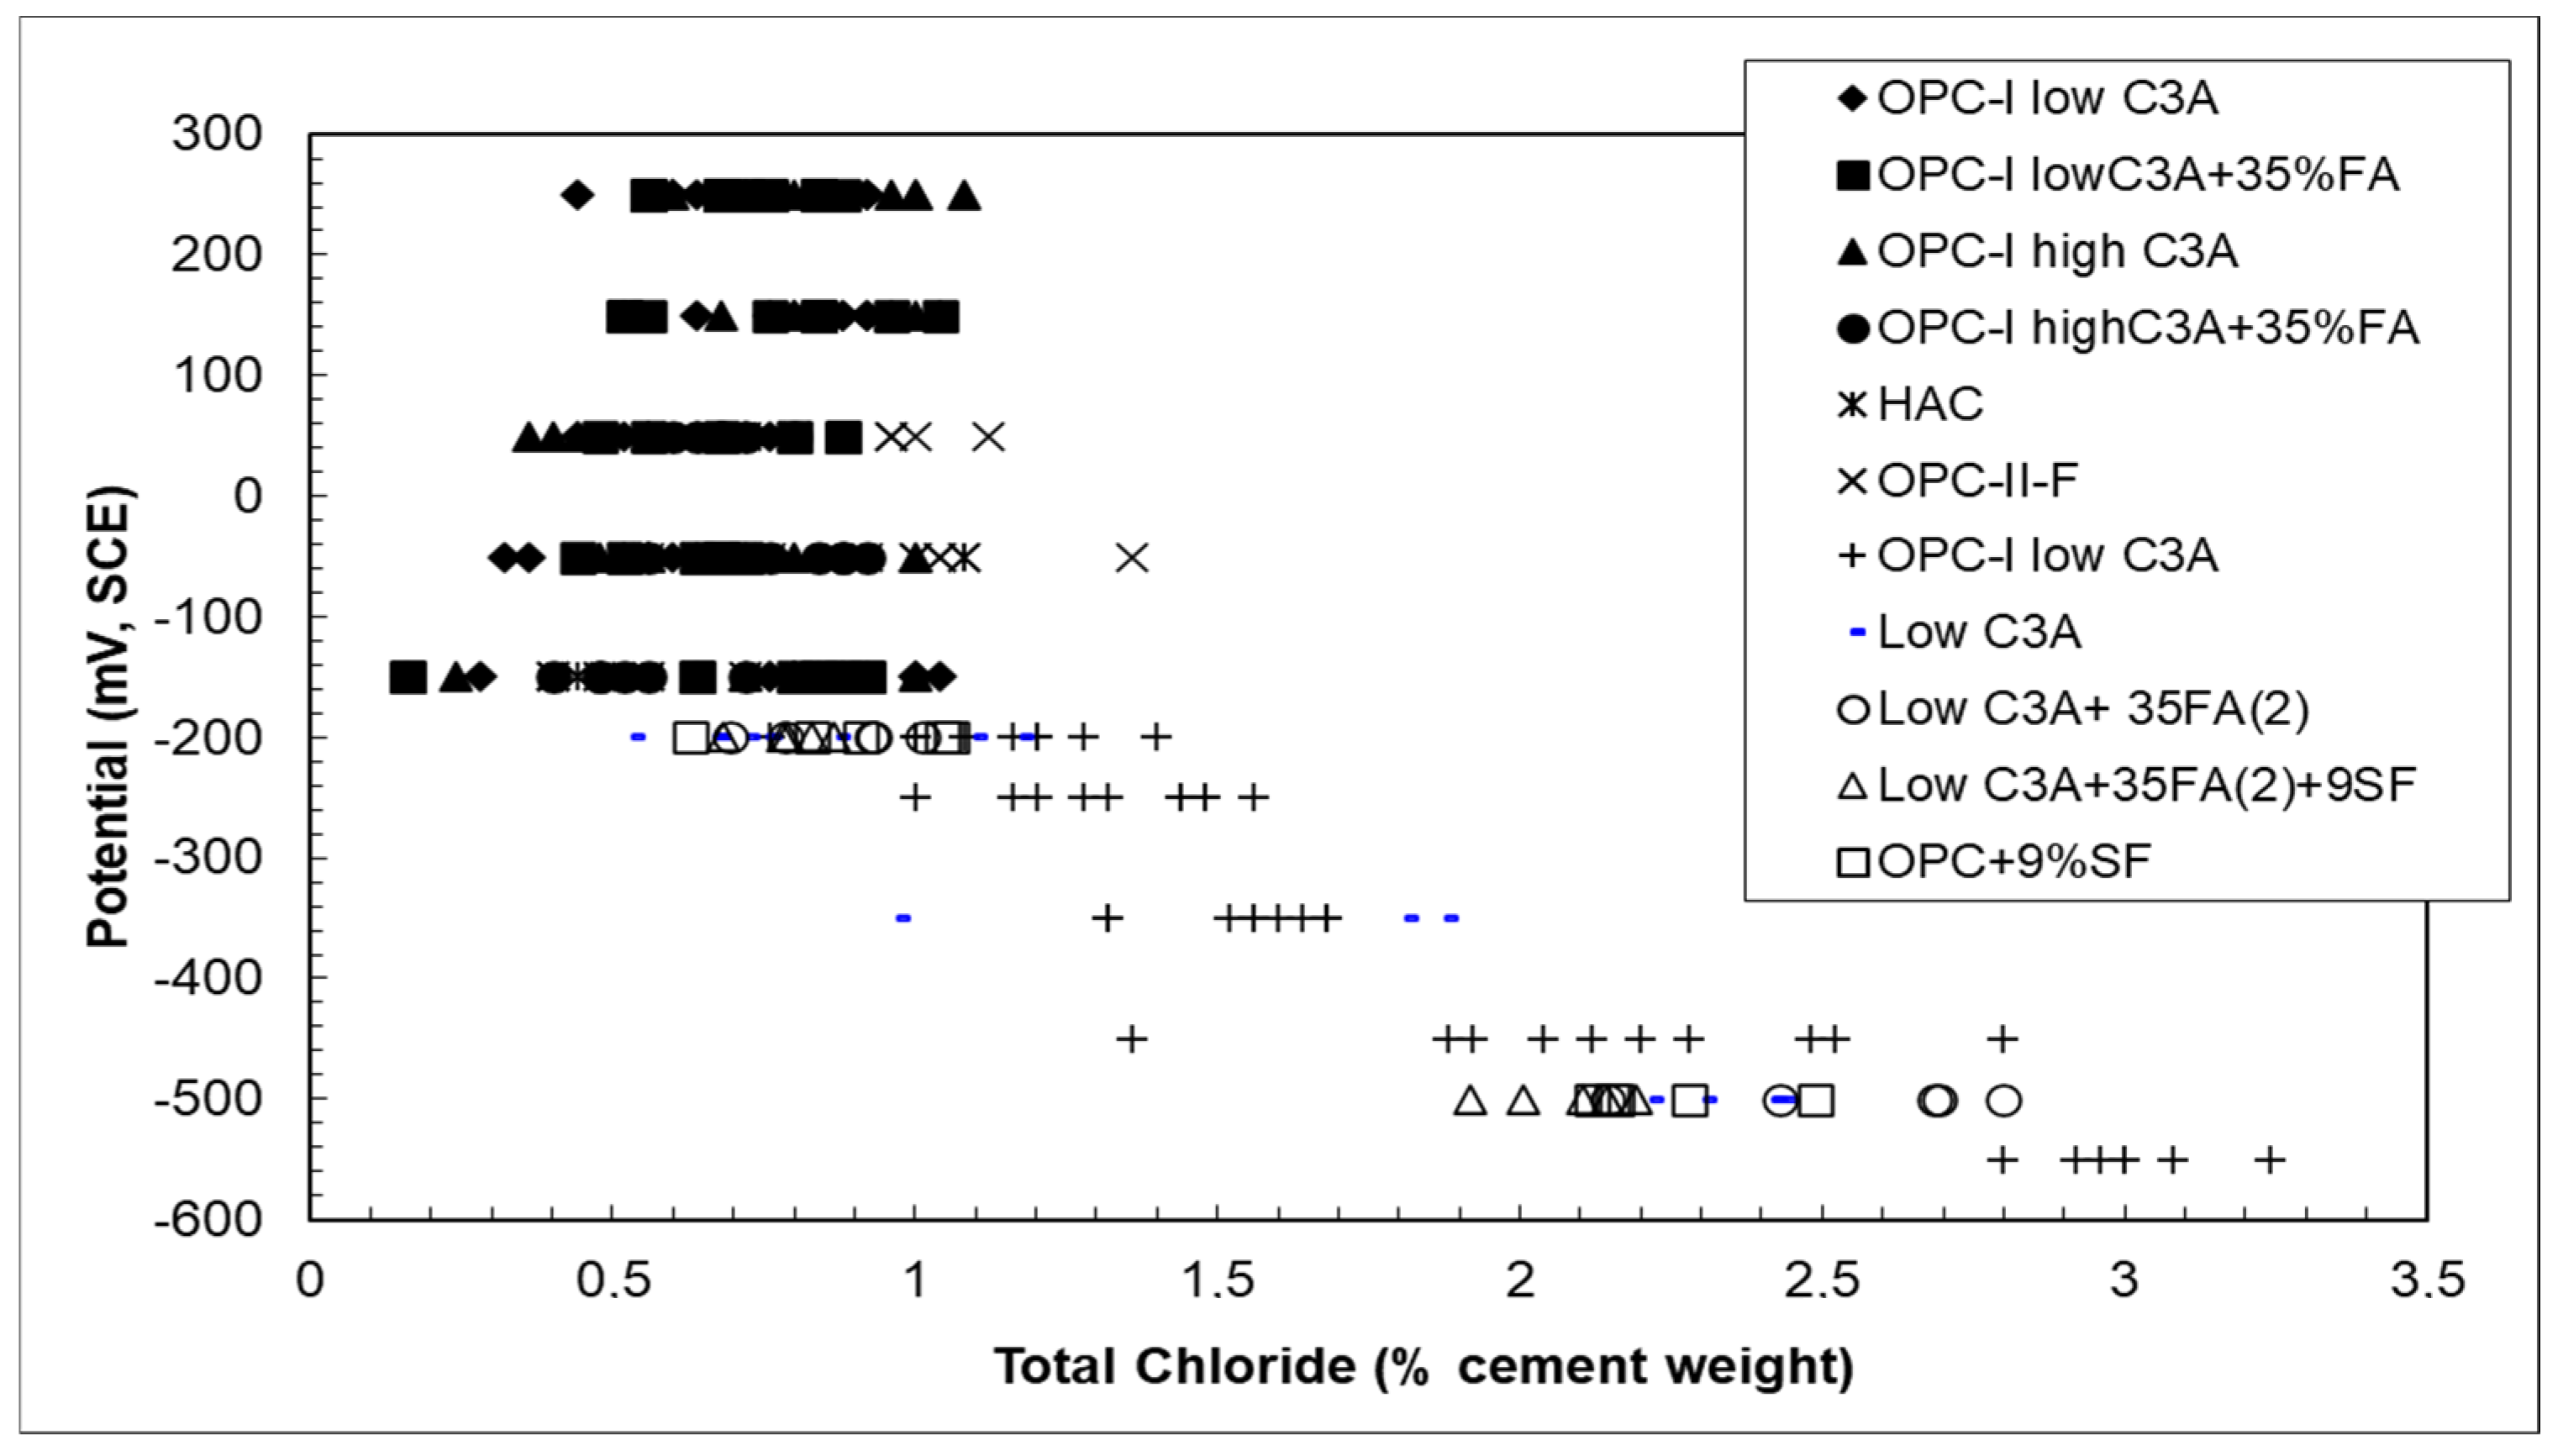
3.1.1. Laboratory Results

For a better understanding, the results mentioned above in [14] are reproduced in Figure 1

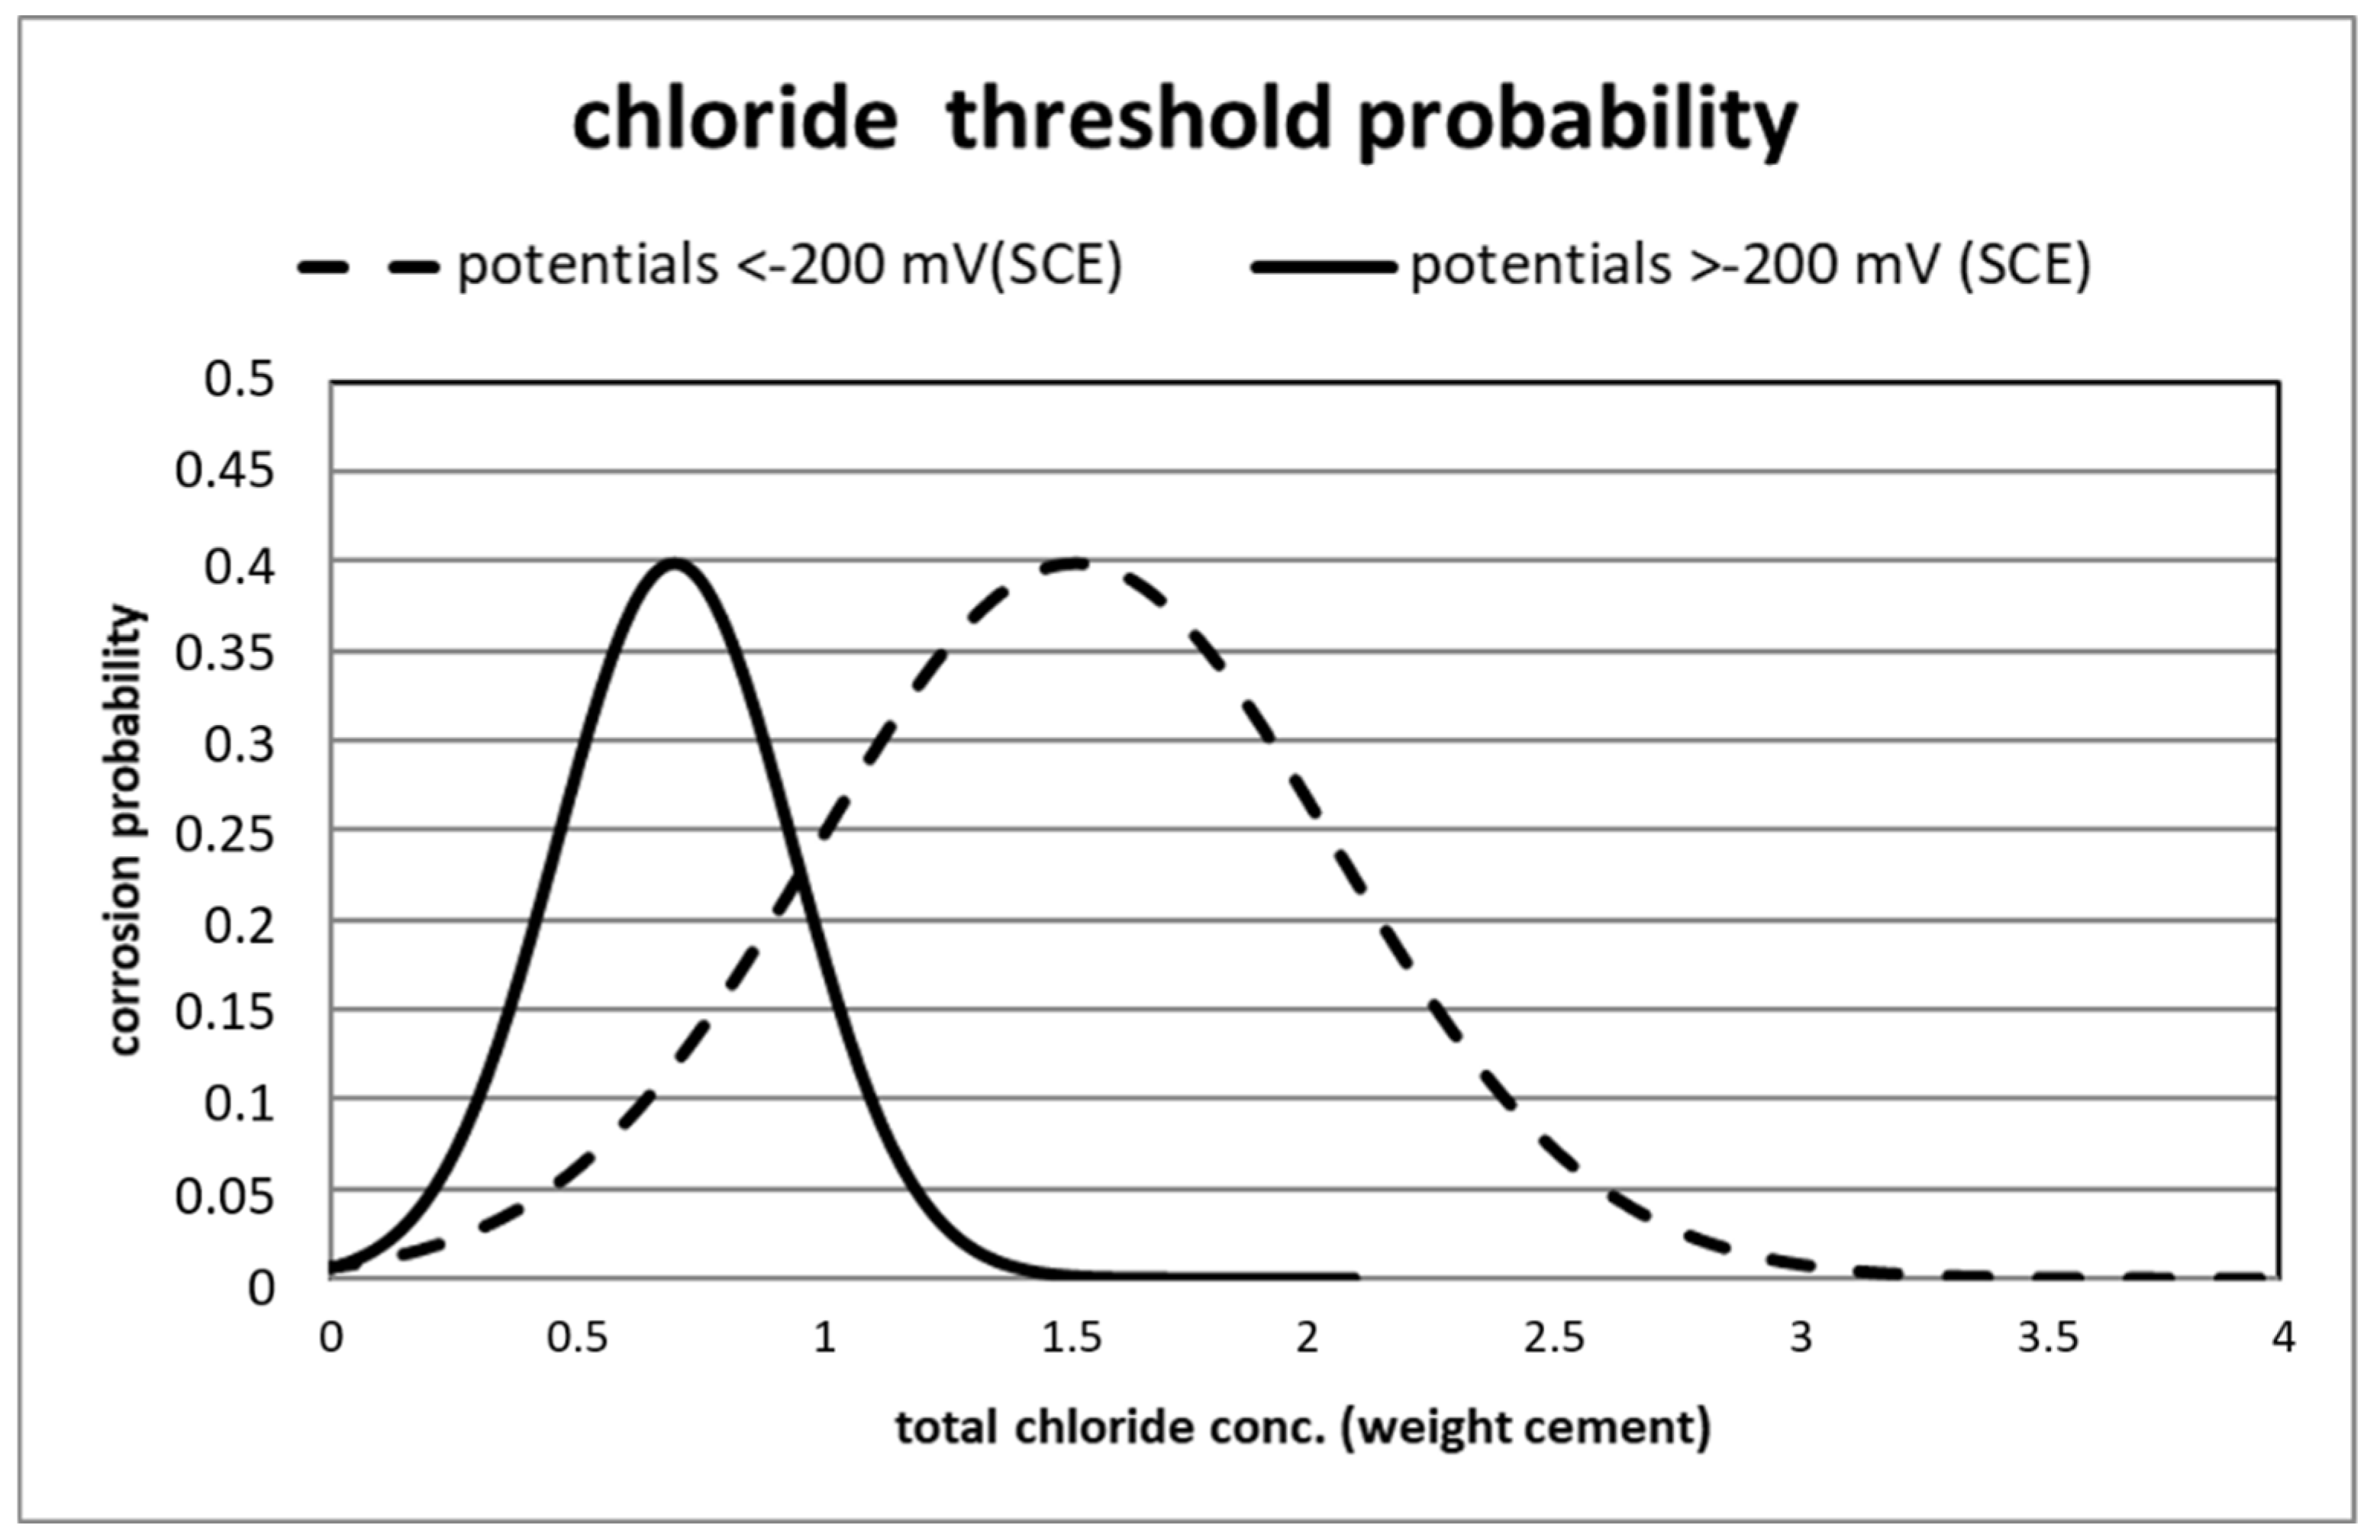
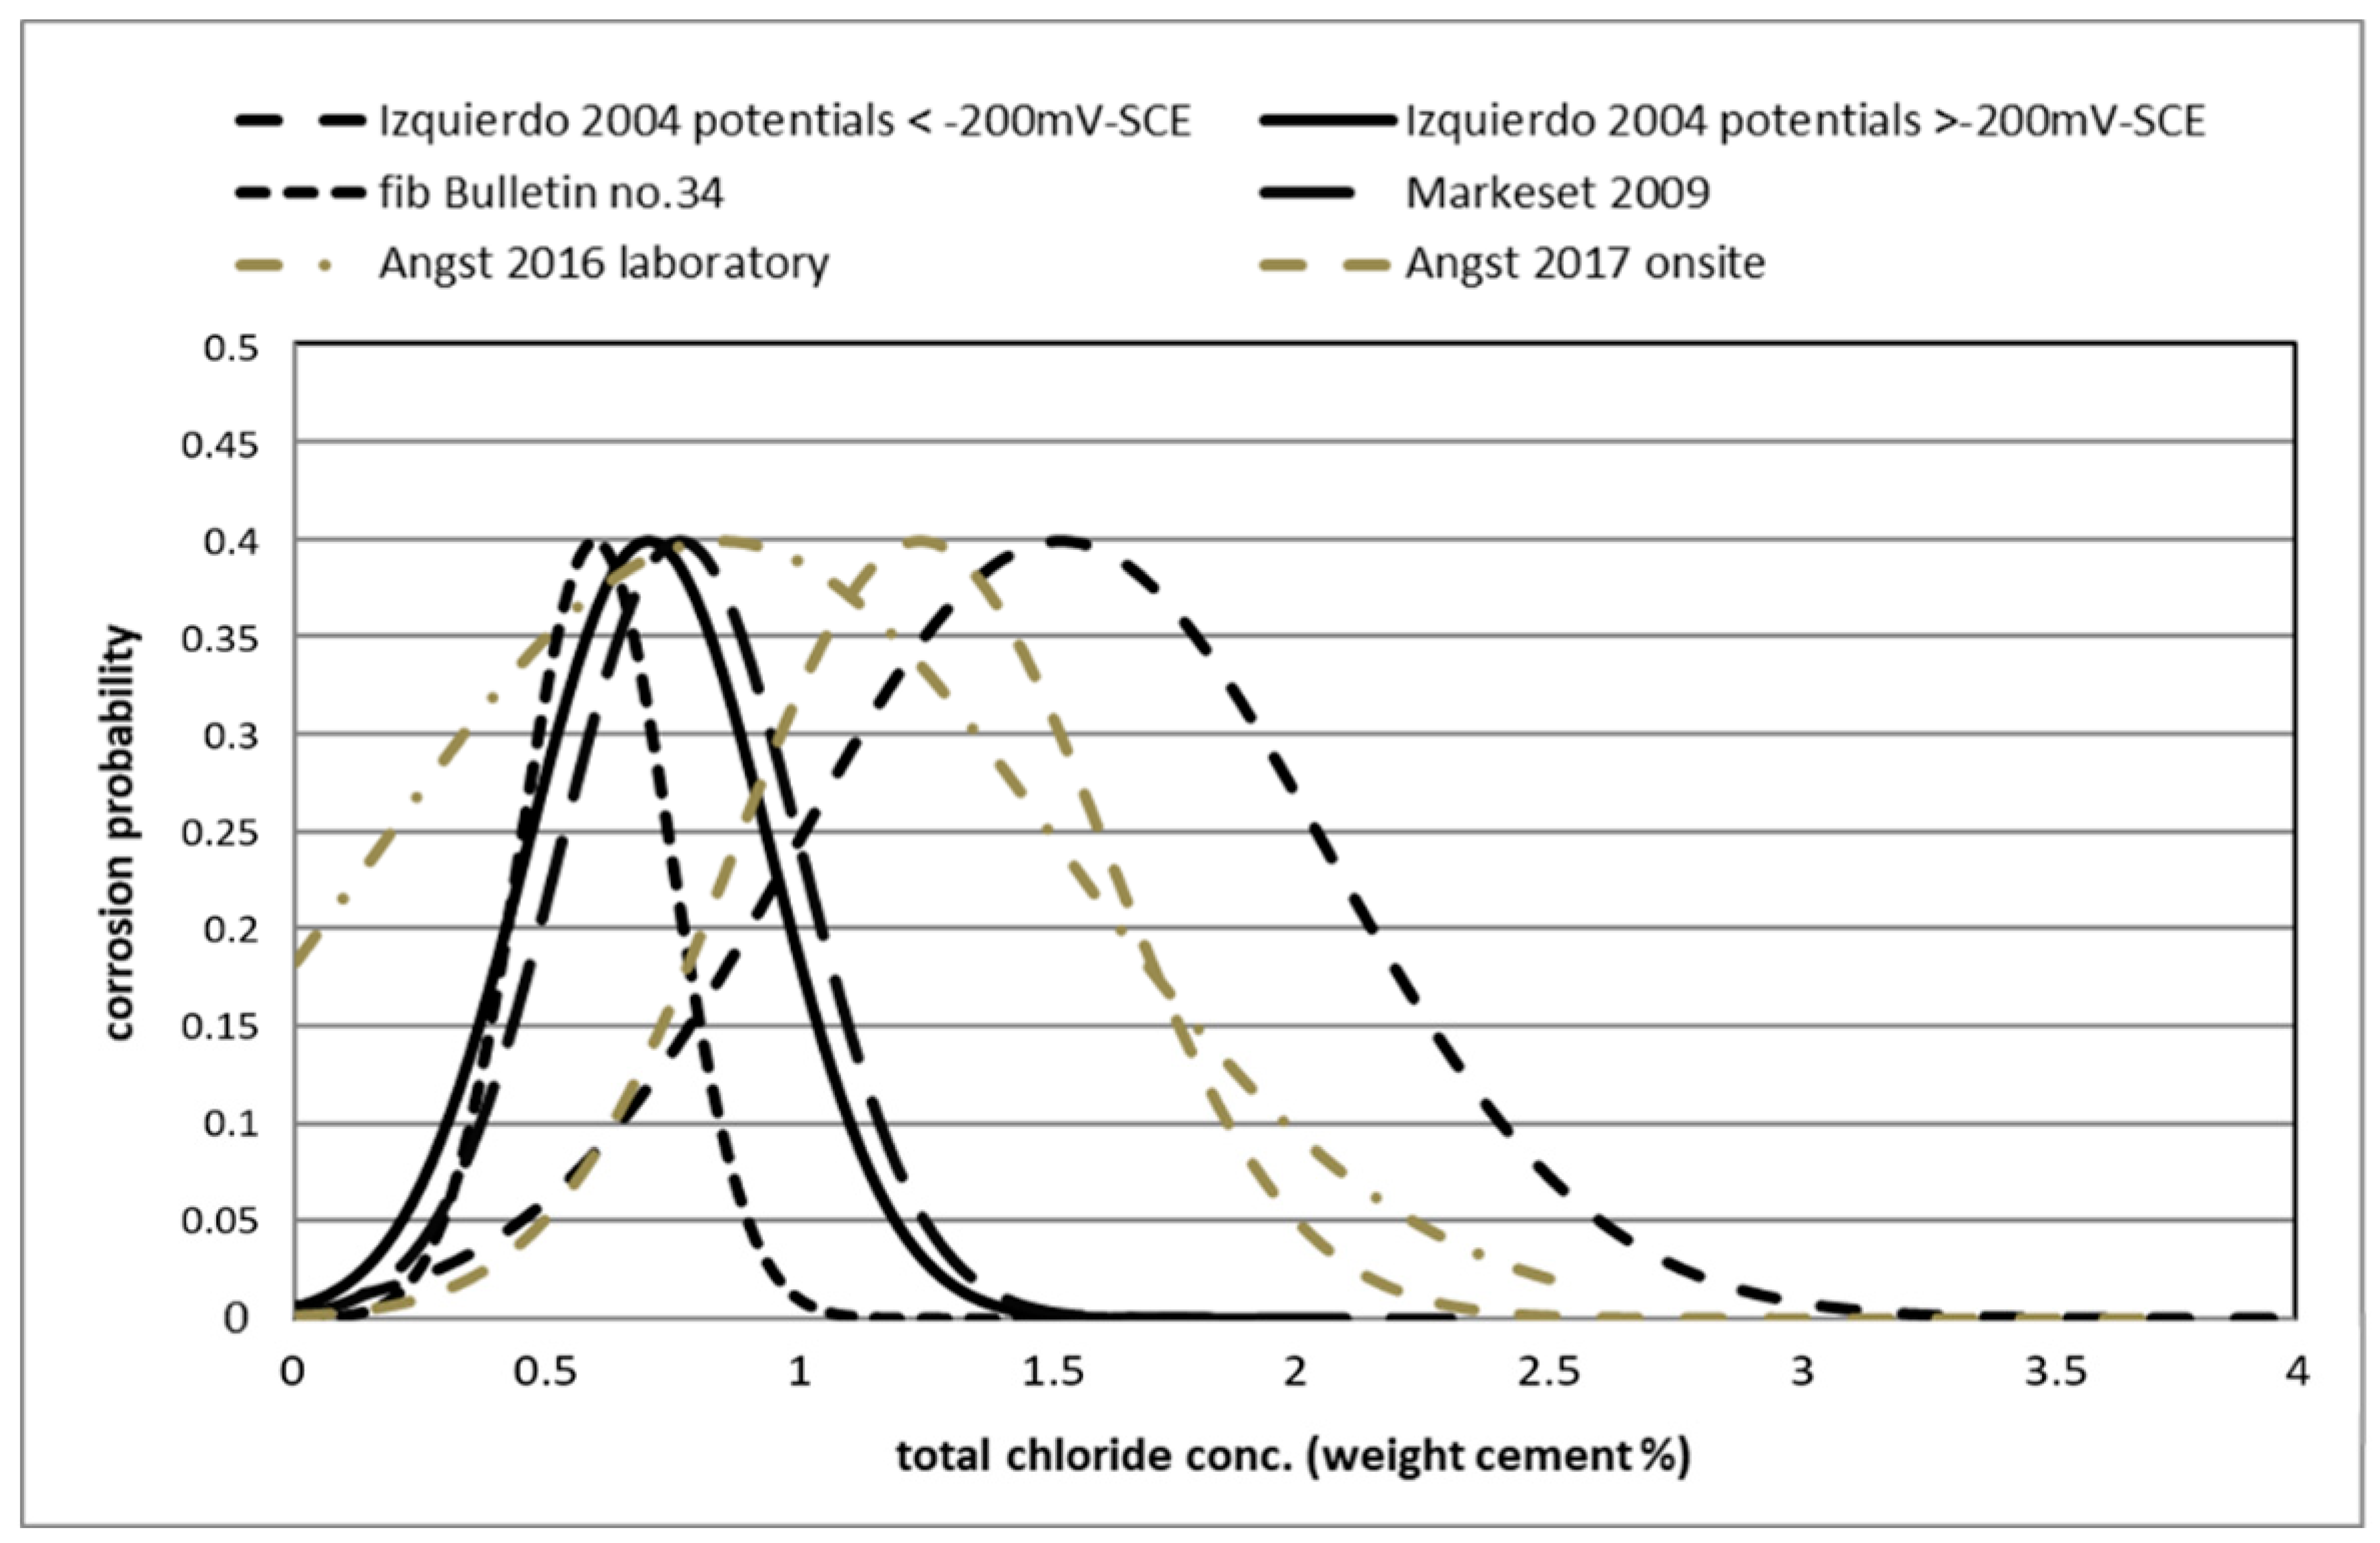
3.1.2. Results from Real Structures of Chloride Threshold

Those that will be discussed later are the ones given in [5,8,9].

3.2. Corrosion Rates

Values of corrosion rate in small specimens are used in the present paper for illustration of the temporal variation while data measured in real structures are given to illustrate the variability in outdoor exposed structures. As mentioned in the Rilem Recommendation [30], the level of values of corrosion rate in small laboratory specimens and in real conditions are similar, providing the concrete conditions are the same.

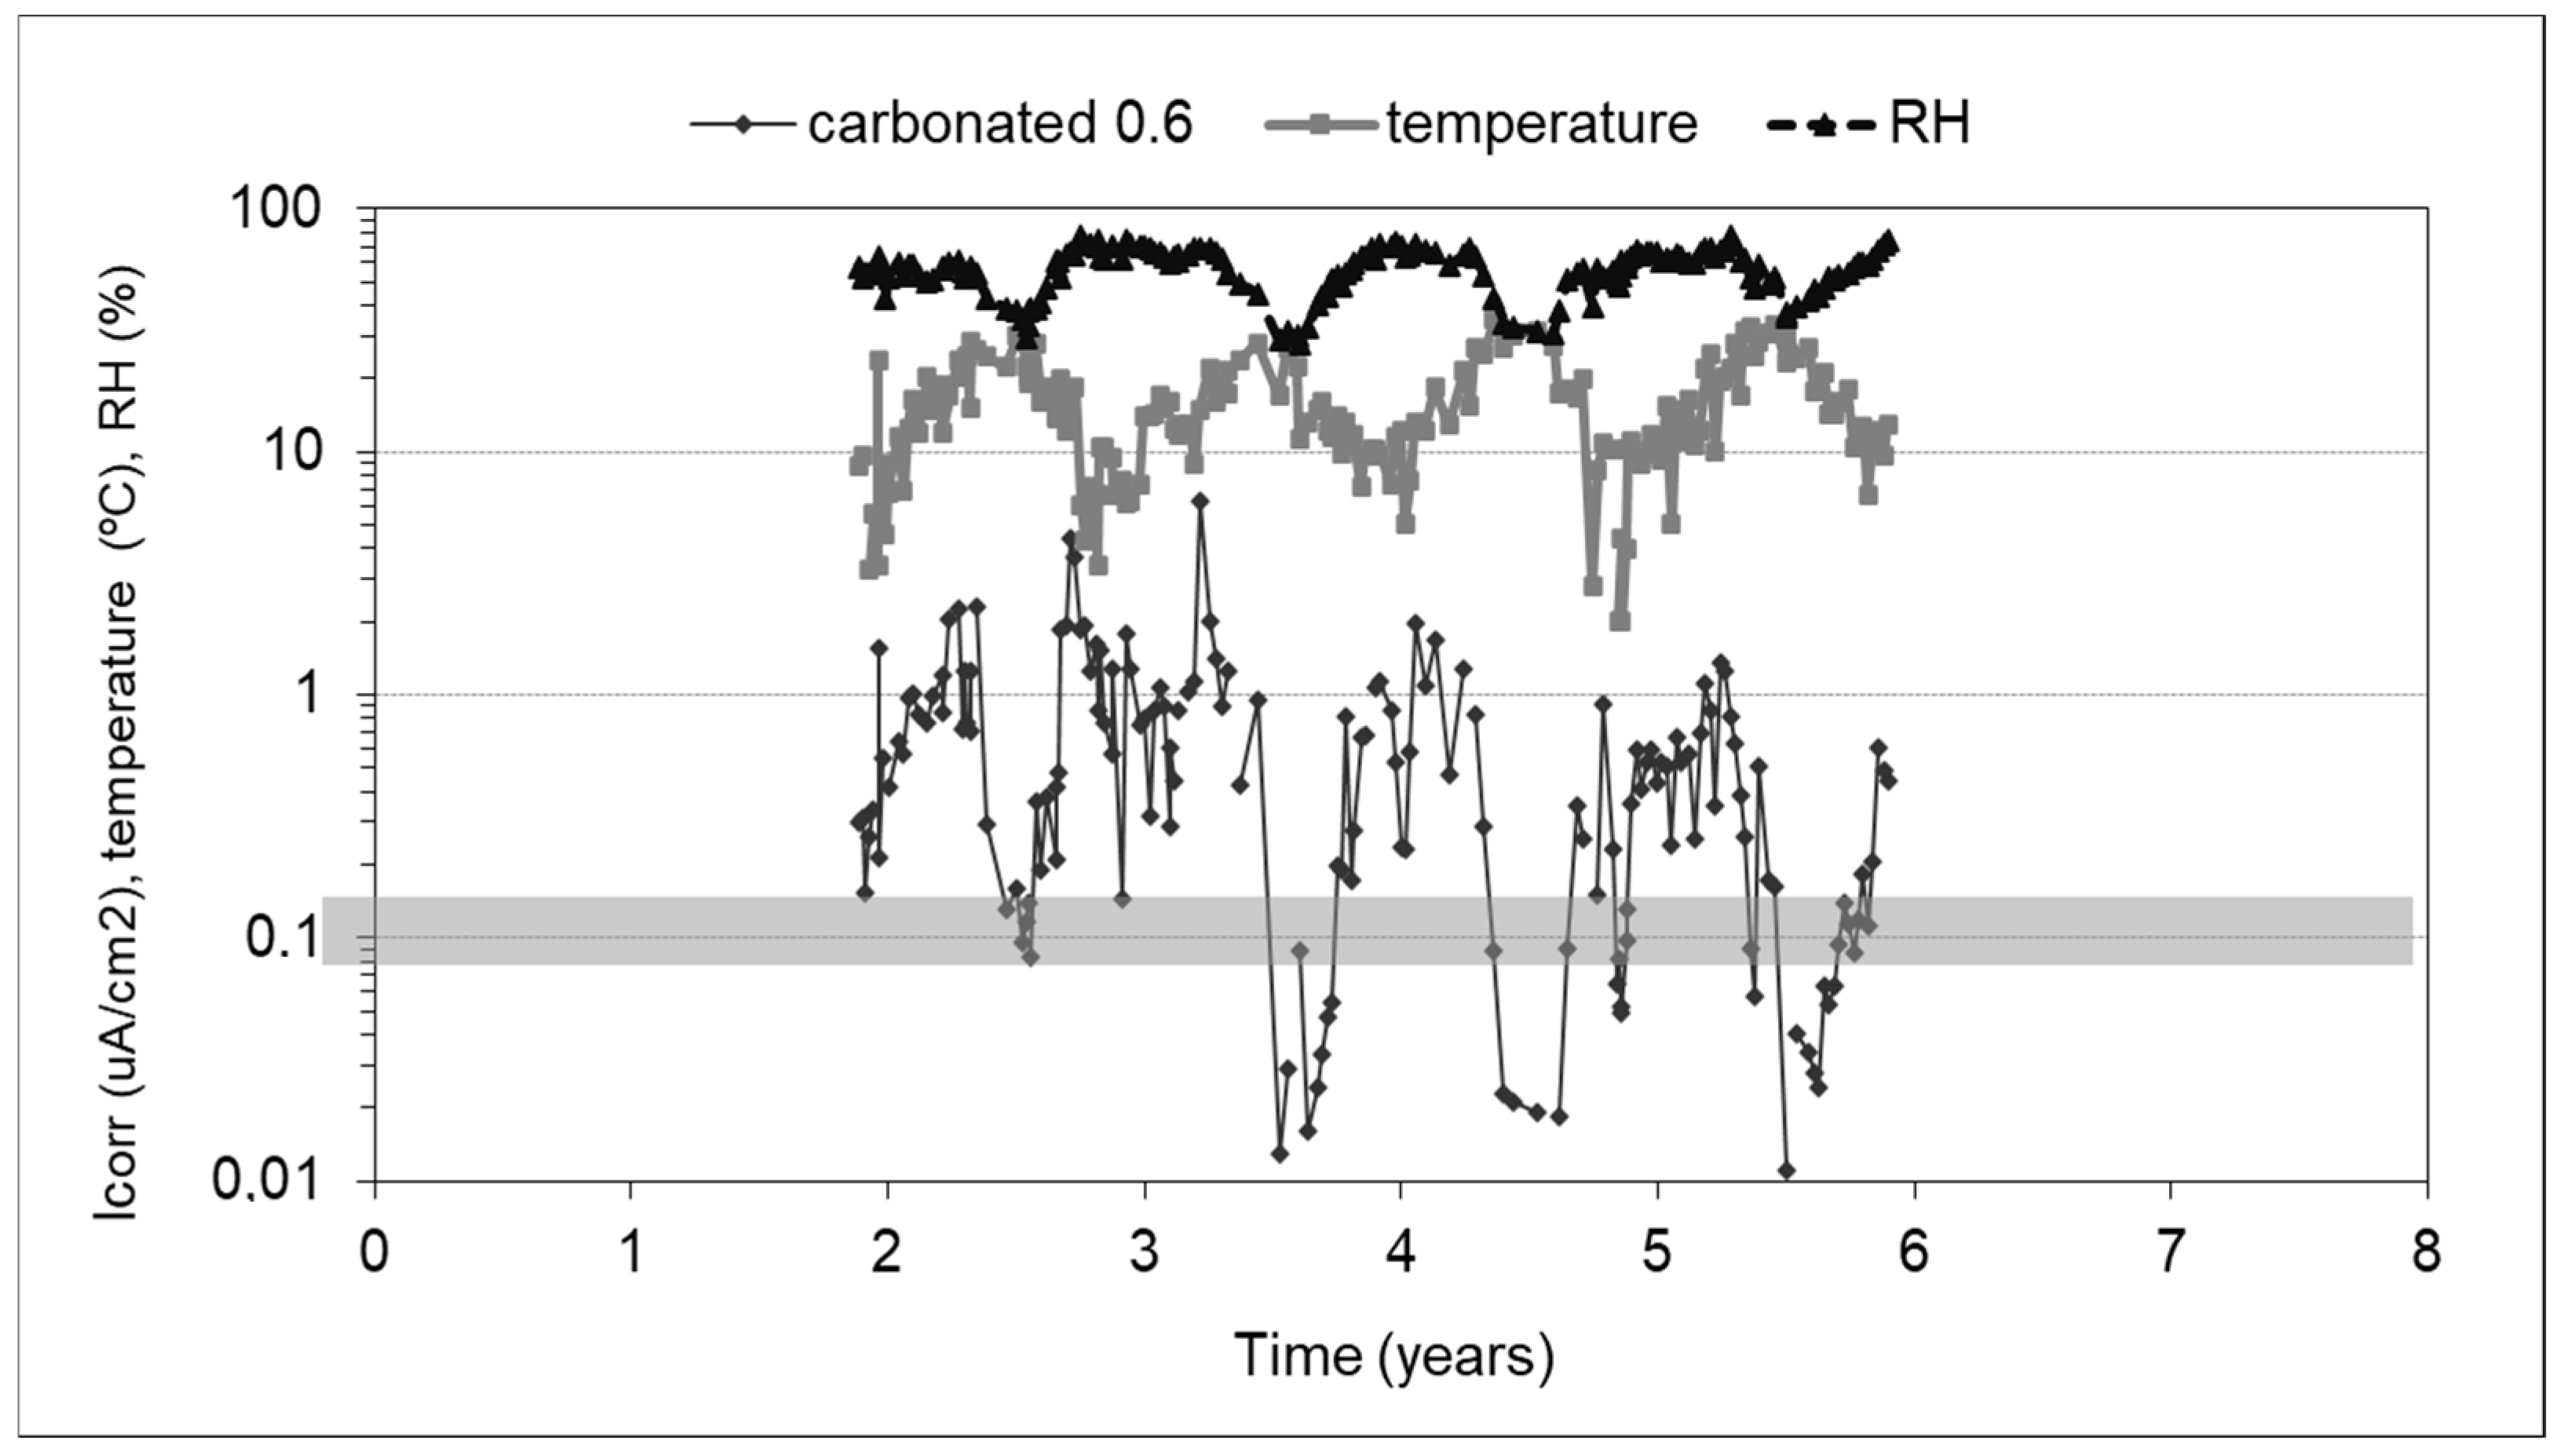
3.2.1. Laboratory Results. Temporal Variation

In Figure 2 is shown an example of the temporal variation of a carbonated specimen exposed outdoors, not protected from rain effects. The variation of temperature together with the rain periods induce the changes in the detected RH values in a hole inside the concrete and, consequently, the corrosion rate (Icorr) changes [4].

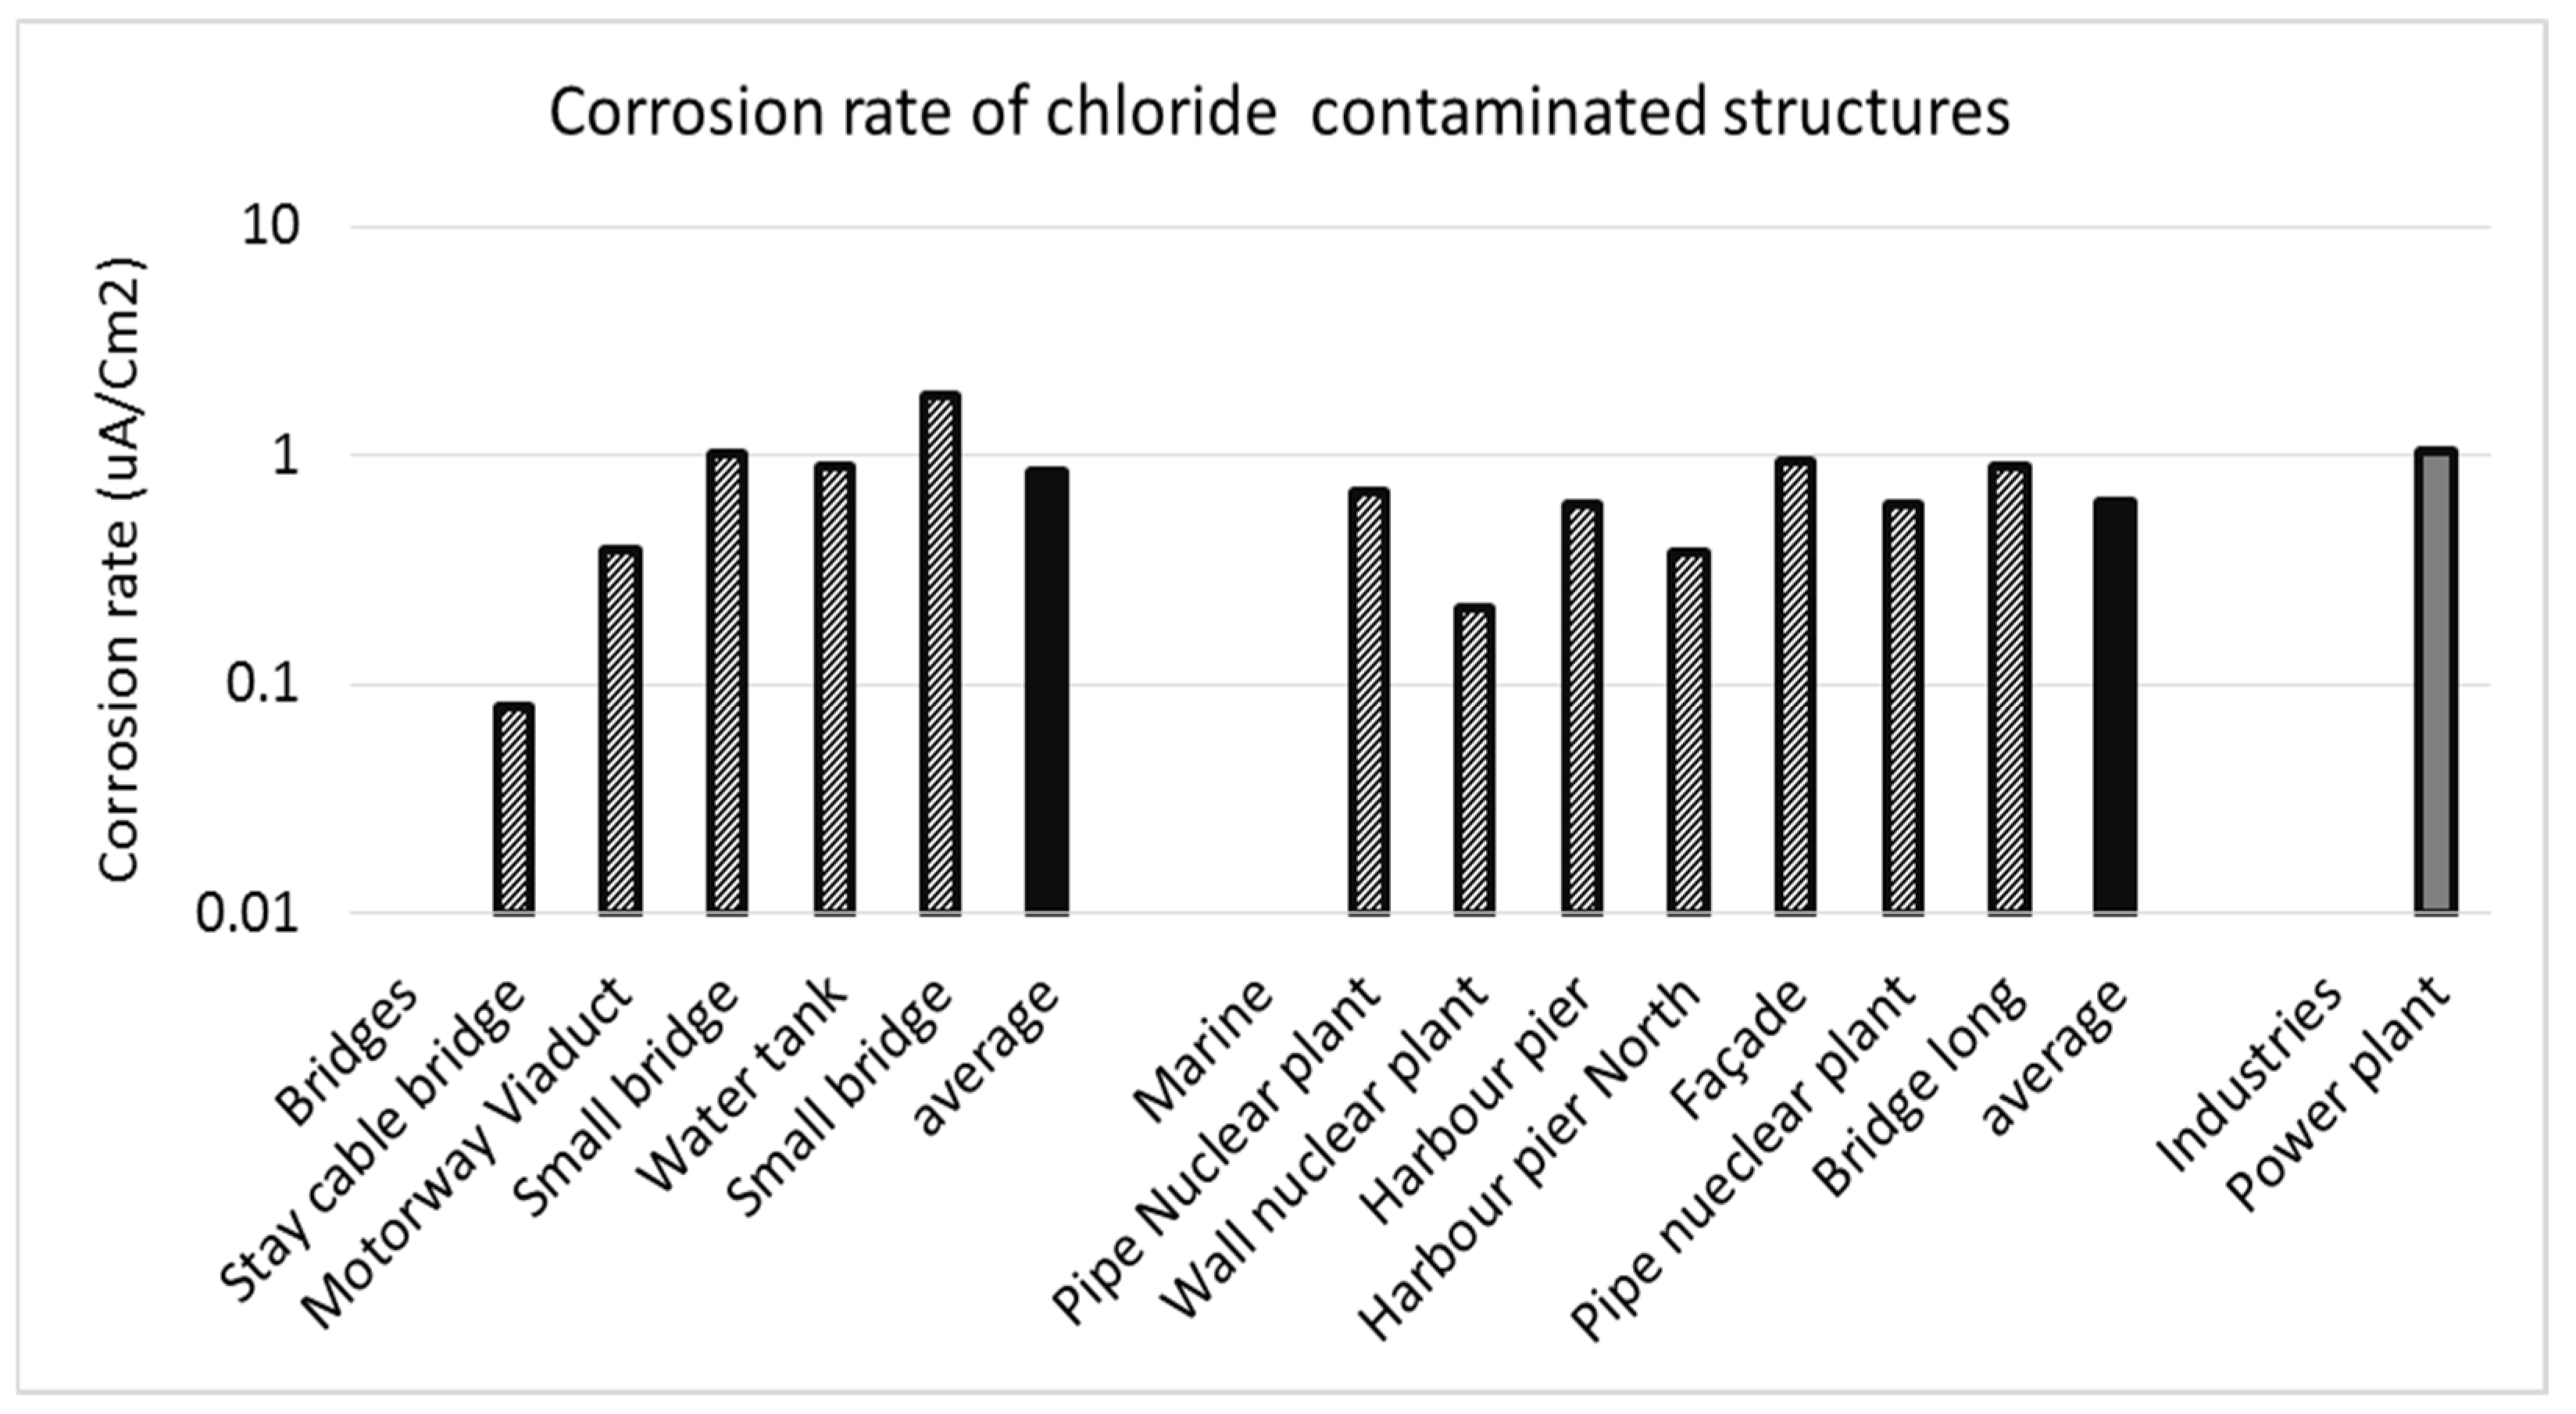
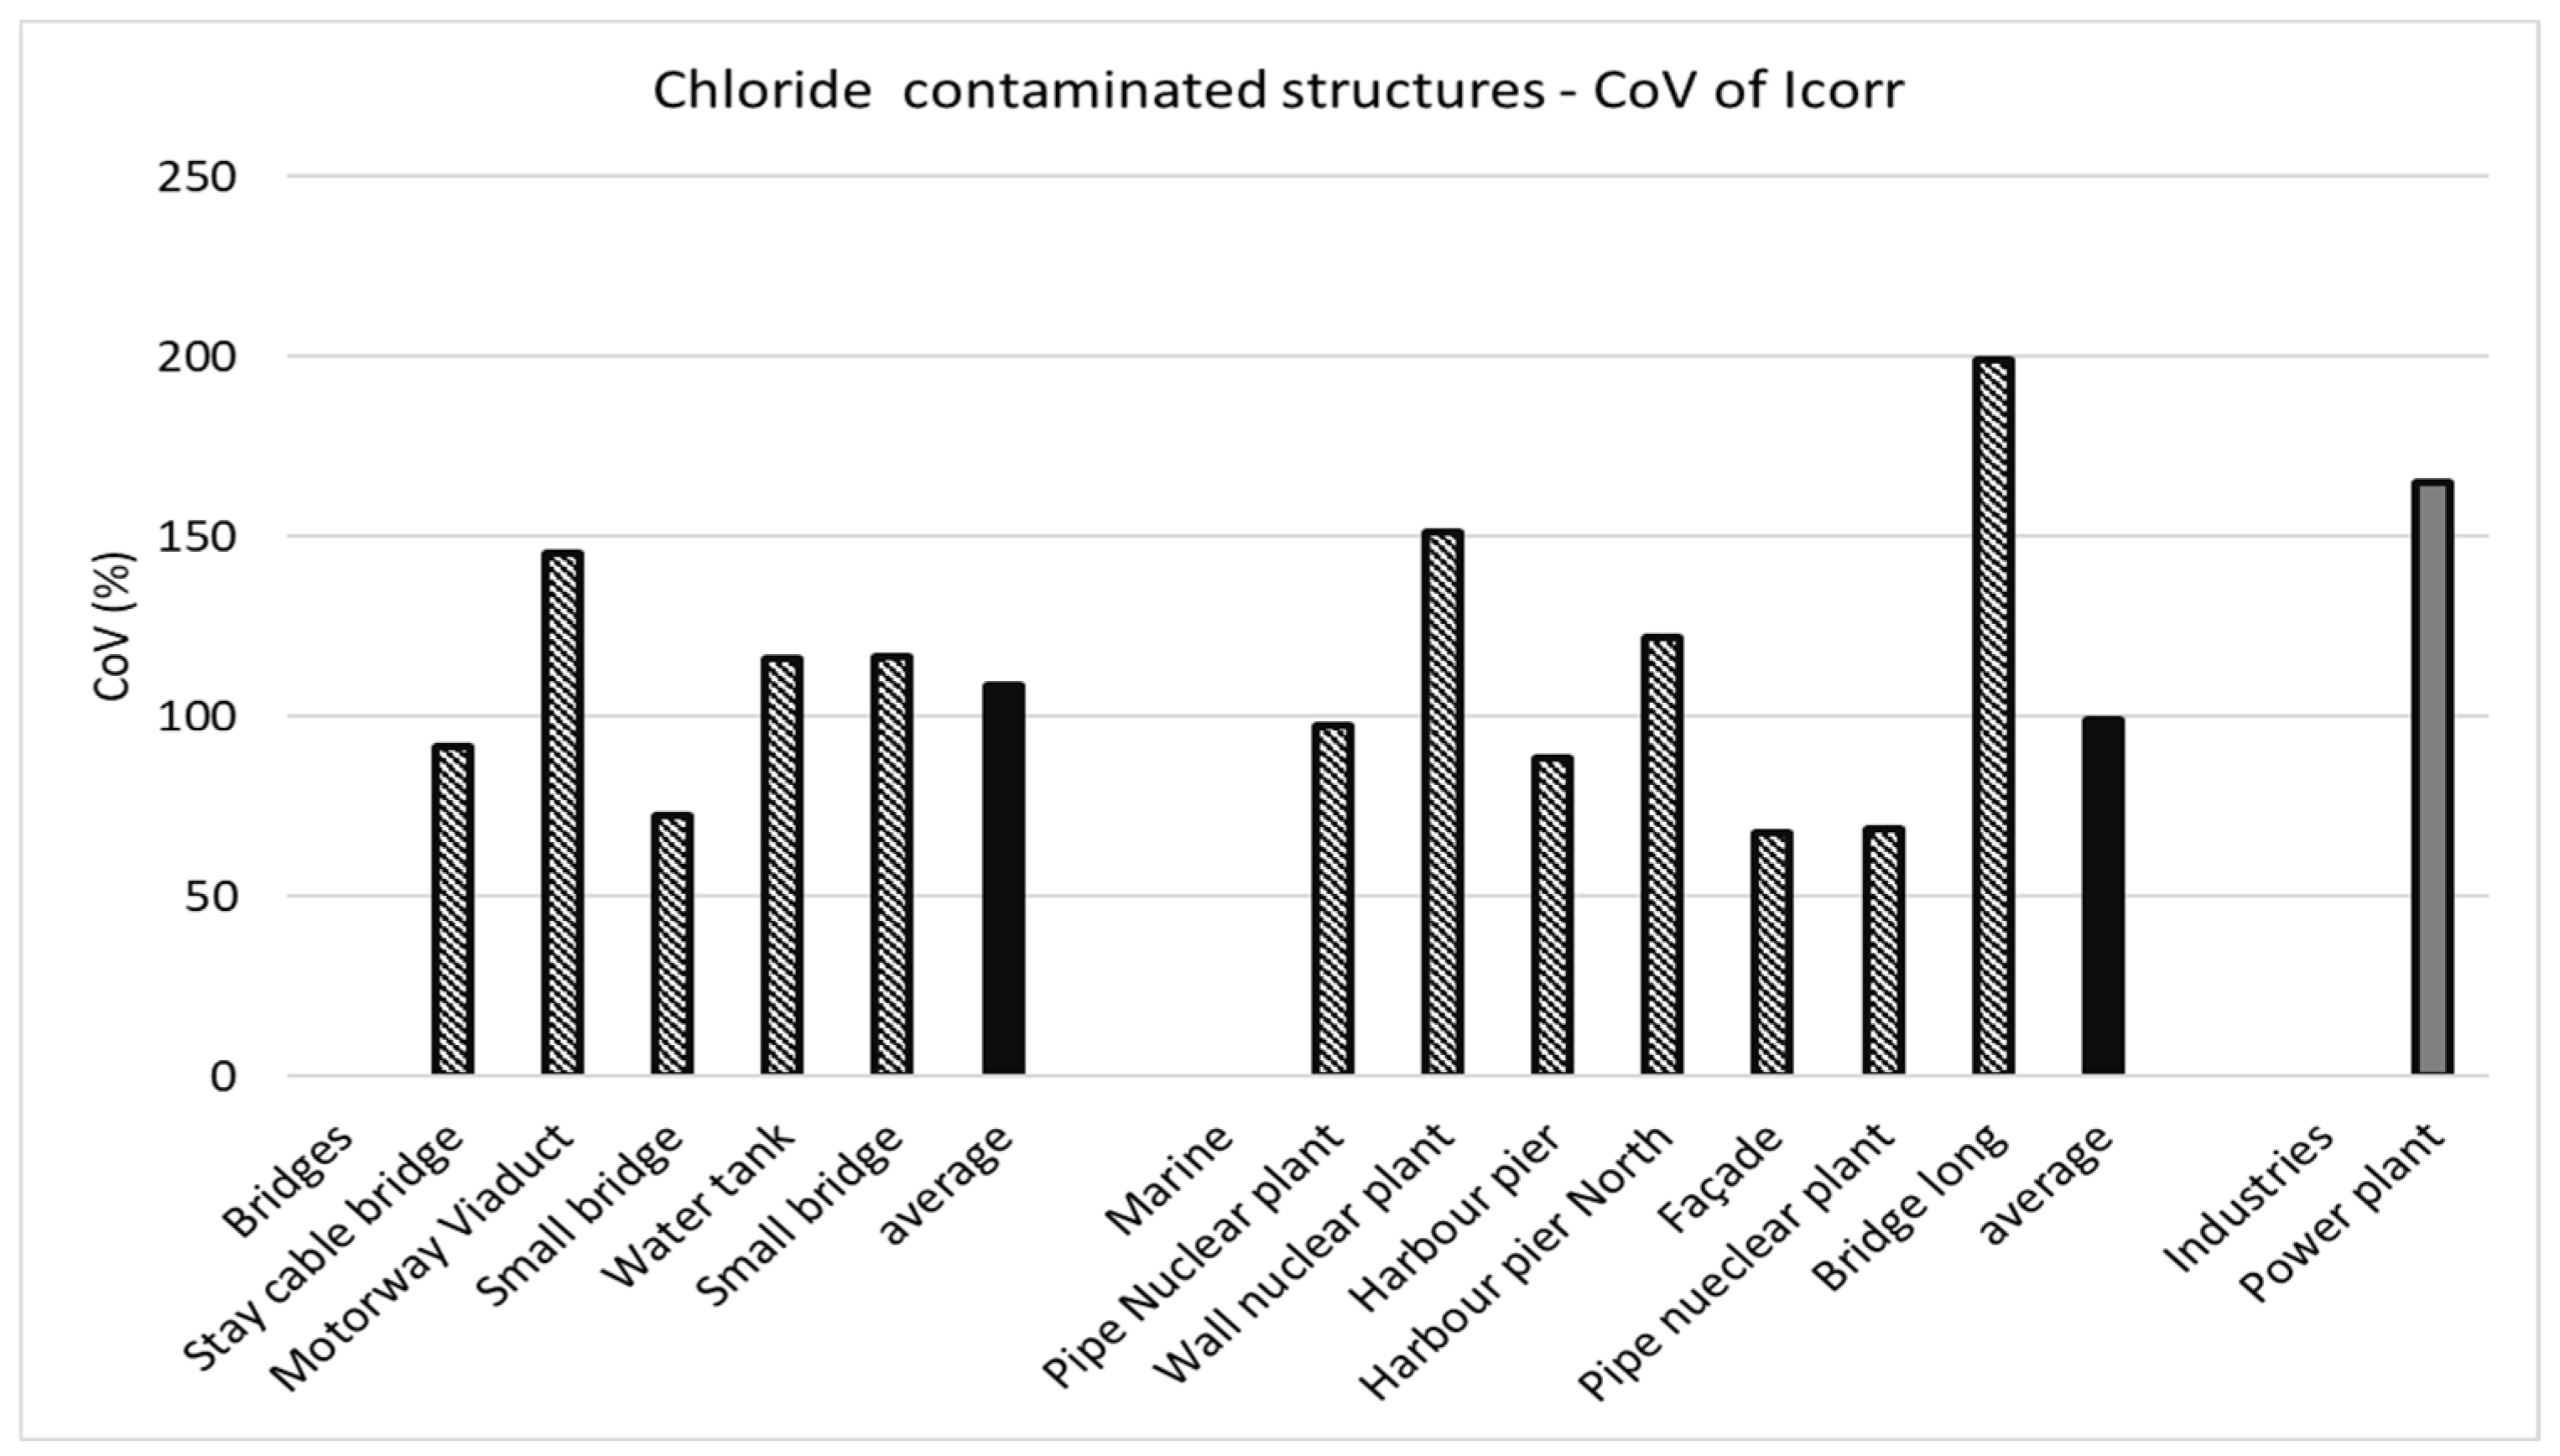
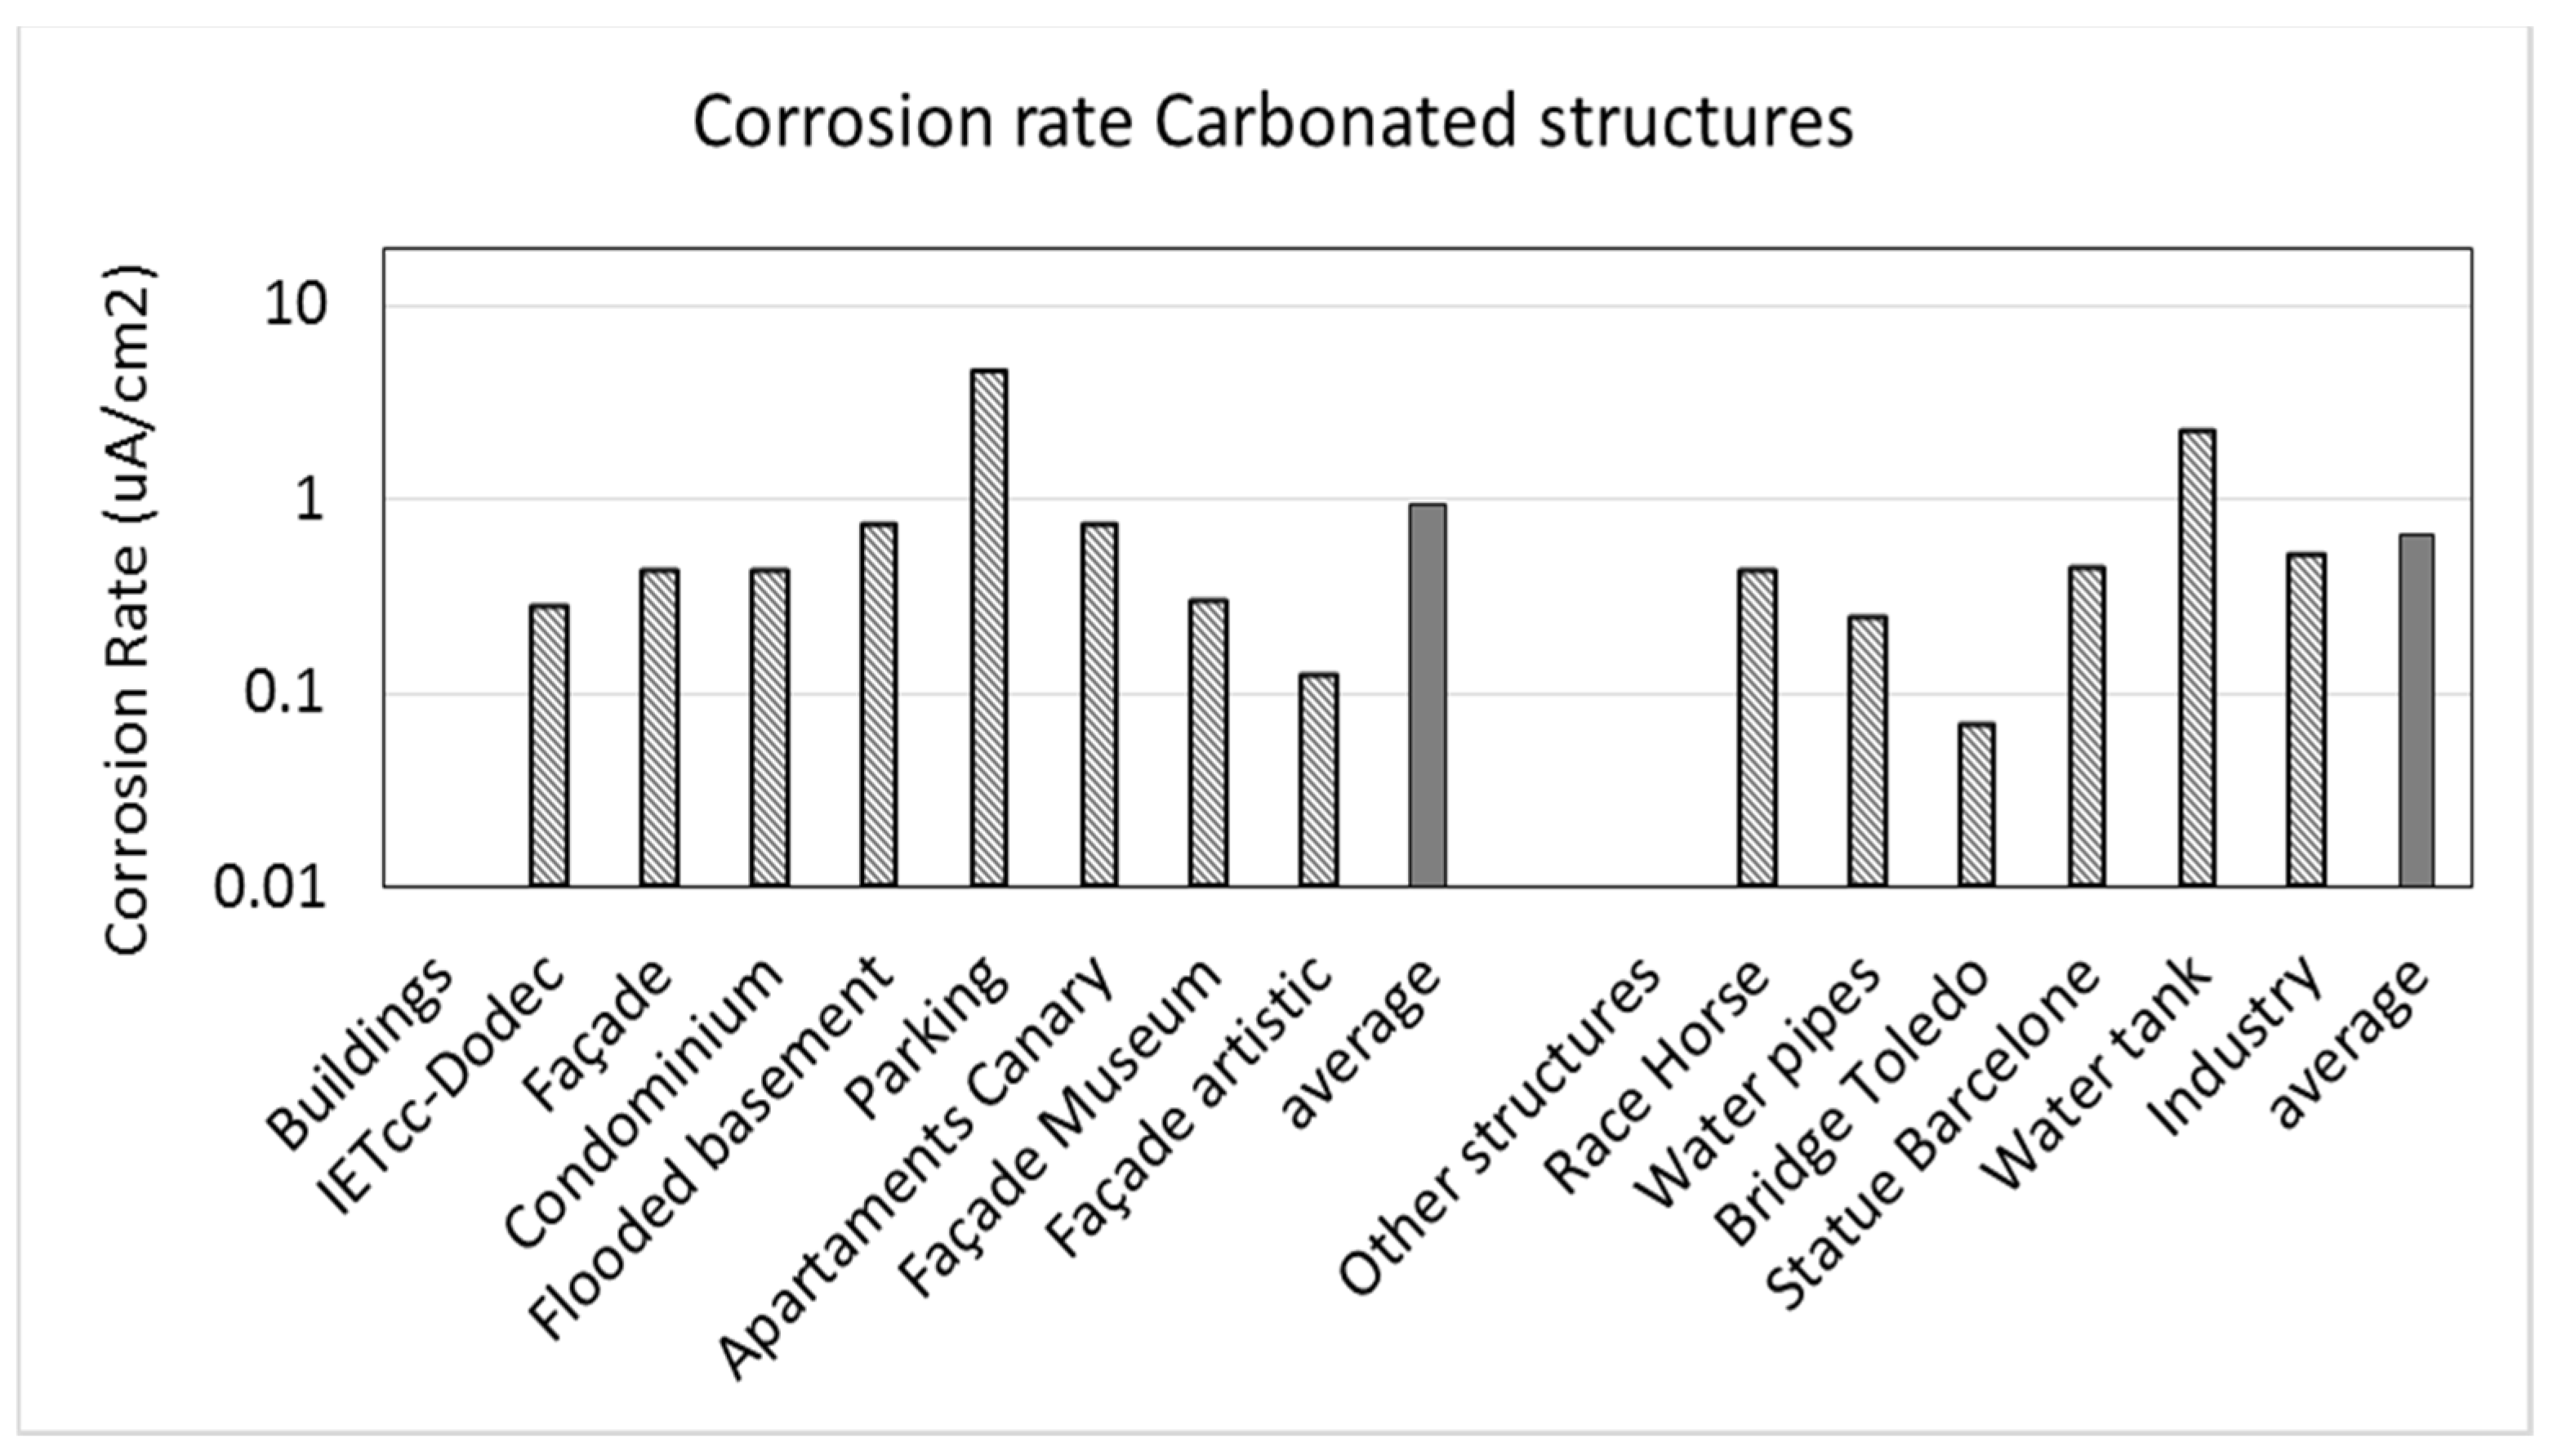
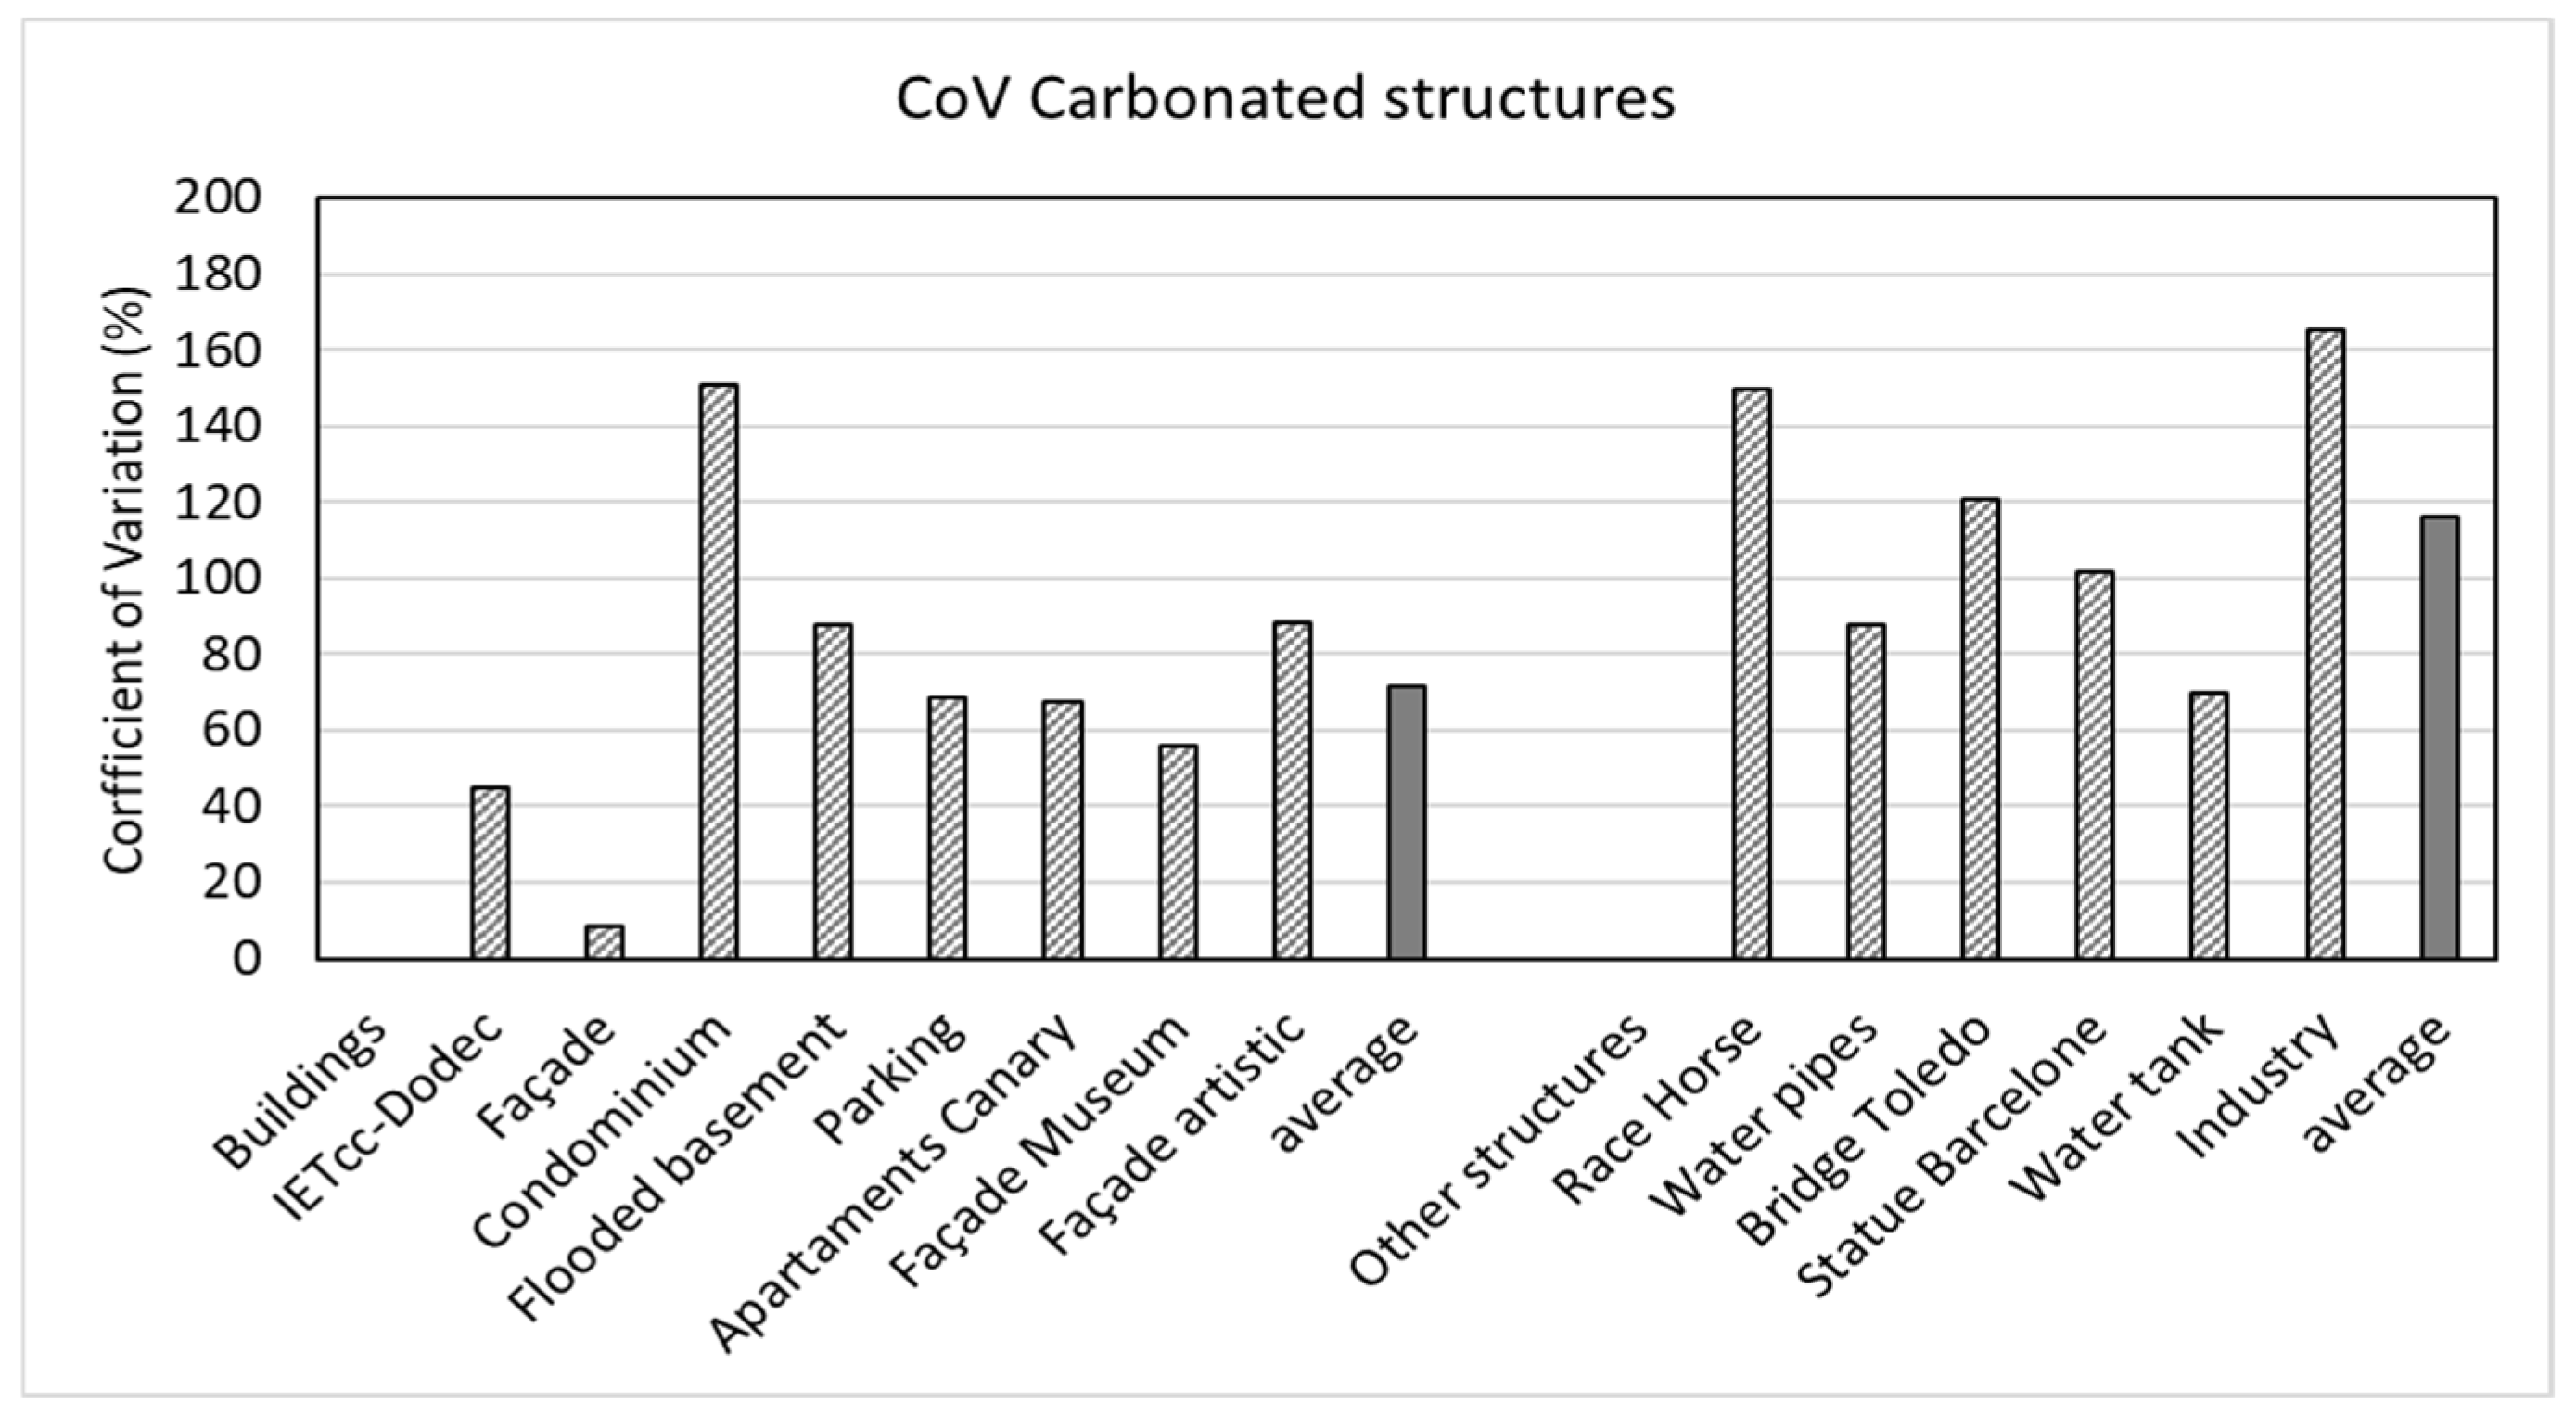
3.2.2. Results from Real Structures of Corrosion Rates

The results given here correspond not to a single structure, but to different ones for the illustration of the ranges of corrosion that can be found in real cases, in spite of having apparently similar exposure aggressivity. The reasons are the different concrete qualities and cover depths in each structure and element. In Figure 3 are the average corrosion rate values measured in structures contaminated by chlorides (either due to deicing salts, bridges, or by marine environments), and in Figure 4, their coefficient of variation (CoV) in each structure (for appraising the spatial variation at the structure level) is shown. Figure 5 shows the corrosion rate values measured in carbonated structures and Figure 6 shows their CoV.
In the figures, it can be appreciated that the values of corrosion rates above 1 µA/cm2 are not frequent, as the most frequent values are between 0.1 and 1 µA/cm2. Regarding the CoV, values above 100% indicate the existence of both, passive and corrosive zones in the structure, while values smaller than 100% are calculated for areas where all the zones are actively corroding. That is, the CoV indicates a spatial variation of the corrosion rate but depends on the zones selected for the measurements.

4. Discussion

4.1. Chloride Threshold

4.1.1. Statistical Characterization

From the values in [15], a first statistical analysis was made whose generic representation is given in Figure 2. This generic representation is made for further comparison in the Discussion with other distributions found by other authors. In Figure 7, two generic distributions are shown, because in [15], two main populations of data were identified: one for values of potential more anodic than −200 mVSCE and the other more cathodic values. Above (more anodic) or below (more cathodic) this potential, the distribution changes its average value. The joint consideration of both distributions explains the large dispersion of values that have been found in practice, likely due to the potentials have been different.
In the case of more anodic potentials, it is interesting to identify that the value the 0.4% with respect to cement weight, prescribed as limit in current codes, corresponds to a corrosion probability of around 7%.

4.1.2. Results from Real Structures of Chloride Threshold

These statistical distributions were compared in Table 1 with that of fib Bulletin no.34 [10] previously mentioned and with the distributions of [5,15], and in Figure 8 with some more recent ones obtained also in real structures [21]. The figure shows a quite good coincidence between the observations in a real structure in Norway [5] and the laboratory tests for the case of potentials more anodic than −200 mVSCE. Other results in Switzerland [21] are closer to the distribution for potential values more cathodic than −200 mVSCE. The agreement between the distributions in the range of potentials more anodic than −200 mVSCE enabled the conclusion that these distributions can be considered the most conservative but universal, representing the cases of structures in contact to the atmosphere with anodic potential values.
A further deduction from Figure 8 is that the values of chloride threshold shown for potential values more cathodic than −200 mVSCE show a dramatic increase in the chloride threshold the more negative the potential is; indeed, in accordance with the functioning of cathodic protection. If so, it can be deduced that this distribution may better represent the wet or submerged conditions with limited access of oxygen. The fact that with more cathodic potentials, the much higher the threshold (being the highest chloride thresholds around 3–3.5% by cement weight), can also justify the high values reported by several other authors. In summary, the chloride threshold may vary from structure to structure and the chloride threshold may be higher than those specified in Codes and Standards.

4.2. Chloride Threshold Values for Design of New Structures and Assessment of Existing Ones

If several distributions are feasible, which chloride threshold value to consider for practical application? The first, it is realizing that for normal design, statistical distributions are not used, because the Codes and standards are deterministic, and they limit the maximum amount of chloride in the mix raw materials of concrete. The Codes do not consider calculation of service life through modelling. The most general value used until now has been of 0.4% by weight of cement as total chloride content. This limit is not given considering service life calculations, although is taken as such for those making such calculations.
For deterministic calculation of service life (50% probability of corrosion) a mean value could be appropriate and then 0.6 to 0.7% by cement weight is a possibility. Only if the service life is probabilistically calculated, the statistical distribution of chloride threshold is needed. These possibilities are still not incorporated into Codes and then the designer is free to select which value or distribution could be most appropriate from data in those shown in Figure 8.
The selection should be made by first attending to:
-
The “consequences of corrosion (failure);
-
The importance of the structure;
-
Whether or not the structural element or zone is accessible for inspection;
-
The exposure class;
-
Whether previous testing is feasible or similar concrete has been already characterized.
The most conservative decision (see Table 1) is to consider a distribution log-normal with an averaged value of 0.6–0.7% by weight of cement, while if the structure is submerged the value of 1.5% may be reasonable.
With respect to existing structures, the concrete can be chiseled and the concentration of chlorides at the rebar level can be measured identifying zones not corroding and slightly corroding in order to pick the threshold value in the particular concrete and exposure condition. In summary, in existing structures the distribution and average value is accessible through testing.

4.3. Ccorrosion Rate

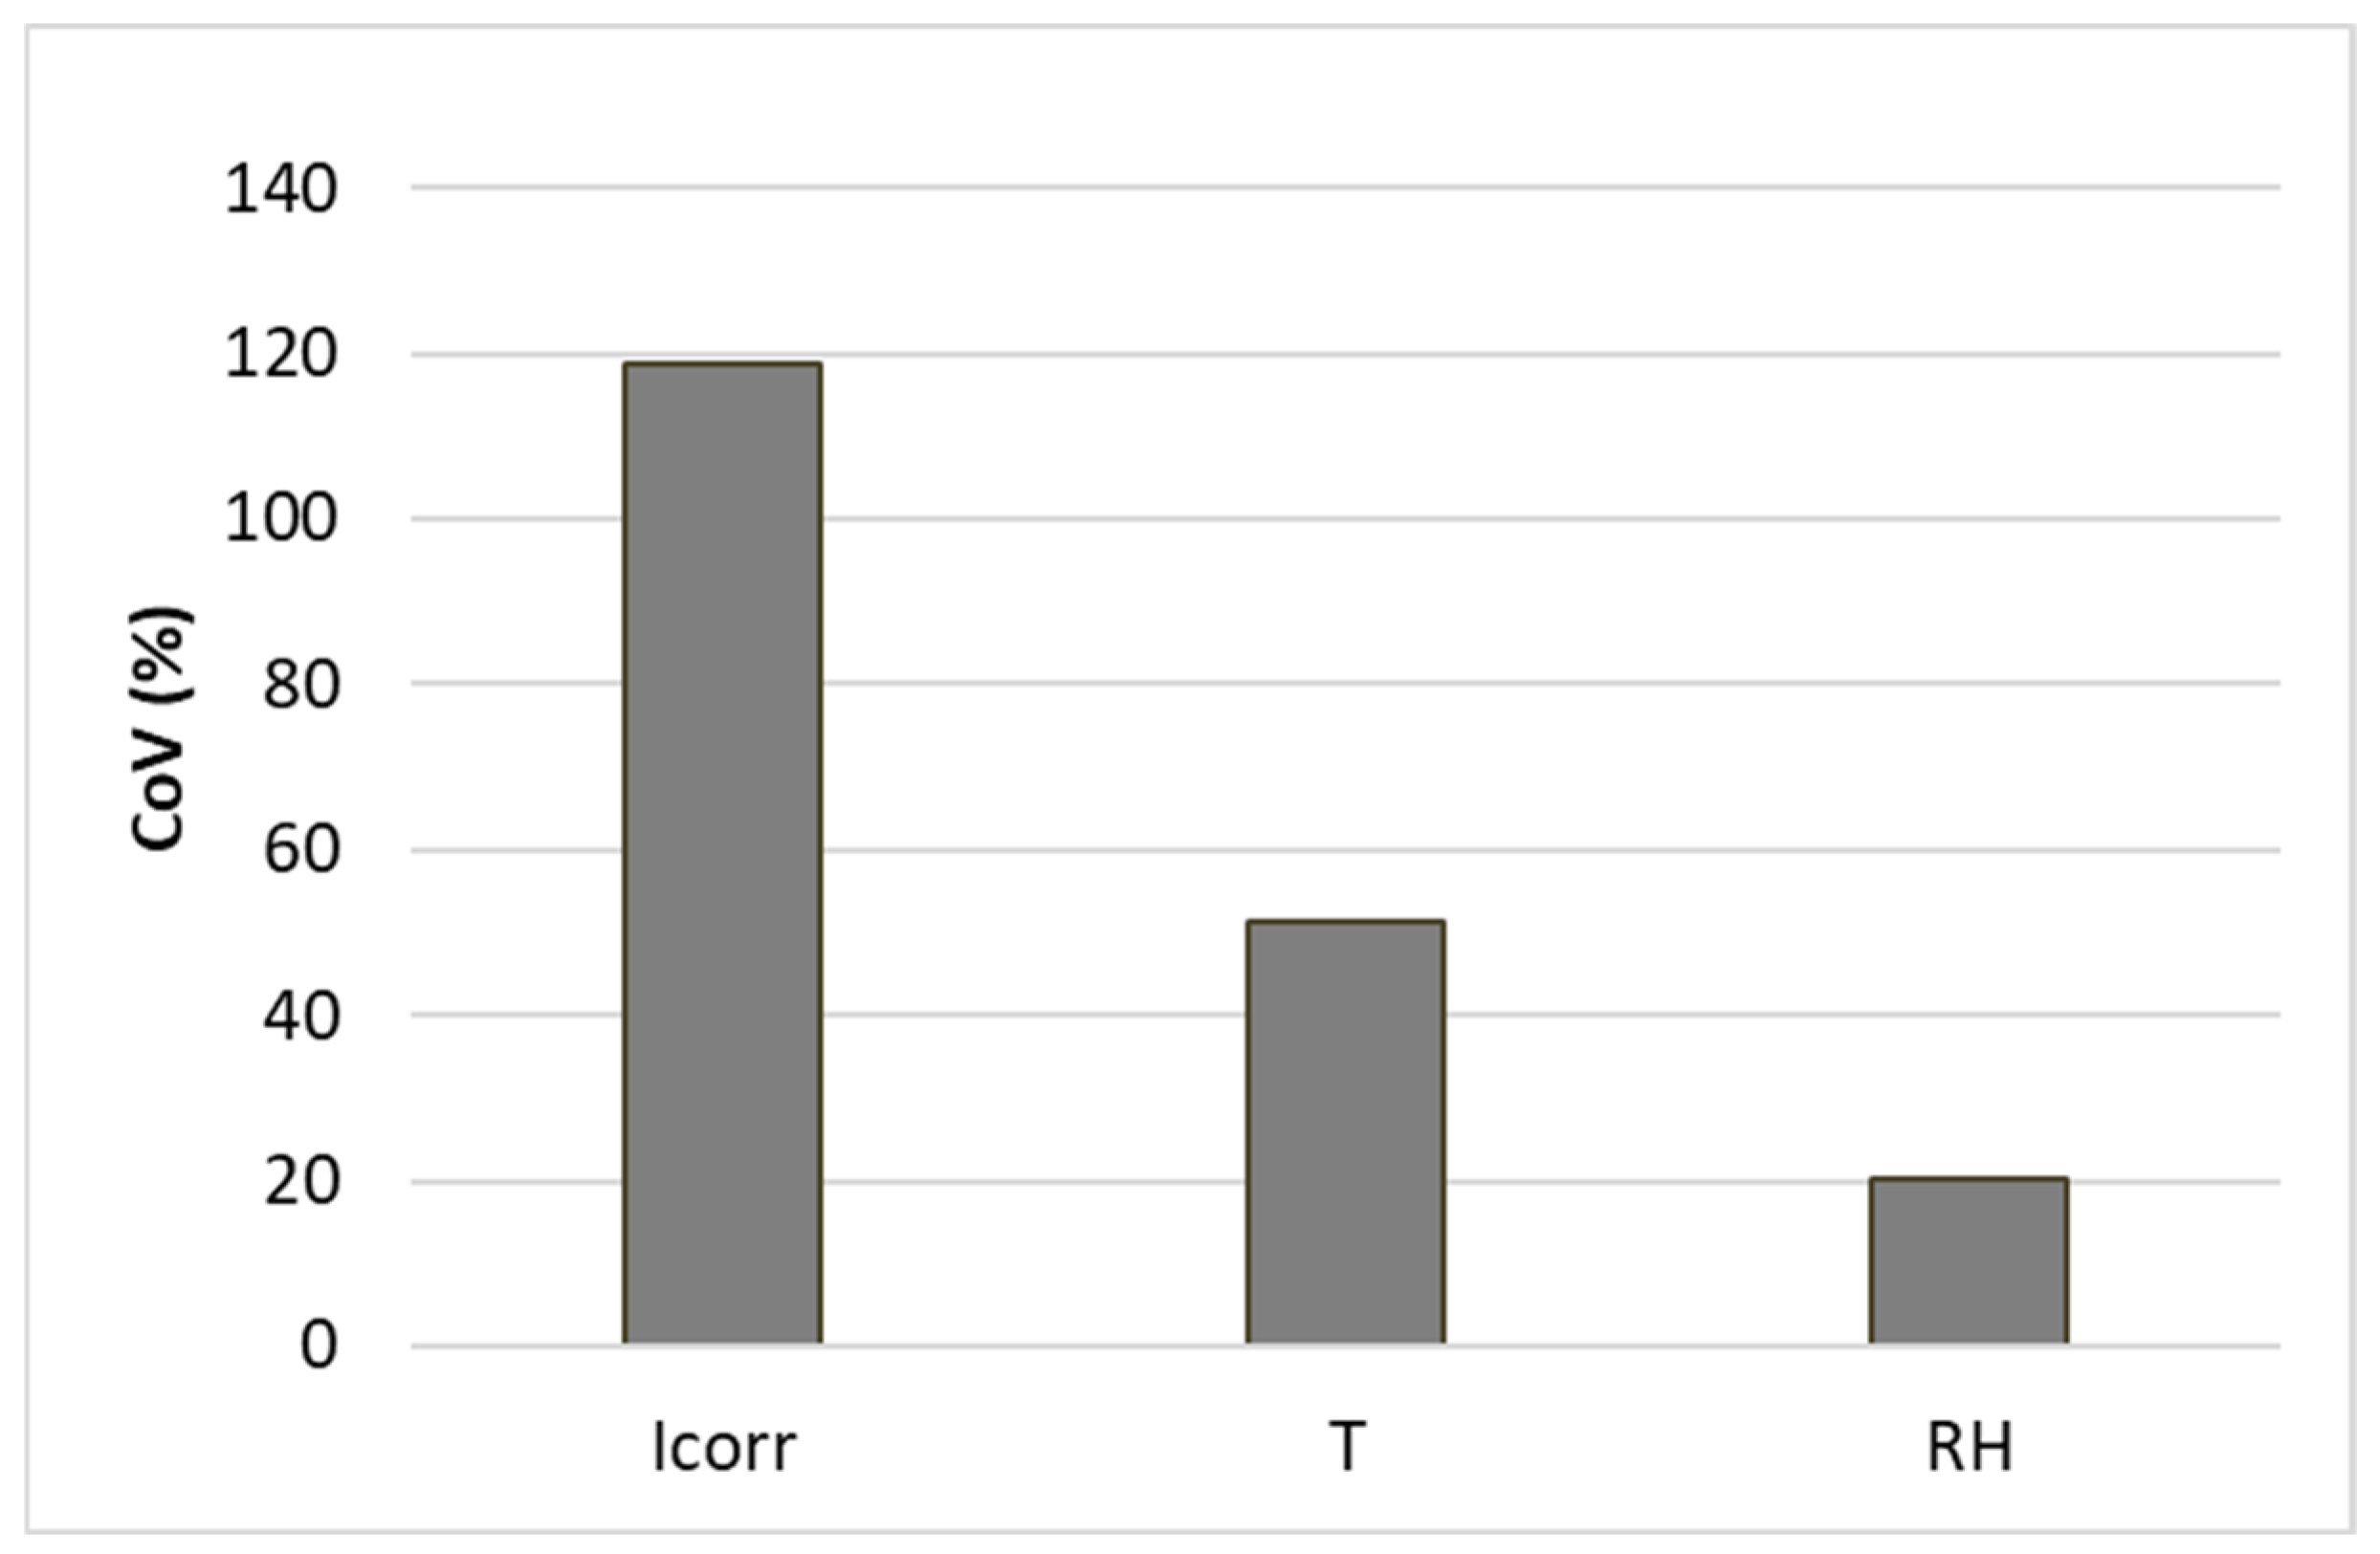
4.3.1. Uncertainty of Corrosion Rate Due to Climatic Seasons

In real structures, a “temporal”variation of the corrosion rate due to the climatic conditions evolution was found [23]. Thus, in the same structure, the corrosion parameters (potential, resistivity and corrosion rate) evolve following the temperature/humidity variations along the year. To derive the relation of the instantaneous corrosion rate with the climatic events is not straight forward, as with the same Relative Humidity (RH) and temperature (T), very different corrosion rates can be obtained depending on the previous history of climatic events or the exposition to the rain [23]. A general law relating instantaneous corrosion rate and RH and T still has not been formulated. In the present case, a new approach is explored on the possibility of characterization the variations in function of the environmental changes. Thus, taking the period of 4 years shown in Figure 2, Figure 9 shows the CoV of these variables during this period. The variation of the corrosion rate is the larger one due to it changes with logarithmic shifts. It can be derived from a simple relation that in the present results gives:
CoV I corr = 2 · CoV RH   or = 5 · CoV Temperature
These relations are only examples of the type of data that are needed in order to be able to predict the behavior from a particular climate.

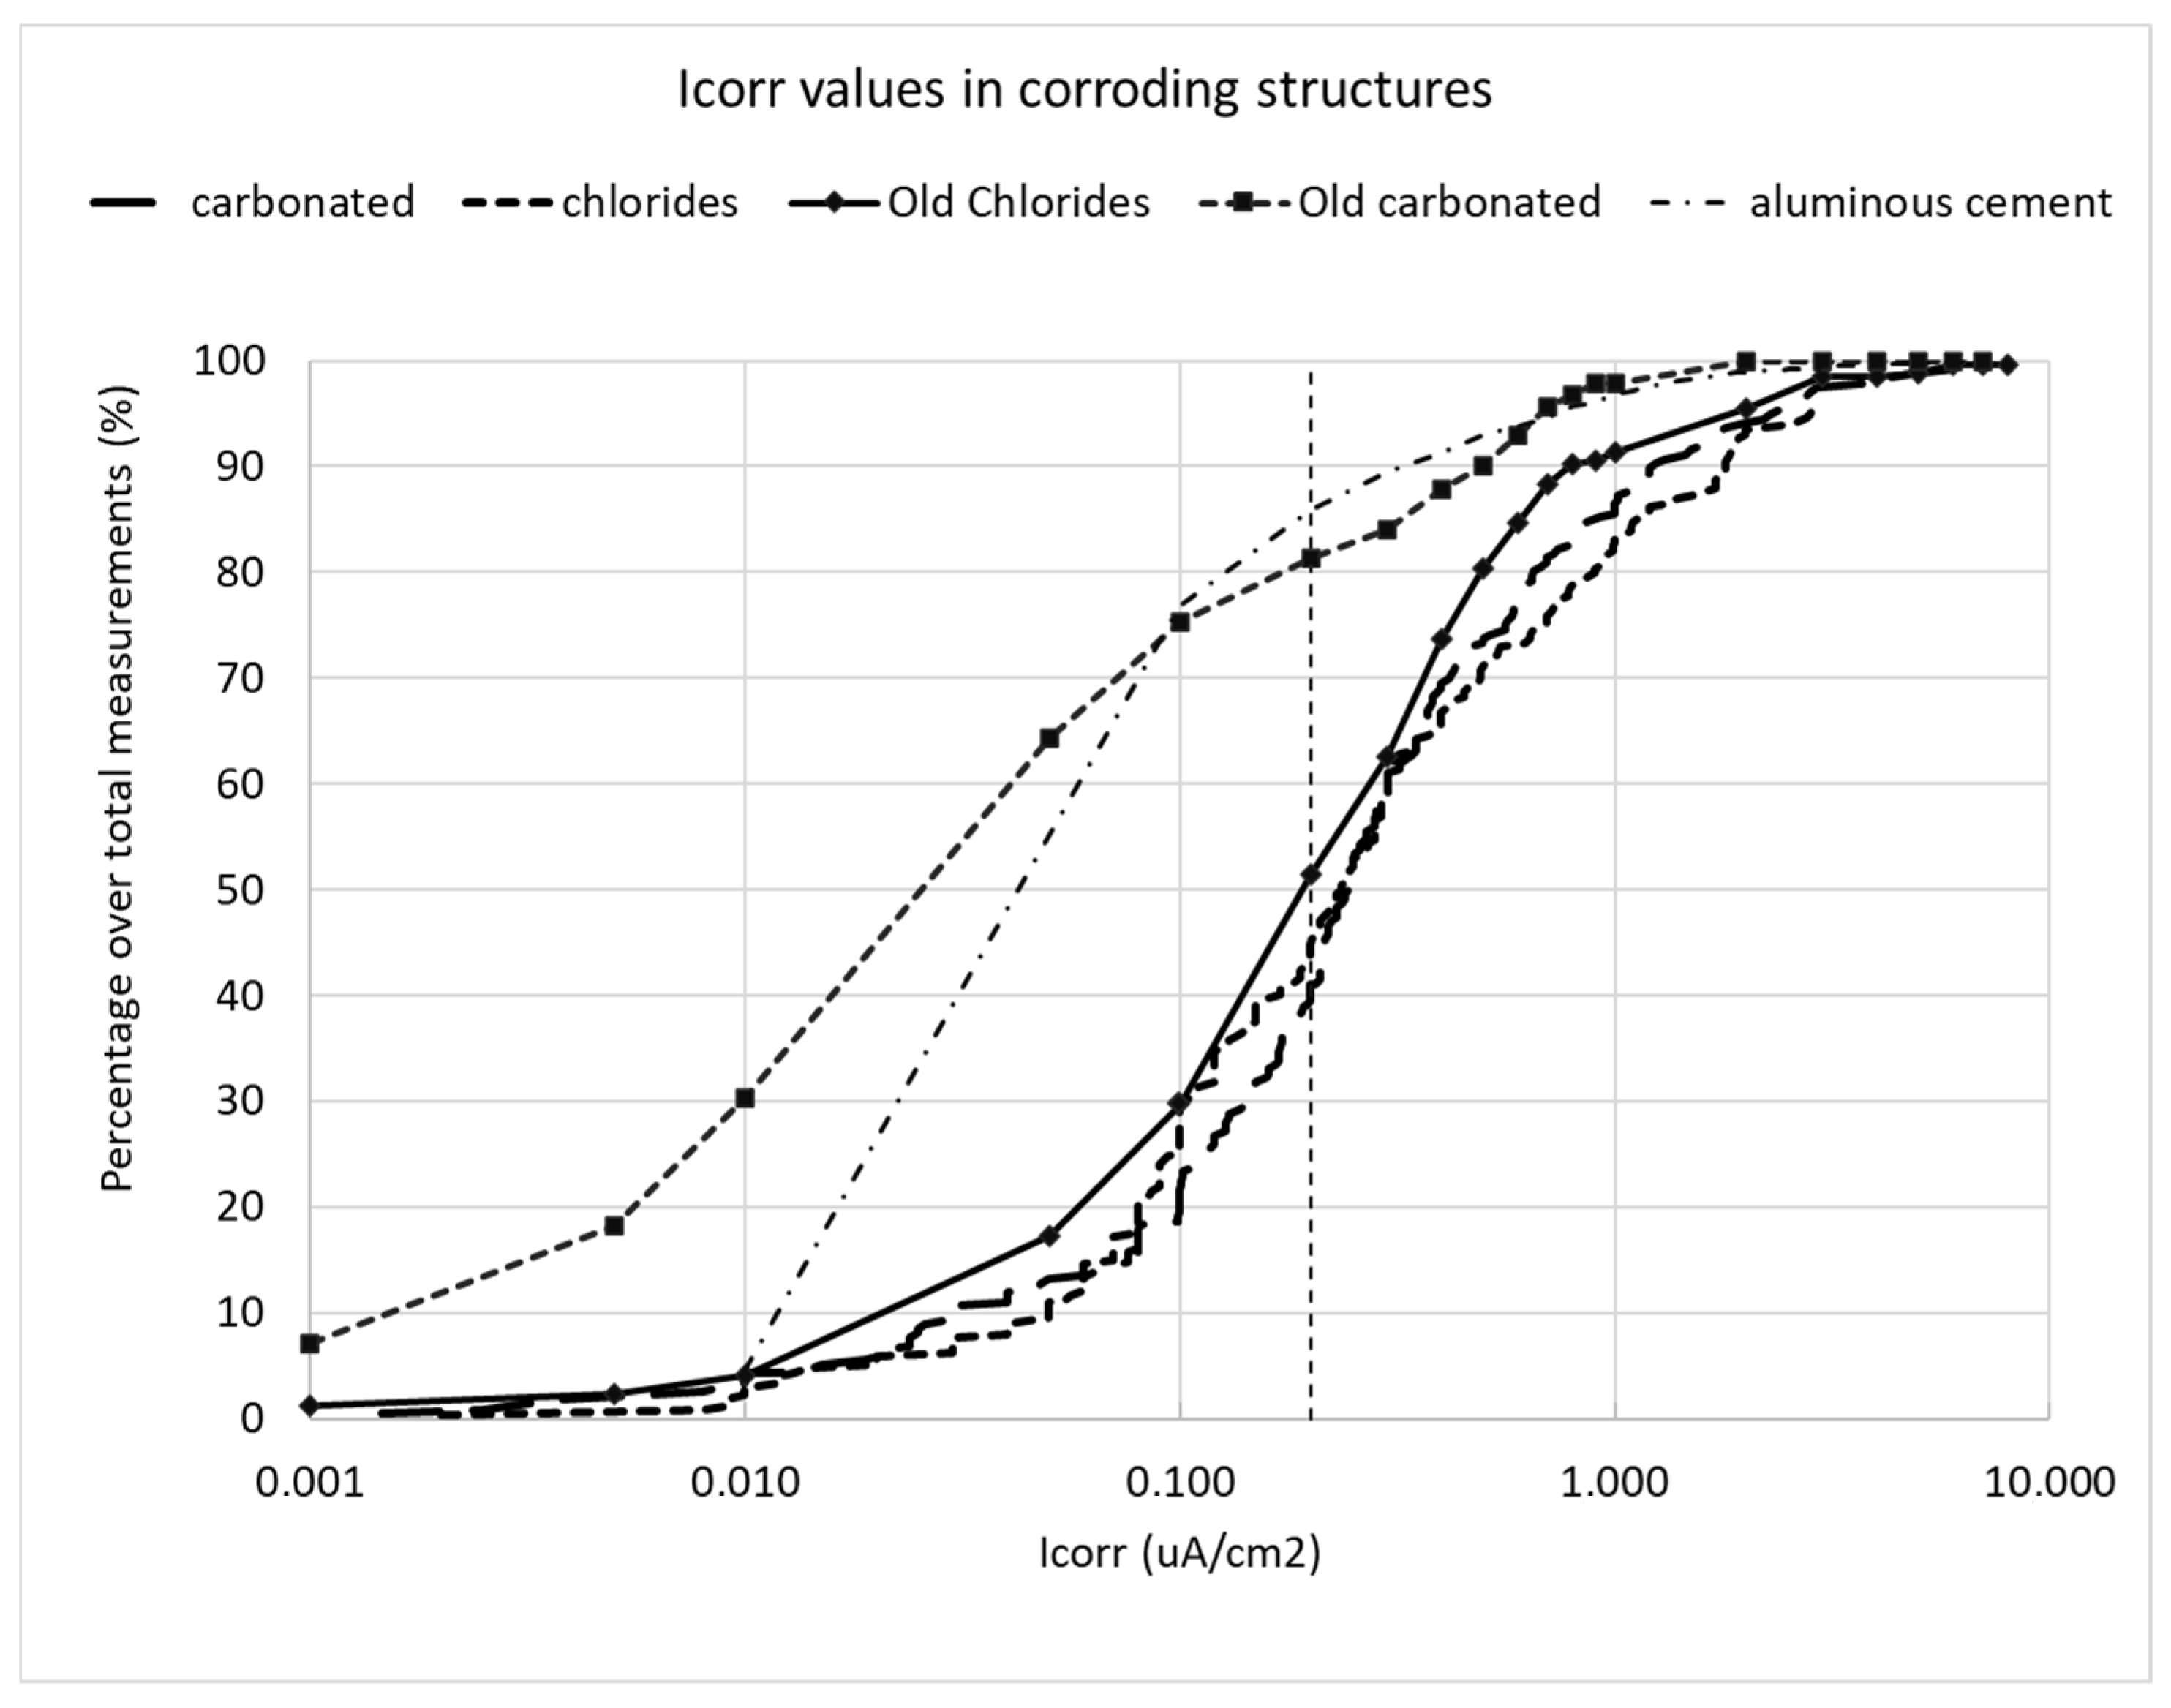
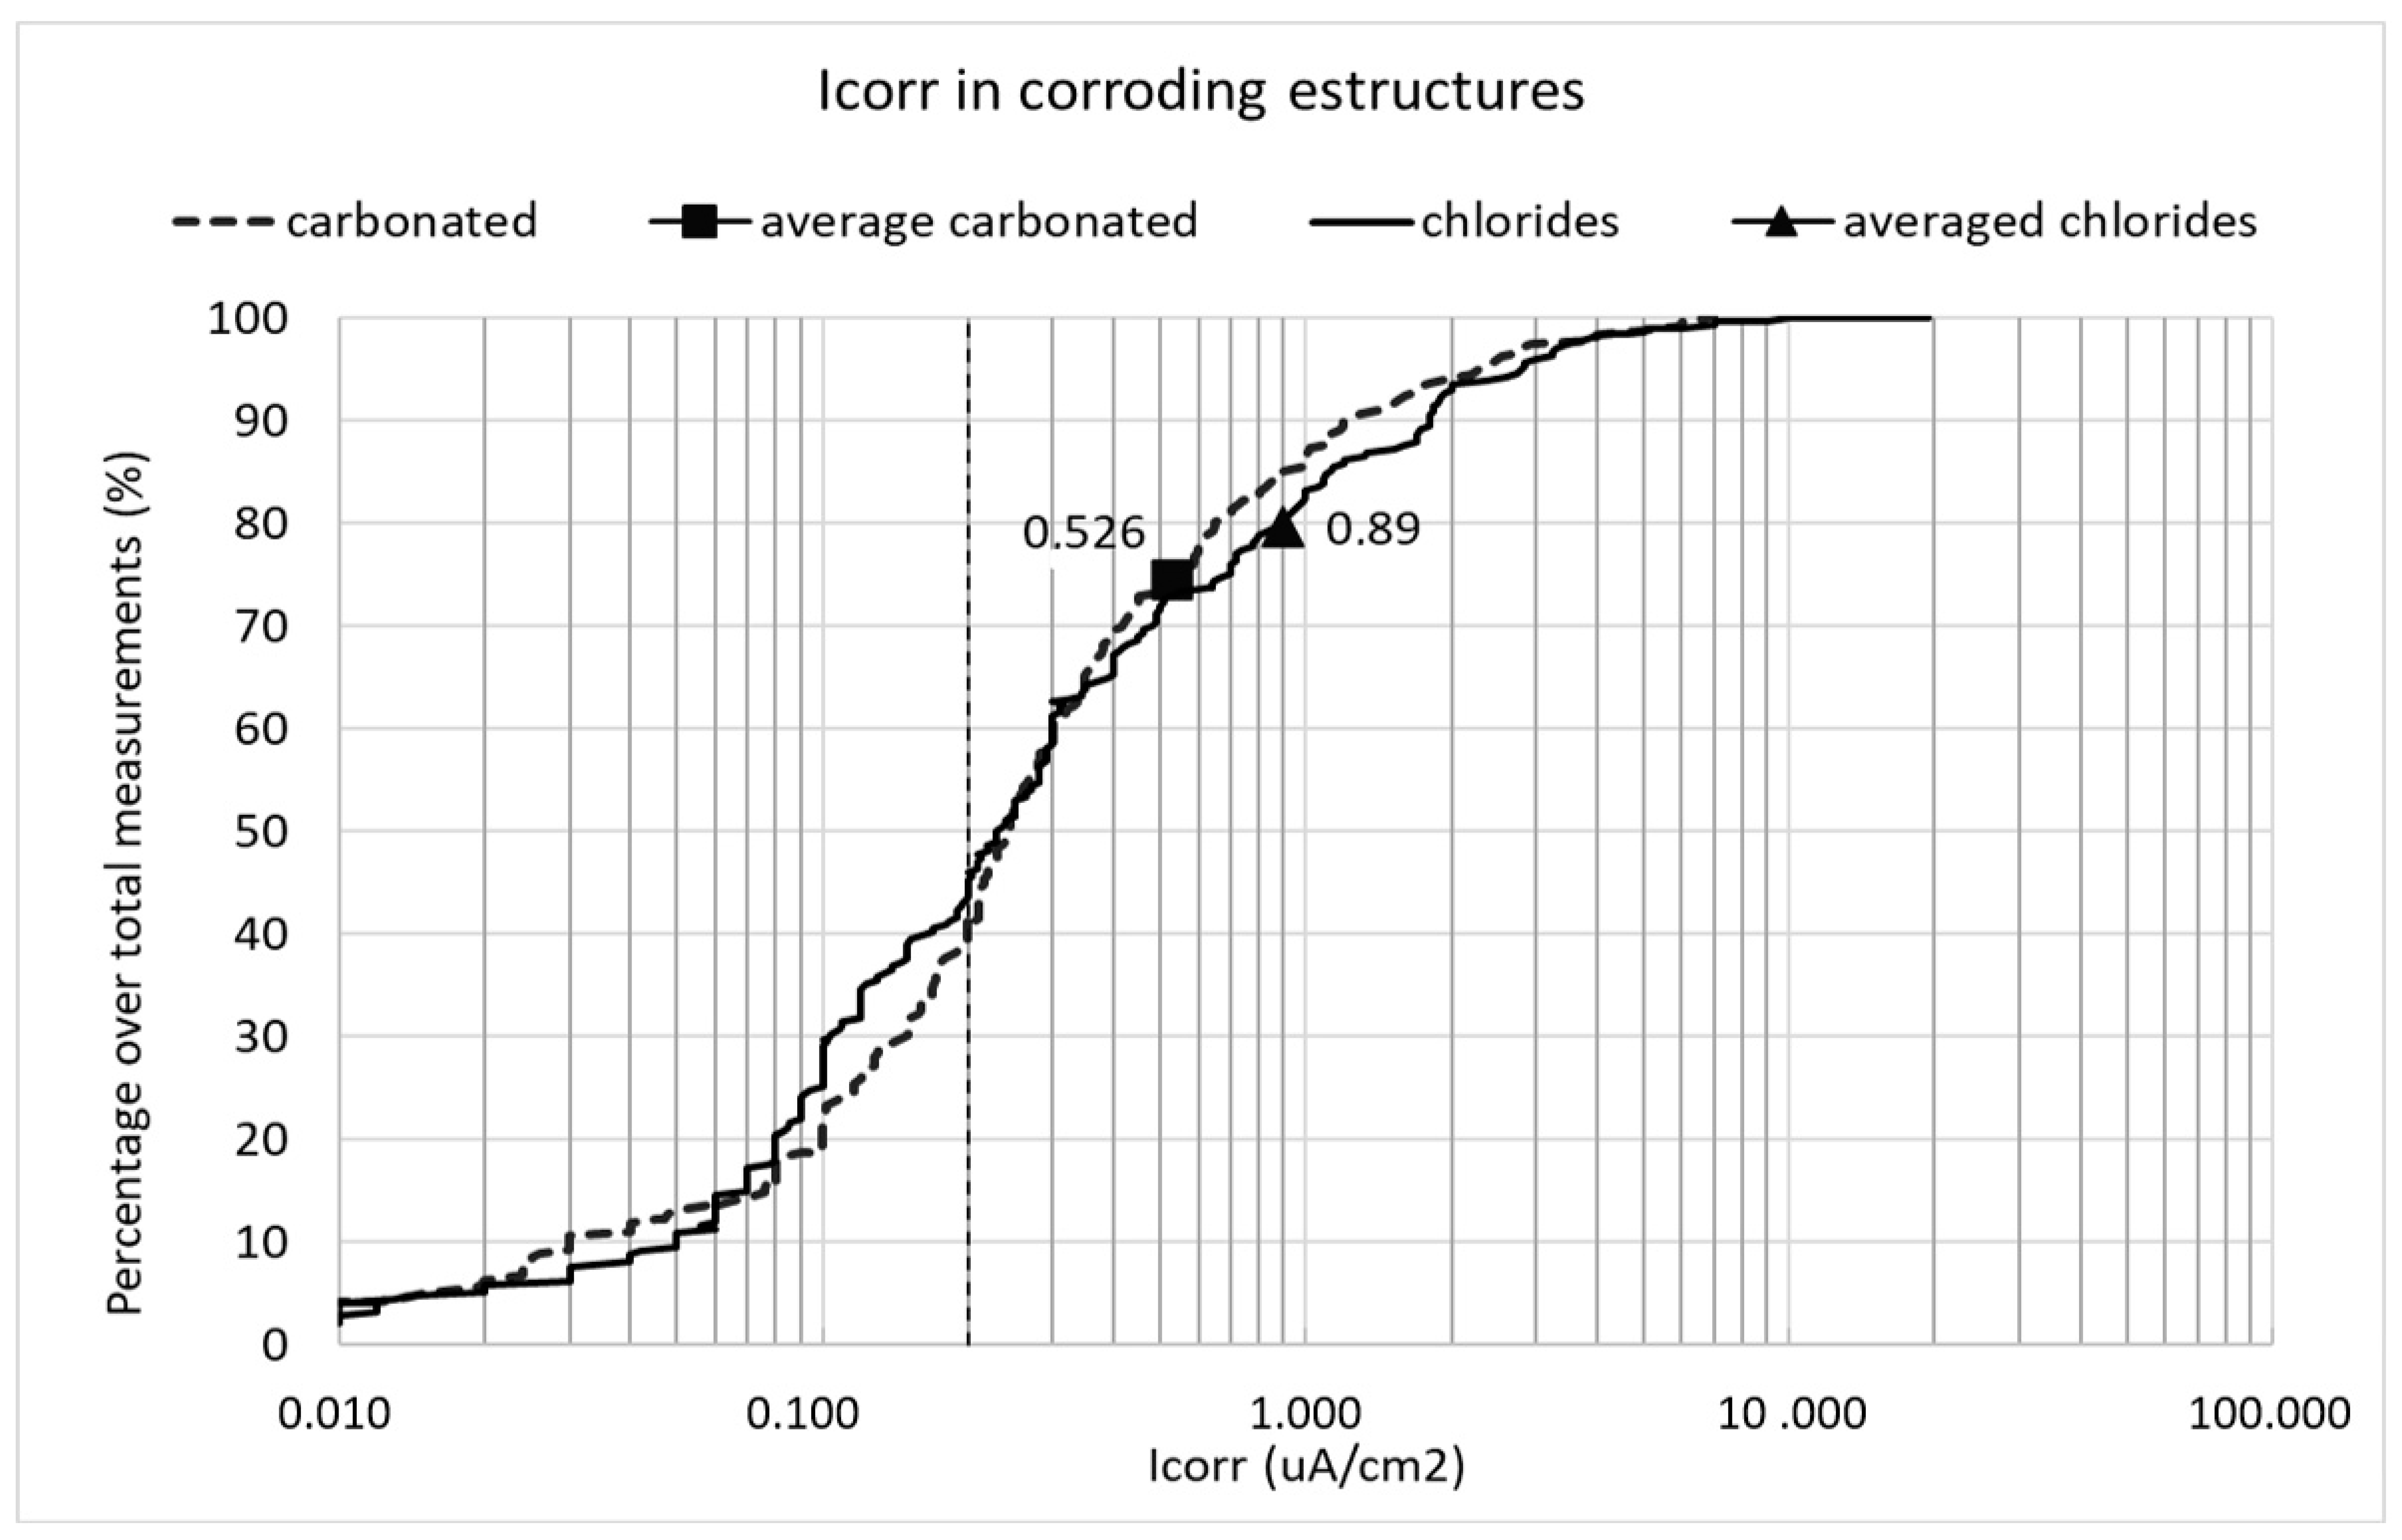
4.3.2. Statistical Distributions of Corrosion Rates in Real Structures

In existing structures, the corrosion can be homogeneous, if the attack is by carbonation, it can be localized when chlorides are the reason of the active corrosion. In all cases, the attack starts in the bar surface closer to the external concrete surface. In addition to this fact, which is responsible of a non symmetric distribution of the corrosion along the bar perimeter, in real situations, the corrosion is also not “spatially” homogeneous, due to the humidity and the aggressive substances which arrive to the bar surface differently in the several structural elements, depending on the particular environmental conditions and contamination. This spatial variability has not yet been fully quantified, although certain values of the CoV are given here in Figure 4 and Figure 6. All the data of corrosion rates obtained from real structures (Figure 3 and Figure 5) were ordered from the smallest to the highest value and their probability fraction is represented (Figure 10). The carbonated chloride contaminated structures have been represented separately. The cases given in Figure 10 have to be interpreted taking into account that:
-
All the cases correspond to structures where corrosion has been already detected and then they are representative, not of the whole population of structures, but of those with signs of corrosion;
-
The selection of measurement zones was made by choosing only one zone where corrosion is likely not yet produced, and several zones where the corrosion was evident. Then, the number of places measured with no corrosion are smaller than those corroding, although some apparently corroding have shown values below the limit of 0.1–0.2 μA/cm2.
The representation makes it possible to deduce that the structures measured from either carbonated or chloride contaminated, give almost exactly the same statistical distribution and they are coincident with the structures contaminated with chlorides measured by Geocisa decades ago, in spite of the very different set of structures inspected. However, the carbonated structures measured by Geocisa (either with aluminous cement or not) give a different distribution that indicates that these structures had a larger number of zones measured which exhibited lower corrosion rates.

4.3.3. Statistical Distribution of Corrosion Rates Valid for Design and Assessment

The data of Figure 10 refer to already corroding structures. As mentioned, the distributions do not represent the whole asset of structures, but the probability and values of corrosion rate in the cases where corrosion was detected. Then, in a particular structure, this distribution can be applied if data on corrosion rates are not measured or the data measured are scarce.
In absence of better values or when the measurements are very few, in Figure 11 are represented only the most recent set of data resulting in a log-normal distribution whose characteristics are given in Table 2. The average value and the CoV are larger in the case of structures contaminated by chlorides. The coefficient of variation is larger because in the same structure, there are non corroding zones and other with high corrosion rates. The probability of finding values of corrosion rates above 10 μA/cm2 is lower than the 0.35% and values above 5 μA/cm2 smaller than the 1.5%.
In the figure, the limit of 0.2 μA/cm2 is underlined in vertical with a dashed line, which could be taken as the frontier between active and negligeable corrosion. This values for this limit indicate that around 45% of the measurements made in a corroding structure would show negligeable corrosion.

5. Conclusions

A general conclusion is that, either in the case of chloride threshold values or the corrosion rate, tests in the laboratory may well represent the site conditions. The values are the same with the same ranges with respect to the concrete condition.
Chloride threshold:
  • Several statistical distributions of chloride threshold have been compared, deducing that each structure may present a different one, but all within the range of chloride concentration until around 3–3.5% by cement weight;
  • As the data found on site by [5] with a distribution of an averaged value of 0.77% of total chlorides by weight of cement were very similar to those of [15] in the laboratory with an averaged value of 0.7%, such distribution can be considered as universally representing the most conservative probability of corrosion in structures exposed to the atmosphere. The total range in these more conservative distributions was from 0.1–0.2% by weight of cement to around 1.5%;
  • Another distribution with a higher averaged value was also found by [15] for potentials more cathodic than −200 mVSCE, which could represent wet/submerged structures, and that gives as corrosion threshold an averaged value of 1.53% by weight of cement. The range of possible threshold values is higher until around 3%;
  • For practical engineering use, the codes are deterministic and the values given as chloride threshold are in the safer limit of the distribution indicated for the maximum chloride amount in the concrete mix components. For probabilistic calculations related to service life prediction, the selection of a threshold value should be made attending at: (a) the “consequences of corrosion (failure), (b) the importance of the structure, (c) whether the structural element or zone is accessible or not for inspection, (d) the exposure class and (e) whether previous testing is feasible or similar concrete has been already characterized.
Corrosion rate
  • The data were collected in corroding structures and then represented the probability of corrosion rate values, assuming that the measurements made in the non corroding zones are fewer than the number of measurements in the corroding zones;
  • An average value of 0.526 μA/cm2 was found for the carbonated structures and of 0.89 μA/cm2 for those containing chlorides;
  • The variation found depends not only on the spatial variation, but also of the temporal evolution produced by the climatic seasons;
  • The spatial variation is very much dependent on the contamination and humidity distribution in each element and in the whole structure. In its interpretation, the number of data measured in the corroding and non corroding zones must be taken into account;
  • The temporal variation is influenced by the regime of raining and temperature due to the climatic conditions.

Author Contributions

Conceptualization, C.A.; methodology, validation, both authors; writing—original draft preparation, C.A. All authors have read and agreed to the published version of the manuscript.

Funding

This research has no external fundings, but the original data collection by the authors was funded by Geocisa-Spain, the Institute of Construction Sciences-CSIC-Spain and by the Ministry of Science and Innovation of Spain.

Data Availability Statement

They come from different sources. They are not publicly available as some of them correspond to confidential cases.

Acknowledgments

The authors are grateful to the company Geocisa for having made available their data base on corrosion rate values. They are also grateful to the Institute of Construction Sciences (IETcc) of the CSIC-Spain for the facilities to perform the surveys in the existing structures.

Conflicts of Interest

The authors declare no conflict of interest. The funders had no role in the writing of the manuscript, or in the decision to publish the results.

References

  1. Kropp, J. Relations between transport characteristics and Durability. Chapter 5. RILEM Report no.5. In Performance Criteria for Concrete Durability; Kropp, J., Hilsdorf, H.K., Eds.; E&FN SPON: London, UK, 1995. [Google Scholar]
  2. Xia, Y.; Chen, B.; Zhou, X.; Xu, Y. Field monitoring and numerical analysis of Tsing Ma Suspension Bridge temperature behavior. Struct. Control Heath Monit. 2013, 20, 560–575. [Google Scholar] [CrossRef]
  3. Tuutti, K. Corrosion of Steel in Concrete; Swedish Cement and Concrete Institute (CBI) n° 4-82: Stockholm, Sweden, 1982. [Google Scholar]
  4. Andrade, C.; Castillo, A. Evolution of reinforcement corrosion due to climatic variations. Mater. Corros. 2003, 54, 379–386. [Google Scholar] [CrossRef]
  5. Markeset, G. Critical chloride content and its influence on service life predictions. Mater. Corros. 2009, 60, 8593–8596. [Google Scholar] [CrossRef]
  6. Fluge, F. Marine chlorides—A probabilistic approach to derive provisions for EN 206-1. In Proceedings of the 3rd DuraNet Workshop, Tromsø, Norway, 10–12 June 2001. [Google Scholar]
  7. Helland, S.; Aarstein, R.; Maage, M. In-field performance of North Sea offshore platforms with regard to chloride resistance. Struct. Concr. 2010, 11, 15–24. [Google Scholar] [CrossRef]
  8. Angst, U.; Wagner, M.; Elsener, B.; Leemann, A.; Nygaard, P.V. Method to Determine the Critical Chloride Content of Existing Reinforced Concrete Structures; Swiss Federal Roads Office: Berne, Switzerland, 2016.
  9. Angst, U.; Elsener, B. The size effect in corrosion greatly influences the predicted life span of concrete infrastructures. Sci. Adv. 2017, 3. [Google Scholar] [CrossRef] [PubMed] [Green Version]
  10. fib Bulletin no. 34 Model Code for Service Life Design. 2006. Available online: https://www.fib-international.org/publications/fib-bulletins/model-code-for-service-life-design-pdf-detail.html (accessed on 6 October 2022).
  11. fib Model Code for Concrete Structures 2010; Fédération Internationale du Béton: Lausanne, Switzerland, 2013.
  12. Hausmann, D.A. A probability model for steel corrosion in concrete. Mater. Perform. 1996, 37, 64–68. [Google Scholar]
  13. Everett, L.H.; Treadaway, K.W.J. Deterioration due to Corrosion inReinforced Concrete. IP12/80 Monograph-Building Research Establishment-Garston-Watford, WD2 7JR. 1980, pp. 4–8. Available online: https://trid.trb.org/view/165106 (accessed on 6 October 2022).
  14. Alonso, C.; Andrade, C.; Castellote, M.; Castro, P. Chloride threshold values to depassivate reinforcing bars embedded in a standardized OPC mortar. Cem. Concr. Res. 2000, 30, 1047–1055. [Google Scholar] [CrossRef]
  15. Izquierdo, D.; Alonso, C.; Andrade, C.; Castellote, M. Potentiostatic determination of chloride threshold values for rebar depassivation. Exp. Stat. Study-Electrochim. Acta 2004, 49, 2731–2739. [Google Scholar] [CrossRef]
  16. Pourbaix, M. Significance of protection potential in pitting and intergranular corrosion. Corrosion 1970, 26, 431–438. [Google Scholar] [CrossRef]
  17. Breit, W. Kritischer korrosionsauslösender Chloridgehalt—Neuere Untersuchungsergebnisse (Teil 2). Beton 1998, 8, 511. [Google Scholar]
  18. DuraCrete Project Final Technical Report Brite EuRam Project BE95-1347, Probabilistic Performance Based Durability Design of Concrete Structures. Report TG4/B Statistical Quantification, Onset of Corrosion. 2000. Available online: https://cordis.europa.eu/project/id/BRPR950132 (accessed on 6 October 2022).
  19. Ghelen, C. Probability-Based Service Life Design of Reinforced Concrete Structures-Reliability Studies for Prevention of Reinforcement Corrosion (Probabilistische Lebensdauerbemessung von Stahlbetonbauwerken–Zuverlässigkeitsbetrachtungen zur Wirksamen Vermeidung von Bewehrungskorrosion. Ph.D. Thesis, RWTH Aachen, Aachen, Germany, 2000. [Google Scholar]
  20. Ferreira, R.M. Probability-Based Durability Analysis of Concrete Structures in Marine Environment. Ph.D. Thesis, University of Minho, Braga, Portugal, 2004. [Google Scholar]
  21. Angst, U. Predicting the time to corrosion initiation in reinforced concrete structures exposed to chlorides. Cem. Concr. Res. 2019, 115, 559–567. [Google Scholar] [CrossRef]
  22. Andrade, C. Modelling the concrete-real environment interaction to predict service life. Struct. Concr. 2015, 16, 159–160. [Google Scholar] [CrossRef]
  23. Castellote, M.; Andrade, C. Analysis of total chloride content. RILEM Recommendation of TC-178-Testing and modelling chloride penetration in concrete. Mater. Struct. 2002, 35, 583–585. [Google Scholar]
  24. Castellote, M.; Andrade, C. Analysis of water soluble chloride content in concrete. RILEM Recommendation of TC-178-Testing and modelling chloride penetration in concrete. Mater. Struct. 2002, 35, 586–588. [Google Scholar]
  25. Andrade, C.; González, J.A. Quantitative measurements of corrosion rate of reinforcing steels embedded in concrete using polarization resistance measurements. Werkst. Und Korros. 1978, 29, 515. [Google Scholar] [CrossRef]
  26. Feliú, S.; González, J.A.; Feliú, S., Jr.; Andrade, C. Confinement of the electrical signal or in-situ measurement of Polarization Resistance in Reinforced concrete. ACI Mater. J. 1990, 87, 457. [Google Scholar]
  27. Rodriguez, J.; Ortega, L.M.; Garcia, A.M.; Johansson, L.; Petterson, K. On site corrosion rate measurements in concrete structures using a device developed under the EUREKA project EU-401. In Proceedings of the Conference Concrete Across Borders, Odense, Denmark, June 1995; pp. 215–226. [Google Scholar]
  28. Andrade, C.; Rebolledo, N.; Morales, J.A. Surface Inhibitors for the Non-Invasive treatment of Corroded Structures. In Proceedings of the XIV DBMC—14th International Conference on Durability of Building Materials and Components, Ghent, Belgium, 29–31 May 2017. [Google Scholar]
  29. CONTECVET. Manual for the Evaluation of Structures Affected by Reinforcement Corrosion, DG Enterprise, CEC 2001. Available online: https://www.ietcc.csic.es/wp-content/uploads/1989/02/manual_contecvet.pdf (accessed on 6 October 2022).
  30. Andrade, C.; Alonso, C.; Gulikers, J.; Polder, R.; Cigna, R.; Vennesland, Ø.; Salta, M.; Raharinaivo, A.; Elsener, B. RILEM TC 154-EMC: Electrochemical Techniques for Measuring Metallic Corrosion. Recommendations Test methods for on-site corrosion rate measurement of steel reinforcement in concrete by means of the polarization resistance method. Mater. Struct. 2004, 37, 623–643. [Google Scholar] [CrossRef]
Figure 1. Values of chloride thresholds (by weight of cement) [14,15] for different types of binders and the potentials applied. The values at each potential indicate the individual values of 10 twin specimens tested for the same potential and binder type.
Cmd 03 00032 g001
Figure 2. Evolution of the corrosion rate, the temperature and the Relative Humidity in a carbonated specimen exposed outdoors, not sheltered from rain.
Cmd 03 00032 g002
Figure 3. Average values of corrosion rate in different structures contaminated by chlorides.
Cmd 03 00032 g003
Figure 4. Average values the coefficient of variation in different structures contaminated by chlorides.
Cmd 03 00032 g004
Figure 5. Average values of corrosion rate in different carbonated structures.
Cmd 03 00032 g005
Figure 6. Average values of the coefficient of variation in different carbonated structures.
Cmd 03 00032 g006
Figure 7. Statistical distributions of the chloride threshold [15] made in laboratory conditions for two ranges of potential: more anodic than −200 mVSCE potentials typical at atmospheric conditions and more cathodic than −200 mVSCE potentials typical of submerged conditions. (SCE = saturated calomel electrode).
Cmd 03 00032 g007
Figure 8. Some statistical distributions of the chloride threshold [5,10,14,15,21] showing the variability of the distributions, that however are of them within the limits shown in Figure 7.
Cmd 03 00032 g008
Figure 9. Coefficient of variation of the parameters shown in Figure 2 during the period delimited in that figure.
Cmd 03 00032 g009
Figure 10. Statistical representation for the values of corrosion rate measured in all kinds of structures (“Old” and “aluminous cement” refer to measurements made by the company Geocisa) [27].
Cmd 03 00032 g010
Figure 11. Proposed general statistical distributions of corrosion rate values in corroding structures.
Cmd 03 00032 g011
Table 1. Statistical distributions of the chloride threshold.
Literature SourceStatistical DistributionAverage Value
% by Cement Weight
Coefficient of Variation (%)
fib Bulletin no. 34Beta0.631.00
Markeset 2009Log-normal0.7732.46
Izquierdo et al. 2004 >−200mV (atmospheric)normal0.728.57
<−200mV (submerged)Log-normal1.5334.64
Table 2. Characteristics of the statistical distribution of averaged corrosion rate values and their coefficient of variation in real structures.
Type of ContaminationProbability Averaged Corrosion RateCoefficient of Variation
carbonation75%0.526 μA/cm2177.30%
chlorides80%0.89 μA/cm2221.86%
Publisher’s Note: MDPI stays neutral with regard to jurisdictional claims in published maps and institutional affiliations.

