1. Introduction
This paper reviews recent progress in the understanding Mg corrosion, with an emphasis on “general corrosion” in chloride solutions, an improved understanding of the anodic hydrogen evolution on anodic polarization and an improved understanding of the Mg corrosion mechanism. There have been a series of reviews on Mg corrosion and oxidation [
1,
2,
3,
4,
5,
6,
7,
8,
9,
10,
11,
12]. These reviews provide the interested reader with an excellent understanding of Mg corrosion and oxidation. They are essential reading for anyone undertaking research on Mg corrosion and oxidation. There is also much important detail in the recent literature on Mg corrosion [
13,
14,
15,
16,
17,
18,
19,
20,
21,
22,
23,
24,
25,
26,
27,
28,
29,
30,
31,
32,
33,
34,
35,
36,
37,
38,
39,
40,
41,
42,
43,
44,
45,
46,
47,
48,
49,
50] and in our other recent papers [
51,
52]. There are also reviews on stress corrosion cracking (SCC) of Mg [
53,
54,
55,
56,
57,
58,
59], biocorrosion of Mg [
1,
60,
61,
62,
63,
64], oxidation and burning of Mg alloys [
65,
66,
67,
68,
69], Mg anodes in Mg batteries [
70], and much the literature on the effect of inhibitors and coatings [
71,
72,
73,
74,
75]. These references introduce these topics. However, the interested researcher needs to dig deeper for a comprehensive overview.
“General corrosion” is the main topic of this review, in the sense of Mg corroding when exposed to an electrolyte solution such as a chloride solution. Chloride solutions are popular because chlorides are ubiquitous in most service environments (e.g., close to the sea, salt used for road de-icing, sweat, synthetic body fluids used to study biocorrosion) and are typically more corrosive than other common solutions such as sulphate and acetate solutions. The corrosion of Mg alloys tends to be limited in depth because of the associated alkalinization, except for corrosion associated with second phases when the corrosion of the adjacent alpha-Mg matrix is typically accelerated by the micro-galvanic corrosion caused by the second phase acting as a more-efficient cathode for the cathodic hydrogen evolution reaction [
4,
5].
Corrosion in solution can be studied by a wide variety of techniques [
2,
3,
4,
5,
76,
77] such as weight loss and electrochemistry, so the study of such Mg corrosion continues to be popular, and of technological importance. However, a purpose of such studies has also been to understand corrosion in such service applications as in automobile service and in biodegradable medical implants. There are clearly other factors of importance in such service applications [
1,
2], although the studies of Mg corrosion in chloride solutions does provide a useful framework to understand Mg corrosion in the more complex environments, such as encountered during bio-corrosion, during auto service and during exposure to the atmosphere. The understanding of Mg corrosion in chloride solutions provides a useful foundation for the study of Mg corrosion in the more complex environments.
There is good evidence [
52] that there is typically a double layer film on the surface of Mg during corrosion in chloride solutions. A thin MgO layer (~3–10 nm thick) adjacent to the Mg metal surface provides some corrosion protection, on top of which is a thicker (~0.02 mm) porous layer of Mg(OH)
2. X-ray diffraction typically detects the Mg(OH)
2 layer, whereas the MgO layer is harder to detect [
78] and has been studied using techniques such as XPS (X-ray photon spectroscopy) and TEM (transmission electron microscopy).
This review starts with the measurement of the corrosion rate of Mg alloys. This is not a new topic, nevertheless there are important aspects that need to be repeated because they should be better understood by researchers studying Mg corrosion. It is well known that there is an extreme increase in the Mg corrosion rate for a Mg alloy containing an impurity element concentration above the tolerance limit. An overview of recent new insights is provided herein. There continues to be much effort to produce more corrosion resistant Mg alloys. These works need to compare the measured corrosion rates of their alloys with the intrinsic Mg corrosion rate. Recent work on anodic hydrogen evolution has provided strong experimental evidence contradicting the enhanced catalytic activity mechanism and in support of the uni-positive Mg
+ corrosion mechanism. Atrens et al. [
2] provided a thorough review of the evidence relevant to the understanding of the Mg corrosion mechanism, and the interested reader should consult that review. The new compelling experimental evidence supporting the uni-positive Mg
+ corrosion mechanism is herein reviewed. This new evidence relates to anodic hydrogen evolution, new experimental evidence gathered using electrochemical impedance spectroscopy (EIS) and the new insights that the uni-positive Mg
+ corrosion mechanism provides for understanding the performance of Mg-air batteries.
2. Corrosion Rate Measurement
This section briefly introduces the common methods used for the measurement of the Mg corrosion rate for Mg exposed to an electrolyte solution such as a chloride solution. The good agreement between the hydrogen evolution method and the weight loss method indicates that both methods are reliable for the measurement of substantial corrosion rates. The hydrogen evolution method indicates corrosion rates that are much too low for low Mg corrosion rates. Furthermore, the hydrogen evolution method is often not useful in the synthetic body fluids used to study the biocorrosion of Mg alloys.
2.1. Hydrogen Evolution
The overall Mg corrosion reaction is as follows.
One atom of Mg reacts with water to produce one Mg
++ ion and one hydrogen molecule. Consequently, the corrosion rate of Mg can be conveniently measured by means of measurement of the volume of hydrogen evolved per unit time as suggested by Song, Atrens and StJohn [
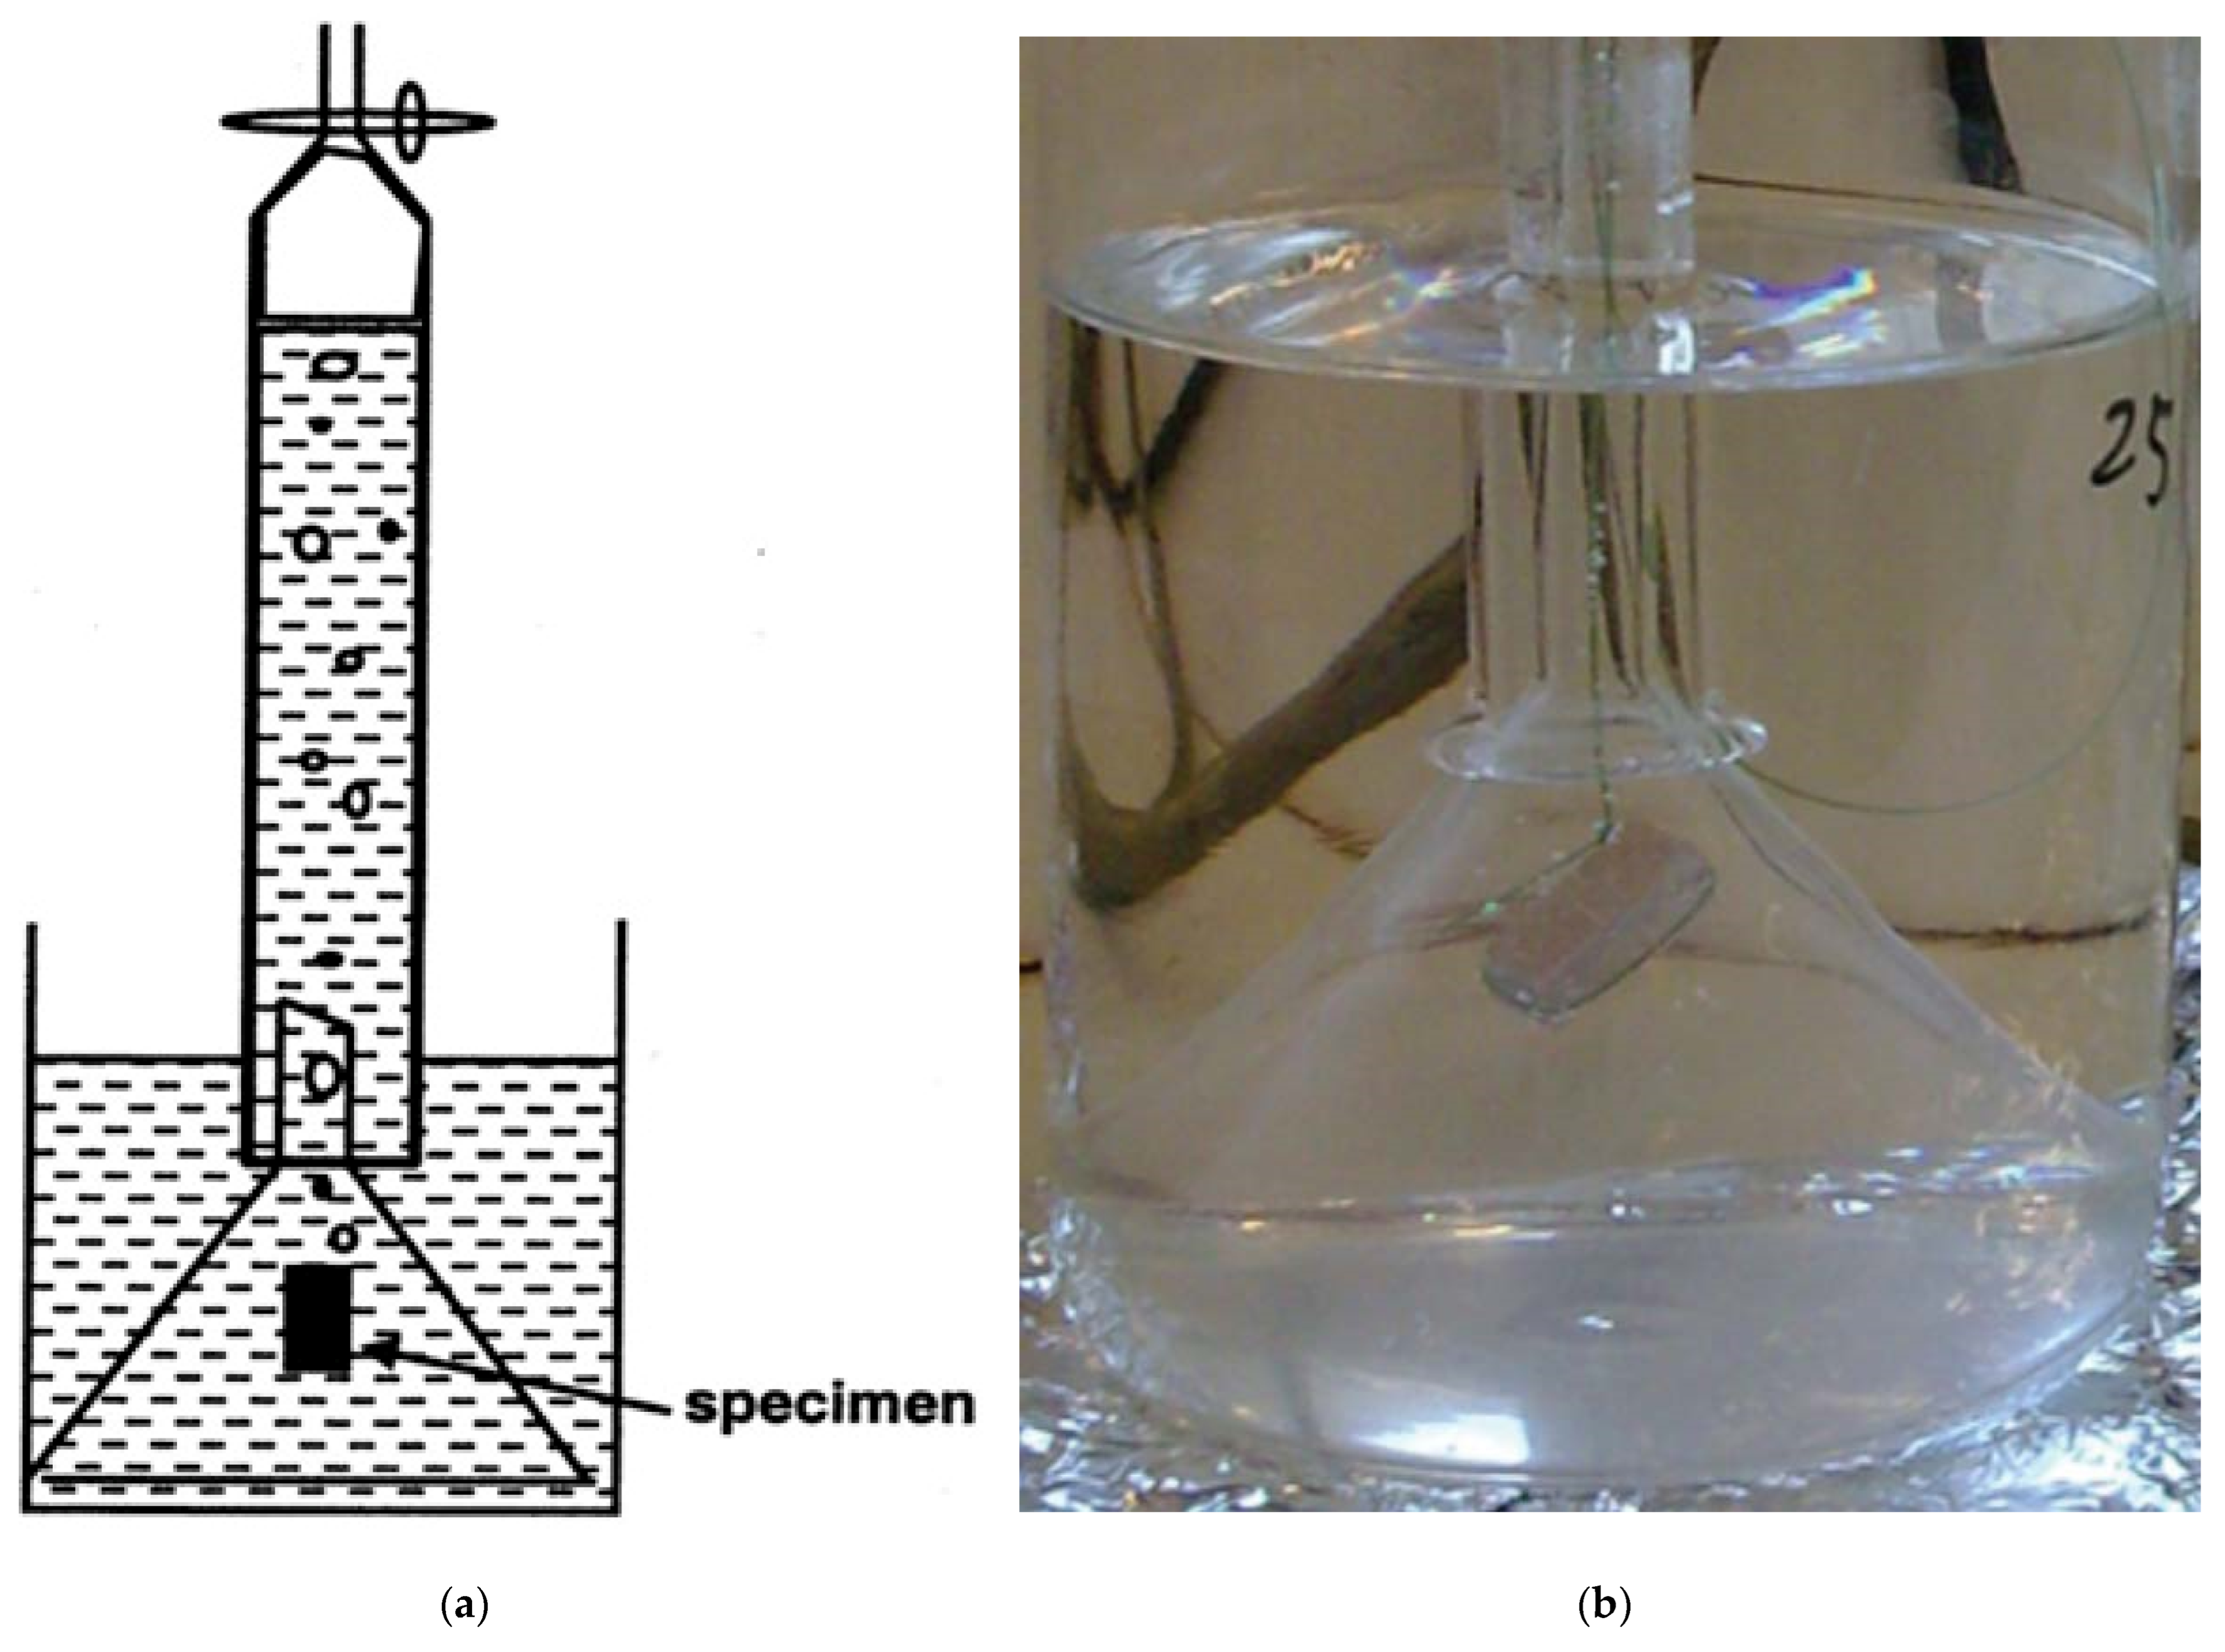
79]. A convenient method of measuring the evolved hydrogen is illustrated in
Figure 1a. The evolved hydrogen from a freely corroding Mg specimen is channeled by an inverted filter funnel into a burette, which allows the periodic recording of the evolved hydrogen volume. The volume of evolved hydrogen can also be measured as the buoyancy caused by the displaced water [
80]; nevertheless, the principle of the technique remains the same.
Figure 1b provides an illustration of the fishing line method [
76,
77], wherein the Mg specimen is supported in the solution by a fishing line, so that the specimen surface exposed to the solution is maximized, and there is minimum influence of the specimen mount or support.
Figure 1c provides a photo of a Mg specimen mounted in metallurgical epoxy, with an electrical connection to the back of the specimen to allow the specimen to be used for electrochemical measurements, such as illustrated in
Figure 1d. The front surface can be ground and polished using standard metallurgical methods to easily produce a highly reproducible surface.
Figure 1d provides an illustration of a plug-in specimen and the arrangement by which the plug-in specimen can be used for (i) weight loss measurements, (ii) measurements of the evolved hydrogen volume, and (iii) electrochemical measurements. The bared copper conductor is pressed into the undersized hole drilled into the Mg specimen to provide a reliable electrical contact. With care, the electrical conductor can be removed after exposure to the corrosive solution, allowing weight loss measurement.
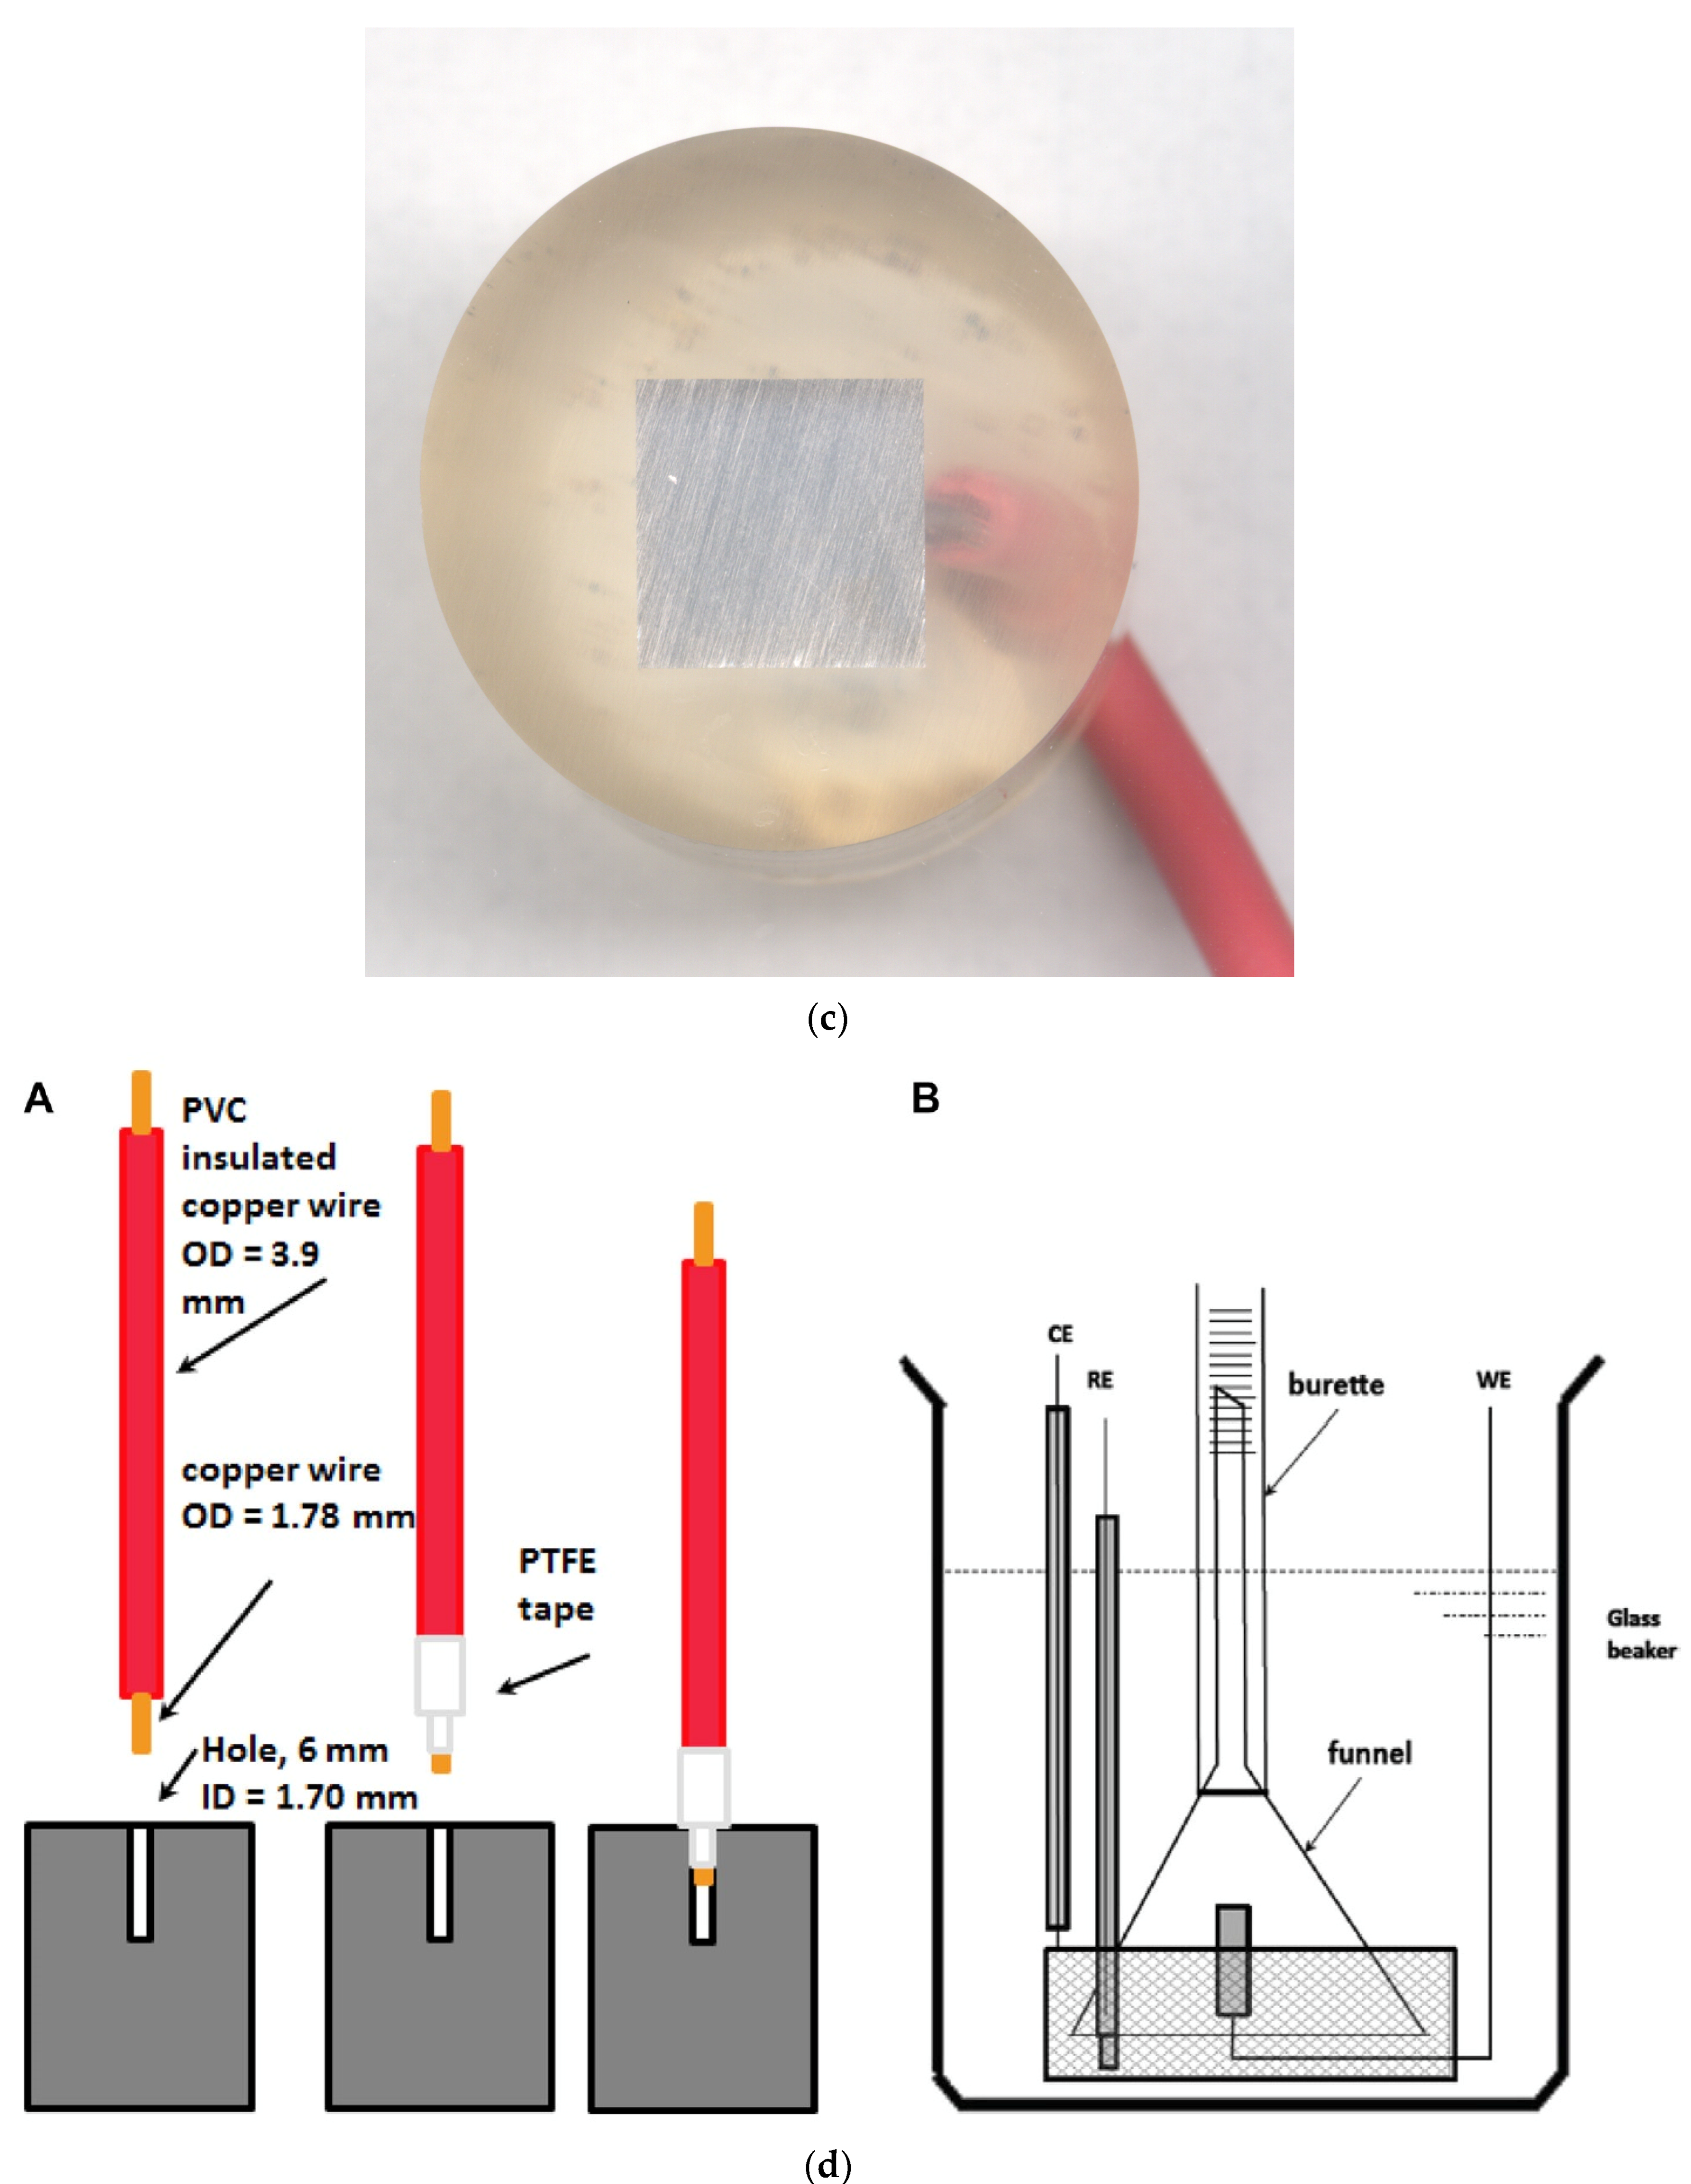
Typical corrosion rate data [
81] is presented in
Figure 2, which presents a cross plot of independent measurements of the average corrosion rate evaluated from the total volume of evolved hydrogen,
PAH, plotted against the average corrosion rate over the experimental duration measured from the weight loss,
PW, which is typical of measurements in chloride solutions.
Figure 2 shows that, for substantial corrosion rates, the average corrosion rate evaluated from the total volume of evolved hydrogen,
PAH, is in good agreement with the average corrosion rate over the experimental duration measured from the weight loss,
PW. This gives credence that both measurements represent good measurements of the actual Mg corrosion rate.
Figure 2 indicates that, for low corrosion rates, the average corrosion rate evaluated from the total volume of evolved hydrogen,
PAH, is less than, and sometimes very much less than, the average corrosion rate over the experimental duration measured from the weight loss,
PW. Under these conditions, the average corrosion rate evaluated from the total volume of evolved hydrogen,
PAH, is not a good measure of the Mg corrosion rate. This provides one obvious limitation to the measurement of the Mg corrosion rate using hydrogen evolution. It must also be remembered that the weight loss method is limited by (i) the resolution of the scale used for the weighing of the specimen (typically 0.1 mg), and (ii) the requirement to remove all corrosion products and no uncorroded metal. (Weight loss measurements are in error if the weight loss measurements are carried without removal of corrosion products).
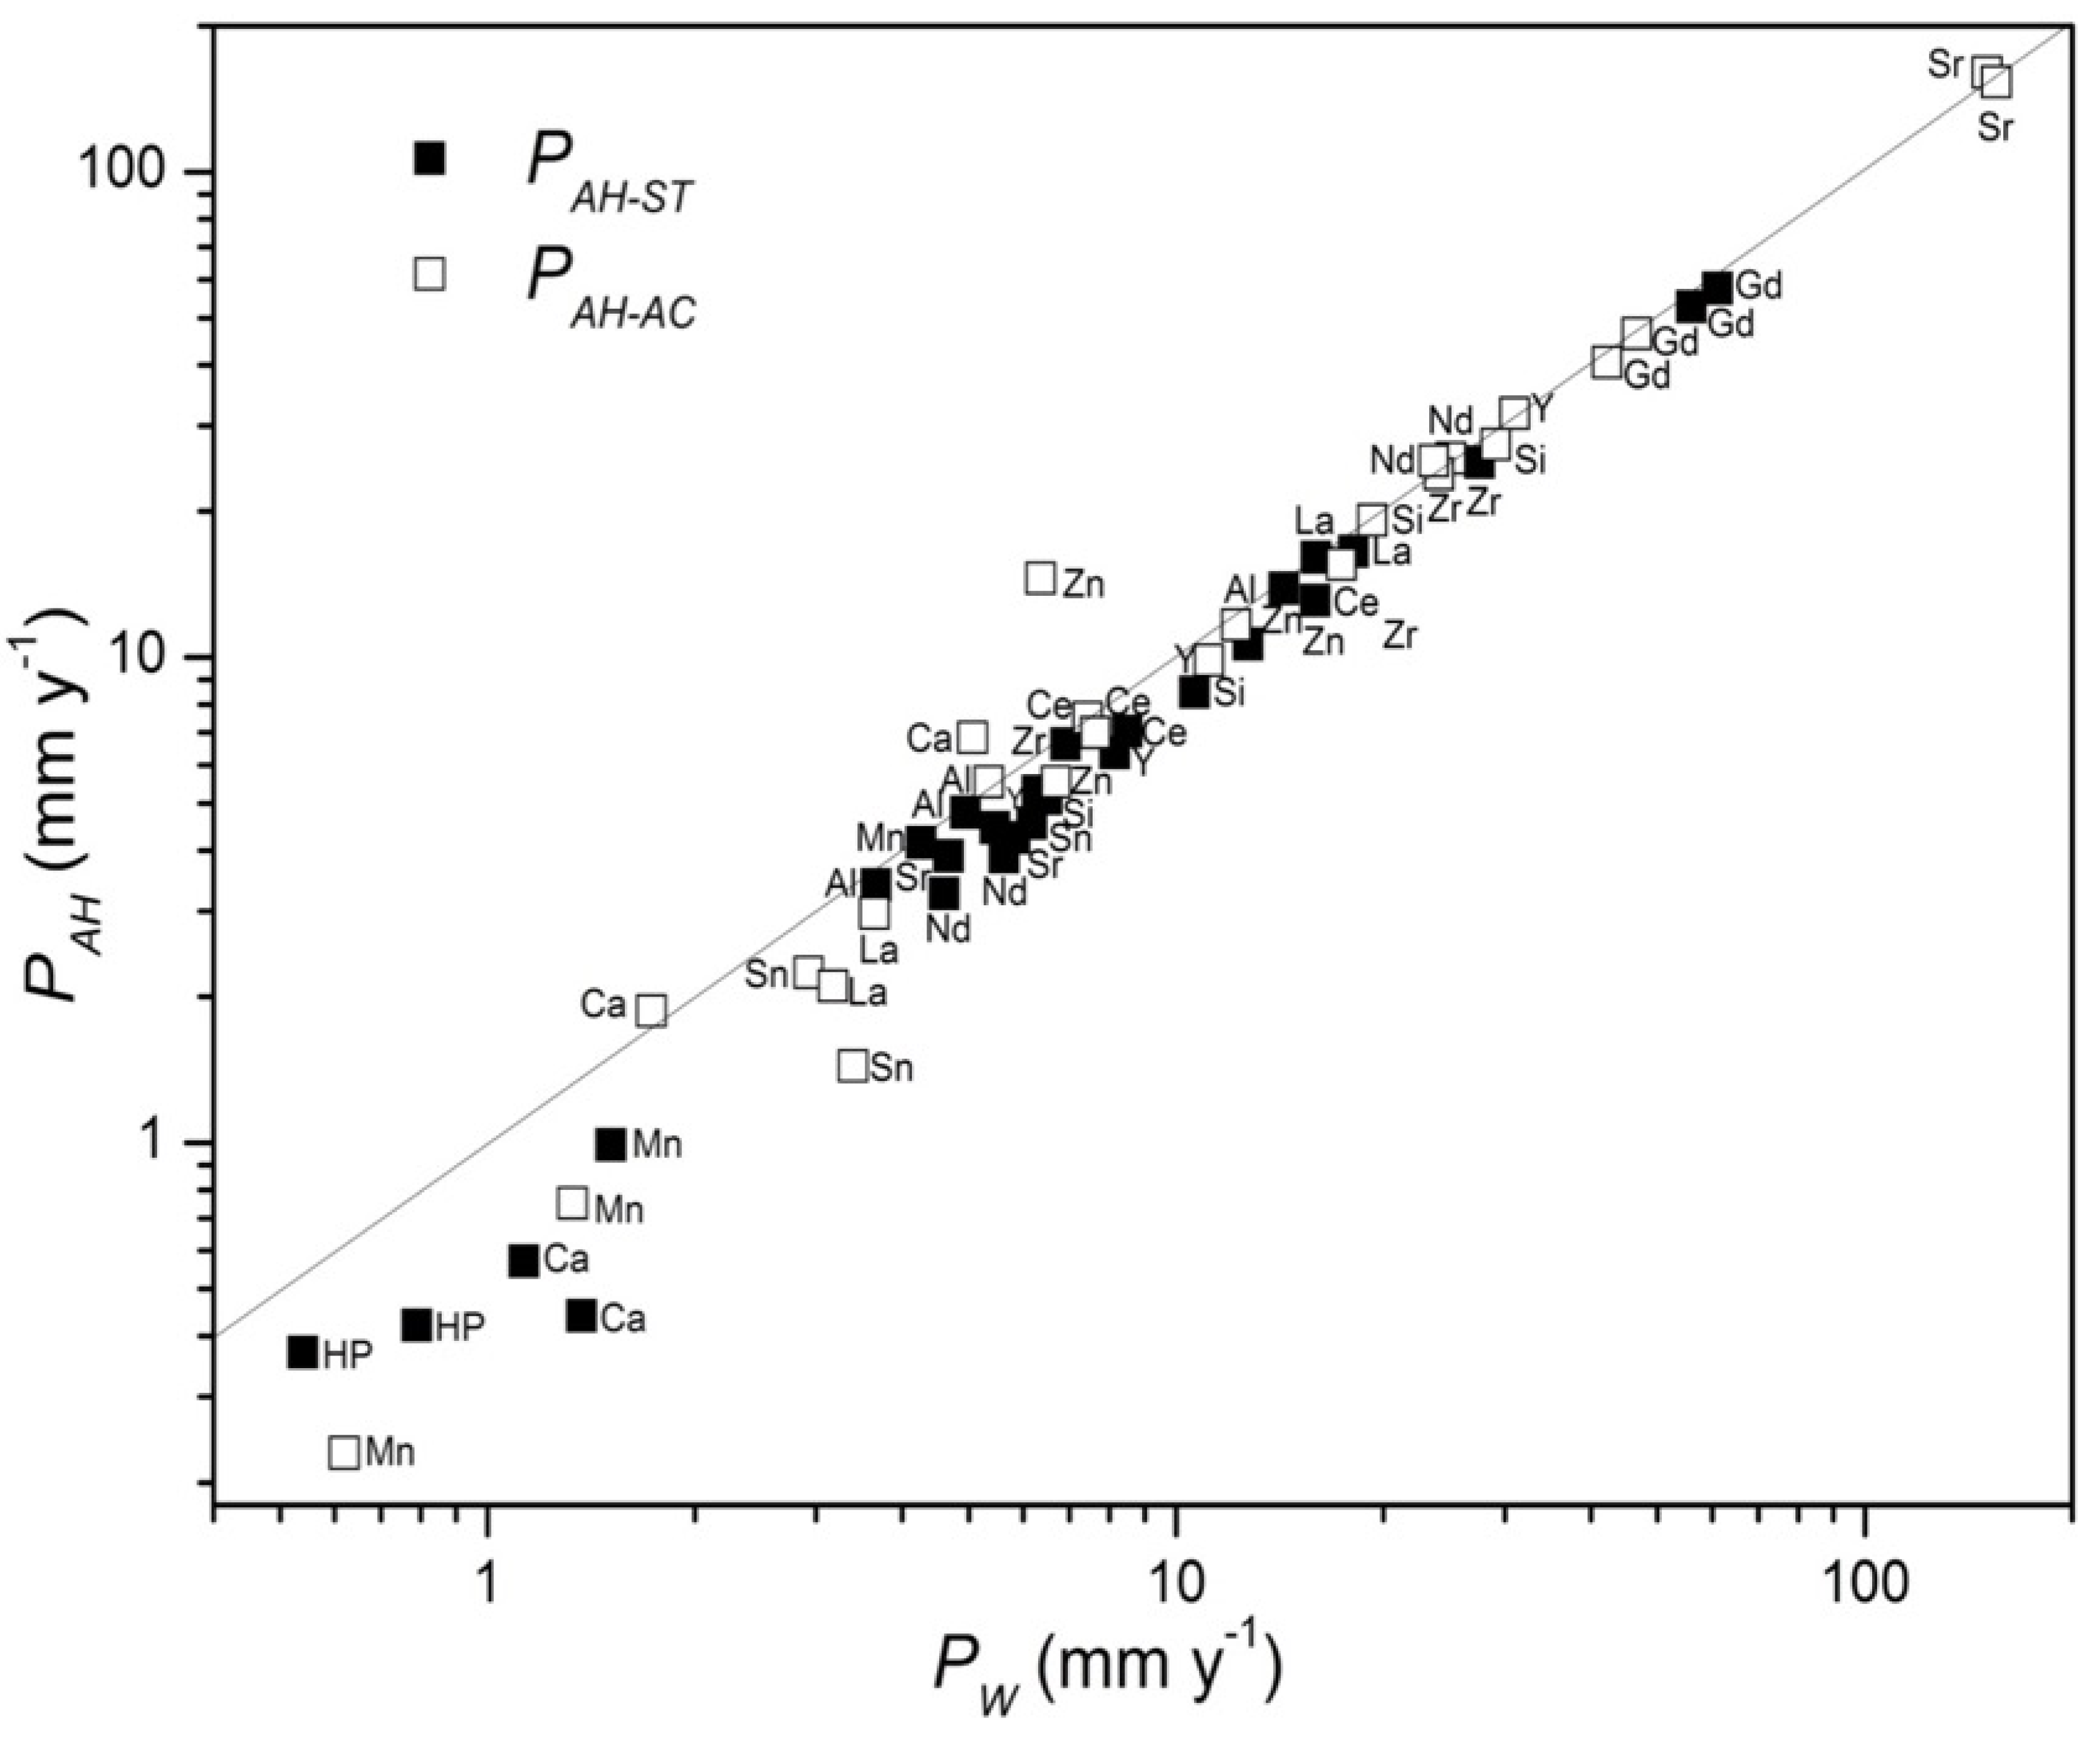
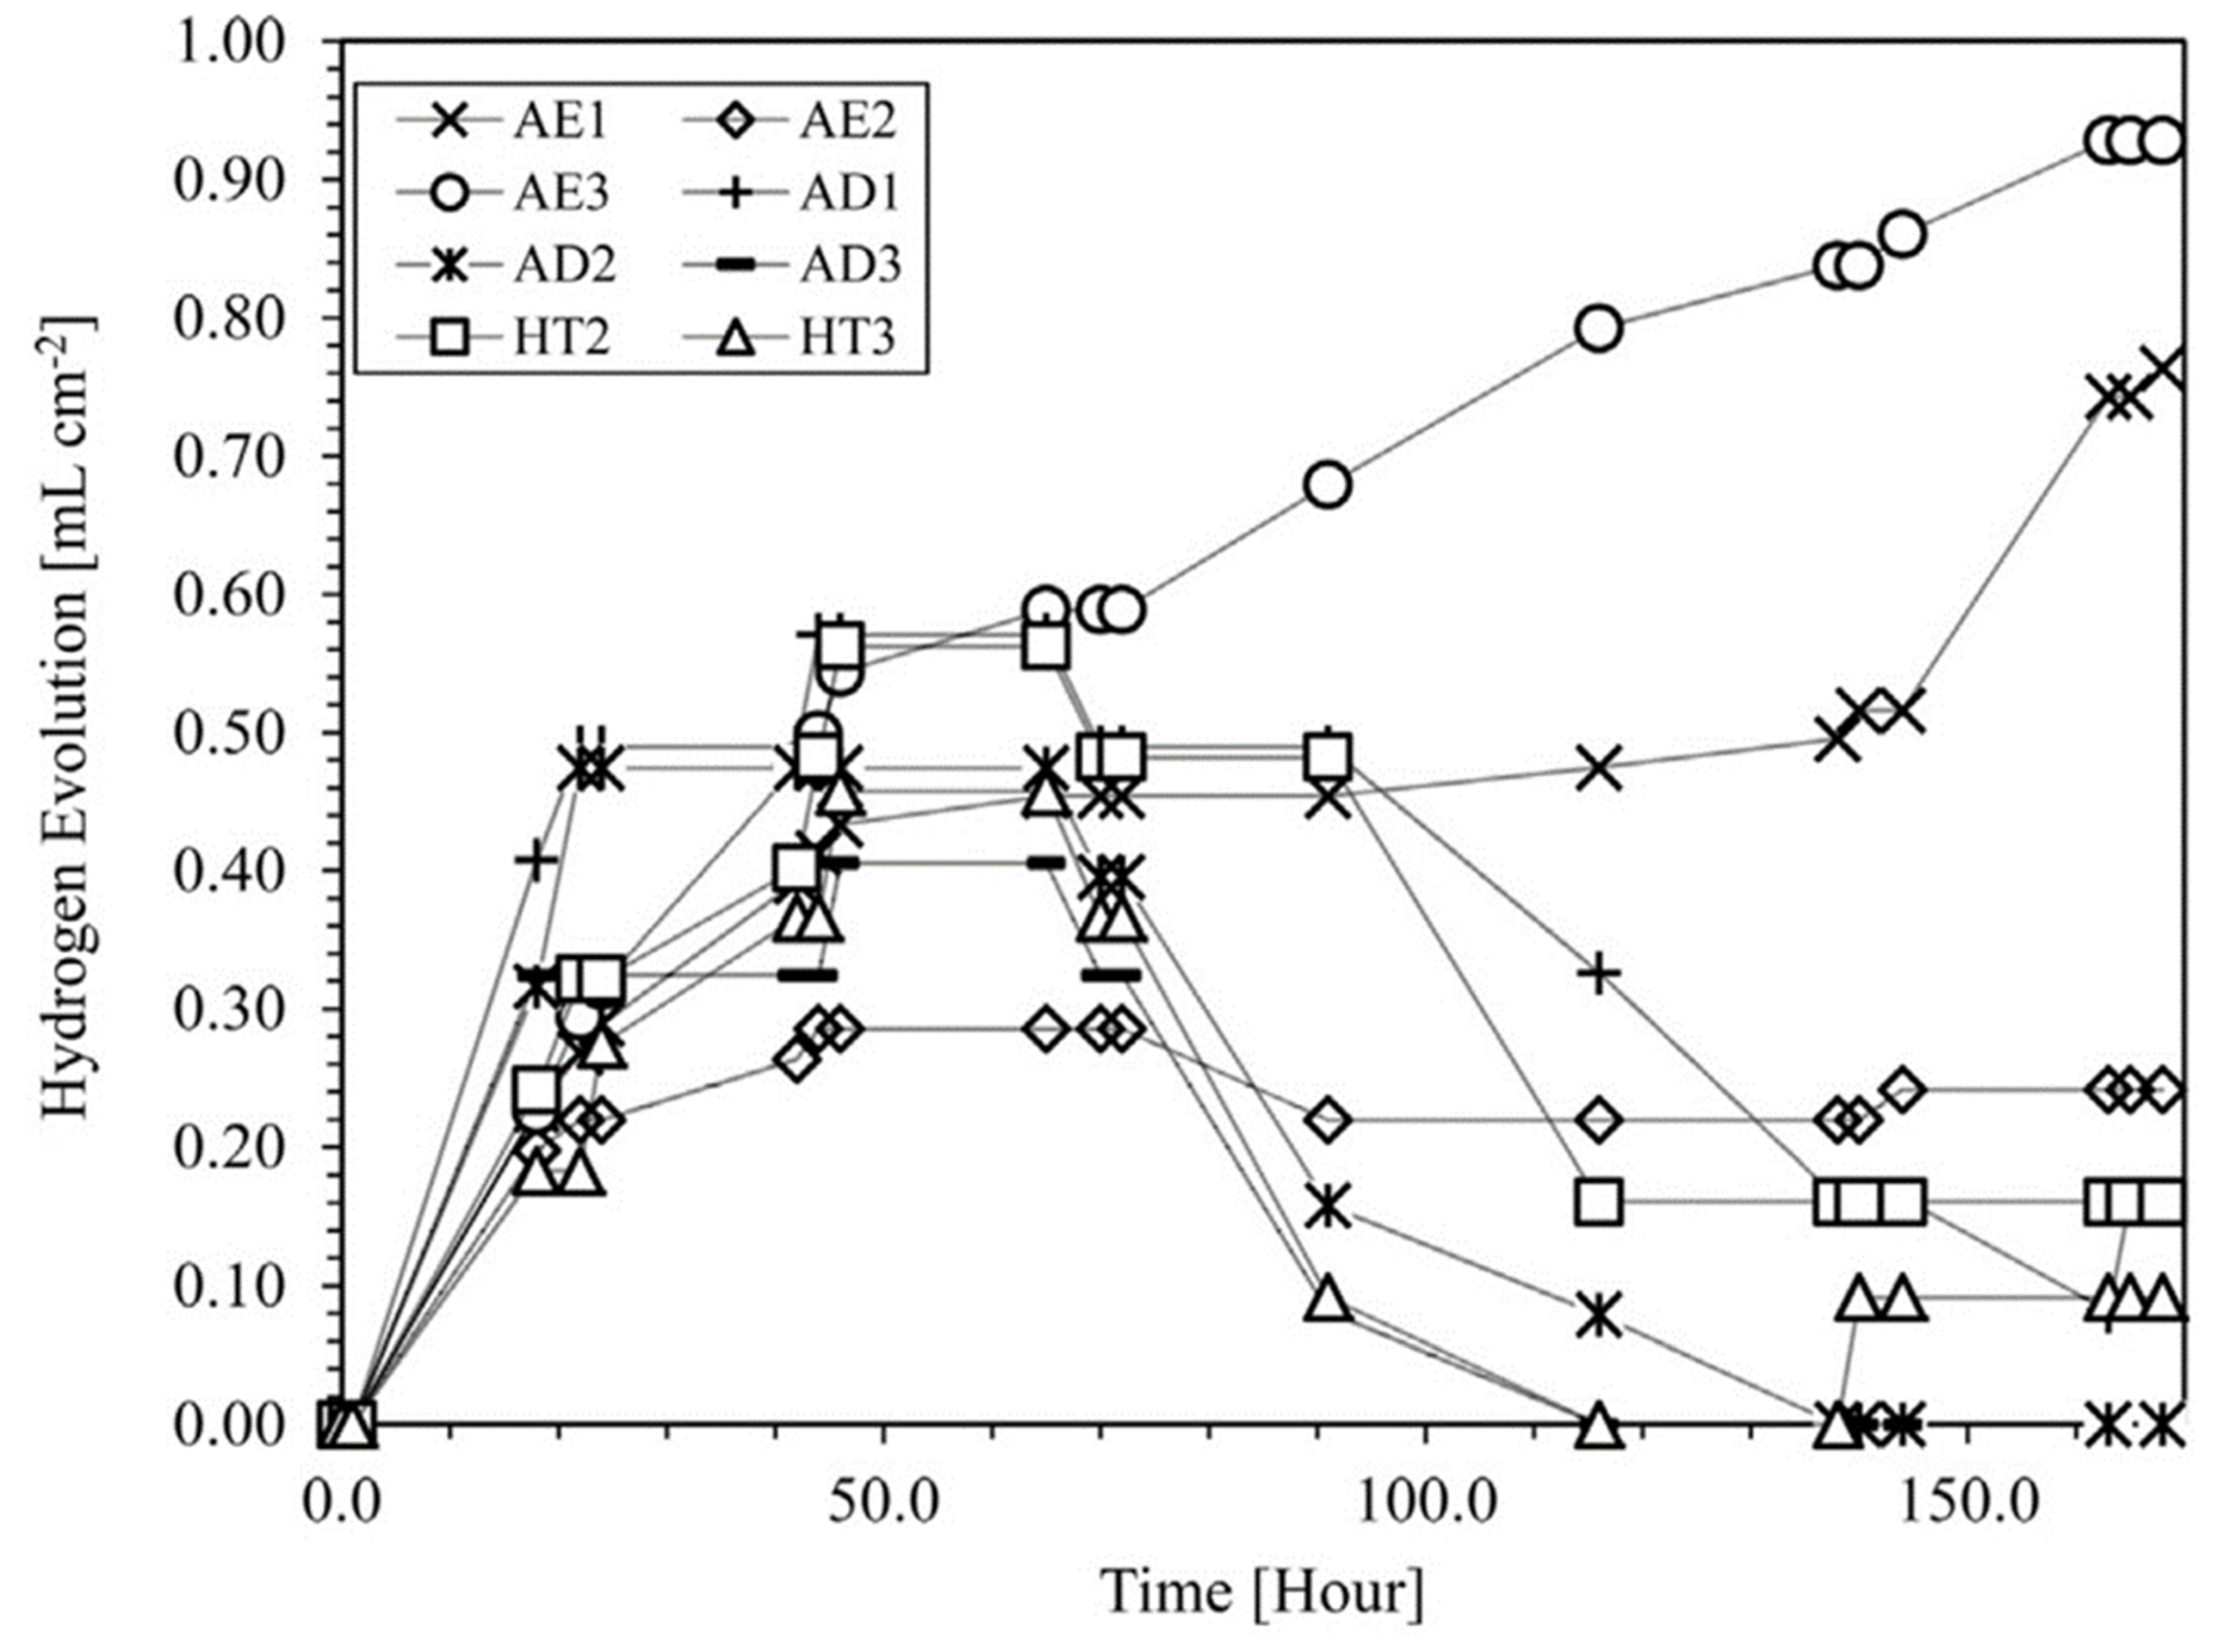
Another limitation of the hydrogen evolution method for the measurement of the Mg corrosion rate is that the method typically does not work well in the synthetic body fluids used to characterize Mg biocorrosion, particularly at low corrosion rates. An example is shown in
Figure 3 [
82].
Figure 3 presents hydrogen evolution data for various Mg alloys in Nor’s solution: CO
2-bicarbonate buffered Hanks’ solution. The amount of hydrogen dissolved in the solution caused decreases in the total measured volume of evolved hydrogen, which in some cases decreased with elapsed time, leading to apparent negative corrosion rates. One expects that such an apparent negative corrosion rate would alert the researcher that there is something inappropriate in the experimental arrangement or analysis. This example is presented herein to provide an alert to this possibility.
2.2. Electrochemical Measurements
Mg corrosion rates measured by electrochemical methods have typically not agreed with the steady state corrosion rates measured by weight loss. This is not a new observation. This has been well known for a long time.
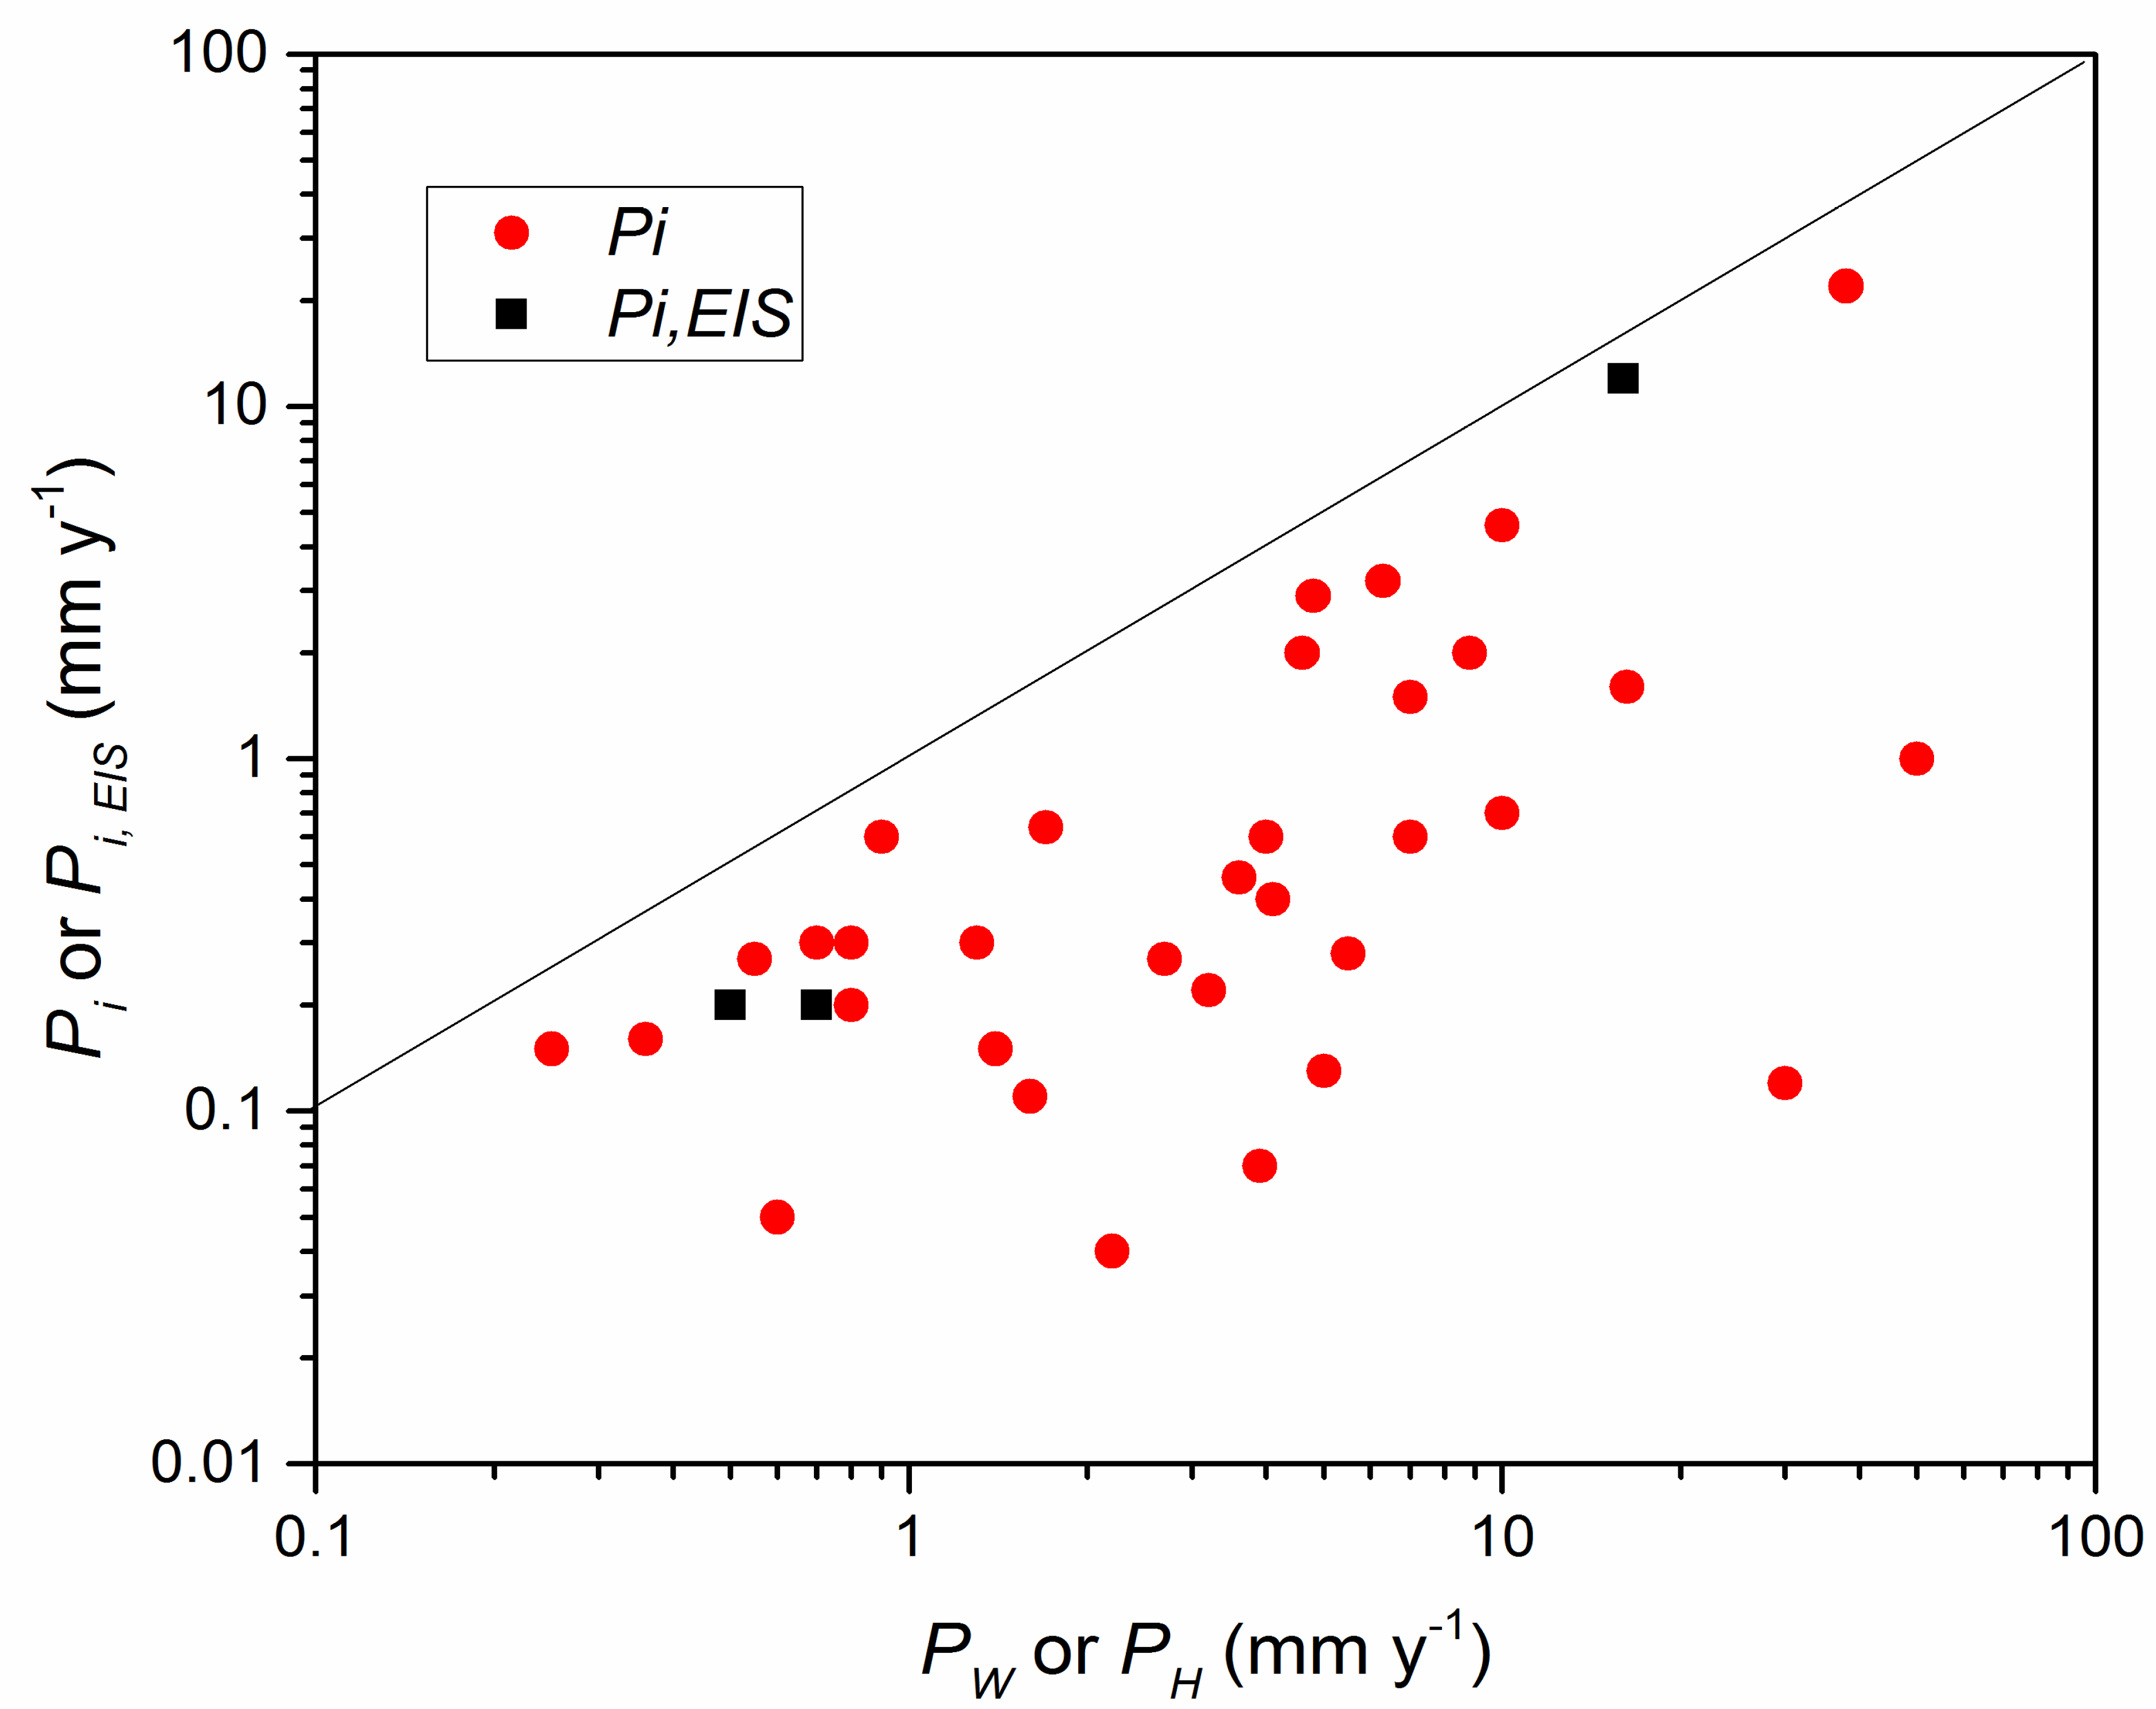
Figure 4 provides typical data from a recent compilation of experiment measurements [
83]. Mg corrosion rates were measured by electrochemical methods (Mg corrosion rates measured by Tafel extrapolation of polarization curves,
Pi, and using electrochemical impedance spectroscopy,
PEIS) (The electrochemical measurements of the corrosion rate in
Figure 4 were those in each of the papers. They typically made an estimate of the anodic Tafel constant from the anodic branch of their measured polarization curves). These measurements were cross plotted against independent measurements made in the same paper of the steady state corrosion rate as measured by weight loss,
PW, or by hydrogen evolution,
PH.
Figure 4 shows that the Mg corrosion rates measured by electrochemical means were typically much less than the Mg steady state corrosion rates,
PW or
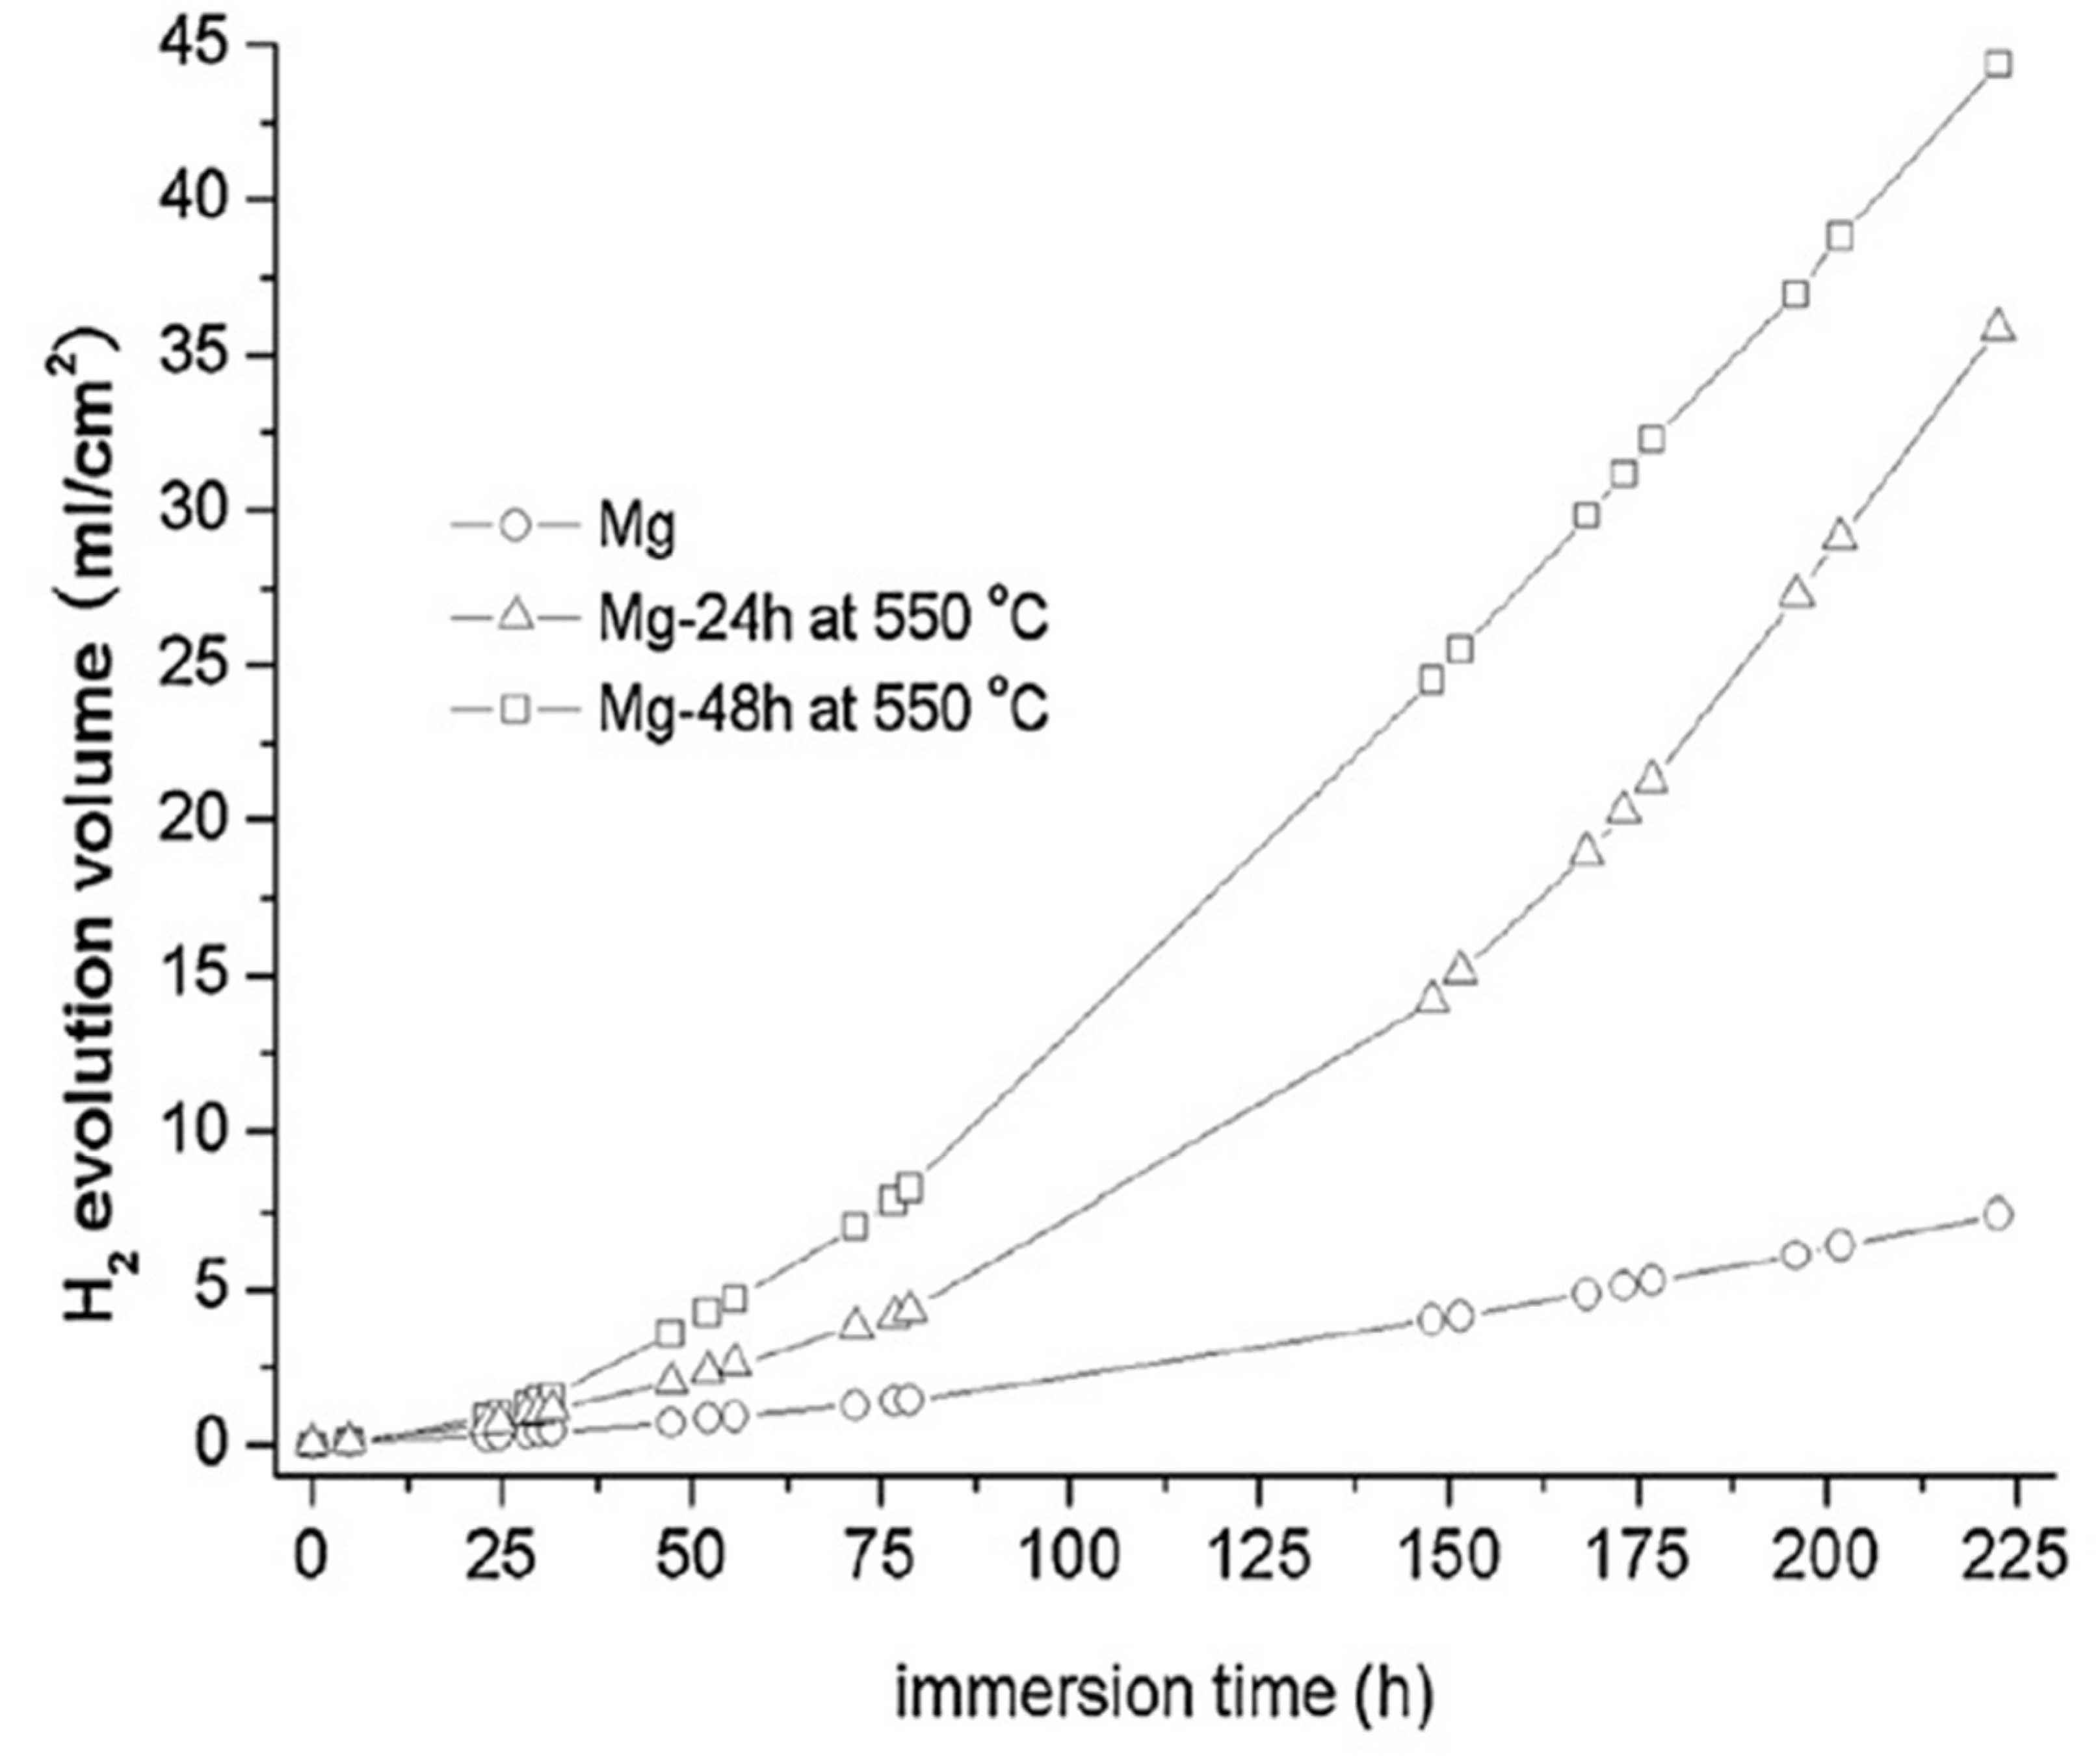
PH.Part of the explanation is that electrochemical measurements are often carried out soon after specimen immersion in the solution. This is often before steady state conditions have become established. This can be understood from
Figure 5 [
84].
Figure 5 presents the evolved hydrogen volume as a function of immersion time for high purity Mg as-cast and after heat treatment at 550 °C. The corrosion rate is evaluated from the slope of the hydrogen evolution curve. The data represented by the squares indicates that there was an initial low corrosion rate, which accelerated with immersion time until a steady state corrosion rate was reached that was significantly greater than the initial corrosion rate. This indicates that the initial corrosion rate (as typically measured by electrochemical methods) was not representative of the steady state corrosion rate, (as measured by weight loss).
3. Tolerance Limits
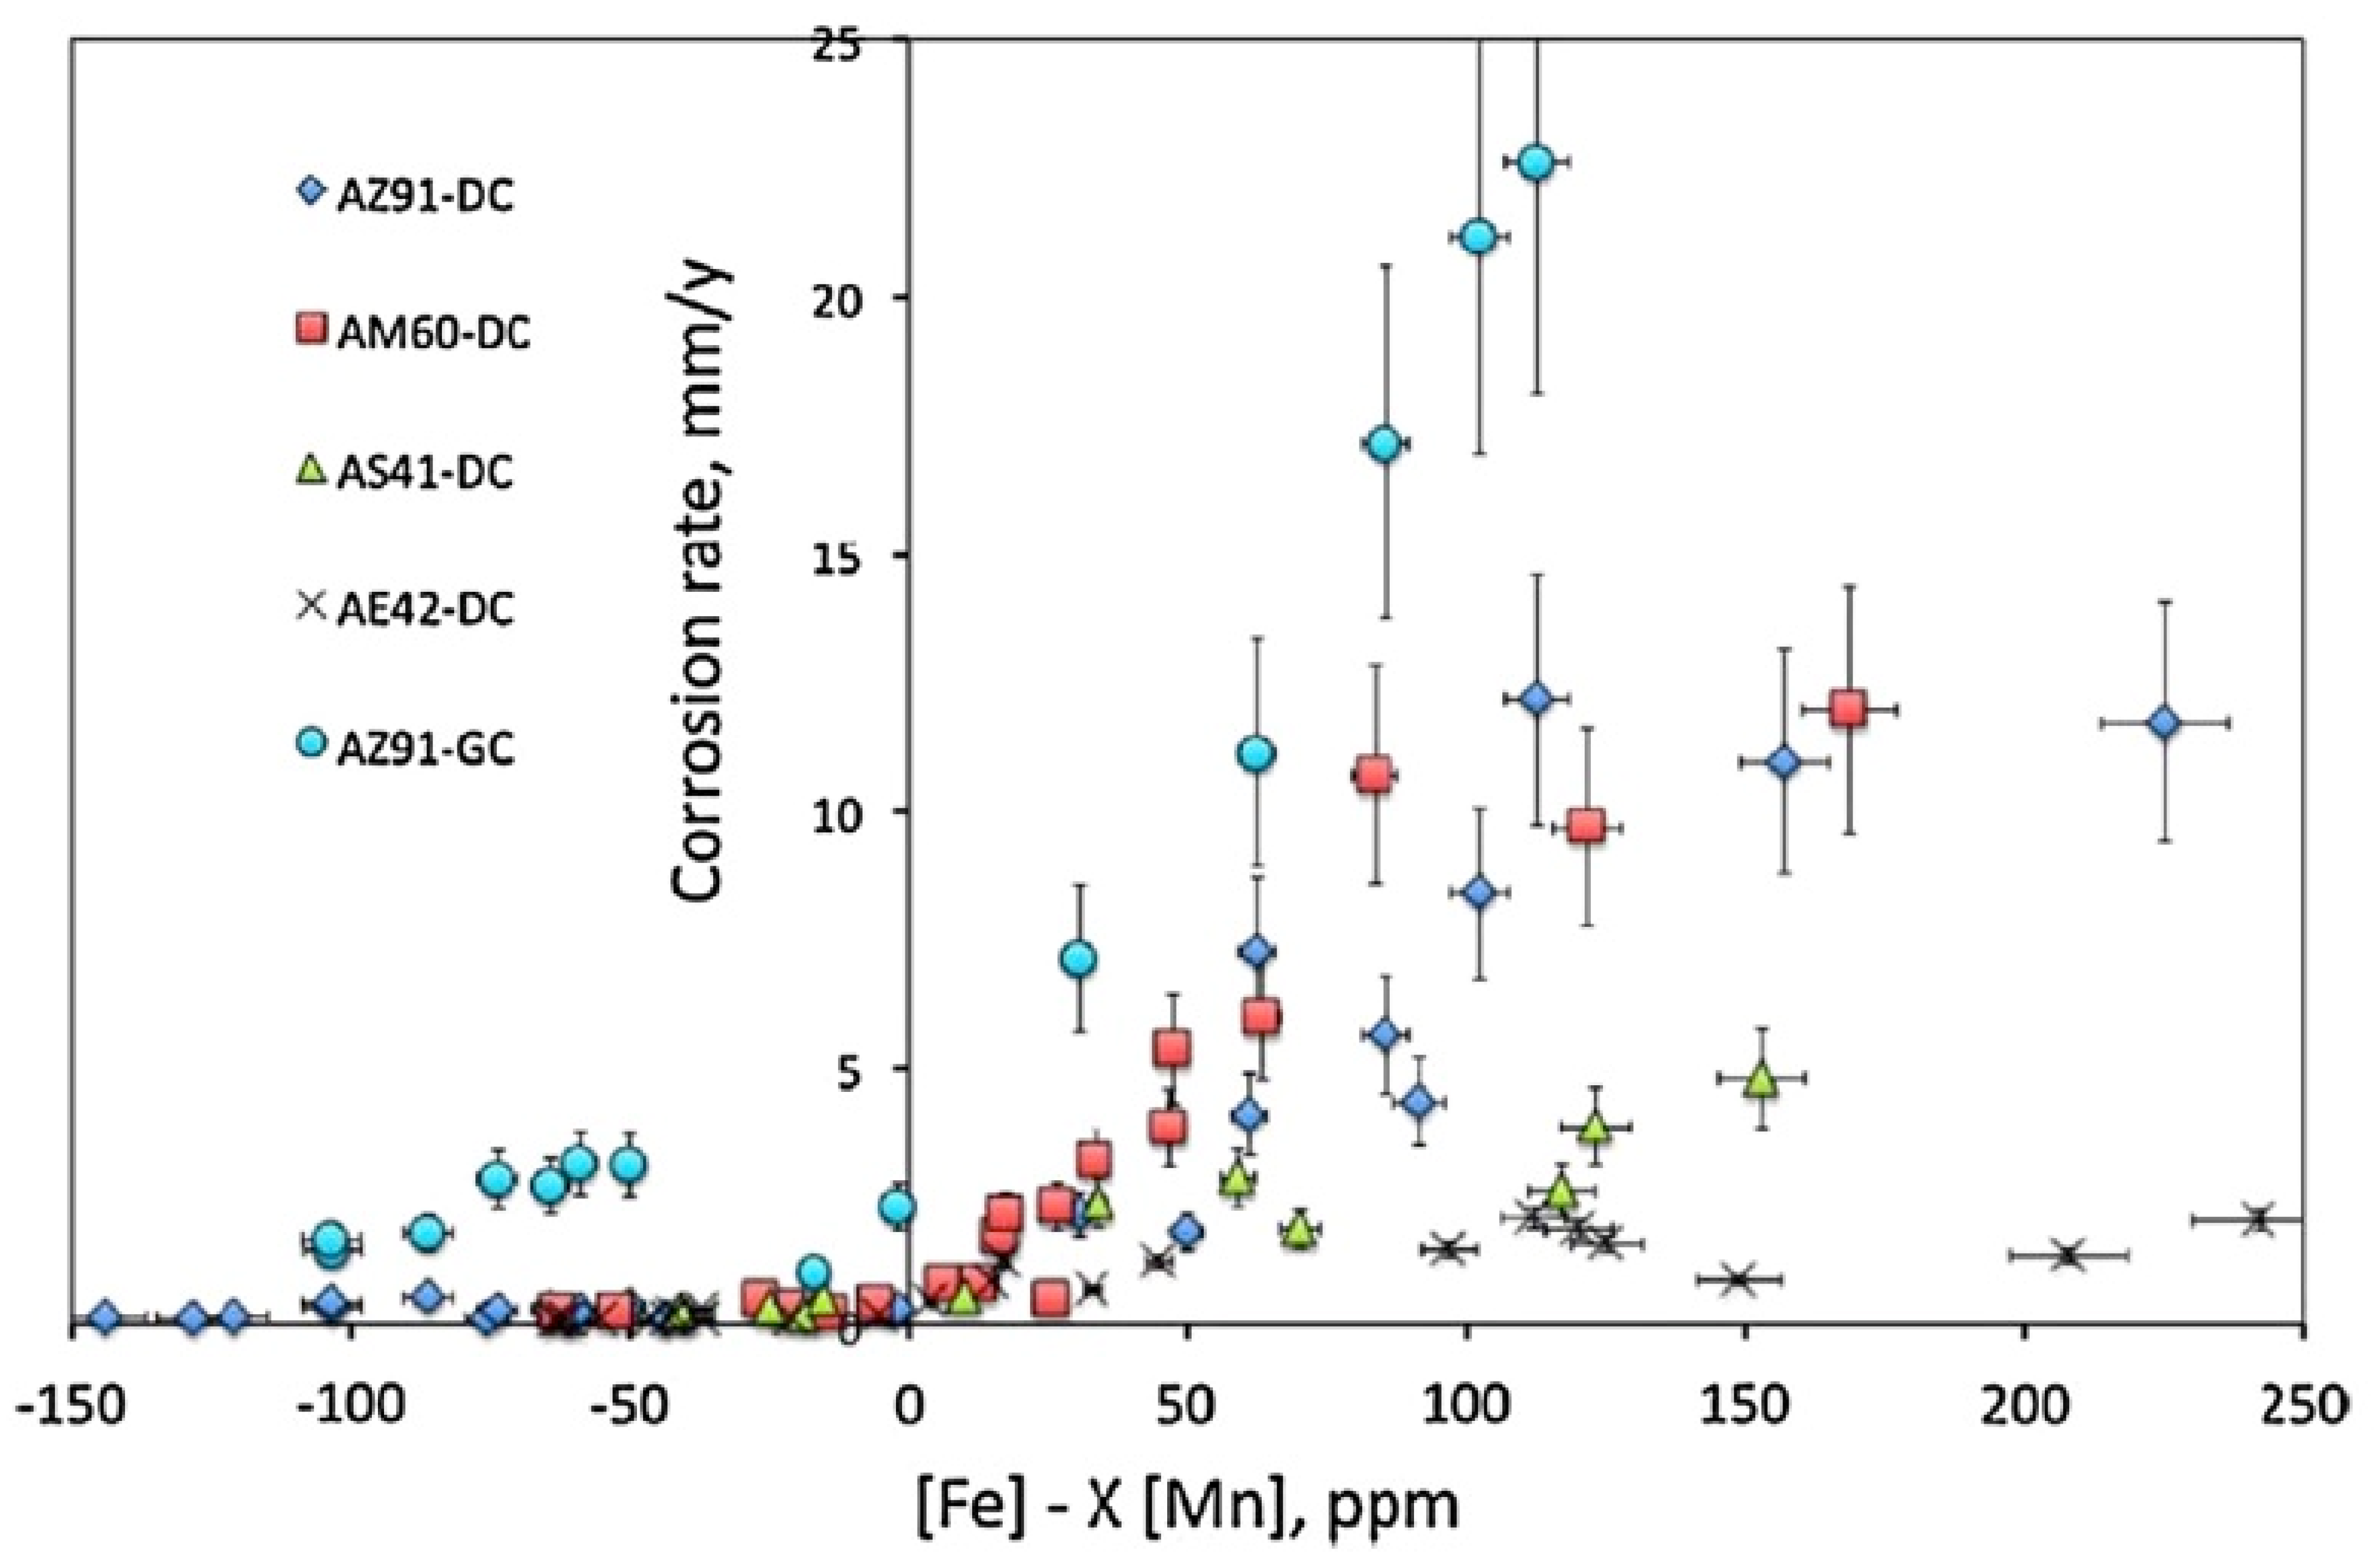
Figure 6 presents data [
84] indicating that the corrosion rate is high above the compositional dependent tolerance limit, whereas there is a low corrosion rate for compositions below the tolerance limit.
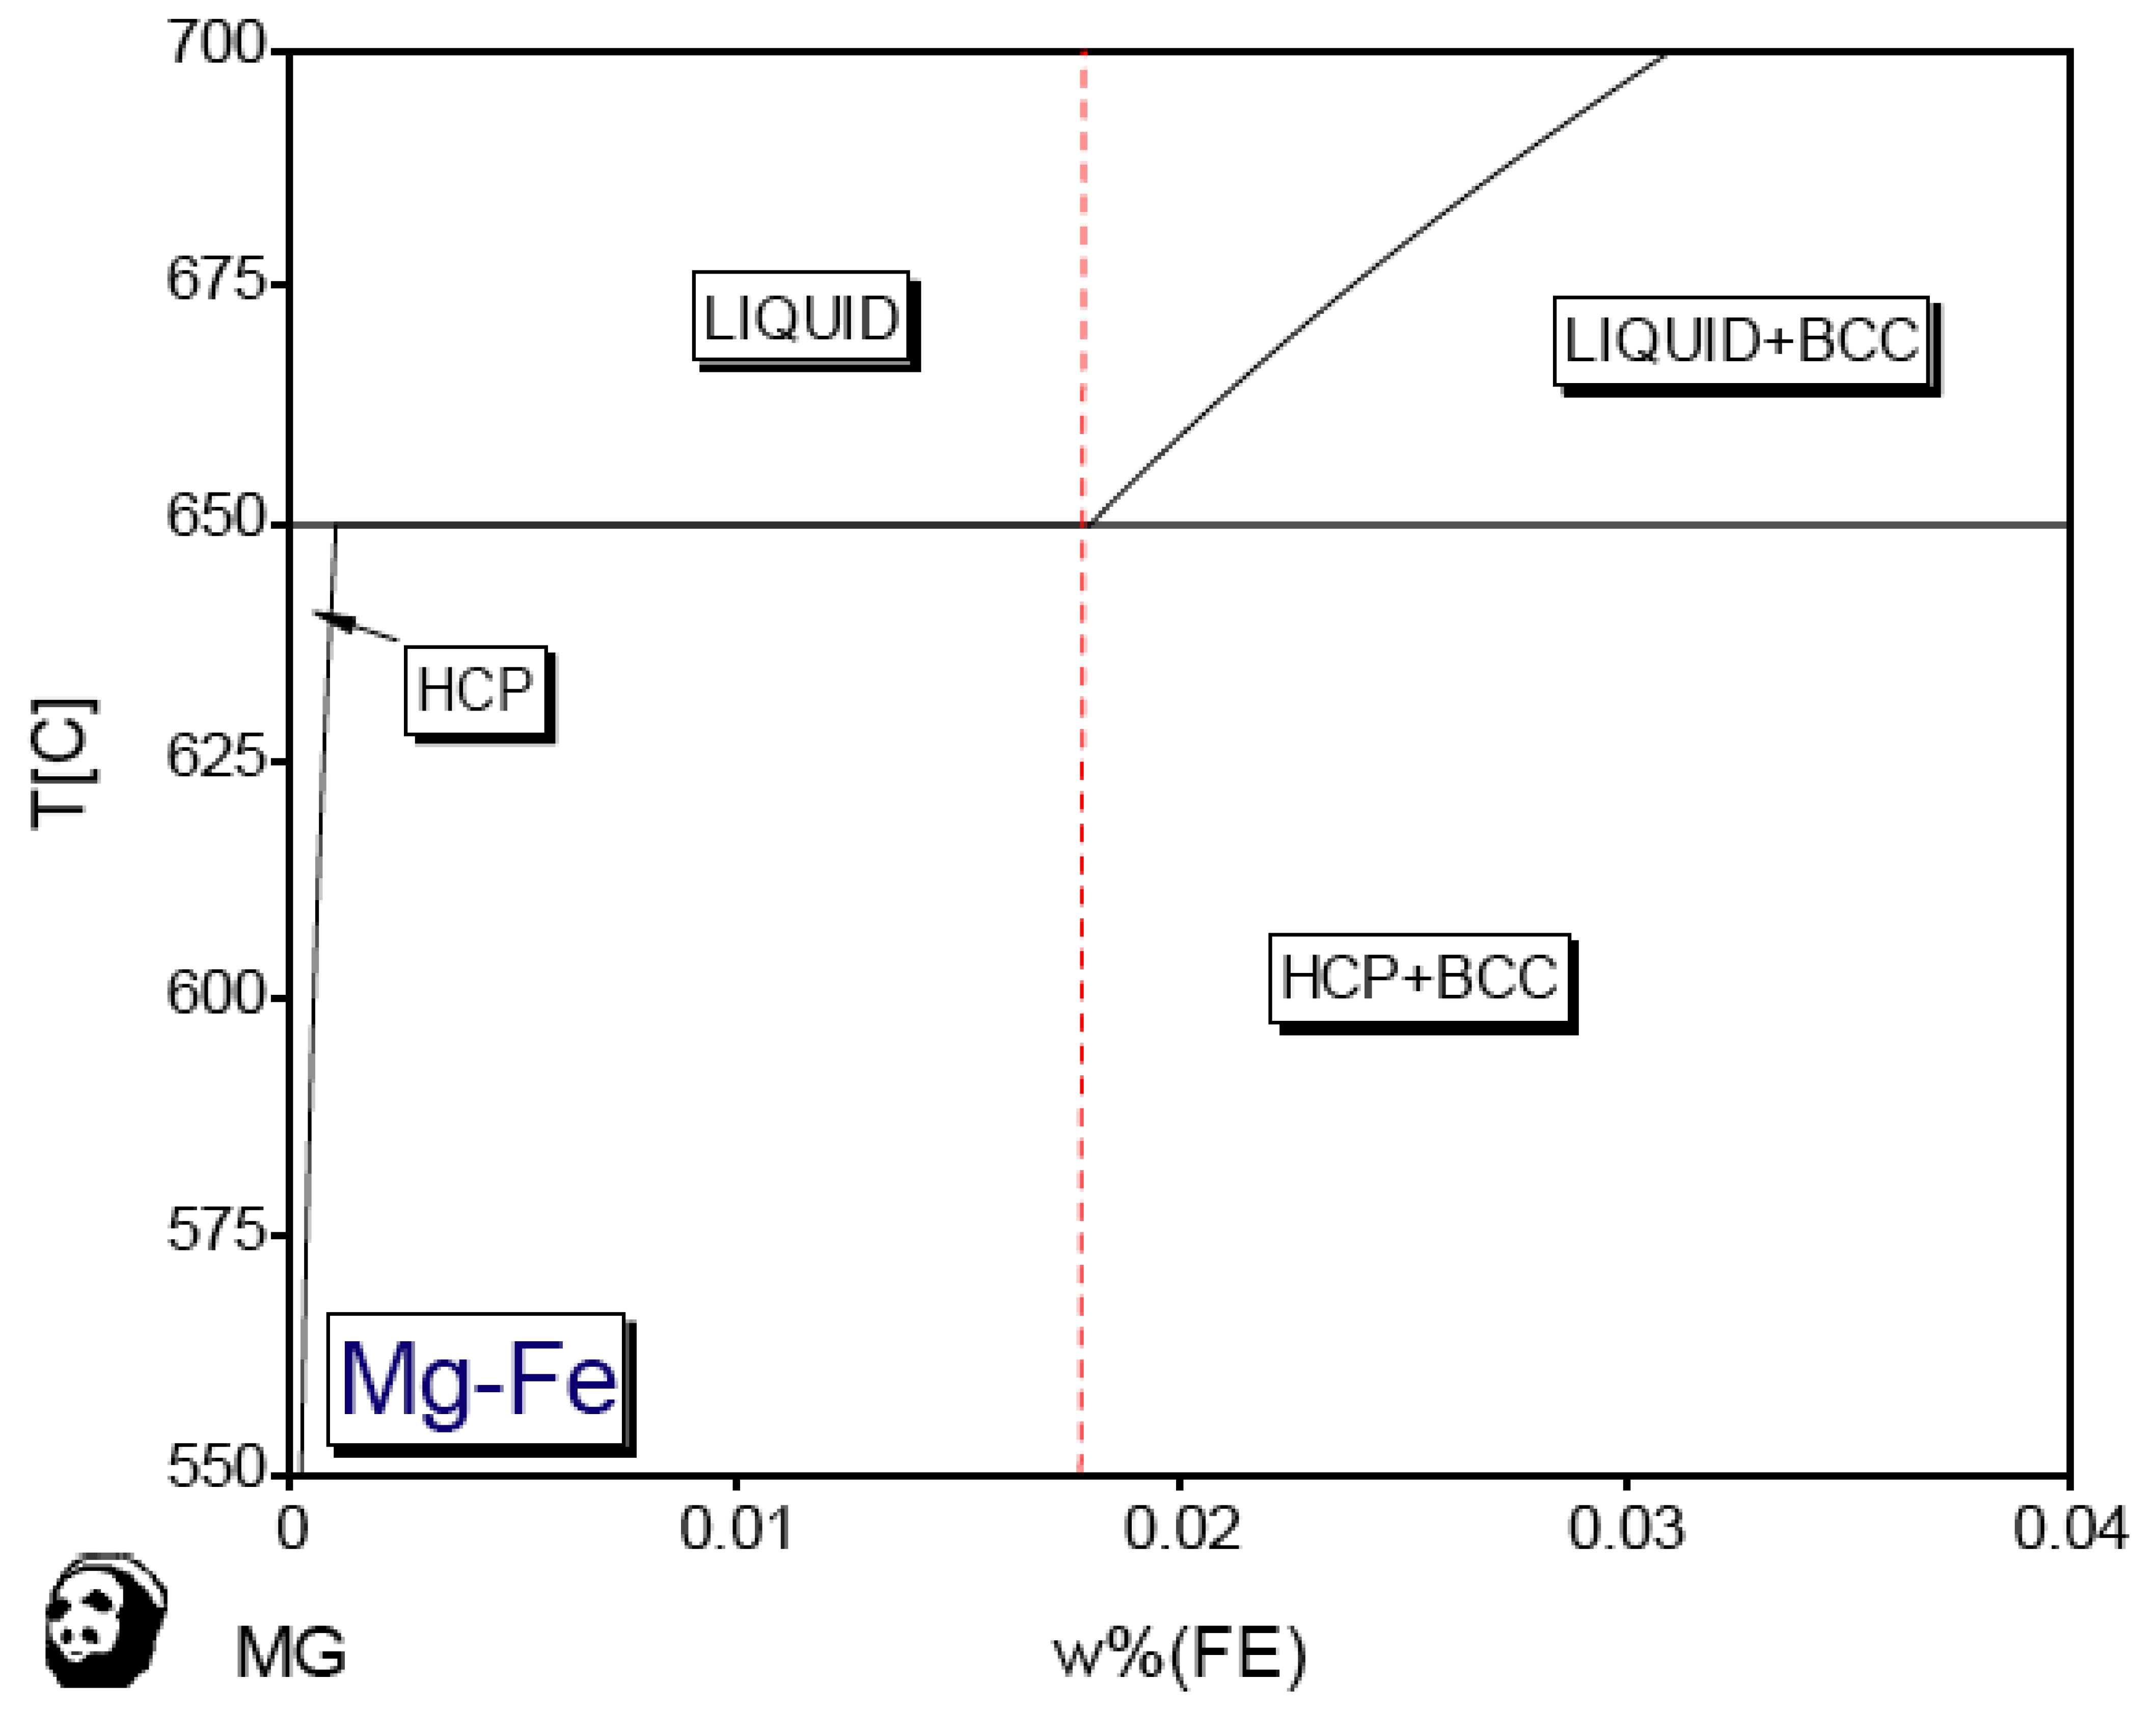
The Fe tolerance limit can be understood by considering the equilibrium Mg-Fe phase diagram [
84] which is shown in
Figure 7. The Mg-Fe equilibrium phase diagram is an eutectic phase diagram [
84]. The eutectic concentration of 0.018 wt% Fe (180 wt ppm) corresponds to the Fe tolerance limit for a pure Mg casting. Solidification of a casting with a higher Fe content causes primary solidification of the Fe-rich BCC, so that all such compositions contain the Fe-rich BCC phase on solidification, which causes high corrosion rates of the Mg alloy because the Fe-rich BCC phase is an extremely effective hydrogen evolution cathode. Only alpha-Mg is typically the result of normal solidification of a Mg alloy with a Fe content less than the eutectic concentration. As-solidified, such alpha-Mg produces low corrosion rates. However, the Mg-Fe phase diagram indicates that such alpha-Mg is in a meta-stable state. The equilibrium microstructure is alpha-Mg plus the Fe-rich BCC phase. This predicts that heat treatment of as-cast Mg with an Fe-content between 2 wt ppm and 180 wt ppm causes precipitation of Fe-rich particles and a significant increase in the corrosion rate. This prediction was verified by the data in
Figure 5 by the much higher corrosion rates after heat treatment of the as-cast pure Mg.
This indicates that the Fe-tolerance limit may be dependent on heat treatment. The Fe tolerance limit is 180 wt ppm Fe for pure Mg in the typical as-cast condition, but ~2 wt ppm after heat treatment.
The Fe tolerance limit can also be drastically decreased in the presence of small concentrations of Si [
85]. Si has extremely low solubility in Mg and easily forms Fe-rich precipitates containing FeSi. The low Fe tolerance limit can be easily understood from
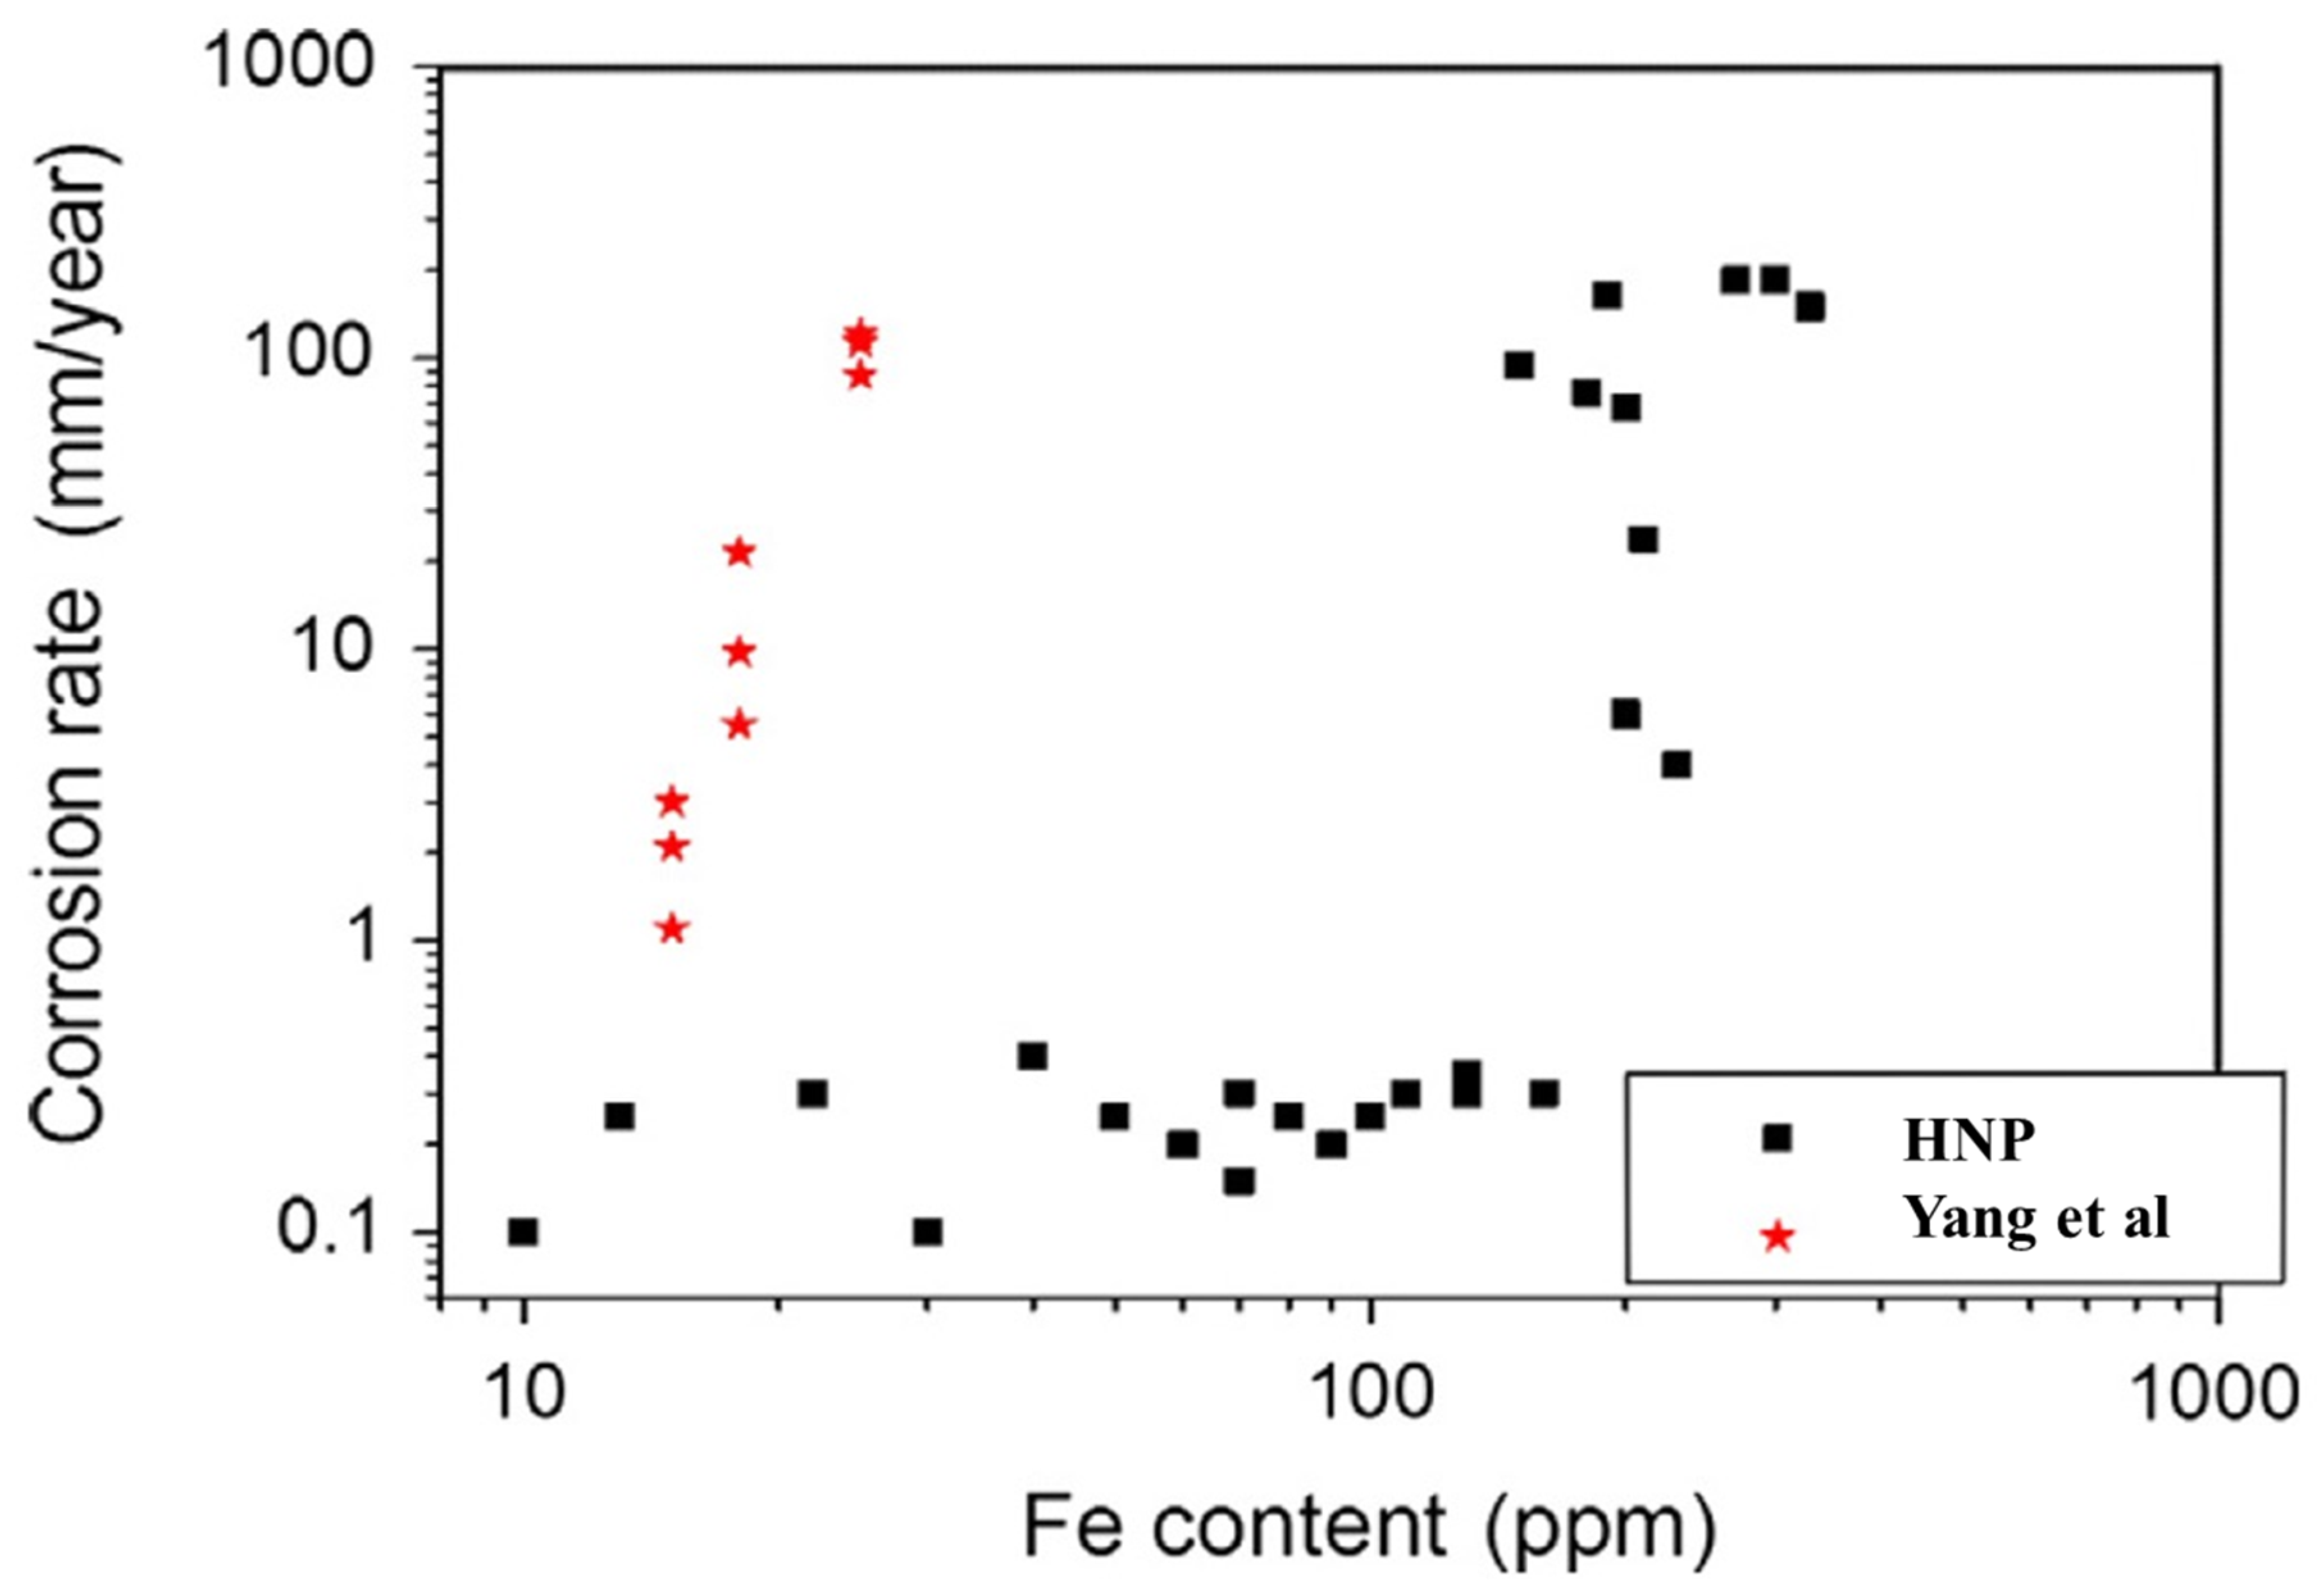
Figure 8.
Figure 8 presents corrosion rates evaluated by weight loss for pure Mg containing Fe: (i) the stars represent data from Yang et al. [
85] for corrosion of pure Mg also containing Si in 3.5 wt% NaCl for 2 days, and (ii) the squares represent data from Hanawalt, Nelson and Peloubet [
86] (HNP) for alternate immersion in 3% NaCl. Figure from [
85].
The data represented by the solid squares [
86] represents the influence of Fe on the corrosion rate of as-cast pure Mg (purified by distillation). This data shows that the corrosion rate of pure Mg is 0.3 mm/y for an iron content below 180 wt ppm. This corrosion rate, measured by weight loss, can be considered as the intrinsic Mg corrosion rate in a chloride solution. Incidentally, for pure Mg, the corrosion rate is similar for a wide range of chloride concentrations because there is no micro-galvanic corrosion acceleration [
87]. The data represented by the squares defined the Fe-tolerance limit at 180 wt ppm Fe for pure as-cast Mg.
The data in
Figure 8 represented by the stars indicate low Fe tolerance limits in the presence of Si [
85] and concomitantly high corrosion rates.
4. Intrinsic Mg Corrosion Rate
As indicated in
Figure 8 by the squares, the intrinsic Mg corrosion rate in a chloride solution is 0.3 mm/y as measured by the weight loss method. This intrinsic Mg corrosion rate is identified as the lowest measured corrosion rate for pure Mg is such solutions. The above discussion indicates that the intrinsic Mg corrosion is only reliably measured using the weight loss method. At such low corrosion rates, the other measurement methods provide measurements that are erroneously too low, perhaps by orders of magnitude. All techniques for the measurement of the corrosion rate are limited by the resolution of the measuring method; this includes weight loss and hydrogen evolution. Although the weight loss and hydrogen evolution methods would have limitations for any Mg alloys that would form a protective or passive surface film, it must be remembered that the film that forms naturally during Mg corrosion in chloride solutions provides minimal corrosion protection, and the intrinsic Mg corrosion rate of 0.3 mm/y is actually quite substantial.
Figure 8 indicates that it has been known since 1948 that the intrinsic Mg corrosion rate in a chloride solution is 0.3 mm/y. Any claim for exceptional corrosion performance after that year for an Mg alloy with a significantly higher corrosion rate [
88,
89] is not valid.
The intrinsic Mg corrosion rate provides a useful benchmark against which to compare Mg alloy corrosion measurements. Typically, Mg alloys have corrosion rates significantly greater than the intrinsic Mg corrosion rate, often due to micro-galvanic corrosion acceleration by second phases. Often there is discussion about how microstructural changes in such Mg alloys “improve the corrosion resistance”. However, consideration should be given to simply a change in the amount of micro-galvanic corrosion caused by the microstructure changes in the “improved” alloy if the resultant corrosion rate of the “improved” alloy is greater than the intrinsic Mg corrosion rate.
In addition, the intrinsic Mg corrosion rate of 0.3 mm/y as measured by weight loss provides a useful benchmark. A lot of effort has been expended to try to develop a Mg alloy with a much lower corrosion rate.
5. Mg Corrosion Rates
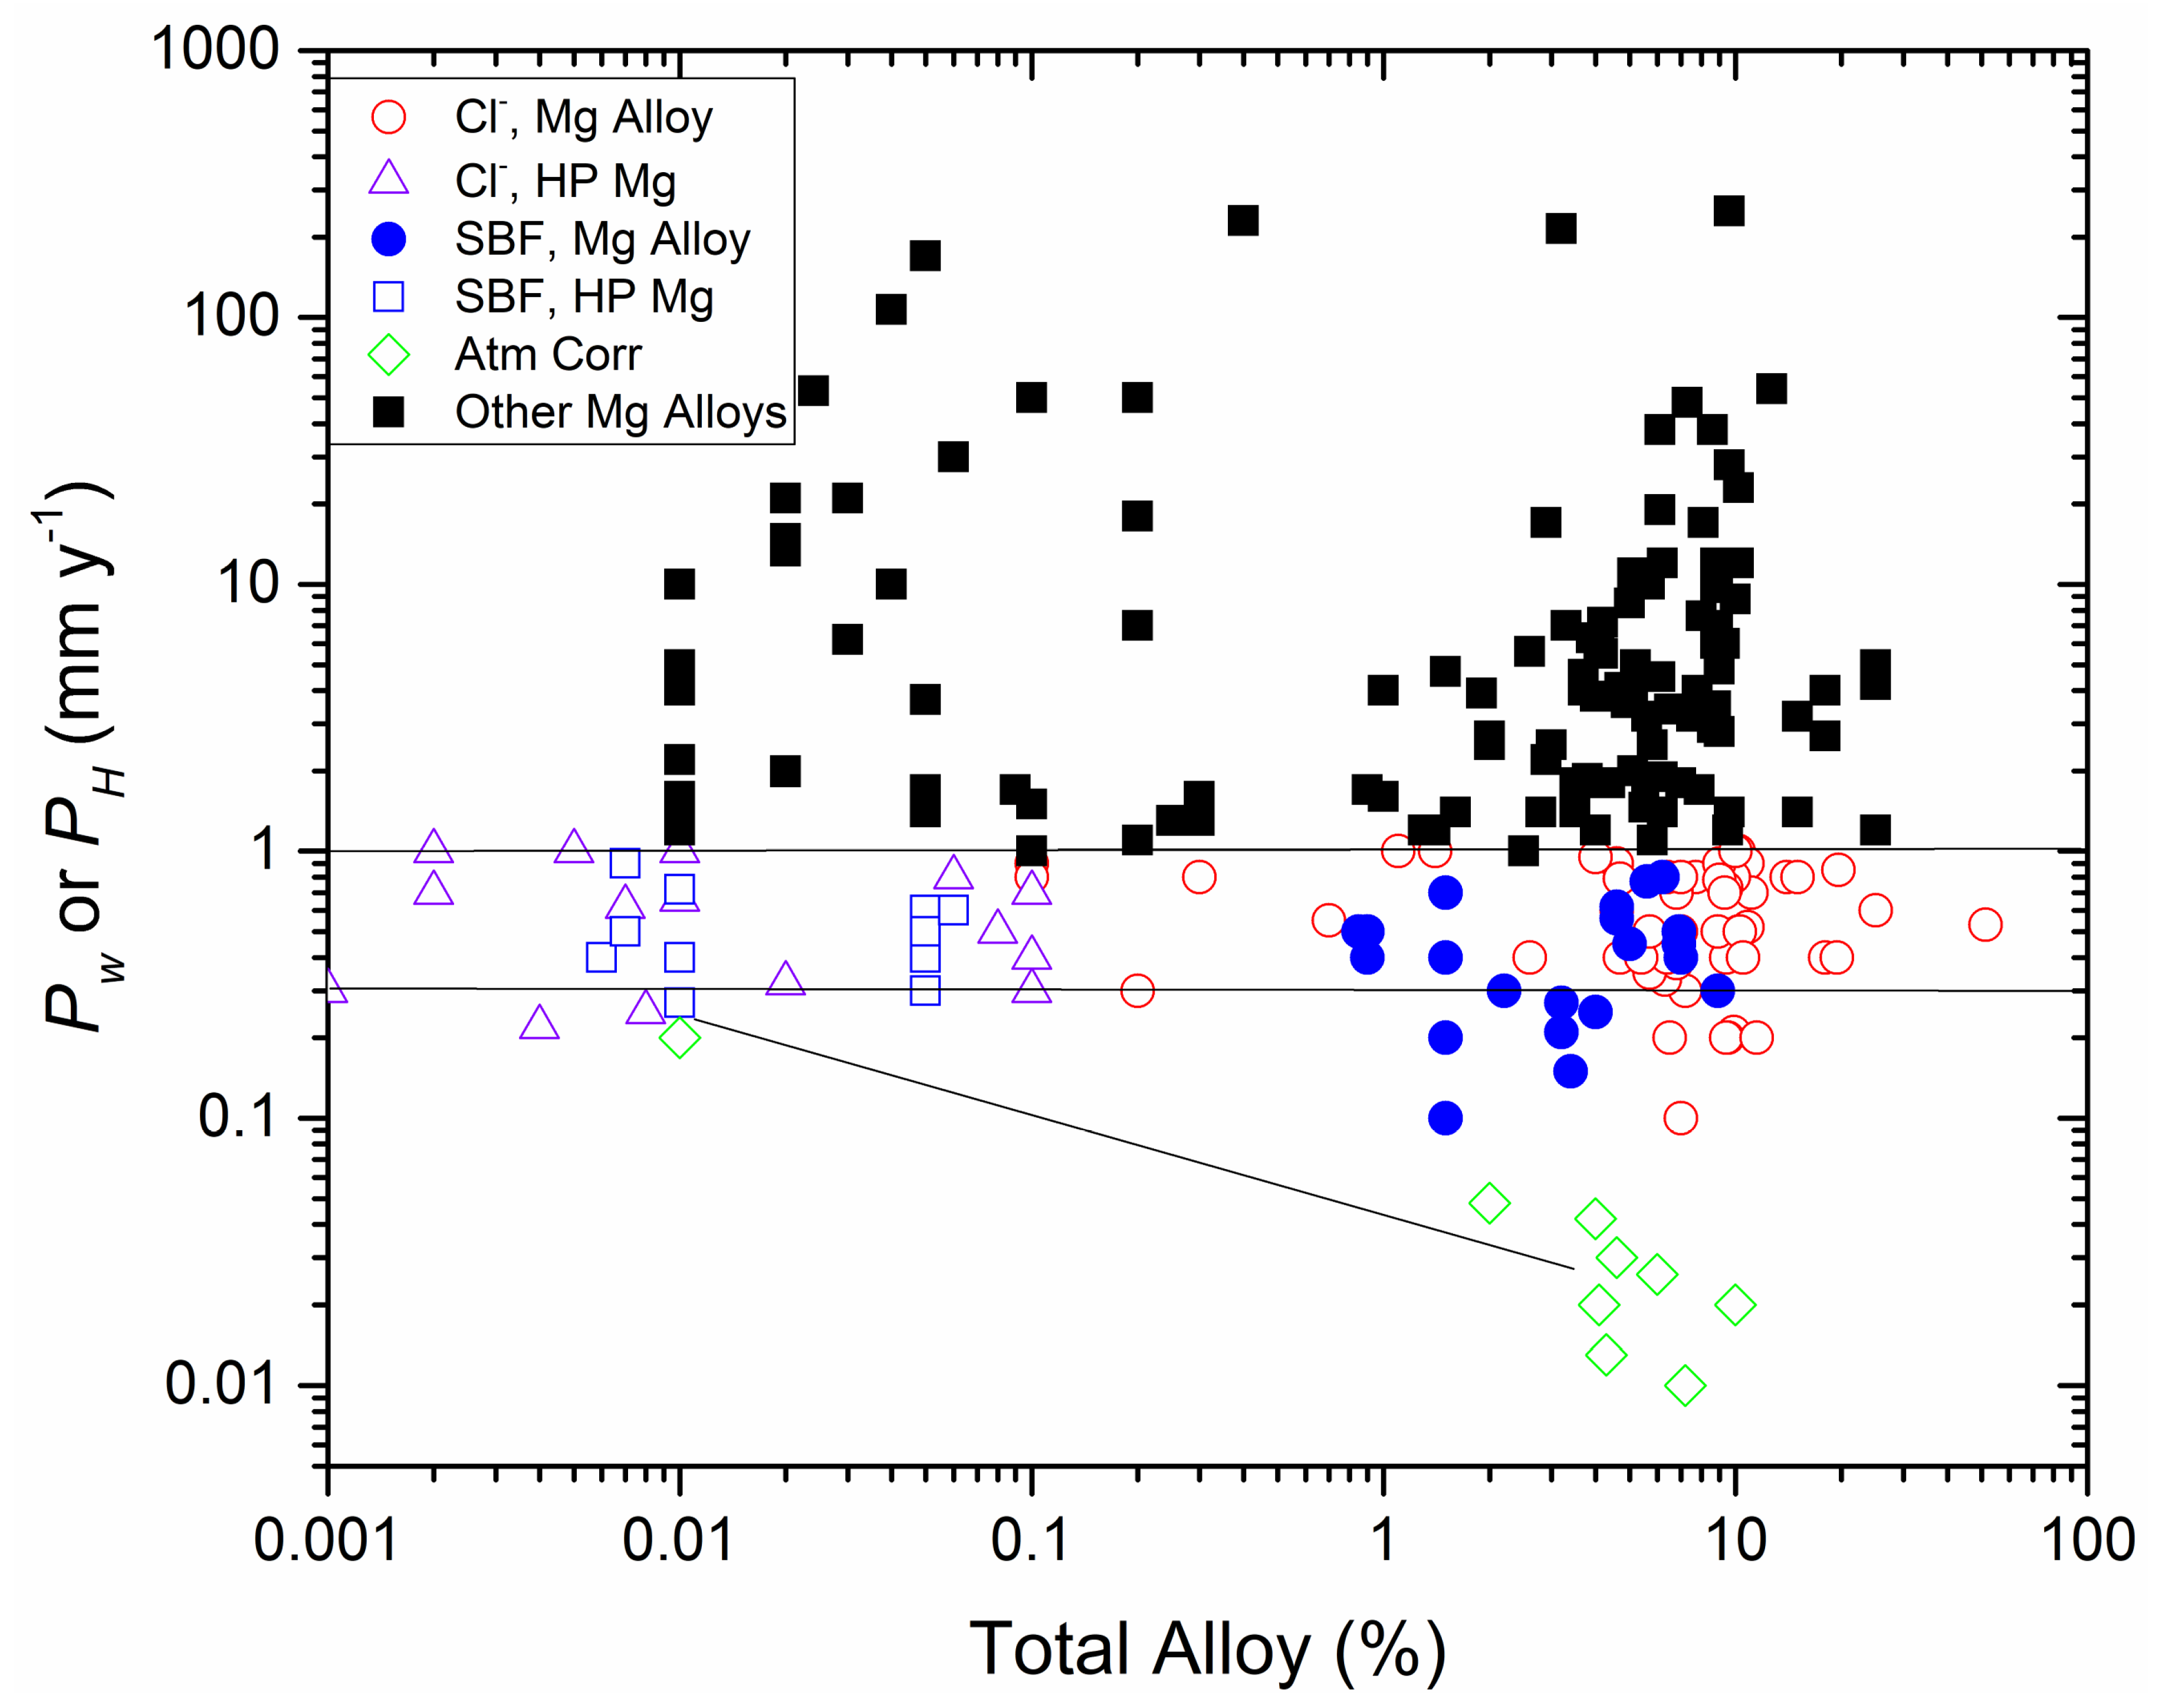
Figure 9 provides a recent compilation [
83] of corrosion rates of Mg alloys that was focused on Mg alloys with low corrosion rates. The corrosion rate, as measured by weight loss or hydrogen evolution, is plotted against total alloy content for convenience to display a large amount of data. There is no expectation that the corrosion rate is simply related to the total alloy content. The two horizontal lines are drawn representing corrosion rates of 0.3 mm/y and 1.0 mm/y. These horizontal lines are merely drawn as a guide to the eye.
The corrosion rate of 0.3 mm/y represents the intrinsic Mg corrosion rate for Mg corrosion. This corrosion rate is the lowest corrosion rate measured for high purity Mg in a chloride solution [
86,
90]. It is worth mentioning that there are many independent measurements of such a corrosion rate for high purity Mg. The existence of many independent measurements of such a corrosion rate for high purity Mg validates the concept of the intrinsic Mg corrosion rate. It is also noteworthy that there are a number of Mg alloys with a corrosion rate approaching the intrinsic Mg corrosion rate. These measurements include measurements of Hanawalt, Nelson and Peloubet [
86] from 1942 and Cao et al. [
90] of 2013 and Yang et al. [
91] of 2018.
There were a few Mg alloys with corrosion rates in chloride solutions with corrosion rates somewhat lower that the intrinsic Mg corrosion rate. Such alloys are of immerse technological and scientific interests; however, they continue to be rare.
The corrosion rate of 1.0 mm/y is an arbitrary corrosion rate used to distinguish between low corrosion rates and substantial corrosion rates. It is worth noting that there are many Mg alloys with corrosion rates between 0.3 mm/y and 1.0 mm/y. This indicates that the claims [
88,
89] in 2015 were not consistent with the literature that an alloy had been produced that was more corrosion resistant than any Mg alloy produced so far [
88,
89].
The data presented by the full squares indicates that there are many Mg alloys with corrosion rates significantly greater than 1.0 mm/y in chloride solutions and in synthetic body fluids. In fact, most Mg alloys have such corrosion rates. This is because Mg alloys typically contain phases in addition to the alpha-Mg matrix and these second phase typically cause micro-galvanic acceleration of the corrosion rate of the Mg alloy because the second phases are typically cathodic and are more efficient cathodes for the cathodic hydrogen evolution reaction than the alpha-Mg matrix. Particularly deleterious are Fe-rich second phases.
The green diamonds in
Figure 9 [
83] represent atmospheric corrosion rates of Mg alloys. These are largely Mg-Al alloys. These corrosion rates are significantly lower that the intrinsic Mg corrosion rate in chloride solutions and in synthetic body fluids. This lower corrosion rate during atmospheric exposure is attributed to the more protective surface films formed on the surface of the Mg alloy by the periodic drying during atmospheric drying.
6. Anodic Hydrogen Evolution
Li et al. [
92] have provided new insights into the issue of anodic hydrogen evolution on Mg. The cathodic partial reaction during Mg corrosion is mainly hydrogen evolution, which in a neutral or alkaline solution can be written as follows.
For normal electrochemistry, if such a cathodic reaction is governed by Tafel kinetics, the current density of the cathodic reaction,
icHER,T, at an applied potential,
E, is given by
where
i0H is the exchange current density (i.e., a constant which is the speed of the forward reaction rate at equilibrium which is equal to the speed of the backward reaction rate) and
bH is the Tafel constant. Equation (3) indicates that cathodic current density of the cathodic partial reaction,
icHER,T, decreases rapidly with increasing anodic potential, and rapidly reaches negligible values.
Mg is different in that the rate of hydrogen evolution increases rapidly with anodic polarization as indicated in
Figure 10 [
92]. This rapid increase in the hydrogen evolution rate with anodic polarization has been well known for a long time [
4,
5] and is labelled the negative difference effect [
4,
5]. This evolved hydrogen evolution during anodic polarization has also been designated as anodic hydrogen.
Clearly, the rapid increase in hydrogen evolution with anodic polarization is in contradiction to normal Tafel kinetics for a cathodic reaction if it is assumed that the evolved hydrogen on anodic polarization of Mg is evolved by the cathodic partial reaction. Thus, the designation as anodic hydrogen is useful in that the designation “anodic hydrogen” does indicate that the hydrogen evolution mechanism is different to cathodic hydrogen evolution by the cathodic partial reaction.
7. Enhanced Catalytic Activity Mechanism
The enhanced catalytic activity mechanism for Mg corrosion [
93,
94] assumes that (i) the anodic partial reaction for Mg corrosion occurs in one step by the simultaneous exchange of two electrons as follows:
and that (ii) hydrogen evolved on anodic polarization of Mg is evolved by the cathodic partial reaction, Equation (2), except that the current density of the cathodic hydrogen evolution reaction,
icHER,c, is given by:
where the terms have the same meaning except that
i0H,c is a constant for cathodic polarization BUT increases rapidly on anodic polarization, increases much faster that the decrease caused by the exponential term, so that there is nevertheless an increase in current density with increase in anodic polarization as measured experimentally.
Birbilis et al. [
94] proposed that this enhanced catalytic activity mechanism and the predicted increase in the speed of the cathodic hydrogen evolution reaction could be validated by the measurement of the speed of the cathodic hydrogen evolution reaction immediately after anodic polarization.
Li et al. [
92] carried out such an evaluation of the enhanced catalytic activity mechanism, and rather than the validation proposed by Birbilis et al. [
94], found the experimental evidence contradicted the predictions of the enhanced catalytic activity mechanisms of Mg corrosion [
93,
94]. Li et al. [
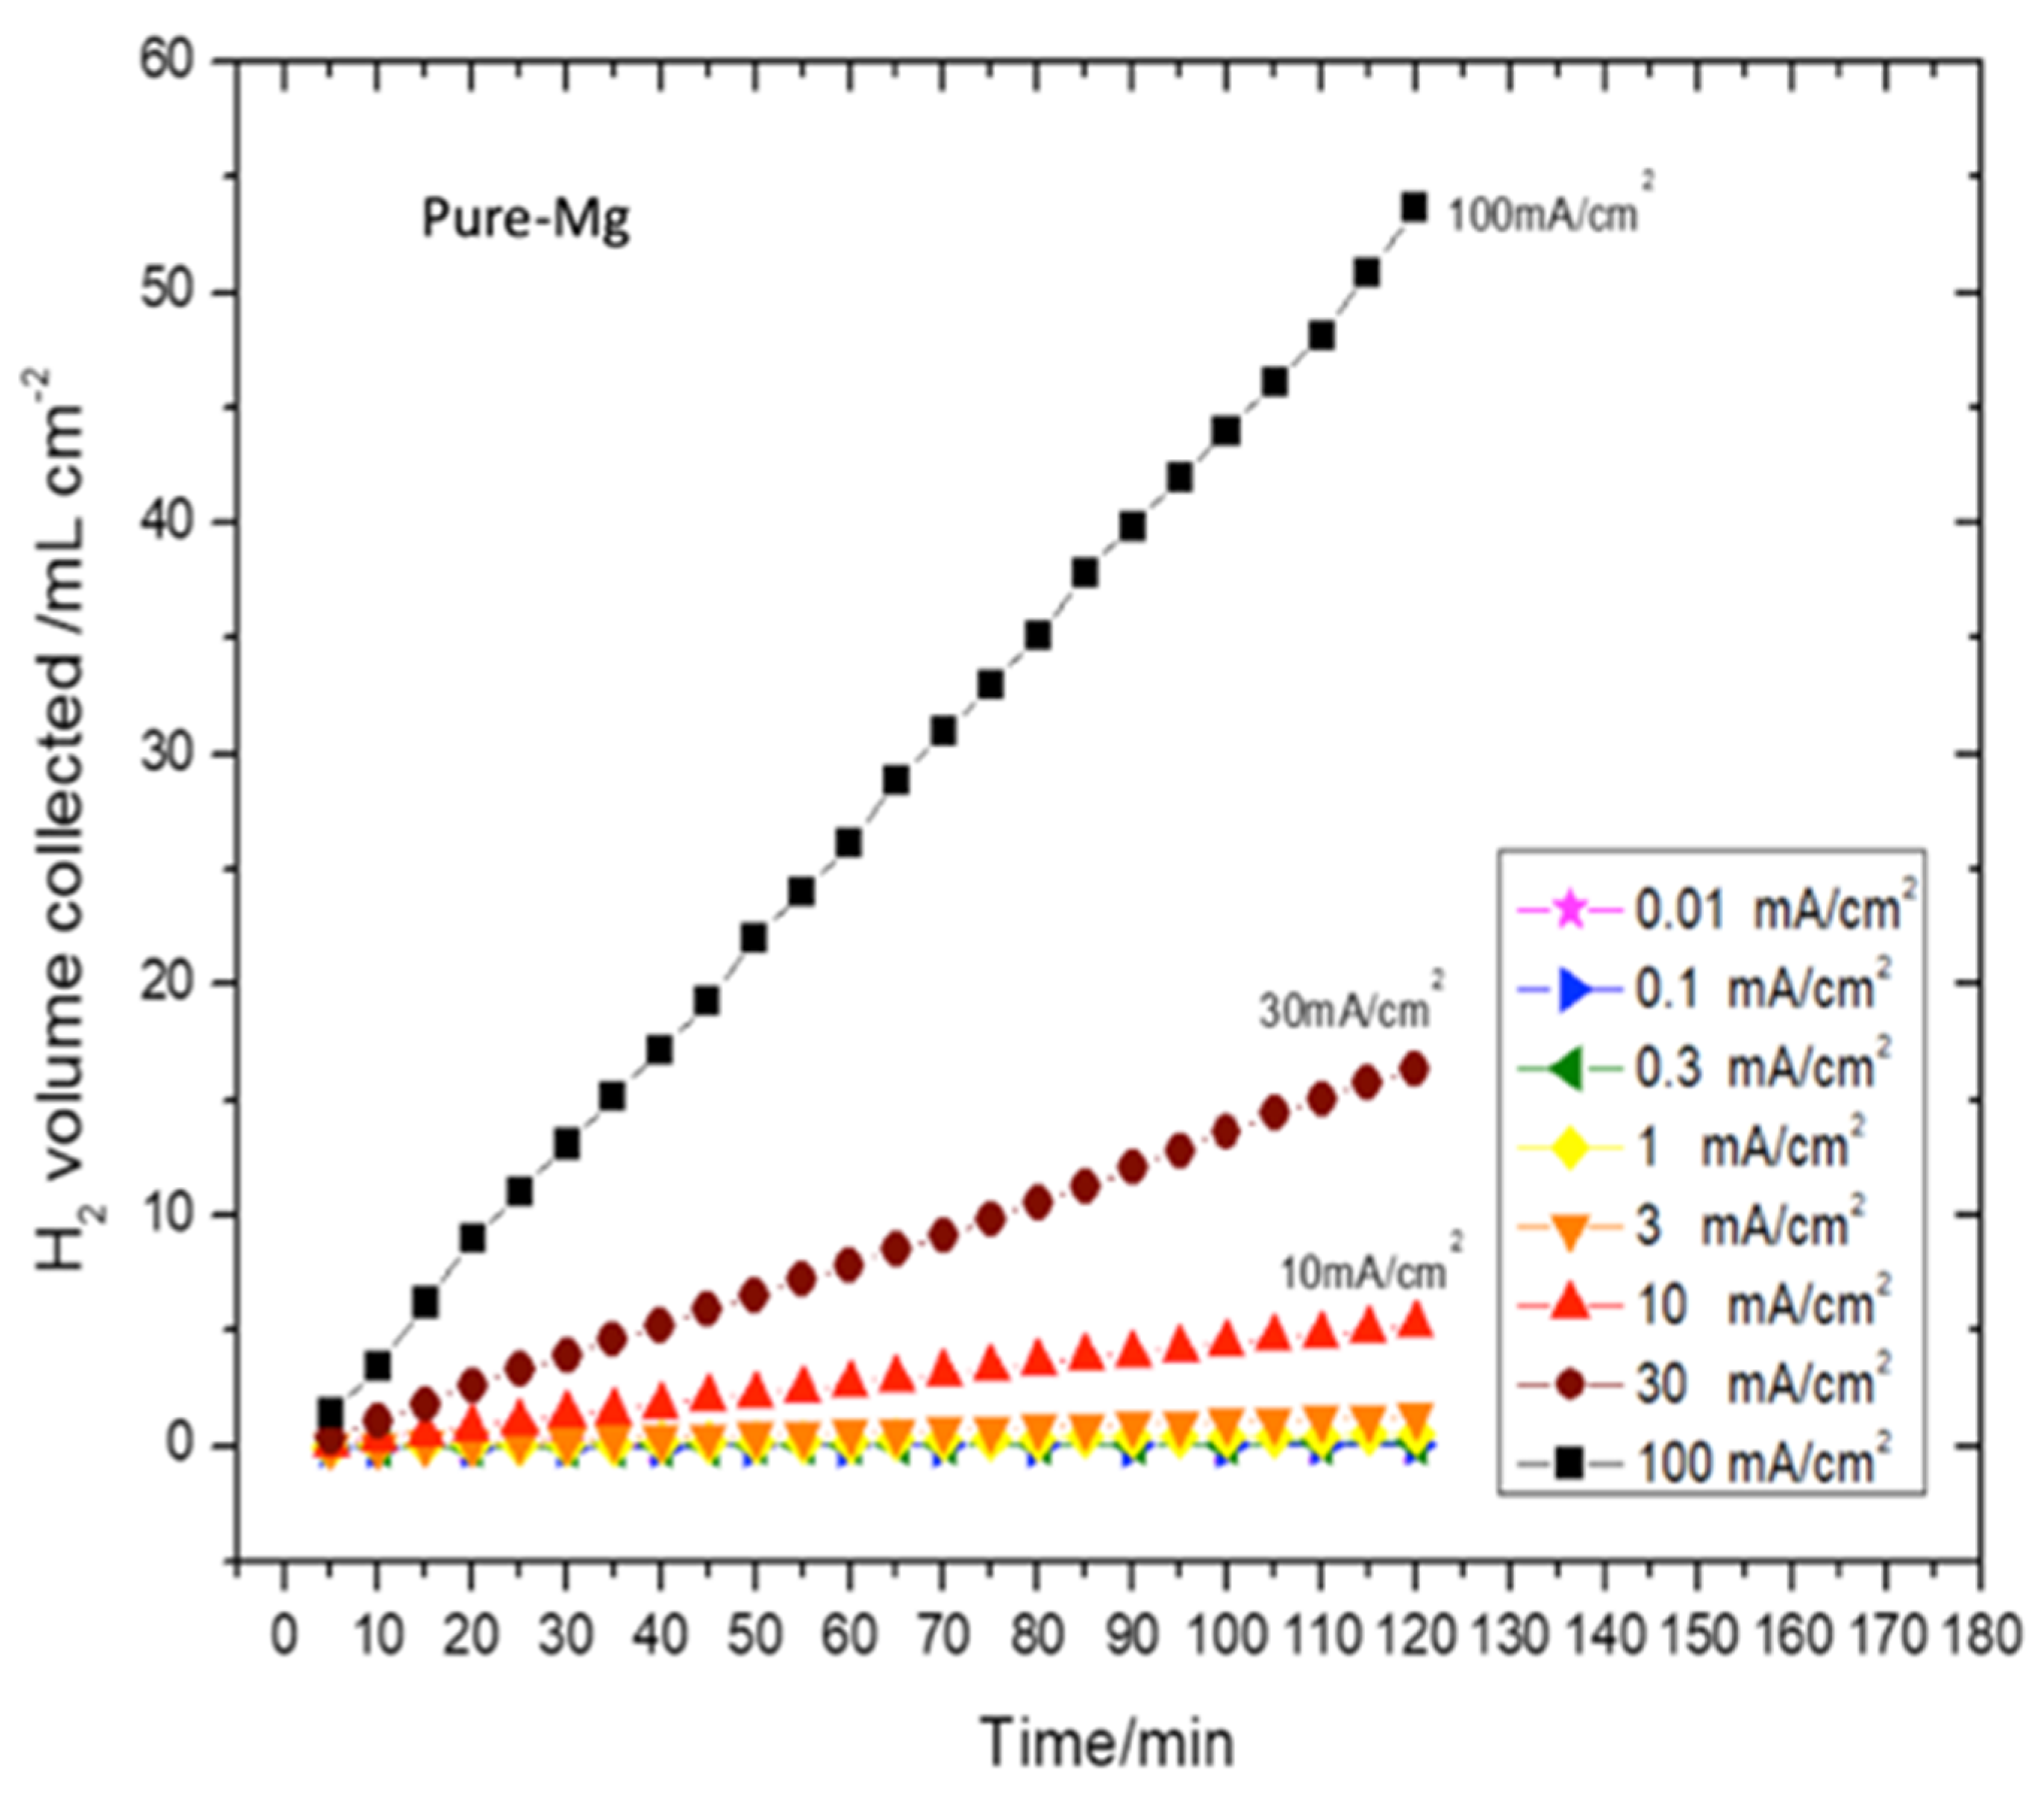
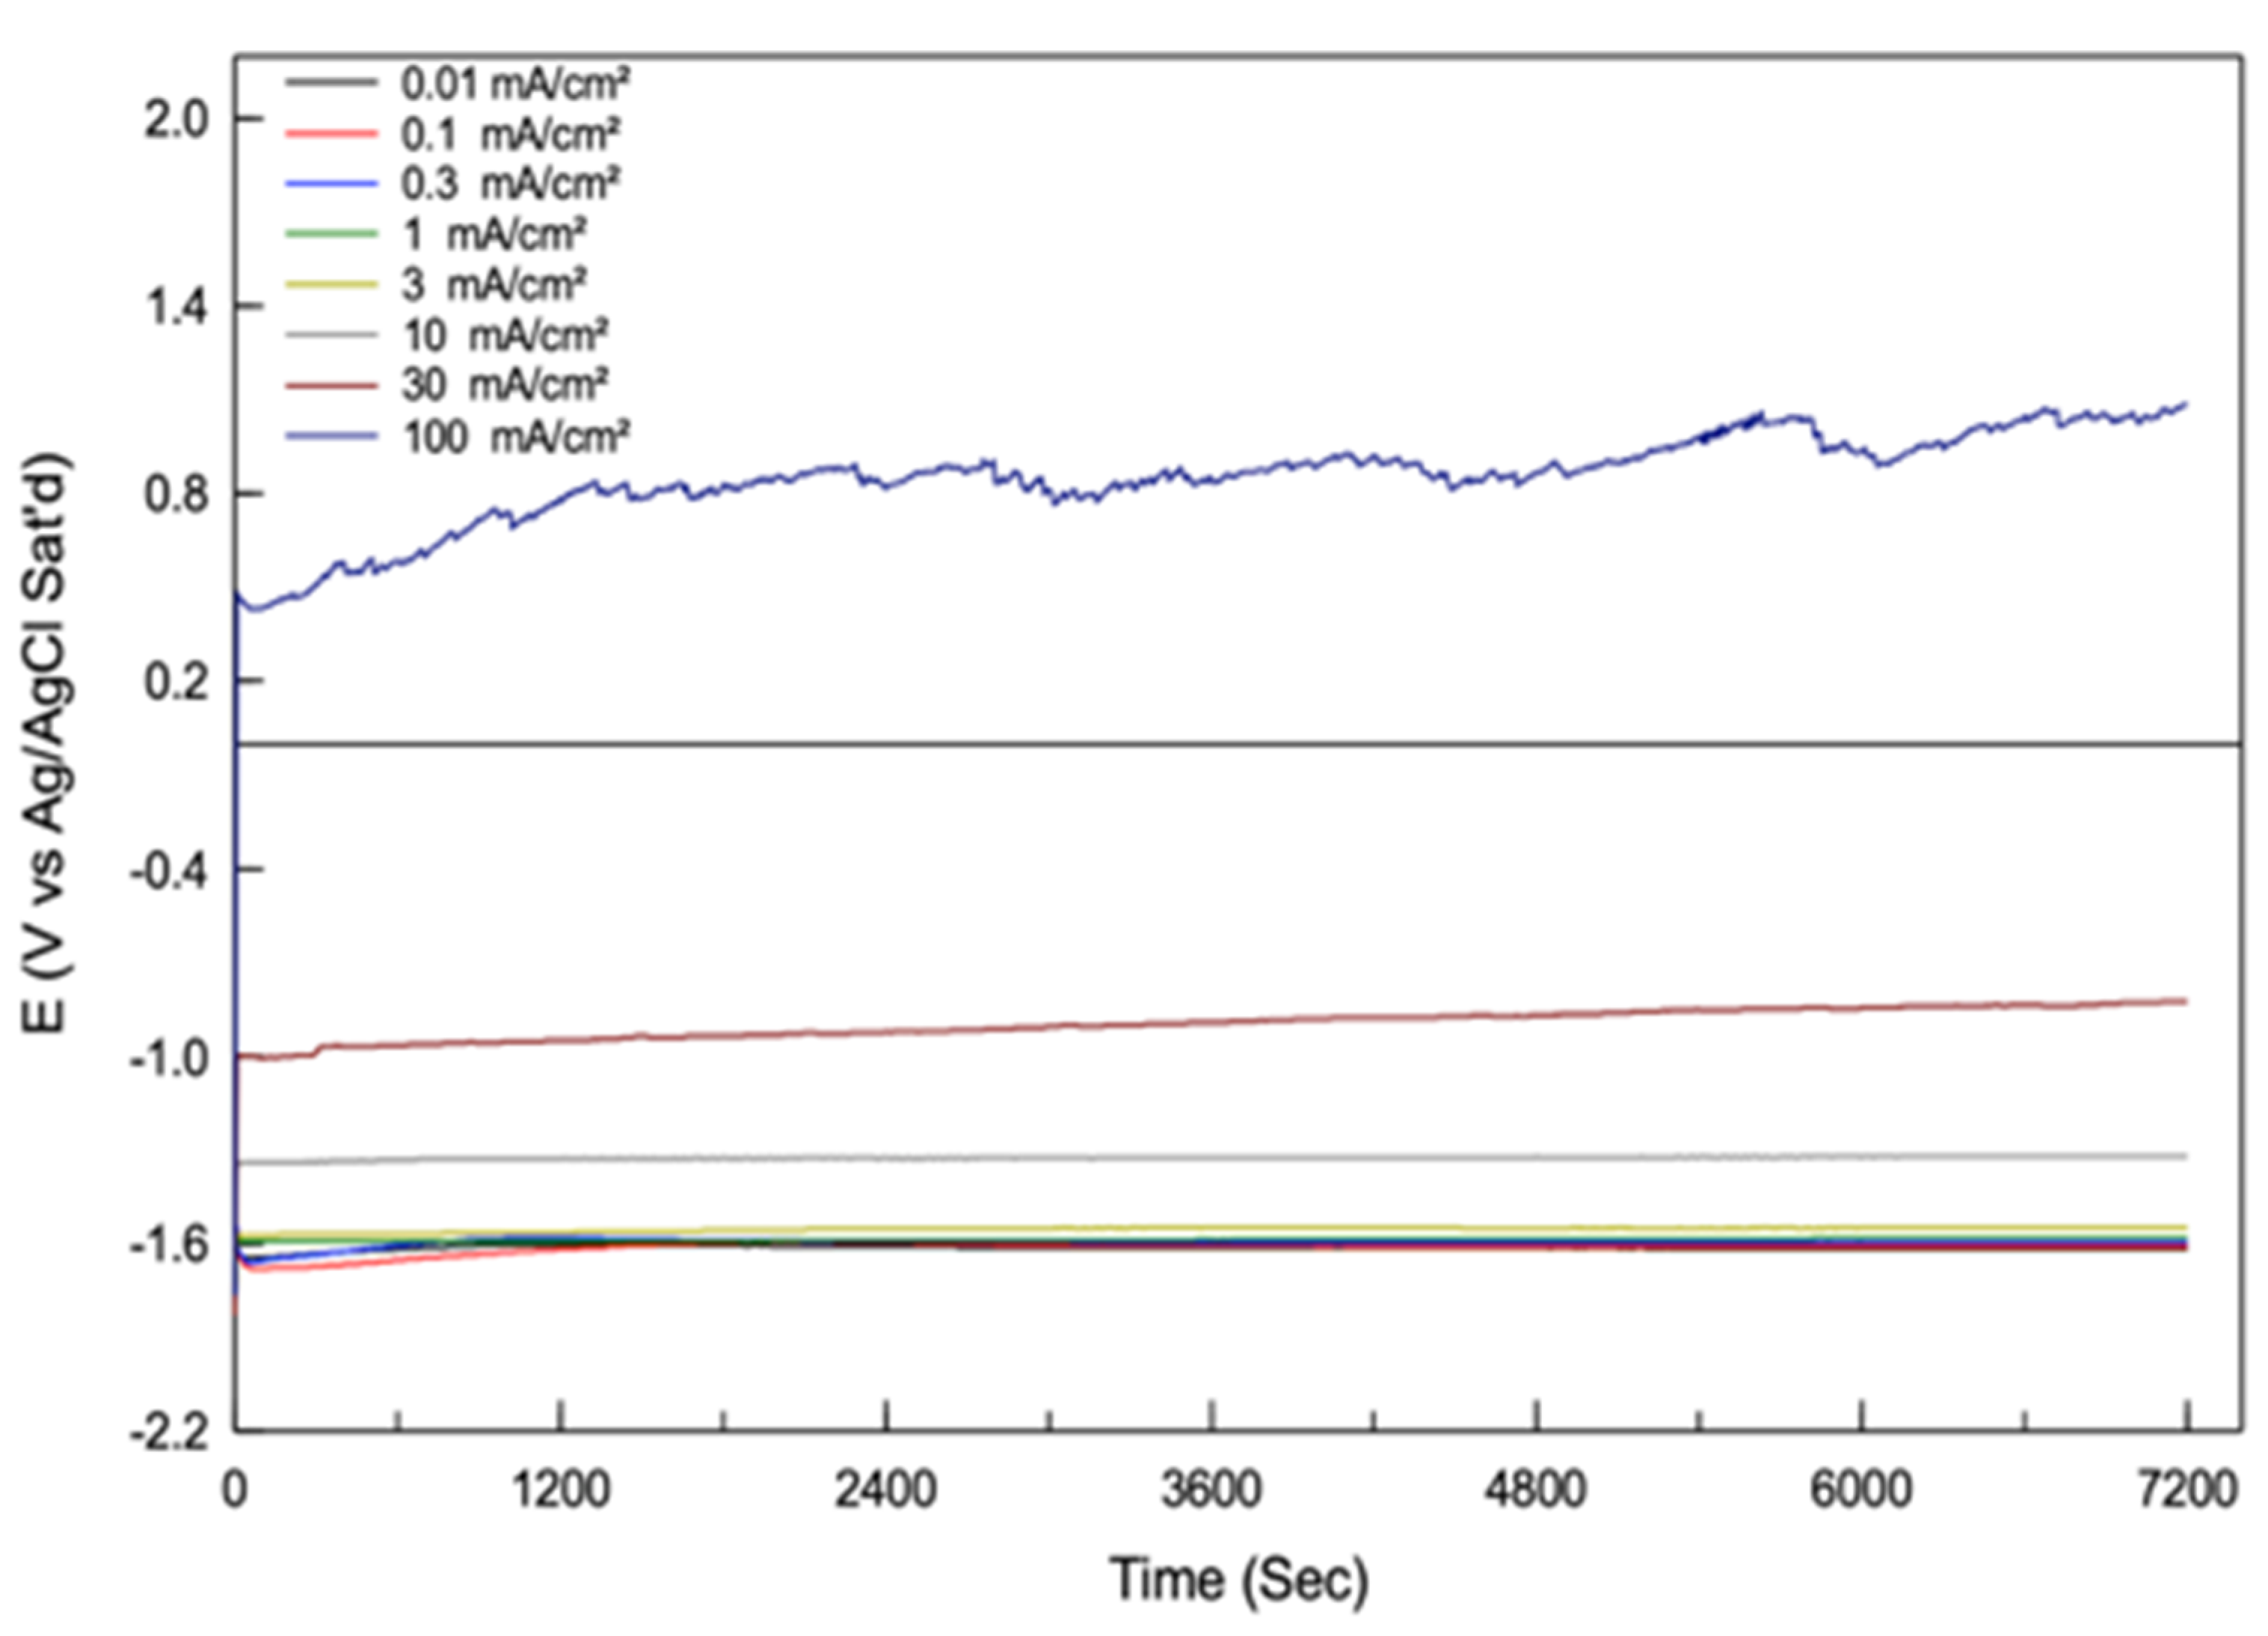
92] measured the volume of anodic hydrogen evolved on anodic polarization as presented in
Figure 11, and measured the potential of the Mg electrode during each anodic polarization as shown in
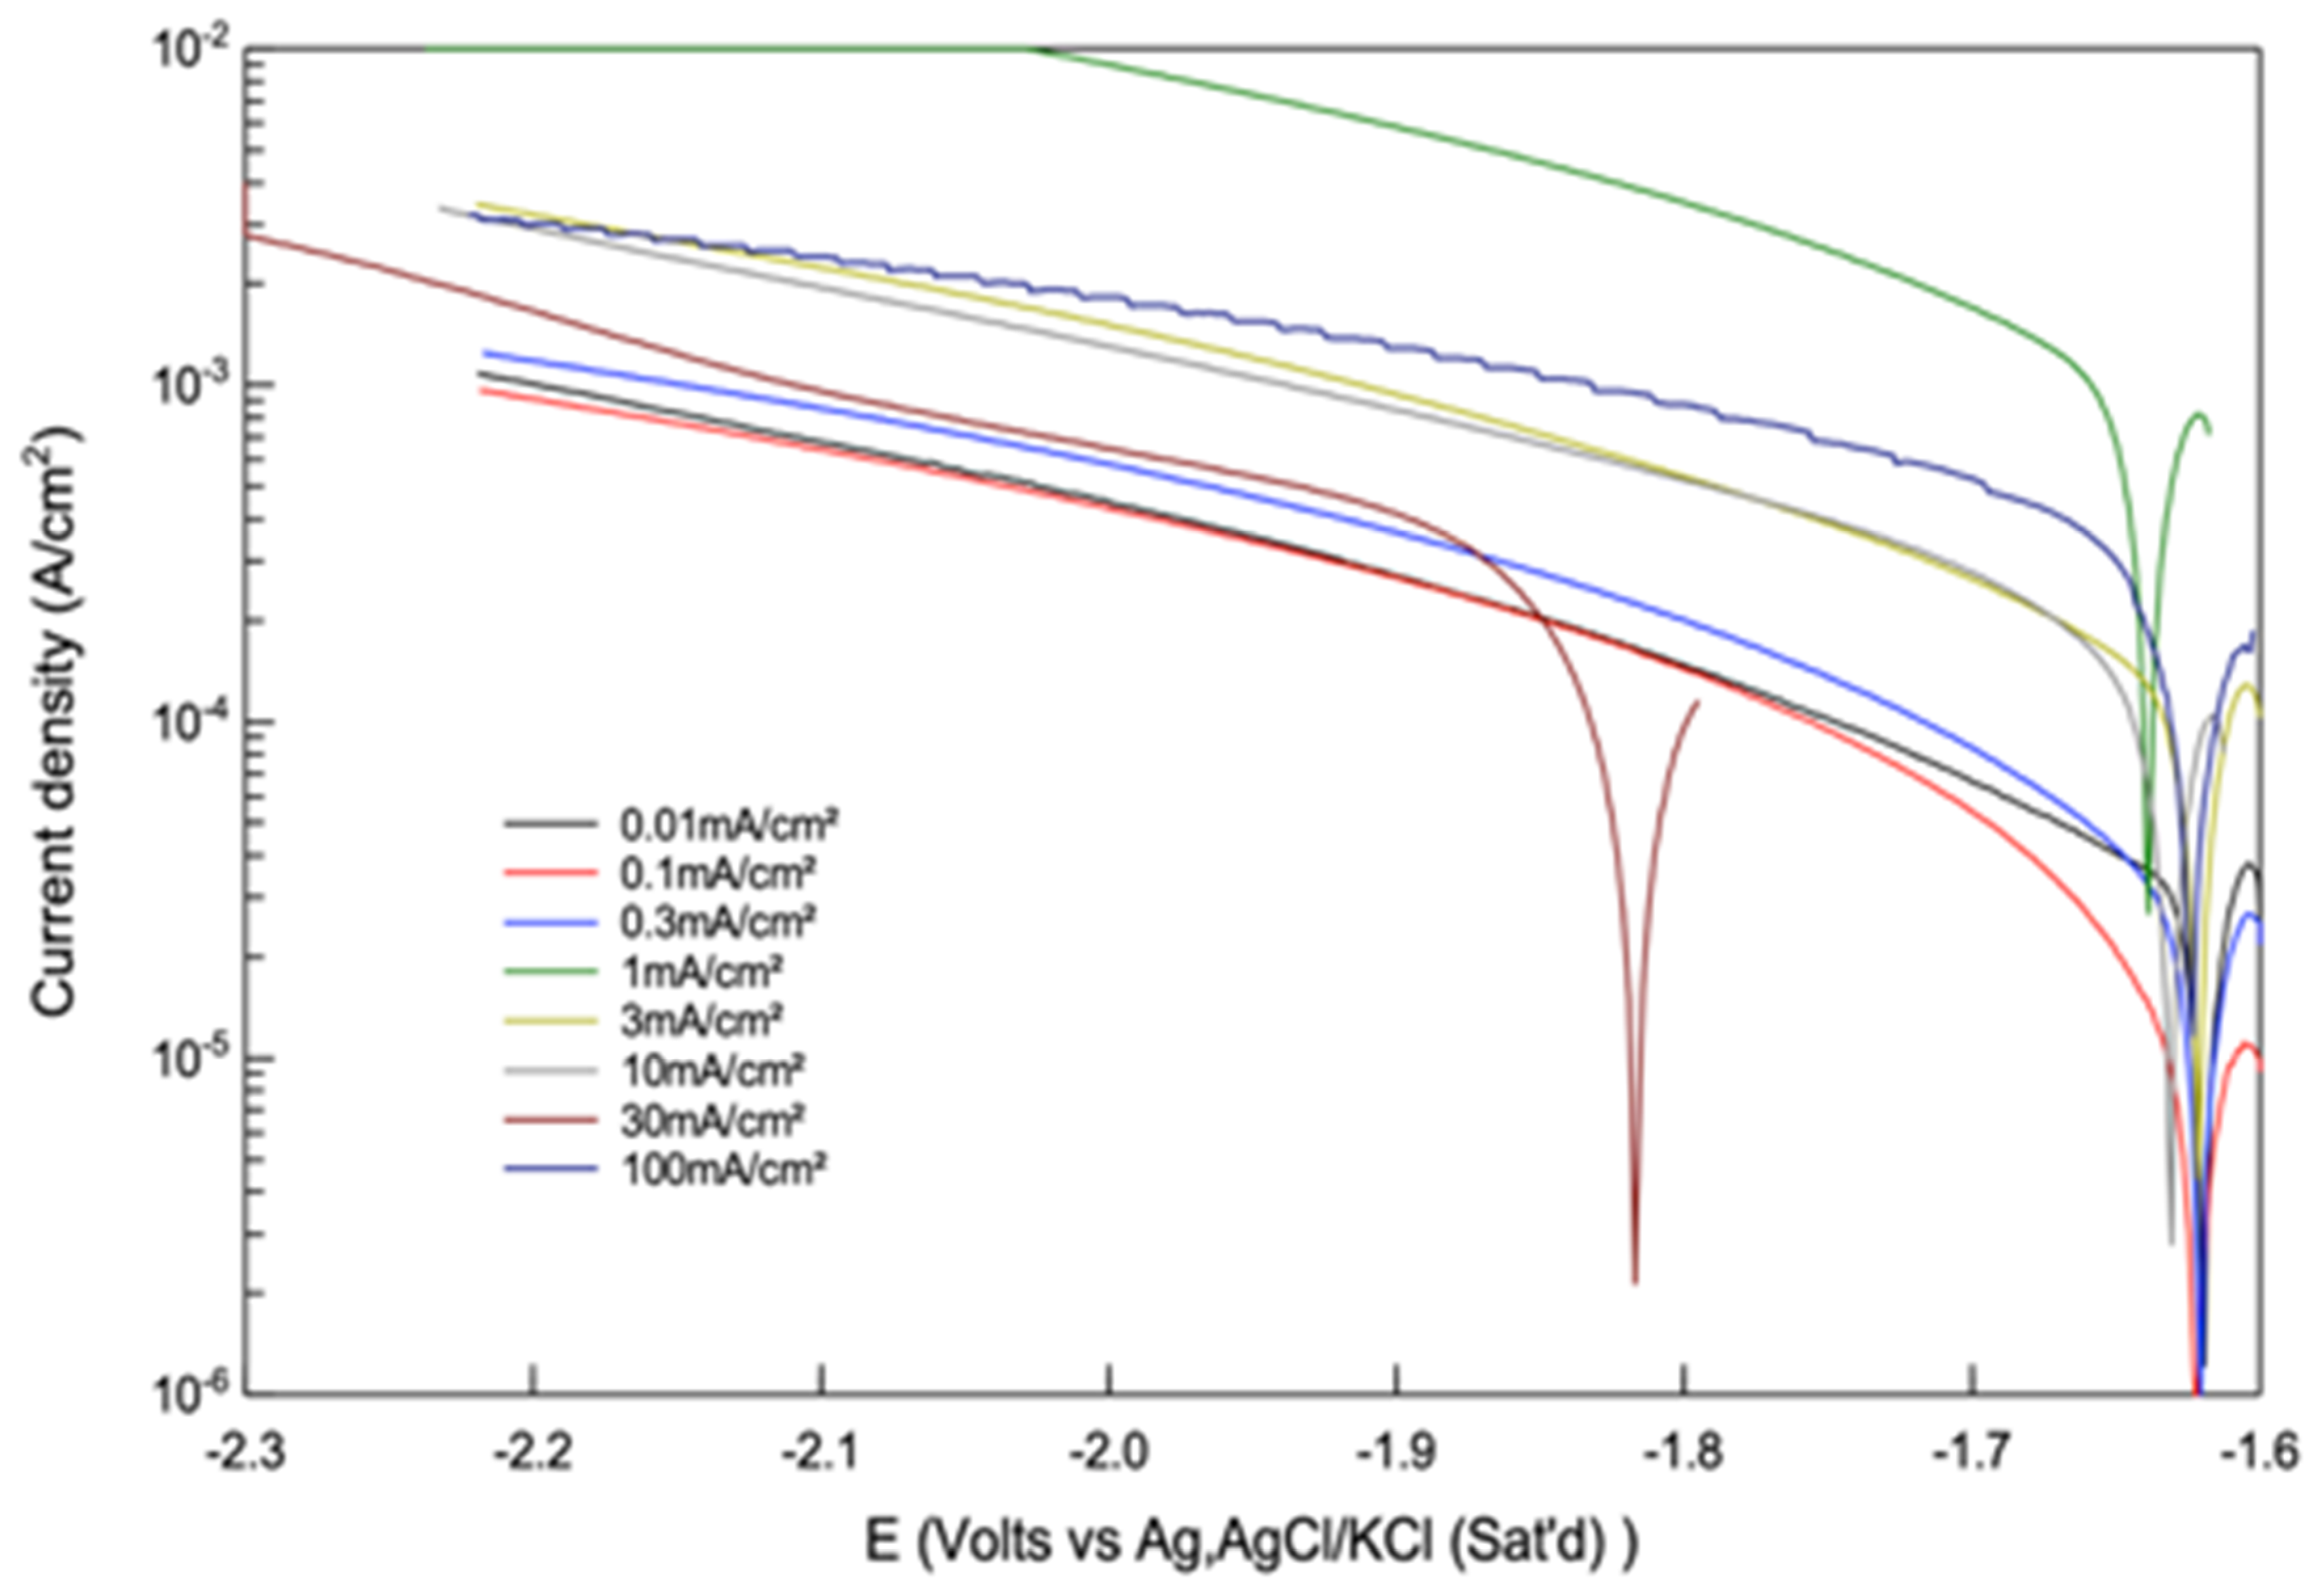
Figure 12. The cathodic hydrogen evolution was characterized by the measurement of the cathodic polarization curve as shown in
Figure 13, immediately after each anodic polarization experiment. Extrapolation of each cathodic curve to the potential during the anodic polarization as presented in
Figure 12 yielded the “enhanced” cathodic evolution rate corresponding to each anodic hydrogen evolution rate for that anodic polarization. This “enhanced” cathodic hydrogen evolution rate is plotted in
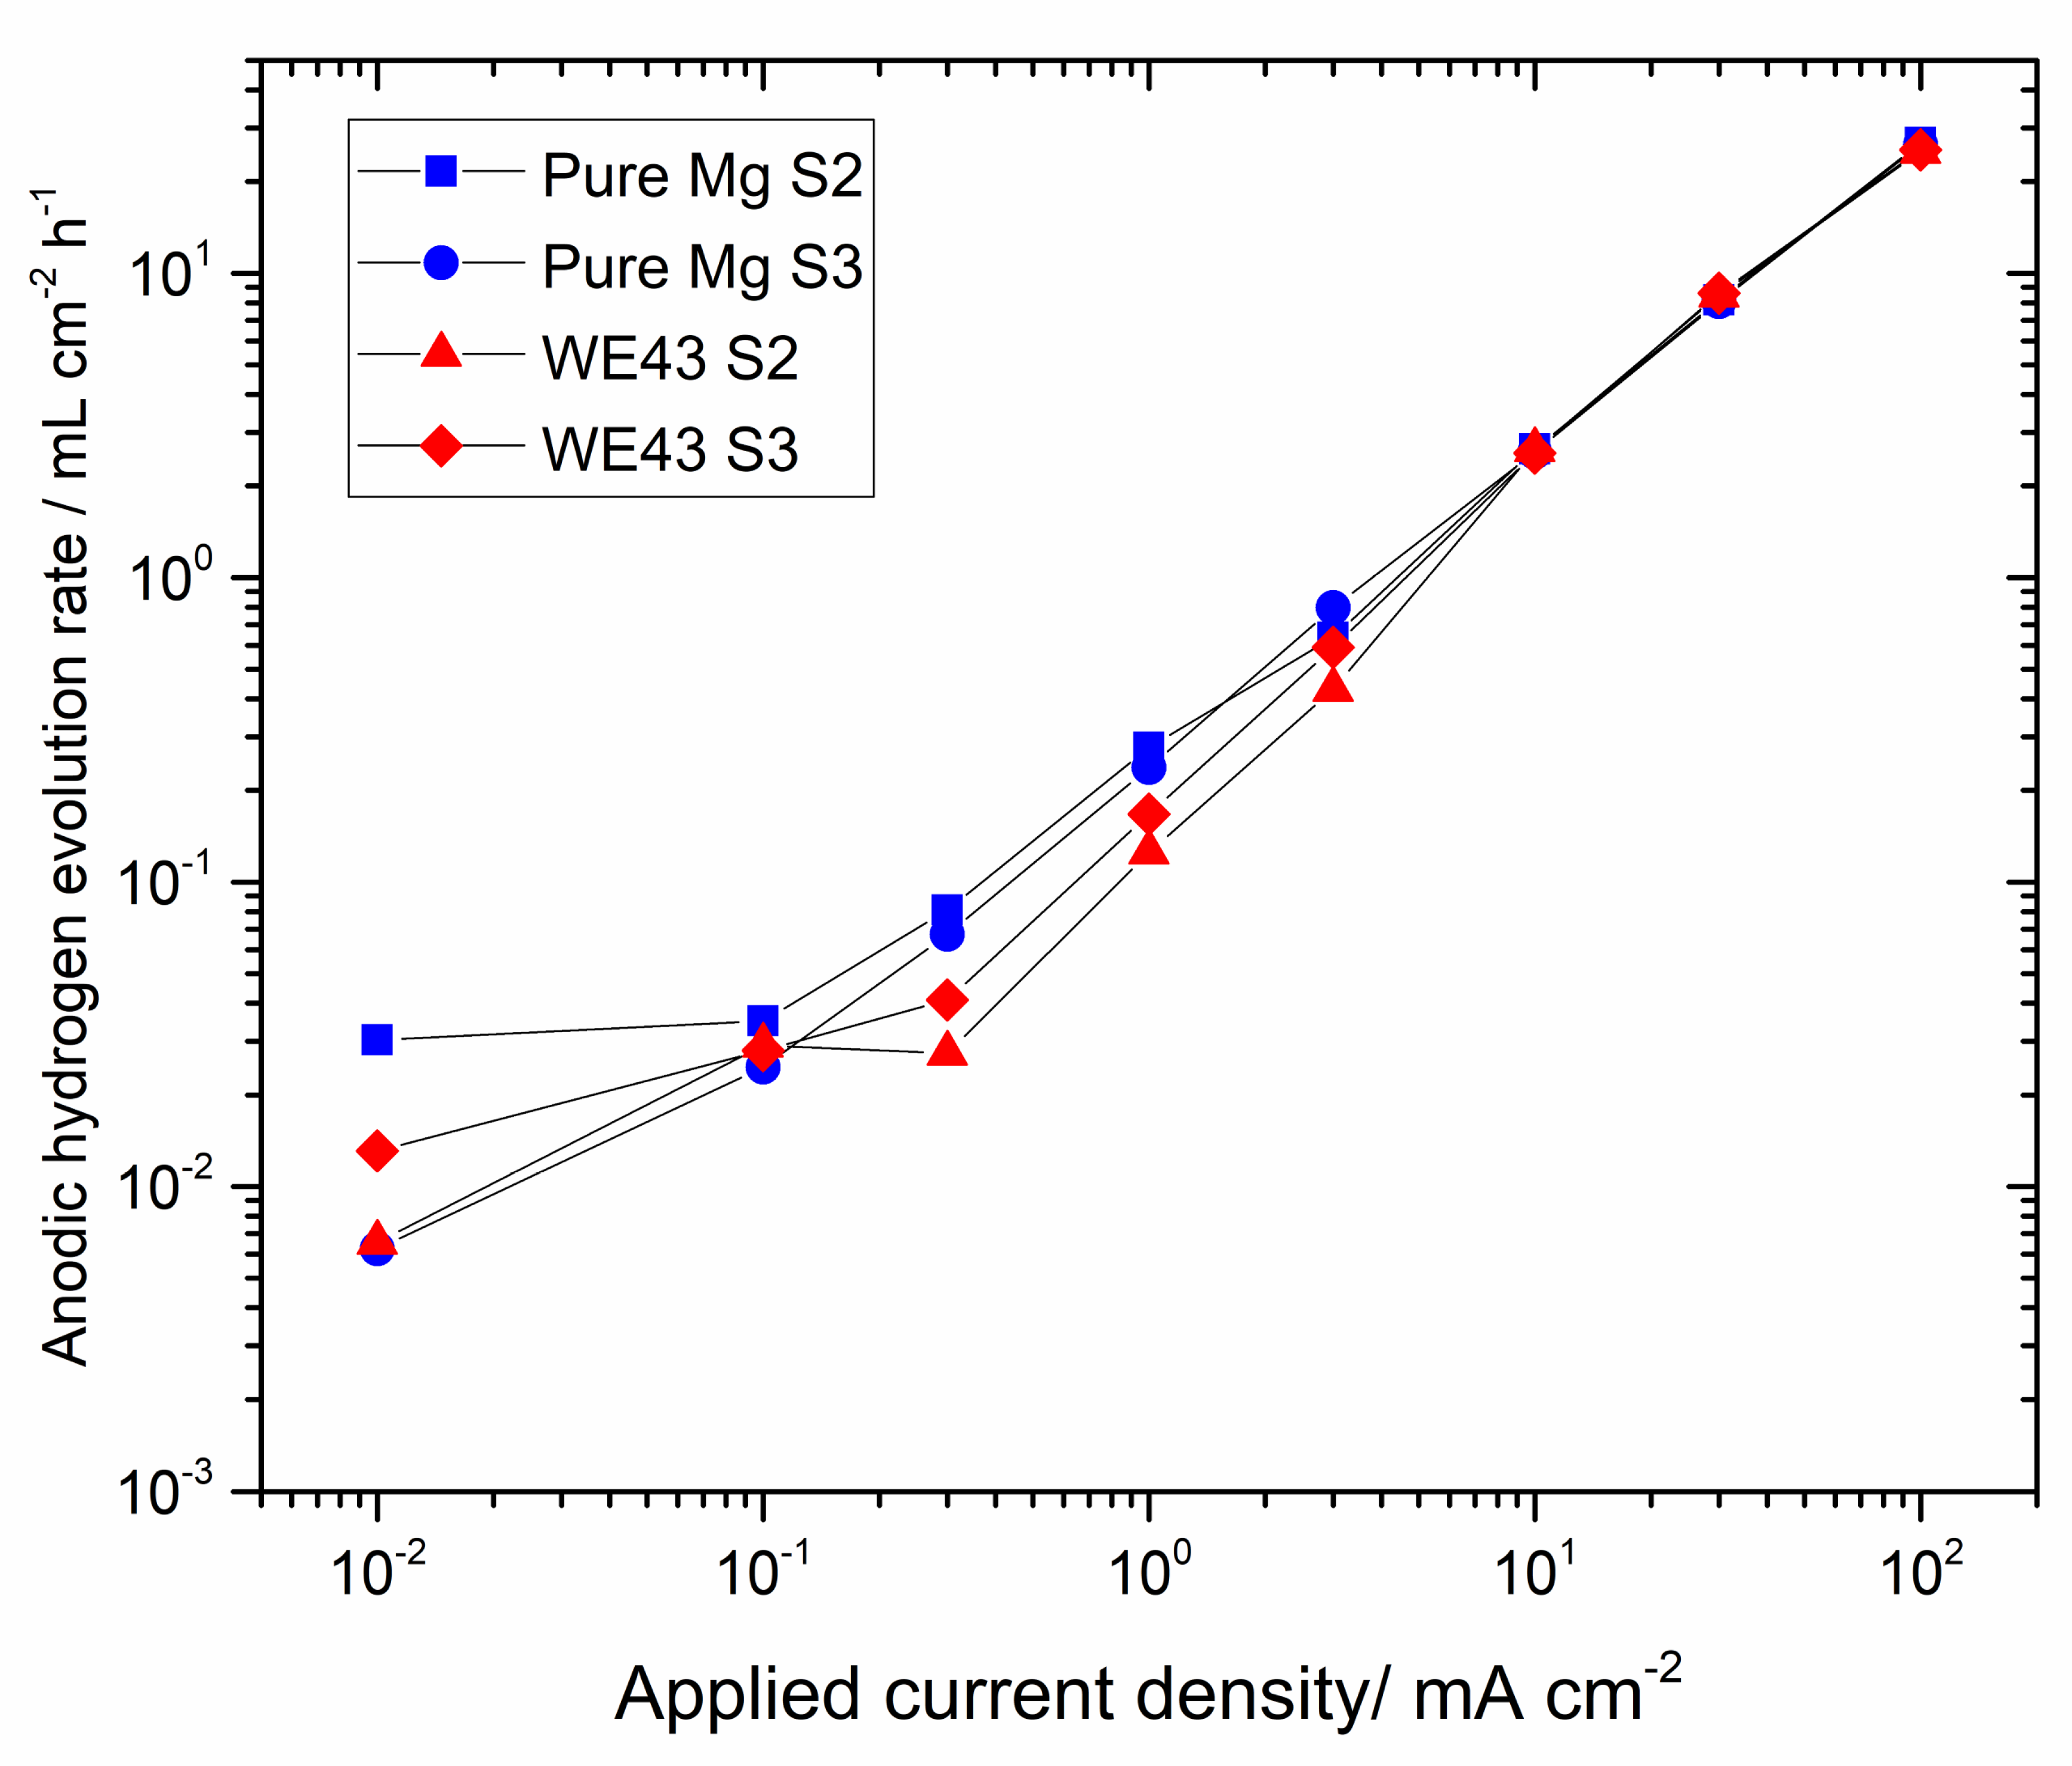
Figure 14 to allow a direct comparison with the anodic hydrogen evolution rate. The enhanced catalytic evolution mechanism predicts that the “enhanced” cathodic hydrogen evolution rate must be equal to the anodic hydrogen evolution rate.
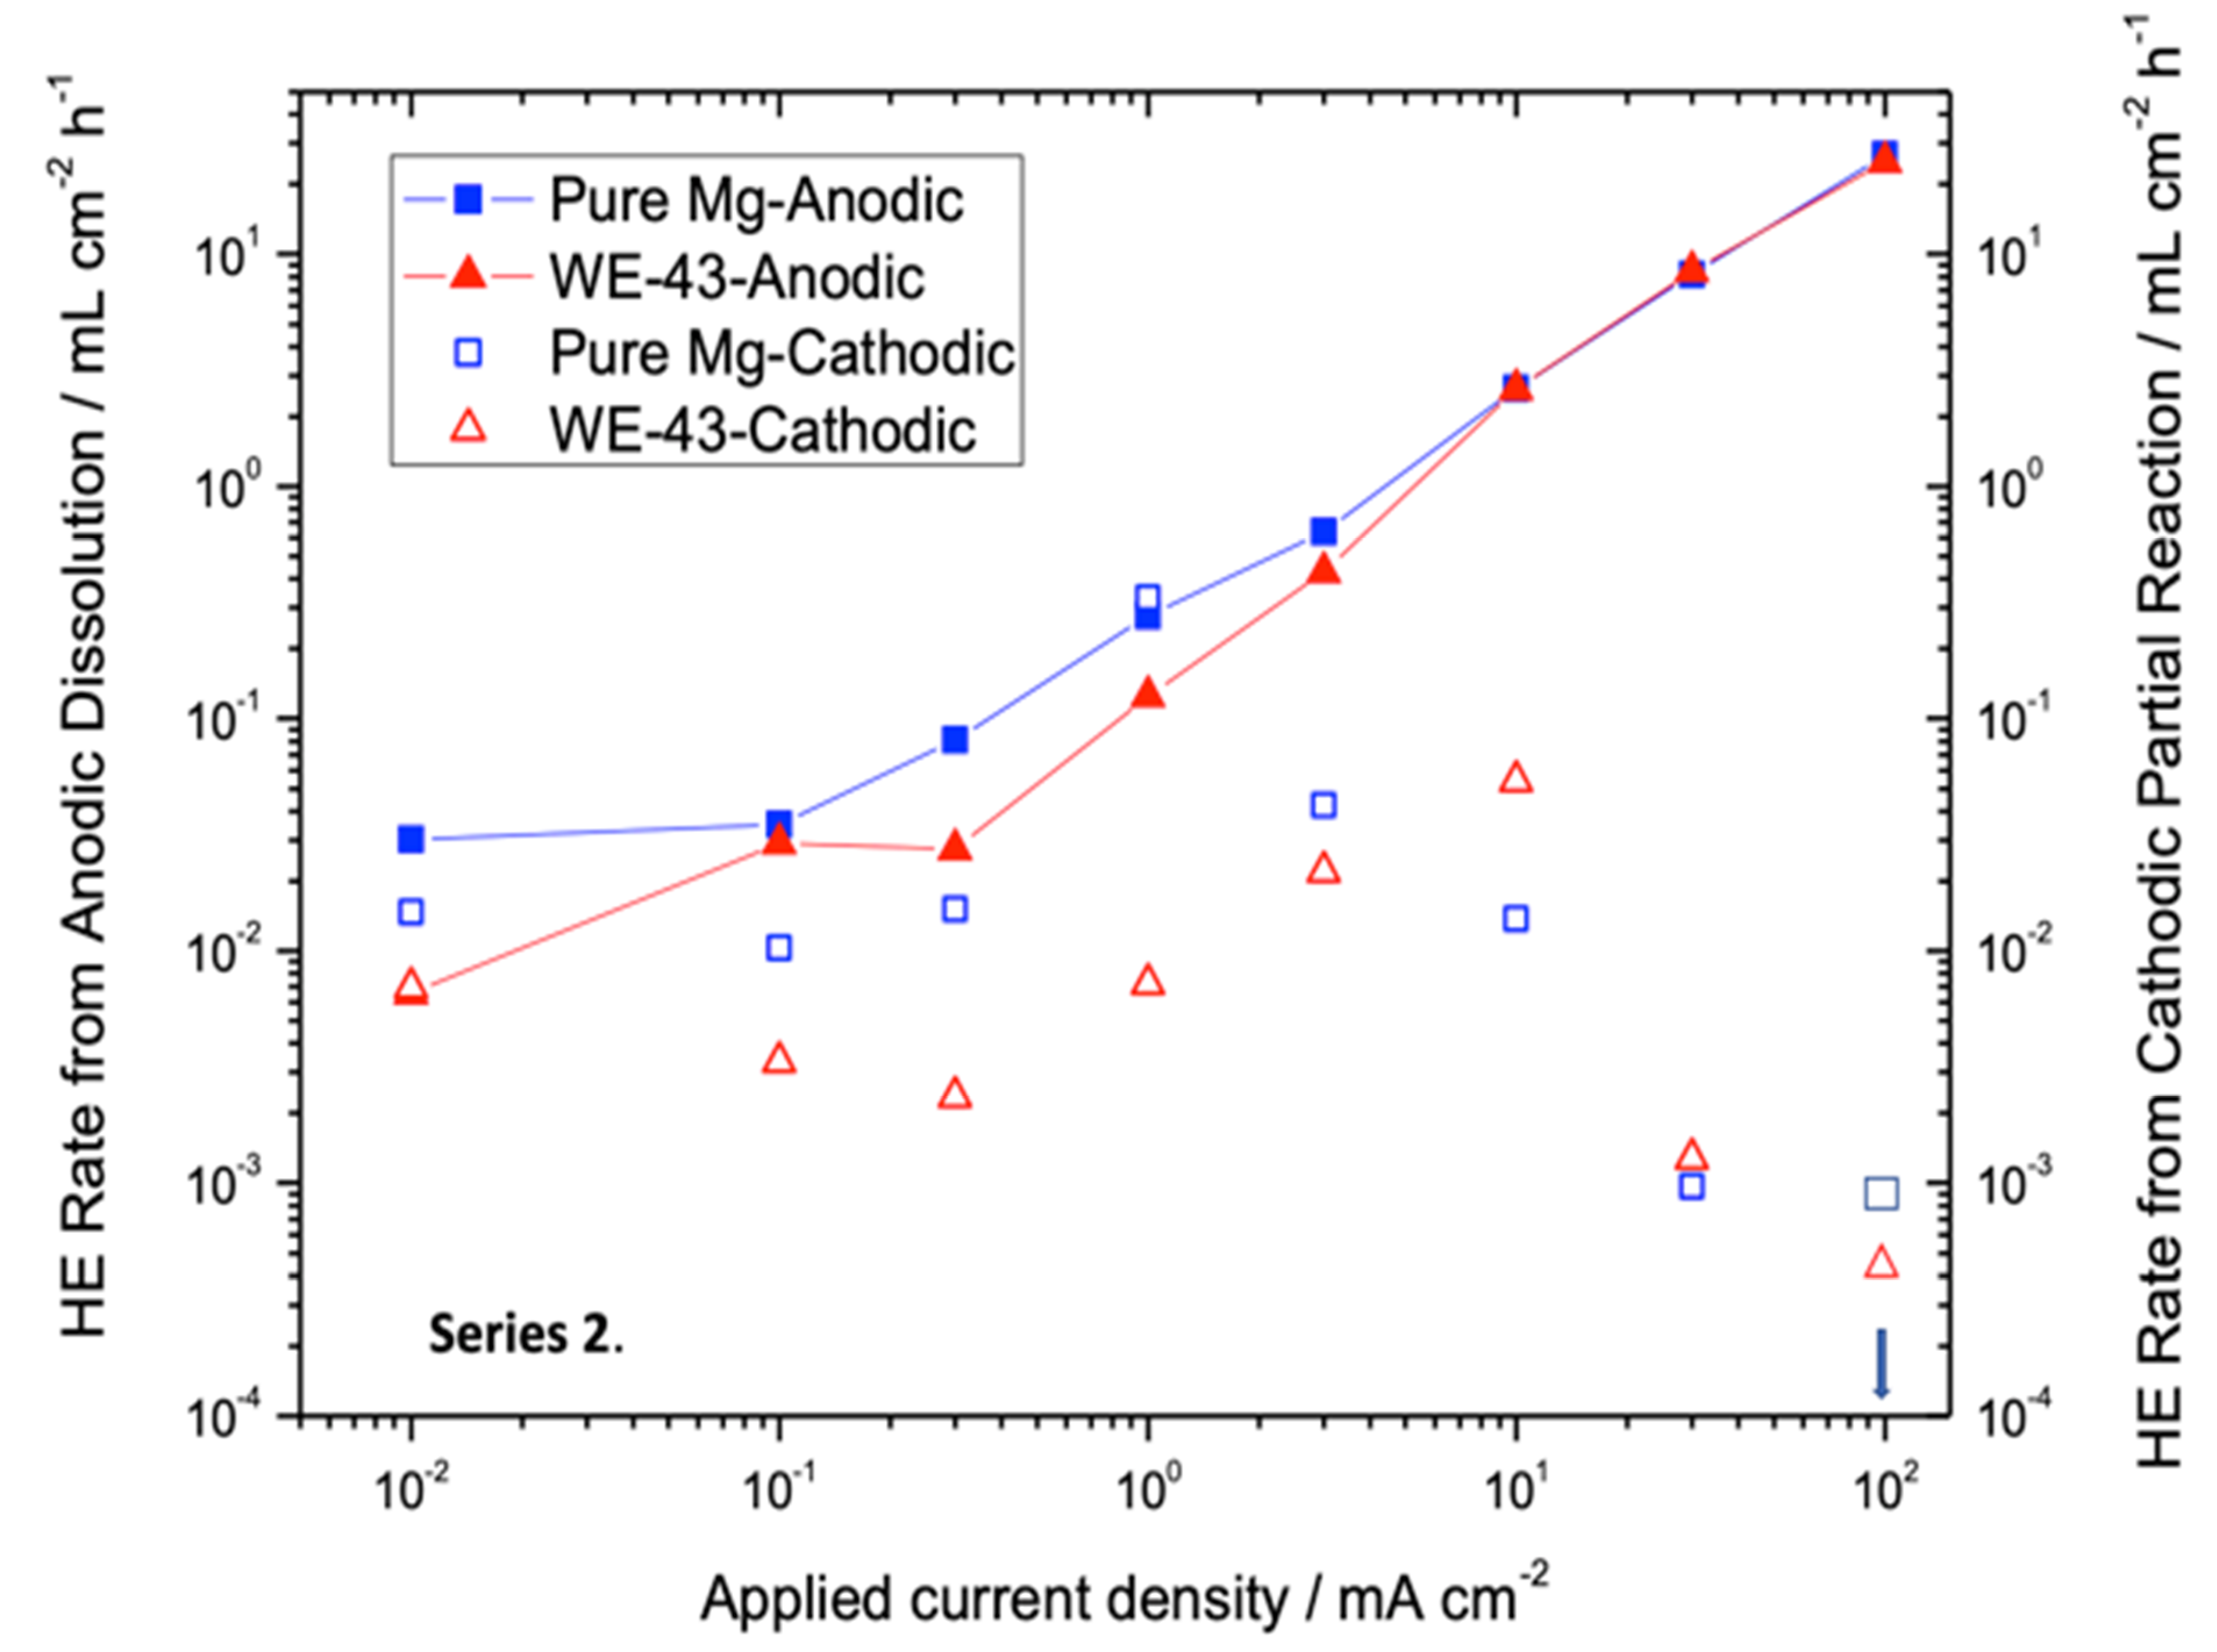
Figure 14 presents the “enhanced” cathodic hydrogen evolution rate (open symbols) as evaluated from
Figure 13 plotted together with the anodic hydrogen evolution rate (closed symbols) as a function of the applied anodic current density to allow a direct comparison with the anodic hydrogen evolution rate. The enhanced catalytic evolution mechanism predicts that the “enhanced” cathodic hydrogen evolution rate must be equal to the anodic hydrogen evolution rate. The fact that the “enhanced” cathodic hydrogen evolution rate was significantly less than the anodic hydrogen evolution rate for substantial applied anodic current densities indicates that experimental evidence contradicts the enhanced catalytic activity mechanism of Mg corrosion.
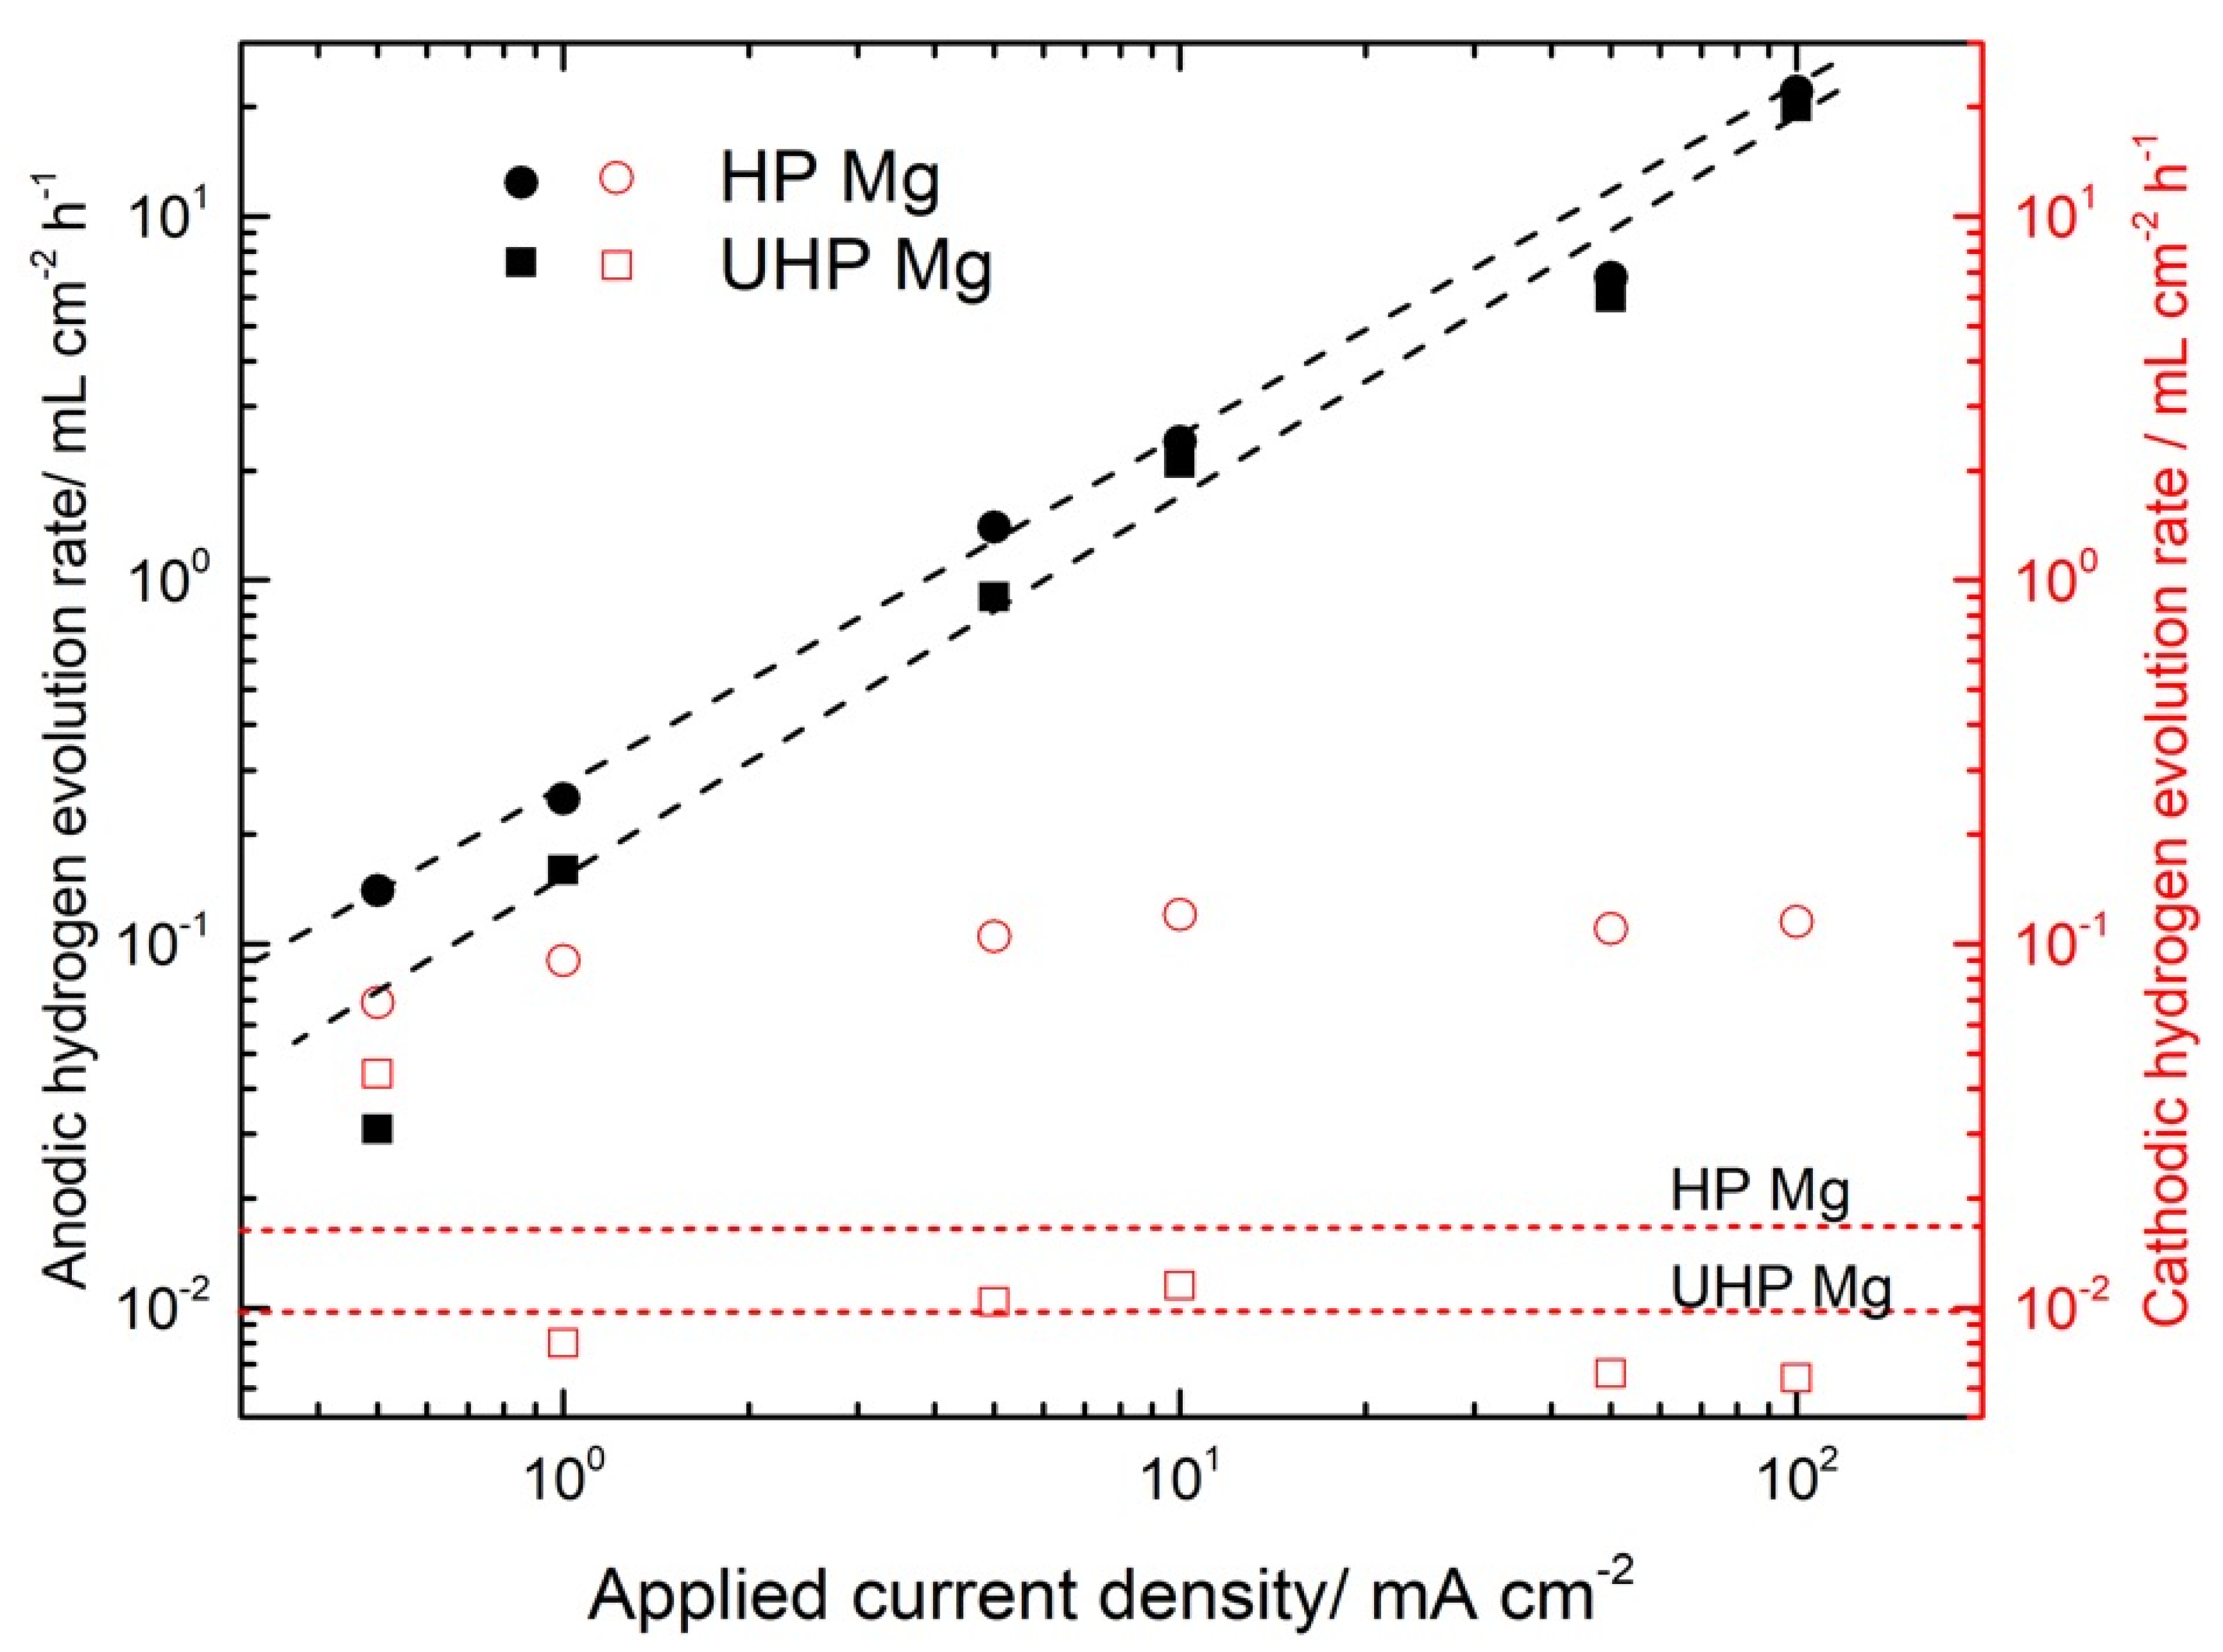
Figure 15 provides similar plot replotted from the work of Fajardo and Frankel [
95], who made measurements similar to those described above from the work of Li et al. [
92]. The enhanced catalytic evolution mechanism predicts that the “enhanced” cathodic hydrogen evolution rate must be equal to the anodic hydrogen evolution rate. The fact that the “enhanced” cathodic hydrogen evolution rate (open symbols) was significantly less than the anodic hydrogen evolution rate (closed symbols) for substantial applied anodic current densities in
Figure 15 indicates that experimental evidence contradicts the enhanced catalytic activity mechanism of Mg corrosion.
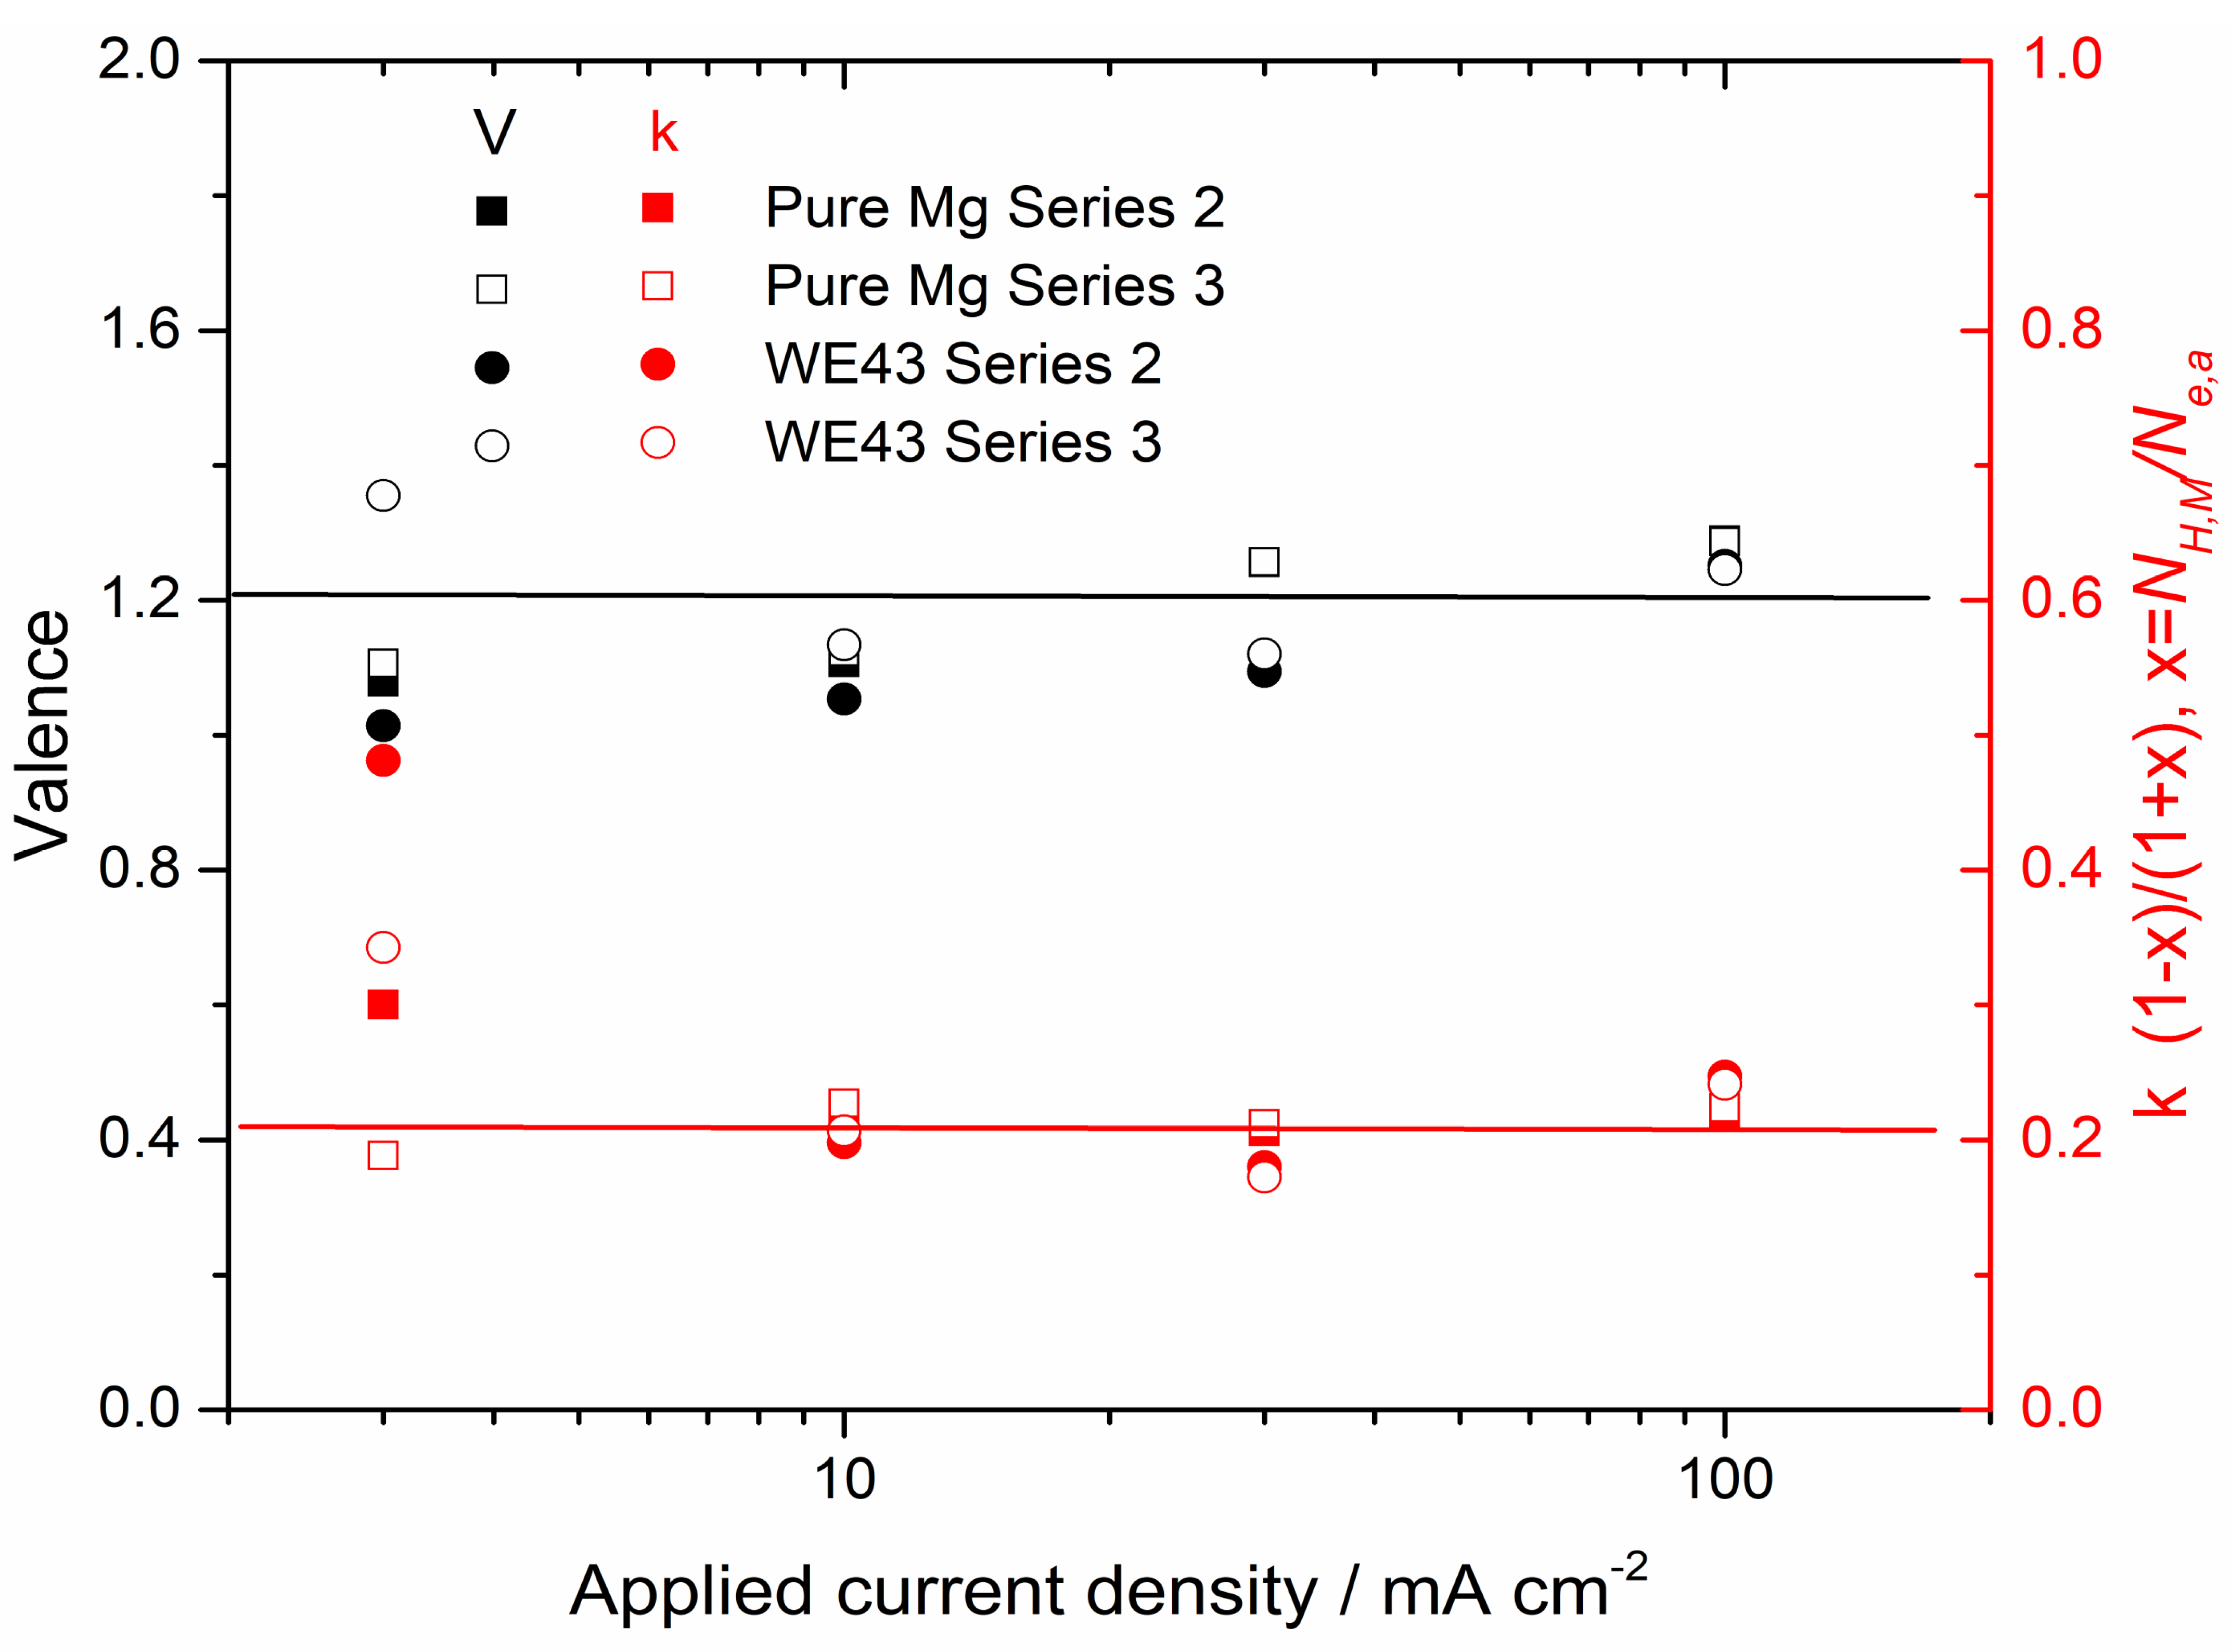
Figure 16 provides a further test for the enhanced catalytic activity mechanism of Mg corrosion from the data measured by Li et al. [
92]. As stated above, the enhanced catalytic activity mechanism of Mg corrosion assumes that the anodic partial reaction for Mg corrosion occurs in one step by the simultaneous exchange of two electrons as presented in Equation (4). This means that he enhanced catalytic activity mechanism of Mg corrosion predicts that the apparent valence of Mg during Mg must be equal to 2.0.
Figure 16 plots the measured apparent Mg valence from the work of Li et al. [
92]. The apparent valence of Mg,
V, was evaluated as
where
NW (mmol cm
−2 h
−1) is the flux of Mg atoms corresponding to the measured weight loss rate and
Ne,a (mmol cm
−2 h
−1) is the corresponding electron flux corresponding to the anodic partial reaction,
Ia, driven by the applied current density,
Iapplied, where
Ne,a is given by
where
Ic is the cathodic current density and
F is the Faraday. Thus, Equation (6) allows evaluation of the number of electrons produced by the anodic partial reaction per Mg atom during the anodic polarization experiment.
A value of apparent Mg calence
V = 2.0 is predicted by the enhanced catalytic activity mechanism of Mg corrosion. A value of
V = 1.2 is shown in
Figure 16 evaluated from the above experimental results of Li et al. [
92]. This provides further experimental evidence in contradiction to the enhanced catalytic activity mechanism of Mg corrosion.
This value of apparent Mg valence V = 1.2 is as expected by the uni-positive Mg+ mechanism as explained in the next section.
8. Uni-Positive Mg+ Mechanism
Quantum mechanics forbids the simultaneous transfer of two electrons [
96]. In addition, the first principles research of Ma et al. [
97,
98] indicates that it is much easier for a Mg atom to lose two electrons sequentially than in one step. Thus, it is expected that there are a number of elementary steps in the overall anodic partial reaction of Mg corrosion as indicated by Equation (4). Thus, a simplified reaction sequence for the Mg corrosion reaction at steady state is as follows. The anodic partial reaction can be considered to occur in two steps as follows, whereby a fraction designated as k reacts electrochemically to produce Mg
++.
The total anodic partial reaction (made up of Equations (8) and (9)) is balanced by the following cathodic partial reaction:
The complementary fraction (1 − k)Mg
+ reacts chemically with water as follows:
The reaction sequence made up of Equations (8)–(11) sums up to provide the overall Mg corrosion reaction as given by Equation (1). However, the apparent Mg valence is less than 2.0 because (1 − k) Mg+ reacts chemically with water and produces no electrons to the external circuit. The apparent Mg valence is predicted to be equal to 1 + k.
Anodic polarization is predicted to increase the number of Mg+ ions which produces more evolved hydrogen as measured experimentally.
In addition, the Mg valance is predicted to be (1 + k) during Mg corrosion by the uni-positive Mg
+ mechanism. This is consistent with the data of
Figure 16, which indicates that
V = 1.2, so that k = 0.2.
Li et al. [
92] also made an independent evaluation of the value of k using the following:
where
NH (mmol cm
−2 h
−1) is the corresponding number of hydrogen atoms. The value of k so evaluated from
Figure 16 is in good congruence of the value of the apparent valence.
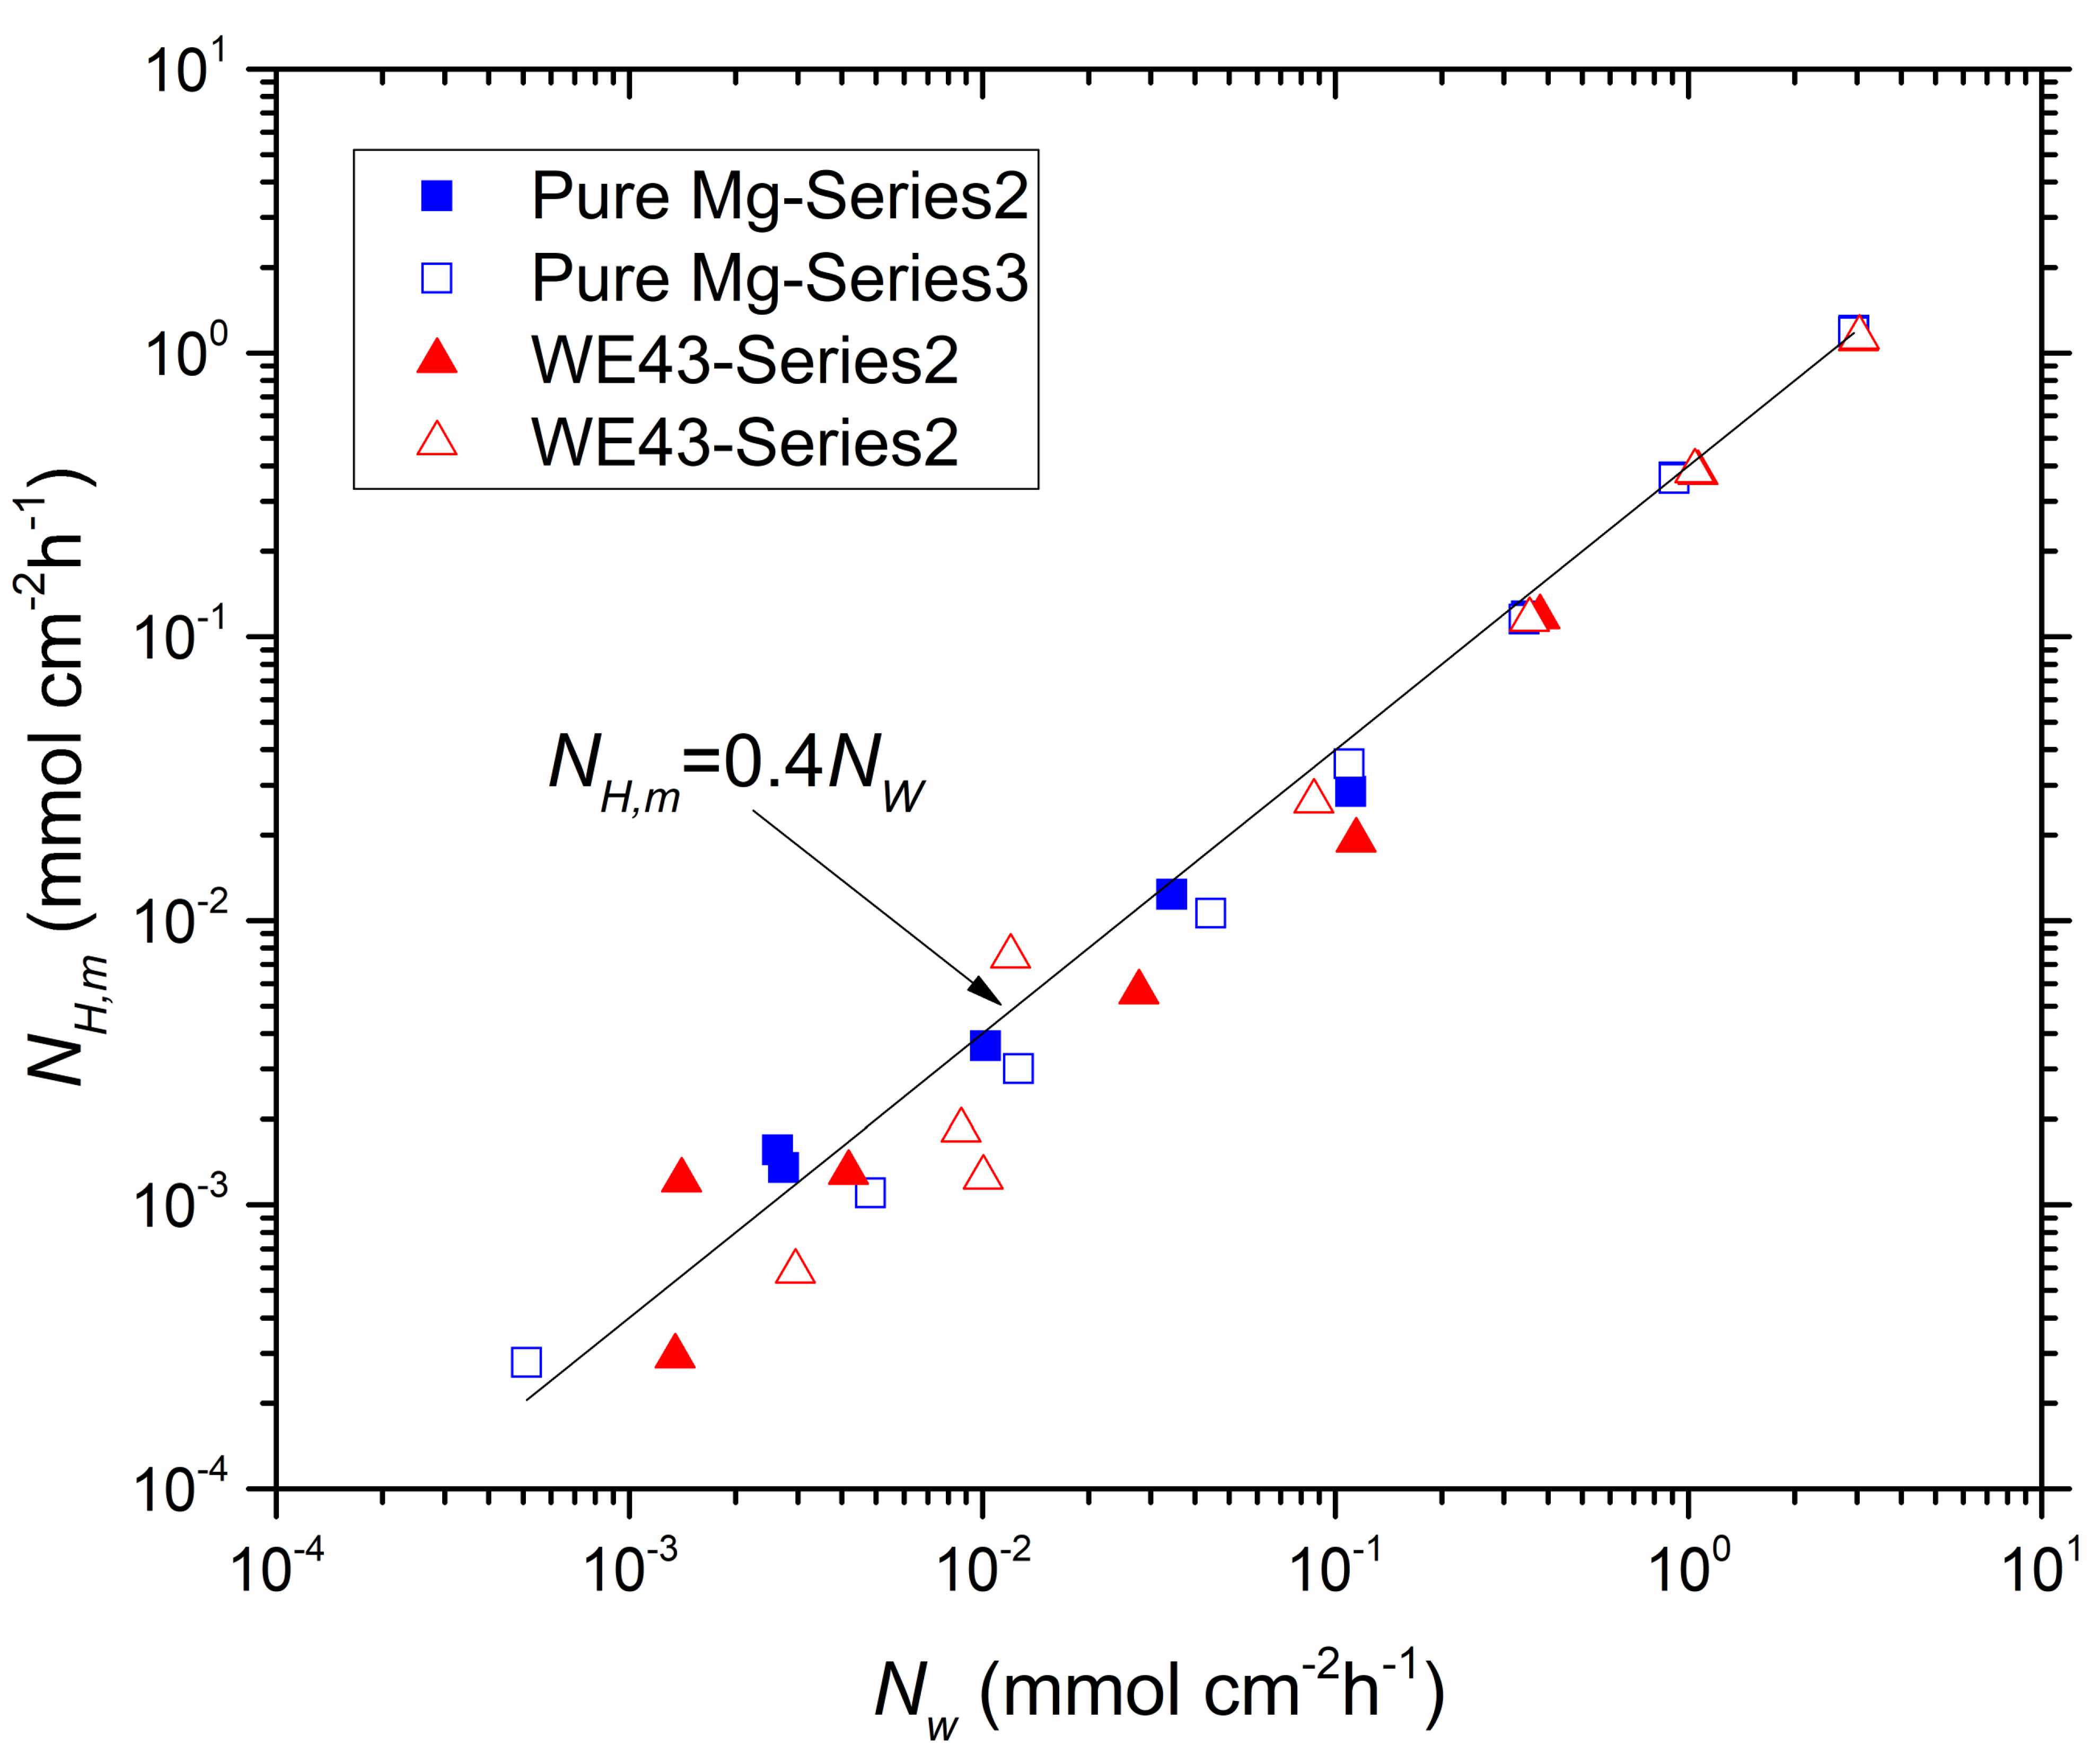
The reaction sequence given by Equations (8)–(11) indicates the following relationship
which indicates
NH/
NW = 0.4 for k = 0.2.
Figure 17 plots
NH against
NW from the experimental data of Li et al. [
92]. The experimental data points are presented. The line drawn is that predicted by Equation (13) and is not a line of best fit through the data. Nevertheless, the line predicted by Equation (13) is a good fit through the experimental data providing further experimental validation for the uni-positive Mg
+ corrosion mechanism.
Thus, strong experimental evidence for the uni-positive Mg+ corrosion mechanism has been provided by (i) an apparent valence of 1.2 during the anodic polarization of pure Mg and the Mg alloy WE43 (where the apparent valence was evaluated from the ratio of Ne,a/NW, ((the number of electrons taking part in the anodic partial reaction)/(the number of Mg atoms)), (ii) that the fraction k of Mg+ ions electrochemically oxidized to Mg2+ was measured to be 0.2 during anodic polarization of pure Mg and WE43 in agreement with the measured apparent valence of 1.2, and (iii) that the evolution rate of hydrogen, NH, increased linearly with the weight loss rate of Mg, NW, and that NH/NW = 0.4 consistent with k = 0.2 and the value of the apparent valence of 1.2. Thus, the uni-positive Mg+ corrosion mechanism was supported by all the relationships between the experimental quantities Ne,a, NW and NH.
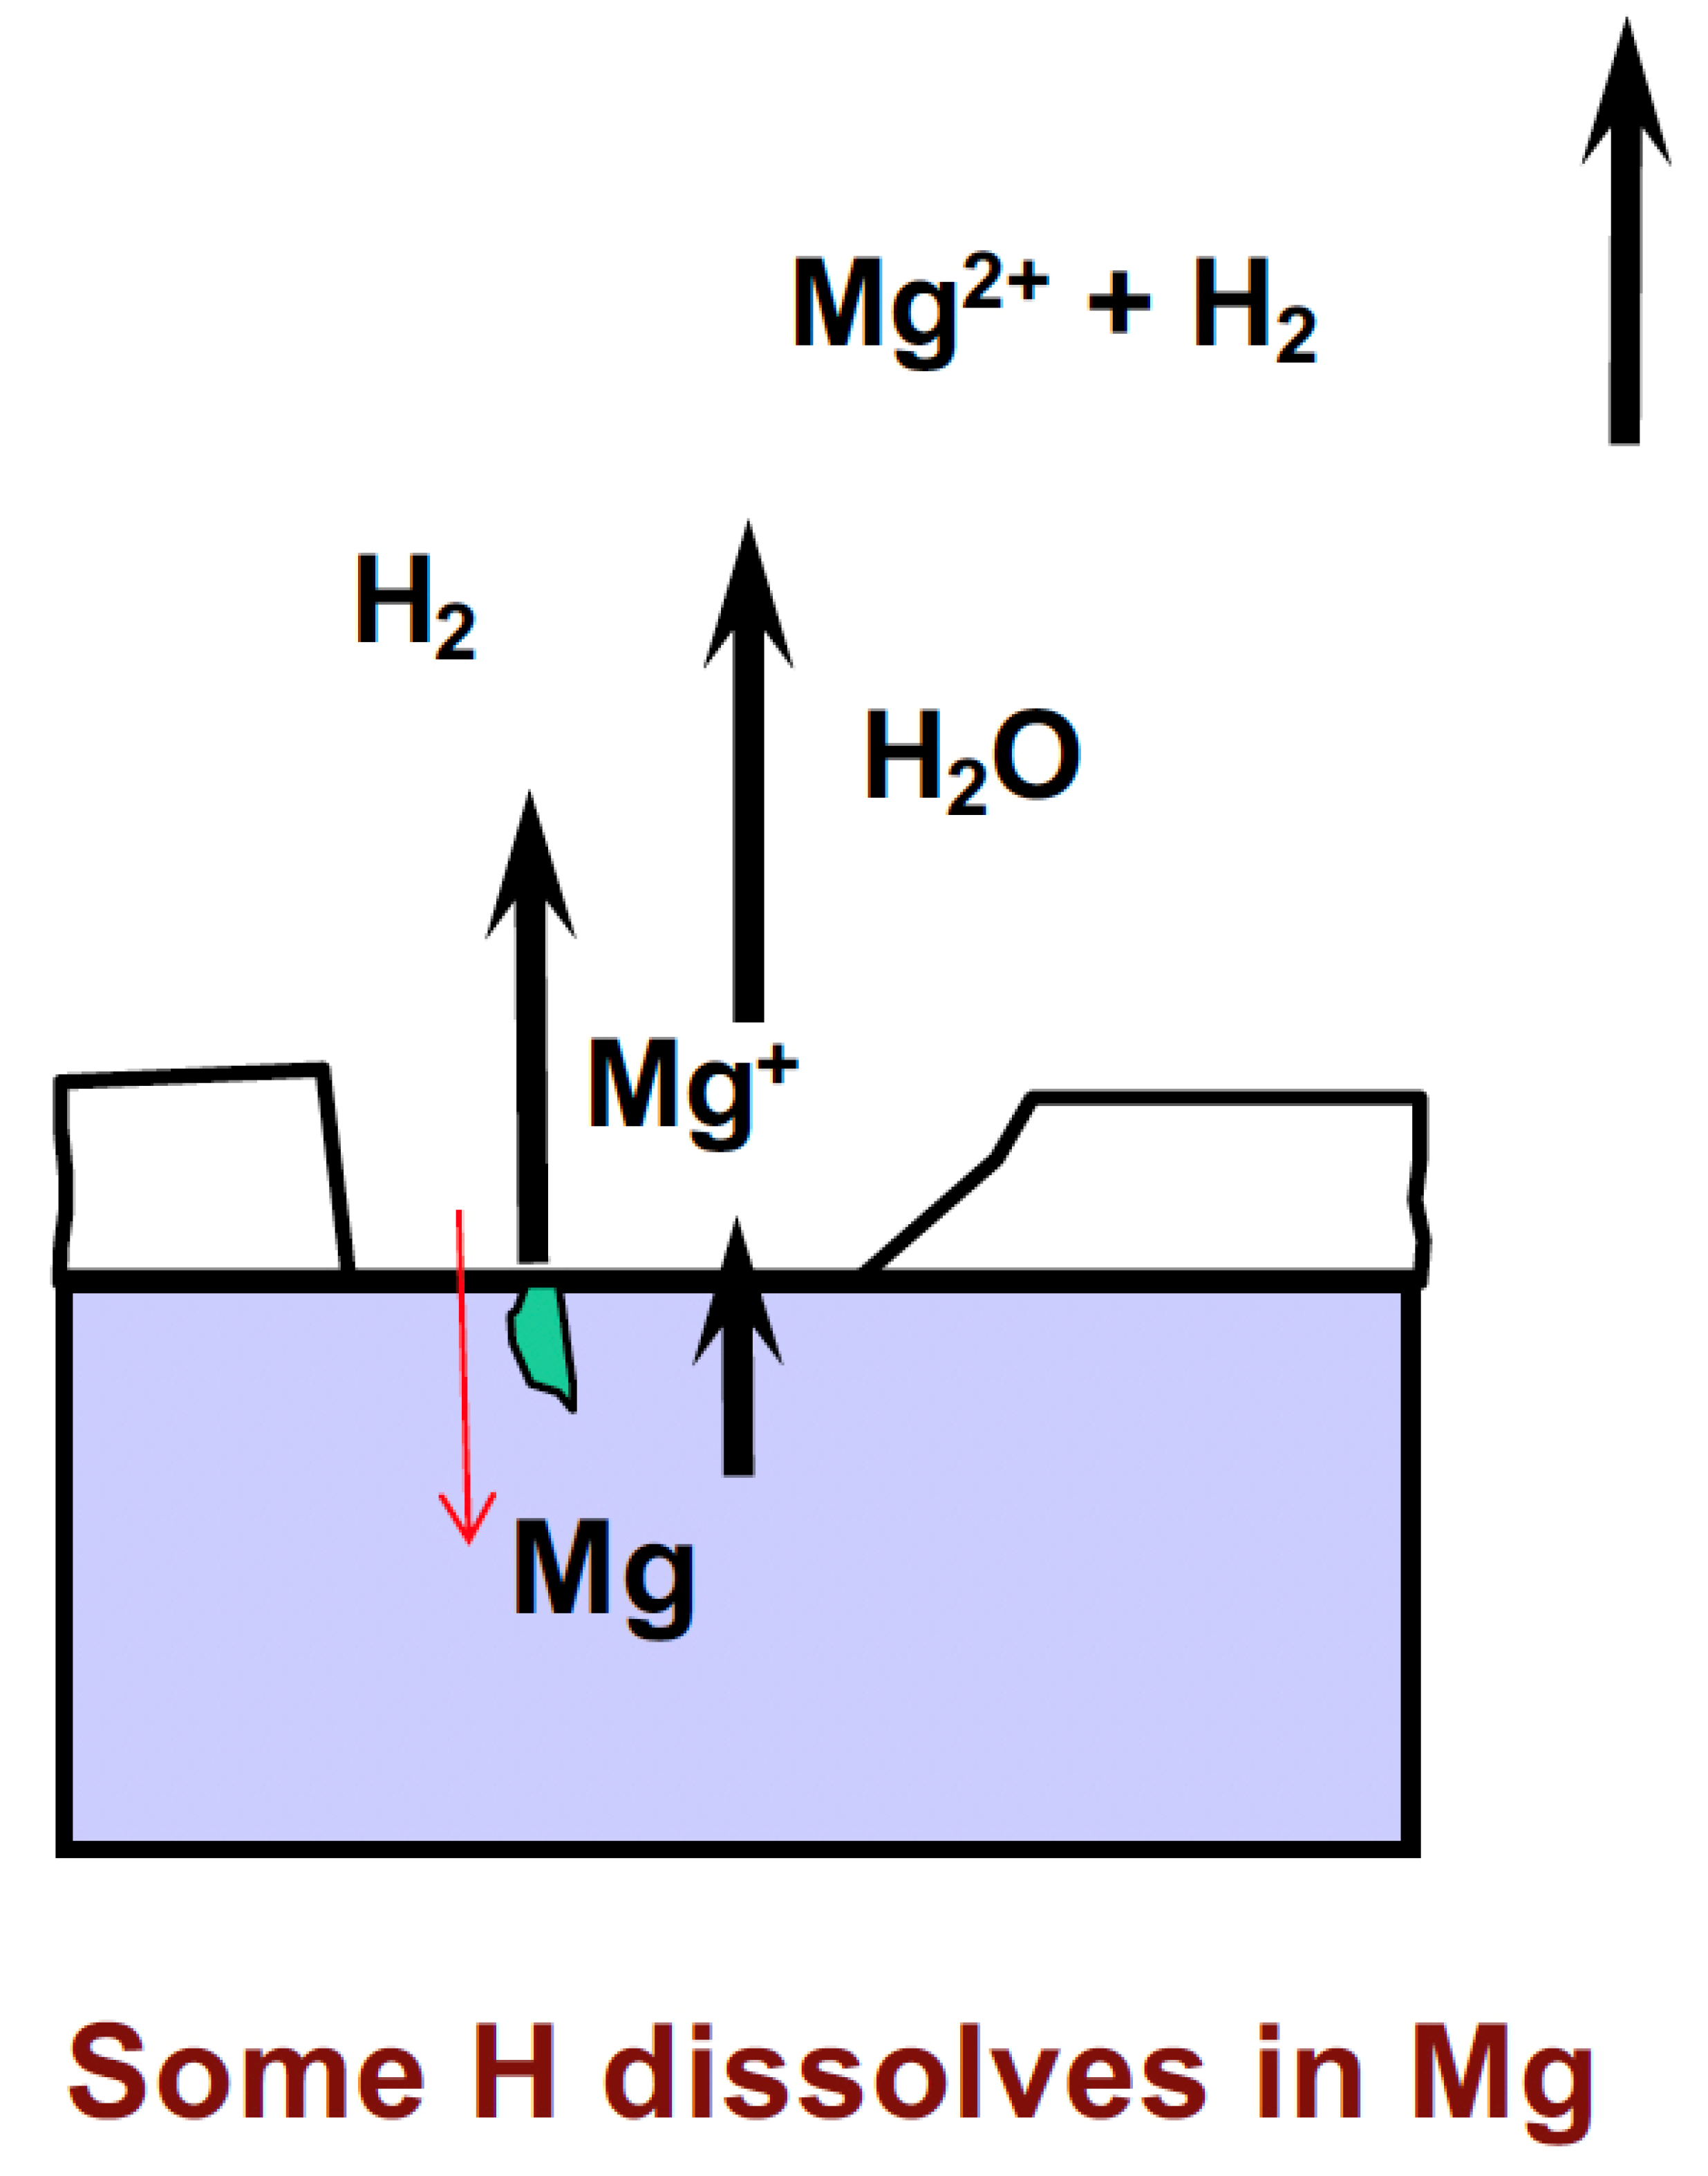
Figure 18 provide a schematic of the Mg corrosion mechanism. The anodic reaction occurs in two steps via the uni-positive Mg
+ ion that is sufficiently reactive to chemically split wa to produce hydrogen. Anodic polarization produces more Mg
+ and hence a greater volume of anodic hydrogen.
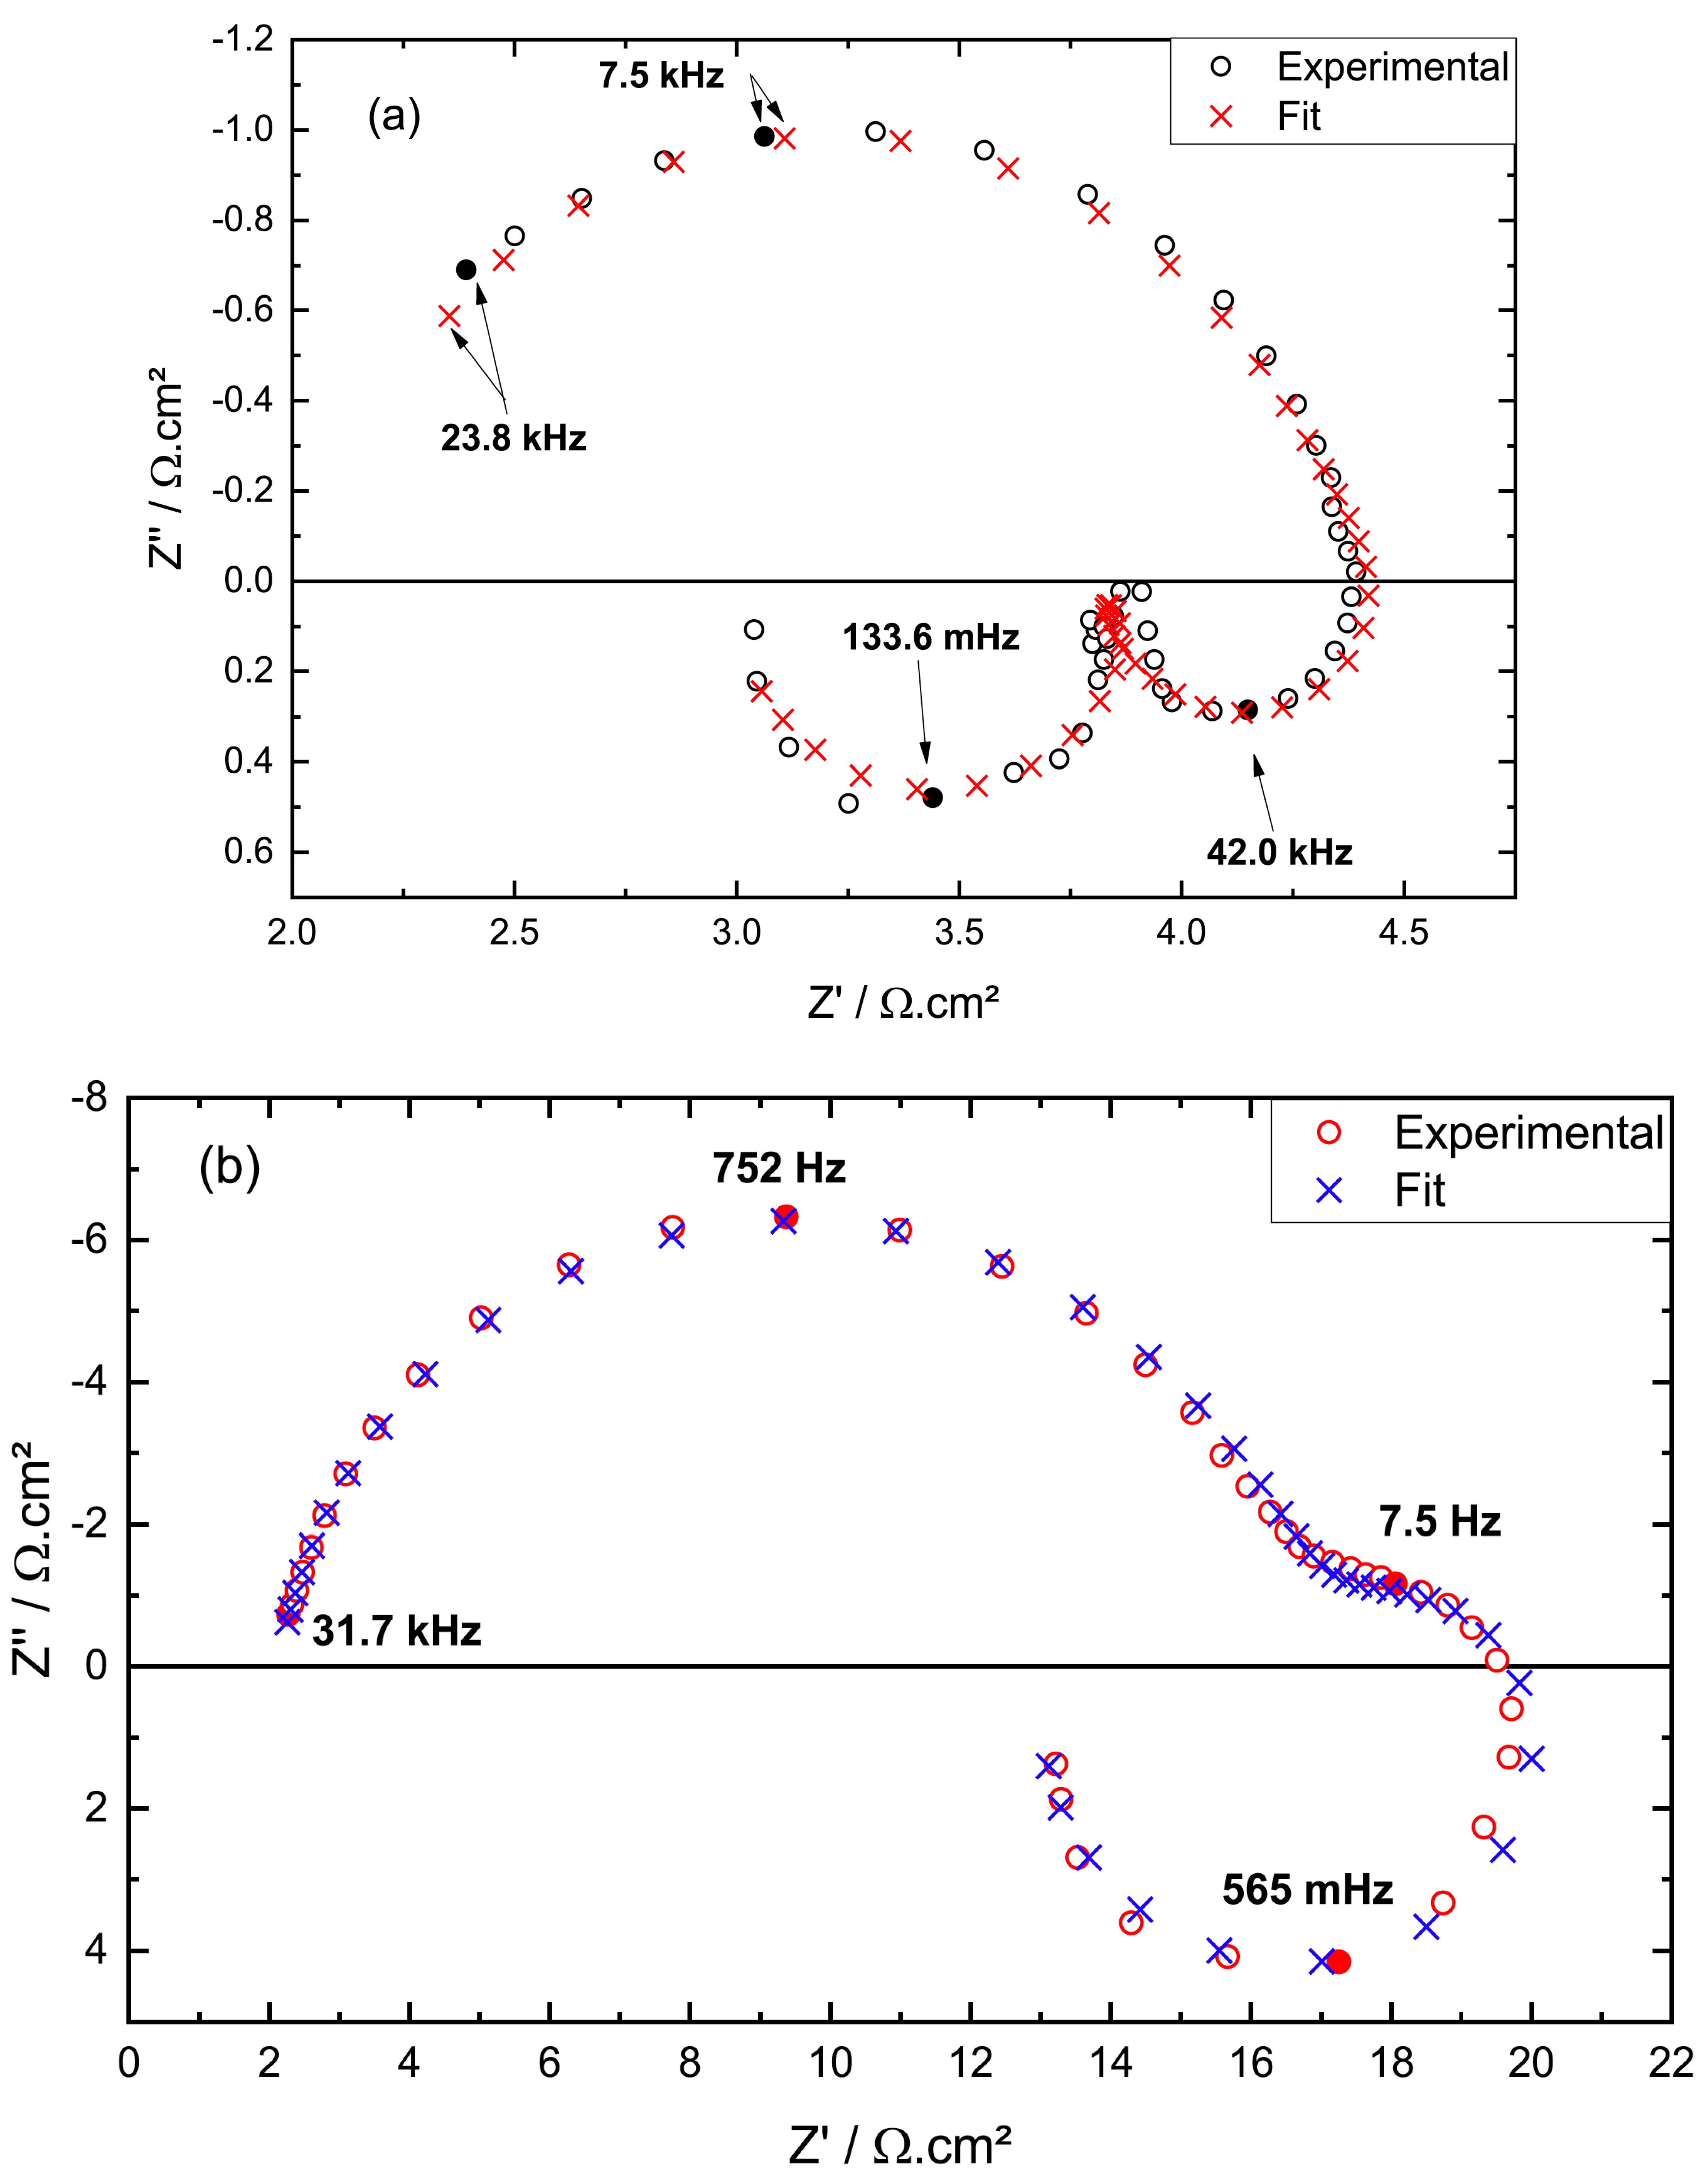
9. Electrochemical Impedance Spectroscopy
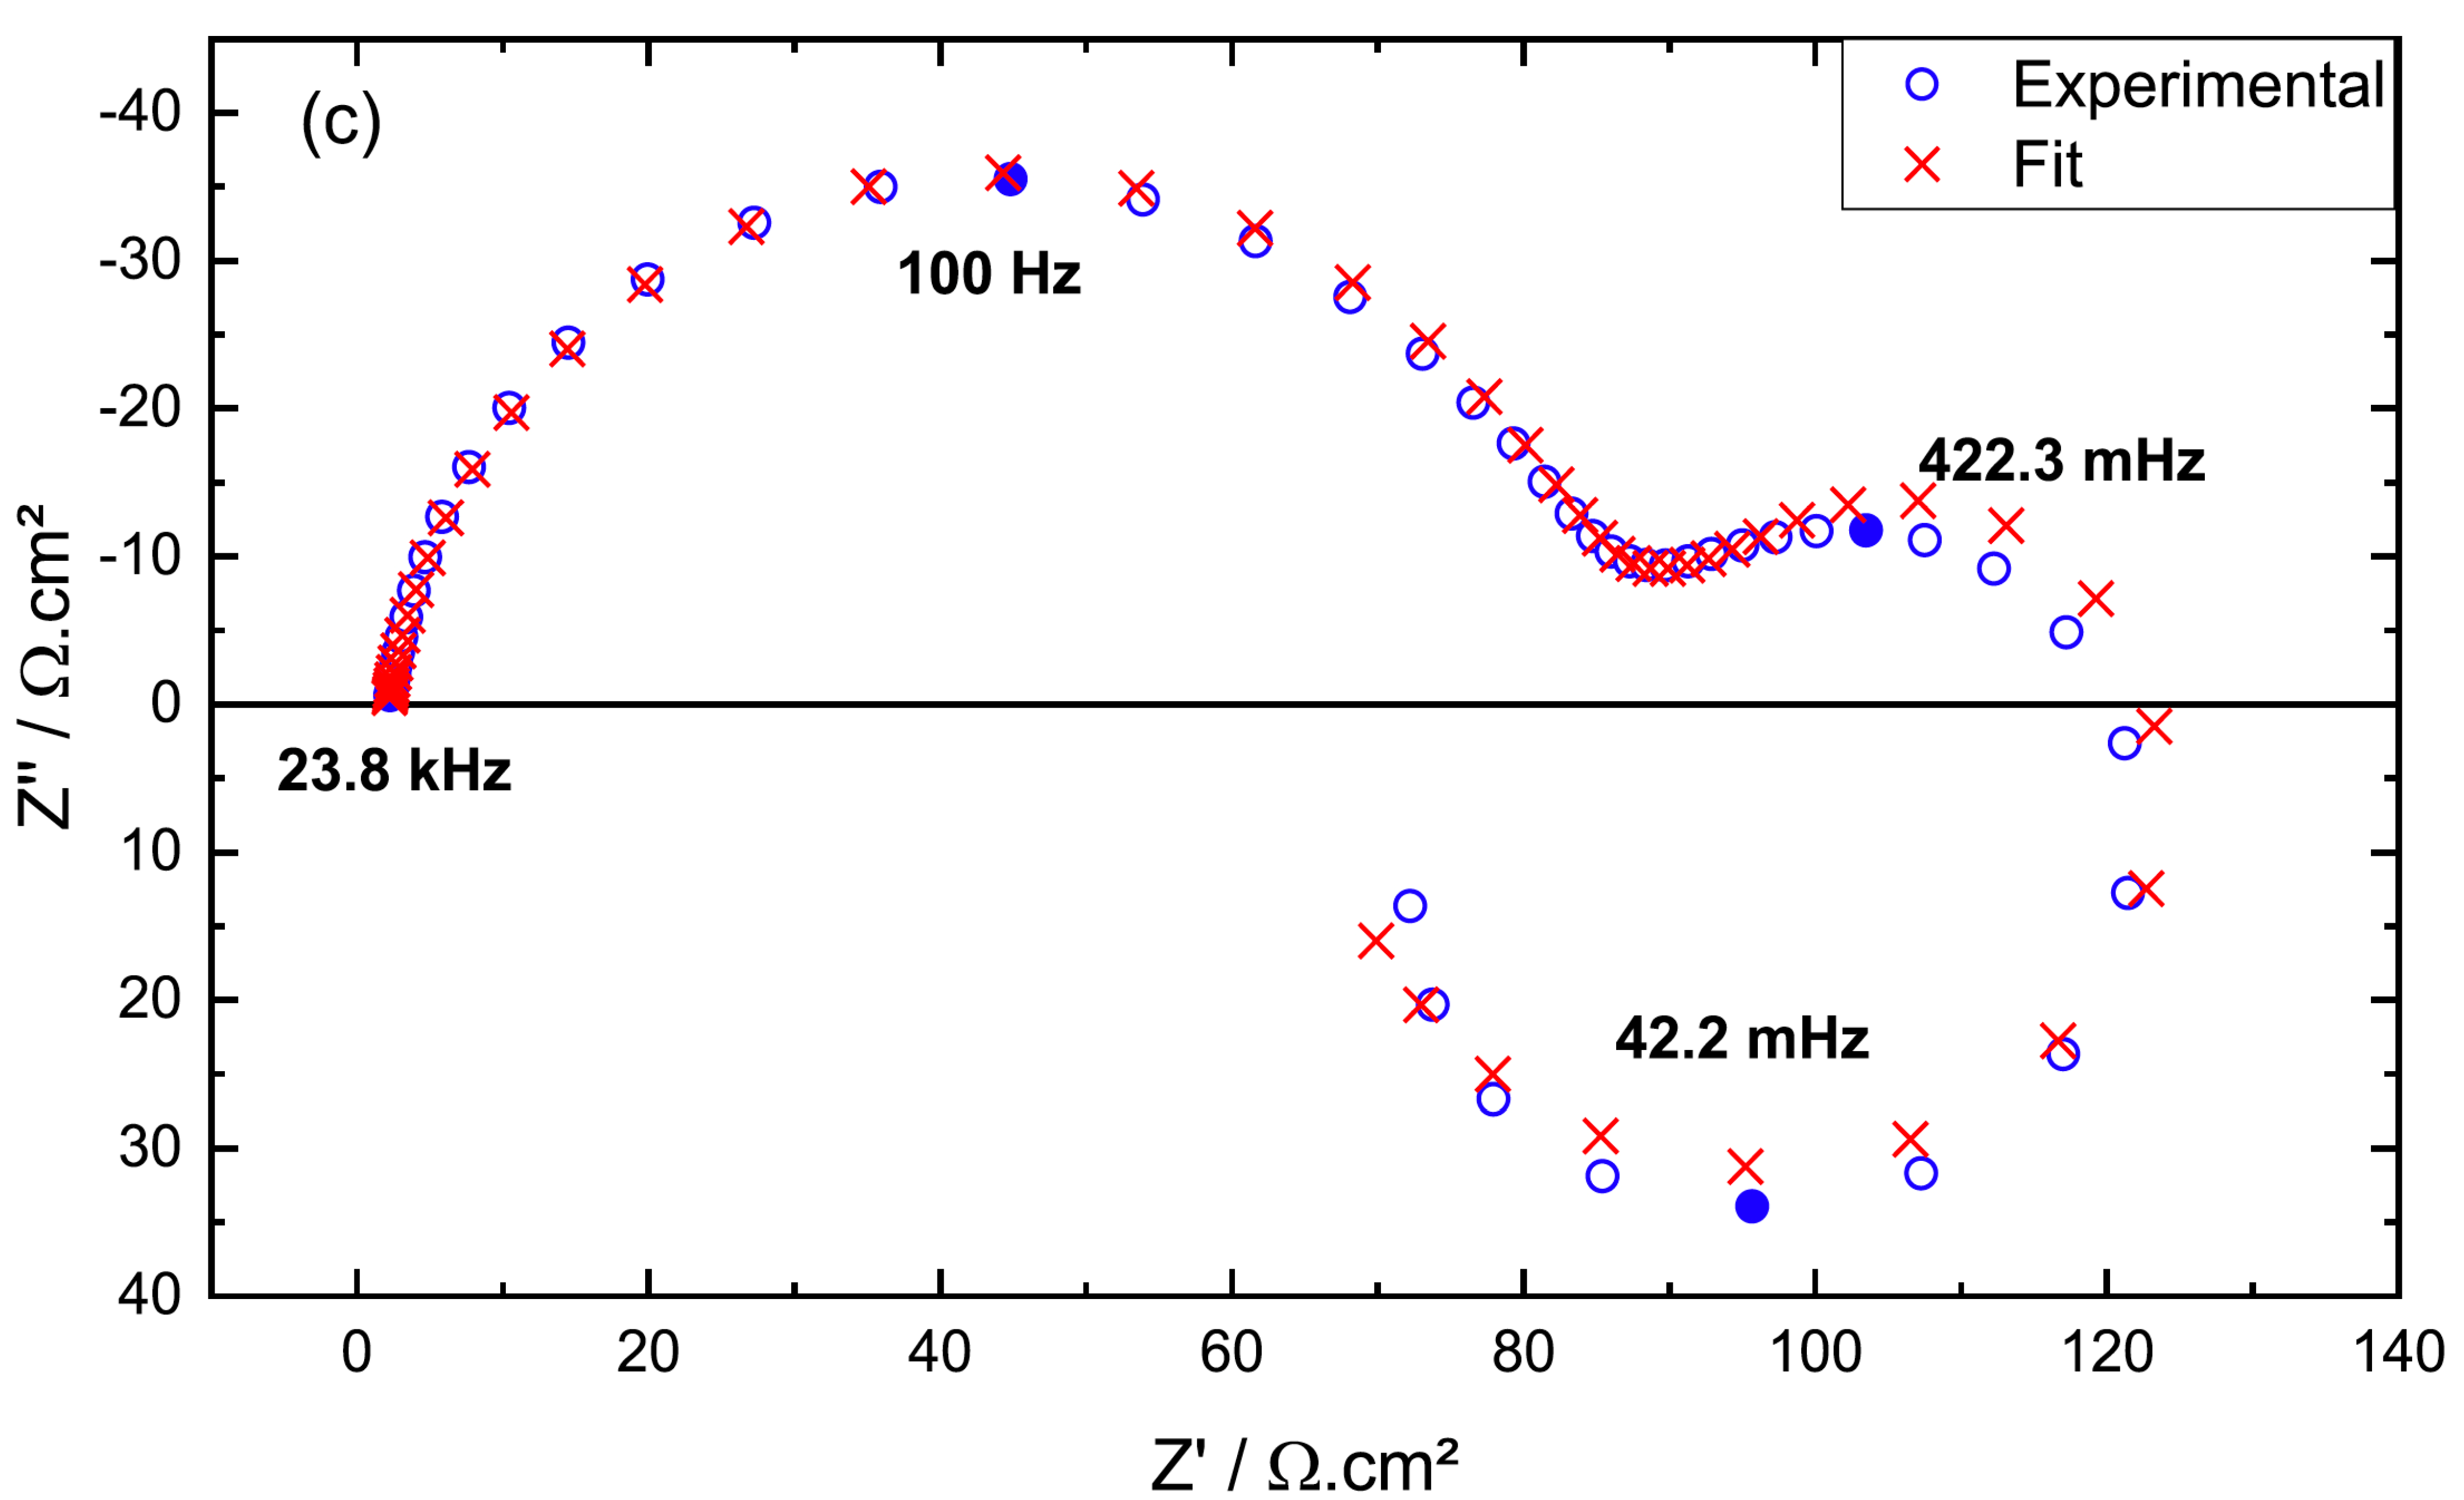
Figure 19 provides experimental impedance spectroscopy (EIS) diagrams [
45] for a rotating disc Mg electrode (1000 revolutions per min) after 30 min at the corrosion potential in 1 M Na
2SO
4 (blue circles) and the result of the fitting procedure with a Mg corrosion model based on the uni-positive Mg
+ ion (red crosses) at (a) pH = 1.8, (b) pH = 2.9, and (c) pH = 7.7. The good fit between the Mg corrosion model based on the uni-positive Mg
+ ion provides strong support for the Mg corrosion mechanism based on the uni-positive Mg
+ ion.
The model [
45] is as explained above in simplified form. The details of the uni-positive Mg
+ ion model [
45] can be summarized as follows. In an acid medium, there are the following four anodic, chemical and cathodic reactions:
In neutral and alkaline solutions, the anodic partial reactions remain as given by Equations (14) and (15); the chemical and cathodic reactions are as follows.
The modelling and fitting of the EIS data assumed that the adsorbed species each followed a Langmuir isotherm and that the electrochemical reactions were exponentially potential dependent (i.e., obey the Tafel Law).
The good fit between this model and the experimental data as shown in
Figure 19 provide strong support for this Mg corrosion mechanism based on the uni-positive Mg
+ ion [
45].
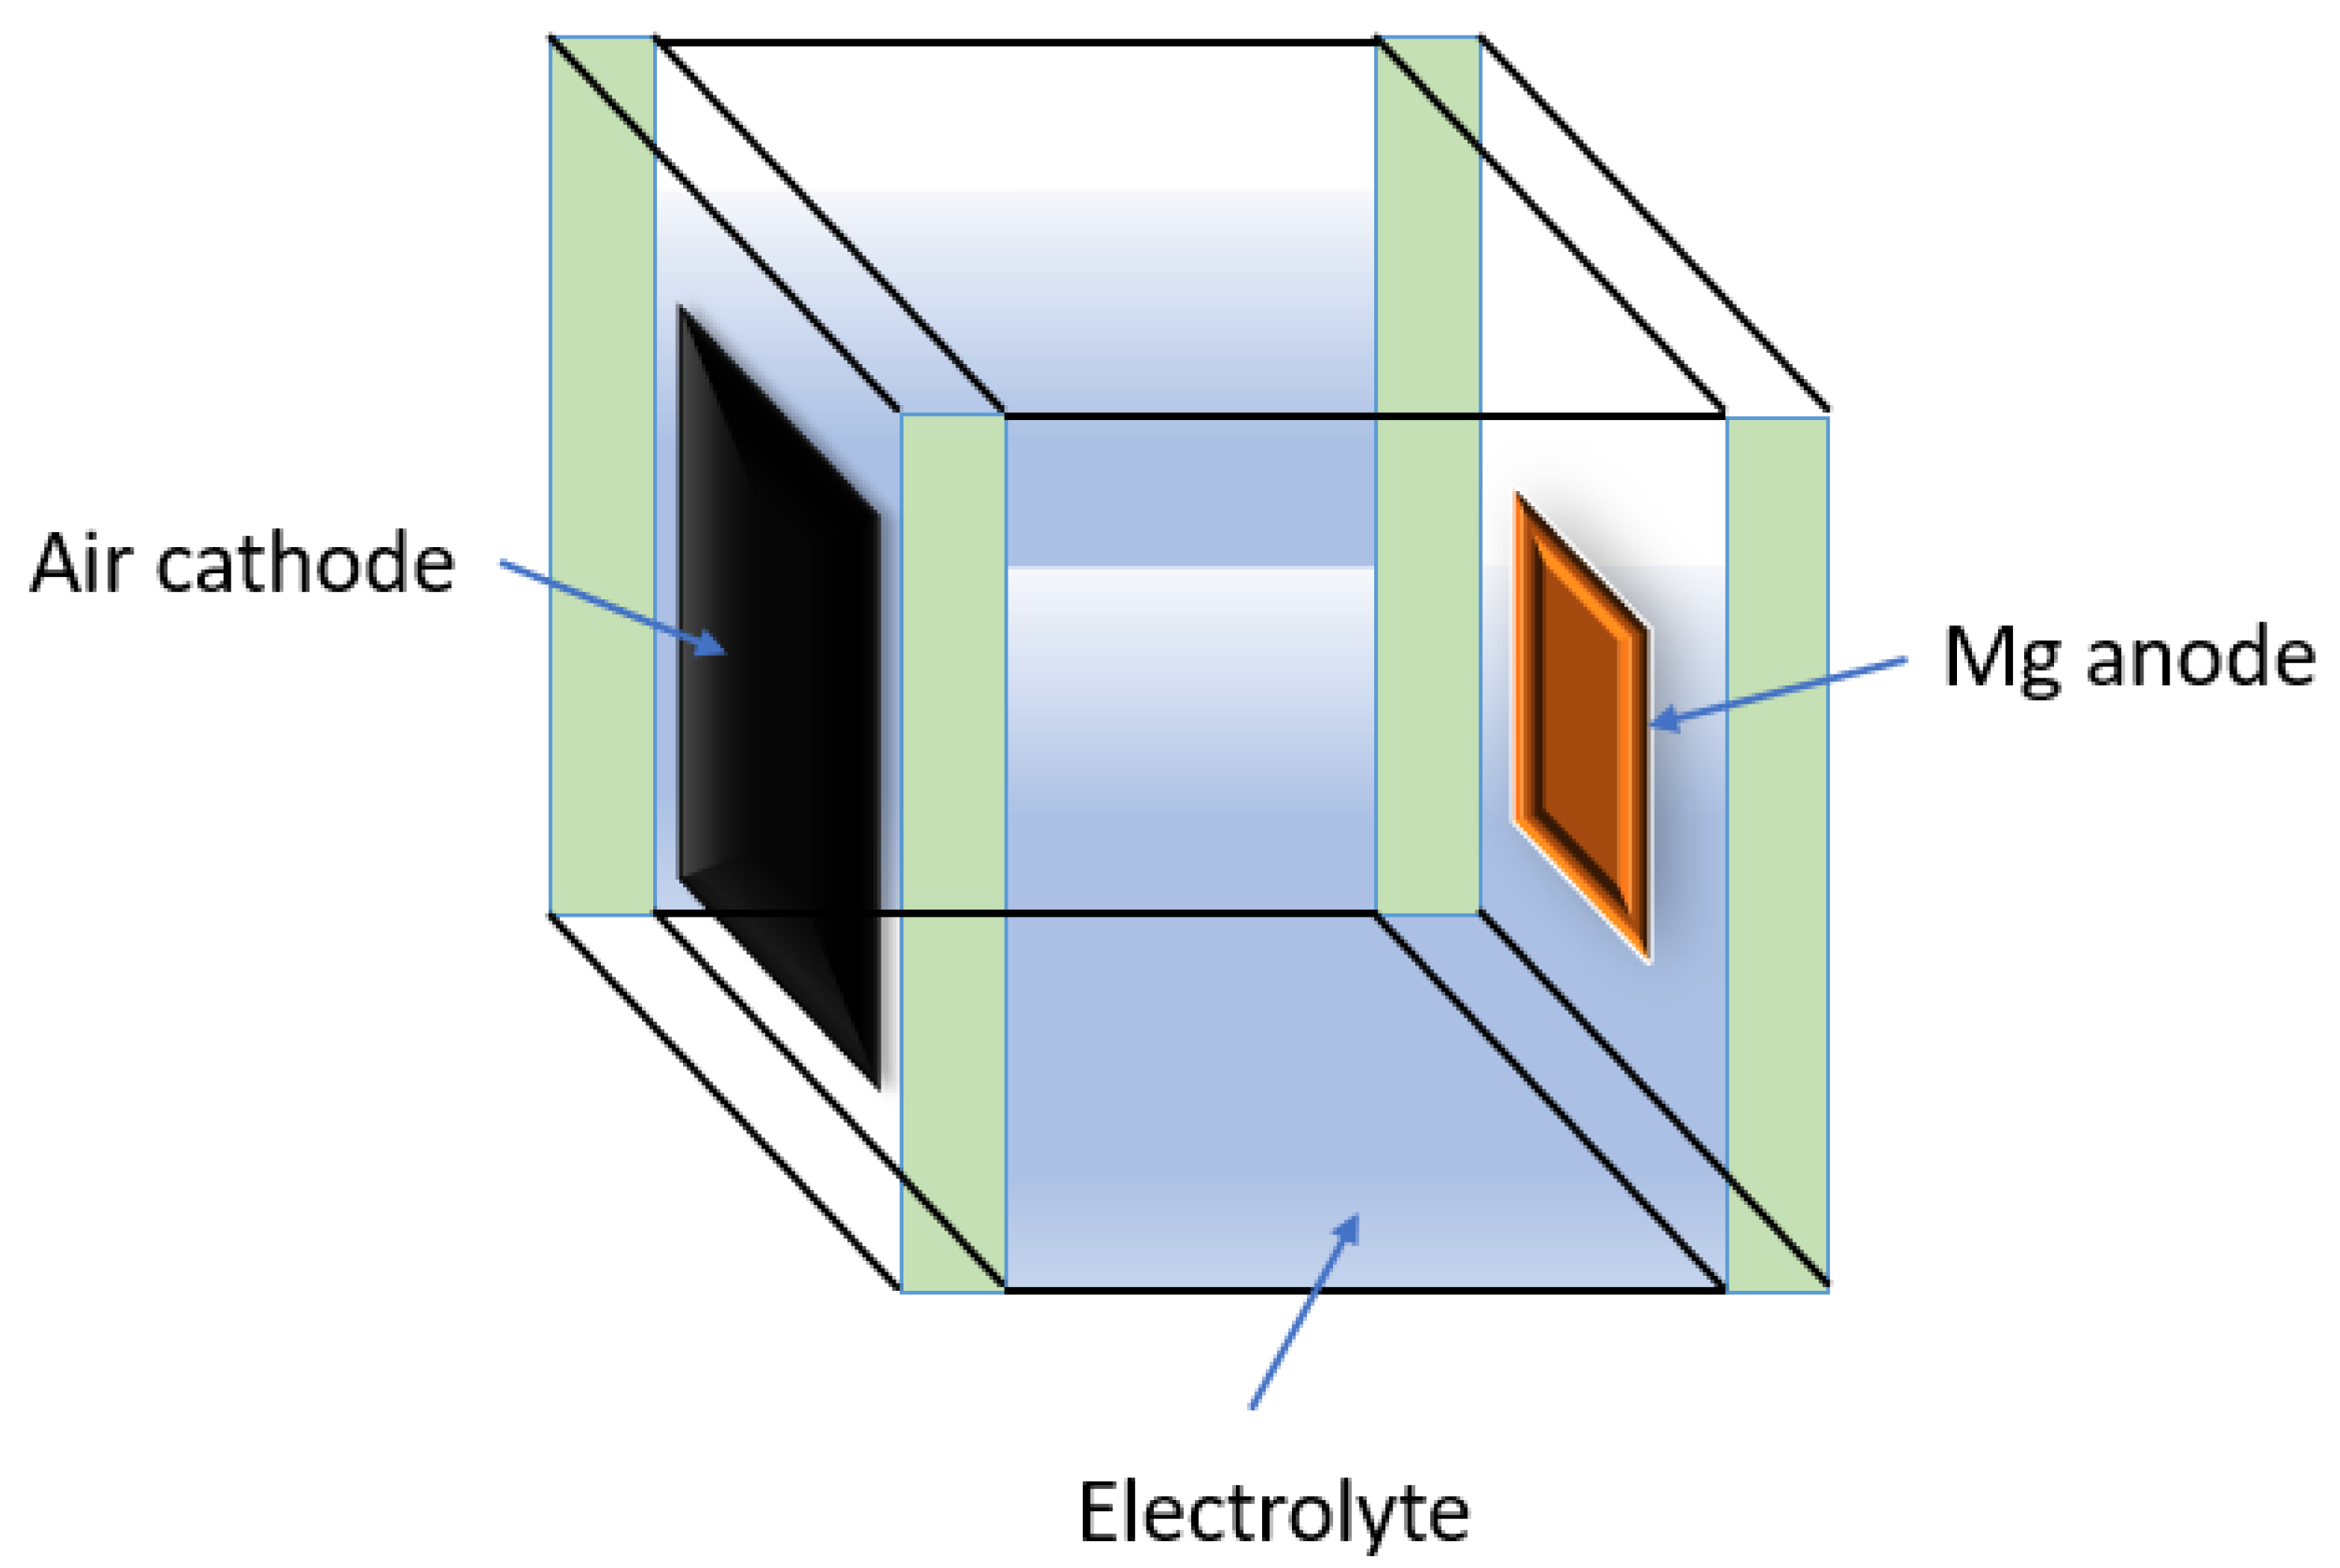
10. Mg-Air Battery
The primary Mg-air battery has been regarded as a low cost, clean, safe and environmentally friendly energy storage system to reduce dependence on fossil fuel and achieve carbon neutrality. The battery is an emerging star in applications requiring ultrahigh energy densities that electrically rechargeable batteries are still unable to meet (e.g., long-range drones, off-grid power systems, and range extenders for electric vehicles) [
99], sparked by its superior theoretical discharge voltage (3.1 V) and energy density (6.8 Wh kg
−1) [
100].
The Mg-air battery produces electricity through an overall electrochemical reaction in an aqueous electrolyte of the Mg alloy and the oxygen in the air, wherein the anode reaction (Equation (22)) is spatially separated from the cathodic reaction (Equation (23)), which are given by:
This battery has a simple structure and is easy to assemble, as shown in
Figure 20. However, Mg-based anodes suffer from self-corrosion due to the anodic hydrogen reaction (also known as the negative difference effect) chemical step Equation (11). This chemical step produces no electrons for the Mg-air battery, leading to poor anodic efficiency and poor discharge capacity. This chemical step is part of the overall Mg corrosion reaction.
The apparent Mg valence,
Ve,ibattry, for the Mg anode during discharge of a Mg-Air battery can be evaluated from [
101]:
where
Ne,ibattery is the electron flux produced by the battery corresponding to the flux of dissolving Mg atoms,
NW. This is an operational definition of the apparent Mg valence based on the battery performance. The electron flux produced by the battery,
Ne,ibattery, can be evaluated using:
where
Ibattery is the applied current density used in the evaluation of battery performance.
Note that the apparent valence, Ve,ibattry, evaluated using Equation (24) is different to that evaluated using Equation (6) in that Equation (25) uses the applied current density used in the evaluation of battery performance, Ibattery, which does not take into account the cathodic current at the Mg anode, particularly at low current density values. Thus, the apparent valence, Ve,ibattry, evaluated using Equation (25) provides an underestimate of the apparent valence as determined using Equation (6), particularly at low current densities.
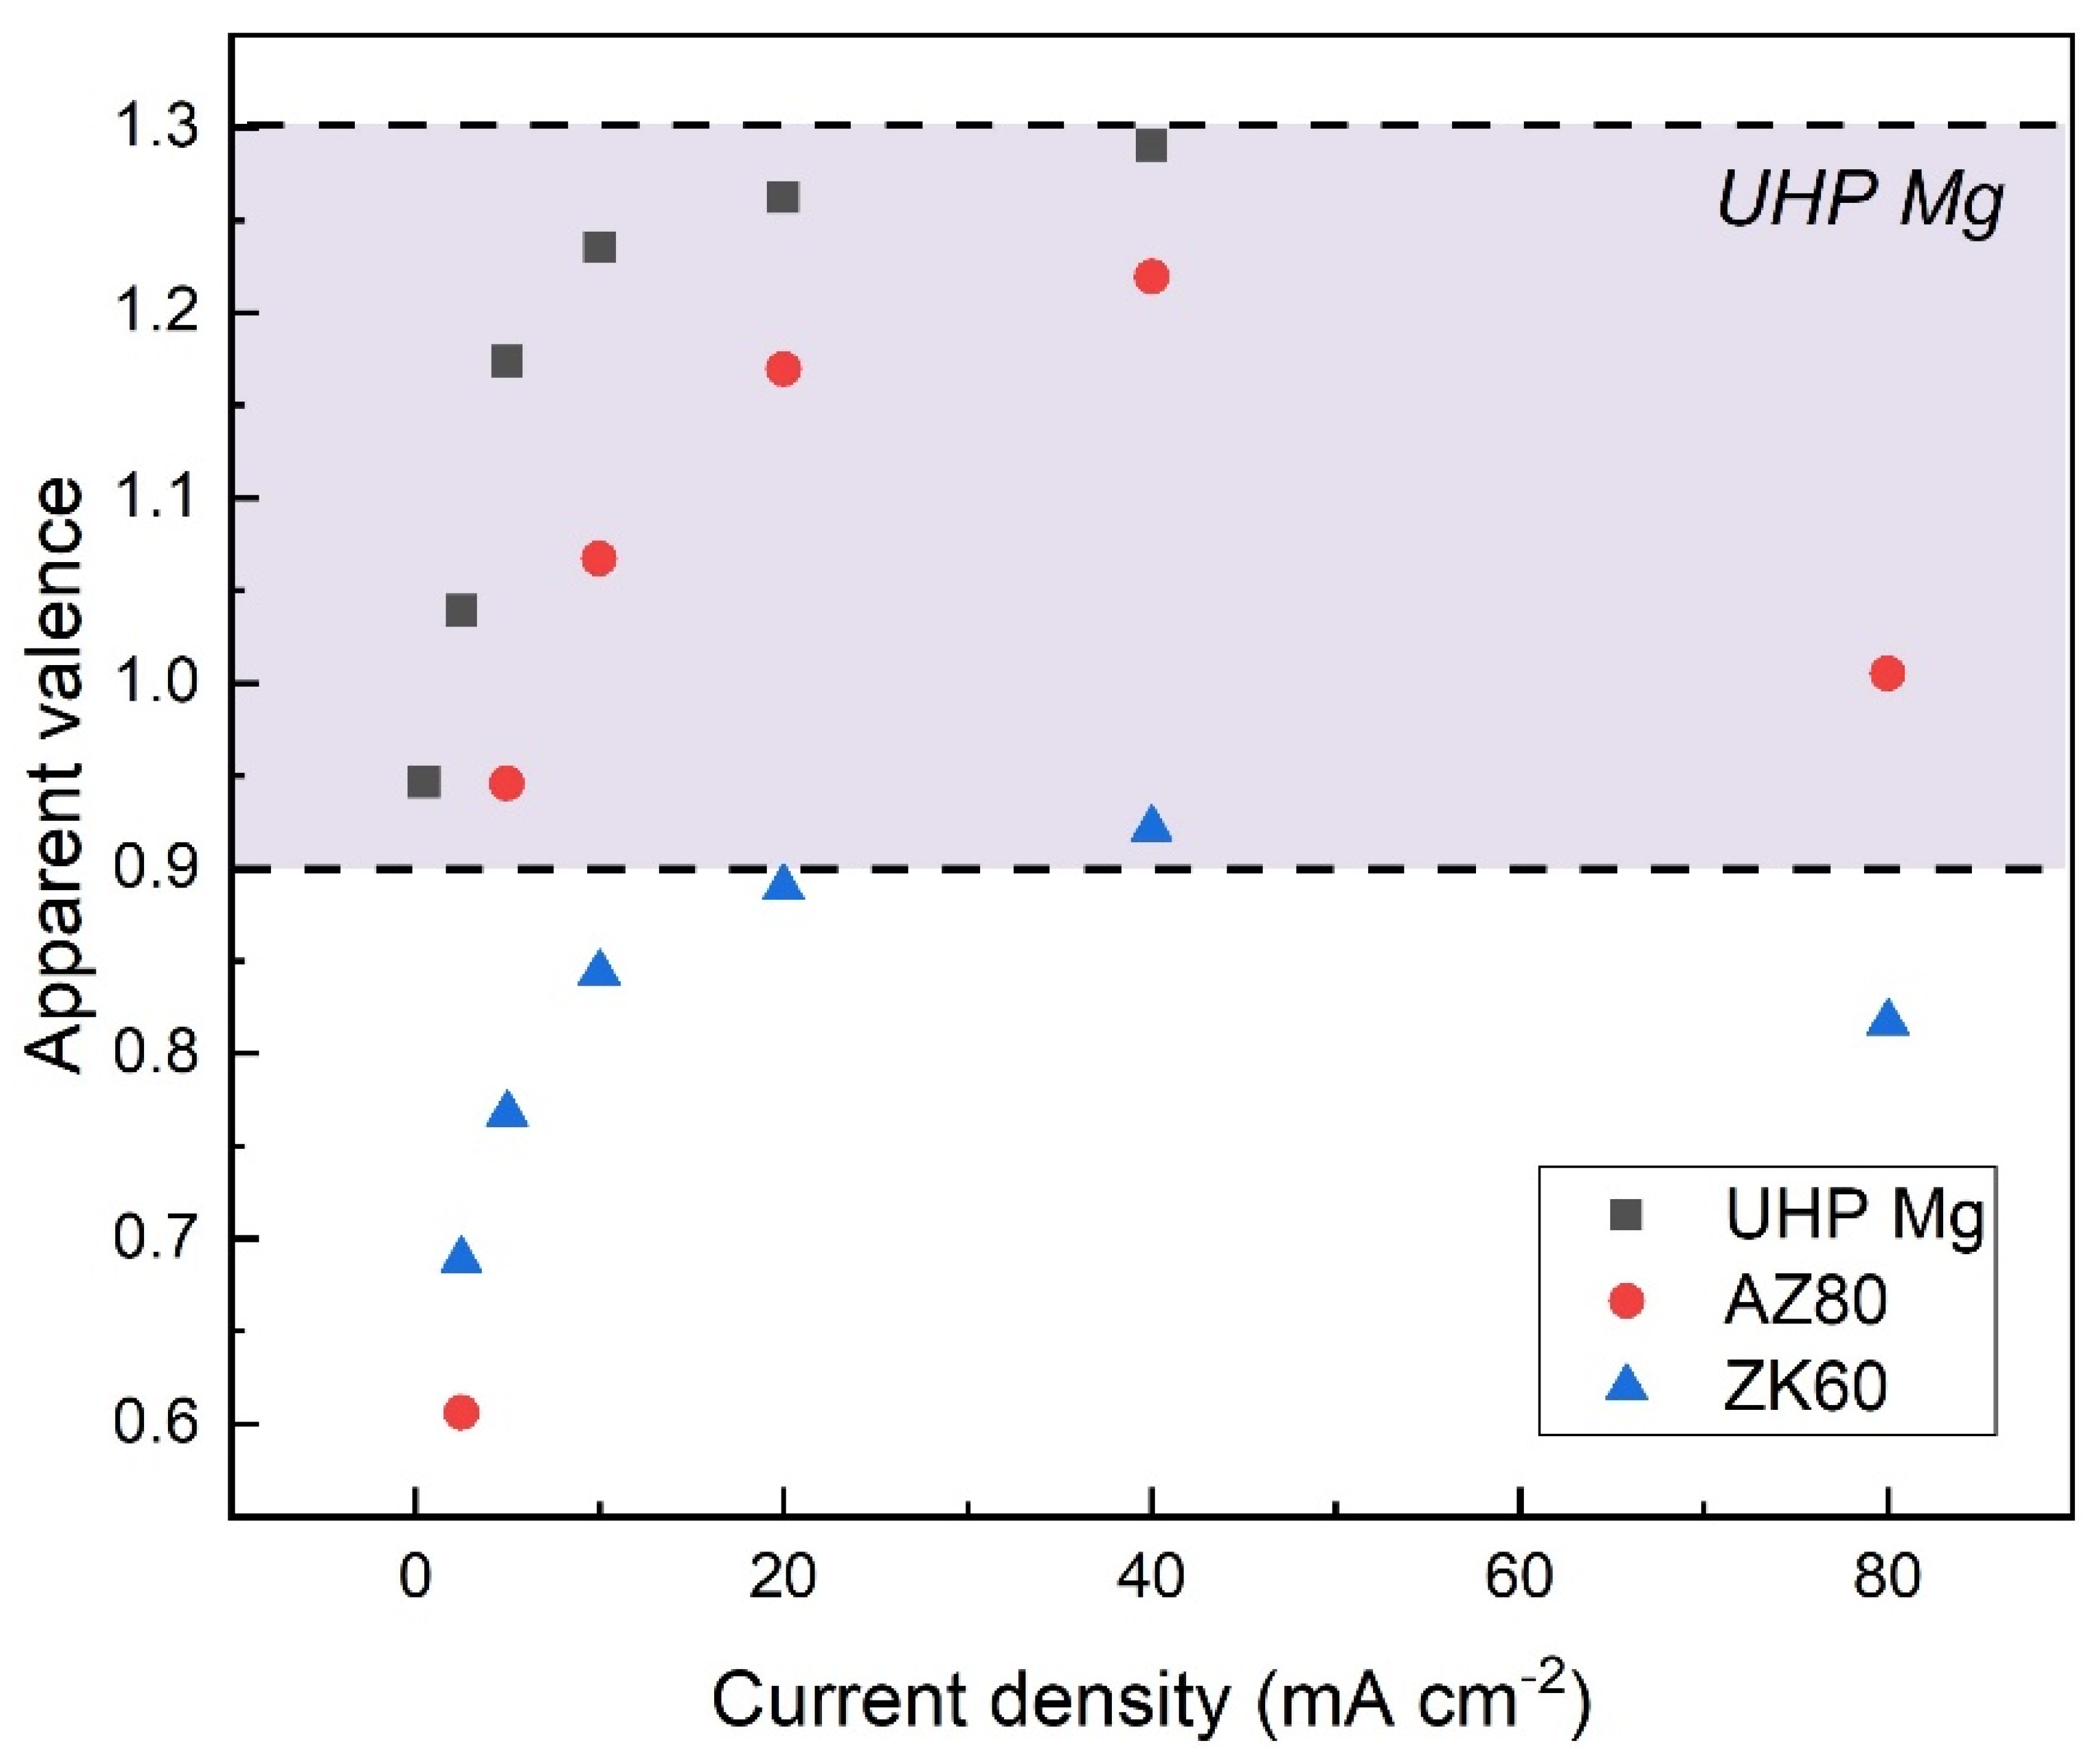
Figure 21 presents the apparent Mg valence
Ve,ibattery, for UHP Mg, AZ80 and ZK60 at different current densities during battery testing [
101]. The increase in apparent Mg valence with increasing current density is attributed to the decreasing importance of the cathodic partial current at the Mg anode.
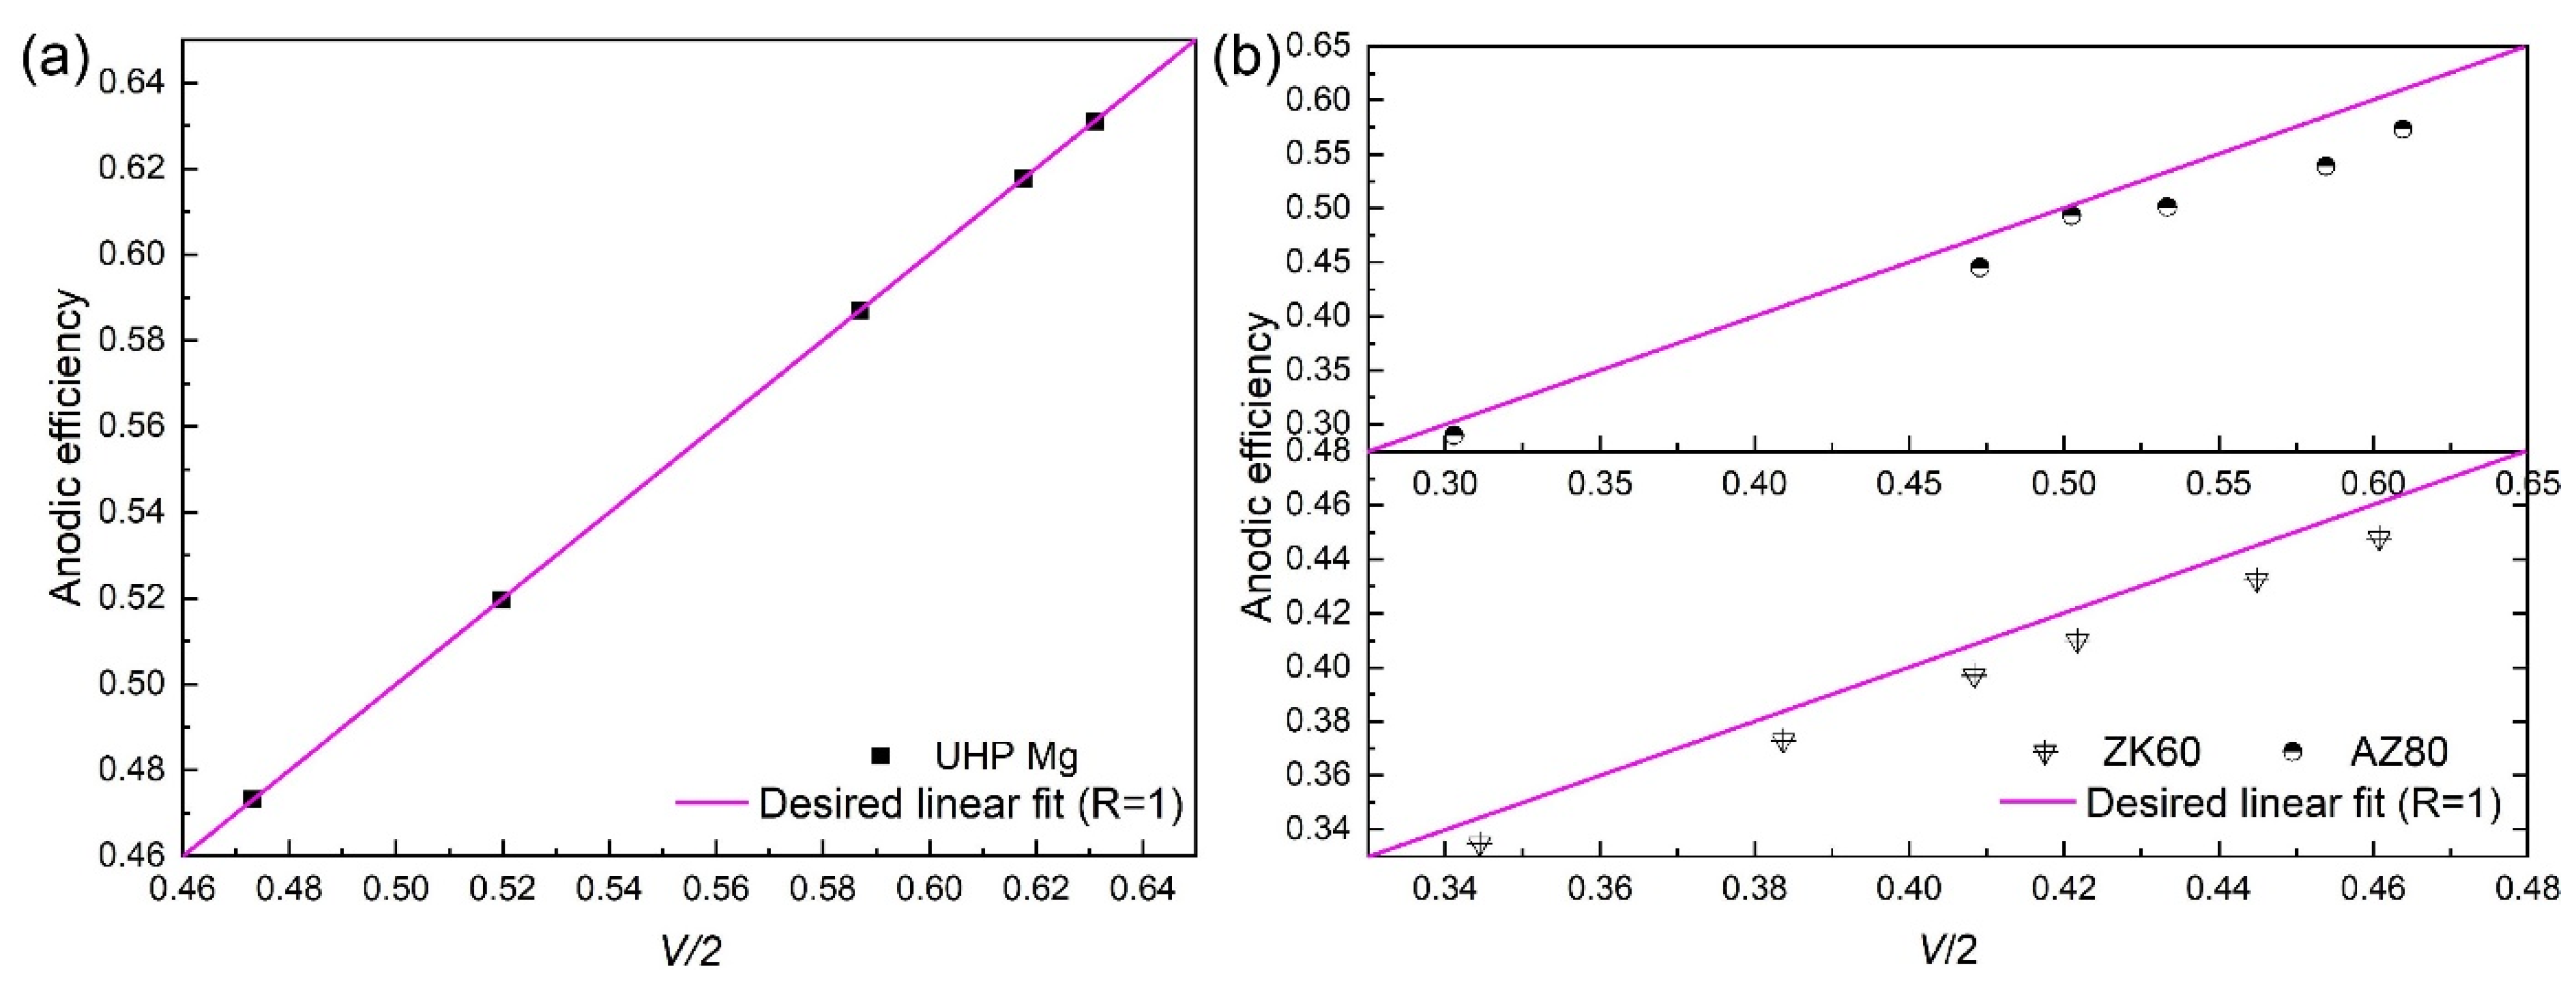
Figure 22 presents [
101] the relationship between anodic efficiency and
Ve,ibattery/2 during battery testing for (a) UHP Mg, (b) AZ80 and ZK60. This provides an explanation for the low values of anodic efficiency for Mg anodes in terms of the Mg corrosion mechanism This also provides a methodology for the design and production of more efficient Mg anodes.
11. Future Prospects
A significant effort has been expended in an attempt to produce a Mg alloy with a corrosion rate much lower than the intrinsic Mg corrosion rate of 0.3 mm/y in a chloride solution as measured by weight loss. There was a significant amount of activity devoted to the idea that As and similar alloying elements could decrease the corrosion rate of the Mg alloy by decreasing the rate of the hydrogen evolution reaction. There was also some interest when it was proposed that a Mg-Li alloy had a low corrosion rate, but this was also not proved because of the high corrosion rate of the reference “pure Mg”.
The recent review of Mg corrosion rates [
83] summarized in
Figure 9 indicated the existence of some Mg alloys with lower corrosion rates, but these were nevertheless within a factor of five of the intrinsic Mg corrosion rate. Song and Atrens [
4] suggested in 2003 that a Mg-X alloy would have better corrosion resistance if the surface film was based on the alloying element X. This approach has produced Mg alloys with better oxidation resistance [
65,
66,
67], and is expected to produce Mg alloys with better resistance to atmospheric corrosion. In fact, development of a Mg alloy for resistance to atmospheric corrosion has been a neglected area of study, and it would be expected that significant advances were possible.
12. Conclusions
For substantial corrosion rates, the average corrosion rate evaluated from the total volume of evolved hydrogen, PAH, is in good agreement with the average steady-state corrosion rate over the experimental duration measured from the weight loss, PW. This gives credence that both measurements represent good measurements of the actual steady-state Mg corrosion rate.
There is good evidence that there is typically a double layer film on the surface of Mg during corrosion in chloride solutions. A thin MgO layer (~3–10 nm thick) adjacent to the Mg metal surface provides some corrosion protection, on top of which is a thicker (~0.02 mm) porous layer of Mg(OH)2.
Corrosion rates of Mg measured by electrochemical methods have typically not agreed with the steady state corrosion rates measured by weight loss. They are typically too low in chloride solutions.
Part of the explanation for the low Mg corrosion rates measured using electrochemical techniques is that electrochemical measurements are carried out soon after specimen immersion in the solution before steady state conditions have become established. The initial corrosion rate (as typically measured by electrochemical methods) may not be representative of the steady state corrosion rate, (as measured by weight loss).
The Fe tolerance limit can be understood from the Fe-Mg equilibrium phase diagram.
The Fe tolerance limit is 180 wt ppm Fe for pure as cast Mg, but Fe-rich particles may precipitate after heat treatment and cause high corrosion rates if the Fe content is greater than 2 wt ppm Fe in pure Mg.
The Fe tolerance limit for as cast Mg can be very low in the presence of Si.
The intrinsic Mg corrosion rate in a chloride solution is 0.3 mm/y as measured by the weight loss method.
The enhanced catalytic evolution mechanism predicts that the “enhanced” cathodic hydrogen evolution rate must be equal to the anodic hydrogen evolution rate measured during anodic polarization. The fact that the “enhanced” cathodic hydrogen evolution rate has been repeated measured to be significantly less than the anodic hydrogen evolution rate for substantial applied anodic current densities indicates that experimental evidence contradicts the enhanced catalytic activity mechanism of Mg corrosion.
Strong experimental evidence for the uni-positive Mg+ corrosion mechanism has been provided by (i) an apparent valence of 1.2 during the anodic polarization of pure Mg and the Mg alloy WE43 (where the apparent valence was evaluated from the ratio of Ne,a/NW, ((the number of electrons taking part in the anodic partial reaction)/(the number of Mg atoms)), (ii) that the fraction k of Mg+ ions electrochemically oxidized to Mg2+ was measured to be 0.2 during anodic polarization of pure Mg and WE43 in agreement with the measured apparent valence of 1.2, and (iii) that the evolution rate of hydrogen, NH, increased linearly with the weight loss rate of Mg, NW, and that NH/NW = 0.4 consistent with k = 0.2 and the value of the apparent valence of 1.2. Thus, the uni-positive Mg+ corrosion mechanism was supported by all the relationships between the experimental measured quantities Ne,a, NW and NH.
The anodic reaction during Mg corrosion occurs in two steps via the uni-positive Mg+ ion that is sufficiently reactive to chemically split water to produce hydrogen. Anodic polarization produces more Mg+ and hence a greater volume of anodic hydrogen.
New compelling experimental evidence supporting the uni-positive Mg+ corrosion mechanism has been provided by electrochemical impedance spectroscopy (EIS).
The uni-positive Mg+ corrosion mechanism provides new insights for understanding the performance of Mg-air batteries and for the development of better Mg anodes.
Development of a Mg alloy for resistance to atmospheric corrosion has been a neglected area of study, and it would be expected that significant advances were possible.
Author Contributions
All authors made a significant contribution. Conceptualisation, methodology, formal analysis, resources, writing—original draft preparation, writing—review and editing, A.A.; conceptualisation, writing—original draft preparation, writing—review and editing, X.C.; formal analysis, writing—review and editing, Z.S. All authors have read and agreed to the published version of the manuscript.
Funding
The research received no external funding.
Institutional Review Board Statement
Not applicable.
Informed Consent Statement
Not applicable.
Data Availability Statement
The data used in this review is from the papers as quoted herein.
Acknowledgments
Thanks to Sean Johnston, Catalina Taltavull, Nor Ishida Zainal Abidin, Aleks D Atrens, Darren Martin, Akif Soltan, Matt Dargusch, Syeda Mehreen, Guang-Ling Song, Ming Liu, Mingxing Zhang, Qichi Le, Zahrina Mardina, Christopher Maher, Michiaki Yamasaki, Jeffrey Venezuela, Liang Wu, Bin Jiang, Fusheng Pan, Ming-Chun Zhao, Darren Gerrard, Jiangfeng Song, Ming Yan, Xianhua Chen, Fiona Jones, Barry Wood, Fuyong Cao, Nan Yang, Cuie Wen, Baptiste Py, Krzysztof Wolski, Yang Li, Qiyang Tan, Arvind Prasad, Jason Nairn, Nicholas Winzer, Jimmy Jia.
Conflicts of Interest
The authors declare no conflict of interest.
References
- Atrens, A.; Johnston, S.; Shi, Z.; Dargusch, M.S. Viewpoint—Understanding Mg corrosion in the body for biodegradable medical implants. Scr. Mater. 2018, 154, 92–100. [Google Scholar] [CrossRef]
- Atrens, A.; Song, G.-L.; Liu, M.; Shi, Z.; Cao, F.; Dargusch, M. Review of Recent Developments in the Field of Magnesium Corrosion. Adv. Eng. Mater. 2015, 17, 400–453. [Google Scholar] [CrossRef]
- Atrens, A.; Song, G.-L.; Cao, F.; Shi, Z.; Bowen, P.K. Advances in Mg corrosion and research suggestions. J. Magnes. Alloy. 2013, 1, 177–200. [Google Scholar] [CrossRef]
- Song, G.; Atrens, A. Understanding magnesium corrosion mechanism: A framework for improved alloy performance. Adv. Eng. Mater. 2003, 5, 837–858. [Google Scholar] [CrossRef]
- Song, G.; Atrens, A. Corrosion mechanisms of magnesium alloys. Adv. Eng. Mater. 1999, 1, 11–33. [Google Scholar] [CrossRef]
- Atrens, A.; Shi, Z.; Mehren, S.U.; Chen, X.; Johnston, S.; Song, G.L.; Chen, X.; Pan, F. Corrosion of Mg alloys, in Encyclopedia of Materials: Metals and Alloys; Elsevier: Amsterdam, Netherlands, 2022; Volume 1, pp. 46–64. [Google Scholar]
- Atrens, A.; Song, G.L.; Shi, Z.; Soltan, A.; Johnston, S.; Dargusch, M.S. Understanding the corrosion of Mg and Mg alloys. Encylo-Pedia Interfacial Chem. 2018, 515–535. [Google Scholar] [CrossRef]
- Atrens, A.D.; Gentle, I.; Atrens, A. Possible dissolution pathways participating in the Mg corrosion reaction. Corros. Sci. 2015, 92, 173–181. [Google Scholar] [CrossRef]
- Esmaily, M.; Svensson, J.E.; Fajardo, S.; Birbilis, N.; Frankel, G.S.; Virtanen, S.; Arrabal, R.; Thomas, S.; Johansson, L.G. Fundamentals and advances in magnesium alloy corrosion. Prog. Mater. Sci. 2017, 89, 92–193. [Google Scholar] [CrossRef]
- Jiang, P.; Blawert, C.; Zheludkevich, M.L. The Corrosion Performance and Mechanical Properties of Mg-Zn Based Alloys—A Review. Corros. Mater. Degrad. 2020, 1, 92–158. [Google Scholar] [CrossRef]
- Huang, J.; Song, G.-L.; Atrens, A.; Dargusch, M. What activates the Mg surface—A comparison of Mg dissolution mechanisms. J. Mater. Sci. Technol. 2020, 57, 204–220. [Google Scholar] [CrossRef]
- Tan, Q.; Atrens, A.; Mo, N.; Zhang, M.-X. Oxidation of magnesium alloys at elevated temperatures in air: A review. Corros. Sci. 2016, 112, 734–759. [Google Scholar] [CrossRef]
- Zhou, H.; Liang, B.; Jiang, H.; Deng, Z.; Yu, K. Magnesium-based biomaterials as emerging agents for bone repair and regenera-tion: From mechanism to application. J. Magnes. Alloy. 2021, 9, 779–804. [Google Scholar] [CrossRef]
- Mei, D.; Wang, C.; Lamaka, S.V.; Zheludkevich, M.L. Clarifying the influence of albumin on the initial stages of magnesium corrosion in Hank’s balanced salt solution. J. Magnes. Alloy. 2020, 9, 805–817. [Google Scholar] [CrossRef]
- Dargusch, M.S.; Shi, Z.; Zhu, H.; Atrens, A.; Song, G.-L. Microstructure modification and corrosion resistance enhancement of die-cast Mg-Al-Re alloy by Sr alloying. J. Magnes. Alloy. 2020, 9, 950–963. [Google Scholar] [CrossRef]
- Bazhenov, V.E.; Li, A.V.; Komissarov, A.A.; Koltygin, A.V.; Tavolzhanskii, S.A.; Bautin, V.A.; Voropaeva, O.O.; Mukhametshina, A.M.; Tokar, A.A. Microstructure and mechanical and corrosion properties of hot extruded Mg-Zn-Ca_(Mn) biodegradable alloys. J. Magnes. Alloy. 2021, 9, 1428–1442. [Google Scholar] [CrossRef]
- Liu, X.; Zhu, Z.; Xue, J. Electrochemical and corrosion behaviours of the wrought Mg-Y-Zn based alloys with high Y/Zn mole ratios. J. Magnes. Alloy. 2021, 9, 1419–1427. [Google Scholar] [CrossRef]
- Nie, Y.; Dai, J.; Li, X.; Zhang, X. Recent developments on corrosion behaviors of Mg alloys with stacking fault or long period stacking ordered structures. J. Magnes. Alloy. 2020, 9, 1123–1146. [Google Scholar] [CrossRef]
- Sekar, P.; Narendranath, S.; Desai, V. Recent progress in in vivo studies and clinical applications of magnesium based biode-gradable implants—A Review. J. Magnes. Alloy. 2021, 9, 1147–1163. [Google Scholar] [CrossRef]
- Tsakiris, V.; Tardei, C.; Clicinschi, F.M. Biodegradable Mg alloys for orthopedic implants—A review. J. Magnes. Alloy. 2021, 9, 1884–1905. [Google Scholar] [CrossRef]
- Lotfpour, M.; Dehghanian, C.; Emamy, M.; Bahmani, A.; Malekan, M.; Saadati, A.; Taghizadeh, M.; Shokouhimehr, M. In-vitro cor-rosion behavior of the cast and extruded biodegradable Mg-Zn-Cu alloys in simulated body fluid (SBF). J. Magne-Sium Alloy. 2021, 9, 2078–2096. [Google Scholar] [CrossRef]
- Kruger, D.; Zeller-Plumhoff, B.; Wiese, B.; Yi, S.; Zuber, M.; Wieland, D.C.F.; Moosman, J.; Willumeit-Roemer, R. Assessing the mi-crostructure and in vitro degradation behavior of Mg-xGd screw implants using μCT. J. Magnes. Alloy. 2021, 9, 2207–2222. [Google Scholar] [CrossRef]
- Liu, Y.; Cheng, W.; Gu, X.; Liu, Y.; Cui, Z.; Wang, L.; Wang, H. Tailoring the microstructural characteristic and improving thw corrosion resistance of extruded dilute Mg-0.5Bi-0.5sn alloy by microalloying with Mn. J. Magnes. Alloy. 2021, 9, 1656–1668. [Google Scholar] [CrossRef]
- Zerankeshi, M.M.; Alizadeh, R.; Gerashi, E.; Asadollahi, M.; Langdon, T.G. Effects of heat treatment on the corrosion behavior and mechanical properties of biodegradable Mg alloys. J. Magnes. Alloy. 2022, 10, 1737–1785. [Google Scholar] [CrossRef]
- Gerashi, E.; Alizadeh, R.; Langdon, T.G. Effect of crystallographic texture and twinning on the corrosion behavior of Mg alloys: A review. J. Magnes. Alloy. 2021, 10, 313–325. [Google Scholar] [CrossRef]
- Du, Y.; Wang, X.; Liu, D.; Sun, W.; Jiang, B. Corrosion behaviour of a Mg-Zn-Ca_la alloy in 3.5 wt.% NaCl solution. J. Magnes. Alloy. 2022, 10, 527–539. [Google Scholar] [CrossRef]
- Pulido-González, N.; Hidalgo-Manrique, P.; García-Rodríguez, S.; Torres, B.; Rams, J. Effect of heat treatment on the mechanical and biocorrosion behaviour of two Mg-Zn-Ca alloys. J. Magnes. Alloy. 2021, 10, 540–554. [Google Scholar] [CrossRef]
- Fajardo, S.; Miguélez, L.; Arenas, M.; de Damborenea, J.; Llorente, I.; Feliu, S. Corrosion resistance of pulsed laser modified AZ31 Mg alloy surfaces. J. Magnes. Alloy. 2021, 10, 756–768. [Google Scholar] [CrossRef]
- Iranshahi, F.; Nasiri, M.B.; Warchomicka, F.G.; Sommitsch, C. Investigation of the degradation rate of electron beam processed and friction stir processed biocompatible ZKX50 magnesium alloy. J. Magnes. Alloy. 2021, 10, 707–720. [Google Scholar] [CrossRef]
- Bairagi, D.; Mandal, S. A comprehensive review on biocompatible Mg-based alloys as temporary orthopaedic implants: Cur-rent status, challenges, and future prospects. J. Magnes. Alloy. 2022, 10, 627–669. [Google Scholar] [CrossRef]
- Song, J.; Chen, J.; Xiong, X.; Peng, X.; Chen, D.; Pan, F. Research advances of magnesium and magnesium alloys worldwide in 2021. J. Magnes. Alloy. 2022, 10, 863–898. [Google Scholar] [CrossRef]
- Du, P.; Mei, D.; Furushima, T.; Zhu, S.; Wang, L.; Zhou, Y.; Guan, S. In vitro corrosion properties of HTHEed Mg-Zn-Y-Nd alloy microtubes for stent applications: Influence of second phase particles and crystal orientation. J. Magnes. Alloy. 2021, 10, 1286–1295. [Google Scholar] [CrossRef]
- Gnedenkov, A.S.; Sinebryukhov, S.L.; Filonina, V.S.; Egorkin, V.S.; Ustinov, A.Y.; Sergienko, V.I.; Gnedenkov, S.V. The detailed corro-sion performance of bioresorbable Mg-0.8Ca alloy in physiological solutions. J. Magnes. Alloy. 2022, 10, 1326–1350. [Google Scholar] [CrossRef]
- Tie, D.; Guan, R.; Liu, H.; Chen, M.; Ulasevich, S.A.; Skorb, E.V.; Holt-Torres, P.; Lu, X.; Hort, N. In vivo degradability and biocompati-bility of a rheo-formed Mg-Zn-Sr alloy for ureteral implantation. J. Magnes. Alloy. 2022, 10, 1631–1639. [Google Scholar] [CrossRef]
- Kavyani, M.; Ebrahimi, G.R.; Ezatpour, H.R.; Jahazi, M. Microstructure refinement, mechanical and biocorrosion properties of Mg-Zn-Ca-Mn alloy improved by a new severe plastic deformation process. J. Magnes. Alloy. 2022, 10, 1640–1662. [Google Scholar] [CrossRef]
- Tang, J.; Chen, L.; Li, Z.; Zhao, G.; Zhang, C.; Lin, J.; Zuo, Y. Microstructure characterization and corrosion behavior of hollow ZK60 Mg profile containing longitudinal welds. Corros. Sci. 2021, 193, 109875. [Google Scholar] [CrossRef]
- Xu, B.; Sun, J.; Han, J.; Yang, Z.; Zhou, H.; Xiao, L.; Xu, S.; Han, Y.; Ma, A.; Wu, G. Effect of hierarchical precipitates on corrosion be-havior of fine-grain magnesium-gadolinium-silver alloy. Corros. Sci. 2022, 194, 109924. [Google Scholar] [CrossRef]
- Zhang, C.; Liu, C.; Li, X.; Liu, K.; Tian, G.; Wang, J. Quantifying the influence of secondary phases on corrosion in multicomponent Mg alloys using X-ray computed microtomography. Corros. Sci. 2021, 195, 110010. [Google Scholar] [CrossRef]
- Lei, L.; Cui, Z.; Pan, H.; Pang, K.; Wang, X.; Cui, H. Effect of extrusion on the microstructure and corrosion behavior of Mg-Zn-Mn-(0, 1.5)Sr alloys in Hank’s solution. Corros. Sci. 2021, 195, 109975. [Google Scholar] [CrossRef]
- Wang, C.; Song, C.; Mei, D.; Wang, L.; Wang, W.; Wu, T.; Snihirova, D.; Zheludkevich, M.L.; Lamaka, S.V. Low interfacial pH discloses the favorable biodegradability of several Mg alloys. Corros. Sci. 2021, 197, 110059. [Google Scholar] [CrossRef]
- Feng, Y.-J.; Li, Q.; Zhao, T.-L.; Pan, F.-S. A quasi-passivated film formed on as-solutionized Mg-Sm-Zn-Zr alloy in NaCl solution. Corros. Sci. 2022, 198, 110136. [Google Scholar] [CrossRef]
- Chaudry, U.M.; Farooq, A.; bin Tayyab, K.; Malik, A.; Kamran, M.; Kim, J.-G.; Li, C.; Hamad, K.; Jun, T.-S. Corrosion behavior of AZ31 magnesium alloy with calcium addition. Corros. Sci. 2022, 199, 110205. [Google Scholar] [CrossRef]
- Kurchavov, D.; Haddad, M.; Lair, V.; Volovitch, P. Mg-alloys in water—Hydrophilic ionic liquid mixtures: Is there a negative difference effect? Corros. Sci. 2022, 200, 110178. [Google Scholar] [CrossRef]
- Yang, L.; Xu, W.; He, S.; Zhang, E.; Zhang, X.; Zhang, T.; Qin, G. On the effect of trace Si on accelerating the corrosion of Mg-Mn alloys. Corros. Sci. 2022, 201, 110258. [Google Scholar] [CrossRef]
- Benbouzid, A.Z.; Gomes, M.P.; Costa, I.; Gharbi, O.; Pébère, N.; Rossi, J.L.; Tran, M.T.; Tribollet, B.; Turmine, M.; Vivier, V. A new look on the corrosion mechanism of magnesium: An EIS investigation at different pH. Corros. Sci. 2022, 205, 110463. [Google Scholar] [CrossRef]
- Prasad, A.; Vashishtha, H.; Singh, S.S.; Gosvami, N.N.; Jain, J. La containing Mg alloy for enhanced corrosion at elevated temper-atures in ethylene glycol media. Corros. Sci. 2022, 205, 110446. [Google Scholar] [CrossRef]
- Feng, J.; Zhang, H.; Zhang, L.; Zou, G.; Wang, J.; Peng, Q. Microstructure and corrosion properties for ultrahigh-pressure Mg-Li alloys. Corros. Sci. 2022, 206, 110519. [Google Scholar] [CrossRef]
- Bexiga, N.M.; Alves, M.M.; Taryba, M.G.; Pinto, S.N.; Montemor, M. Early biomimetic degradation of Mg-2Ca alloy reveals the impact of β-phases at the interface of this biomaterial on a micro-scale level. Corros. Sci. 2022, 207, 110526. [Google Scholar] [CrossRef]
- Kousis, C.; Keil, P.; Hamilton, N.M.; Williams, G. The kinetics and mechanism of filiform corrosion affecting organic coated Mg alloy surfaces. Corros. Sci. 2022, 206, 110477. [Google Scholar] [CrossRef]
- Li, M.; Cucinotta, C.S.; Horsfield, A.P. The influence of surface Fe on the corrosion of Mg. J. Phys. Chem. Solids 2022, 170, 110936. [Google Scholar] [CrossRef]
- Soltan, A.; Dargusch, M.; Shi, Z.; Gerrard, D.; Atrens, A. Understanding the corrosion behaviour of the magnesium alloys EV31A, WE43B, and ZE41A. Mater. Corros. 2019, 70, 1527–1552. [Google Scholar] [CrossRef]
- Soltan, A.; Dargusch, M.S.; Shi, Z.; Gerrard, D.; al Shabibi, S.; Kuo, Y.; Atrens, A. Corrosion of Mg alloys EV31A, WE43B, and ZE41A in chloride- and sulfate-containing solutions saturated with magnesium hydroxide. Mater. Corros. 2020, 71, 956–979. [Google Scholar] [CrossRef]
- Winzer, N.; Atrens, A.; Song, G.-L.; Ghali, E.; Dietzel, W.; Kainer, K.U.; Hort, N.; Blawert, C. A Critical Review of the Stress Corrosion Cracking (SCC) of Magnesium Alloys. Adv. Eng. Mater. 2005, 7, 659–693. [Google Scholar] [CrossRef]
- Atrens, A.; Winzer, N.; Dietzel, W.; Srinivasan, P.B.; Song, G. Stress corrosion cracking of magnesium (Mg) alloys. In Corrosion of Magnesium Alloys; Woodhead Publishing: Sawston, UK, 2011; pp. 299–364. [Google Scholar]
- Atrens, A.; Dietzel, W.; Srinivasan, P.B.; Winzer, N.; Kannan, M.B. Stress Corrosion Cracking (SCC) of Magnesium Alloys; Woodhead Publishing: Sawston, UK, 2011; pp. 341–380. [Google Scholar] [CrossRef]
- Atrens, A.; Winzer, N.; Dietzel, W. Stress Corrosion Cracking of Magnesium Alloys. Adv. Eng. Mater. 2011, 13, 11–18. [Google Scholar] [CrossRef]
- Winzer, N.; Atrens, A.; Dietzel, W.; Song, G.; Kainer, K.U. Evaluation of the Delayed Hydride Cracking Mechanism for Trans-granular Stress Corrosion Cracking of Magnesium Alloys. Mater. Sci. Eng. A 2007, 466, 18–31. [Google Scholar] [CrossRef]
- Shi, Z.; Kim, W.; Cao, F.; Dargusch, M.S.; Atrens, A. Stress corrosion cracking of high-strength AZ31 processed by high-ratio differential speed rolling. J. Magnes. Alloy. 2015, 3, 271–282. [Google Scholar] [CrossRef]
- Shi, Z.; Hofstetter, J.; Cao, F.; Uggowitzer, P.J.; Dargusch, M.S.; Atrens, A. Corrosion and stress corrosion cracking of ul-tra-high-purity Mg5Zn. Corros. Sci. 2015, 93, 330–335. [Google Scholar] [CrossRef]
- Atrens, A.; Liu, M.; Abidin, N.I.Z. Corrosion mechanism applicable to biodegradable magnesium implants. Mater. Sci. Eng. B 2011, 176, 1609–1636. [Google Scholar] [CrossRef]
- Abidin, N.I.Z.; Rolfe, B.; Owen, H.; Malisano, J.; Martin, D.; Hofstetter, J.; Uggowitzer, P.; Atrens, A. The in vivo and in vitro corrosion of high-purity magnesium and magnesium alloys WZ21 and AZ91. Corros. Sci. 2013, 75, 354–366. [Google Scholar] [CrossRef]
- Abidin, N.I.Z.; Atrens, A.D.; Martin, D.; Atrens, A. The corrosion of high purity Mg, Mg2Zn0.2Mn, ZE41 and AZ91 in Hank’s solution at 37 °C. Corros. Sci. 2011, 53, 3542–3556. [Google Scholar] [CrossRef]
- Mardina, Z.; Venezuela, J.; Dargusch, M.S.; Shi, Z.; Atrens, A. The influence of the protein bovine serum albumin (BSA) on the corrosion of Mg, Zn, and Fe in Zahrina’s simulated interstitial fluid. Corros. Sci. 2022, 199, 110160. [Google Scholar] [CrossRef]
- Johnston, S.; Shi, Z.; Atrens, A. The influence of pH on the corrosion rate of high-purity Mg, AZ91 and ZE41 in bicarbonate buffered Hanks’ solution. Corros. Sci. 2015, 101, 182–192. [Google Scholar] [CrossRef]
- Tan, Q.; Yin, Y.; Mo, N.; Zhang, M.; Atrens, A. Recent understanding of the oxidation and burning of magnesium alloys. Surf. Innov. 2019, 7, 71–92. [Google Scholar] [CrossRef]
- Tan, Q.Y.; Mo, N.; Lin, C.L.; Zhao, Y.T.; Yin, Y.; Jiang, B.; Pan, F.S.; Atrens, A.; Uang, H.; Zhang, M.X. Generalisation of the oxide rein-forcement model for the high oxidation resistance of some Mg alloys micro-alloyed with Be. Corros. Sci. 2019, 147, 357–377. [Google Scholar] [CrossRef]
- Prasad, A.; Shi, Z.; Atrens, A. Flammability of Mg-X Binary Alloys. Adv. Eng. Mater. 2012, 14, 772–784. [Google Scholar] [CrossRef]
- Tan, Q.; Mo, N.; Jiang, B.; Pan, F.; Atrens, A.; Zhang, M.-X. Combined influence of Be and Ca on improving the high-temperature oxidation resistance of the magnesium alloy Mg-9Al-1Zn. Corros. Sci. 2017, 122, 1–11. [Google Scholar] [CrossRef]
- Tan, Q.; Mo, N.; Lin, C.-L.; Jiang, B.; Pan, F.; Huang, H.; Atrens, A.; Zhang, M.-X. Improved oxidation resistance of Mg-9Al-1Zn alloy microalloyed with 60 wt ppm Be attributed to the formation of a more protective (Mg,Be)O surface oxide. Corros. Sci. 2018, 132, 272–283. [Google Scholar] [CrossRef]
- Chen, X.; Liu, X.; Le, Q.; Zhang, M.; Liu, M.; Atrens, A. A comprehensive review of the development of magnesium anodes for primary batteries. J. Mater. Chem. A 2021, 9, 12367–12399. [Google Scholar] [CrossRef]
- Zheng, Z.R.; Zhao, M.C.; Tan, L.L.; Zhao, Y.C.; Xie, B.; Yin, D.F.; Yang, K.; Atrens, A. Corrosion behavior of a self-sealing coating con-taining CeO2 particles on pure Mg produced by micro-arc oxidation. Surf. Coat. Technol. 2020, 386, 125456. [Google Scholar] [CrossRef]
- Yao, W.; Liang, W.; Huang, G.; Jiang, B.; Atrens, A.; Pan, F. Superhydrophobic coatings for corrosion protection of magnesium alloys. J. Mater. Sci. Technol. 2020, 52, 100–118. [Google Scholar] [CrossRef]
- Zhang, G.; Wu, L.; Tang, A.; Ma, Y.; Song, G.; Zheng, D.; Jiang, B.; Atrens, A.; Pan, F. Active corrosion protection by a smart coating based on a MgAl-layered double hydroxide on a cerium-modified plasma electrolytic oxidation coating on Mg alloy AZ31. Corros. Sci. 2018, 139, 370–382. [Google Scholar] [CrossRef]
- Soltan, A.; Dargusch, M.S.; Shi, Z.; Jones, F.; Wood, B.; Gerrard, D.; Atrens, A. Effect of corrosion inhibiting compounds on the corrosion behaviour of pure magnesium and the magnesium alloys EV31A, WE43B and ZE41A. J. Magnes. Alloy. 2020, 9, 432–455. [Google Scholar] [CrossRef]
- Soltan, A.; Dargusch, M.S.; Shi, Z.M.; Gerrard, D.; Atrens, A. Influence of commercial corrosion-inhibiting compounds on the at-mospheric corrosion of the magnesium alloys EV31A, WE43B, ZE41A and pure magnesium. Mater. Corros. 2021, 72, 672–693. [Google Scholar] [CrossRef]
- Shi, Z.; Atrens, A. An innovative specimen configuration for the study of Mg corrosion. Corros. Sci. 2011, 53, 226–246. [Google Scholar] [CrossRef]
- Shi, Z.; Prasad, A.; Atrens, A. Plug-In Specimens for Measurement of the Corrosion Rate of Mg Alloys. JOM 2012, 64, 657–663. [Google Scholar] [CrossRef]
- Liu, M.; Zanna, S.; Ardelean, H.; Frateur, I.; Schmutz, P.; Song, G.-L.; Atrens, A.; Marcus, P. A first quantitative XPS study of the surface films formed, by exposure to water, on Mg and on the Mg–Al intermetallics: Al3Mg2 and Mg17Al12. Corros. Sci. 2009, 51, 1115–1127. [Google Scholar] [CrossRef]
- Song, G.L.; Atrens, A.; John, D.S. An hydrogen evolution method for the estimation of the corrosion rate of magnesium alloys. Magnes. Technol. 2001, 255–262. [Google Scholar] [CrossRef]
- Bottini, L.; Santamaria, M.; Curioni, M. Development of an Electrochemical Balance to Measure Quantitatively Hydrogen Generation during Electrochemical Processes. J. Electrochem. Soc. 2017, 164, C618–C625. [Google Scholar] [CrossRef]
- Cao, F.; Shi, Z.; Song, G.L.; Liu, M.; Atrens, A. Corrosion behaviour in salt spray and in 3.5 % NaCl solution saturated with Mg(OH)2 of as-cast and solution heat-treated binary Mg-X alloys: X = Mn, Sn, Ca, Zn, Al, Zr, Si, Sr. Corros. Sci. 2013, 76, 60–97. [Google Scholar] [CrossRef]
- Johnston, S.; Shi, Z.; Dargusch, M.; Atrens, A. Influence of surface condition on the corrosion of ultra-high-purity Mg alloy wire. Corros. Sci. 2016, 108, 66–75. [Google Scholar] [CrossRef]
- Atrens, A.; Shi, Z.; Mehreen, S.U.; Johnston, S.; Song, G.-L.; Chen, X.; Pan, F. Review of Mg alloy corrosion rates. J. Magnes. Alloy. 2020, 8, 989–998. [Google Scholar] [CrossRef]
- Liu, M.; Uggowitzer, P.J.; Nagasekhar, A.V.; Schmutz, P.; Easton, M.; Song, G.; Atrens, A. Calculated phase diagrams and the corro-sion of die-cast Mg-Al alloys. Corros. Sci. 2009, 51, 602–619. [Google Scholar] [CrossRef]
- Yang, L.; Zhou, X.; Liang, S.-M.; Schmid-Fetzer, R.; Fan, Z.; Scamans, G.; Robson, J.; Thompson, G. Effect of traces of silicon on the formation of Fe-rich particles in pure magnesium and the corrosion susceptibility of magnesium. J. Alloys Compd. 2015, 619, 396–400. [Google Scholar] [CrossRef]
- Hanawalt, J.D.; Nelson, C.E.; Peloubet, J.A. Corrosion studies of magnesium and its alloys. Trans. of the Am. Inst. of Min. and Metall. Engineers. 1942, 147, 273. [Google Scholar]
- Taltavull, C.; Shi, Z.; Torres, B.; Rams, J.; Atrens, A. Influence of the chloride ion concentration on the corrosion of high-purity Mg, ZE41 and AZ91 in buffered Hank’s solution. J. Mater. Sci. Mater. Med. 2013, 25, 329–345. [Google Scholar] [CrossRef] [PubMed]
- Xu, W.; Birbilis, N.; Sha, G.; Wang, Y.; Daniels, J.; Xiao, Y.; Ferry, M. A high-specific-strength and corrosion-resistant magnesium alloy. Nat. Mater. 2015, 14, 1229–1235. [Google Scholar] [CrossRef]
- Frankel, G.S. Ready for the road. Nat. Mater. 2015, 14, 1189. [Google Scholar] [CrossRef]
- Cao, F.; Shi, Z.; Hofstetter, J.; Uggowitzer, P.J.; Song, G.; Liu, M.; Atrens, A. Corrosion of ultra-high-purity Mg in 3.5% NaCl solution saturated with Mg(OH)2. Corros. Sci. 2013, 75, 78–99. [Google Scholar] [CrossRef]
- Yang, L.; Liu, G.; Ma, L.; Zhang, E.; Zhou, X.; Thompson, G. Effect of iron content on the corrosion behaviour of pure magnesium: Critical factor for iron tolerance limit. Corros. Sci. 2018, 139, 421–429. [Google Scholar] [CrossRef]
- Li, Y.; Shi, Z.; Chen, X.; Atrens, A. Anodic hydrogen evolution on Mg. J. Magnes. Alloy. 2021, 9, 2049–2062. [Google Scholar] [CrossRef]
- Frankel, G.; Samaniego, A.; Birbilis, N. Evolution of hydrogen at dissolving magnesium surfaces. Corros. Sci. 2013, 70, 104–111. [Google Scholar] [CrossRef] [Green Version]
- Birbilis, N.; King, A.; Thomas, S.; Frankel, G.; Scully, J. Evidence for enhanced catalytic activity of magnesium arising from anodic dissolution. Electrochim. Acta 2014, 132, 277–283. [Google Scholar] [CrossRef]
- Fajardo, S.; Frankel, G.S. Effect of impurities on the enhanced catalytic activity for hydrogen evolution in high purity magnesium. Electrochim. Acta 2015, 165, 255–267. [Google Scholar] [CrossRef]
- Bockris, J.O.; Reddy, A.K.N.; Vijh, A.K. Modern Electrochemistry. J. Electrochem. Soc. 1972, 119, 136C. [Google Scholar] [CrossRef]
- Ma, H.; Liu, M.; Chen, W.; Wang, C.; Chen, X.-Q.; Dong, J.; Ke, W. First-principles study on the effects of twin boundaries on anodic dissolution of Mg. Phys. Rev. Mater. 2019, 3, 053806. [Google Scholar] [CrossRef]
- Ma, H.; Chen, X.-Q.; Li, R.; Wang, S.; Dong, J.; Ke, W. First-principles modeling of anisotropic anodic dissolution of metals and alloys in corrosive environments. Acta Mater. 2017, 130, 137–146. [Google Scholar] [CrossRef]
- Chen, X.; Zou, Q.; Le, Q.; Zhang, M.; Liu, M.; Atrens, A. Influence of heat treatment on the discharge performance of Mg-Al and Mg-Zn alloys as anodes for the Mg-air battery. Chem. Eng. J. 2022, 433, 133797. [Google Scholar] [CrossRef]
- Chen, X.; Jia, Y.; Shi, Z.; Le, Q.; Li, J.; Zhang, M.; Liu, M.; Atrens, A. Understanding the discharge behavior of an ultra-high-purity Mg anode for Mg–air primary bat-teries. J. Mater. Chem. A 2021, 9, 21387–21401. [Google Scholar] [CrossRef]
- Chen, X.; Atrens, A. A new anodic properties evaluation indicator for the magnesium-based anodes of magnesium-air batteries: The apparent valence. Int. J. Energy Res. 2022, 1–9. [Google Scholar] [CrossRef]
| Publisher’s Note: MDPI stays neutral with regard to jurisdictional claims in published maps and institutional affiliations. |
© 2022 by the authors. Licensee MDPI, Basel, Switzerland. This article is an open access article distributed under the terms and conditions of the Creative Commons Attribution (CC BY) license (https://creativecommons.org/licenses/by/4.0/).


