Article

N-b-Hydroxyethyl Oleyl Imidazole as Synergist to Enhance the Corrosion Protection Effect of Natural Cocoyl Sarcosine on Steel

1
Department of Physics, University Koblenz-Landau, 56070 Koblenz, Germany
2
Institute of Mechanics and Material Science, TH Mittelhessen University of Applied Sciences, 35390 Giessen, Germany
3
Materials Science, Energy and Nano-Engineering Department, Mohammed VI Polytechnic University, Ben Guerir 43150, Morocco
*
Authors to whom correspondence should be addressed.
Corros. Mater. Degrad. 2022, 3(3), 536-552; https://doi.org/10.3390/cmd3030029
Submission received: 18 July 2022 / Revised: 3 September 2022 / Accepted: 5 September 2022 / Published: 8 September 2022
(This article belongs to the Special Issue Corrosion Barrier Coatings)

Abstract

:
To investigate the corrosion protection behavior of naturally derived cocoyl sarcosine in combination with N-b-hydroxyethyl oleyl imidazole for steel CR4 in 0.1 M NaCl, different evaluation systems (weight loss, electrochemical measurements, and spray corrosion tests) were used. Both compounds were tested in different concentrations (25–100 mmol/L) and with variable dip coating times (1–30 min), first individually and then in combination, to check any synergistic effects for surface protection. Both showed only an insignificant corrosion inhibiting effect with less than 50% efficiency at all concentrations and dip coating times if used alone. In contrast, compound combinations revealed an improved corrosion inhibition correlated with higher concentrations. Across all methods, the compound combination concentration of 100 mmol/L resulted in improved efficiency of up to 83% for gravimetric tests, up to 84% for the impedance measure and more than 91% for potentiodynamic polarization. Dip coating variations proved 10 min to be the best option for all compounds with a maximum efficiency of up to 86% for the compound combination.

Graphical Abstract

1. Introduction

Corrosion protection of steel with inhibitors is still one of the most cost-effective methods for the majority of applications, especially in industry [1,2,3]. The inhibitor substance itself can be an organic or inorganic chemical compound. It reduces corrosion when added to the medium, preferably in small quantities, or adsorbed directly on the metal surface, depending on its dissolution ability [1,4,5,6]. Industrially produced organic inhibitors include amines, imidazoles, and acetylenic alcohols, just to name a few [1]. Several research papers have investigated plant-derived organic inhibitors containing nitrogen or oxygen atoms, but also heterocyclic motives with polar groups, which could be used as alternatives to protect steel without environmental risk [7,8,9,10,11,12]. These substances have at least one unbound pair of electrons, usually from the heteroatoms they contain. Adsorption then occurs due to the interaction between these electrons and the metal surface [1,13,14].
Organic inhibitors prevent the corrosion of metals by isolating the active metal surface from its environment. Ideally, this happens by the adsorption of a thin monolayer film on the metal surface [1,14,15,16]. The polar group of the organic inhibitor adheres to the metal surface and the nonpolar hydrocarbon moiety forms a hydrophobic barrier to repel water [1,17]. The efficiency of the compound is influenced by various factors, such as its molecular weight, length of the hydrocarbon chain and its concentration [1,9,18,19,20,21,22,23,24,25,26]. The adsorption ability of the inhibitor on the metal surface generally increases with its concentration and a larger molecular weight [6,9,20].
Previous studies already confirmed that amino acids and derivatives of amino carboxylic acids protect steel against corrosion without harming the environment [6,25,27,28,29,30]. Ochoa et al. [31,32,33] investigated the synergistic effect of a combination of fatty amines containing oleoyl residues together with phosphorus-containing carboxylic acids on the corrosion reduction of carbon steel and classified them as mixed type inhibitors. As reported in recent works, the efficiency of an inhibitor system composed of sarcosine amino acid and fatty residues reduces corrosion as a function of carbon chain length, molecular weight, its concentration, and the dip coating time of steel in the inhibitor solution needed for surface adsorption [6,34]. The linkage between the polar sarcosine and the hydrocarbon chain of the fatty acid improves the overall solubility in many solvents and increases the acidity of the carboxyl group, resulting in better adsorption than free fatty acid [17]. Moreover, acyl sarcosine derivatives are used in cosmetics manufacturing, as they have no negative effects on humans and the environment [19,20].
One source of the fatty residues is, for example, coconuts. The fat content can be extracted as a naturally occurring mixture of fatty acids, which must first be separated to be resynthesized as individual sarcosine derivatives [6,20,34]. In this context, it would be advantageous if the naturally occurring fatty acid mixture could be used as sarcosine derivative, the so-called cocoyl-sarcosine (C). The N-acyl sarcosine substance C is known to have anticorrosive properties and whether it could be synergistically improved by the use of an additional active ingredient remains unanswered. Compound C is anionic in nature, registered as a mild substance, and shows efficiency in corrosion protection, is non-toxic and has aerobic and anaerobic biodegradability [17,20]. The fatty acids in compound C attached to sarcosine are a natural mixture of different hydrocarbon chains, usually in the following range of: 2–4% C10, up to 55% C12, 19–22% C14, 0–7% C16, 4–21% C18, 0–8% oleic acid, and 0–3% unsaturated fatty acids [20]. The acyl sarcosine derivatives adsorb on metallic surfaces, with the adsorption process occurring essentially via the amino acid portion of the molecule [6,17,20].
The second compound is N-b-hydroxyethyl oleyl imidazole (OI). Derivatives of oleyl imidazoles are widely used as corrosion inhibitors to reduce carbon dioxide-induced corrosion in acidic environments e.g., oil production [35]. OI consists of a five membered ring with two nitrogen atoms that can interact with the metal surface, a long hydrocarbon chain that acts as a hydrophobic barrier to water, and an additional short side chain that carries hydroxy functionality and, thus, meets the proven criteria of an inhibitor [35].
In the current study cocoyl sarcosine (C) with natural fatty acid content and N-b-hydroxyethyl oleyl imidazole (OI) are investigated individually and in combination (C + OI) with regard to their corrosion protection ability by surface adsorption. Different concentrations of C, OI and C + OI (25–100 mmol/L) are tested, as well as various dip coating times (1–30 min) to reduce corrosion of steel type CR4 in 0.1 M NaCl.

2. Materials and Methods

2.1. Metal Specimens and Weight Loss
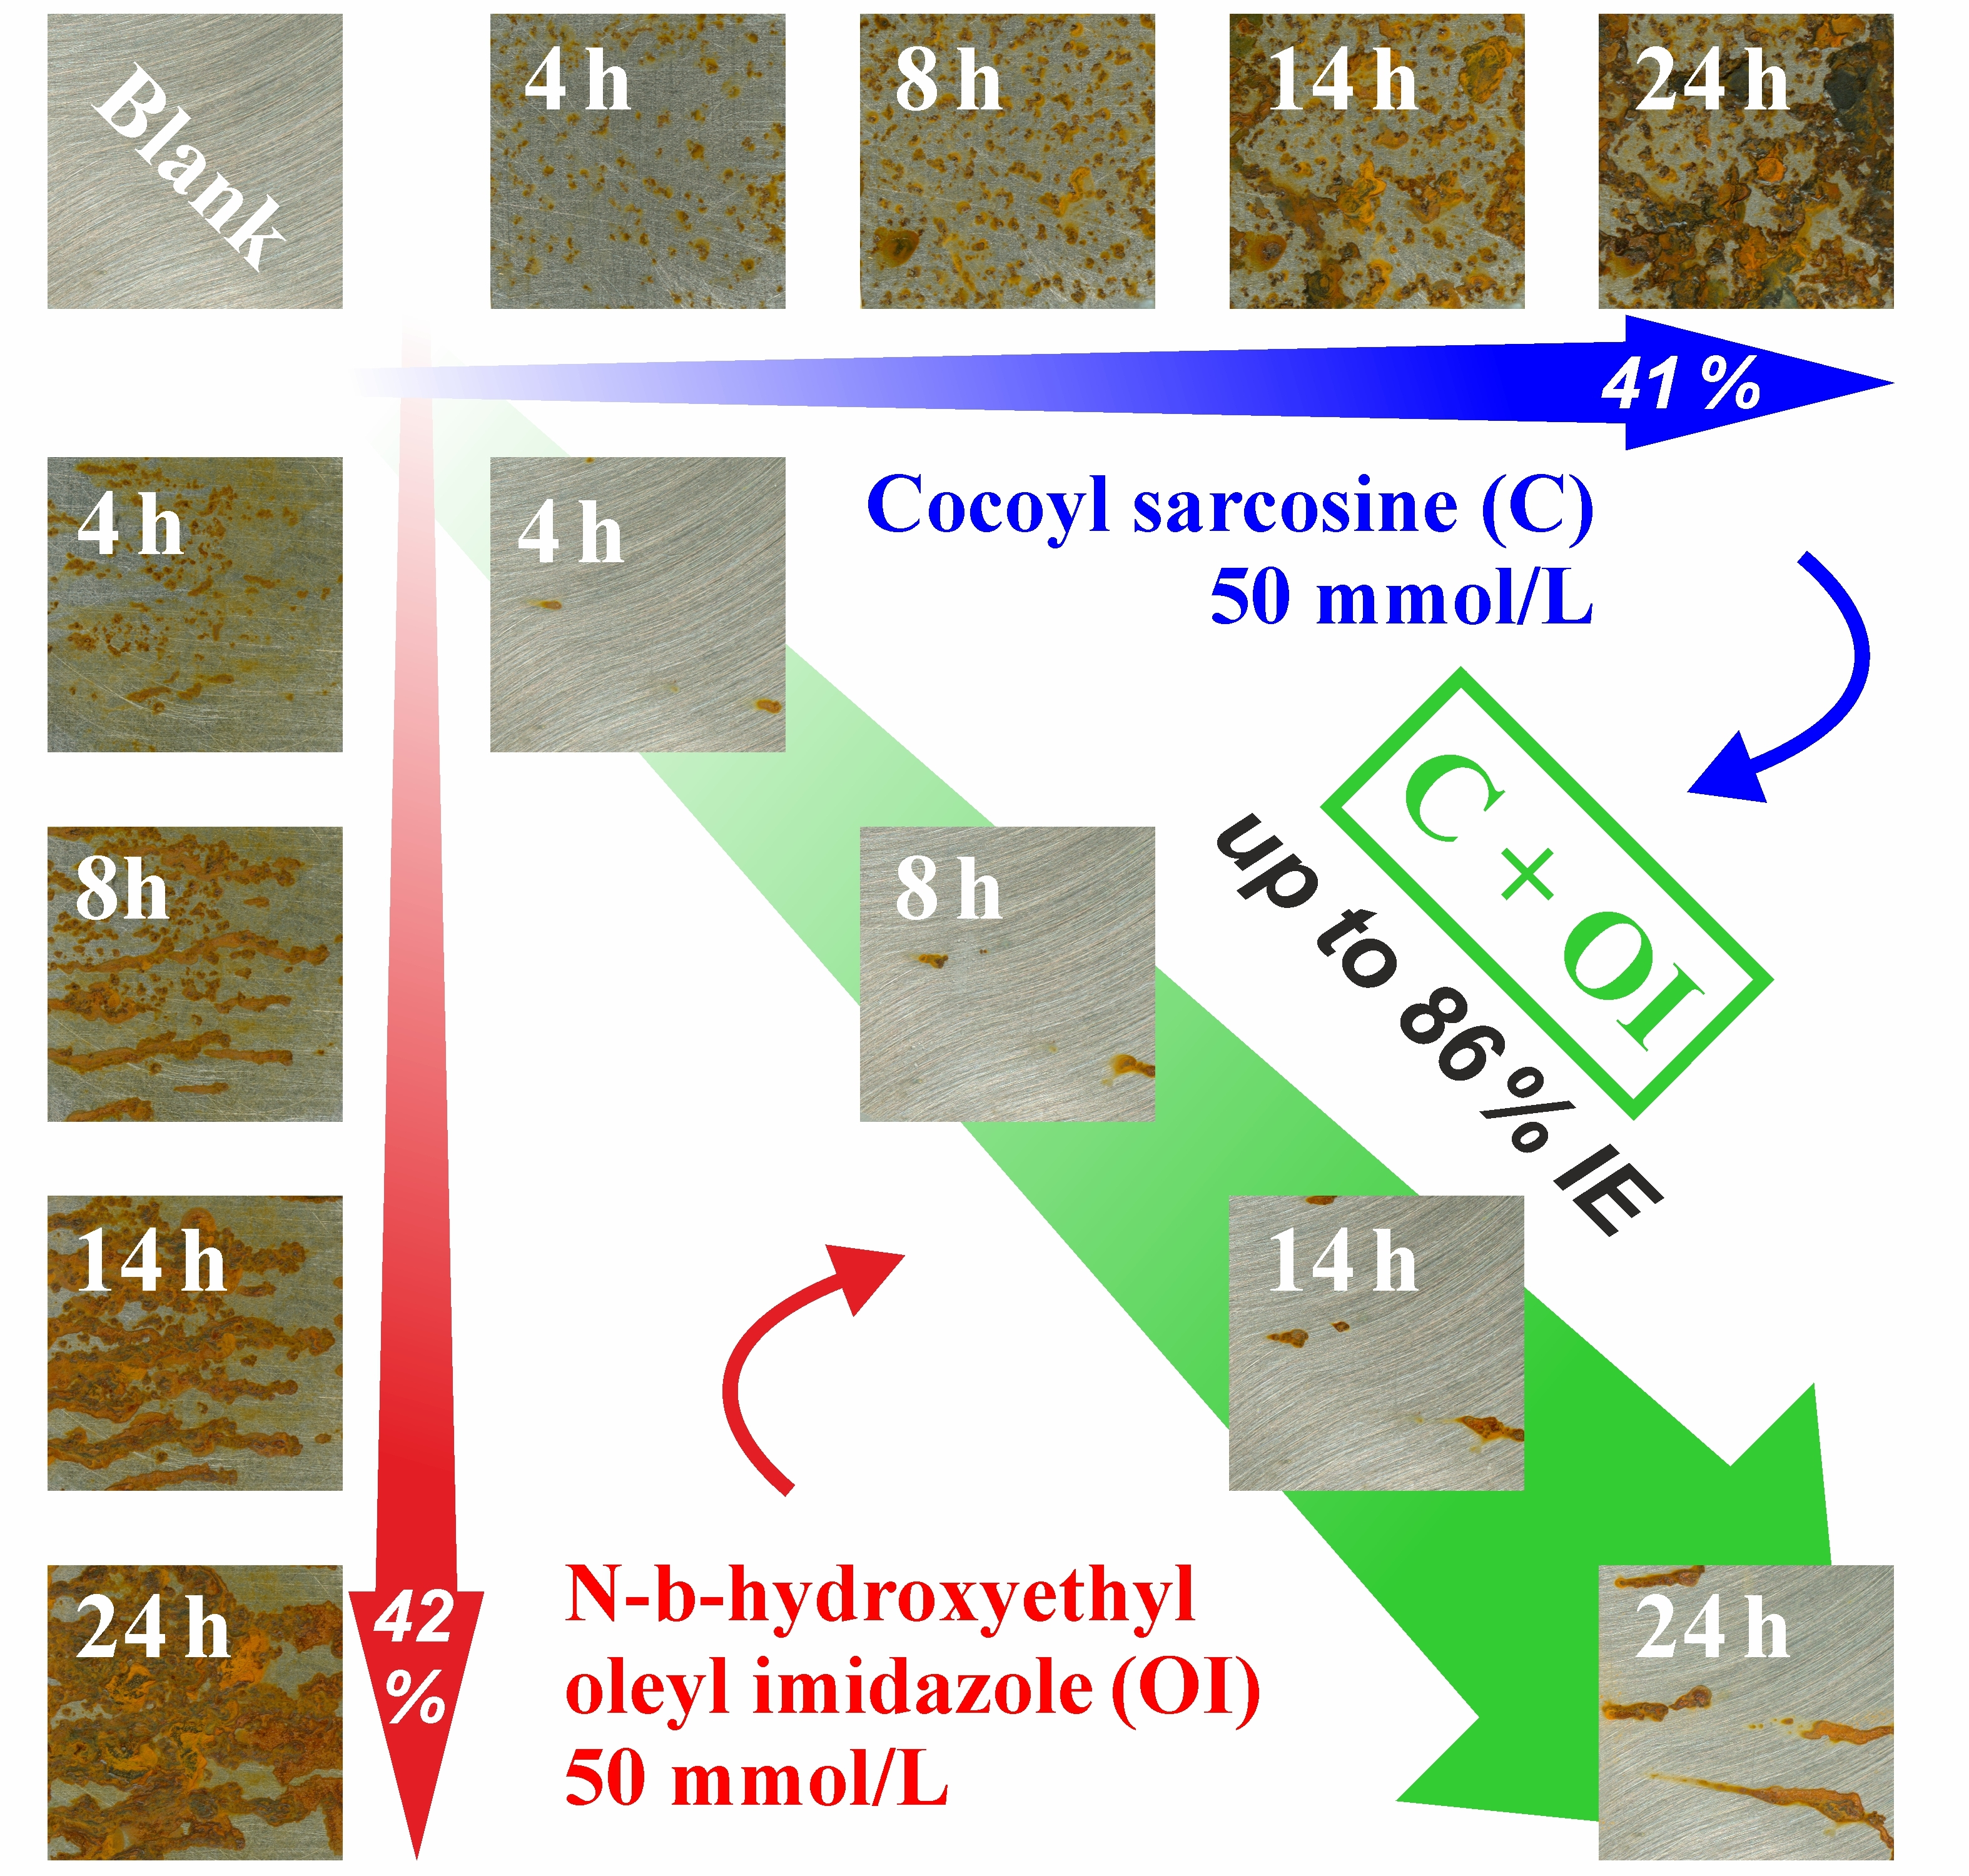
Low carbon CR4 steel coupons (25 × 25 × 1 mm3, Nick-Stanztechnik, Koblenz, Germany) were taken for corrosion testing in 0.1 M NaCl. Optical emission spectroscopy (variolab, Belec Spektrometric Opto-Elektronik GmbH, Georgsmarienhütte, Germany) was used to verify the steel composition and to compare it with the standards (Table 1) [36].
The grinding and preparation of the steel specimen was performed according to reference [6] and DIN-ISO 9227:2006 [37,38], and is, therefore, only briefly summarized: Metal specimen grinding with emery paper P120 and 220 (WS FLEX 18c water proof, HERMES, Hamburg, Germany), ultrasonic cleaning with isopropanol, drying or storage at 60 °C (if needed) before inhibitor coating. Finally, the CR4 samples were dip coated in the respective inhibitor solution for specific times and used immediately.
Weight loss (WL) measurements (KERN 770, error ± 0.01 mg) for uncoated and coated steel CR4 were carried out for both compounds. Prepared metal specimens were immersed for 24 h in 1 L of aqueous NaCl solution (0.1 M), washed thereafter twice with distilled water before rust products were removed via immersion in 0.5 M hydrochloric acid for 10 s. The coupons were then cleaned directly with distilled water and isopropanol, dried thoroughly, and weighed accurately to determine any weight differences [39].

2.2. Inhibitors

As inhibitory compounds (Figure 1), the cocoyl sarcosine (C) [20] and N-b-hydroxyethyl oleyl imidazole (OI) as potential synergist were used [31,32,33,35]. As detected by GC-MS (Thermo Finnigan Q-GC, GCQ/Polaris MS, Thermo Fisher Scientific Inc., Waltham, MA, USA) the present, natural composed compound C contained the following as main fatty residues: 3.1% C 8, 4.2% C 10, 41.8% C 12, 18.9% C 14, 9.7% C 16, and 9.3% C 18. Stock solutions for the dip coating were provided at four concentrations (25, 50, 75, and 100 mmol/L) of both single compounds in toluene (see Supplementary SI 1) [34]. For the inhibitor combinations C + OI, respective stock solutions were combined in 50:50 volume percent so that they finally had the same molecular concentrations (25, 50, 75, and 100 mmol/L). For each individual inhibitor use and combination, fresh (or properly stored) metal specimens were used and fresh solutions were prepared.
For the evaluation of the inhibitory effect of C, OI and C + OI via electrochemical measures and spray corrosion the dip coating was arranged for 10 min at all concentrations. For the investigation on dip coating time, a 50 mmol/L concentration at various times (1, 2.5, 5, 10, and 30 min) was chosen according to reference [34]. Surface microscopic studies were carried out with a scanning electron microscopy (SEM, LEO 1450 ZEISS, Carl Zeiss, Aalen, Germany, WD 20 mm) equipped with an energy dispersive X-ray spectroscopy (EDS) for the 100 mmol/L concentration of C + OI to show film formation.

2.3. Electrochemical Measurements

Potentiodynamic polarization (PP) was recorded using a potentiostat (Laboratory—Galvanostate Wenking LPG03 system, Bank Electronic—Intelligent Controls GmbH, Pohlheim, Germany) for the prepared CR4 coupons in 0.1 M NaCl according to [6]. The three-electrode set up in a double-walled glass vessel was: reference electrode (RE) Ag/AgCl, a sample holder to expose 1 cm2 of specimen area as working electrode, and platinum as auxiliary electrode. To avoid and minimize effects of distortion in the analysis of Tafel slopes and corrosion current density, a scan rate of 0.5 mV/s was adopted, which was not deleterious as reported in previous work [40,41,42]. Further conditions were the following: The electrode system was immersed in the electrolyte for 30 min to achieve the stable open circuit condition (OCP); a voltage range of ±200 mV was applied depending on the OCP value.
Electrochemical impedance spectroscopy (EIS) was also performed in 0.1 M NaCl. The two-electrode setup (identical to above, but with no RE) was carried out using a Frequency Response Analyzer PSM 1700 (Newtons4th Ltd., Loughborough, UK). Frequencies from 100 kHz to 0.1 Hz and an AC amplitude sweep of 4 mV, peak-to-peak (AC) signal in OCP with 10 points per decade were applied [40]. In all electrochemical tests, 800 mL of a 0.1 mol/L NaCl aerated stirring solution with a stable pH of 6.5 ± 0.5 (pH-Meter, EL20/EL2, Toledo Group, Greifensee, Switzerland) was used as the electrolyte at room temperature (RT). To ensure reproducibility, a complete series consisted of at least three independent measurements for each inhibitor set or its combination.

2.4. Spray Corrosion Test

Following our previous work [6], a spray corrosion evaluation for 24 h was performed for both inhibitors C and OI at a concentration of 50 mmol/L and for the combination C + OI at four different concentrations (25, 50, 75, and 100 mmol/L). The experimental details and evaluation procedure are described in detail in reference [6]. In short, the key points are the following: The corrosion process of each series (in duplicate), each comprising five specimen, was checked and documented at five specific times (2, 4, 8, 14, and 24 h). Digital documentation of the degradation process was carried out with a scanner (HP Scanjet G4010, @1200 dpi, Hewlett Packard, Palo Alto, CA, USA). An ImageJ [43] implemented macro (extraction of blue channel, threshold adjustment, excluding 3 × 3 pixel artifacts) was used to quantify the corroded area and its respective number of spots on the central surface of the samples (20 mm × 20 mm, excluding edges). Data processing was done with Orgin Pro 8.1 [44].

3. Results and Discussion

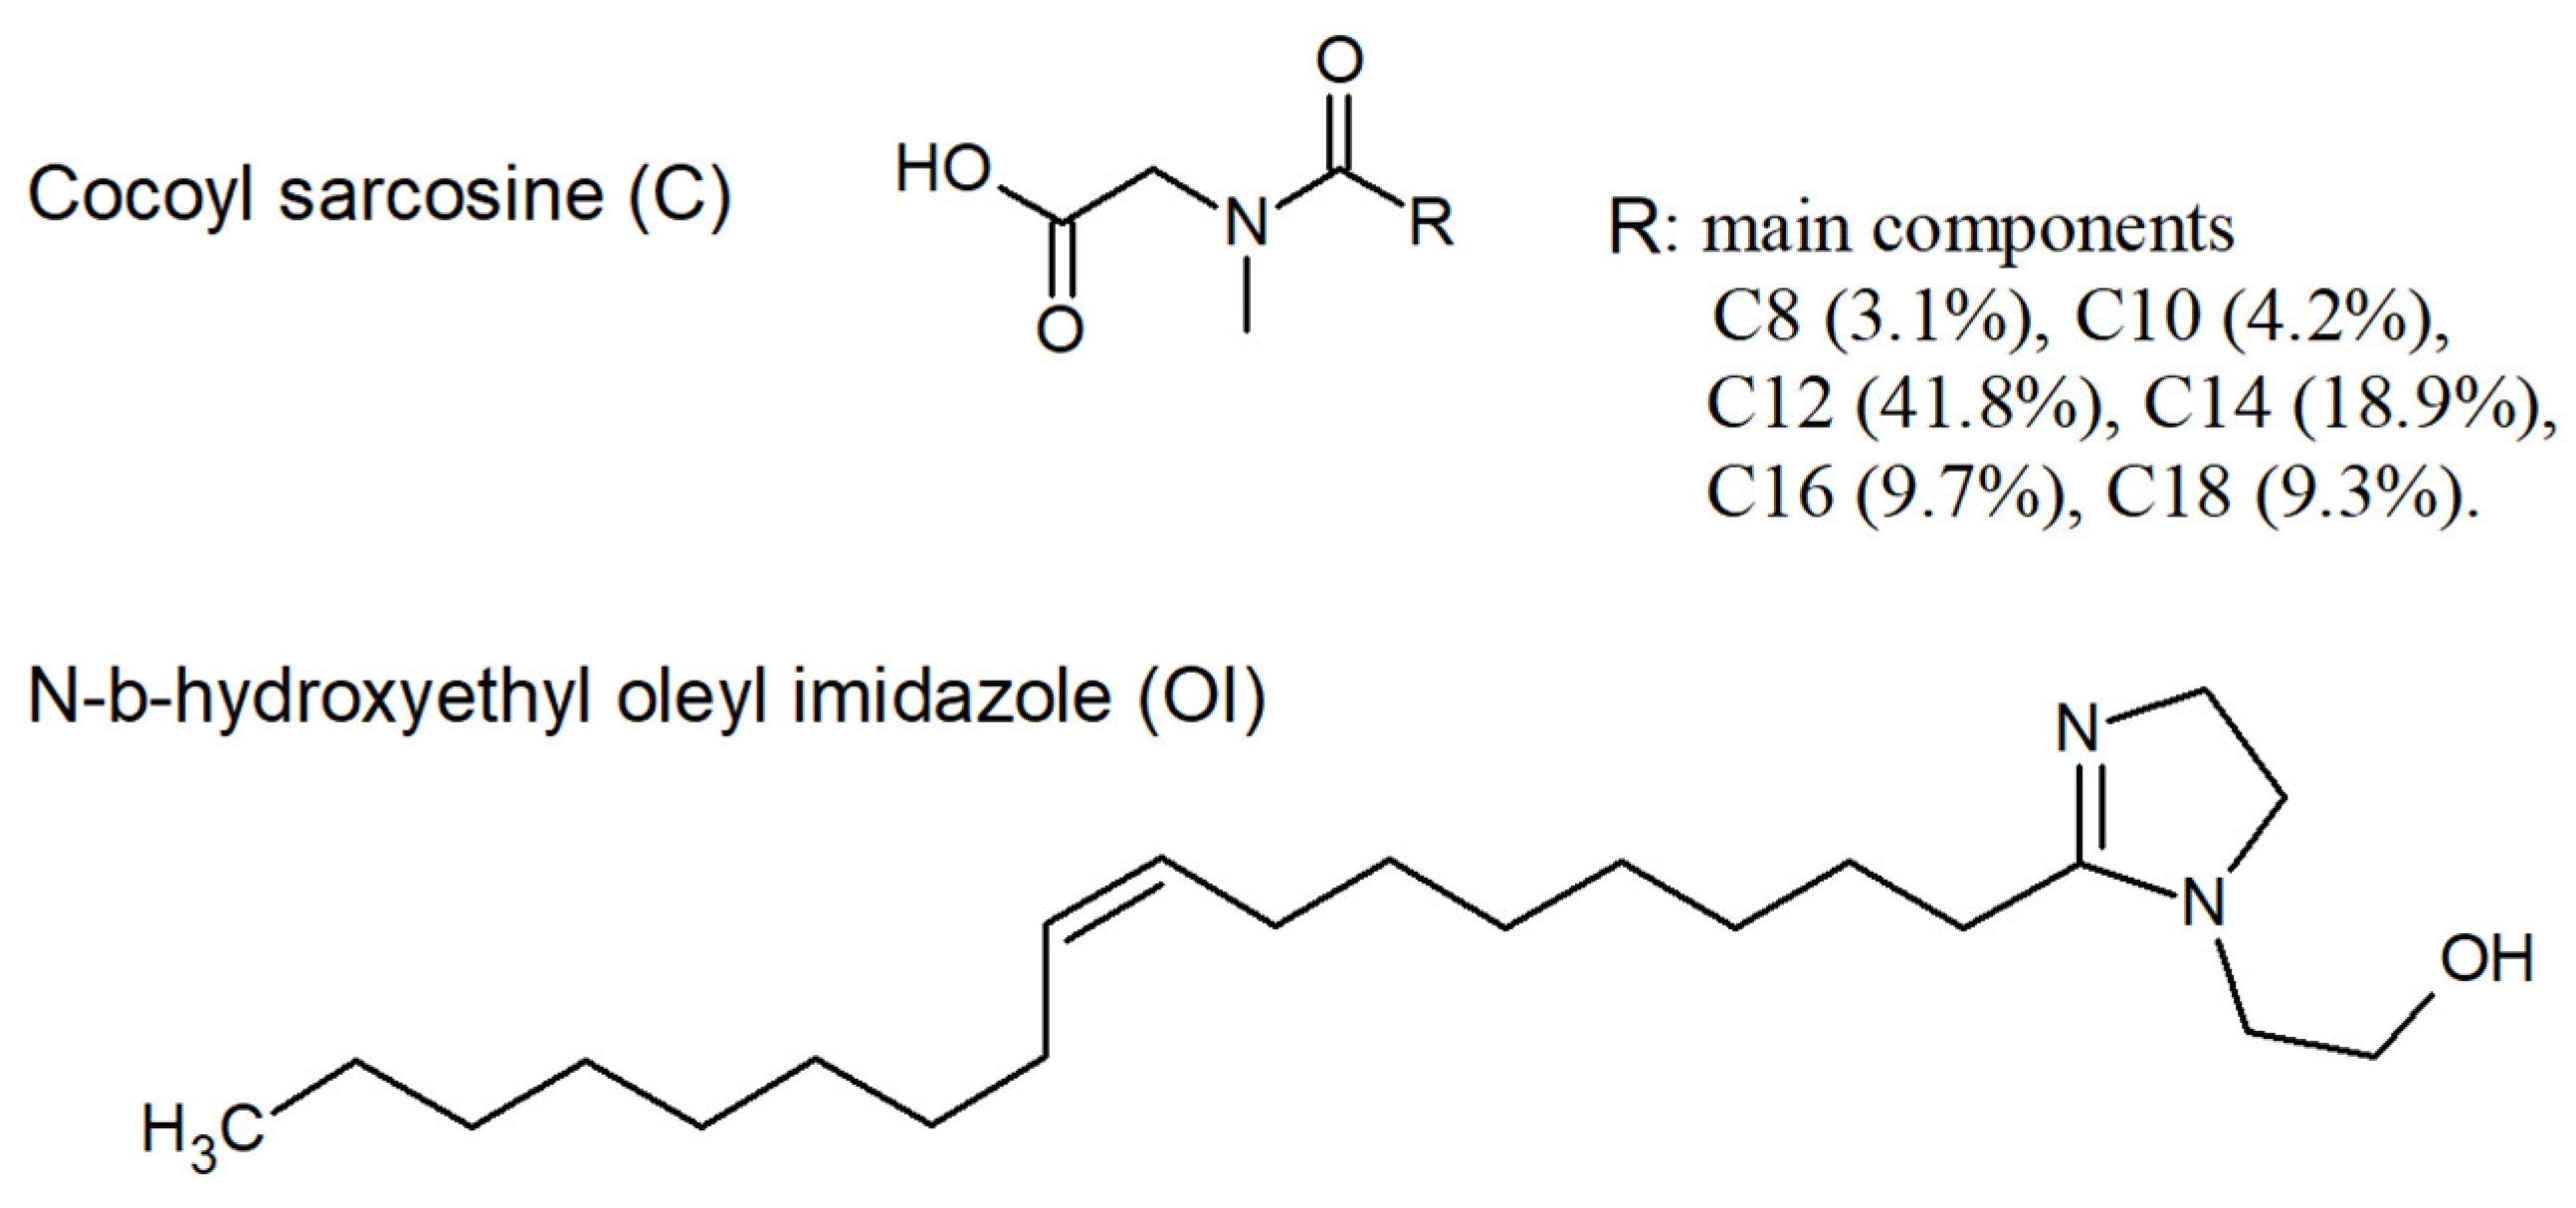
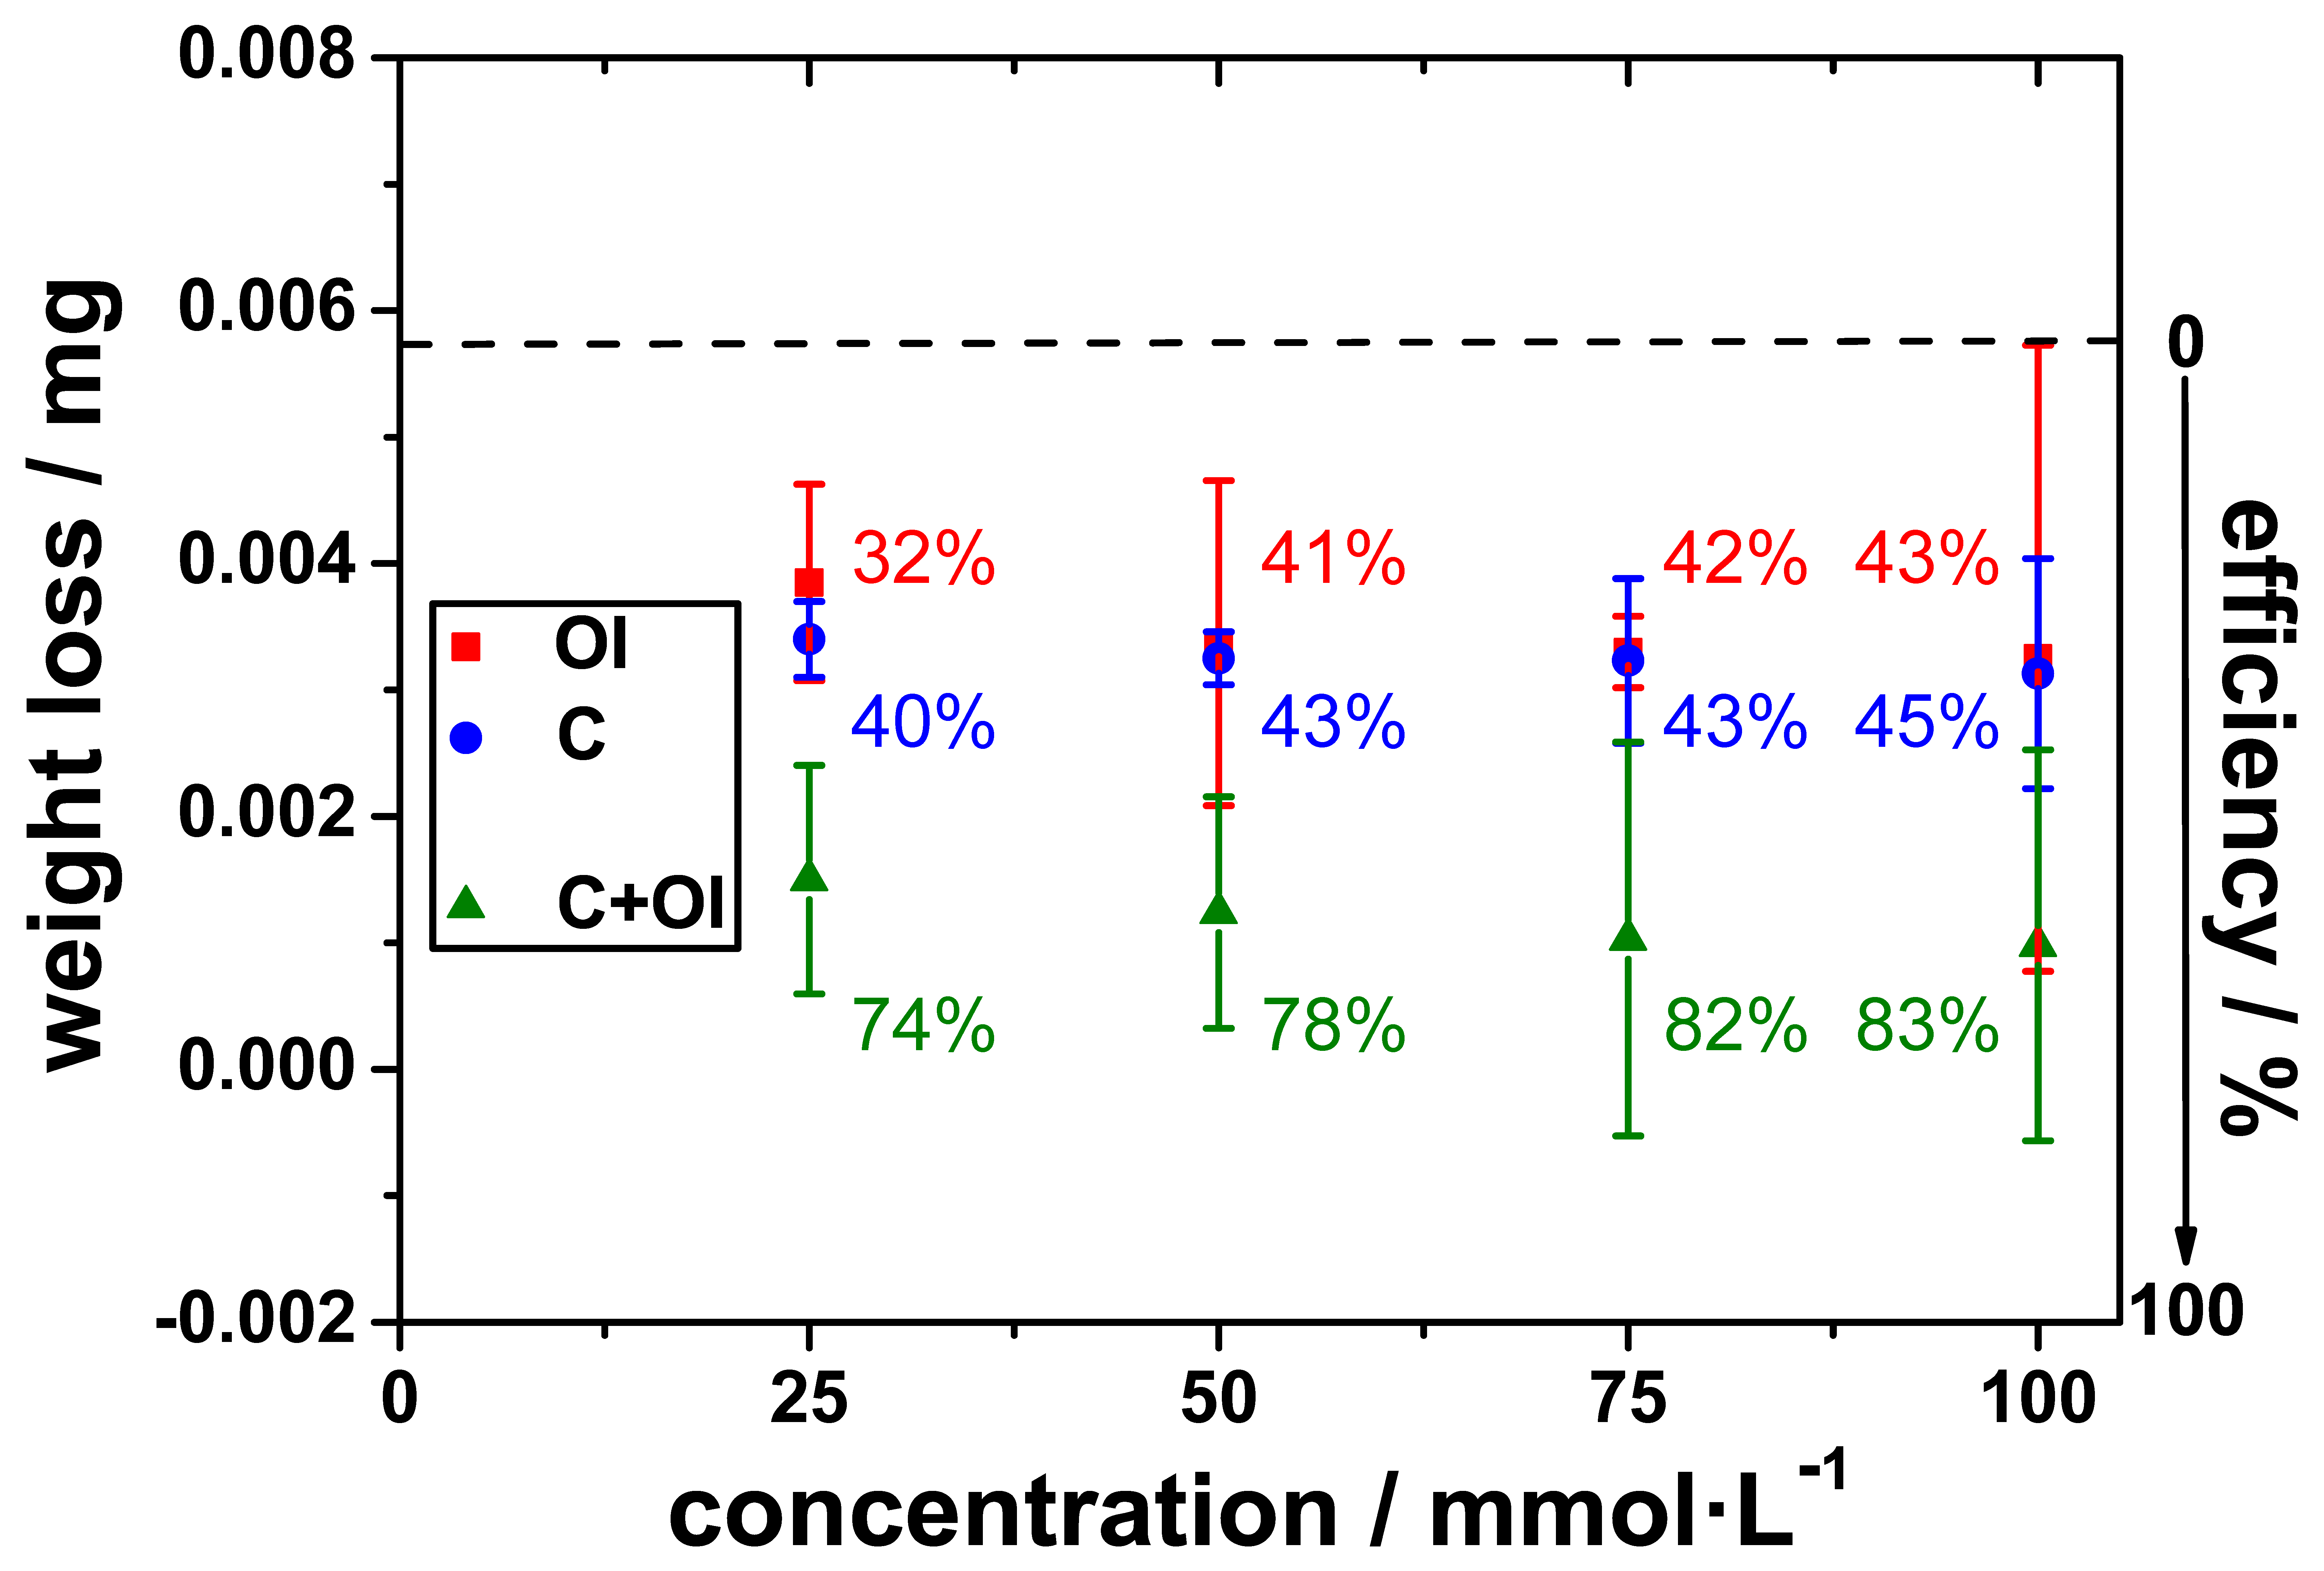
3.1. Weight Loss (WL)

From the WL measurements, the corrosion rate (CR) could be determined with Equation (1) and its inhibition efficiency (IE), according to Equation (2) [39], with ΔW and ΔWinh. being the WL in absence and presence of an inhibitor, A the sample area, and immersion time t:
C R = Δ W A t
I E ( % ) = Δ W Δ W i n h Δ W 100
To determine the ability of the compounds to cover the steel surface, the surface coverage θ was calculated from Equation (3) [39]:
θ = Δ W Δ W i n h Δ W
The results concerning CR, ΔW, θ, and IE for the present compounds C and OI, and their combination C + OI at different concentrations, are listed in Table 2.
Table 2 clearly indicates that CR decreased while the efficiency raised slightly for the individual use of C and OI with higher concentration. This effect was more pronounced with the C + OI combination. The improved efficiency also resulted from a reduction in WL, as depicted in relation to the IE in Figure 2. The maximum efficiency for C at the highest tested concentration of 100 mmol/L was not more than 45% (Figure 2 blue dots and Table 2). A similar value was obtained for OI with just 43% (Figure 2 red squares and Table 2). A significant reduction in WL was only obtained when C and OI were used in combination and in all concentrations. The highest effect was at 75 and 100 mmol/L with efficiencies up to 83% (Figure 2 green triangles and Table 2). The increase in inhibitor effect was clearly due to an increased inhibitor adsorption on steel with the C + OI combination, which reduced the contact area and, thus, the interaction between the metal surface and the environment.

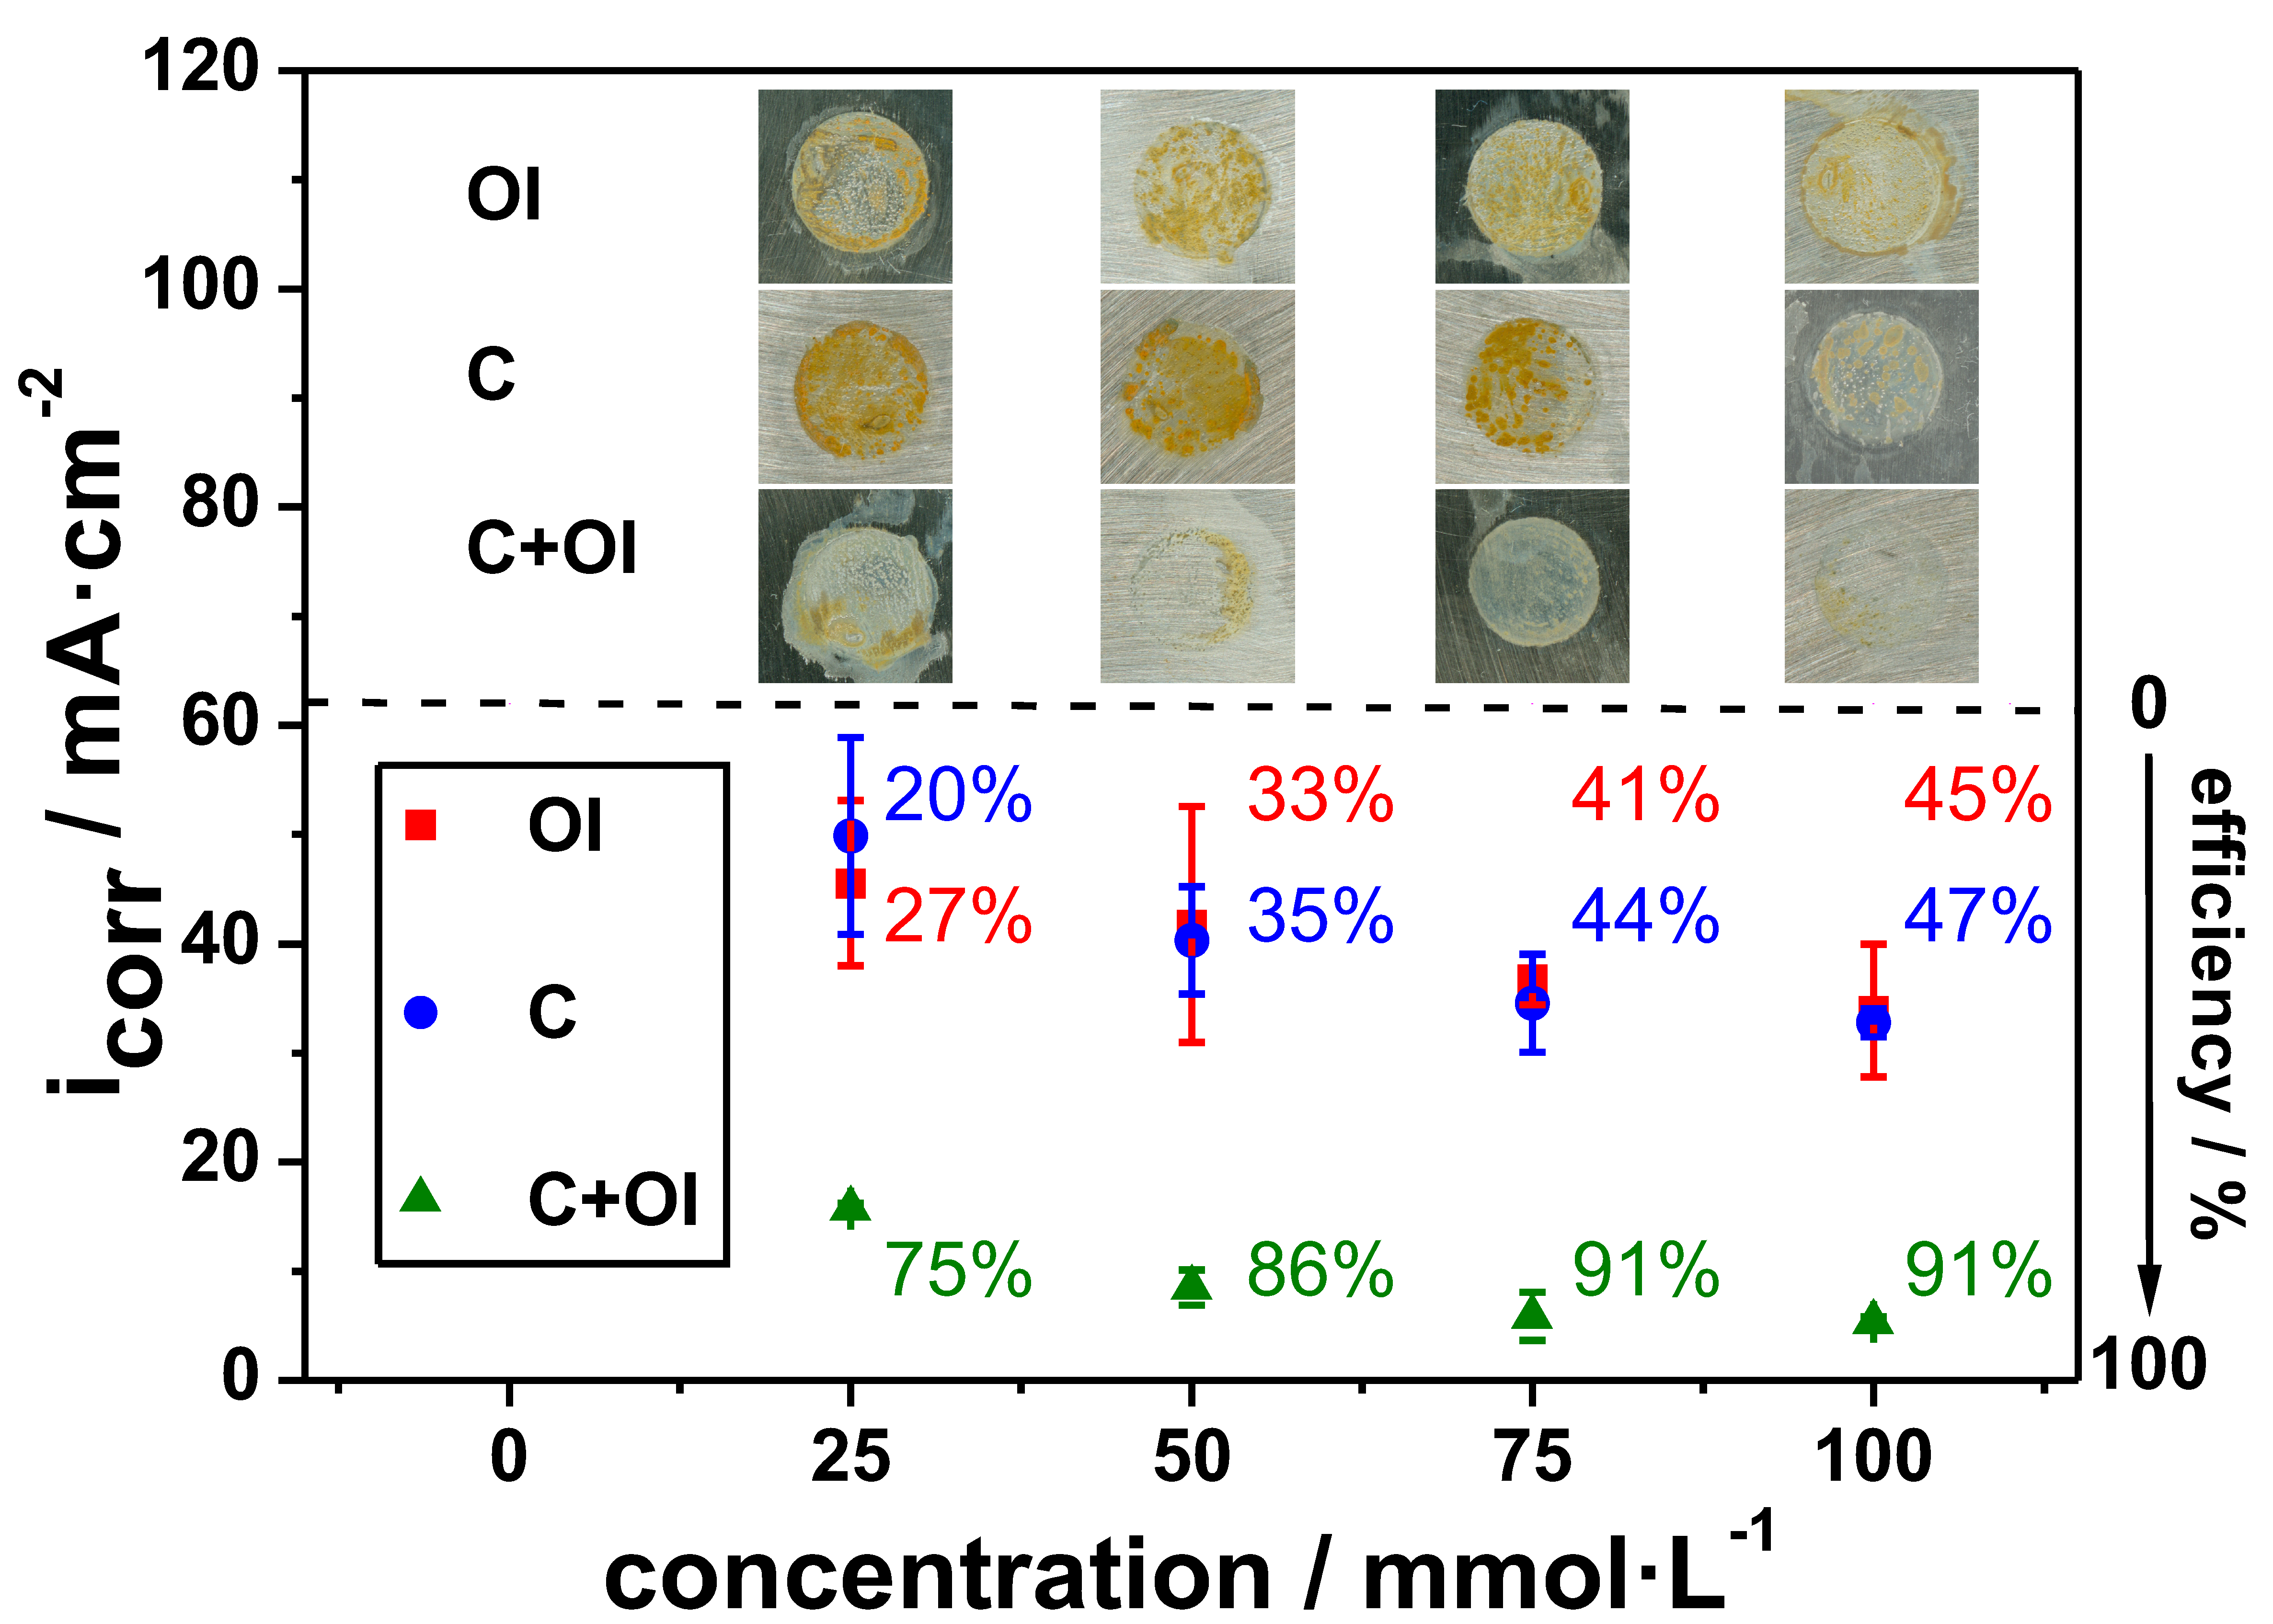
3.2. Potentiodynamic Polarization Measurement

The two compounds were tested individually and in combination by PP to determine their concentration dependence as inhibitors and possible synergies for OI on corrosion protection in 0.1 M NaCl. The efficiency IE in percent was obtained from Equation (4), where icorr and iinh are the corrosion current density in the absence and presence of an inhibitor, respectively:
I E ( % ) = i c o r r i i n h i c o r r 100
Table 3 contains the PP results including corrosion potential Ecorr, corrosion current density icorr, the anodic and cathodic Tafel slope βa and βc, CR, θ, and the determined IE (PP curves and further data in Supplementary SI 2).
In Table 3, the values for the slopes βa and βc show only minor changes in corrosion behavior when C, OI, and C + OI were on the steel coupons. However, it was found that higher concentrations of C caused only a moderate increase in efficiency and a decrease in the current density icorr with a slight shift of the potential in a positive direction. The cathodic current density did not decrease noticeably at all tested concentrations of C, while the anodic current density went down. The highest efficiency of C for corrosion inhibition was only up to 47% at the maximum concentration of 100 mmol/L (Table 3 and Figure 3 in blue).
Compound OI, which was intended as a synergist, had individually even less effect than compound C. A decrease in current density with a small potential shift in negative direction led to a maximum efficiency of only 45% for 100 mmol/L (Table 3 and Figure 3 in red). The remaining OI concentrations showed some variations but rarely exceeded the values of C, except for 25 mmol/L with about 27% compared to roughly 20% for C.
The situation changed when both compounds were used as combination C + OI. The efficiency of C + OI at least doubled at all concentrations studied with a strong shift of the potential in a positive direction (Table 3 and Figure 3 in green) and a maximum at 100 mmol/L of more than 91%. The combination C + OI acted as a mixed inhibitor as it reduced both cathodic and anodic current densities, with the effect being stronger in the anodic part. The images in Figure 3, inserted in the upper half, show exemplary specimens tested here, which were digitalized after the corresponding PP testing by scanning at a resolution of 1200 dpi. It clearly shows that the corrosion on the surface decreased with increasing concentration of the investigated substances, especially for C + OI.

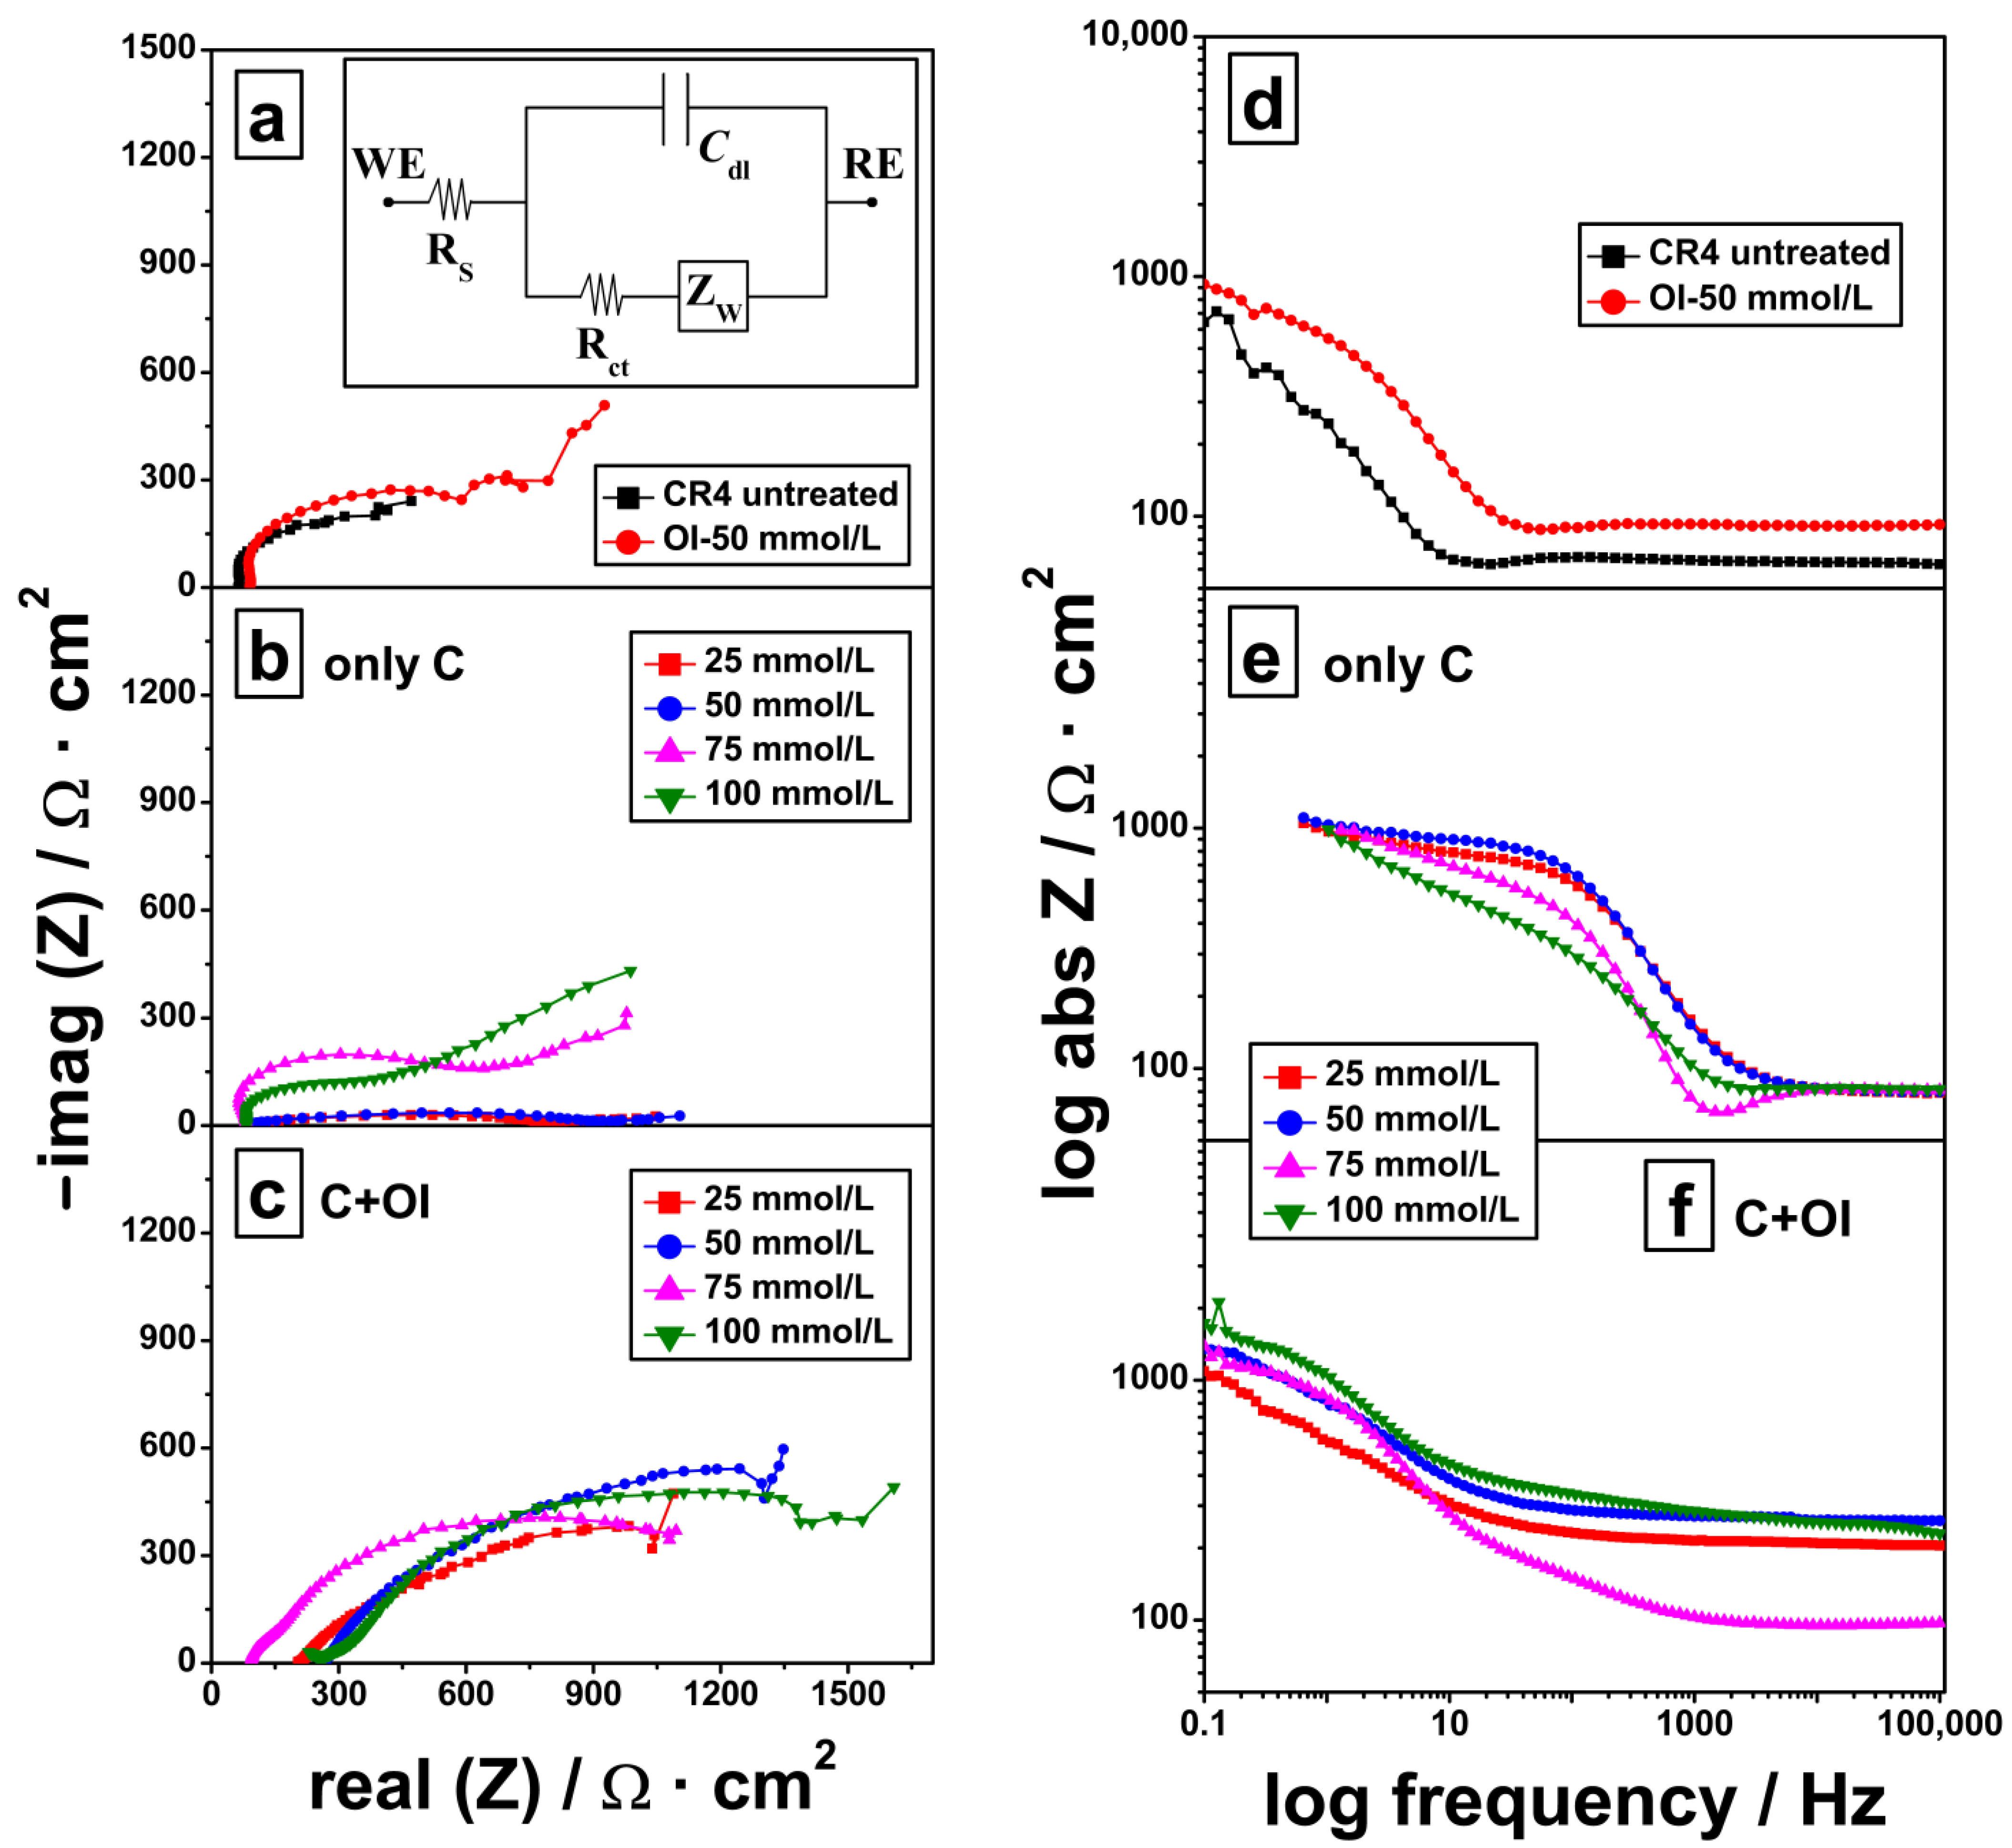
3.3. Electrochemical Impedance Spectroscopy Measurement

The EIS technique provides details about how effectively a studied organic substance inhibits the metal surface. The adsorption of organic molecules on the metal surface increases the charge transfer resistance Rct [45]. The impedance characteristics without and with C, OI and C + OI at different concentrations were analyzed by Nyquist and Bode plots (Figure 4). Randle’s model of the electrochemical cell, which consists of an active electrolyte resistance Rs in conjunction with the parallel combination of the double layer capacitance Cdl and an impedance of the Faradic reaction, was used to calculate the equivalent circuit of the electrochemical cell (inset in Figure 4a). Due to the poor results with OI, only the 50 mmol/L concentration was tested and compared with the reference of untreated steel CR4 (Figure 4a), while for C (Figure 4b) and C + OI (Figure 4c) all concentrations were investigated (individual presentations in Supplementary SI 3).
The deviation of the semicircular curves in the Nyquist diagram (Figure 4, left) illustrates the interaction between the steel surface and the electrolyte, which correlates with the kinetic and diffusion processes and generates the polarization interface [46,47,48,49]. Here, the intercept of impedance spectra at high frequency with the real axis represented the solution resistance RS, while the intercept with the same axis of the spectrum at low frequency was the sum RS and Rct, where the diameter of the semicircle was Rct.
The impedance spectra for C in Figure 4b display an increase in the value of the real impedance at the x axis, but the imaginary impedance was obviously too low, especially at 25 and 50 mmol/L, whereas semicircular curves formed at 75 and 100 mmol/L (Figure 4b). The increase of the semicircle diameter in Figure 4c clearly shows that the combination C + OI enhanced an inhibitory effect and Rct increased.
The Bode plots presented in Figure 4d–f deliver the Cdl. The intercept of the extrapolation in the linear range with the axis of absolute impedance Z provides the value for (1/Cdl) [49]. Overall, the highest charge transfer resistance was obtained for C + OI at a concentration of 100 mmol/L (Figure 4f green, triangle down). The parameters obtained by EIS measurements for compounds C and OI are summarized in Table 4. The corresponding IE was calculated from Equation (5), where Rct,inh and R are the resistance with and without inhibitor, respectively:
I E ( % ) = R c t , i n h R R c t , i n h × 100
The EIS results in Table 4 show that a barrier film was formed on the CR4 steel surface by the combination of C + OI and increased the inhibitory effect by up to 85% at a concentration of 100 mmol/L. The semicircle was muted at high frequencies, followed by an inductive loop in the low frequency ranges. These results showed that a charge transfer controlled the corrosion process in the absence and presence of the studied compounds [7,50]. Consequently, the Rct increased with higher concentrations of C + OI (Table 4 and Figure 4c,f). The increase in efficiency with higher concentrations of the combination of C + OI was evident from the increase in θ (Table 4). This improvement was due to the better adsorption performance of the organic molecules on the steel surface, which caused a decrease in the contact area between the metal surface and the environment.
According to the EIS results, compound C exhibited only an unsatisfactory corrosion-reducing effect at the higher concentrations with an efficiency of less than 49% at 75 mmol/L and less than 41% at 100 mmol/L (Table 4 and Figure 4b magenta and green, respectively). The efficiency of sarcosine C at the lower concentrations 25 and 50 mmol/L looked promising at first glance, but the value of the imaginary axis was too low (Figure 4b, red and blue). This might be due to competing inhibitor effects on the metal surface caused by the inhomogeneous mixture of chain lengths in C. Previous studies demonstrated that with increasing chain length and higher concentration of individual sarcosine derivatives the inhibitory effect was enhanced [6,34]. As the main compound here was C-12 with up to 42% (compare Figure 1) and the longer-chain compounds proportionally decreased in content with increasing carbon number, there was obviously an equilibrium between the shorter and longer chains with regard to adsorption on the metal and remaining in the solution. At lower concentrations, it was more likely that longer chained derivatives of C would adsorb together with C-12 on the surface, but with higher concentrations, the superiority of the C-12 compound revealed efficiency comparable with earlier findings [34].
The individual compound OI at a concentration of 50 mmol/L also resulted in only 46% efficiency (Table 4 and Figure 4a, red circles). Overall, the EIS results reinforced the fact that the C + OI combination was an effective corrosion inhibitor, which was consistent with the PP evaluation and the WL results. The mechanism of the inhibitor acted by attachment to the metal surface and could be explained by an adsorption isotherm. The correlation between θ and Cinh was thereby described by the Langmuir adsorption isotherm [51].

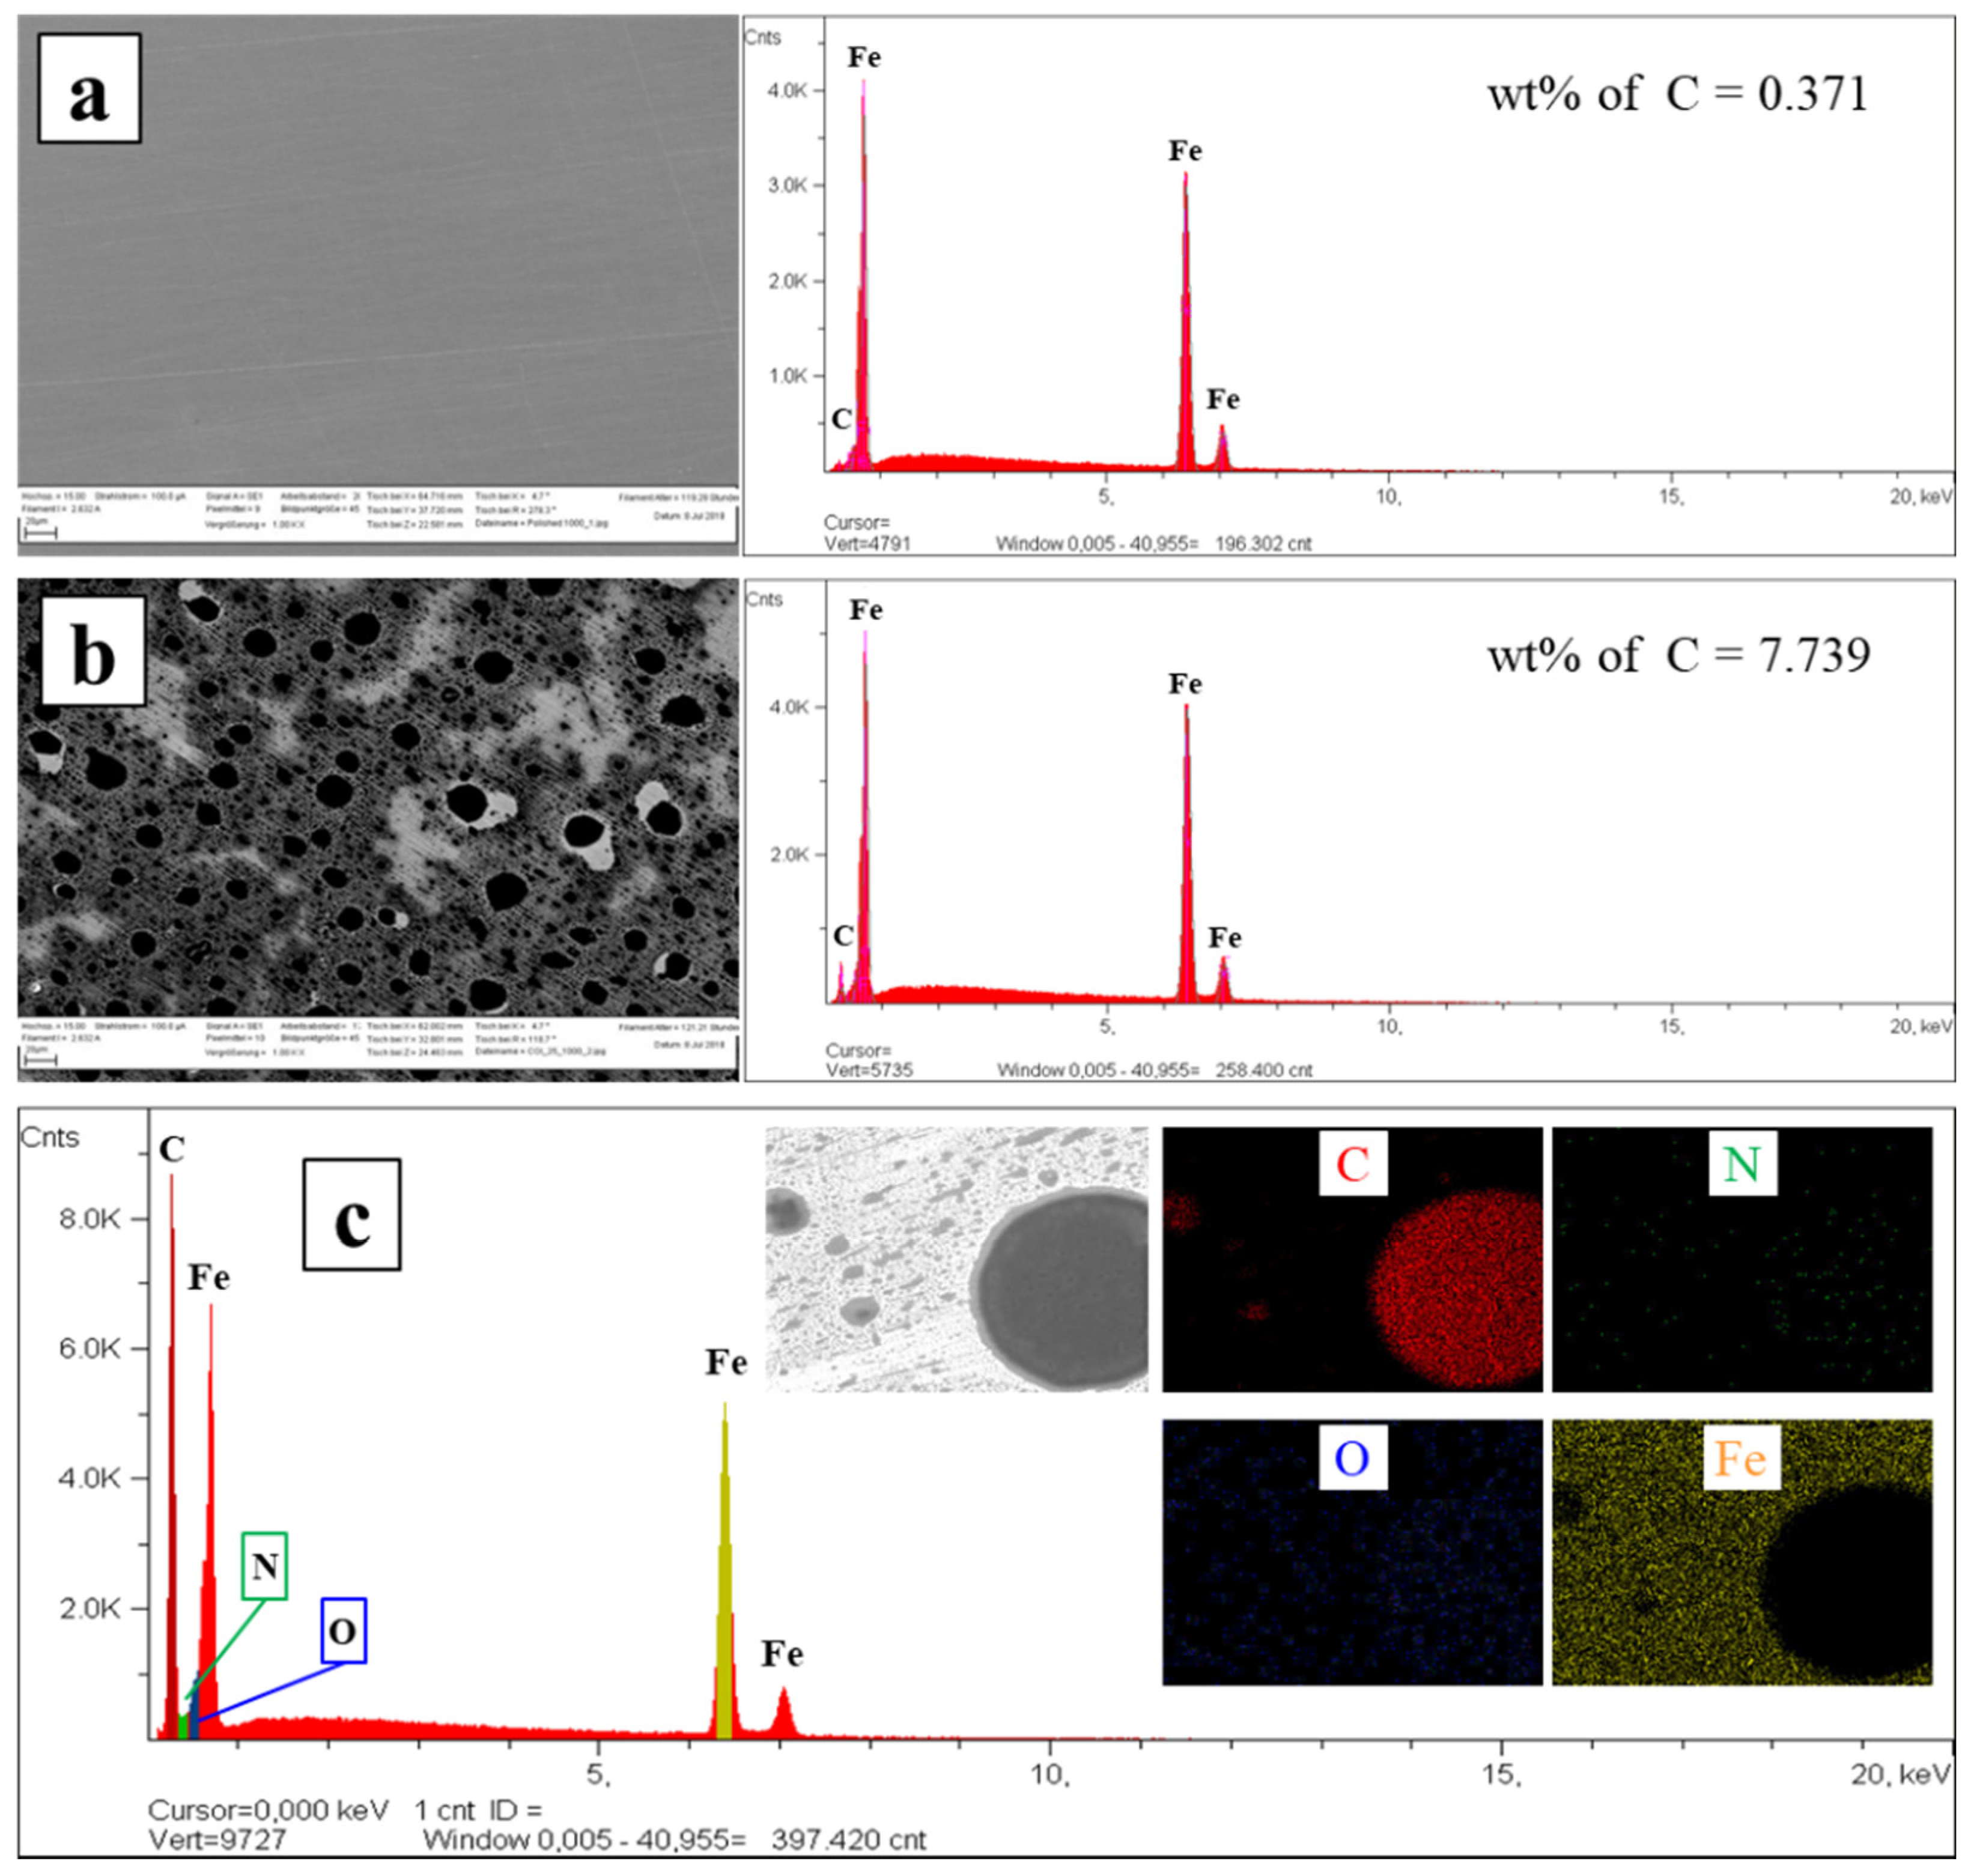
3.4. Surface Characterization

A surface characterization was examined exemplarily using steel samples treated 10 min in the most effective inhibitor combination C + OI of 100 mmol/L. Corresponding SEM and EDS micrographs of untreated reference steel and inhibitor-immersed ones are displayed in Figure 5a,b.
If SEM Figure 5a is compared with Figure 5b, the deposit of the inhibitor was clearly visible. The EDS spectra for untreated and inhibitor-immersed samples supported this, as the carbon content was more than 20 times higher on the sample treated for 10 min in 100 mmol/L of C + OI, indicating clear evidence of adsorption for the inhibitor molecules on the steel in the chosen solvent system. Furthermore, darker and brighter regions are visible in SEM image 5b, which indicated an inhomogeneous distribution of the inhibitor. The elemental mapping shown in Figure 5c supports this observation: the darker regions, especially, contained much more C than the brighter regions, which was exactly the opposite for iron; thus, being in line with earlier findings [34]. In addition, little O- and N-content could be found in the dark regions. A possible inhibitor aggregation and multilayer formation here would also support the competing chain length effects mentioned earlier. The result would be a more or less basic inhibitory effect for regions with sufficient inhibitor coverage being less stable than the multilayer compartments. This would also explain why there was no significant effect at higher concentrations of all systems, as shown by the IE data in Table 2, Table 3 and Table 4. However, although there was no homogeneous coverage with inhibitor molecules, an increased inhibitory behavior for the C + OI combination and a clear synergistic effect were observed.

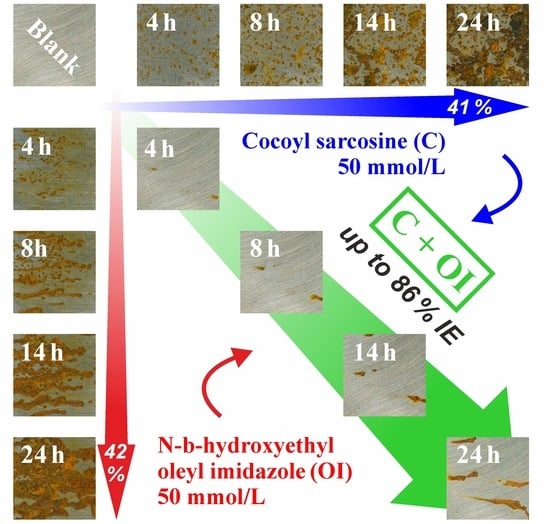
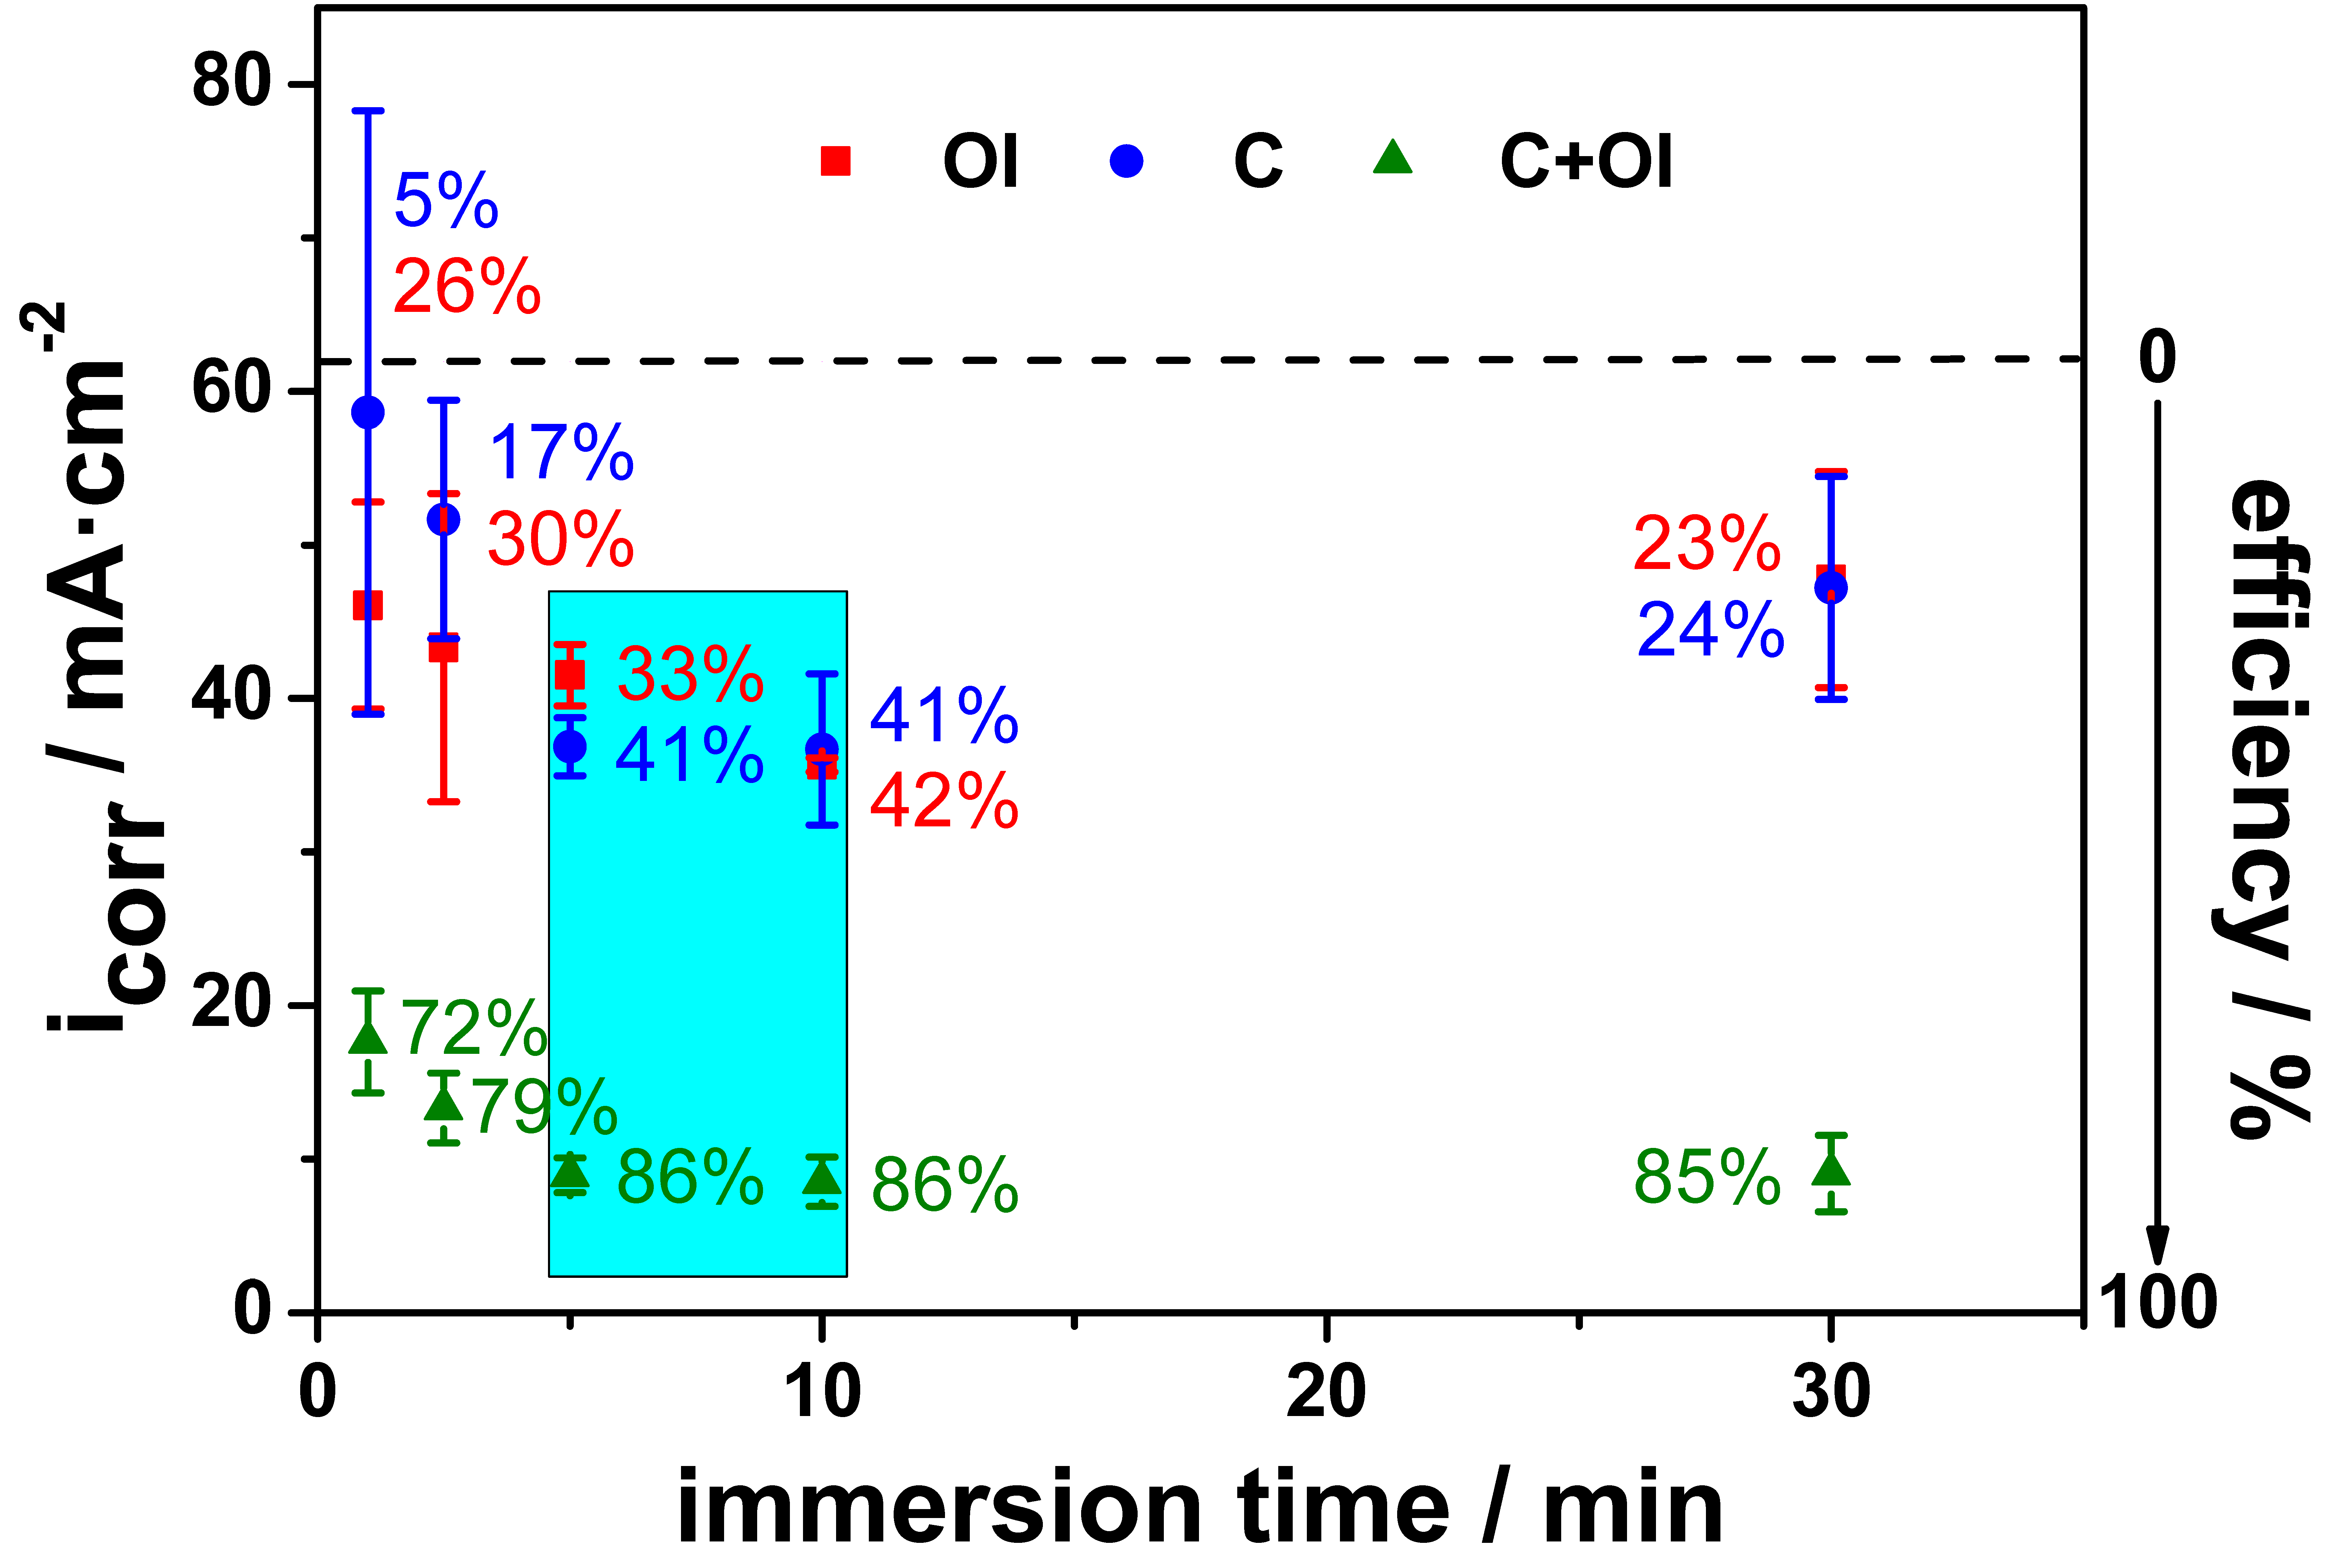
3.5. Effect of Increasing Immersion Time

In addition to the application of different inhibitor concentrations, the immersion time applied was also an important factor here [34]. On the one hand, for the time required for optimal adsorption, and, on the other hand, for the possible overcoming of inhomogeneous coverages. Therefore, PP curves in 0.1 M NaCl at RT were recorded for all candidates in 50 mmol/L concentrations each, to check the effect of immersion time of inhibitor solutions for the steel samples. The obtained electrochemical parameters and the IE in % are summarized in Table 5.
As already seen for the PP data before (Table 3) the anodic βa and cathodic βc slopes again indicated only insignificant changes according to an increasing immersion time, as listed in Table 5 (further data in Supplementary SI 4).
An increase in immersion time from one to 10 min strengthened the protection of steel samples and reduced icorr in each case to maximal efficiencies of up to 41% for C, around 42% for OI and more than 86% for the combination C + OI (Figure 6). A comparison of the polarization curves as a function of concentration and immersion time clearly showed that the potential shift that occurred was related to the behavior of the compounds and combination C + OI themselves, not a result of changing the coating time, which meant that the efficiency could not be increased after 10 min of immersion (Compare Supplementary SI 2 and SI 4).
Over the longer term, the efficiency of C + OI was imperceptibly lower after 30 min than after 10 min, whereas it decreased more markedly with C and OI alone (Figure 6). The increasing efficiency with increasing coating time helped to improve the adsorption of inhibitor molecules by the steel surface. From the results it could be concluded that the surface was maximally, or almost completely, covered after 5 to 10 min of immersion time, depending on the inhibitor used (compare θ in Table 5). When the immersion time was increased from 10 to 30 min, an oily deposition of the inhibitor was observed. This indicated that (5 to) 10 min was obviously the best choice, since the surface was already optimally saturated with the inhibitor compound after this time, as highlighted by the turquoise rectangle in Figure 6. Thus, increasing the immersion time had the same effect as increasing the concentration in increasing the number of inhibitor molecules adsorbed on the steel surface.

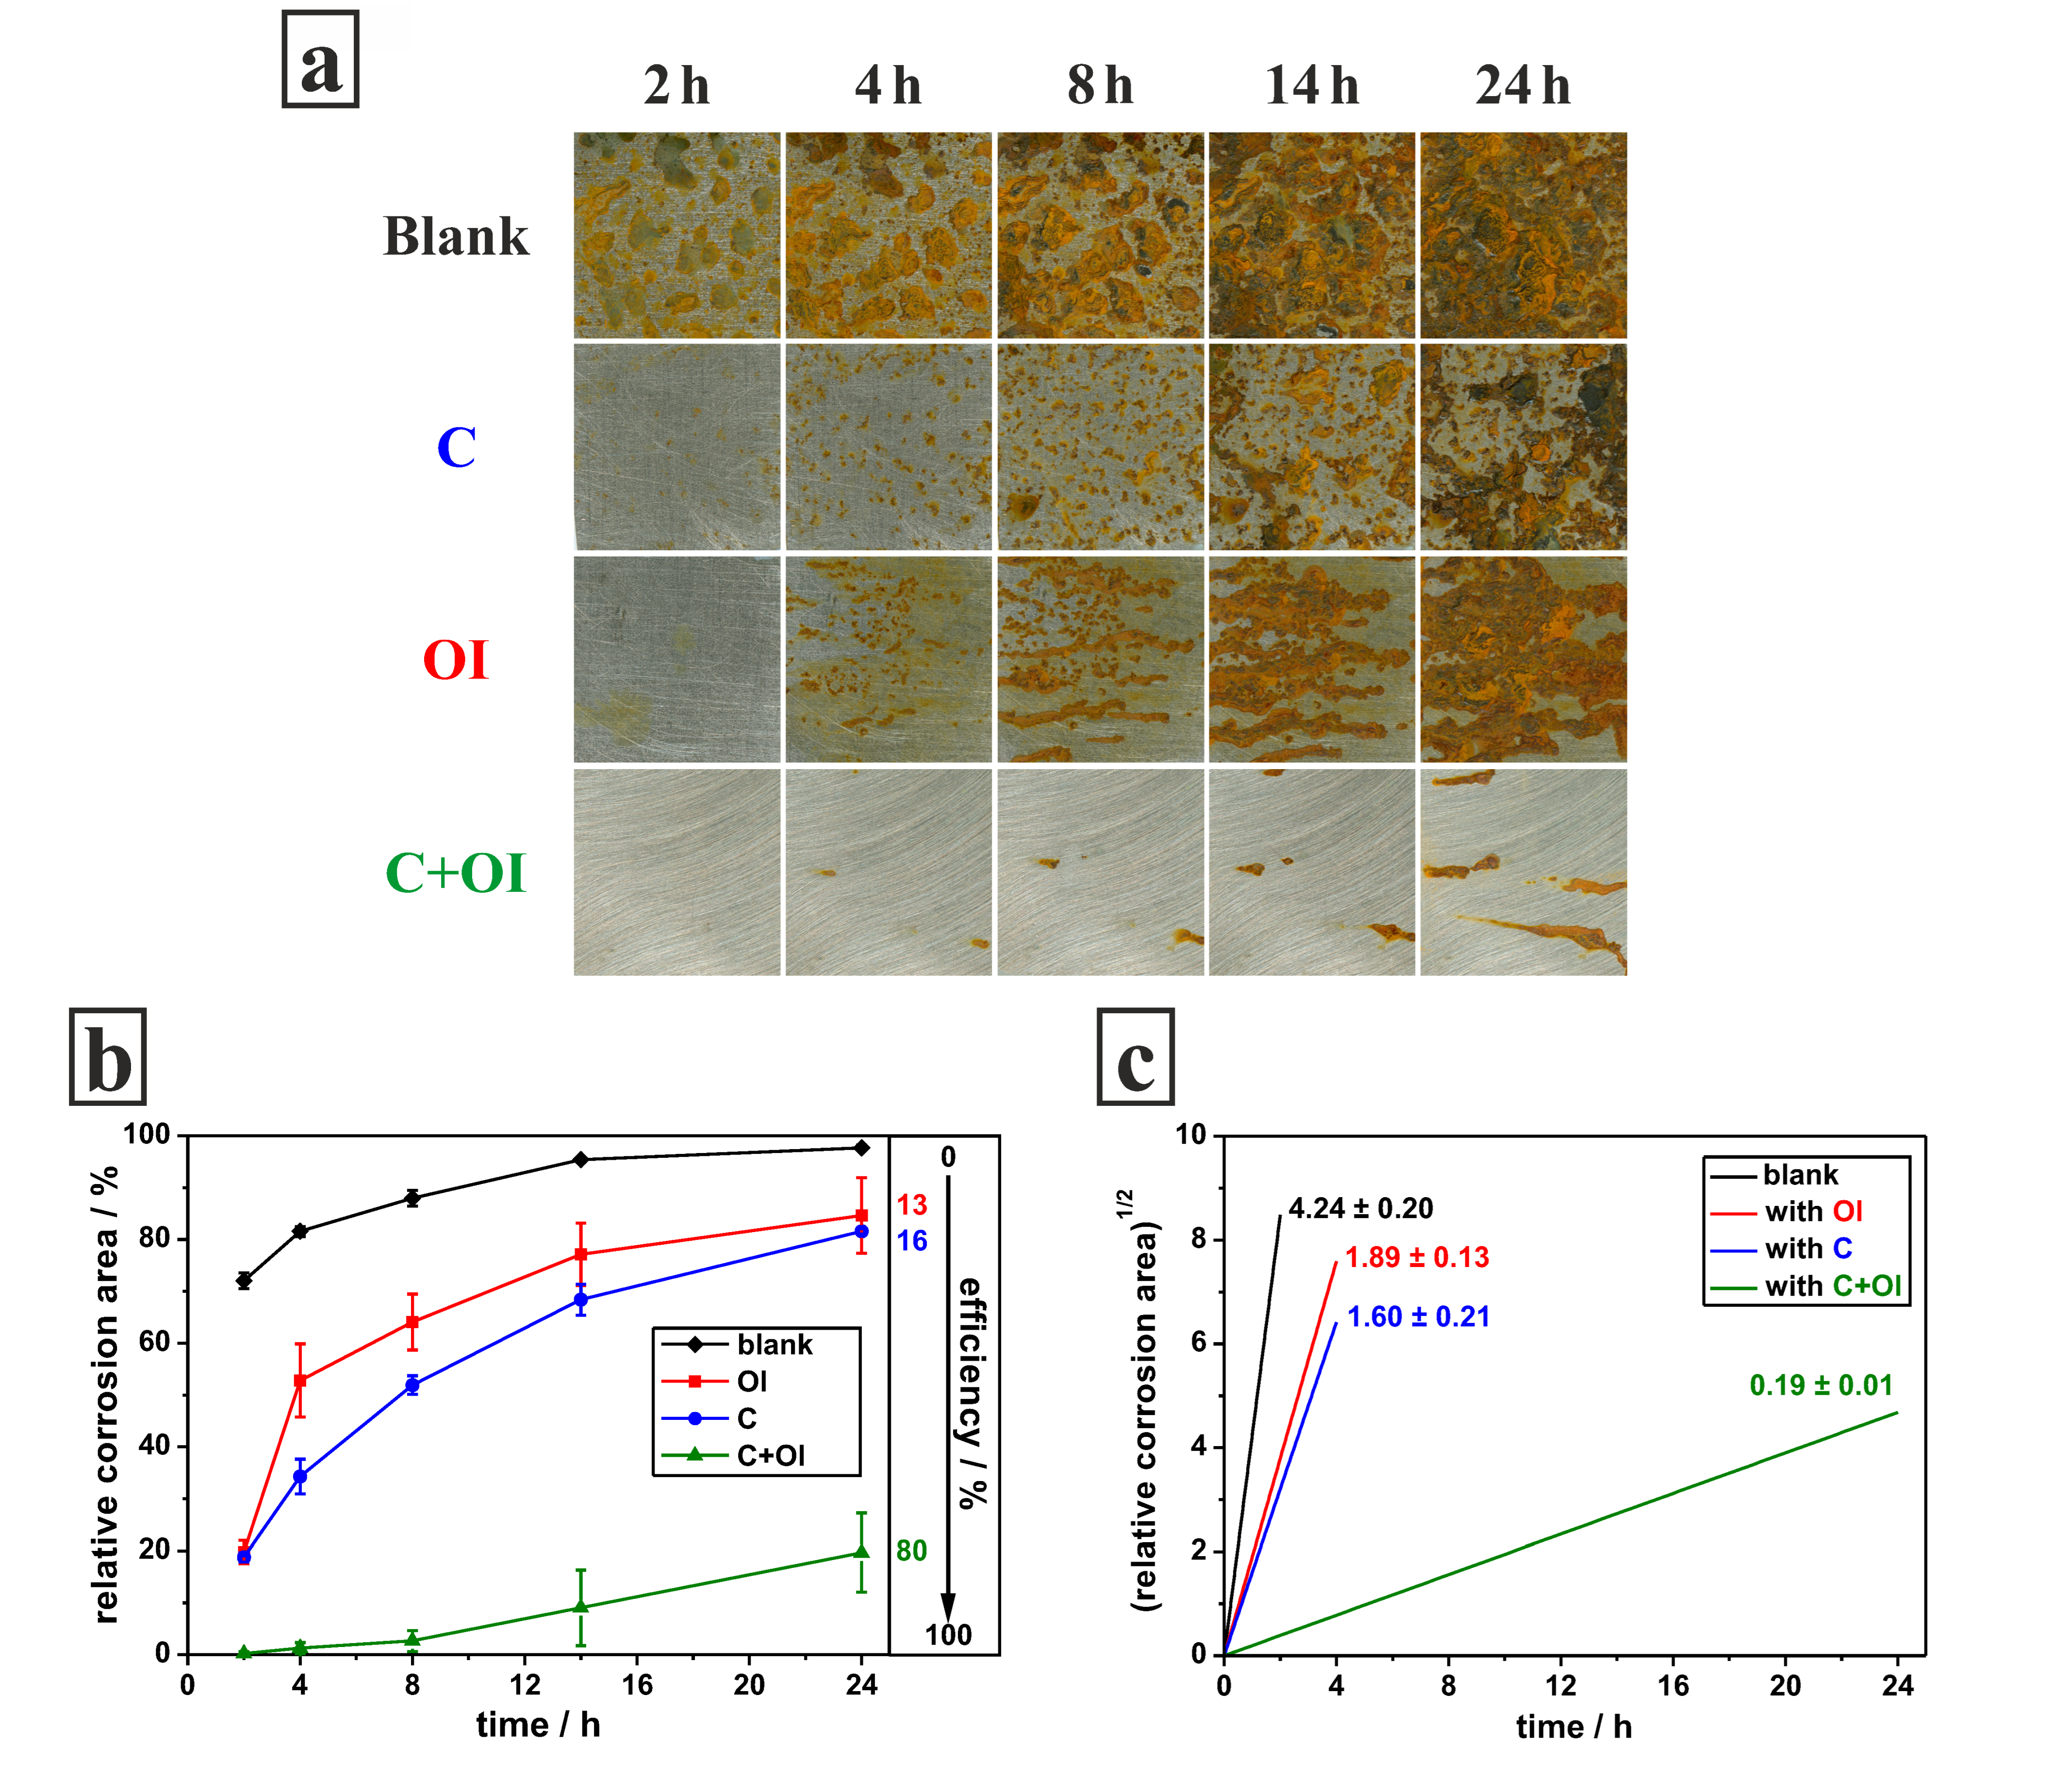
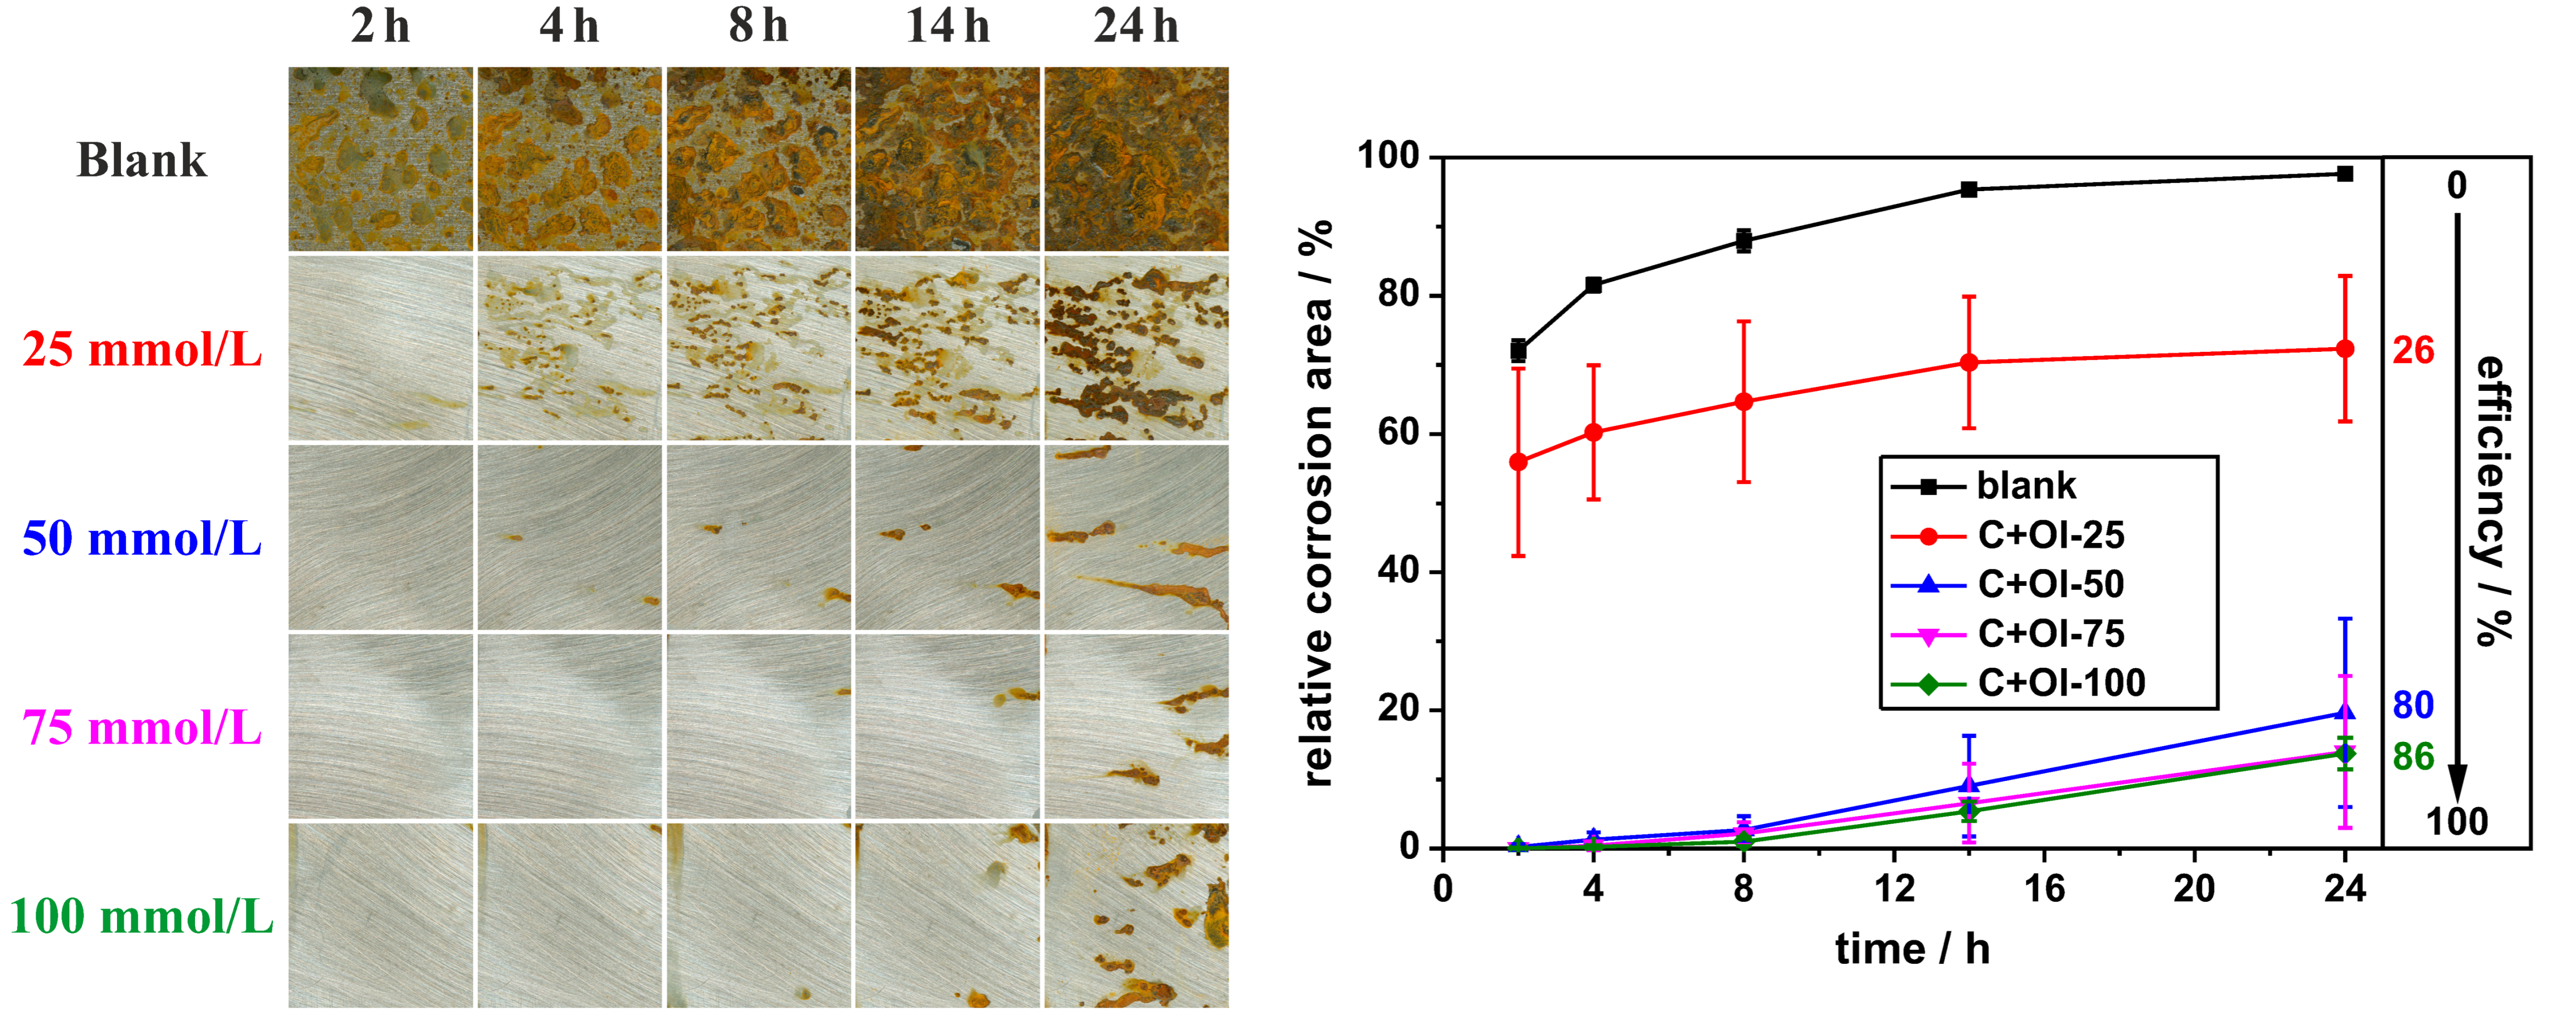
3.6. Spray Corrosion Chamber Test

In order to evaluate the effect of the present compounds on the corrosion processes in a more realistic environment, additional tests were performed for the duration of 24 h using a spray corrosion chamber (Section 2.4). The visibly corroded area was used to analyze the corrosion process and monitor possible protection. This area could be determined after digitalization of each sample by the ImageJ program [6,34,40]. The whole corrosion area divided by the total observed area of the samples yielded the corresponding relative corrosion area in percentage. This value was directly correlated with the corrosion inhibiting effect of each compound. Effective inhibitors could be detected by non-corroded areas or, if they were not strong enough, only in small areas covered with corrosion products and, vice versa, ineffective substances.
Exemplary corroded and digitalized steel samples are presented in Figure 7. It shows the corrosion progress of typical measurements for the blank steel material (row 1) and the series of applied compounds in the order C, OI and C + OI (rows 2–4) at the indicated times of 2, 4, 8, 14 and 24 h. Each series consisted of ten individual metal probes arranged in two independent experimental arrays, each at an inhibitor concentration of 50 mmol/L. Table 6 summarizes the average values obtained and Figure 7 presents the visible and calculated results of corrosion propagation. The overall efficiency of the inhibitor was calculated in analogy to Equation (6) by the difference in relative corrosion area in the absence and presence of compounds. Where IE(%) was the calculated efficiency, and A1, A2 were the relative corrosion areas in absence and presence of the compounds:
I E ( % ) = A 1 A 2 A 1 × 100
As summarized in Table 6 and Figure 7, different corrosion courses were found for the present steel CR4 in combination with the compounds. For blank steel, large corrosion spots with a light rust color were visible from the beginning. These spots grew over time and became darker, indicating different types of rust (Figure 7 first row and black color). After 24 h, the unprotected metal probe was almost completely covered by dark corrosion products, which served here as the reference. Sarcosine compound C (Figure 7 second row and blue color) gave a good initial reducing effect of up to 74% after 2 h, but this dropped in the further course to only 16% at 24 h. During this time, smaller but distinct corrosion spots appeared on the metal surface after only 4 h. These continued to grow and after 8 h they coincided to form larger spots. Compound OI (Figure 7 third row and red color) displayed a similar behavior as C, but was less efficient with 73% at the start and only 13% at 24 h. The first corrosion spots also appeared very early, but, in this case, they merged earlier to form larger, line-like patterns compared to the observations with C. As soon as the two individual compounds were used in combination, the picture changed (Figure 7 fourth row and green color). The combination C + OI showed the best performance in corrosion protection here for steel CR4. Only a negligible number of corrosion spots could be detected on the steel surface after 2 h, becoming larger during the measurement but remaining small in number, which, in the end, still led to an efficiency of up to 80% at 24 h.
Another way to present the results is as a linear relation, as displayed in Figure 7c [6,34]. Here the root of the relative corrosion area is plotted to the exposure times to give a linear approximation. The numbers next to the lines indicate the calculated slope value for each compound. According to previous results [6,34], a good inhibitor displays a rather low value for the slope and thus a rather flat course, and a less effective one has a higher value and is, therefore, steeper. In line with the above findings, the highest slope value was found for blank steel (Figure 7c, black line), followed by OI (red line), C (blue line) and, finally, the lowest, for the combination C + OI (green line, further data see Supplementary SI 5).
To further investigate the efficiency of the C + OI combination analogous spray corrosion tests were executed for concentrations of 25, 50, 75, and 100 mmol/L. Table 7 summarizes the average values obtained and Figure 8 presents the visible and calculated results of the corrosion propagation during 24 h. The first line in Figure 8 reflects the blank material as stated in Figure 7 before. From the second to the fifth line, the increasing concentration of C + OI is indicated, showing the significant corrosion reduction potential. At 25 mmol/L C + OI, corrosion was low up to 2 h, but began to be clearly visible after 4 h and resulted in less than 26% efficiency within 24 h (Table 7 and Figure 8 red line). The obtained efficiencies for 50, 75, and 100 mmol/L were excellent up to good until 14 h with up to 90% (Table 7 and Figure 8 blue for 50, magenta for 75, and green for 100 mmol/L). After 24 h, the efficiency was still over 85% for concentrations 75 and 100 mmol/L and 80% for 50 mmol/L. From the visual impression 75 mmol/L was particularly convincing, but as mentioned before, this was only one typical measurement out of a series consisting of ten individual metal probes arranged in two independent experimental arrays. Nonetheless, these results indicated the same behavior previously observed in the electrochemical studies and WL evaluation.
Overall, the naturally derived cocoyl sarcosine (C) and the N-b-hydroxyethyl oleyl imidazole (OI) had individually only insignificant effects, with less than 50% when used as corrosion inhibitors for the present CR4 steel at all concentrations and immersion times. However, when these compounds were used in combination C + OI they showed very good efficiency and revealed a synergistic effect. The highest concentration of 100 mmol/L for C + OI achieved an optimum efficiency with well over 80% in all methods (83% WL Table 2, 85% EIS Table 4, 86% spray corrosion Table 7, respectively) and up to 91% for PP (Table 3). For all tests, an increase in concentration from 25 to 50 mmol/L was found to have the greatest effect. For further increases up to 100 mmol/L the effects were less pronounced, especially for the combinatorial approach (Table 7, Figure 8). The evaluation of the coating effect, according to Table 5 and Figure 6, show that the best immersion time for the CR4 steel used, in terms of efficiency, was (5-) 10 min: C (41%), OI (42%) and C + OI (86%).
The studied organic compounds affected both the cathodic and the anodic polarizations. Therefore, they can be classified as mixed inhibitors, having a stronger effect on the anodic part. It should also be noted that the results obtained with the corrosion spray chamber differed somewhat from the values obtained with the PP measurements. For the PP measurements, the samples were completely immersed in the surrounding aqueous solution, which allowed a good and direct interaction. In the spray corrosion chamber, on the other hand, the steel samples used were exposed to highly humidified atmospheric conditions resulting in reduced exchange and interaction behavior with the environment. Nevertheless, all evaluation methods used here (WL, PP, EIS, and spray corrosion) indicated the same order in terms of efficiency of the tested substances.

4. Conclusions

The efficiency of naturally derived cocoyl sarcosine (C) was evaluated individually and in combination with N-b-hydroxyethyl oleyl imidazole (OI) as a potential corrosion synergist. Different evaluation systems, including weight loss (WL), potentiodynamic polarization (PP), electrochemical impedance spectroscopy (EIS) and spray corrosion tests, as well as different concentrations and coating times for the inhibitors, were applied for steel type CR4 in 0.1 M NaCl.
Electrochemical measurements clearly showed only insignificant effects on corrosion at all concentrations when C and OI were individually used. Overall efficiencies here were less than 50%. However, with an equimolar mixture of C + OI, the corrosion protection doubled with increasing concentration. The best efficiency of C + OI could be detected at the highest concentration of 100 mmol/L, with over 91% and 84% for PP and EIS measurements, respectively. The WL and spray corrosion tests also indicated a significant effect of more than 80% for the 100 mmol/L C + OI combination. In contrast, the individual effectiveness of compound C or OI was in some cases far below 50%. Moreover, the PP results for C + OI showed that it decreased the current density for both cathodic and anodic polarizations. Thus, the combination C + OI showed a mixed inhibitor effect, with a greater impact on the anodic part.
Additional effects on the immersion time of compounds C, OI, and C + OI were investigated using PP at concentrations of 50 mmol/L each. The best efficiency of C, OI and C + OI to reduce corrosion in 0.1 M NaCl was found to be up to 41%, 42% and 86%, respectively, for an immersion time of 10 min.
Overall, each evaluation system showed the same effects on corrosion protection in terms of compound order. Both C and OI were individually less than 50% effective. However, in the combination C + OI respectable efficiencies of more than 91% (PP) and 84% (EIS) could be obtained, depending on the method, indicating a clear synergistic effect.

Supplementary Materials

The following supporting information can be downloaded at: https://www.mdpi.com/article/10.3390/cmd3030029/s1, SI 1: (PP measurements for steel CR4 with toluene compared to blank in 0.1 M NaCl); SI 2: (PP measurements for steel CR4 with different concentrations of C, OI, and C + OI in 0.1 M NaCl); SI 3: (for Figure 4a–c, individual EIS spectra for compounds OI, C and C + OI of different concentrations in 0.1 M NaCl); SI 4: (PP measurements for steel CR4 in 0.1 M NaCl for different immersion times in 50 mmol/L of C, OI, and C + OI); SI 5: (Linear slope values from Figure 7c—plotting the root of relative corrosion area against exposure time).

Author Contributions

S.E.K.: conceptualization, data acquisition, visualization, writing—original draft, methodology, review, and editing. G.E.: data acquisition, OES analysis, review and editing. J.G.: conceptualization, supervision, review, and editing. C.B.F.: conceptualization, visualization, writing, supervision, review, and editing. All authors have read and agreed to the published version of the manuscript.

Funding

S.E.K. acknowledges in particular the financial support provided by the German Academic Exchange Service (DAAD) within the framework of the “Bagh-DAAD” program under the number 91549239-A13/95797.

Data Availability Statement

The data presented in this study are available on request from the corresponding authors. The data are not publicly available, except the supporting data, due to further studies.

Conflicts of Interest

The authors declare no conflict of interest.

References

  1. Popov, B.N. Corrosion Engineering Principles and Solved Problems; Elsevier B.V.: Amsterdam, The Netherlands, 2015. [Google Scholar]
  2. Eliaz, N.; Gileadi, E. Physical Electrochemistry: Fundamentals, Techniques and Applications; Wiley-VCH Verlag GmbH & Co., KGaA: Weinheim, Germany, 2018. [Google Scholar]
  3. Pathan, S.; Ahmad, S. Synergistic effect of linseed oil based waterborne alkyd and 3-isocynatoropyl triethoxysilane: Highly transparent, mechanically robust, thermally stable, hydrophobic, anticorrosive coatings. ACS Sustain. Chem. Eng. 2016, 4, 3062–3075. [Google Scholar] [CrossRef]
  4. Dariva, C.G.; Galio, A. Corrosion Inhibitors—Principles, Mechanisms and Applications, Ch. 16. In Developments in Corrosion Protection; Aliofhazraei, M., Ed.; IntechOpen: London, UK, 2014. [Google Scholar] [CrossRef]
  5. Agarwal, P.; Landolt, D. Corrosion Inhibitors, Part 5; Application Note COR05; Metrohm Autolab B.V.: Herisau, Switzerland, 2011. [Google Scholar]
  6. Kaskah, S.E.; Pfeiffer, M.; Klock, H.; Bergen, H.; Ehrenhaft, G.; Ferreira, P.; Gollnick, J.; Fischer, C.B. Surface protection of low carbon steel with N-acyl sarcosine derivatives as green corrosion inhibitors. Surf. Interfaces 2017, 9, 70–78. [Google Scholar] [CrossRef]
  7. Bommersbach, P.; Alemany-Dumont, C.; Millet, J.P.; Normand, B. Formation and behaviour study of an environment-friendly corrosion inhibitor by electrochemical methods. Electrochim. Acta 2005, 51, 1076–1084. [Google Scholar] [CrossRef]
  8. Bentiss, F.; Bouanis, M.; Mernari, B.; Traisnel, M.; Vezin, H.; Lagrenée, M. Understanding the adsorption of 4H-1,2,4-triazole derivatives on mild steel surface in molar hydrochloric acid. Appl. Surf. Sci. 2007, 253, 3696–3704. [Google Scholar] [CrossRef]
  9. Sharma, S.K. Green Corrosion Chemistry and Engineering, Opportunities and Challenges; Wiley-VCH Verlag GmbH & Co., KGaA: Weinheim, Germany, 2011. [Google Scholar]
  10. Papavinsam, S. Corrosion inhibitors, Ch. 59. In Uhlig’s Corrosion Handbook, 2nd ed.; Revie, R.W., Ed.; John Wiley: Hoboken, NJ, USA, 2000. [Google Scholar]
  11. Rahim, A.A.; Kassim, J. Recent development of vegetal tannins in corrosion protection of iron and steel. Recent Pat. Mater. Sci. 2008, 1, 223–231. [Google Scholar] [CrossRef]
  12. Zhao, L.; Teng, H.K.; Yang, Y.S.; Tan, X. Corrosion inhibition approach of oil production systems in offshore oilfields. Mater. Corros. 2004, 55, 684–688. [Google Scholar] [CrossRef]
  13. Adamu, M.; Umoru, L.E.; Ige, O.O. Effect of toluene and dioctylphthalate on the rebar corrosion of medium carbon steel in seawater and cassava fluid. J. Miner. Mater. Charact. Eng. 2014, 2, 1–7. [Google Scholar] [CrossRef]
  14. Yadav, M.; Debasis, B.; Sinha, R.R.; Yadav, P.N. Experimental and quantum studies on adsorption and corrosion inhibition effect on mild steel in hydrochloric acid by thiophene derivatives. Acta Metall. Sin. 2014, 27, 37–46. [Google Scholar] [CrossRef]
  15. Chong, A.L.; Mardel, J.I.; MacFarlane, D.R.; Forsyth, M.; Somers, A.E. Synergistic corrosion inhibition of mild steel in aqueous chloride solution by imidazolinium carboxylate salt. ACS Sustain. Chem. Eng. 2016, 4, 1746–1755. [Google Scholar] [CrossRef]
  16. Ostovari, A.; Hoseinieh, S.M.; Peikari, M.; Shadizadeh, S.R.; Hashemi, S.J. Corrosion inhibition of mild steel in 1 M HCl solution by henna extract: A comparative study of the inhibition by henna and its constituents (Lawsone, Gallic acid, α-d-Glucose and Tannic acid). Corros. Sci. 2009, 51, 1935–1949. [Google Scholar] [CrossRef]
  17. Salensky, G.A.; Cobb, M.G.; Everhart, D.S. Corrosion-Inhibitor Orientation on Steel. Ind. Eng. Chem. Prod. Res. Dev. 1986, 25, 133–140. [Google Scholar] [CrossRef]
  18. Rodriguez-Clemente, E.; Gonzalez-Rodriguez, J.G.; Valladares-Cisneros, M.G. Allium sativum as corrosion inhibitor for carbon steel in sulfuric acid. Int. J. Electrochem. Sci. 2014, 9, 5924–5936. [Google Scholar]
  19. Ibrahim, T.H.; Zour, M.A. Corrosion inhibition of mild steel using fig leaves extract in hydrochloric acid solution. Int. J. Electrochem. Sci. 2011, 6, 6442–6455. [Google Scholar]
  20. Lanigan, R.S. Final report on the safety assessment of Cocoyl sarcosine, Lauroyl sarcosine, Myristoyl sarcosine, Oleoyl sarcosine, Stearoyl Sarcosine, Sodium Cocoyl sarcosinate, Sodium Lauroyl sarcosinate, Sodium Myristoyl sarcosinate, Ammonium Cocoyl sarcosinate, and Ammonium Lauroyl sarcosinate. Int. J. Toxicol. 2001, 20 (Suppl. 1), 1–14. [Google Scholar] [PubMed]
  21. Rocca, E.; Steinmetz, J. Inhibition of lead corrosion with saturated linear aliphatic chain monocarboxylates of sodium. Corros. Sci. 2001, 43, 891–902. [Google Scholar] [CrossRef]
  22. Boisier, G.; Lamure, A.; Pébère, N.; Portail, N.; Villatte, M. Corrosion protection of A2024 sealed anodic layers using the hydrophobic properties of carboxylic acids. Surf. Coat. Technol. 2009, 203, 3420–3426. [Google Scholar] [CrossRef]
  23. Hefter, G.T.; North, N.A.; Tan, S.H. Organic corrosion inhibitors in neutral solutions; Part 1—Inhibition of steel, copper, and aluminum by straight chain carboxylates. NACE Int. Corros. 1997, 53, 657–667. [Google Scholar] [CrossRef]
  24. Lahem, D.; Poelman, M.; Atmani, F.; Olivier, M.-G. Synergistic improvement of inhibitive activity of dicarboxylates in preventing mild steel corrosion in neutral aqueous solution. Corros. Eng. Sci. Technol. 2012, 47, 463–471. [Google Scholar] [CrossRef]
  25. Abboud, Y.; Tanane, O.; El Bouari, A.; Salghi, R.; Hammouti, B.; Chetouani, A.; Jodeh, S. Corrosion inhibition of carbon steel in hydrochloric acid solution using pomegranate leave extract. Corros. Eng. Sci. Technol. 2016, 51, 557–565. [Google Scholar] [CrossRef]
  26. Diamanti, M.V.; Velardi, U.V.; Brenna, A.; Mele, A.; Pedeferri, M.; Ormellese, M. Compatibility of imidazolium-based ionic liquids for CO2 capture with steel alloys: A corrosion prespective. Electrochim. Acta 2016, 192, 414–421. [Google Scholar] [CrossRef]
  27. Kálmán, E.; Kármán, F.H.; Telegdi, J.; Várhegyi, B.; Balla, J.; Kiss, T. Inhibition efficiency of N-containing carboxylic and carboxy-phosphonic acids. Corros. Sci. 1993, 35, 1477–1482. [Google Scholar] [CrossRef]
  28. Sastri, V.S. Challenges in Corrosion: Cost, Causes, Consequences, and Control; John Wiley: Hoboken, NJ, USA, 2015. [Google Scholar]
  29. Lgaz, H.; Anejjar, A.; Salghi, R.; Jodeh, S.; Zougagh, M.; Warad, I.; Larouj, M.; Sims, P. Characterization of corrosion products formed on carbon steel in hydrochloric acid medium by 4-(dimethlamino)-1-(6-methoxy-6-oxohexyl) pyridinium bromide. Int. J. Corros. Scale Inhib. 2016, 5, 209–231. [Google Scholar]
  30. Heydari, M.; Javidi, M. Corrosion inhibition and adsorption behaviour of an amido-imidazoline derivative on API 5L X52 steel in CO2-saturated solution and synergistic effect of iodide ions. Corros. Sci. 2012, 61, 148–155. [Google Scholar] [CrossRef]
  31. Ochoa, N.; Moran, F.; Pébère, N.; Tribollet, B. Influence of flow on the corrosion inhibition of carbon steel by fatty amines in association with phosphonocarboxylic acid salts. Corros. Sci. 2005, 47, 593–604. [Google Scholar] [CrossRef]
  32. Ochoa, N.; Moran, F.; Pébère, N. The synergistic effect between phosphonocarboxylic acid salts and fatty amines for the corrosion protection of a carbon steel. J. Appl. Electrochem. 2004, 34, 487–493. [Google Scholar] [CrossRef]
  33. Ochoa, N.; Baril, G.; Moran, F.; Pébère, N. Study of the properties of a multi-component inhibitor used for water treatment in cooling circuits. J. Appl. Electrochem. 2002, 32, 497–504. [Google Scholar] [CrossRef]
  34. Kaskah, S.E.; Ehrenhaft, G.; Gollnick, J.; Fischer, C.B. Concentration and coating time effects of N-acyl sarcosine derivatives for corrosion protection of low-carbon steel CR4 in salt water—Defining the window of application. Corros. Eng. Sci. Technol. 2019, 3, 216–224. [Google Scholar] [CrossRef]
  35. Edwards, A.; Osborns, C.; Webster, S.; Klenerman, D.; Joseph, M.; Ostovar, P.; Doyle, M. Mechanistic studies of the corrosion inhibitor oleic imidazoline. Corros. Sci. 1994, 36, 315–325. [Google Scholar] [CrossRef]
  36. Wegst, C.; Wegst, M. Stahlschlüssel, 22; Auflage, Verlag Stahlschlüssel Wegst GmbH: Marbach, Germany, 2010. [Google Scholar]
  37. DIN EN ISO 9227:2006; Corrosion Tests in Artificial Atmospheres—Salt Spray Tests. European Committee for Standardization: Brussels, Belgium, 2006.
  38. DIN EN ISO 1514:2005-02; Paints and Varnishes—Standard Panels for Testing. European Committee for Standardization: Brussels, Belgium, 2004.
  39. Tawfik, S.M.; Negm, N.A. Vanillin-derived non-ionic surfactants as green corrosion inhibitors for carbon steel in acidic environments. Res. Chem. Intermed. 2016, 42, 3579–3607. [Google Scholar] [CrossRef]
  40. Duarte, T.; Meyer, Y.A.; Osório, W.R. The Holes of Zn Phosphate and Hot Dip Galvanizing on Electrochemical Behaviors of Multi-Coatings on Steel Substrates. Metals 2022, 12, 863. [Google Scholar] [CrossRef]
  41. Zhang, X.L.; Jiang, Z.H.; Yao, Z.P.; Song, Y.; Wu, Z.D. Effects of scan rate on the potentiodynamic polarization curve obtained to determine the Tafel slopes and corrosion current density. Corros. Sci. 2009, 51, 581–587. [Google Scholar] [CrossRef]
  42. McCafferty, E. Validation of corrosion rates measured by Tafel extrapolation method. Corros. Sci. 2005, 47, 3202–3215. [Google Scholar] [CrossRef]
  43. ImageJ Homepage. Available online: https://imagej.nih.gov/ij/index.html (accessed on 16 July 2022).
  44. Origin 8.1 SR2, Home Page. Available online: http://www.originlab.com (accessed on 16 July 2022).
  45. Ma, Y.; Han, F.; Li, Z.; Xia, C. Corrosion behavior of metallic materials in acidic-functionalized ionic liquids. ACS Sustain. Chem. Eng. 2016, 4, 633–639. [Google Scholar] [CrossRef]
  46. Mounir, F.; Salghi, R.; Jodeh, S.; El Issami, S.; Bazzi, L. Argania spinosa (L.) as a source of new and efficient green corrosion inhibitor for copper in acidic medium: A comparative study of three green compounds. Int. J. Corros. Scale Inhib. 2016, 5, 159–171. [Google Scholar] [CrossRef]
  47. Vashisht, H.; Kumar, S.; Bahadur, I.; Singh, G. Evaluation of (2-hydroxyethyl) triphenyl phosphonium bromide as corrosion inhibitor for mild steel in sulphuric acid. Int. J. Electrochem. Sci. 2013, 8, 684–699. [Google Scholar]
  48. Jacobsen, T.; West, K. Diffusion impedance in planar, cylindrical and spherical symmetry. Electrochim. Acta 1995, 40, 255–262. [Google Scholar] [CrossRef]
  49. Zia, A.I.; Mukhopadhyay, S.C. Impedance Spectroscopy and Experimental Setup, Ch 2. In Electrochemical Sensing: Carcinogens in Beverages; Springer Nature: Berlin/Heidelberg, Germany, 2016. [Google Scholar] [CrossRef]
  50. Ashassi-Sorkhabi, H.A.; Asghari, E.; Ejbari, P. Electrochemical studies of adsorption and inhibitive performance of basic yellow 28 dye on mild steel corrosion in acid solutions. Acta Chim. Slov. 2011, 58, 270–277. [Google Scholar]
  51. Trabanelli, G.; Carassiti, V. Mechanism and phenomenology of organic inhibitors. In Advances in Corrosion Science and Technology; Fontana, M.G., Staehle, R.W., Eds.; Springer: Boston, MA, USA, 1970; Volume I, pp. 147–228. [Google Scholar]
Figure 1. Schematic of the inhibitors used, including the composition of present C.
Cmd 03 00029 g001
Figure 2. Results of WL measurements for compounds C (red squares) and OI (blue dots), and their combination C + OI (green triangles) recorded in 0.1 M NaCl for 24 h. The result of the untreated material is displayed as a black dashed line, for reference, and the efficiency is on the right.
Cmd 03 00029 g002
Figure 3. Corrosion current density and IE for different concentrations of C (blue), OI (red), and C + OI (green) during PP measurement of steel CR4 in 0.1 M NaCl. The included images present exemplary degraded samples after the electrochemical test. The result of the untreated material is given as a black dashed line at 62 µA/cm2, respectively, as 0% efficiency, for reference on the right.
Cmd 03 00029 g003
Figure 4. Left: EIS spectra with equivalent circuit (inset in a) of compounds C and OI: (a) for untreated CR4 steel (black squares) and OI at 50 mmol/L (red circles); (b) all concentrations (25–100 mmol/L according to the color code) for compound C; and (c) all concentrations for the combination C + O. Right: Bode plots of compounds C and OI: (d) for untreated CR4 (black squares) and OI at 50 mmol/L (red circles); (e) all concentrations (25–100 mmol/L according to the color code) for compound C; and (f) all concentrations for the combination C + O. (individual presentations in Supplementary SI 3).
Cmd 03 00029 g004
Figure 5. SEM images and EDS spectra for (a) blank steel sample as reference; (b) inhibitor-immersed steel sample (10 min in C + OI 100 mmol/L) and (c) section of a corresponding elemental mapping of (b).
Cmd 03 00029 g005
Figure 6. Effects of IE for increasing immersion time for compound C (red squares), OI (blue circles), and combination C + OI (green triangles up) each 50 mmol/L evaluated by PP.
Cmd 03 00029 g006
Figure 7. (a) Visible corrosion propagation for blank steel (black) and in the presence of 50 mmol/L C (blue), OI (red), and C + OI (green) each at the indicated times. In all cases, only one exemplary run of ten independent specimens with characteristic corrosion patterns is shown. (b) Presentation of the averaged relative corrosion areas during the test period for untreated and treated series with an indication of the IE in % at 24 h. (c) Linear approximation displaying the root of the relative corrosion area to the exposure time. The course of the linear performance and the calculated slope is given according to the color code. (Data points are marked with lines for better readability).
Cmd 03 00029 g007
Figure 8. Left: Visible corrosion propagation for blank steel (black) and in the presence of different concentrations of the combination C + OI each at the indicated times. In all cases, only one exemplary run of ten independent specimens with characteristic corrosion patterns is shown. Right: Presentation of the averaged relative corrosion areas during the test period for untreated and treated series with an indication of the IE in % at 24 h (Data points are marked with lines for better readability).
Cmd 03 00029 g008
Table 1. Metallic composition of the present low carbon steel CR4 in comparison to the standard [36].
ElementCWMnPSCuAlCrMoNiCoW
Norm [36]max. 0.120n.a.max. 0.600max. 0.045max. 0.045n.a.n.a.n.a.n.a.n.a.n.a.n.a.
Present0.0630.0130.2600.0170.0080.0000.0330.0030.0060.0000.0000.006
Table 2. WL results for CR, θ and IE for steel CR4 samples dip coated in different concentrations of C, OI and C + OI after immersion in 0.1 M NaCl at RT for 24 h.
Concentration (mmol/L)WL
(mg) × 10−3
CR
(mg⋅cm−2⋅h−1) × 10−5
Surface Coverage (θ)IE
(%)
Blank05.70 ± 0.861.900--
Inhibitor
C253.40 ± 0.301.1330.40440.4
503.25 ± 0.211.0830.43043.0
753.23 ± 0.651.0770.43343.3
1003.13 ± 0.911.0410.45245.2
OI253.85 ± 0.781.2830.32532.5
503.37 ± 1.291.1220.40940.9
753.30 ± 0.281.1000.42142.1
1003.25 ± 2.471.0830.43043.0
C + OI251.50 ± 0.900.5000.73773.7
501.24 ± 0.920.4130.78278.2
751.03 ± 1.560.3430.81981.9
1000.98 ± 1.550.3280.82782.7
Table 3. PP results for C, OI and C + OI in 0.1 M NaCl. CR is given in millimeter per year (mm/y) depending on current density icorr.
Cinh (mmol/L)icorr
(µA/cm2)
CR (mm/y)βa
(mV/dec)
βc
(mV/dec)
Ecorr (mV)Surface
Coverage (θ)
IE (%)
Blank [34]061.93 ± 7.471.33916.87−2.98−324--
Inhibitor
C2549.89 ± 9.011.08231.00−3.54−3210.19519.5
5040.34 ± 4.930.87530.03−3.91−3000.34934.9
7534.59 ± 4.500.75021.80−4.38−2930.44244.2
10032.78 ± 1.290.71122.23−4.06−2880.47147.1
OI2545.55 ± 7.560.98820.70−3.44−4130.26526.5
5041.76 ± 10.790.90627.84−3.62−3950.32632.6
7536.73 ± 2.300.79723.65−3.98−4110.40740.7
10033.89 ± 6.060.73530.58−3.04−4170.45345.3
C + OI2515.77 ± 0.450.34229.60−4.26−2490.74574.5
508.52 ± 1.600.18429.28−3.46−2600.86286.2
755.86 ± 2.200.12636.08−4.07−2320.90590.5
1005.31 ± 0.520.11525.90−3.64−2530.91491.4
Table 4. EIS results for C, OI and C + OI in 0.1 M NaCl. The values of RS and Rct are given in Ω cm2.
Cinh
(mmol/L)
Rs
(Ω cm2)
Rct
(Ω cm2)
Cdl
(μF/cm2)
Surface Coverage (θ)IE
(%)
Blank064.38178.862.6425--
Inhibitor
OI5090.95331.332.19190.46046.0
C2579.50570.121.60870.68668.6
5080.34687.261.59940.73973.9
7581.40350.281.52420.48948.9
10082.17301.331.81550.40640.6
C + OI25204.15779.332.26670.77077.0
50267.67977.132.14700.81681.6
7596.61077.272.10340.81781.7
100229.561158.682.08780.84584.5
Table 5. PP results for C, OI and C + OI each 50 mmol/L at different immersion times tested in 0.1 M NaCl. CR is given in millimeter per year (mm/y) depending on current density icorr. The corrosion reduction efficiency is given as IE in %.
InhibitorCoating
Time (min)
icorr
(µA/cm2)
CR (mm/y)βa
(mV/dec)
βc
(mV/dec)
Ecorr
(mV)
Surface
Coverage (θ)
IE (%)
Blank [34]061.93 ± 7.471.33916.87−2.98−324--
C158.62 ± 19.661.26818.18−2.98−3070.05345.34
2.551.66 ± 7.761.11715.69−4.11−3070.165816.6
536.85 ± 1.880.79714.59−4.28−3040.404940.5
1036.68 ± 4.930.79330.03−3.91−3000.407740.8
3047.21 ± 7.271.02111.04−3.55−3190.237623.8
OI146.06 ± 6.740.99620.53−2.88−3950.256225.6
2.543.31 ± 10.050.93622.50−3.72−2800.300630.1
541.52 ± 2.010.89817.42−3.68−4060.329533.0
1035.67 ± 0.450.77127.84−3.62−3950.424042.4
3047.74 ± 7.041.03219.56−4.20−3310.229122.9
C + OI117.64 ± 3.320.38119.92−5.55−2890.715171.5
2.513.32 ± 2.280.28813.72−5.54−2800.784878.5
58.95 ± 1.140.19314.40−5.36−2890.855385.5
108.52 ± 1.600.18416.65−4.14−2600.862486.2
309.06 ± 2.490.19512.39−4.77−2670.853785.4
Table 6. Corrosion reduction efficiency according to Equation (6) for the spray corrosion measures at the given times.
Time (h)BlankCIE of C (%)OIIE of OI (%)C + OIIE of C + OI (%)
272.03 ± 1.5018.76 ± 0.8974.019.79 ± 2.2272.50.25 ± 0.4099.7
481.54 ± 0.9934.28 ± 3.3658.052.79 ± 7.0435.31.27 ± 1.0998.4
887.95 ± 1.4951.91 ± 1.7841.064.06 ± 5.3727.22.66 ± 2.0197.0
1495.35 ± 0.4868.38 ± 3.0228.377.10 ± 6.0219.19.05 ± 7.2890.5
2497.69 ± 0.4881.57 ± 0.5016.584.64 ± 7.2613.419.67 ± 7.6280.0
Table 7. Corrosion reduction efficiency according to Equation (6) for the spray corrosion measures at the given times for different concentrations of C + OI.
Time (h)BlankC + OI
25 mmol/L
IE
(%)
C + OI
50 mmol/L
IE
(%)
C + OI
75 mmol/L
IE
(%)
C + OI
100 mmol/L
IE
(%)
272.03 ± 1.5055.92 ± 13.5522.40.25 ± 0.4099.70.00 ± 0.001000.00 ± 0.00100
481.54 ± 0.9960.23 ± 9.6926.11.27 ± 1.0998.40.40 ± 0.6599.50.23 ± 0.2199.7
887.95 ± 1.4964.66 ± 11.6426.52.67 ± 2.0197.02.14 ± 1.6497.61.01 ± 0.6598.9
1495.35 ± 0.4870.32 ± 9.5426.39.05 ± 7.2890.56.58 ± 5.6993.15.39 ± 1.4394.4
2497.69 ± 0.4872.33 ± 10.5126.019.67 ± 13.6280.013.98 ± 11.0385.713.74 ± 2.2786.0
Publisher’s Note: MDPI stays neutral with regard to jurisdictional claims in published maps and institutional affiliations.

