4. Previous Radiolysis Models for ITER
Several models have been developed for describing the chemistry/radiolysis of water in the ITER PHTS [
1,
25,
26,
27,
28,
31], some of which are discussed below. These models are generally extensions or adaptations of the models that have been employed for modeling the primary coolant circuits of water-cooled fission reactors, including BWRs, PWRs, VVERs, and CANDUs, so listings of the reactions in each model are not given here because of the limitations in space. Instead, the reader is referred to the original publications for mechanistic details. However, close examination of these models shows that they suffer from the same maladies as do the fission reactor radiolysis models, as discussed above. This is illustrated below regarding two specific models.
Before reviewing the previous work on modeling the radiolysis of water in the ITER, it is first necessary to briefly discuss some important differences in the radiation produced by nuclear fissioning of
235U
92 by thermal neutrons, as in water-cooled and moderated fission reactors, and the fissioning of the isotopes of hydrogen. The fissioning of
235U
92 may be described by the reaction
235U
92 +
1n
0 →
144Ba
56 +
89Kr
36 + 3
1n
0, which is sometimes written as
235U
92 +
1n
0 →
134Xe
54 +
100Sr
38 + 2
1n
0, where the energy of the prompt neutrons is 4.8 MeV. A spectrum of
γ-photon of 15–25 MeV is also emitted, and the total energy release including delayed emission is 211.3 MeV, corresponding to a 0.093% conversion of mass into energy [% mass conversion = 0.4255(
E/c2),
Table 1]. Thus, the radiation in light or heavy water-moderated fission reactors, such as a BWRs, PWRs, VVERs, and CANDUs, comprises neutrons and
γ-photons. In the case of a PWR, which employs a boric acid nuclear “shim” to control core reactivity via the neutron absorbing reaction
10B
5(
1n
0,
4He
2)
7Li
3, the resulting
α particles (
4He
2) contribute significantly to the total energy dose rate. In the case of nuclear fusion, the D–T reaction has the lowest ignition temperature and may be written as
2H
1 +
3H
1 →
4He
2 (3.5 MeV) +
1n
0 (14.1 MeV) to yield a total energy of 17.6 MeV, with a mass-to-energy conversion of 0.386% (
Table 1 and
Table 2). A fusion reactor will also produce a considerable
γ-photon dose rate from the plasma, as further noted below. The penetrating power of the different forms of radiation in water are measured by the LET values summarized in
Table 10, along with typical dose rates for the various forms of radiation. The G-values given in [
52] are summarized in
Table 11 as a function of LET.
The values listed in
Table 11 were taken from [
52,
53] and strictly apply to irradiation in the aqueous LiOH blanket for the breeding of tritium. In this system, the various forms of irradiation include
γ-photons and recoil ions from the interaction of high-energy neutrons with steel, water, and triton (tritium,
3H
1) and alpha (
4He
2) particles from the neutron fission reaction with
6Li
3 (
6Li
3 +
1n
0 →
3H
1 +
4He
2 + 4.78 MeV). Note that the more massive particles have the largest LET, and hence on a unit energy basis, they are the least penetrating. However, LET is important because the primary radiolytic yields (
) depend on LET, and therein lies an important difference between fusion and fission reactors. Thus, fission reactors operate with much fewer energetic neutrons (4.8 MeV down to a few tenths of an eV for “thermalized” neutrons) than does a fusion reactor (14.1 MeV), so the primary radiolytic yields are expected to be significantly different for a fusion reactor than those for a fission reactor.
One major issue that arises from coolant radiolysis in ITER is the dissociation of water into gaseous hydrogen and oxygen [
1,
25,
35,
37,
50,
77,
94,
96]. This issue has been recently addressed by radiolysis modeling in [
1,
35]. Accumulation of these gases in a tank could potentially lead to accident scenarios. Furthermore, if oxygen is allowed to accumulate unimpeded, it represents a corrosion hazard, particularly toward copper alloys. Two approaches may be adopted to reduce or even eliminate this risk: (1) continuous vacuum degassing, as was practiced in some BWRs, and (2) hydrogen additions to the coolant, as is practiced in PWRs and in BWRs operating on hydrogen water chemistry (HWC).
Although there are three PHTSs in ITER (see
Figure 8), Sato et al. [
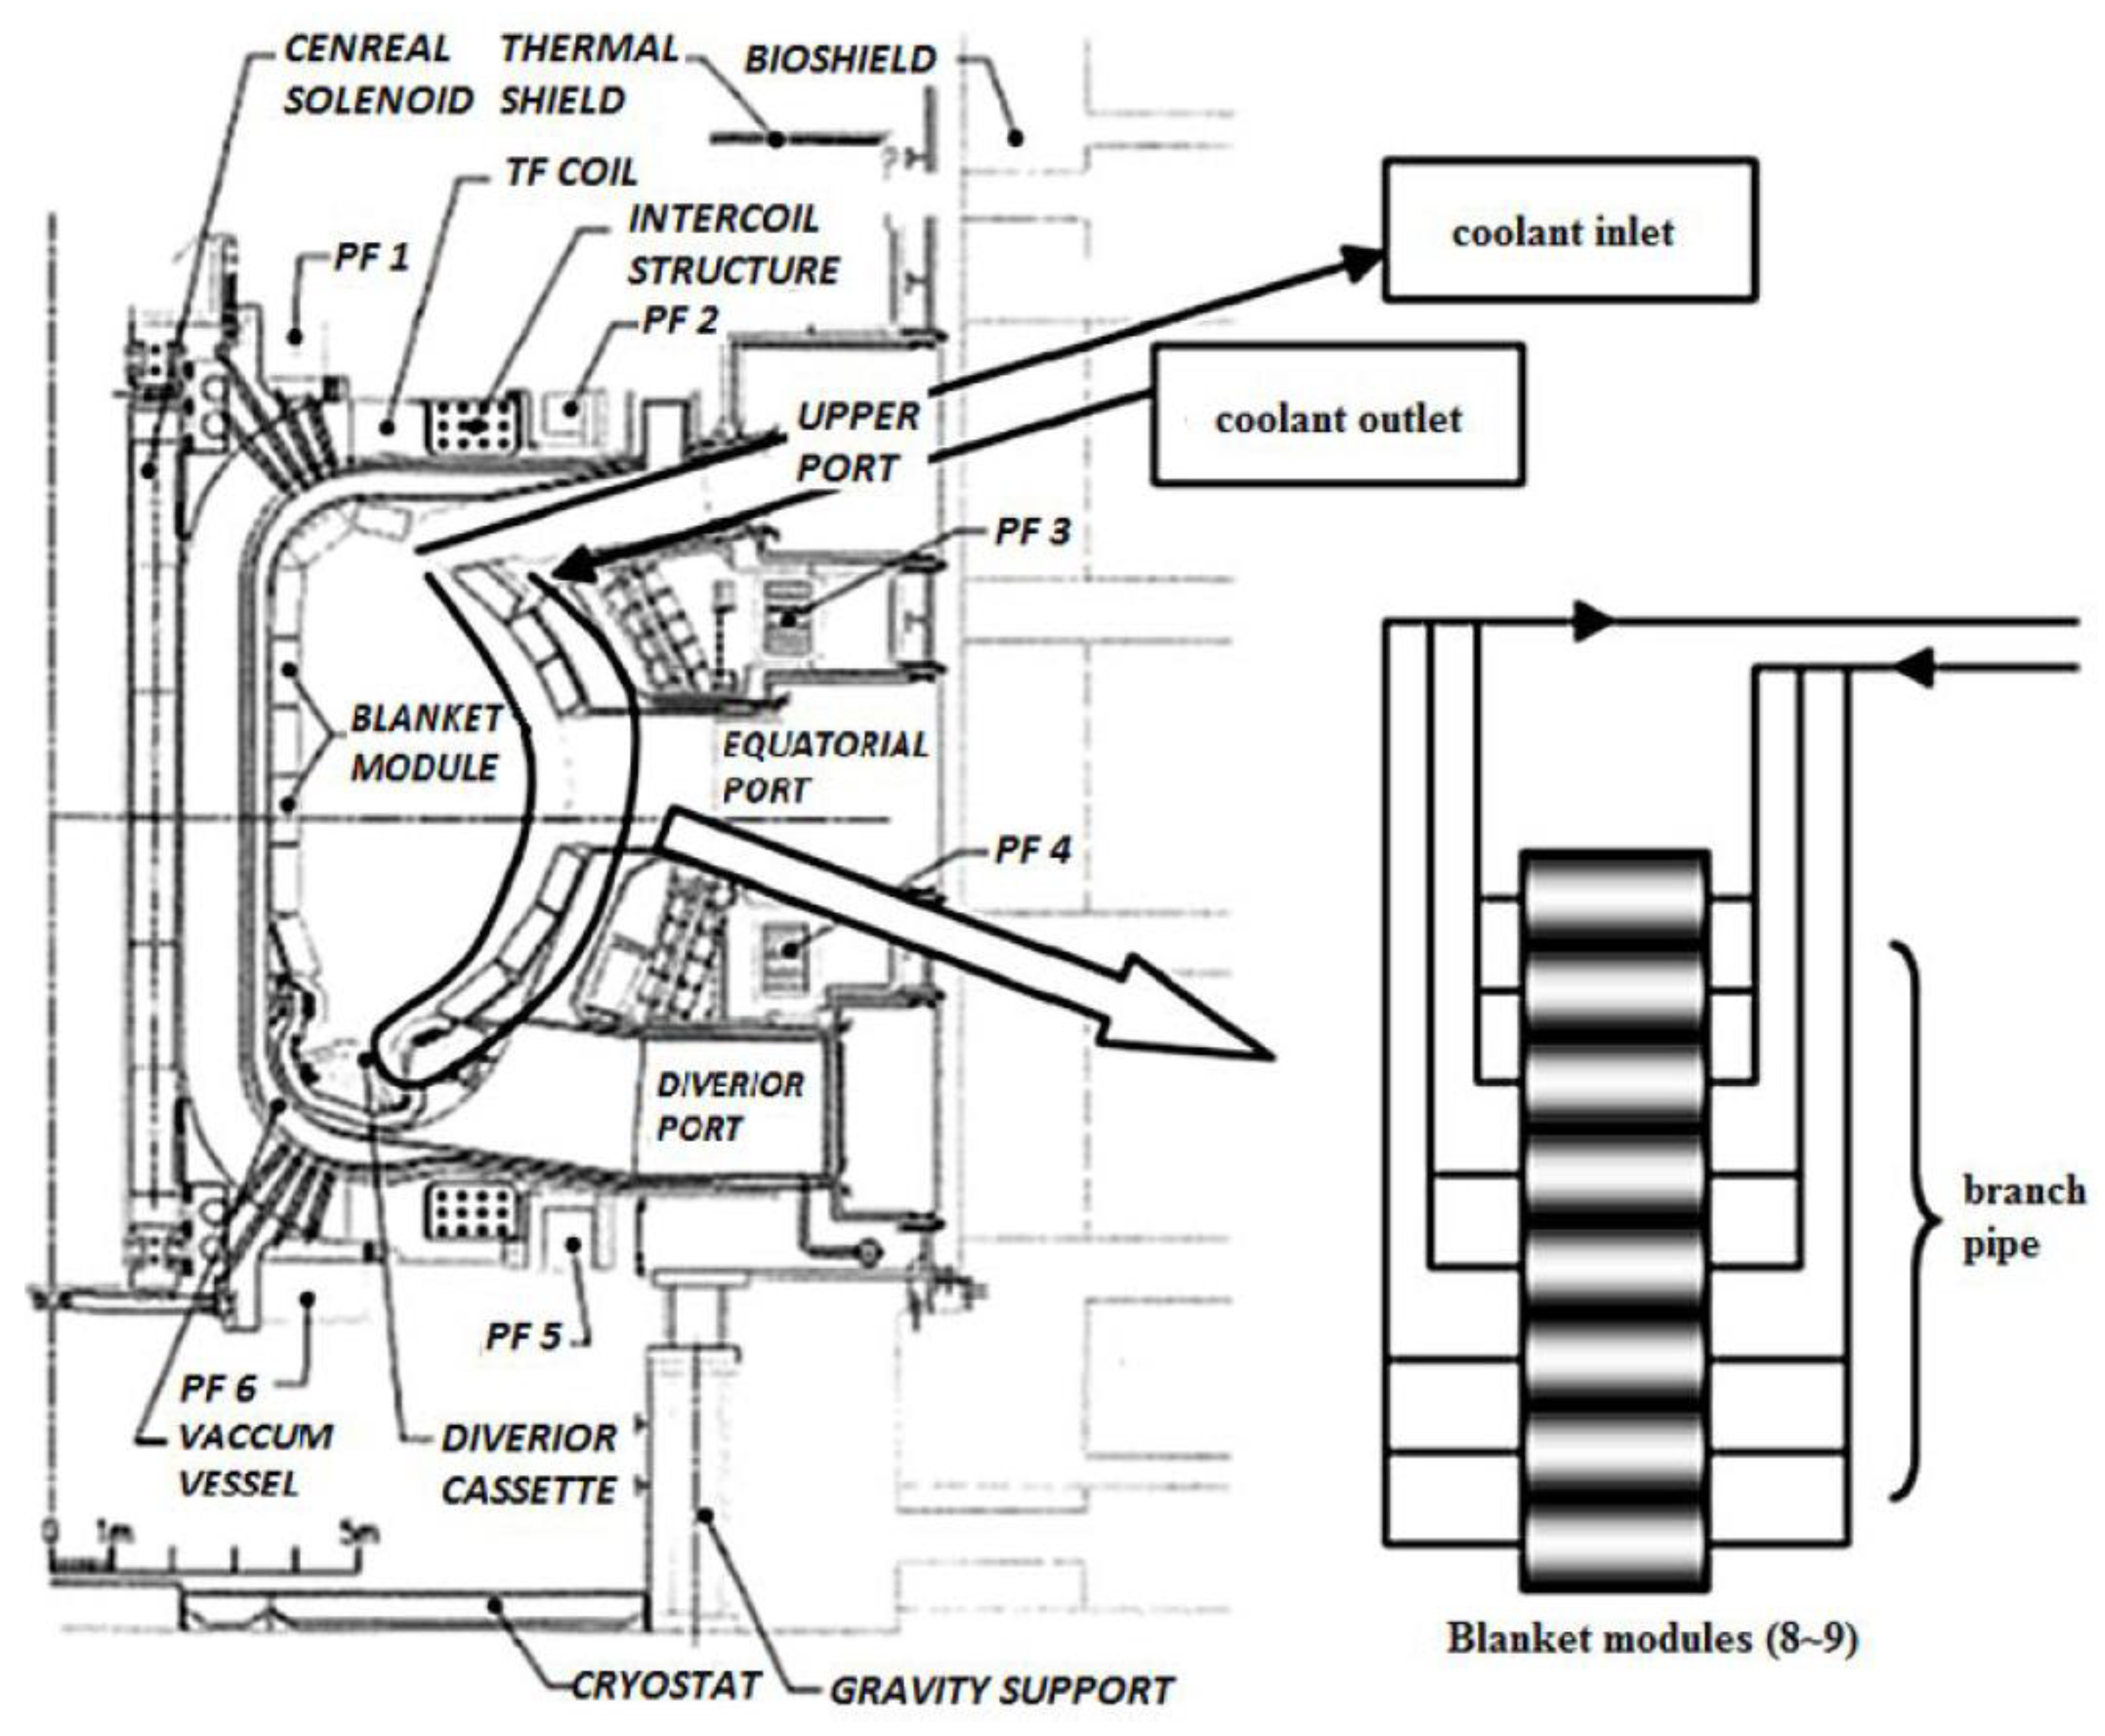
25] chose to model the blanket cooling system (which is part of today’s IBED PHTS) because it will experience the highest irradiation dose rates from the 14.1 MeV neutrons and the 15–25 MeV gamma photons produced by D–T fusion. A schematic of the blanket flow system is given in
Figure 16. Only one of the three identical blanket cooling loops was modeled. As seen in
Figure 16, the cooling water enters the upper side of the blanket, then circulates within the blanket, and exits to the HX from the upper side of the blanket again. The blanket comprises many tubes (called “blanket modules,”
Figure 16), and although the flow rate is different through each module, an average value was used for the sake of simplicity.
The sequence of materials to which the coolant is exposed as it flows through the blanket PHTS are stainless steel plate at the inlet, a copper heat sink, stainless steel plate, another stainless steel, a copper heat sink, and stainless steel corresponding to the outlet stainless steel plate, the Cu heat sink, and finally a stainless steel shield block at the coolant outlet. Thus, the materials represent a mixture of stainless steels and copper. If the conditions achieved within the coolant are highly reducing, via the addition of hydrogen to effectively “suppress” radiolysis and hence the production of oxygen and hydrogen peroxide, copper will be immune to corrosion if the electrochemical potential is displaced below the equilibrium potential for the Cu+/Cu reaction for a given activity of Cu+, except if the coolant contains an activating species, such as bisulfide ion (HS−) or a complexing species such as ammonia (NH3). Given that ammonia is generated by neutron capture by oxygen, this latter possibility is an important issue that needs to be addressed in any future work. Furthermore, dissolved copper is known to plate out on stainless steels via a displacement reaction and induce pitting attack on the steel. This illustrates the “law of unintended consequences” when choosing multiple materials for service in a coolant system.
Table 12 summarizes the parameters used in [
25] to model the blanket PHTS in ITER. The coolant is pure water of pH = 7 at 25 °C, to which is added 2 ppm of hydrogen. For comparison with a typical PWR PHTS, this concentration amounts to 22.4 cm
3(STP)/kg H
2O, which is at the lower end for current PWR operation (20–35 cm
3(STP)/kg H
2O), but is significantly greater than that of a BWR operating under the HWC protocol (typically 0.5–1.0 ppm H
2). However, no pH control, as exists in PWR primary coolant, is currently proposed for ITER. Therefore, the proposed water chemistry is best described as corresponding to Super Hydrogen Water Chemistry (SHWC) without boiling, which is ensured by the pressure of 3 MPa (30 atm). A flow rate of 1.74 × 10
3 kg/s is assumed for the modeled loop. From the volumes of each section and the flow rates, transit times for the water in various regions of the circuit are calculated to be 1.29 s, 5 s, and 71.62 s. Most time is spent in the nonradiated regions. The absorbed neutron irradiation energy is taken to be 2.1 × 10
−2 W/g and 1.5 × 10
−3 W/g in the two principal radiation zones, while the corresponding values for gamma photons are 2.7 × 10
−3 and 4.8 × 10
−4 W/g, which are typical of BWRs, but are lower than for a PWR. Thus, from a core specific power viewpoint, ITER is like a BWR. However, the energy spectra for neutrons and gamma photons are quite different between fission and fusion reactors, as has been noted above.
Three sets of irradiation conditions were modeled by Sato et al. [
25], with the irradiation fields being identified in
Figure 17.
Table 11 summarizes the energy dose rates of neutrons and gamma photons in the two radiation fields as a function of time for any element of the coolant.
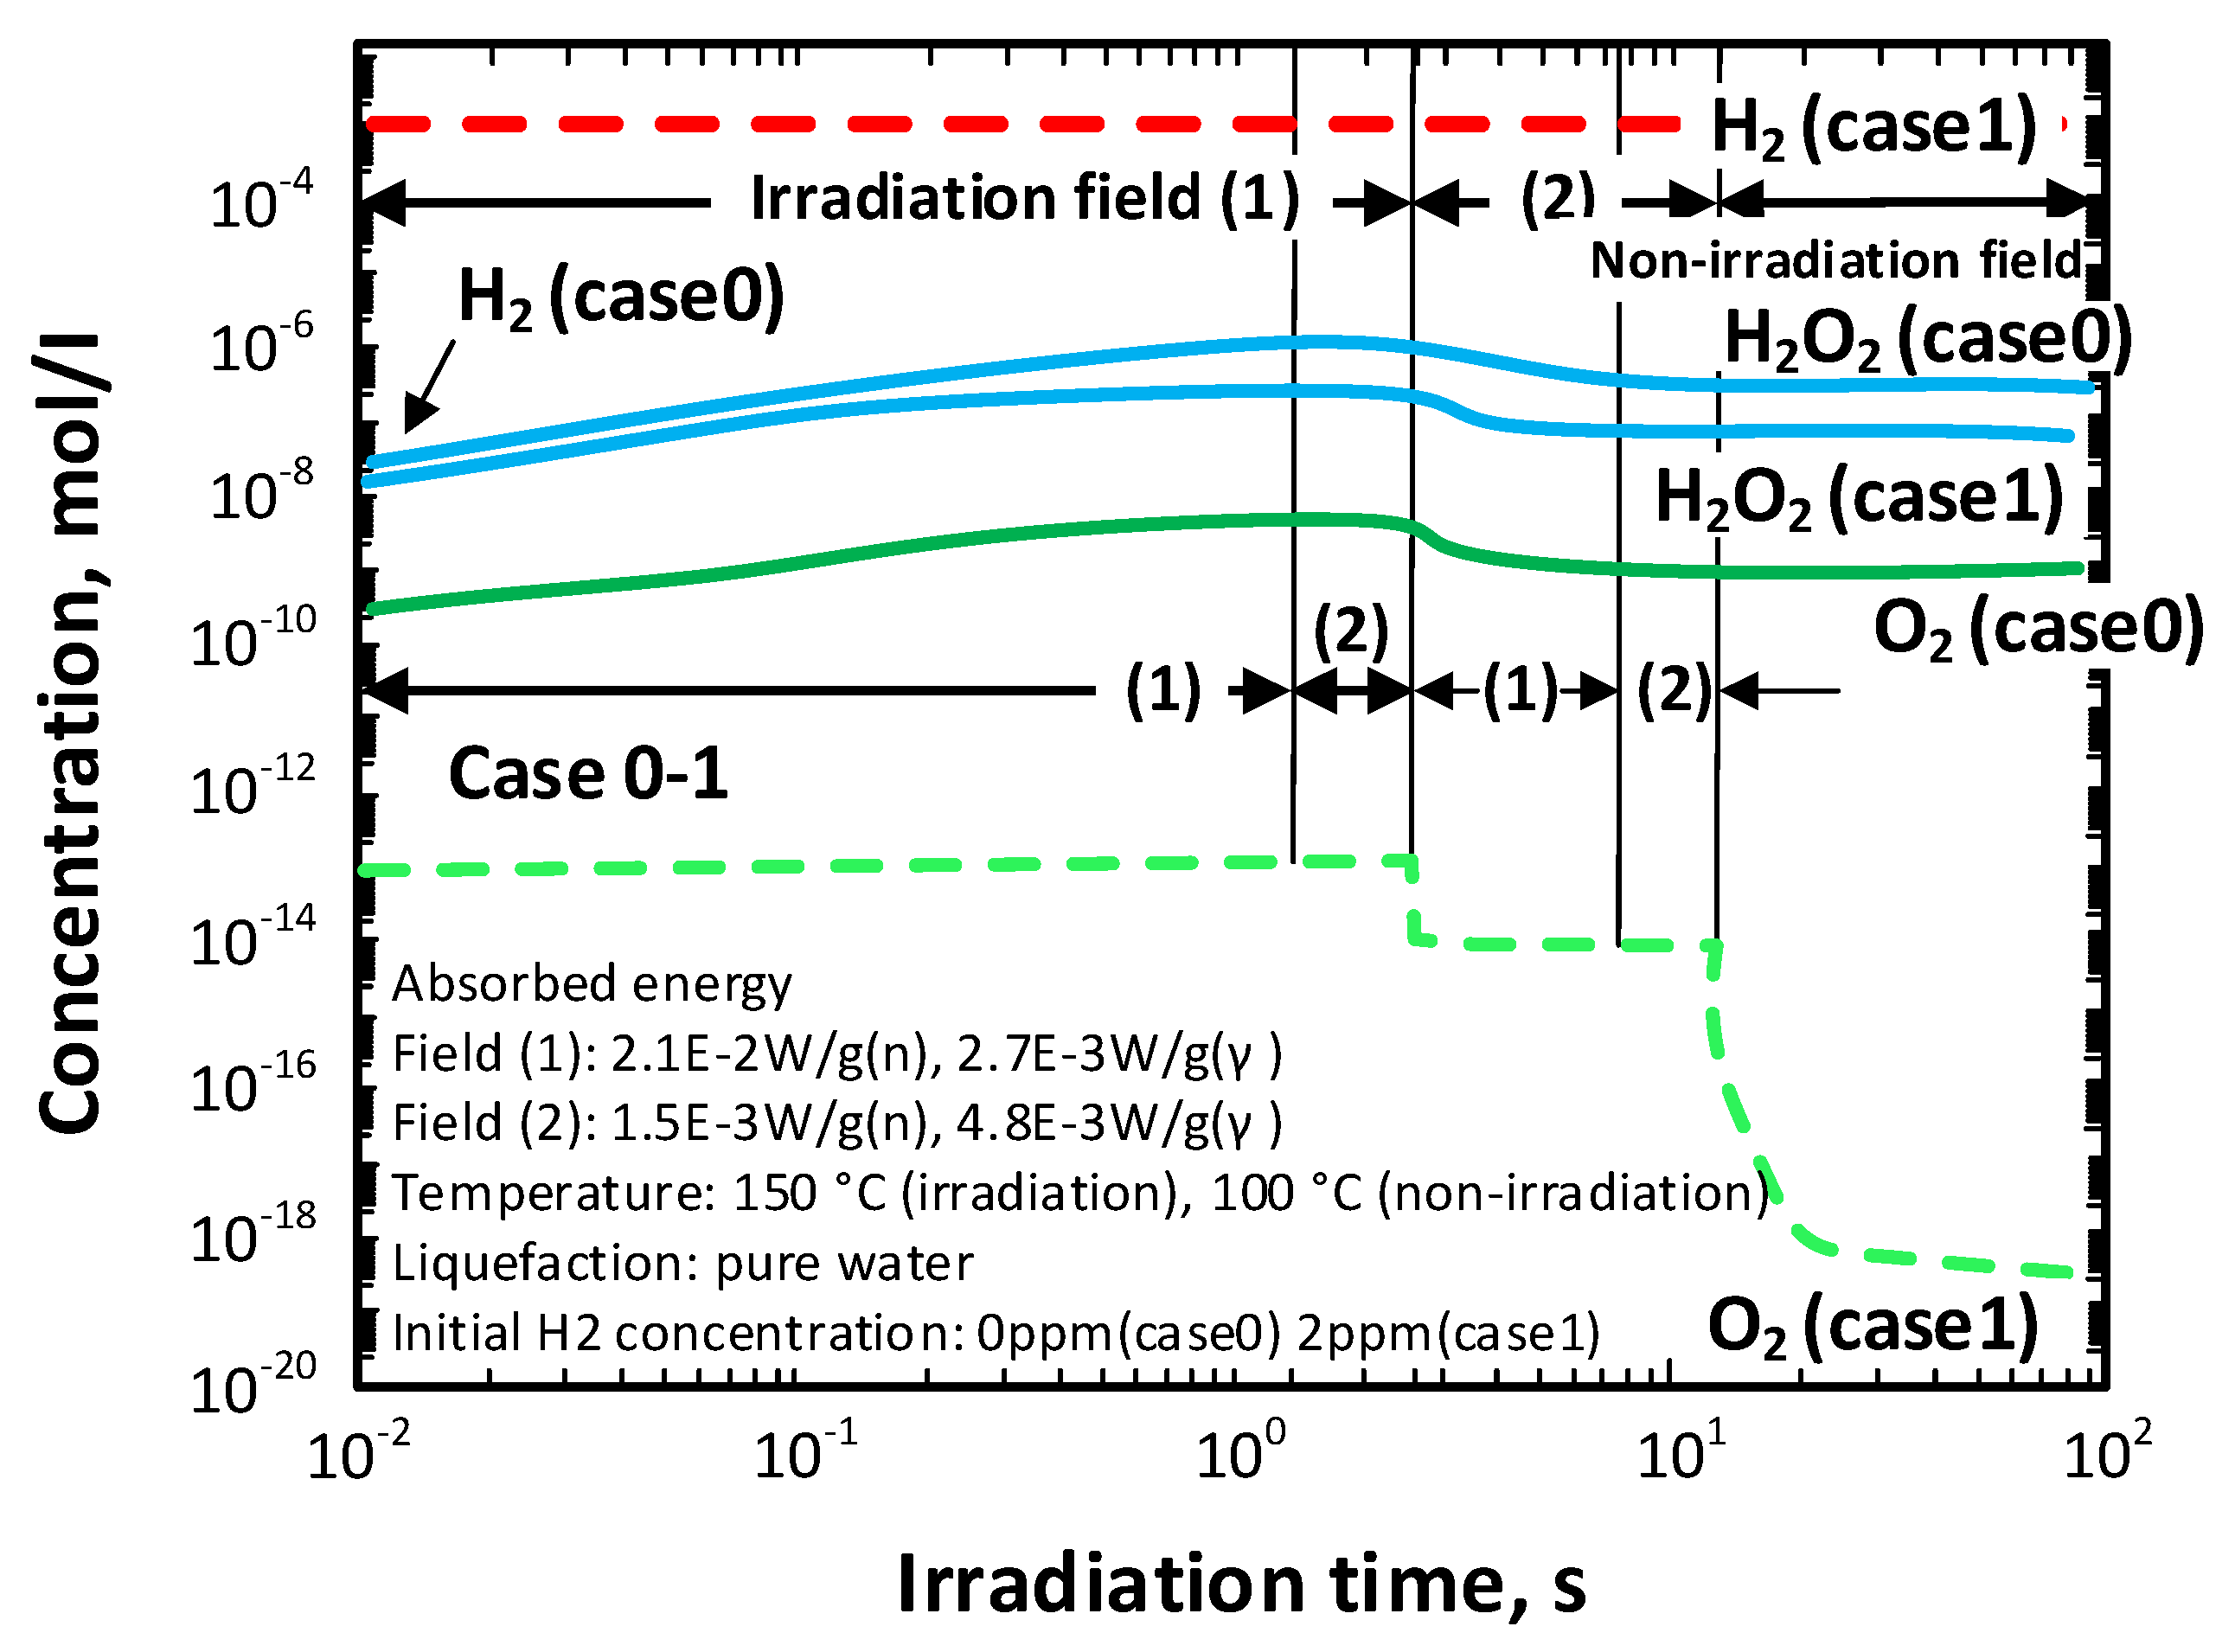
The modeled radiolysis of the coolant in the blanket PHTS of ITER as a function of the radiation zone at a temperature of 150 °C and for (added) hydrogen concentration of 2 ppm (1 × 10
−3 m) is presented in
Figure 18 [
25]. As expected, radiolysis occurs most intensively in Region 1, which is subjected to the highest energy dose rate (
Figure 19). On passing into Region 2, where both the neutron and gamma dose rates are lower (
Figure 18), the concentrations of the radiolysis products are lower, particularly the concentrations of OH and O
2, but the decrease in the concentration of H
2O
2 is quite modest. On entering the nonradiated zone, the concentrations of all radiolysis products are sharply reduced, except that of hydrogen peroxide. Note that the rate of thermal decomposition of H
2O
2 at 150 °C is slow and accounts for the persistence of hydrogen peroxide into the nonradiated zone. These results are in line with similar work carried out on fission reactors, as discussed above.
Figure 19 shows a comparison between the radiolysis behavior of the coolant without hydrogen (Case 0) and with 2 ppm of hydrogen (Case 1). Hydrogen effectively suppresses the formation of oxygen but is predicted to be only modestly effective in suppressing the formation of hydrogen peroxide. Because H
2O
2 is a much stronger oxidizing agent than is O
2, and because it contributes more on a molar basis to establishing a high ECP, weak suppression of H
2O
2 can have important consequences for corrosion. However, these consequences are not directly reflected in the concentrations of the radiolysis products but are reflected in the ECP, which is readily calculated from the concentrations using a mixed potential model [
216,
217,
218]. Thus, it is known that all forms of general corrosion (GC) and localized corrosion (LC), including pitting corrosion (PC), crevice corrosion (CC), stress corrosion cracking (SCC), corrosion fatigue (CF), and hydrogen-induced cracking (HIC), all occur at potentials that are more positive than critical values (more negative in the case of HIC) that depend on the temperature, the thermo-mechanical history of the substrate, and the composition of the alloy. Thus, the strategy for avoiding future corrosion damage requires the use of a water chemistry protocol together with an appropriate alloy that places the ECP as being more negative than the critical potentials for PC, CC, SCC, and CF, but more positive than the critical potential for HIC. A discussion of this important topic is beyond the scope of this review, but the principles supporting this approach will be discussed in Part II [
291].
In summary, the work presented in Sato [
25] has raised several critical issues, including the need for more accurate radiolytic yield data (i.e., primary G-values), particularly for 14 MeV neutrons of high LET. However, it is evident that the study authors were not conversant with corrosion issues or how these are impacted by the radiolysis of water. They also appear to be unaware of the extensive work published on water radiolysis in water-cooled fission reactors and how that phenomenon impacts corrosion and plant operation, as reviewed above. In the authors’ opinion, the radiolysis work published to date on fusion reactors is in the same stage of development as was that for fission reactor work in the mid-1990s. Thus, the authors found only one reliable attempt to calculate the ECP [
253] and no attempts to calculate the rates of growth of stress corrosion cracks, something that was achieved in the mid-1990s in modeling fission reactors [
215,
216,
217,
218,
219,
220,
221,
222,
223,
224,
225,
226,
227,
228,
229,
230,
231,
232,
233,
234,
235,
236,
237,
238,
239,
240,
241,
242,
243,
244,
245,
246,
247,
248,
249,
250,
251,
252,
255,
281,
282,
283,
284,
285,
286,
287,
288,
289], although the SCC of stainless steels had been addressed experimentally [
23].
Kritsky et al. [
27] report a study of radiolysis in the Divertor PHTS (which is part of today’s IBED PHTS) assuming the water chemistry parameters that existed at that time (summarized in
Table 13). The coolant is essentially pure water that is similar to the feedwater of a BWR, except for the added hydrogen; in this case, the coolant may be classified as being SHWC in character, as noted elsewhere. It is apparent that these authors were aware of the importance of the ECP because they list it in the table, albeit without specifying a value.
Four pre-existing radiolysis codes—FACSIMILE, MAKSIMA, CHENSIMUL, and ITERh—with their attendant reaction and parameter sets, were employed [
27]. Although Kritsky et al. [
27] state that the reactions are all elementary, this is not correct because certain reactions may be decomposed into actual elementary reactions, as noted above. Additionally, the reaction set contains reactions between species of like charge, which are unknown in the annals of chemistry under near-ambient conditions, except in the case of outer sphere charge (electron) transfer reactions [
273] because of the strong coulombic repulsion. As shown in
Figure 20, the G-values depend on the LET, with the LET increasing with the kinetic energy of the ionizing particle and hence with mass (and velocity). Thus, γ-photons and β particles (i.e., electrons) tend to be low LET forms of radiation while ionized atoms (e.g., α-particles and C
6+) generally possess high LET. As also shown in
Figure 20, the G-values decrease with increasing LET, except for H
2, H
2O
2, and
, which all show weak increases. The species for which the G-values are found to decrease with increasing LET [H
+,
, OH, and H (LET > 0.2 eV/A)] all result from the initial interaction of ionizing radiation with water, whereas those whose G-values tend to increase with increasing LET (i.e., O
2, H
2, and H
2O
2) result from reactions at longer times (
Table 4). This behavior clearly indicates that the yield reflects a competition between the rate of formation (due to fragmentation of water) and the rate of consumption (as evidenced by reaction within the spur) with consumption dominating at higher LET, resulting in a decrease in the yield. In the case of atomic hydrogen, however, at lower LET levels, the rates of these processes are equal, and the yield is essentially independent of LET (
Figure 20). It is also likely that the data summarized in
Figure 20 are strictly not primary yields, as defined above, because data for species other than those formed in the spurs (
Table 4) are also listed.
The set of G-values employed by Kritsky et al. [
27] for a temperature of 250 °C were taken from Elliot [
51] and others [
73,
87,
146]. The dose rates employed were 1 Gy/s = 100 rad/s = 6.25 × 10
18 eV/(L∙s) or 10
4 Gy/s = 10
6 rad/s = 6.25 × 10
22 eV/(L∙s), and the oxygen concentration in the feedwater was assumed to be 0 or 0.25 mM.
Table 14 presents results obtained using FACSIMILE for neutron and gamma irradiation for equivalent dose rates. These results demonstrate that high-energy neutrons are about 10–20 times more effective in producing H
2, O
2, and H
2O
2 than are gamma photons at an equivalent dose rate.
A detailed view of the impact of dose rate of γ-irradiation (a) and fast neutron irradiation (b) on the yields of H
2, O
2, and H
2O
2 is afforded by the predictions of Kritsky et al. [
27] is plotted in
Figure 21. Again, the factor of 10–20 difference in the yields is apparent between gamma (a) and neutron (b) irradiation, but the most surprising prediction is the presence of maxima in the yield of O
2 and to a lesser extent in the yields of H
2 and H
2O
2 under neutron irradiation at a dose of 10
3 to 10
4 Gy. Additionally, the study authors postulate a species “H
2O
3” (i.e., trioxidane) in the case of γ-irradiation (a), which they posit forms via the reaction OH + HO
2 = H
2O
3. While this species is known to exist, particularly in biological systems, the current review found no evidence for its existence in irradiated water. If the maxima in the yields is not a computational artifact, the result may indicate a preference for the recombination of O
2 and H
2O
2 with hydrogen at high dose rate over and above their generation, which dominates at low dose. A similar phenomenon is observed in BWRs, for example, but is normally couched in terms of dose, and results from a spatial distribution of radiolysis associated with different in-vessel regions. Thus, in BWRs, recombination of O
2 and H
2O
2 is postulated to occur in the downcomer on the outside of the core shroud. In that case, the destruction of H
2, O
2, and H
2O
2 is “catalyzed” by the lower level of radiation in the downcomer, which is nevertheless sufficiently intense to catalyze the reactions via a free-radical mechanism.
Table 15 presents the calculated results of Kritsky et al. [
27] with respect to the impact of added hydrogen on the concentrations of H
2, O
2, and H
2O
2 for γ-radiation at a fixed dose rate of 1 Gy/s.
While the hydrogen concentration naturally increases, because hydrogen is being added to the system, the concentration of oxygen is predicted to be suppressed by almost twelve orders of magnitude. The impact on the hydrogen peroxide concentration is predicted to be much less (about four orders in magnitude), but, nevertheless, the large impact on [O
2] has justified the claim that the addition of hydrogen “suppresses radiolysis. This relationship between radiolysis and added hydrogen was well defined in previous work on modeling radiolysis in BWRs and PWRs [216 and references therein], but this conclusion must be accepted with a word of caution. This is because the benefits of added hydrogen are not so much through the suppression of the concentrations of O
2 and H
2O
2 per se, but its impact on the ECP. Thus, H
2O
2 is a much more powerful oxidizing agent than is O
2; that is, it possesses a much more positive standard reduction potential of 1.77 V
she vs. 1.23 V
she, respectively, and hence has a much greater impact on the ECP than does the addition of oxygen for equivalent molar concentrations. Furthermore, experiments have shown that the addition of small amounts of oxidizing agents to hydrogenated water can result in a significant shift of the ECP in the positive direction [
253]. Clearly, the most important species in affecting this shift is H
2O
2, and the extent to which any species contributes to the shift in the ECP is roughly proportional to the concentration, as determined by the contribution of the partial current density the reduction or oxidation of that species to the total partial current flowing at the interface under open circuit conditions. As seen in
Table 14, the concentration of oxygen under hydrogenation conditions is almost twelve orders of magnitude lower than that of H
2O
2, so that oxygen has no impact on the ECP, but hydrogen peroxide does have a significant impact because its concentration is predicted to be lowered by less than four orders in magnitude. Finally, it is important to recognize that the ECP is a mixed potential established by the balance of charge transfer (i.e., redox) reactions involving oxidizing and reducing species at the metal surface, including the passive electro-dissolution of the metal itself. Theory shows [
217] that the ECP will lie closest to the equilibrium potential of the redox couple that has the highest exchange current density. Because the exchange current density (
) shows a positive relationship with the concentrations of R and O for the redox reaction R = O + ne
− of the type
where
is the standard exchange current density, which is independent of the composition of the solution,
and
are the concentrations of the redox species
O and
R in the bulk environment, respectively, and
is the transfer coefficient of the reaction (a constant). Thus, if one species (e.g., H
2) is present in great excess, regardless of whether radiolysis has been “suppressed,” the ECP will lie closest to the equilibrium potential for the HER. Thus, even though the “suppression of radiolysis” may occur, it is not a necessary condition for the displacement of the ECP in the negative condition; all that is required is that the concentration of hydrogen in the coolant be much greater than the concentrations of any oxidizing species. This condition is always fulfilled in PWR coolant chemistry conditions but is not fulfilled in BWRs operating on NWC (i.e., no added hydrogen) or even on hydrogen water chemistry (HWC, 0.5–1 ppm added to the feedwater). This important fact is seldom recognized in reactor technology.
ITER is a mixed irradiation system, where both fast (14.1 MeV) neutron and γ-photon irradiation impact the chemistry and electrochemistry of the coolant water. Kritsky et al. [
27] explored this issue, and their results are presented in
Figure 22, which compares the predicted radiolysis product concentrations for NWC (i.e., zero added hydrogen) and HWC (i.e, [H
2] = 10
−3 M) as a function of irradiation mix. These calculations demonstrate the higher yields of radiolysis products under fast neutron irradiation compared with γ-photon irradiation, this being by the higher LET of the former than of the latter. However, the calculations suggest a synergistic effect of mixed irradiation on the ability of hydrogen to suppress radiolysis. The authors have not been able to locate any experimental data that confirm this interesting prediction.
Dose rate is found and predicted to have a significant impact on the yield of radiolysis products, as shown by the data in
Figure 23. It is seen that the steady state [H
2O
2] + [O
2] and [H
2O
2] increase linearly with the square root of the dose rate; a result that is also predicted by various radiolysis models. Note that this result strictly applies for γ-radiolysis (
60Co) of water having an initial oxygen concentration of 0.5 × 10
−6 M. Under these conditions, the concentration of oxygen is slightly greater than that of hydrogen peroxide.
The pH of the solution is also predicted in [
27] to have a significant effect on radiolysis product yield, as shown in
Figure 24. Of particular interest is the maximum in the concentrations of radiolysis products at pH = 11. However, note that the experimental data are only in general agreement with prediction, but that is possibly due to the paucity of experiment. In our opinion, the study performed by Kritsky et al. [
27]) is a very important milestone in the study of the radiolysis of the coolant in ITER and is possibly the most comprehensive such study published to date. The work of Kritsky et al. [
27] provides a solid basis for even more comprehensive analyses of this issue.
The next model to be analyzed is that of Christensen et al. [
28], which was used for modeling water radiolysis in the INCA (In-Core Autoclave test) loop at the Studsvik R-2 reactor in Sweden under conditions that simulated the ITER PHTS. The reaction model employed is like that given in
Table 5 for the radiolysis of pure water, except that the model presented in [
28] includes iron species and an organic entity (i.e., fulvic acid). Clearly, the same issues identified with the model in
Table 4 exist with the model in [
28]. The radiolytic yields employed by Christensen et al. [
28] are presented in
Table 16 and
Table 17.
Although the G-values are reasonably consistent from one source to another, in the authors’ opinion, the agreement is somewhat illusory because G-values all appear to come from four sources: Burns and Moore [
44,
45,
264,
265,
275]; Buxton [
36,
43,
63,
67,
80,
125,
132,
137,
148,
177,
178,
197]; Ershov [
72], Katsumara, et al. [
83], and Elliot [
47,
48,
52,
53,
55,
60,
62,
63,
64,
80,
81,
82,
89,
108,
126,
128,
132,
135,
136,
137,
159], with minor variations for (in the authors’ opinion) untraceable reasons. This same level of skepticism concerning the radiolytic yields has been expressed in [
66,
78,
113,
114,
151]. Again, the G-values do not appear to correspond solely to the desired “primary” (i.e., sub-nanosecond) values but include values for H
2O
2 and HO
2, for example, that appear to largely form via reactions outside the spur over a much longer time scale, although some formation of these species may occur within the spur. Another demonstration of the suppression of water radiolysis is found in [
28], as shown in
Figure 25, for systems with and without added hydrogen. Thus, the addition of 5 cm
3(STP)/kg H
2O (0.45 ppm) of hydrogen to the core inlet water of Studsvik’s INCA loop simulating conditions that are expected to exist in the IBED PHTS of ITER leads to the reduction of [O
2] and [H
2O
2] by more than two orders in magnitude. This “suppression of radiolysis” is further illustrated in
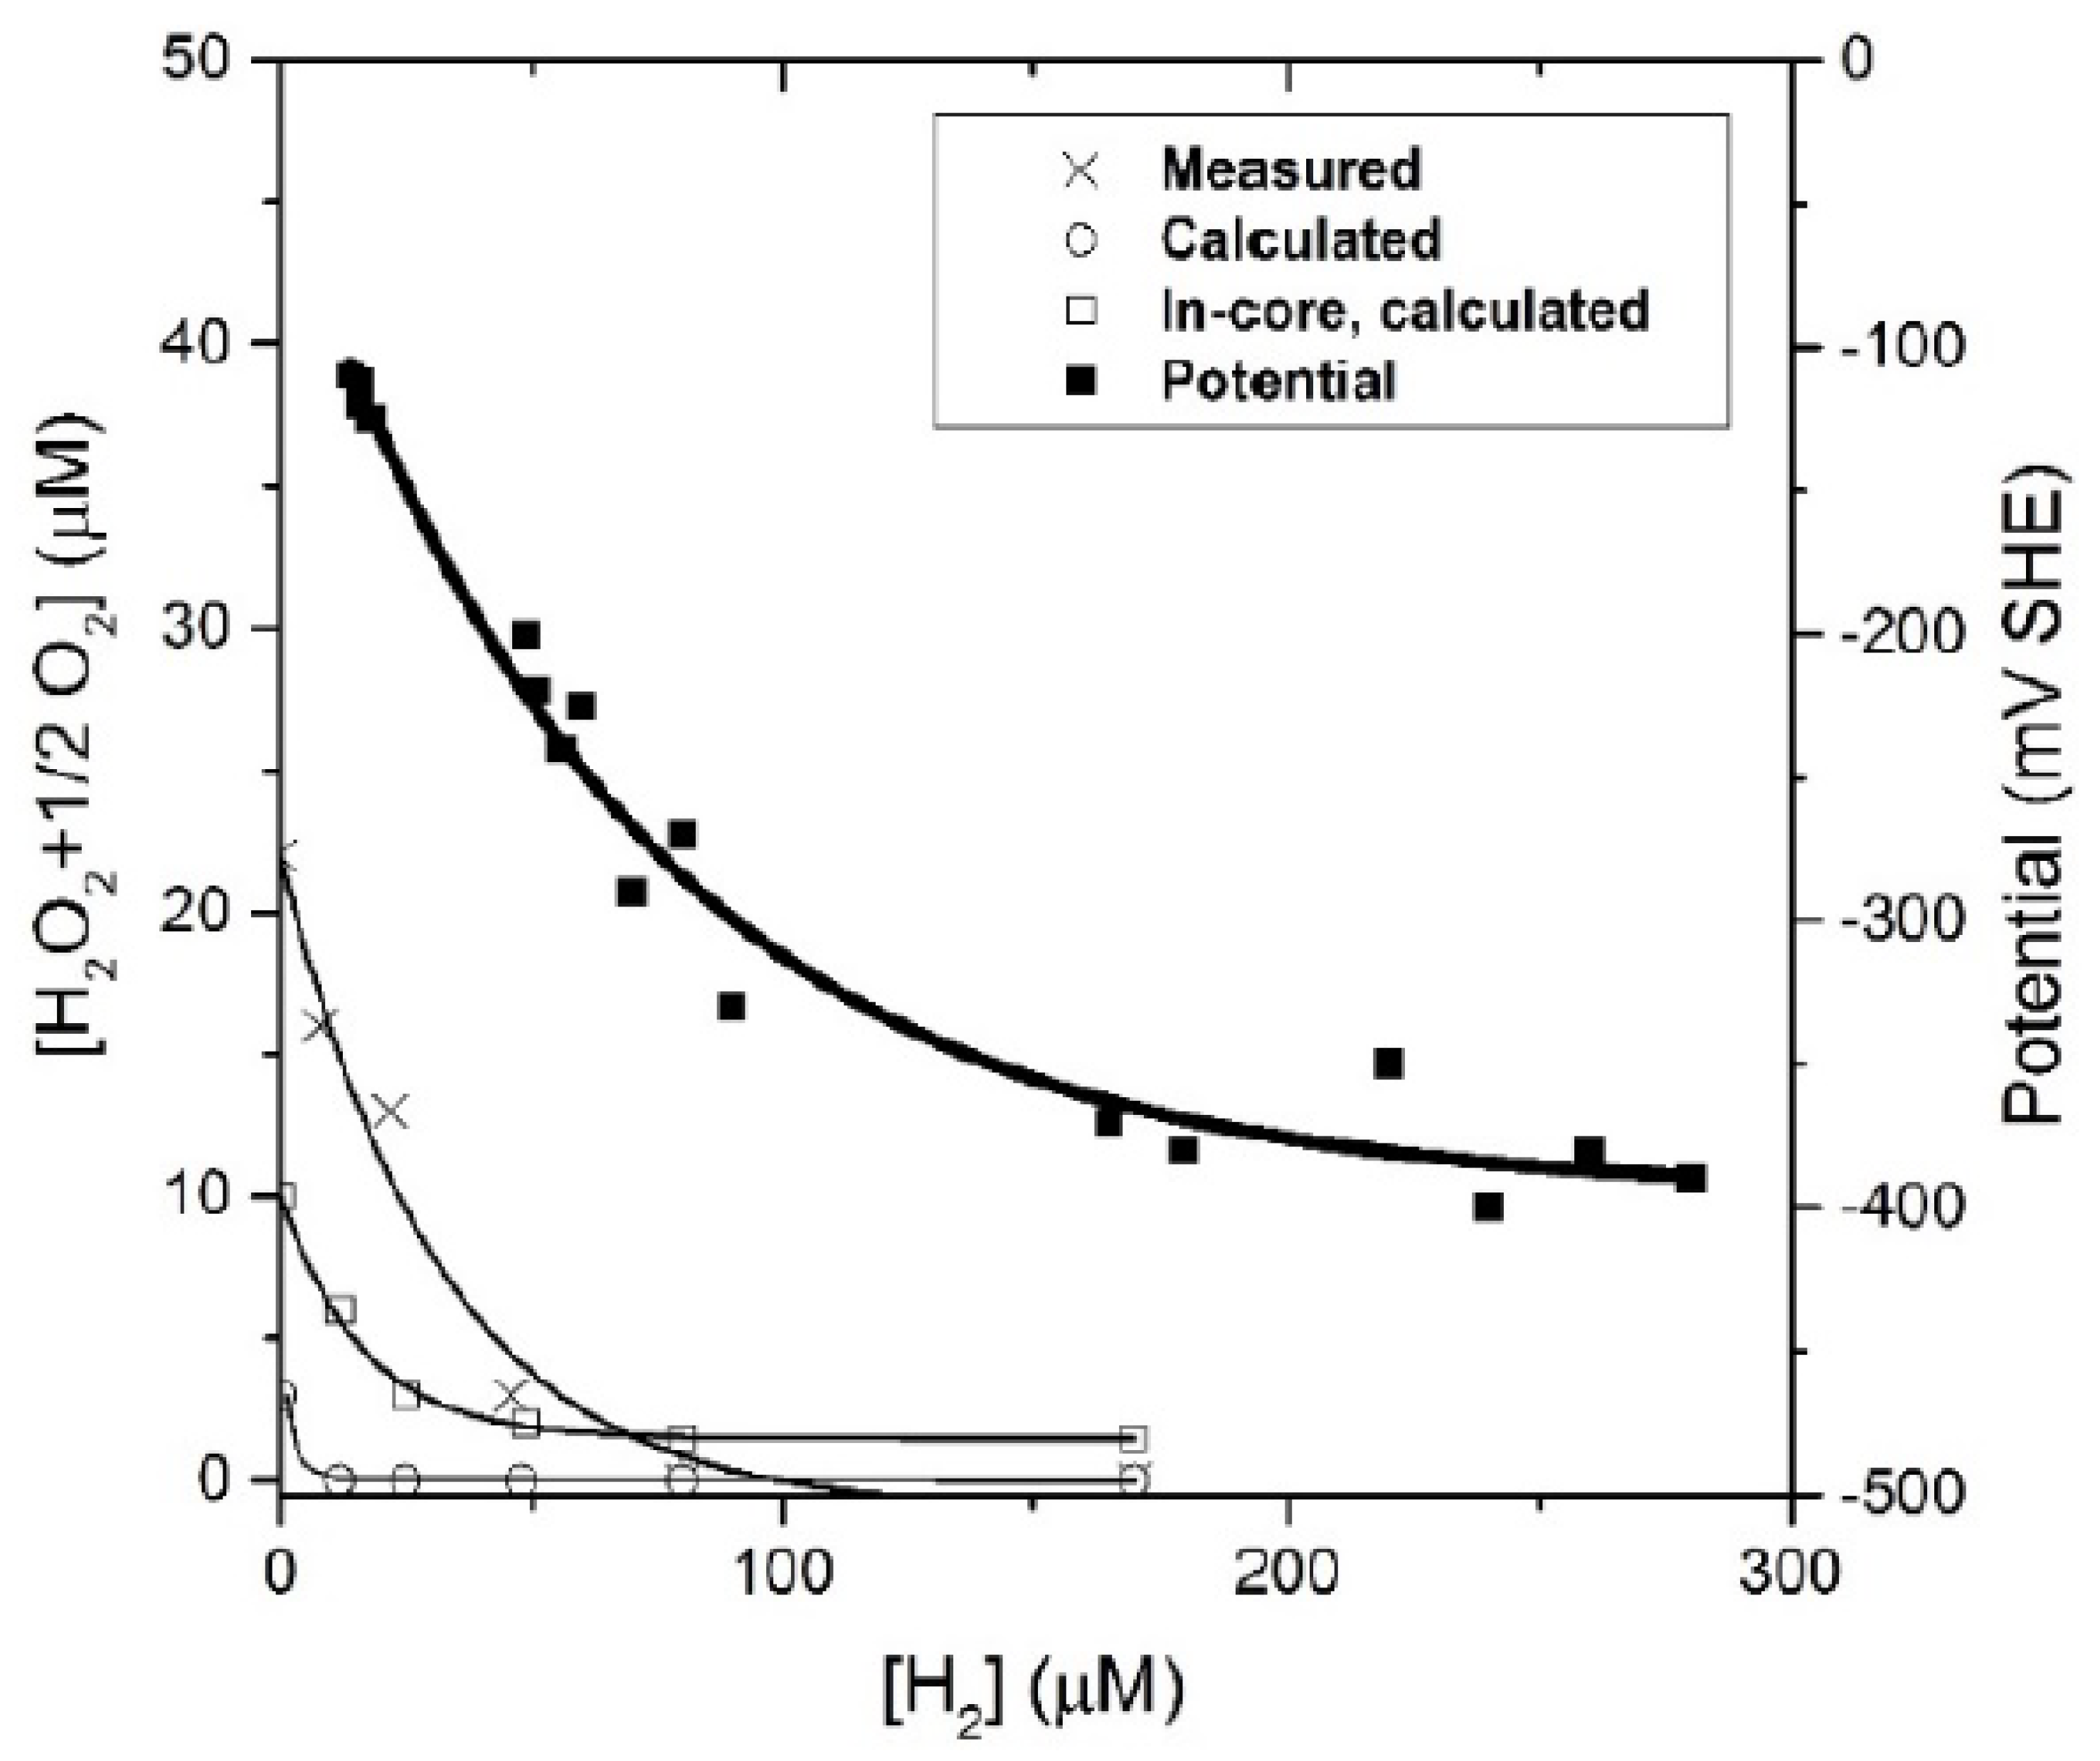
Figure 26 and
Figure 27, where the equivalent oxidizer concentration, [H
2O
2 + ½O
2], and the ECP are presented as a function of added hydrogen at temperatures of 50 °C and 150 °C, respectively. At both temperatures, suppression of radiolysis was achieved by the addition of about 1 × 10
−4 M (200 ppb) of hydrogen to the reactor inlet water; this result is in reasonable concert with the findings for BWRs (c.f.,
Figure 17 and
Figure 18), recognizing that the amount of hydrogen required to suppress radiolysis appears to decrease with increasing temperature.
Amongst the most comprehensive radiolysis modeling of ITER is that reported by Elliot and McCracken at the Chalk River Laboratory of Atomic Energy of Canada Ltd. [
52,
53]. Their work emphasizes modeling of the aqueous LiOH, tritium breeding blanket, rather than the PHTS, but the modeling process is the same, and for that reason the work is included here.
An important issue discussed in [
48,
53] is the dependence of the radiolytic yields (G-values) on LET (
Figure 28), as was also emphasized in [
27,
168,
188,
198,
200,
203]. Generally speaking, those primary radiolysis products that form via the fragmentation of water in the ionization track (
H, and OH) decrease with increasing LET (
Figure 28), whereas those products that form via reactions within the track (H
2, H
2O
2, and HO
2) increase with LET; relationships that have been previously noted in [
1]. These trends probably reflect the increasing importance of in situ reactions with increasing LET within the track between the products produced via the fragmentation of water. The fast neutrons produced by the plasma (14.1 MeV), compared with the thermalized neutrons produced in a water cooled/moderated fission reactor, result in a high LET, and the values adopted by Elliot and McCracken [
48,
53] are those that are given in
Figure 28 [
53].
The reaction model proposed in [
48,
53] is considerably more complex that those proposed by others, comprising some 84 reactions, and including irradiation induced by alpha particles and tritons, in addition to that caused by
γ-photons and neutrons. The alpha particles and tritons are produced by the fission of
6Li
3,
6Li
3 +
1n
0 →
3H
1 +
4He
2, as discussed above, which is used to breed tritium. Acid/base dissociation reactions and some ionization reactions (e.g., H ↔ H
+ +
) are included in the model. Nevertheless, the model also includes reactions between species of like charge, which are of doubtful validity for the reasons discussed previously in this review. Again, as with all radiolysis models, the model proposed in [
48,
53] appears to be massively underdetermined (i.e., there are many more unknown parameters than there are observations), although it is difficult to be unequivocal on that point because their publications [
48,
53] possibly do not include the calibrating data for all reactions. This point needs to be carefully assessed in any future study of water radiolysis. Finally, as noted above, the model proposed in [
48,
53] was used to simulate the chemistry of the aqueous LiOH tritium-breeding blanket, not the PHTS, which will not contain lithium (unless a PWR primary water chemistry is adopted). As such, the ion recoil products
4He
2 and
3T
1 are included, and, assuming their absence, the radiolysis that they cause can be ignored in development of the ITER PHTS radiolysis model. The complexity of the model, as reflected by the number of reactions contained therein, is an important computational issue because the execution time scales roughly with the square of the number of reactions. This becomes a particularly important problem when it is necessary to model the radiolysis of water at closely spaced locations around the entire coolant circuit, as is done for BWRs and PWRs [
221]. In those studies, it was necessary to perform several thousand executions of the code to effectively model the radiolysis, ECP, and crack growth behavior of the system while maintaining the total execution time to 30 min or less. This should also be the goal in development of the ITER PHTS radiolysis model.
In Part II of this review, selected radiolysis data are used to predict the ECP and the CGR of a standard crack (0.5 cm in length loaded to a stress intensity factor KI = 25.0 MPa.m1/2) so as to ascertain the likely impact of coolant chemistry on the susceptibility of RHTS components fabricated from Type 304 SS to IGSCC.
To estimate corrosion damage at any point of the coolant circuit, the concentrations of all species at any point in the loop as a function of time are required. Such information can be obtained by solving the equations of mass balance for all species, if the fluid conditions (e.g., temperature, radiation dose rate, hydrodynamics) are known at every point in the loop. Examples of such calculations can be found in [
1,
35,
216]. For the analysis of the ITER IBED PHTS, the circuit can be subdivided into modules and blocks, and within each block, the known geometrical parameters (i.e., volume, length, diameter) and environmental conditions (i.e., temperature, flow rate, γ-photon and neutron energy deposition rates) are deemed to be constant during the burn and dwell periods. The entire IBED PHTS is represented as a series of combinations of these blocks, by analogy with electric circuits. Each independent series of block combinations is called a “module.” Within each module, the mass flow rate is constant. The IBED PHTS in the Plasma Flux Area (subject to intense gamma and neutron radiation) comprises 12 independent modules, each containing from 1 to 19 blocks. Simulated IBED PHTS components that are Out-of-Flux Area (OPFA, outside of the radiation area) include distribution and connection piping, heat exchangers, pumps, and headers. The scheme of configuration of all modules is available in [
1,
35].
In each block, the following parameters are characterized: cross section area, A (m2); length, L (m); water volume, V (m3); coolant mass flow rate, U (kg/s); average water temperature, Tav (°C); and the gamma and neutron energy deposition rates, Qγ and Qn, respectively (W/cm3). The average hydrodynamic velocity in the block is calculated as v = (U/ρ)/A (m/s), where ρ is density of water, (g/cm3). Residential time for each species in the block is calculated as tL = L/v (s), i.e., this is the time for any species to move through the block (from the input to the output of the block). In calculations for multiple cycles of the coolant in the entire IBED PHTS system, it is assumed that the concentrations of species at the inlet of each block for the current cycle were equal to the concentrations of the species at the end of the Out-of-Plasma-Flux Area (OPFA) for the previous cycle. The transit time in the OPFA is important because it is during this time and in the absence of energy deposition from the intense gamma and neutron radiation that the radiolytic species recombine, resulting in a decrease in their concentrations.
The system of mass transfer equations for each block was solved by using the following approximations.
The one-dimensional approximation can be applied. That is, all quantitates can be represented as a function of a single spatial coordinate—the distance down the block (tube), x. This means that all quantities to be averaged either differ insignificantly from the average value or undergo a substantial change within a narrow region next to the tube surface. For the present conditions, the impact of the boundary region on the average concentration in the bulk coolant is found to be negligible because of the overwhelming (homogeneous reaction) radiolytic source of radiolysis products.
Along the direction, x, all species are transported by convection only. Therefore, diffusion and migration are neglected in comparison with the relatively large convective transfer. This condition is valid for the high flow rates that are envisioned for the IBED PHTS.
The geometry of each tube does not depend on the coordinate, x, (i.e., the area, A, and the wetted perimeter, P, are constants within a block). It is assumed that the density of the liquid (i.e., water) does not change substantially in the tube; therefore, U(t) is only a function of time and not of position.
The influence of the heterogeneous reactions (i.e., chemical, and electrochemical) is not taken into consideration, i.e., only changes of species concentrations due to the radiation and homogeneous chemical reaction are considered.
It can be shown [
1,
35] that after all of the above simplifications are adopted, the system of transport equations can be reduced to the set of the first order ordinary equations:
with the boundary conditions:
describing the concentrations of all species,
Ck, as a function of the retention time inside any particular block. Here,
Ck0 is the concentration of species k (mol/L) at the block inlet (which correspond retention time
t = 0),
N is the total number of species in the solution. Note that, for
t >
tL, the concentrations do not depend on the initial values (all liquid that was initially in the block for
t >
tL is now out of the block). Because
tL <<
tc, it is not necessary to take into account the initial conditions (see second paragraph below). The first two terms in the right side correspond to the primary dose irradiation, where
Qγ and
Qn are the energy deposition rates by
γ-photon and neutron radiation (W/cm
3), respectively;
Gγk and G
nk are the corresponding gamma and neutron primary G-values for the species
k (no./100 eV), respectively; and
δ is the conversion factor. The second two terms in the right side correspond to the homogeneous chemical reactions that are described by the set of
M chemical reactions with the stoichiometry:
where
μmk and
νmk are the stoichiometric coefficients of the compound (or element)
k in module
m, and
km is the reaction rate constant. Note that Equation (9) does not include a term for the transfer of a volatile species (e.g., H
2) to a gas phase, as is the case for a BWR [
216], because no boiling of the coolant occurs in the ITER.
Equation (9) with initial conditions (10) describes mass transfer inside the block only in the region x < (or in the region x < Vt for V = const). However, assuming that during any operational cycle of duration tc the velocity through each block does not change and that tc is much greater than the residence time, t, the conclusion is made that the equations presented above can be used to describe mass transfer at any point in the block at any moment of time.
It is assumed that 11 species listed in
Table 9 are generated as a result of water radiolysis, although not all of the species may be formed within the spurs at a time period of less than 0.01 ns. The presence of these metal ions—Cu
+, Cu
2+, Fe
2+, Fe
3+—in the solution [
27,
28] is also considered; these ions may act as homogeneous catalysts for some of the reactions in the radiolysis model presented in [
1,
35]. In addition, it is assumed that, because of the influence of radiation on
N2 molecules and due to the generation of nitrogen species via the nuclear reactions
16O
8(
1n
0,
1p
1)
16N
7 and
17O
8(
1n
0,
1p
1)
17N
7 with the oxygen isotopes in water, the following species are present in the solution [
271]:
The G-values were obtained by the procedure described in the paragraph below Equation (8). The values shown in
Table 18 and
Table 19 are used in the IBED PHTS radiolysis model.
The G-values for temperatures in-between tabulated values were calculated by Lagrange interpolation. Comparison shows that there is good agreement between the improved and original G-values (the discrepancy is within 1.5%). However, the improved G-values exactly satisfy the laws of mass and charge conservation.
For water radiolysis, the rate constants proposed in [
21] are used. For reactions involving metal ions, the data from [
27] (Cu ions) and [
28] (Fe ions) are employed. For reactions containing nitrogen atoms and atomic oxygen, O, the data (including G-values) proposed in [
271] are employed (if N
2 is decomposed under radiation to generate nitrogen atoms). The dependence of the rates of the reactions on temperature is described by the usual Arrhenius relation, but in some cases this dependence is obtained by interpolation of the experimental data. The complete list of the rates of all 89 reactions included into the consideration at temperature range between 25 °C and 250 °C is provided in [
1]. The values of the rate constants for temperatures in-between the tabulated values are calculated by Lagrange interpolation.
A modularization of the IBED PHTS of the ITER for radiolysis assessment is presented in
Figure 29. Each module inside the Plasma Flux Area (PFA) is yellow-colored and contains the indicated number of blocks in series. The number of modules and associated blocks in the IBED PHTS is provided in
Table 20. Each module with its component blocks in the PFA is located inside the Vacuum Vessel and absorbs heat from the plasma via the flowing coolant.
As seen, the system comprises three principal areas: the PFA is subjected to intense neutron and γ-photon irradiation during the plasma burn period (550 s, including ramp-up and ramp-down,
Figure 9) and Out-of-Plasma Flux Area (OPFA) which is subdivided into Hot OPFA with temperature 126 °C (upstream of heat exchangers) and Cold OFPA with temperature 70 °C (downstream of the heat exchangers). The OPFA is not subjected to irradiation. For the analysis, the IBED PHTS can be subdivided into modules and blocks and is represented as a series of combinations of these blocks. Each independent series of block combinations is called a “module.” The IBED PHTS in the PFA consists of 12 independent modules, each containing from 1 to 19 blocks. For example, the Divertor Cassettes comprises one module that contains nineteen blocks [
1,
35]. Simulated IBED PHTS components that are OFPA include distribution and connection piping, heat exchangers, pumps, and headers. These are represented by 28 modules.
Table 20 lists the modules associated with the PFA and the OPFA, with number of blocks in each module.
As is common practice, this system can be schematically represented as comprising two parts, PFA (red) and OPFA (yellow), as shown in
Figure 30 [
1,
35].
The module chosen to model represents 15 Equatorial Ports, which experience the highest energy deposition rates (
Qn and
Qγ of 3.2 and 4.3 W/cm
3, respectively). The actual data employed in the model are summarized in
Table 21, which also contains specified limits on the concentrations of metal ions, oxygen, and added hydrogen. The temperature of 98 °C is the average of the temperatures at the module inlet (70 °C) and the module outlet (126 °C).
The chosen module may be compared with some other modules in the cooling system; an example is summarized in
Table 22. Thus, the chosen model is predicted to have the highest radiation energy deposition rates (3.2 and 4.3 W/cm
3 for neutrons and γ-photons, respectively, for a total energy deposition rate of 7.5 W/cm
3) and hence are expected to display the greatest impact of radiolysis on the chemistry and electrochemistry of the coolant. As shown in
Table 22, these other modules also differ significantly in terms of residence time, mass flow rate, and volume, even though the temperatures are predicted to be the same, because they draw on the same source of coolant which flows through regions of similar heat flux. By way of comparison, a typical BWR has an in-core energy deposition rate of 50–60 W/cm
3 suggesting that the radiolytic environment in the ITER will be somewhat muted compared with that in a fission BWR.
By performing radiolysis assessment of the entire IBED PHTS, the emphasis is on the accumulation of hydrogen, oxygen, and hydrogen peroxide because these species dominate the ECP and hence the corrosion behavior and the crack growth rate in a structural material. As noted above, for assessing the behavior of the radiolysis species in the entire IBED PHTS module, this system can be schematically represented by the simplified model shown in
Figure 30 [
1,
35].
Figure 31,
Figure 32 and
Figure 33 illustrate results of the model calculations in a typical Equatorial Port module with a high energy deposition rate as a function of the concentration of added hydrogen. The values of the concentrations of species at the module inlet, temperature, energy deposition rates inside the module, and retention time, are given in
Table 20.
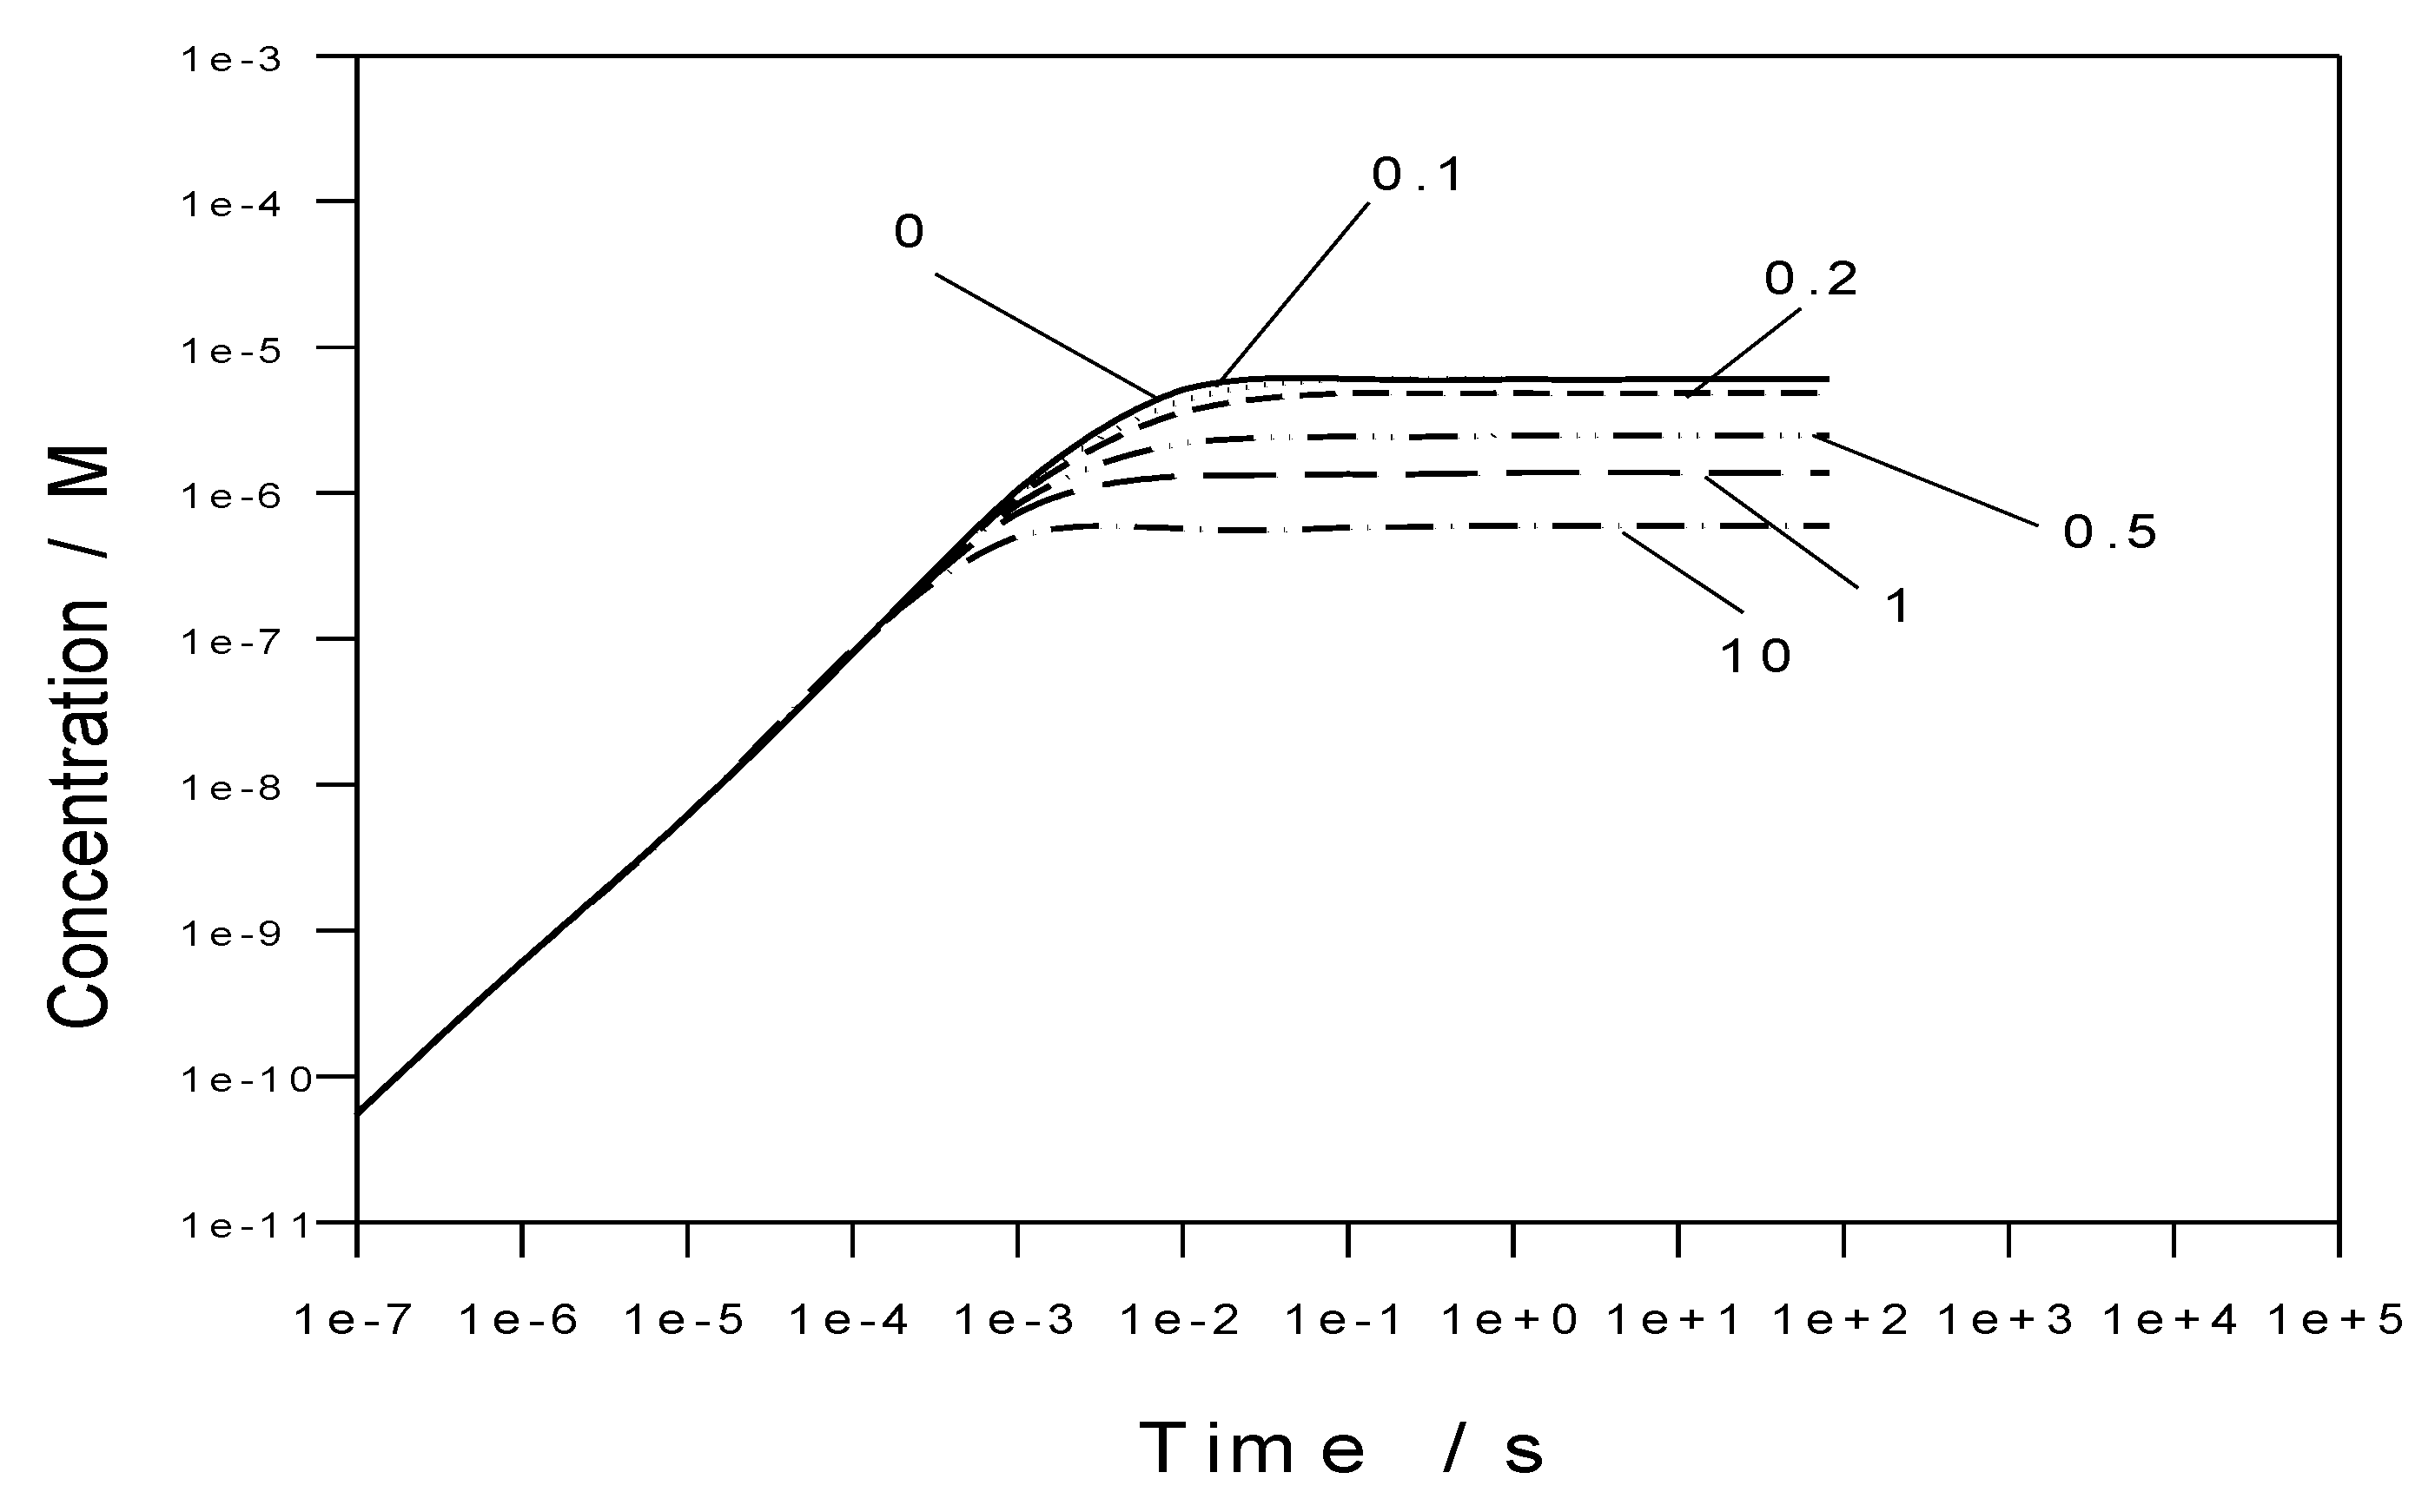
Figure 31 shows that the system rapidly reaches a steady state after the initiation of irradiation as the coolant enters the PFA. In fact, all the concentrations of all radiolysis products are predicted to be constant after irradiation for 10 ms with that of HO
2 showing some small change up to 100 ms (
Figure 31). This time is short compared with the residence time (tens of seconds) and hence the concentrations can be assumed to be constant throughout the PFA and the OPFA. Therefore, because the wall material, temperature, and hydrodynamic velocity inside the module remain unchanged during virtually entire retention time, we assume that the ECP does not change within each area of the module; i.e., the corrosion conditions inside each area of the module can be characterized by the single ECP value.
Figure 32 shows that addition of [H
2] = 1 cc (STP)/kg H
2O (0.09 ppm) reduces the concentration of oxygen to a level that is significantly lower than the target value (10 ppb = 3.3 × 10
−7 m). However, the concentration of oxygen increases above the target value if the concentration of hydrogen decreases to below 0.2 cc (STP)/kg H
2O (18 ppb). At the same time, the concentration of hydrogen peroxide increases to a level that is substantial from a corrosion viewpoint, although the steady-state value is predicted to decrease with increasing hydrogen (see
Figure 33). To our knowledge, no specification has been placed on the concentration of H
2O
2, which we find surprising because hydrogen peroxide is a much stronger oxidizing agent than is oxygen on a per-mole basis, as reflected in their standard reduction potentials of 1.77 V
she and 1.23 V
she, respectively. Accordingly, H
2O
2 is much more aggressive towards general and localized corrosion phenomena than is O
2. We argue in Part II [
291] that the prudent approach to managing water chemistry in the mitigation of corrosion would be to place a limit on the electrochemical corrosion potential (ECP), as has been done in the operation of BWRs.
The concentration of molecular nitrogen practically does not change (
Figure 31), indicating that bond fissioning of N
2 to form reactive atomic nitrogen is not extensive. In accordance with [
26], the maximum concentrations of nitrogen isotopes derived from the nuclear reactions (
16N
7 and
17N
7) are equal to 4 × 10
−10 M and 3.0 × 10
−14 M, respectively. Therefore, the concentrations of all species containing nitrogen are very low and do not represent a significant source of radiolysis products, although they may pose a radiation hazard, as is the case for BWRs operating on hydrogen water chemistry where the nitrogen isotopes (
16N
7 and
17N
7) exist in the form of volatile NH
3, which is transferred to the steam phase by in-core boiling and then swept into the turbine hall that was not (originally) designed as a radiation area. This required installation of extensive shielding, including the strengthening of structures, to achieve acceptable man REM (Rontgen Equivalent Man) costs.
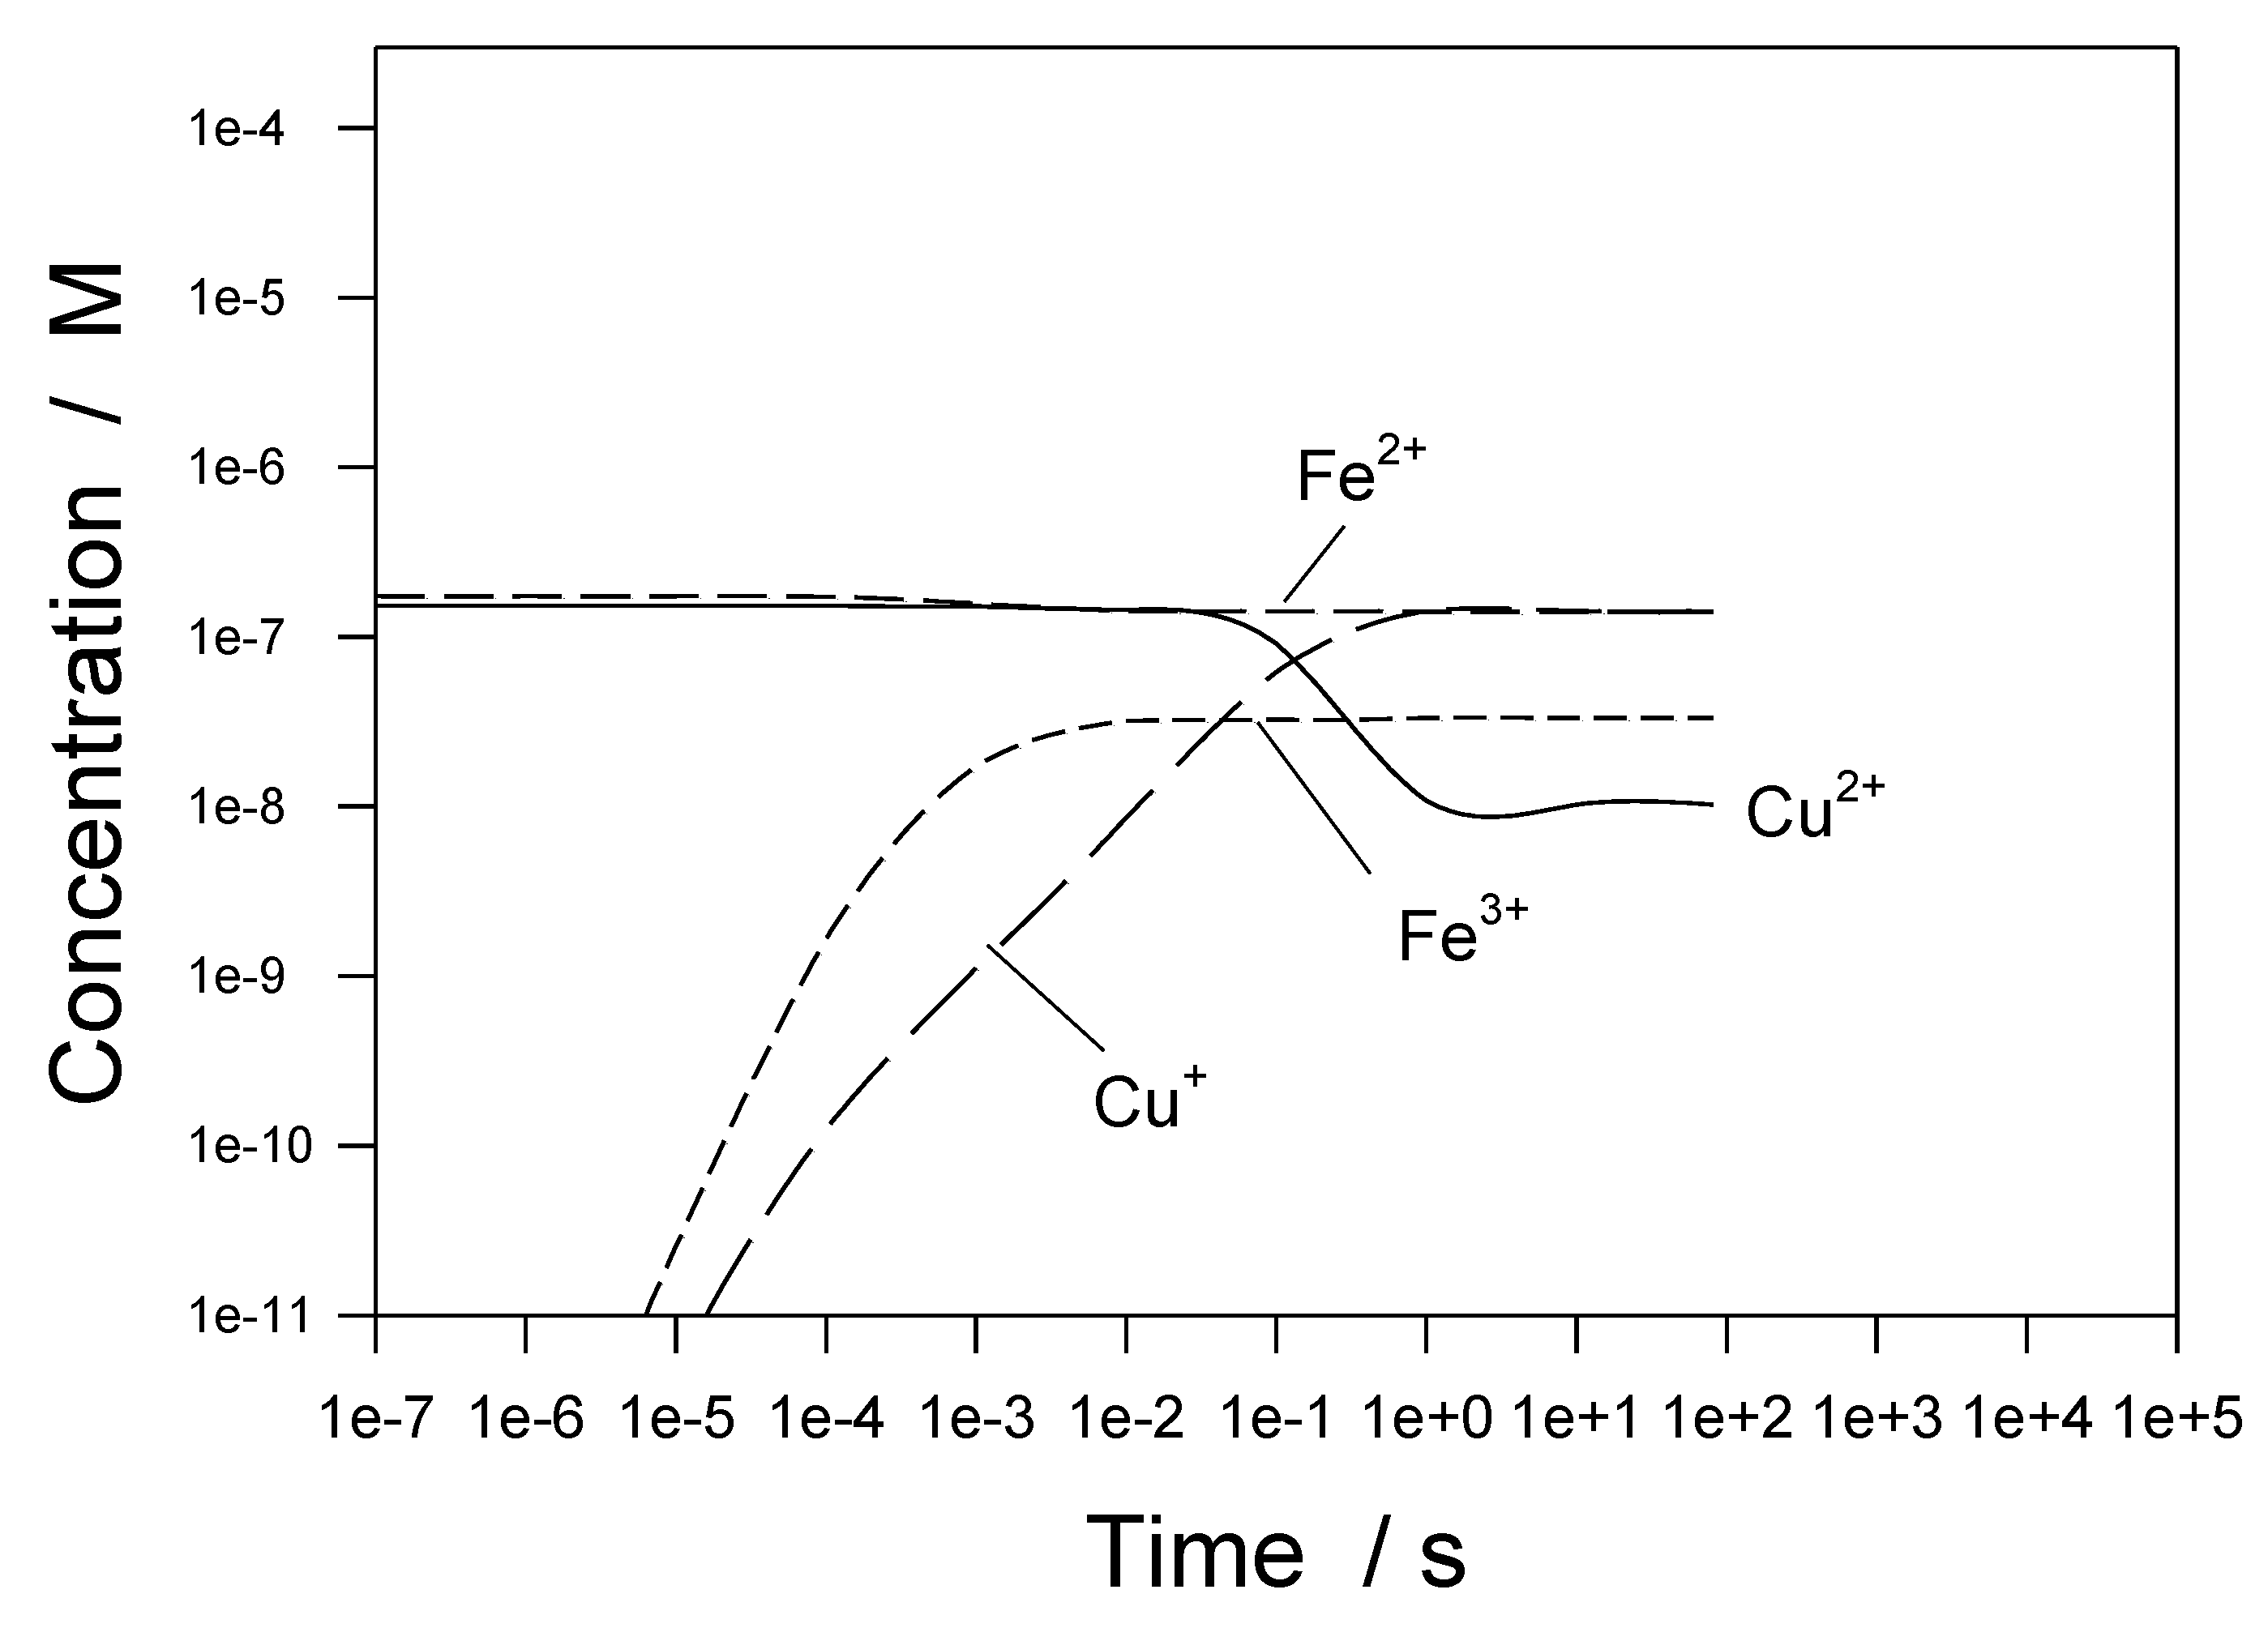
Figure 34 shows predicted concentrations of metal-containing species as a function of time, assuming initial conditions are [Cu
2+] = 10 ppb, [Fe
2+] = 10 ppb, and [Cu
+] = [Fe
3+] = 0 [
1,
35]. Because of the presence of added hydrogen [1 cc(STP)/kg H
2O], the most highly oxidized species (Cu
2+, Fe
3+) tend to be reduced to Cu
+, Fe
2+, respectively, as the system achieves a steady state. The final concentrations reflect the redox potential of the coolant (
EO/R), which is analogous to the ECP, except the metal substrate is inert (and hence is measured using a Pt indicator electrode). The more negative the value of
EO/R, the more reducing is the environment and, hence, the greater is the driving force for the reduction of species to lower oxidation states.
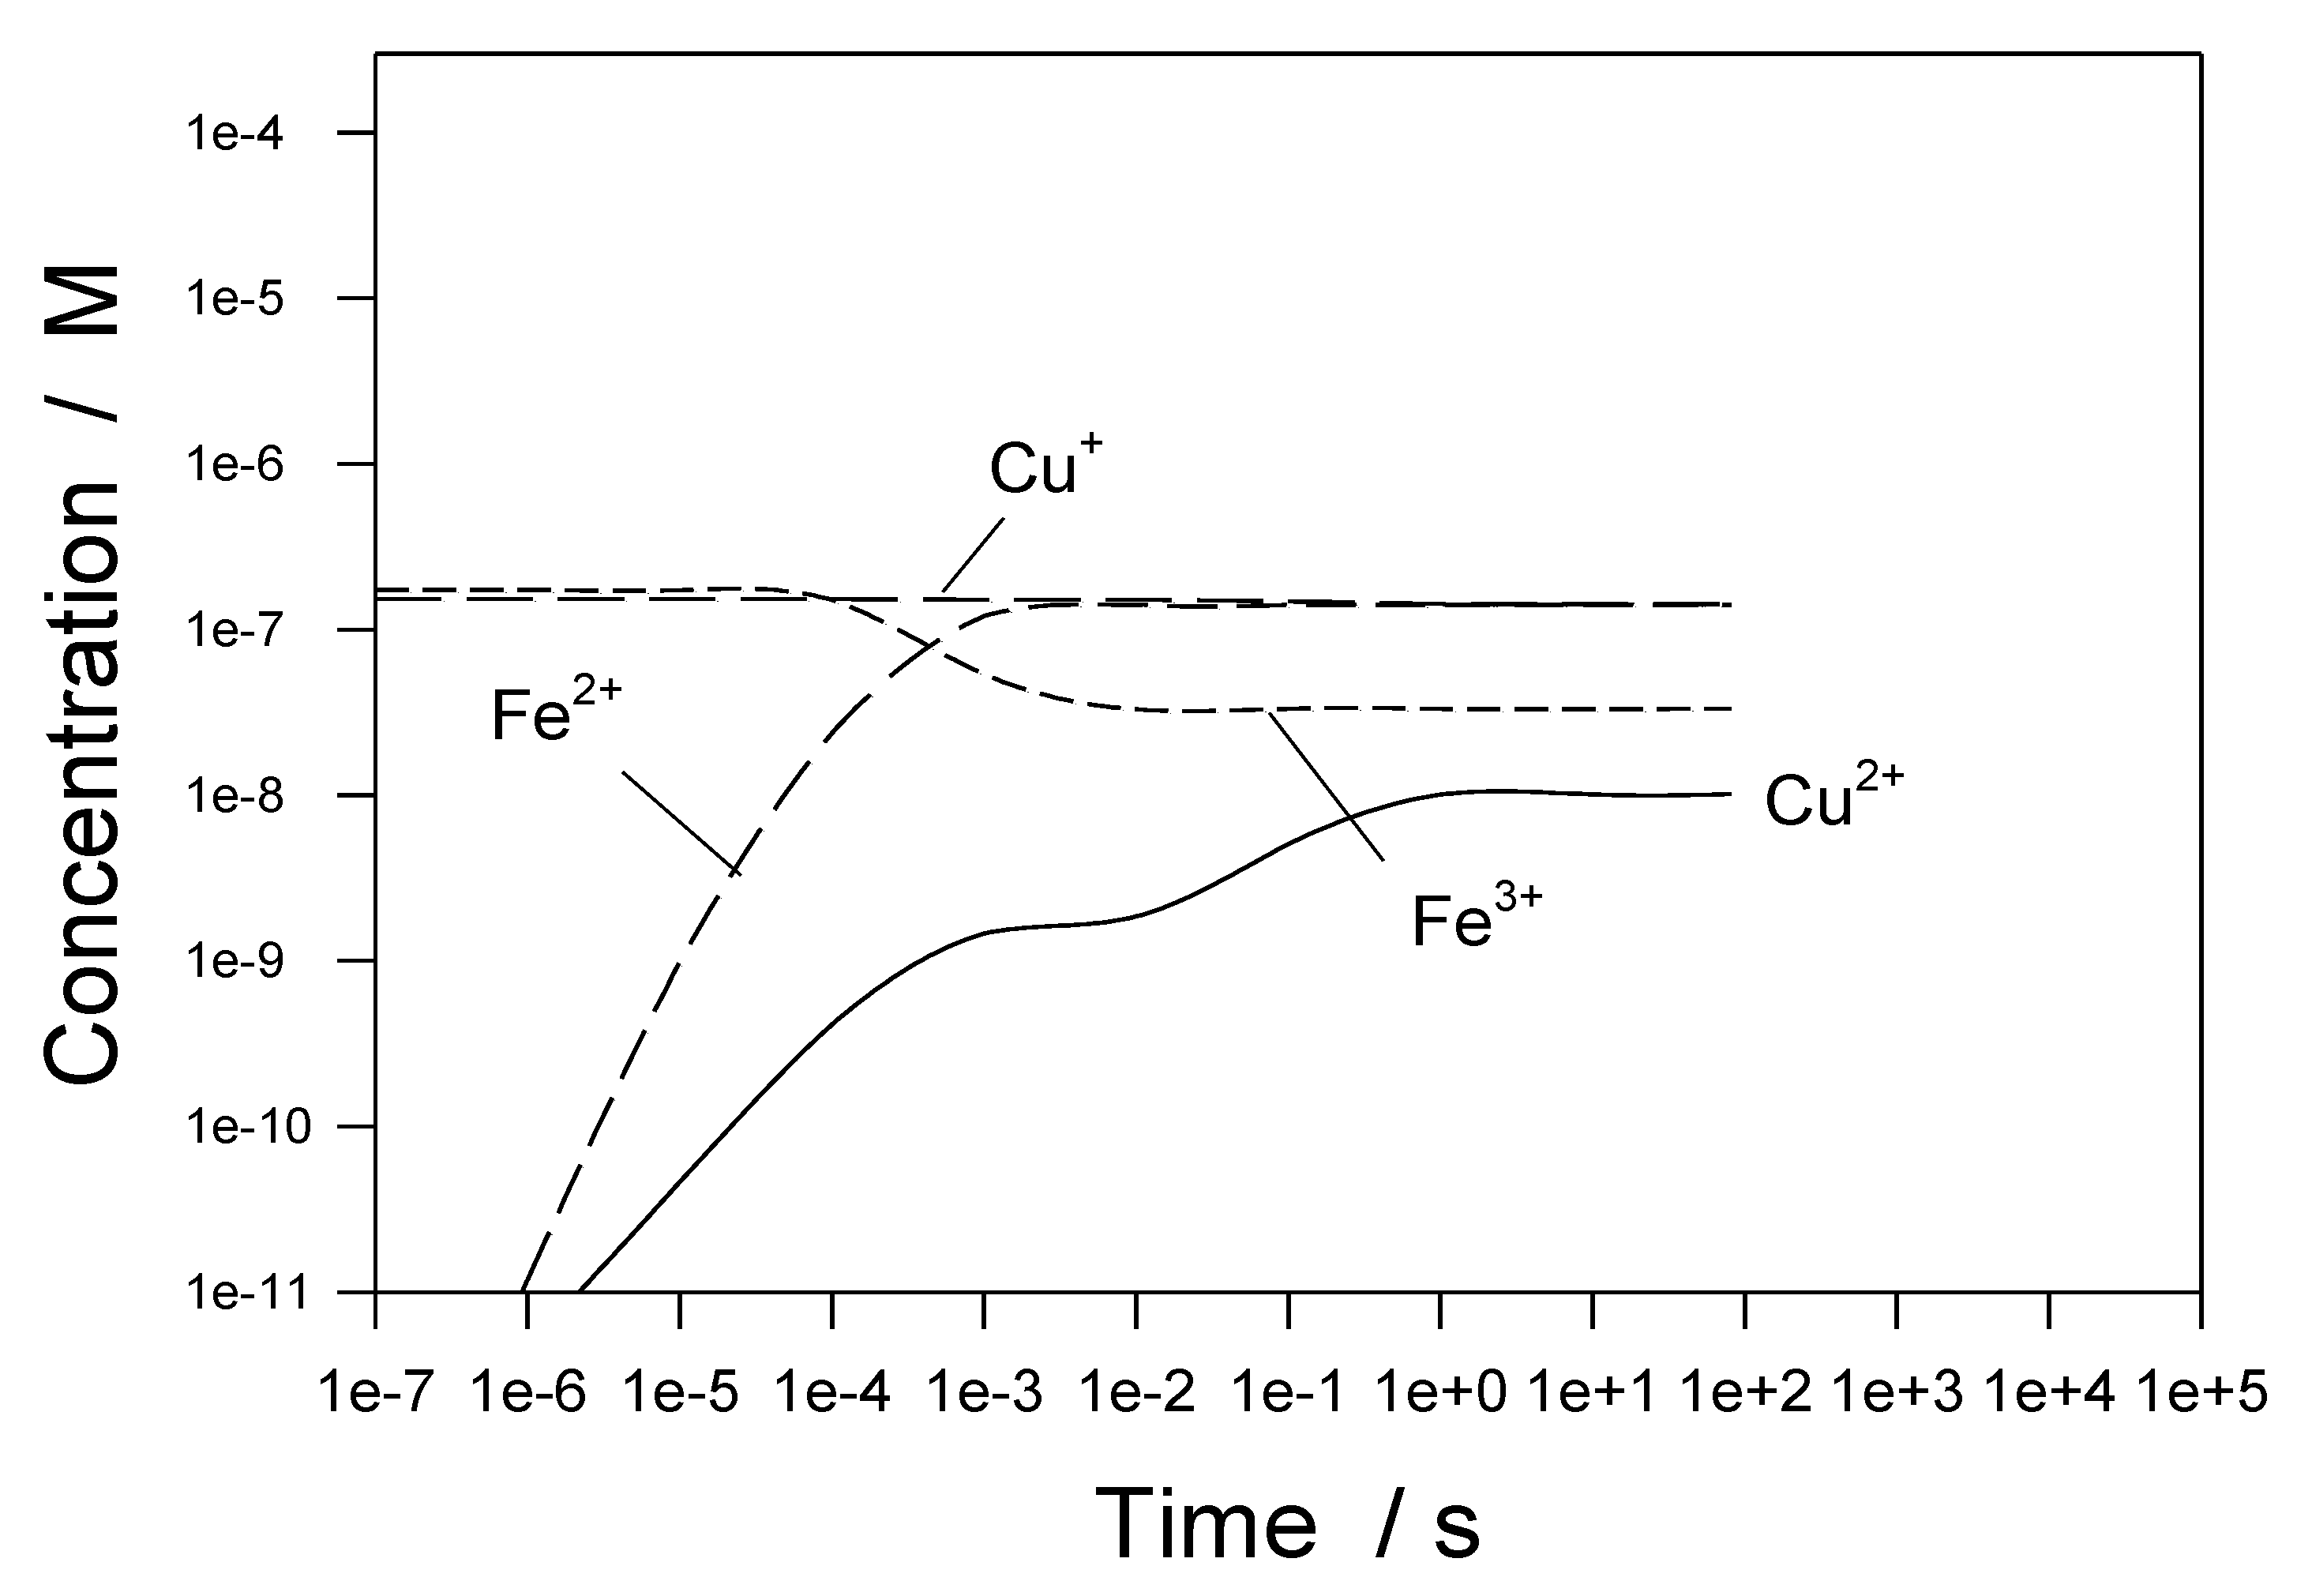
Figure 35 shows concentrations of metal-containing species for initial conditions of [Cu
+] = 10 ppb, [Fe
3+] = 10 ppb, and [Cu
2+] = [Fe
2+] = 0 [
1,
35]. Note that the calculations displayed in
Figure 34 and
Figure 35 differ in the initial concentrations of the metal species. Again, the hydrogen addition results in the reduction of Cu
2+ and Fe
3+ to Cu
+, and Fe
2+, respectively. These findings have important consequences with respect to the corrosion of structural materials in the IBED PHTS. For example, a lower concentration of Cu
2+ reduces the rate of the cathodic reaction Cu
2+ + e
− → Cu
+. An important issue that does not appear to have been explored is whether metallic copper could be plated out on the structural alloy surfaces. If that occurs, the Cu nuclei may act as nucleation sites for passivity breakdown and localized (pitting) corrosion, a phenomenon that is well documented for stainless steels.
As noted above, in performing radiolysis assessment of the entire IBED PHTS, the emphasis is on the accumulation of hydrogen, oxygen, and hydrogen peroxide because these species dominate the ECP and hence the crack growth rate in a structural material. Instead of a detailed description of the mass transfer of species out of the radiation blocks at all downstream positions, the following approximation is used [
1,
35]. The average concentration of each specie,
Ck, at the PFA outlet is estimated as
where
Ck,m is the concentration of the specie
k at the output of the module
m,
M is the number of parallel modules in the PFA, and
Vm = Um/ρm is the volumetric flow velocity at the outlet of the module
m (
ρm is the density of water at the outlet of the module
m). All components outside of the PFA are considered as a single block with an aqueous temperature of 70 °C and a residence time of 50 s during the irradiation (i.e., burn) period, which is part of one revolution of the entire cycle.
If the concentrations of the radiolysis species at the PFA inlet and the conditions within the PFA are known, the concentrations of radiolysis species at the outlet of each module can be calculated, as well as the average concentrations of radiolysis species at the PFA outlet via Equation (12). An example of these calculations with the addition of 1 cc (STP)/kg H
2O of hydrogen is shown in
Figure 36 and
Figure 37 (marked by revolution cycles 0 to 13) [
1,
35]. The concentrations marked by cycles = 0 in
Figure 36 correspond to the initial conditions in the IBED PHTS. After that, the coolant, containing the species at the calculated concentrations, flows to the PFA outlet (marked by Cycle 1 in
Figure 36), then passes through the OPFA, and concentrations of species at the PFA inlet (marked by Cycle 1 in
Figure 36) are used as input data for the PFA to calculate the average concentrations at the Plasma Flux Area outlet for the next cycle (marked by Cycle 2 in
Figure 37). This process, which is repeated thirteen times in our calculations, is representative of events within an envisioned plasma “burn” period in IBED PHTS operation.
As seen in
Figure 36 and
Figure 37, stabilization of the concentrations of the radiolysis species already occurs after the first cycle. This means that there is no accumulation of radiolysis products in the OPFA in the IBED PHTS if a super stoichiometric amount of hydrogen (i.e., greater than that generated by radiolysis) is injected into the coolant water. Furthermore, during plasma the plasma burn period, as the coolant moves through the OPFA, almost complete decomposition of radiolysis products that were generated in the Plasma Flux Area occurs. An exception is hydrogen peroxide, which can have high production rates in some PFA modules and slowly accumulates in the system during plasma cycle. Although currently there is no hydrogen peroxide limit in the IBED PHTS, the corrosion impact of the hydrogen peroxide level should be carefully evaluated by estimating the ECP and crack growth rate for a standard crack in a structural alloy, for example, as is done in Part II [
291]. Briefly, because an operating reactor will have a wide distribution in crack length, reflecting a wide distribution in crack initiation time and distributions in the stress intensity factor (stress), in the ECP, and in crack growth rate, it is necessary to define a “standard crack” to characterize the relative severities of the environment toward IGSCC. For the present purposes, the “standard crack” is defined as one having a crack length of 0.5 cm loaded to a stress intensity factor of 25.0 MPa·m
1/2. The “standard crack” concept is addressed further in Part II of this series [
291].
Because the resulting concentration of oxygen in IBED PHTS during the plasma burn with hydrogen addition is below the target level (10 ppb), there is no pressing need to remove oxygen from the coolant water. However, a degassing function of CVCS via fractional clean-up will be needed during all other modes of operation of the IBED PHTS. Moreover, the CVCS is needed to control concentrations of Cu, Fe, and other impurities in the system.
The concentrations of the three principal radiolysis products (H
2, O
2, and H
2O
2) at the PFA outlet and at the PFA inlet for the next coolant cycle (i.e., after passing for 50 s through the OPFA) are summarized in
Table 23 and
Table 24, respectively. It must be noted that because the relaxation time (the time over which the species concentrations change during formation,
Figure 32, or recombination) in the OPFA (<<1 s) is much less than residential time in this area (50 s), the concentrations at the PFA inlet can be considered as the concentrations inside the main part of OPFA of the previous cycle.
Analysis of
Table 23 and
Table 24 shows that the concentration of oxygen in the model block in Plasma Flux Area (
Table 21) is sensitive to the concentration of input hydrogen with [O
2] decreasing from 144.8 ppb to 6.38 × 10
−4 ppb upon the addition of 10 cc (STP)/kg H
2O (0.9 ppm) of hydrogen to the circuit; a reduction by a factor of 2 × 10
5. On the other hand, [H
2O
2] is predicted to decrease from 212.1 to 21.0 ppb, a factor of 10.1. Thus, hydrogen added to the circuit from an external source (e.g., in the CVCS) is much more effective in suppressing the formation of oxygen in the PFA than it is in suppressing the formation of hydrogen peroxide—a fact that was known from previous fission reactor (BWR) studies [
216] and from previous modeling of the ITER (e.g., [
27,
28]). In the absence of added hydrogen, the [O
2] decays from 144.82 ppb at the model block in PFA outlet to 70.6 ppb at the PFA inlet on the following cycle: a decrease by a factor of 2.05. This occurs via the radiolysis model (e.g.,
Table 5) acting in reverse, due to the loss of the radiolysis source terms (
Qn and
Qγ) in Equation (9): these terms in the OFA are equal to zero. Under the same conditions, the concentration of H
2O
2 decays from 212.1 ppb to 6.44 × 10
−3 ppb; a factor of 3.3 × 10
3. With the addition of 10 cc (STP)/kgH
2O (0.9 ppm), the [O
2] decreases from 6.38 × 10
−4 ppb to 2.14 × 10
−7 ppb, or by a factor of 2.9 × 10
3, while [H
2O
2] decays from 20.1 ppb to 5.91 × 10
−4 ppb, or by a factor of 3.5 × 10
4. Thus, hydrogen has only a modest impact on the decay of H
2O
2 but greatly enhances the decay of O
2 in the OPFA. This is because the primary mode of decay of H
2O
2 in the absence of irradiation is due to Reaction 30,
Table 5, 2H
2O
2 → 2H
2O + O
2. On the other hand, the primary mode of decay of O
2 is the reaction with hydrogen via the reverse of the radiolysis mechanism.
In the OPFA (
Table 23), with the addition of a super stoichiometric concentration of hydrogen ([H
2]
Inlet > 0), the concentrations of O
2 and H
2O
2 are reduced to a very low level but, nevertheless, are considerably greater than the thermodynamic equilibrium values, due to residual amounts that are not completely annihilated by recombination with hydrogen via the reverse of the radiolysis mechanism (O
2) and thermal decomposition (H
2O
2). These residual amounts of these oxidizing agents displace the ECP slightly in the positive direction from the value in their absence, as is discussed in Part II [
291].
Apparently, the focus on “suppression of radiolysis” by monitoring dissolved oxygen is somewhat misplaced from a corrosion viewpoint because H2O2 is the more powerful oxidizing agent, on a molar basis, than is O2, and it is much more potent than is oxygen in raising the ECP and in increasing the driving force for general corrosion and the various forms of localized corrosion (e.g., IGSCC in sensitized austenitic stainless steels).


