1. Introduction
The model for fire temperature rise in high-rise residential buildings is of great significance for the fire protection design, risk assessment, and fire rescue of buildings, offering an important indicator for scientific research on fires in high-rise residential buildings. To date, many scholars have built models for fire temperature rise in buildings, such as the three parametric models for post-flashover temperature rise given by Babrauskas [
1,
2], Mccaffrey et al. [
3], and Law [
4]. Among them, Law’s model is most commonly used. The equations developed for the model based on many international fire tests have shown that the model can fully reflect fire characteristics during flashover. In other words, fire space and opening characteristics determine the combustion state and room temperature during flashover. Magnusson et al. [
5,
6] proposed a set of temperature rise curves to describe fires in enclosures. These curves are related to the room opening factor and fire load and are often called “Swedish curves”. The temperature rise curves of EUROCODE parameters have been given based on an approximate simulation of Swedish curves. Welch et al. [
7] and Lennon and Welch et al. [
8] conducted full-scale fire tests in a factory building 12 m × 12 m × 3.4 m (length × width × height) in size at Cardington with the aid of the British Building Research Establishment (BRE). They found that the temperature decay stage during a fire could not be ignored and revised the scope of application of the temperature rise curves of EUROCODE parameters. Based on analyzing fire test data, the American Society of Civil Engineers proposed an empirical model for room temperature rise [
9], considering relevant parameters based on thermodynamic theories. The model considers fire load, opening factor, and wall material properties to control fires through ventilation.
However, the above models summarize temperature rise curves in specific fire scenarios. They use a deterministic formula to express fire temperature rise in high-rise residential buildings but have ignored many random factors affecting such models, such as the fire load in buildings and the size of ventilation openings. The Design Guide has explored the randomness of fire scenarios as follows: Structure Fire Safety CIB W14 Workshop Report (Code CIB14) [
10], the JCSS Probabilistic Model Code (JCSS) [
11], the EUROCODE [
6], the Japanese Code [
12], and the SFPE Handbook of Fire Protection Engineering (SFPE) [
13]. These are accompanied by research from scholars such as Jin et al. [
14], Xia et al. [
15], Zhang [
16], Wang [
17], Culver [
18], and Melinek [
19]. The probability distributions of factors such as fire load in some buildings have also been given. Wen et al. [
20] proposed the fire temperature rise formula for large timber buildings considering the influence of building area, building height, fire source power, and other factors on fires. Based on the investigation results, Zhang et al. [
21] used fire simulation software (FDS) to calculate the practical heating-up curves of sample bedrooms.
Due to the differences between buildings and the uncertainties with fire occurrence and development, the interior combustibles, wall thermal inertia, and opening factor size of fire-exposed rooms are all random to varying degrees, causing the uncertainty of fire temperature rise in high-rise residential buildings. In that context, this study investigated the random factors of fires in high-rise residential buildings, striving to solve the problem of uncertainties with the model for fire temperature rise in high-rise residential buildings under random factors based on the Latin Hypercube Sampling method.
2. Model for Fire Temperature Rise in High-Rise Residential Buildings
2.1. Key Affecting Factors of Fires
2.1.1. Fire Load Density
Fire load density refers to the total energy released by the combustion of all interior combustibles per unit area. It is an important indicator used to evaluate the fire risk to buildings. It can be calculated from the following formula:
where
q is fire load density (MJ/m
2);
mi is the mass of combustibles (kg);
hi is the calorific value of the material (MJ/kg) that can be measured using the oxygen bomb calorimetric method;
A is room area (m
2).
2.1.2. Opening Factor
Studies have shown that [
22] in a post-flashover fire, factor
(where
Av is the opening area and
Hv is the opening height) is directly proportional to the rate of mass flow through the opening. The factor is referred to as the ventilation factor. The value of the opening factor is equal to that of the ventilation factor divided by the total interior surface area. The ventilation factor and the opening factor can be calculated from Equations (2)–(4):
where
Ai is the area of the
ith opening (m
2);
Hi is the height of the
ith opening (m);
At is the surface area of the room (m
2);
η is the opening factor (m
1/2).
2.1.3. Wall Thermal Inertia
Wall thermal inertia is a dimensionless indicator characterizing the attenuation rate of periodic temperature waves inside enclosures.
The thermal inertia indicator
involves three parameters, i.e., thermal conductivity
k, density
ρ, and specific heat capacity
c. Some scholars have studied the thermal inertia of common wall materials and summarized their thermal inertia parameters, as provided in
Table 1:
2.2. Standard Temperature Rise Models
2.2.1. ISO Standard Temperature Rise Model
The standard temperature–time curve given by the International Organization for Standardization in 1991 (i.e., the “ISO 834” curve) has been the most widely used fire temperature rise curve globally in recent years:
where
T is mean room temperature (°C);
t is time (min). However, the standard temperature rise model cannot satisfactorily reflect the randomness of fires.
2.2.2. EUROCODE Model
The EUROCODE model, developed by the European Committee for Standardization based on the temperature rise model built by Magnusson and Thelandersson, gives a room fire temperature–time curve according to fire load density, opening factor, and wall materials’ thermophysical properties. The model divides fire development into two stages, i.e., the temperature rise stage and the temperature decline stage. They can be calculated as follows:
Temperature rise stage
Temperature decline stage
where
is the wall thermal inertia parameter of fire-exposed rooms. When the room wall is composed of different materials, the weighted mean is taken by the area;
η is the opening factor;
q is fire load density;
tm is the duration of the temperature rise stage (min);
Tgm is the temperature at
tm;
Γ is the correction factor.
3. Random Factors Investigation of Fires in High-Rise Residential Buildings
According to the EUROCODE model, fire load density, opening factor, and the wall thermal inertia of fire-exposed rooms are all important parameters that affect fire temperature rise in buildings. Moreover, due to the differences between buildings and the uncertainties with fire occurrence and development, the interior combustibles and opening factor size of fire-exposed rooms are somewhat random.
3.1. Fire Load Density
High-rise residential buildings were screened according to the Chinese Code [
23] and were divided into four categories based on the year of construction: less than 5 years old, 5–10 years old, 15–20 years old, and more than 20 years old. Each category was randomly selected, resulting in 38 buildings. The authors derived the distribution laws of fire load density by investigating and sampling 38 urban high-rise residential buildings and conducting the classified statistics and analysis of samples. The investigation field is shown in
Figure 1 and
Figure 2:
When investigating the fire load density of high-rise residential buildings, the combustion calorific value of various indoor combustible items was calculated. The amount of combustible materials obtained from the investigation and the area of each room were used to calculate the fire load density of different rooms in each residential building. The maximum, minimum, mean, and standard deviation of fire load density were solved for each of the six rooms, i.e., living room, bedroom, kitchen, study, bathroom, and balcony. The statistics for different types of rooms are provided in
Table 2:
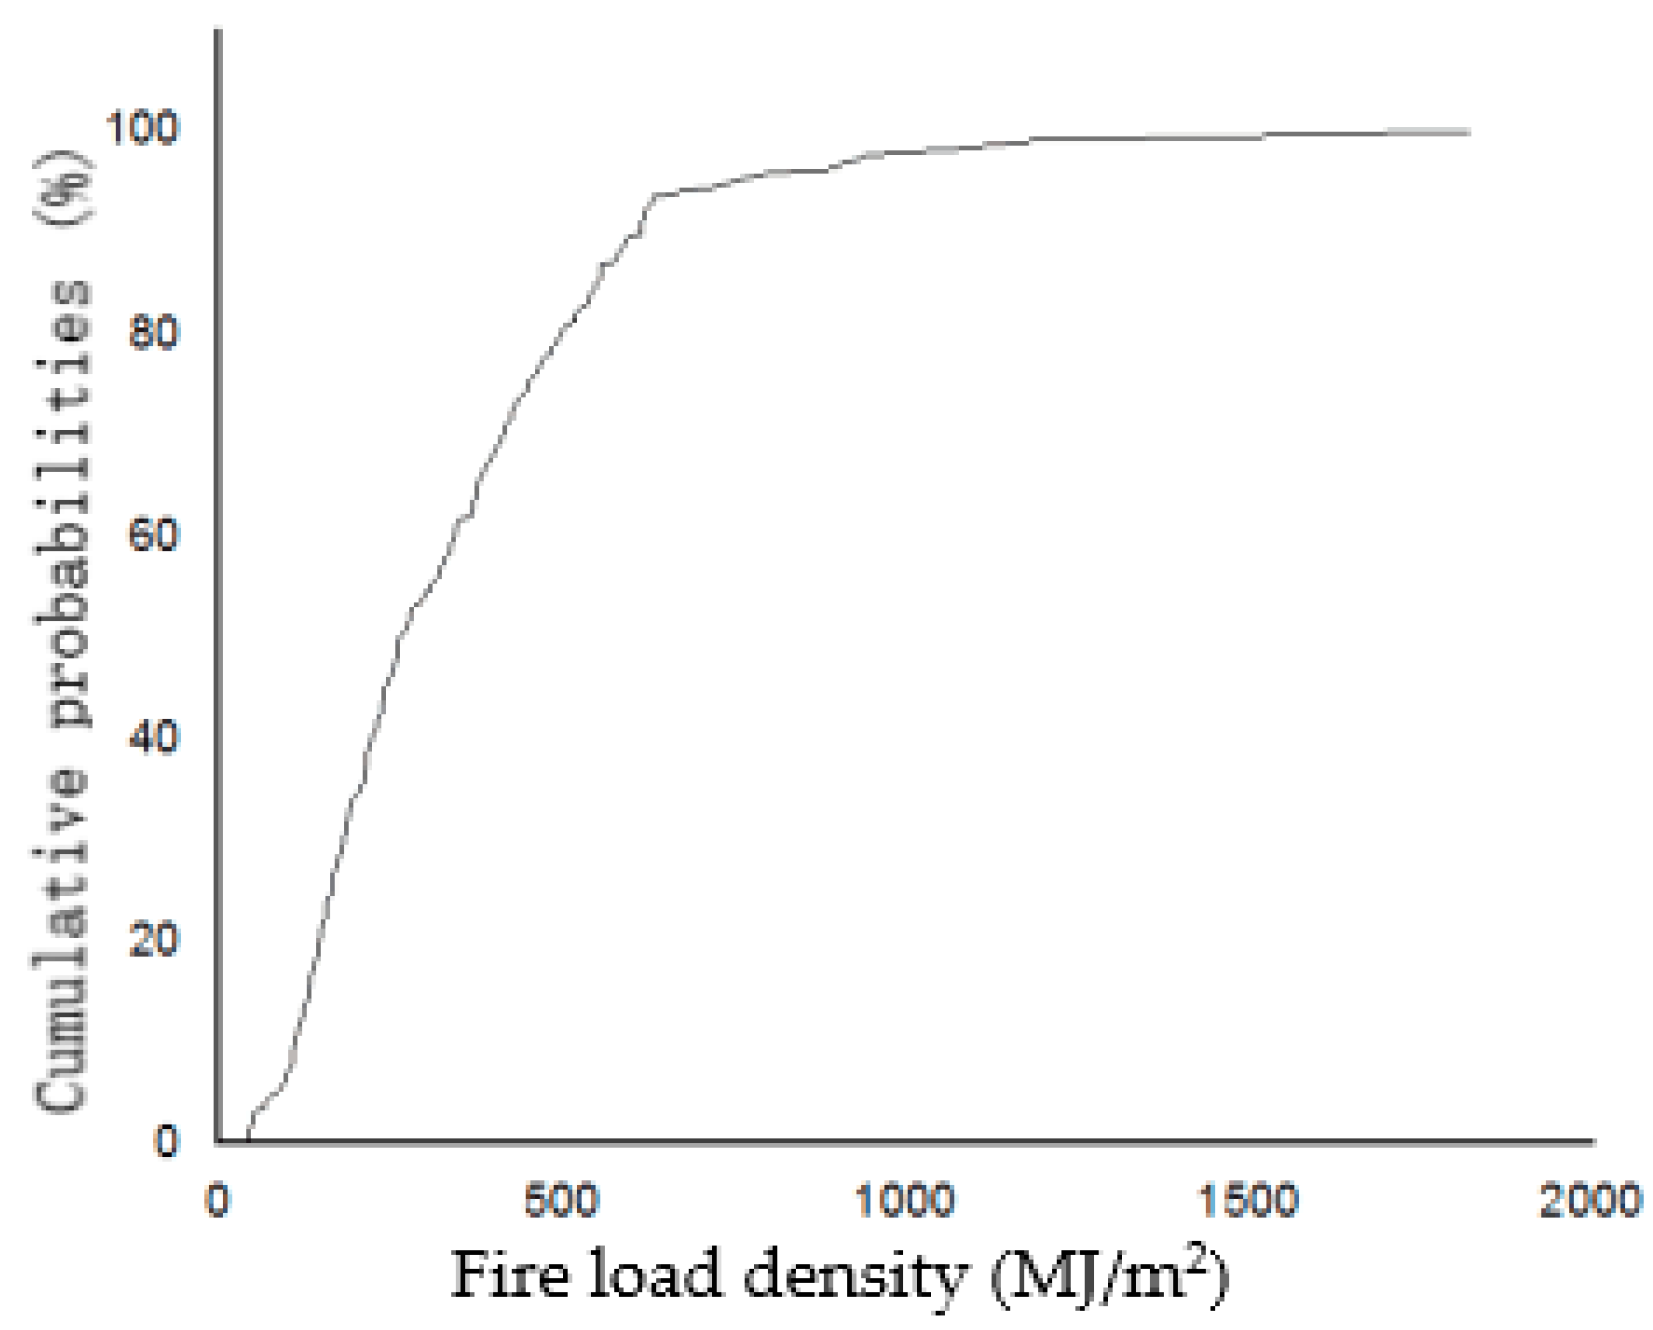
Fitting results showed that fire load density obeyed log-normal distribution.
Figure 3 shows the cumulative probability function (CDF) of fire load density for the investigated high-rise residential buildings. The fire load density values corresponding to cumulative probabilities of 50%, 80%, and 90% were 265.84 MJ/m
2, 498.29 MJ/m
2, and 616.49 MJ/m
2, respectively.
3.2. Ventilation Factor
Similarly, the ventilation factors of different types of rooms in different buildings were also investigated, covering opening height, opening length, the distance from the bottom of the opening to the ground, the distance from the left side of the opening to the left wall, and the distance from the right side of the opening to the right wall. The classified statistics and analysis of samples were conducted, and the ventilation factor’s maximum, minimum, mean, and standard deviation values were obtained. The investigation field is shown in
Figure 4 and
Figure 5. The statistics for different types of rooms are provided in
Table 3.
Figure 6 shows the CDF of the ventilation factor for the investigated high-rise residential buildings, where the values corresponding to cumulative probabilities of 50%, 80%, and 90% were 4.71 m
5/2, 0.8 m
5/2, and 13.46 m
5/2, respectively.
3.3. Wall Thermal Inertia
Currently, wall materials commonly used for urban high-rise residential buildings mainly include clay bricks (hollow), powder ash air-entrained concrete, and lightweight aggregate concrete, the last of which is most widely applied. According to the literature review, a positive correlation exists between thermal conductivity and density for clay bricks, air-entrained concrete, and lightweight aggregate concrete. Specific heat capacity remains relatively stable and can be taken as a deterministic parameter.
The literature [
24] holds that the wall thermal inertia
of fire-exposed rooms obeys uniform distribution. The thermal inertia and statistical characteristics of common building materials are provided in
Table 4.
4. Probabilistic Model for Fire Temperature Rise in High-Rise Residential Buildings under the Action of Uncertain Factors
4.1. Basic Idea
4.1.1. Latin Hypercube Sampling Method
Monte Carlo simulation can produce a group of random variables with corresponding distribution according to the distribution of each random variable (if the probability distribution of random variables and the limit state equation are predetermined). Then, by substituting them into the limit state equation, the following equation can be produced:
A group of random variables Z can be obtained with N number of tests.
4.1.2. Probabilistic Model for Fire Temperature Rise under the Action of Uncertain Factors
The probabilistic model for fire temperature rise under the action of certain factors can be obtained from the temperature rise model in
Section 2.2. However, as the occurrence of a fire is a dual-coupling process with randomness and determinacy, the variables in the mathematical model include fire load density, wall thermal inertia, and opening factor. The probabilistic model for fire temperature rise in high-rise residential buildings is somewhat uncertain and obeys probability distribution.
Therefore, based on
Section 4.1.1, the Latin Hypercube Sampling method was used in the computer sampling simulation on the uncertain factors in the temperature rise process. The probability density function (PDF) was employed to describe the randomness of the uncertain factors in the temperature rise process. Then, the expected probability distribution of temperature was determined, as shown in
Figure 7. Furthermore, the model’s output was analyzed statistically to determine the statistical characteristics of the output, such as the PDF and CDF.
4.2. Random Scenarios Construction
According to the investigation data, fire load density showed a log-normal distribution with a mean of 339.11 MJ/m
2 and a standard deviation of 246.60 MJ/m
2, so its PDF is
The opening factor showed a log-normal distribution with a mean of 0.2 m
1/2 and a standard deviation of 0.2 m
1/2, so its PDF is
The wall materials of urban high-rise residential buildings are largely lightweight aggregate concrete. Therefore,
showed a uniform distribution with a mean of 1787.5 J/m
2·K·s
1/2, a standard deviation of 220.8 J/m
2·K·s
1/2, and a range of [1405, 2170], so its PDF is
In conclusion, the distribution laws of fire load density, opening factor, and wall thermal inertia can be summarized in
Table 5:
4.3. Probability Distribution of Temperature Rise Model
Uncertain factors such as fire load density, opening factor, and wall thermal inertia were sampled using MATLAB’s Latin Hypercube Sampling method. Sampling was performed 7000 times for the three parameters to guarantee a precision of 99.9%.
4.3.1. Distribution Laws of Temperature Rise Time
The fire load density and opening factor obtained from sampling were substituted into the EUROCODE model to solve the value of
tm, and the calculated data were used to draw the time probability distribution histogram corresponding to the highest temperature, as shown in
Figure 8.
The K–S test was carried out on time required by the highest temperature using SPSS software, and it was found that the logarithm value satisfied normal distribution. Therefore, the time satisfied the log-normal distribution. The time corresponding to the highest temperature satisfied a log-normal distribution with a mean of 26.46 min and a standard deviation of 38.26 min, so its PDF is
where
tm is the time corresponding to the highest temperature (min).
4.3.2. Distribution Laws of the Highest Temperature
The solved time corresponding to the highest temperature was substituted into Formula (9) to obtain the corrected time
t*, which was further substituted into Formula (5) to acquire the highest fire temperature, as shown in
Figure 9. The highest temperature occurred most frequently within the range of 1100–1200 °C. The mean and standard deviation of the highest temperature were 873.3 °C and 286.3 °C, respectively.
After subjecting the solved data to the K–S test, it was found that they satisfied neither normal distribution nor log-normal distribution. In that case, the distribution histogram was drawn using MATLAB, and the distribution curve was fitted. Taking the highest temperature as the abscissa and frequency as the ordinate, MATLAB was used to solve the fitted equation of the fitted curve with the
cftool function. Then, Gaussian distribution fitting was performed. It can be observed from the histogram that the discrete degree of data differed between the two sides of the highest point, so the logarithm value was taken to fit the PDF of the highest temperature, as shown in Equation (18):
The sum of squares due to error (SSE) between the fitted equation and the original function was 0.007943, i.e., close to 0. Therefore, taking the logarithm value for temperature produced a desirable fitting effect.
4.3.3. Most Representative Temperature Rise Curve
Based on the probability distribution proposed above, the temperature rise curve with the highest probability in the case of a fire in urban high-rise residential buildings can be given. Specifically, the correction factor was 5.31, the maximum temperature rise time was 14.73 min, and the highest temperature was 984 °C. We compared that to the standard temperature rise curve, as shown in
Figure 10. According to the picture, compared with the standard temperature curve, there is a turning point in the temperature curve of urban high-rise residential buildings, and the time needed to reach the highest temperature is shorter. By comparing it with the experimental data [
25], it was found that there is a turning point of temperature change in both of them, appearing about 900 s after the fire.
5. Conclusions
Modeling fire temperature rise in high-rise residential buildings offers an important indicator for scientific research on fires in high-rise residential buildings. To date, many scholars have built models for fire temperature rise in buildings. However, these models summarize temperature rise curves in specific fire scenarios. They use a deterministic formula to express the rise of fire temperature in high-rise residential buildings but ignore many random factors affecting such models.
This study investigated 38 urban high-rise residential buildings in Chinese cities with a population of more than 10 million, created the PDFs of fire load density, opening factor, and wall thermal inertia, and constructed random fire scenarios for urban high-rise residential buildings. It was found that fire load density and opening factor showed log-normal distribution for urban high-rise residential buildings, while wall thermal inertia presented uniform distribution. Fire temperature rise time and correction factor obeyed log-normal distribution.
On this basis, relying on the Latin Hypercube Sampling method, this study further explored the probabilistic model for fire temperature rise in urban high-rise residential buildings under the action of uncertain factors, gave the possible temperature rise curves of fires in urban high-rise residential buildings and their probability distribution, and established the most representative temperature rise curve, with a turning point and highest temperature of 984 °C. The findings of this study are of great significance for the fire protection design, risk assessment, and fire rescue of high-rise residential buildings in China. The method of probabilistic analysis of fire temperature based on survey data used in this article is also helpful to future research on fire development.
Author Contributions
All authors contributed significantly to this study. Conceptualization, G.Z.; data curation, J.Y.; formal analysis, T.T.; investigation, L.Z.; methodology, P.D. All authors have read and agreed to the published version of the manuscript.
Funding
This research was funded by the National Key Research and Development Program of China, grant number 2022YFC3090503.
Data Availability Statement
All data generated or appearing in this study are available upon request from the corresponding author.
Conflicts of Interest
The authors declare no conflict of interest.
References
- Babrauskas, V. A closed-form approximation for post-flashover compartment fire temperatures. Fire Saf. J. 1981, 4, 63–73. [Google Scholar] [CrossRef]
- Babrauskas, V.; Williamson, R.B. Post-flashover compartment fires: Basis of a theoretical model. Fire Mater. 1978, 2, 39–53. [Google Scholar] [CrossRef]
- Mccaffrey, B.J.; Quintiere, J.G.; Harkleroad, M.F. Estimating room temperatures and the likelihood of flashover using fire data correlations. Fire Technol. 1981, 17, 98–119. [Google Scholar] [CrossRef]
- Gao, Y.F. Prediction method and analysis of indoor fire temperature. J. Catastrophology 2006, 1, 64–66. [Google Scholar]
- Magnusson, S.E.; Thelandersson, S. Temperature-time curves of complete process of fire development. In Bulletin of Division of Structural Mechanics and Concrete Construction; Lund Institute of Technology: Lund, Sweden, 1970; pp. 1–15. [Google Scholar]
- Magnusson, S.E.; Thelandersson, S. Comments on Rate of Gas Flow and Rate of Burning for Fires in Enclosures. In Bulletin of Division of Structural Mechanics and Concrete Construction; Lund Institute of Technology: Lund, Sweden, 1971; pp. 1–12. [Google Scholar]
- Welch, S.; Allan, J.; Susan, D.; Richard, M.; Jose, L.T. BRE large compartment fire tests-Characterising postflashover fires for model validation. Fire Saf. J. 2007, 42, 548–567. [Google Scholar] [CrossRef]
- Lennon, T.; Moore, D. The natural fire safety concept-full-scale tests at Cardington. Fire Saf. J. 2003, 38, 623–643. [Google Scholar] [CrossRef]
- Lie, T.T. Fire Temperature-Time Relations. SFPE Handbook of Fire Protection Engineering, 3rd ed.; National Fire Protection Association: Quincy, MA, USA, 2002; pp. 4–201. [Google Scholar]
- Thomas, P.H. Design guide: Structure fire safety CIB W14 Workshop report. Fire Saf. J. 1986, 2, 77–137. [Google Scholar] [CrossRef]
- Vrouwenvelder, T. The JCSS probabilistic model code. Struct. Saf. 1997, 19, 245–251. [Google Scholar] [CrossRef]
- The Cabinet. Architectural Datum Method; Sanseido: Tokyo, Japan, 2000; pp. 126–128. [Google Scholar]
- John, R.; Hall, J.; Joglar, F. SFPE Handbook of Fire Protection Engineering, 5th ed.; Springer: Berlin, Germany, 2016; pp. 2827–2874. [Google Scholar]
- Jin, F.; Li, G.Q. Parameter randomness of parametric model of prime indoor fire. J. Archit. Civ. Eng. 2006, 4, 44–48. [Google Scholar]
- Xia, Y.; Wang, W.Y. Statistical analysis of uncertain parameters of building fire load. Build. Sci. 2018, 34, 18–21. [Google Scholar]
- Zhang, Z.J. Reliability Analysis of Steel Structure Based on Randomness of Fire Heating. Master’s Thesis, Harbin Engineering University, Harbin, China, 2011. [Google Scholar]
- Wang, J.P. The standard value of fire load of typical existing building in China. In Proceedings of the 2013 China Fire Protection Association Science and Technology Annual Conference, Hefei, China, 22 October 2013. [Google Scholar]
- Culver, C.G. Characteristics of fire loads in office buildings. Fire Technol. 1978, 14, 51–60. [Google Scholar] [CrossRef]
- Melinek, S.J. The distribution of fire load. Fire Saf. J. 1993, 20, 83–88. [Google Scholar] [CrossRef]
- Wen, L.; Zhou, J.; Wang, L. Study on analytical model of temperature development of large-space gymnasium timber structure buildings considering wood combustion effects. J. Nanjing Tech Univ. (Nat. Sci. Ed.) 2021, 43, 503–510. [Google Scholar]
- Zhang, M.; Li, T.; Xue, Y.H. Simulation of Residential Building Bedrooms’ Heating up Curves under Live Fire Loads in Central Plains Region. Build. Sci. 2012, 28, 87–92. [Google Scholar]
- Karlsson, B.; Quintiere, J.G. Enclosure Fire Dynamics, 2nd ed.; CRC Press: Boca Raton, FL, USA, 2022. [Google Scholar]
- GB 50016-2014; Code for Fire Protection Design of Buildings. China Planning Press: Beijing, China, 2018.
- Jin, F. Randomness of Indoor Air Heating in Buildings under Fire. Master’s Thesis, Tongji University, Shanghai, China, 2007. [Google Scholar]
- Li, S.Y.; Zong, R.W.; Liao, G.X. Experimental and Modeling Study on Flashover in the Typical Compartment of Extra-high Building Construction. In Proceedings of the 2010 International Forum on Fire Safety and Integrated Disaster Prevention Technology of Super Tall Buildings, Guangzhou, China, 20 November 2010. [Google Scholar]
| Disclaimer/Publisher’s Note: The statements, opinions and data contained in all publications are solely those of the individual author(s) and contributor(s) and not of MDPI and/or the editor(s). MDPI and/or the editor(s) disclaim responsibility for any injury to people or property resulting from any ideas, methods, instructions or products referred to in the content. |
© 2023 by the authors. Licensee MDPI, Basel, Switzerland. This article is an open access article distributed under the terms and conditions of the Creative Commons Attribution (CC BY) license (https://creativecommons.org/licenses/by/4.0/).


