
Countering Omitted Evidence of Variable Historical Forests and Fire Regime in Western USA Dry Forests: The Low-Severity-Fire Model Rejected


Abstract
:1. Introduction
1.1. The Issue of Historical Forest Structure and Fire in Dry Forests
1.2. Rationale and Methodology of This Paper
2. Expanding Sources of Evidence about Dry-Forest HRV since the 1990s Omitted in H

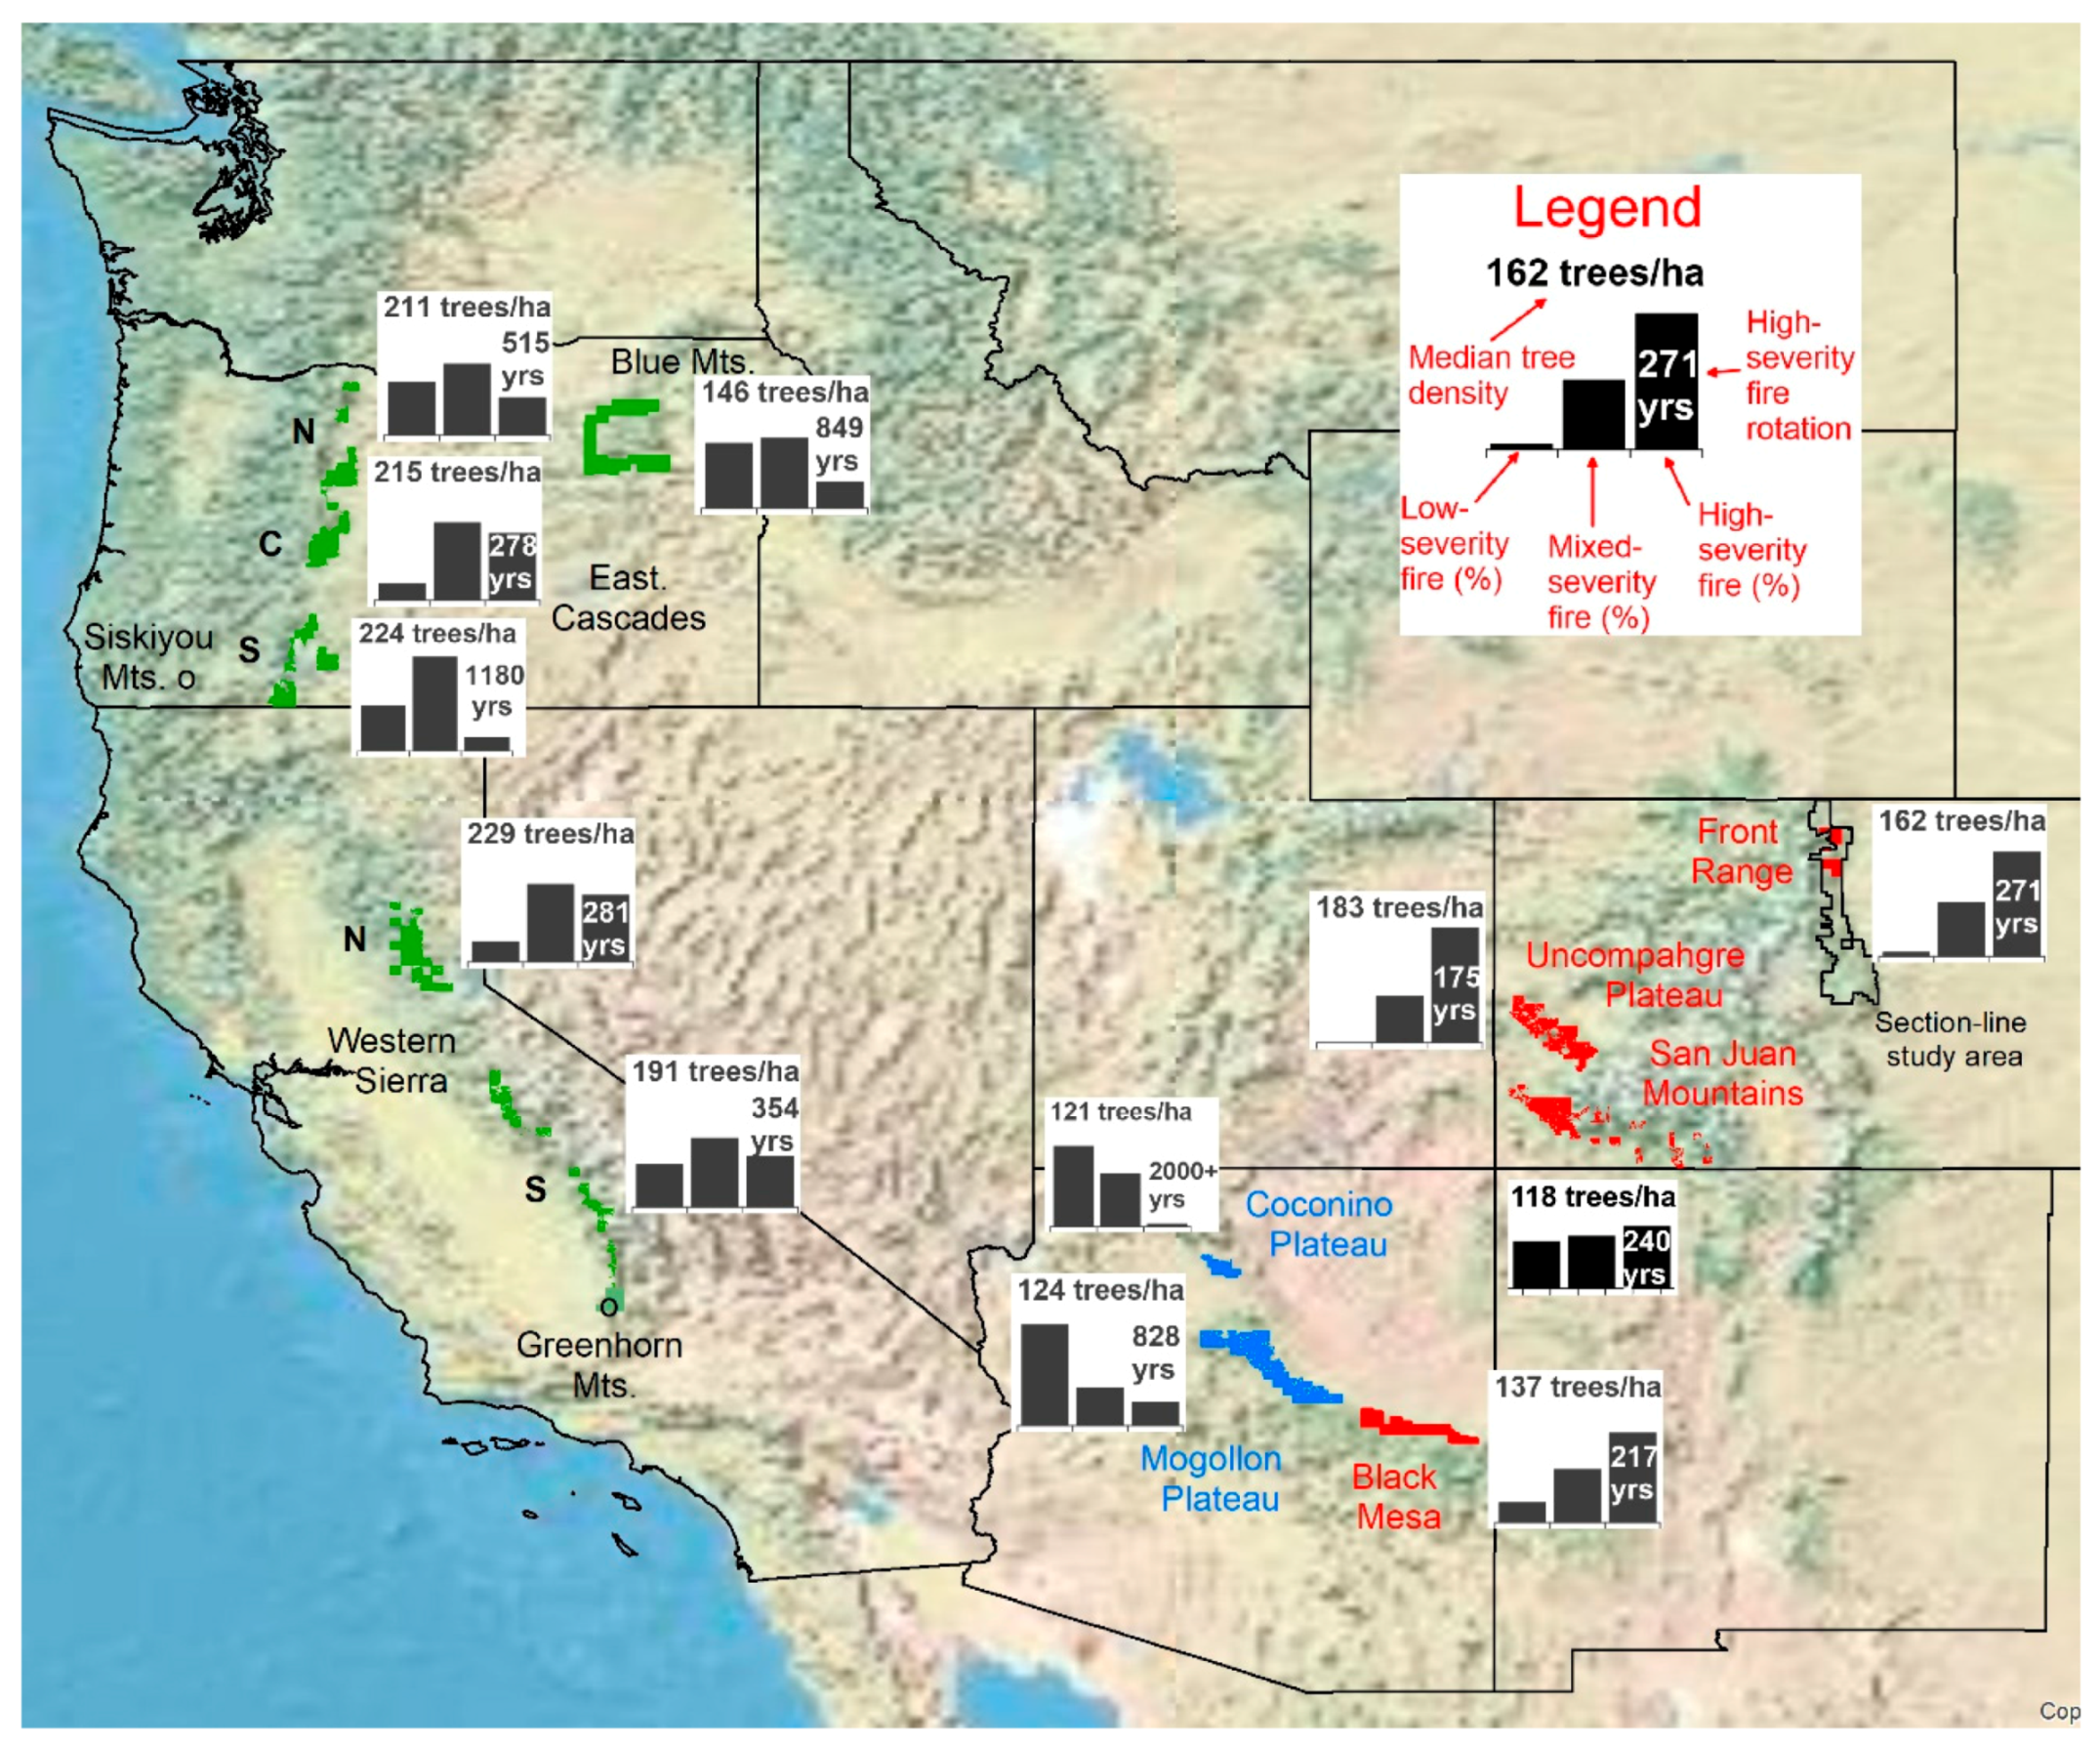
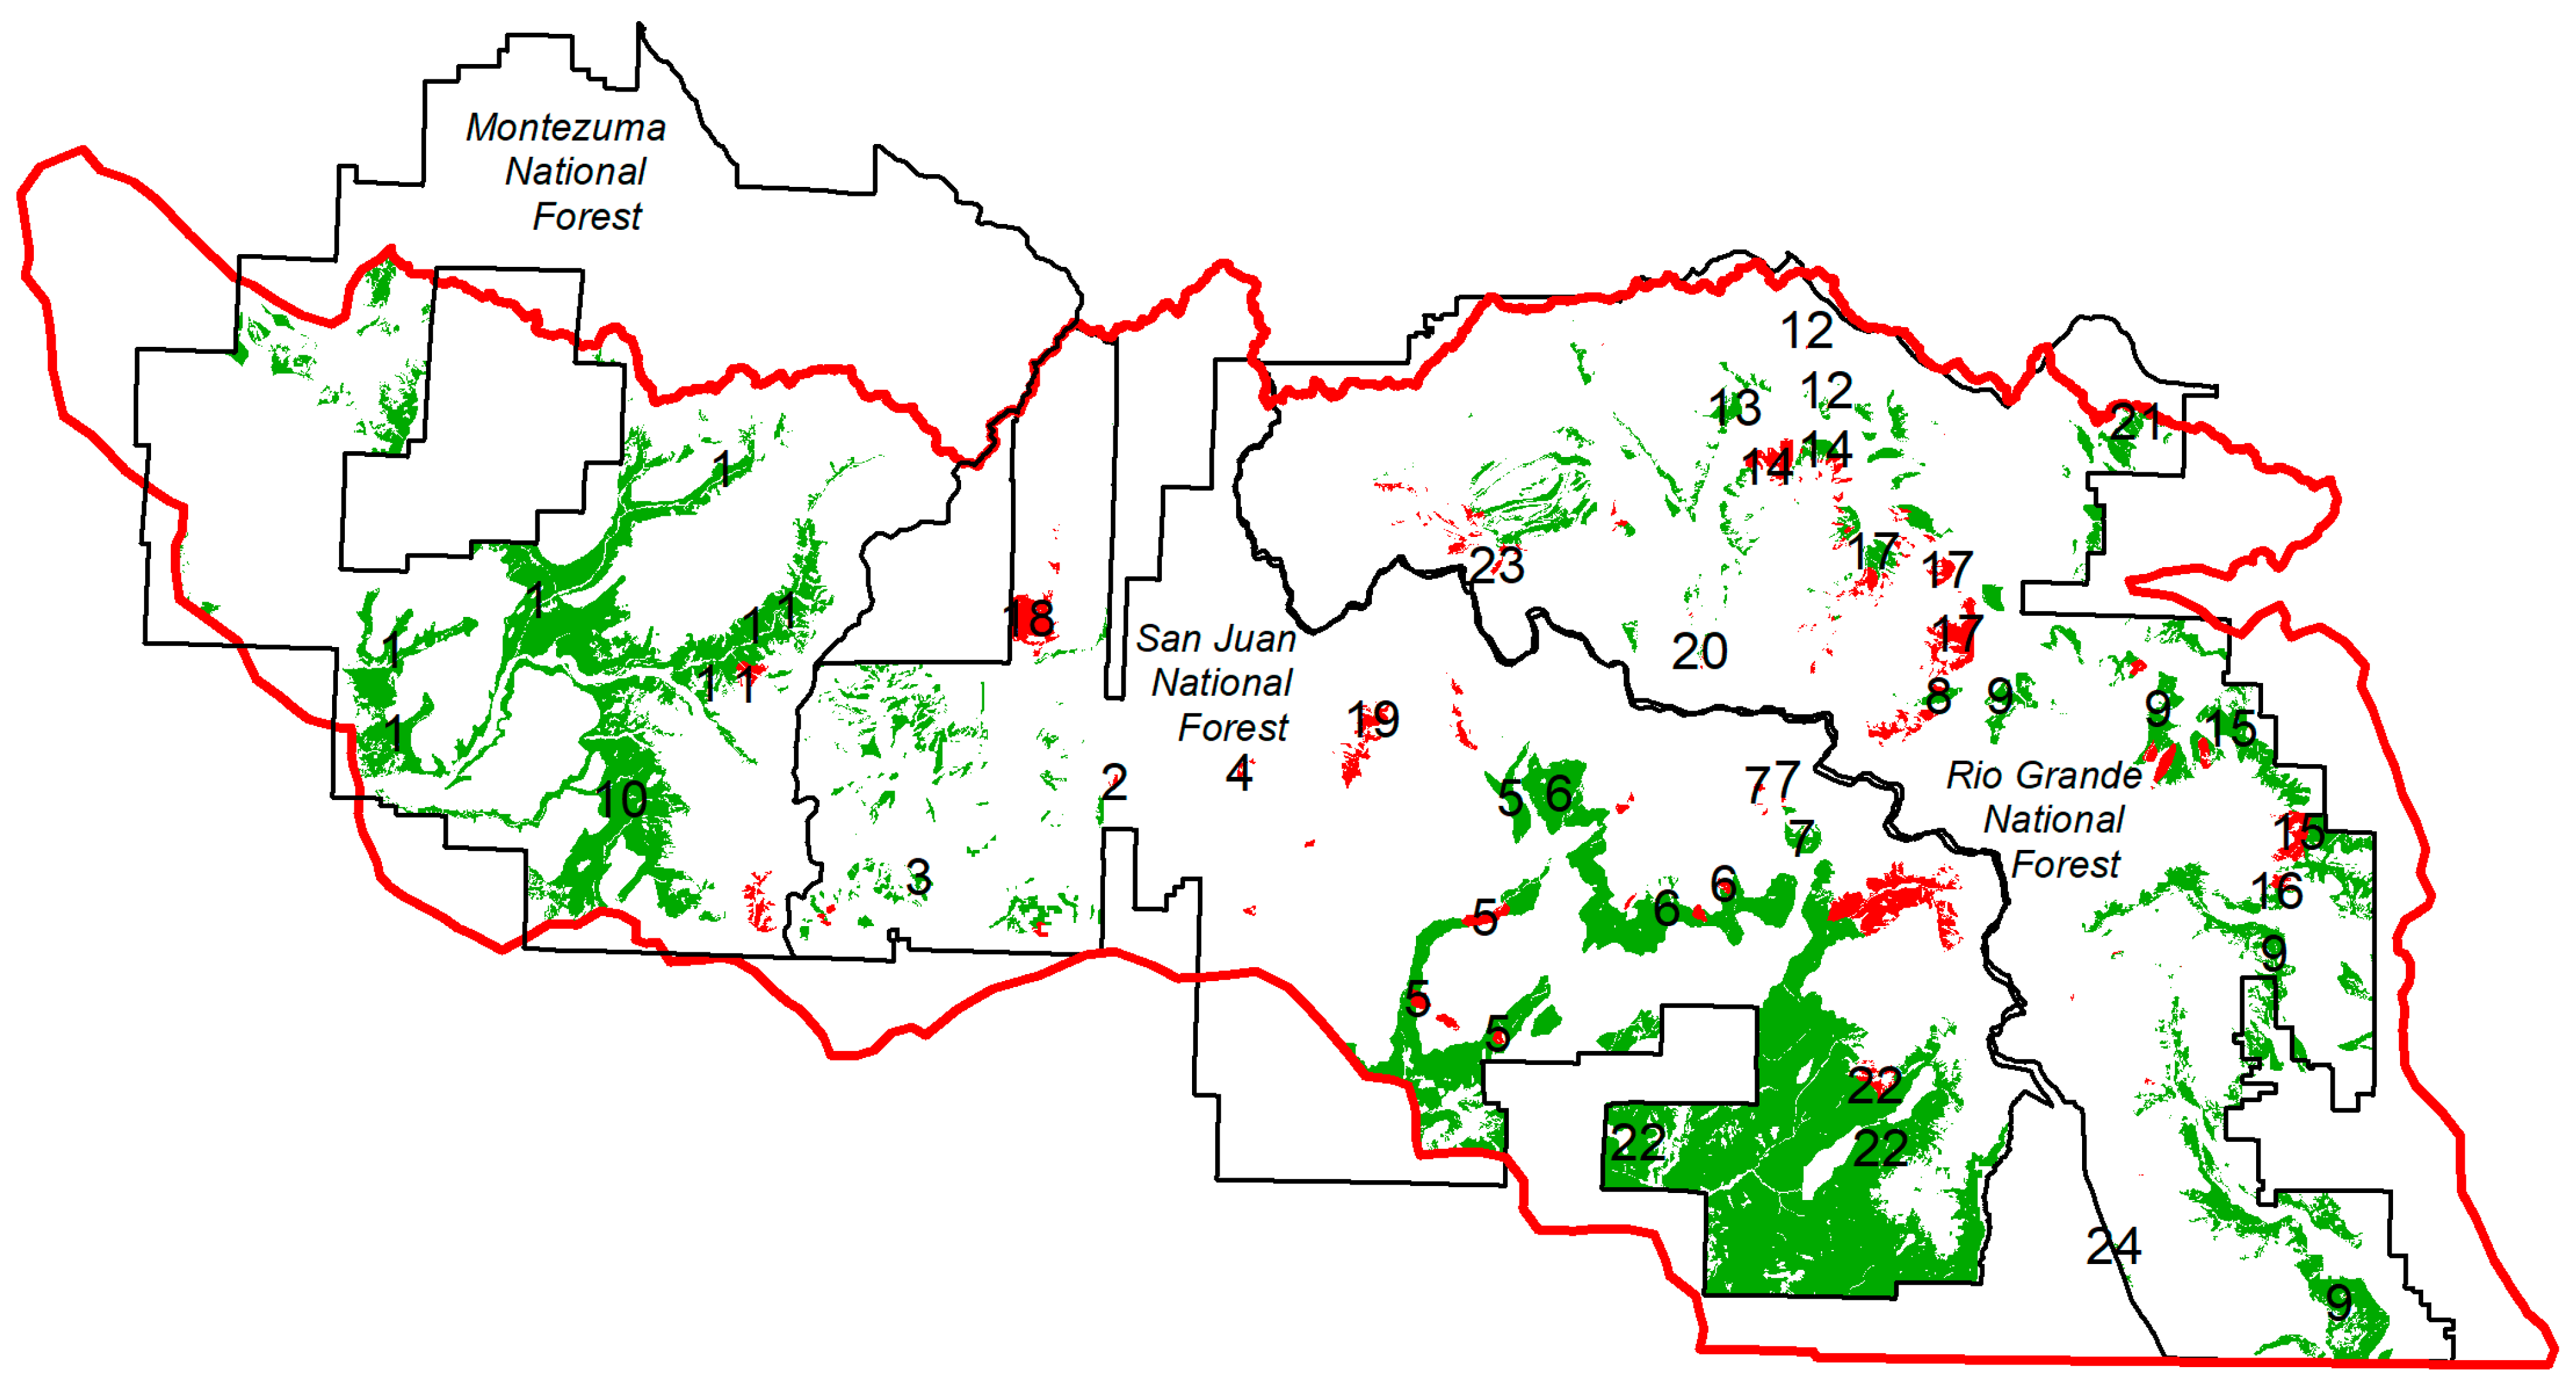
| Study Area | Source | Area (ha) | Historical Fire Severity | Historical Tree Density (Trees/ha) | ||||||
|---|---|---|---|---|---|---|---|---|---|---|
| Low (%) | Mixed (%) | Low + Mixed (%) | High (%) | High Rotat. (yrs) | Mean | Median | C.V. (%) | |||
| Group 1—Mostly low- to moderate-severity fires and low tree density | ||||||||||
| Mogollon Plateau, AZ | Williams and Baker [24] | 405,214 | 62.4 | 23.1 | 85.5 | 14.5 | 828 | 141 | 124 | 54 |
| Coconino Plateau, AZ | Williams and Baker [27] | 41,214 | 58.8 | 38.7 | 97.5 | 2.5 | 2000 1 | 142 | 121 | 46 |
| Group 2—Mostly moderate- to high-severity fires and intermediate to high tree density | ||||||||||
| W Sierra, CA-North | Baker [28] | 133,482 | 12.6 | 48.2 | 60.8 | 39.2 | 281 | 318 | 229 | 106 |
| W Sierra, CA-South | Baker [28] | 196,461 | 26.4 | 42.5 | 68.9 | 31.1 | 354 | 275 | 191 | 203 |
| W. Sierra, CA--Greenhorn Mts. 2 | Baker and Hanson [17] | 49,050 | - | - | - | 26.9 3 | - | 280 4 | - | - |
| Blue Mts., OR | Williams and Baker [24] | 304,709 | 40.3 | 43.2 | 83.5 | 16.5 | 849 | 167 | 146 | 54 |
| E Cascades, OR-N | Baker [29] | 146,555 | 32.5 | 44.2 | 76.7 | 23.3 | 515 | 246 | 211 | - |
| E Cascades, OR-C | Baker [29] | 147,502 | 10.4 | 48.2 | 58.6 | 41.4 | 278 | 262 | 215 | - |
| E Cascades, OR-S | Baker [29] | 104,160 | 29.4 | 61.7 | 91.1 | 8.9 | 1180 | 233 | 224 | - |
| Siskiyou Mts., OR 2 | Baker [30] | 46,445 | - | - | - | - | 272 | 253 | ||
| Group 3—More high-severity fires and intermediate tree density | ||||||||||
| Black Mesa, AZ | Williams and Baker [24] | 151,080 | 12.0 | 32.8 | 44.8 | 55.2 | 217 | 144 | 137 | 47 |
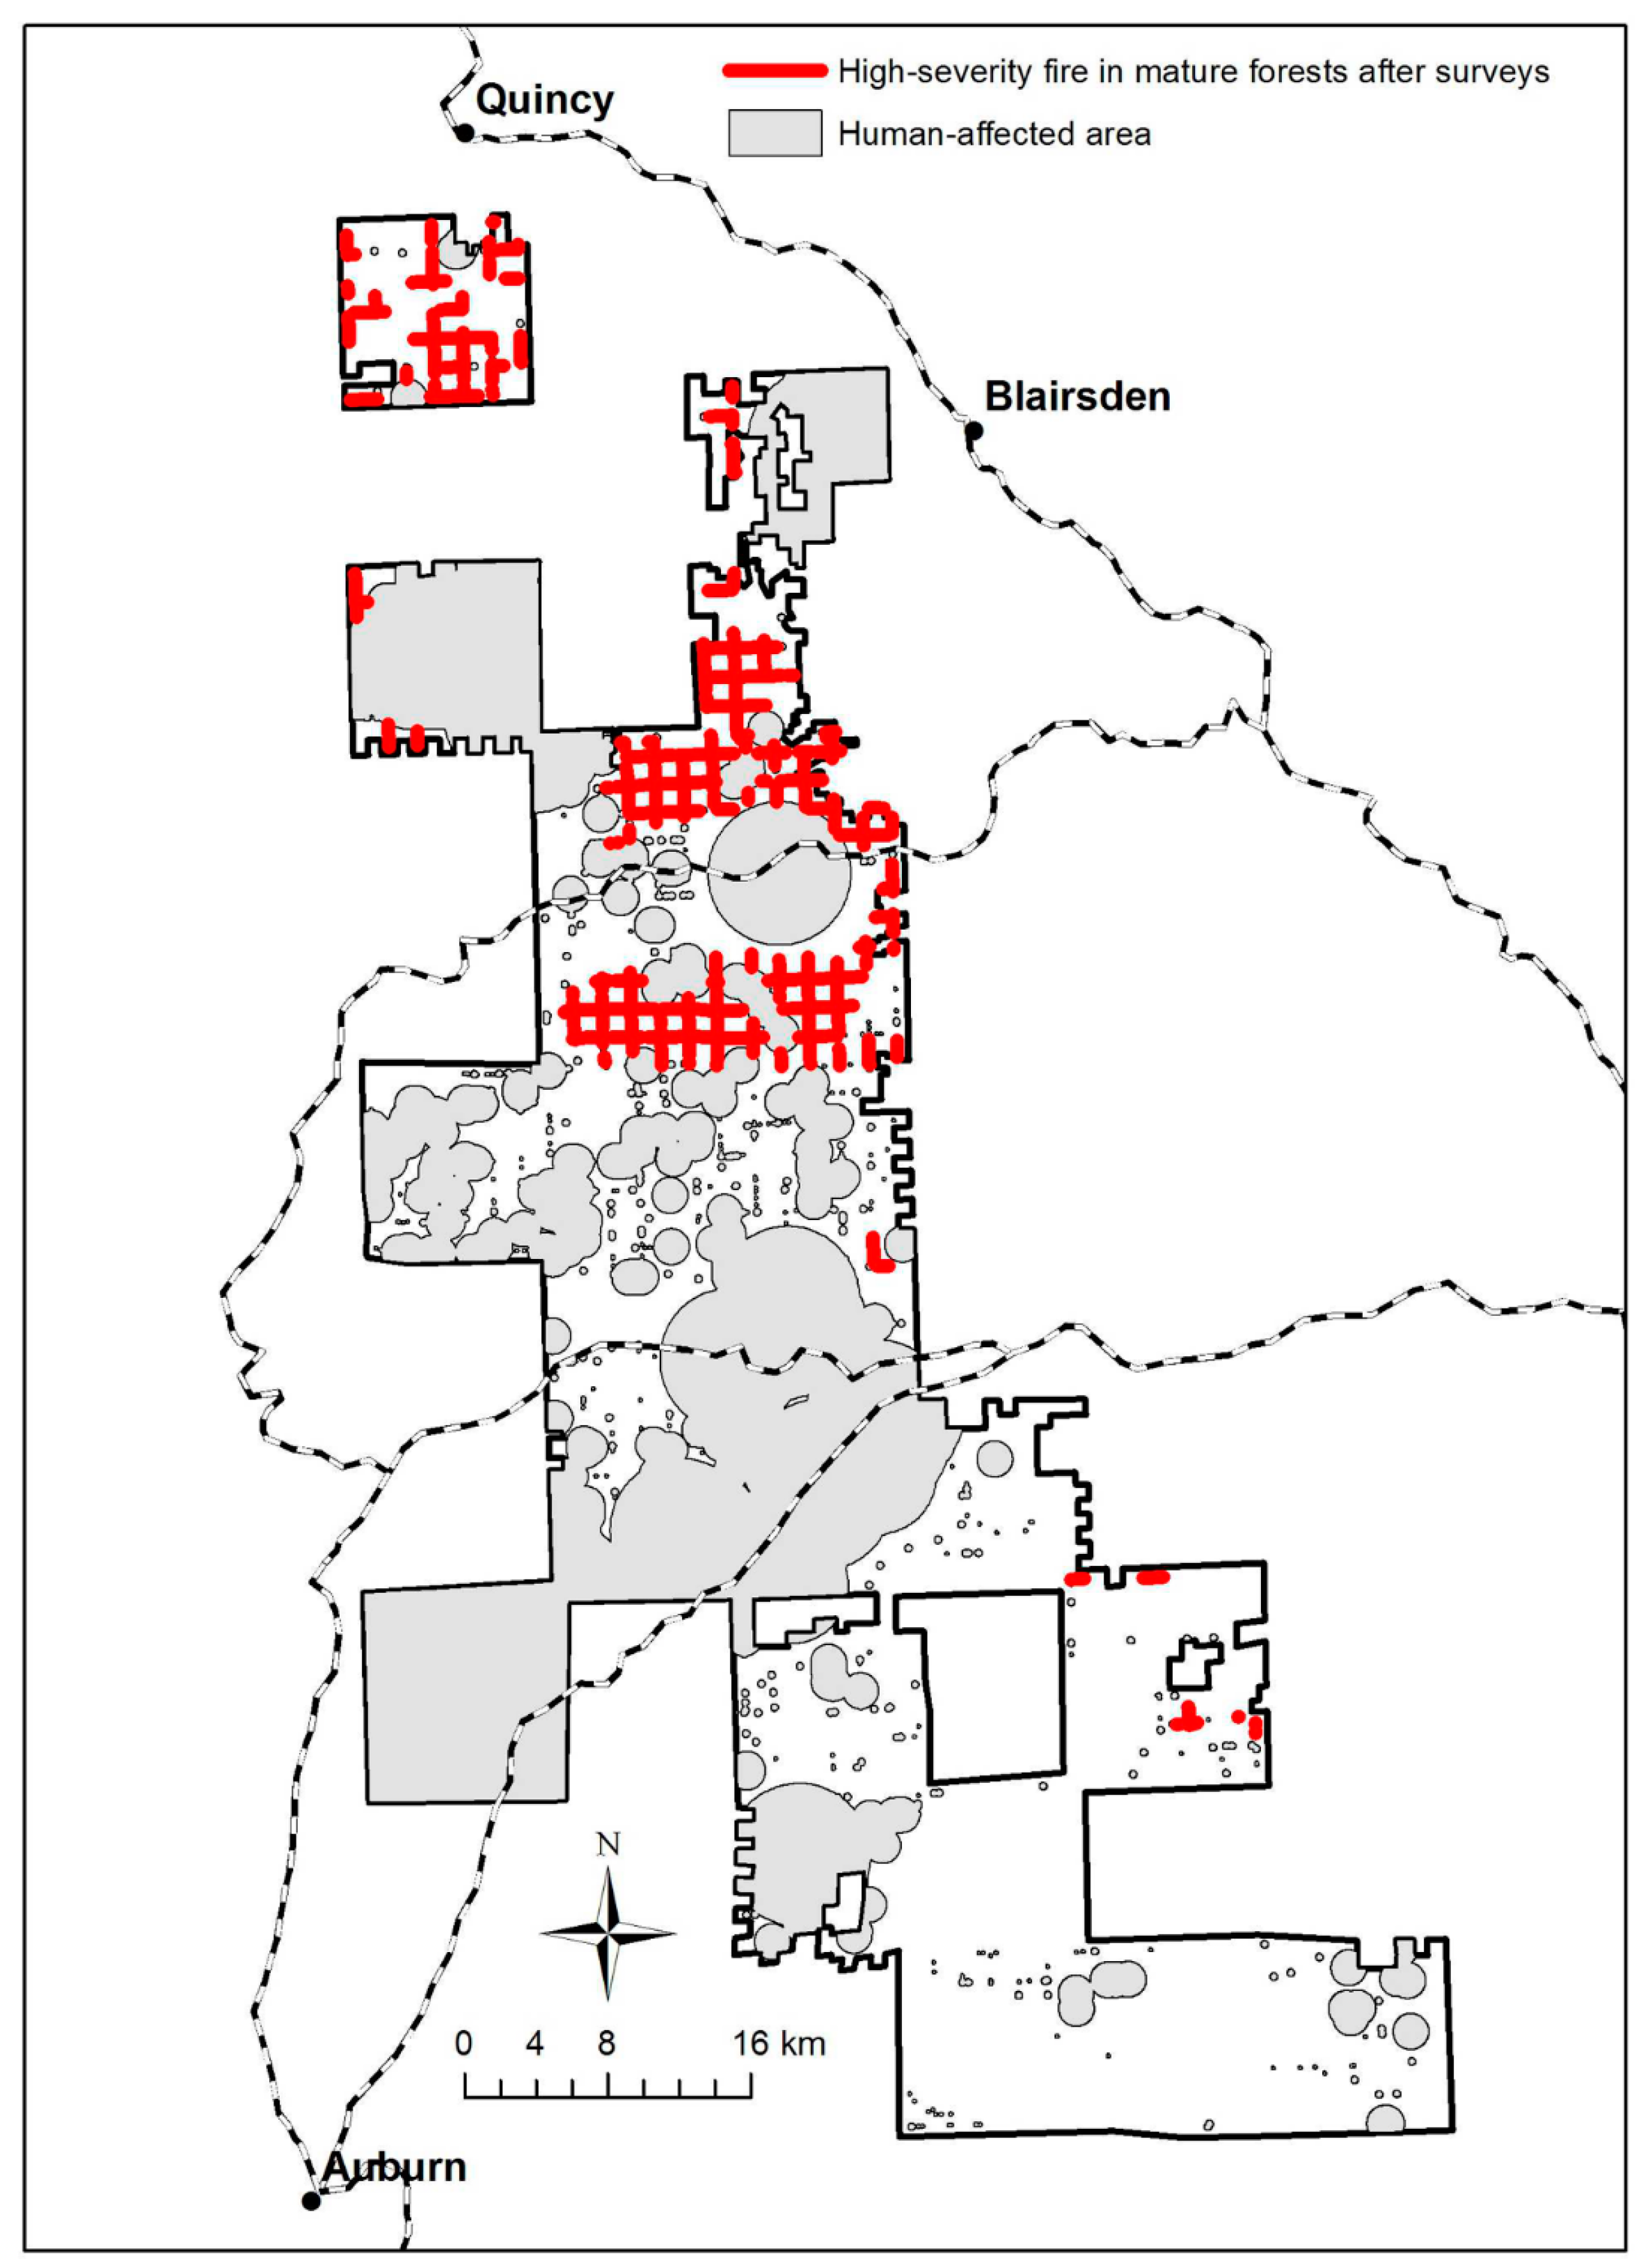
| Front Range, CO | Williams and Baker [24] | 65,525 | 2.5 | 32.9 | 35.4 | 64.6 | 271 | 217 | 162 | 100 |
| Front Range, CO--Section-line area | Williams and Baker [31] | 624,156 | - | - | - | 249 5 | - | - | - | |
| Uncompahgre Plateau, CO 4 | Baker [32] | 227,036 | 0.0 | 28.7 | 28.7 | 71.3 | 175 | 182 | 183 | 86 |
| San Juan Mts., CO 2 | Baker [33] | 235,787 | 29.2 | 32.5 | 61.7 | 38.3 | 240 | 191 | 118 | 99 |
| Historical Forest Structure | |
| Tree-ring reconstructions from remnant evidence | Fulé et al. [39] |
| Land survey reconstructions from bearing-tree data | Williams and Baker [24,40,41] |
| Early forest reserve reports | Baker et al. [35] |
| Early records from forest inventories | Baker and Williams [34] |
| Early aerial photographs | Hessburg et al. [11] |
| Early oblique photographs | Veblen and Lorenz [42] |
| Historical Fires | |
| Tree-ring reconstructions from fire scars—small plots | Baisan and Swetnam [43] |
| Tree-ring reconstructions from landscape-level data | Farris et al. [15] |
| Land survey reconstructions from bearing-tree data | Williams and Baker [24,40,41] |
| Land survey reconstructions from section-line data | Williams and Baker [31] |
| Forest Inventory and Analysis reconstructions | Odion et al. [12] |
| Paleo-charcoal reconstructions | Pierce et al. [36] |
| Early records from newspaper accounts | Baker [44] |
| Early scientific publications | Baker [44] |
| Early forest reserve reports | Baker et al. [35] |
| Early forest atlases | Baker [44] |
| Early oblique photographs | Baker [45] |
| Early aerial photographs | Hessburg et al. [11] |
3. Debunking H’s: “Fire Regimes Are Significantly Departed”
“…nearly the only fires that reach any size are those that escape control under severe climatological conditions, in heavy fuels, and/or in inaccessible topography…Since almost all fires occurring under moderate conditions are put out, areas burned by wildfire in the contemporary study area suffer a statistical predisposition to burn at higher severity. This is especially evident in lower and middle elevation forests like yellow pine and mixed conifer…”
4. Debunking H’s “Evaluating Evidence of Lack of Change”
“…publications that suggest the preponderance of evidence misrepresents or overgeneralizes departures from active fire regimes. These publications then suggest that management actions aimed at recapturing the influence of abundant low- and moderate-severity fire lacks [sic] a sound ecological foundation. Over the past two decades, independent research groups have evaluated the methods and inferences proposed by these publications and documented multiple weaknesses. Despite demonstrated methodological biases and errors, new papers employing these methods, or results and conclusions derived from them, continue to pass peer review” H.(p. 16)
4.1. H’s “Misrepresented Historical Forest Conditions” Section Omitted Evidence
4.1.1. Evidence Showing Validity and Accuracy of the WB Method, Omitted in H
- Evidence of development of the WB method relative to earlier methods, omitted in H
| Counter-Evidence | Evaluation of Counter-Evidence | H Omitted Rebuttals and Other Published Evidence also Essential to Evaluation of Counter-Evidence | |||
|---|---|---|---|---|---|
| Citations | Counter-premise | Citations | Implications of evaluation | Citations | Implication of omitted evidence |
| Williams and Baker [41] Baker and Williams [34] | Novel methods provide estimates of tree density from point data, i.e., General Land Office (GLO) records of bearing trees | Levine et al. [61,62] | Multiple existing plotless density estimators (PDEs) provided less biased estimates than the PDE developed by Williams and Baker [41], which overestimated known tree densities by 24–667% in contemporary stands | Omitted Rebuttal by Baker and Williams [63] | Levine et al. [61] incorrectly coded and applied the WB method, producing spurious results that had no bearing on the WB method. |
| Omitted Rebuttal by Baker and Williams [63], Omitted evidence in Williams and Baker [41] | Levine et al. [62] corrected their flawed 2017 code in [61], but then in [62] used incorrect equations. Baker and Williams [63] used corrected equations with their code at their sites and showed the WB method worked well. Williams and Baker [41] had shown that Voronoi-based estimators work better than existing PDEs and do not overestimate in western dry forests. | ||||
| Knight et al. [64] | Methods supported by PDE sampling theory and multiple accuracy assessments further demonstrate the potential for misrepresentation of historical tree density by biased estimators used at resolutions substantially smaller than the minimum recommended for −50% accuracy | Omitted evidence in Williams and Baker [41] | Knight et al. [64] did not use or test the WB method at all. They used old point-pattern measures that Cogbill et al. [59] had already shown were inaccurate, require large samples, and underestimate. The WB method was designed to overcome these known limitations and had already been validated [41] to be able to accurately estimate tree density at the −518 ha scale in western dry forests. | ||
| Williams and Baker [24] | Historical forests were denser than previously documented | Johnston et al. [65] | Existing method for estimating tree density from point data [66,67] yielded densities less than half as large as estimates using Williams and Baker [41] | Omitted Rebuttal by Baker and Williams ([63] Appendix S1) | This study roughly estimated Voronoi-based tree density of 89.6 trees/ha for Johnston et al.’s sites, a modest error of 20% if a Johnston et al. estimate of 112 trees/ha is considered truth. This is within expected accuracy for the WB method [41]. Their estimate is not from a random sample and is too small to compare, as they did, with the mean for the whole WB study area, but is within one s.d. of the reconstructed historical mean [24] and so is congruent with historical variability, as found in the reconstruction. |
| Williams and Baker [24] Baker [25,28,29,68] | Historical forests were denser than previously documented | Hagmann et al. [54,69,70,71], Collins et al. [72], Stephens et al. [73,74], Battaglia et al. [75], Johnston et al. [65] | Consistent with the finding that Williams and Baker [41] methods overestimate tree density (Levine et al. [61,62], Johnston et al. [65], and Knight et al. [64]), early timber inventory records and tree-ring reconstructions for the same study areas documented substantially lower tree densities than those estimated using Williams and Baker [41] methods | New evidence here | See above for why Levine et al. [61,62], Johnston et al. [65], and Knight et al. [64] do not show that the WB method overestimates tree density. Regarding early timber inventories, see the last line below. Battaglia et al.’s [75] study area was ~30 times WB’s, a major scale-mismatch, and was based on sampling 97% in logged forests. There has been no validation that the method they used can accurately reconstruct historical tree density in their region, and there especially has been no validation of their method in heavily logged forests where evidence likely has been destroyed by harvesting and associated activities. |
| Hanson and Odion [76] | Managing for dense, old forest and high-severity fire is consistent with historical conditions | Collins et al. [77] | Fundamental errors compromise assertions about historical conditions including (1) inappropriate use of coarse-scale habitat maps and (2) inaccurate assumption that areas lacking timber volume in early inventories indicate past high-severity fire | Omitted rebuttal in Hanson and Odion [78] | Collins et al. [77] is not about tree density or forest density and did not belong in this table. However, Hanson and Odion [78] showed that (1) Collins et al. thought maps were wrong but missed that areas that were forested by 1992, having recovered from early high-severity fires, had burned again, and (2) Collins et al. had omitted including essential 1911 field survey notes that directly described high-severity fires. |
| Odion et al. [12], Baker [4,68], Baker and Hanson [17] | Spatially extensive early timber inventories and bias in their use and interpretation misrepresent historical conditions | Stephens et al. [73], Collins et al. [77], Hagmann et al. [18,54,71] | Fundamental errors compromise conclusions, including (1) the use of previously discredited methods (Williams and Baker [24]) to estimate tree density from GLO data as a baseline comparison; (2) incorrect assumptions about the methodological accuracy of early timber inventories; (3) inappropriate comparisons of studies of vastly different spatial scales, forest types, and diameter limits; (4) unsubstantiated assessment of bias in the locations of early timber inventories; and (5) unwarranted assumptions about vegetation patterns as indicators of fire severity | Omitted Rebuttal in Baker et al. [19] | Evidence in H omitted our rebuttal [19], where we showed that Hagmann et al. [18] did not contest Baker and Hanson’s [17] key findings: (1) early two-chain-wide timber inventories, documented to underestimate, are unreliable and were abandoned by the 1930s, (2) comparisons between timber-inventory estimates and other sources showed it is timber inventory estimates that underestimate and need correction, (3) one-chain-wide inventories, if available data are used, could be fairly accurate, and (4) omission of immature conifers and non-conifers may lead to additional underestimation. In response, we revised our estimates of needed correction multipliers to 1.6–2.3. Hagmann et al. [18] still contended that inventories do not have biased placement, but we presented more evidence. |
- Modern and historical validations showing high accuracy of WB method, omitted in H
- Independent multi-proxy evidence of variable density and dense forests, omitted in H
4.1.2. Rebuttals of Critiques of the WB-Method, Omitted in H
- Levine et al. modeling and plot tests shown to be incorrectly coded, omitted in H
- Older point-pattern methods lower accuracy than WB method, rebuttal omitted in H
- WB method has published evidence of scale-matched high accuracy, omitted in H
- Original and rebuttal evidence early timber inventories underestimate, omitted in H
- The fourth entry in H Table 3 is misplaced and belongs in H Table 5
4.1.3. Conclusion—Historically Heterogeneous Tree Density and Dense Forests
4.2. “Misrepresented Fire Regimes” Section in H Omitted More Evidence
4.2.1. Evidence about Low-Severity Fires Omitted/Misinterpreted in H Table 4
| Counter-Evidence | Evaluation of Counter-Evidence | Published Evidence, Essential to Evaluation of Counter-Evidence, That Was Omitted | |||
|---|---|---|---|---|---|
| Citations | Counter-premise | Citations | Implications of evaluation | Citations | Implication of omitted evidence |
| Baker and Ehle [47,48], Ehle and Baker [14], Kou and Baker [49,50], Baker [25,85], Dugan and Baker [51] | Tree-ring reconstructions misrepresent historical fire regimes by overestimating fire frequency and extent because (1) unrecorded fires (e.g., fires that did not scar trees) increase uncertainty of mean fire interval (MFI); (2) interval between pith (origin) and first fire scar should be considered a fire-free interval and included in calculations of MFI; (3) targeted sampling of high scar densities biases MFI; and (4) mean point fire interval (mean of intervals between fire scars weighted by the number of fire scars) may more accurately represent historical fire rotation than MFI (mean between all fire scars) | Collins and Stephens [82] | Unrecorded fires (fire did not scar the tree) may contribute to underestimation, not overestimation, of fire frequency and extent in frequent fire systems. Probability of scarring decreased when intervals between successive fires were short in areas burned by up to four late-20th-century fires. Absence of scar does not indicate absence of fire. | Omitted evidence in Baker ([25] S1 Text) | It is generally agreed that each fire only scars some of the trees. However, with typical scarring fractions, only ~50 trees or ~1 ha need sampling to detect all the fires in a plot. In a sample of 262 reconstruction sites in dry forests of the western USA, 88% sampled ∃1.0 ha. Thus, underestimation from unrecorded fires is likely rare, and absence of a scar in a particular year likely does show lack of fire. A key problem with “composite fire intervals”, the primary source of evidence about historical low-severity fire rates, is the compositing process itself. Compositing makes a single list of all fire years in the plot. This assumes all fires burned the whole plot, which is not true, based on 11 studies [47]. Putting small fires in a single list with large fires reduces the “mean composite fire interval” to a small value, leading to large overestimation of rates of fire. Small fires can be filtered, but filtering is arbitrary, and compositing still destroys the long intervals that were found. |
| Brown and Wu [86], Van Horne and Fulé [81], Brown et al. [83], Stephens et al. [84], Yocum Kent and Fulé [87], Meunier et al. [88] | Including origin-to-first-scar interval erroneously inflates MFI. Not all trees that survive fire are scarred. As an ambiguous indicator of fire-free interval, it should not be included in calculations of MFI. Additionally, tree establishment may not indicate a stand-replacing disturbance in dry forests where regeneration is strongly associated with climate | Omitted evidence in Kou and Baker [49], Polakow and Dunne [89], Moritz et al. [90] Omitted evidence in Dugan and Baker [52] | Fire history data typically have incomplete intervals at the start and end of a period of record. Real but long fire intervals have more chance of appearing at the beginning or end, and getting left out, than do real but short intervals. Thus, censoring the starting or ending incomplete intervals biases the record toward estimates that are too short and have reduced variability [49], as found in two other independent studies [89,90]. There is no citation in the counter-evidence list that assumed tree establishment indicates stand-replacing disturbance in dry forests. Brown and Wu [86] incorrectly assumed that a fire scar before a pulse of tree establishment does not indicate moderate- to high-severity fire [52]. | ||
| Fulé et al. [91] Van Horne and Fulé [81], Farris et al. [15,92], O’Connor et al. [93] | Complete, systematic (gridded), and random sampling at stand, watershed, and mountain range scale have repeatedly demonstrated fire frequencies similar to those derived from targeted sampling within forest types and scales. In direct comparison studies, no evidence was found that targeted sampling of fire-scarred trees biased MFI estimates. Targeted sampling reconstructed fire parameters comparable to those derived from systematic sampling of both a subset of the trees and all trees in a study area and from independent 20th-century fire atlases | Omitted evidence in Baker ([25] S1 Text) | Evidence cited in H in Farris et al. [92] and in Van Horne and Fulé [81] is not correct. Farris et al. instead found that using a targeted sample led to CFI estimates that were shorter (80–96%, comparing targeted and probabilistic sample size corrected in their Table 3) than that from a statistical sample. Van Horne and Fulé found that a targeted ITFI estimate was only 83% (inverse of 1.2 from p. 865) of ITFI from a random sample. These studies thus show that targeted samples produce CFI/ITFI estimates that are shorter than estimates from random samples. | ||
| Farris et al. [15] Huffman et al. [94] | Rather than overestimating fire frequency as suggested in counter-premise papers, MFI may underestimate fire frequency, especially where small fires were abundant | Omitted evidence in Baker [25] | MFI as used in H is just composite fire interval (CFI), which has the well-established property of producing estimates that are too short relative to fire rotation, the gold standard, as shown in this monograph on this topic, which was omitted in H | ||
| Van Horne and Fulé [81] Farris et al. [92] | Composite mean fire intervals (CMFI, e.g., fires recorded on 25% of samples) are relatively stable across changes in sample area or size. See the section on “Underestimated historical fire frequency” for a more detailed summary of CMFI and the highly problematic and inherently biased alternatives proposed in counter-evidence publications | Omitted evidence in Baker [25] | CFI estimates do vary with sample size, but they also definitely produce estimates that are too short relative to fire rotation, the gold standard, as shown in this monograph on this topic, which was omitted in H | ||
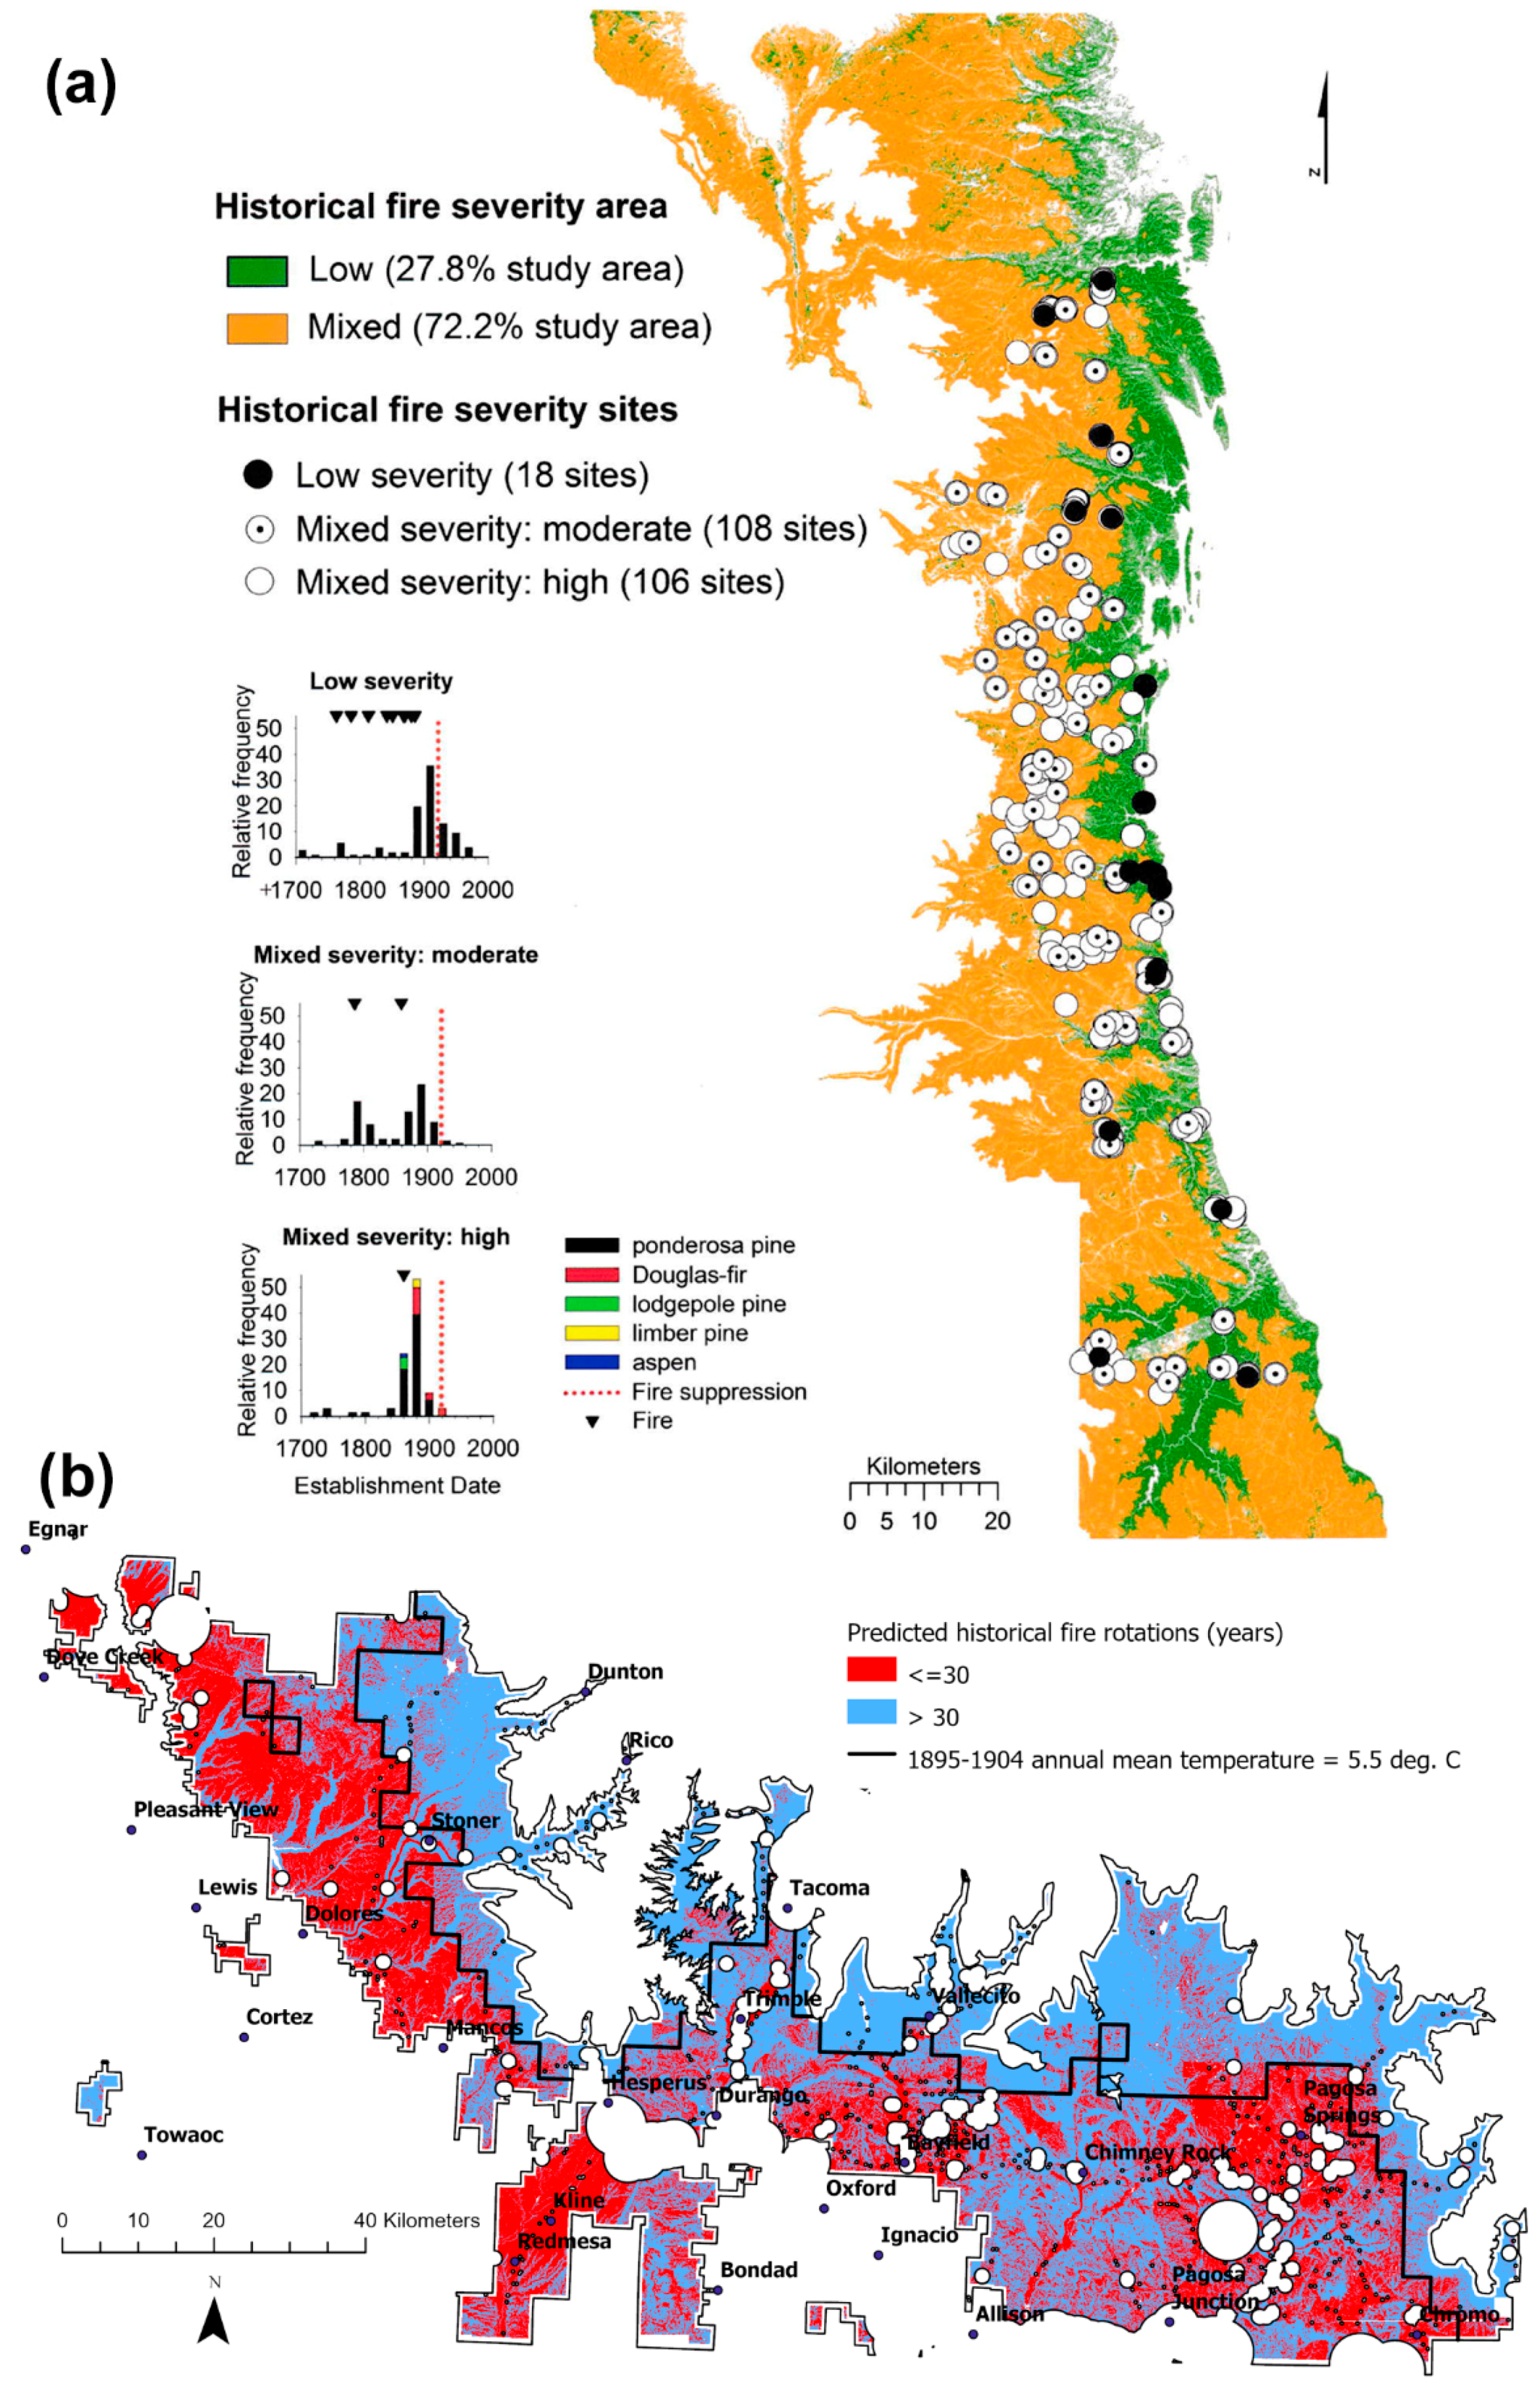
4.2.2. Evidence about Historical Fire Severity Omitted/Misinterpreted in H Table 5
- Published validations of the WB-method fire-severity reconstructions vs. independent multi-proxy sources in both modern and historical forests, omitted in H
- Abundant independent, multi-proxy evidence of historically severe fires, including tree-ring reconstructions and evidence in H’s own publications, omitted in H
“W&B also fail to acknowledge the lack of contemporary evidence for large, patch-size crown fires in low- and mid-elevation dry forest landscapes, such as primary observation or photographic documentation in the 19th and early 20th centuries. The lack of direct documentary evidence of extensive crown fire in ponderosa pine forests in particular has been noted and reported repeatedly by ecologists and land-use historians for nearly 90 years…”.[80] (p. 826)
- Incorrect use of fire scars and age structures omits role of historically severe fires in H
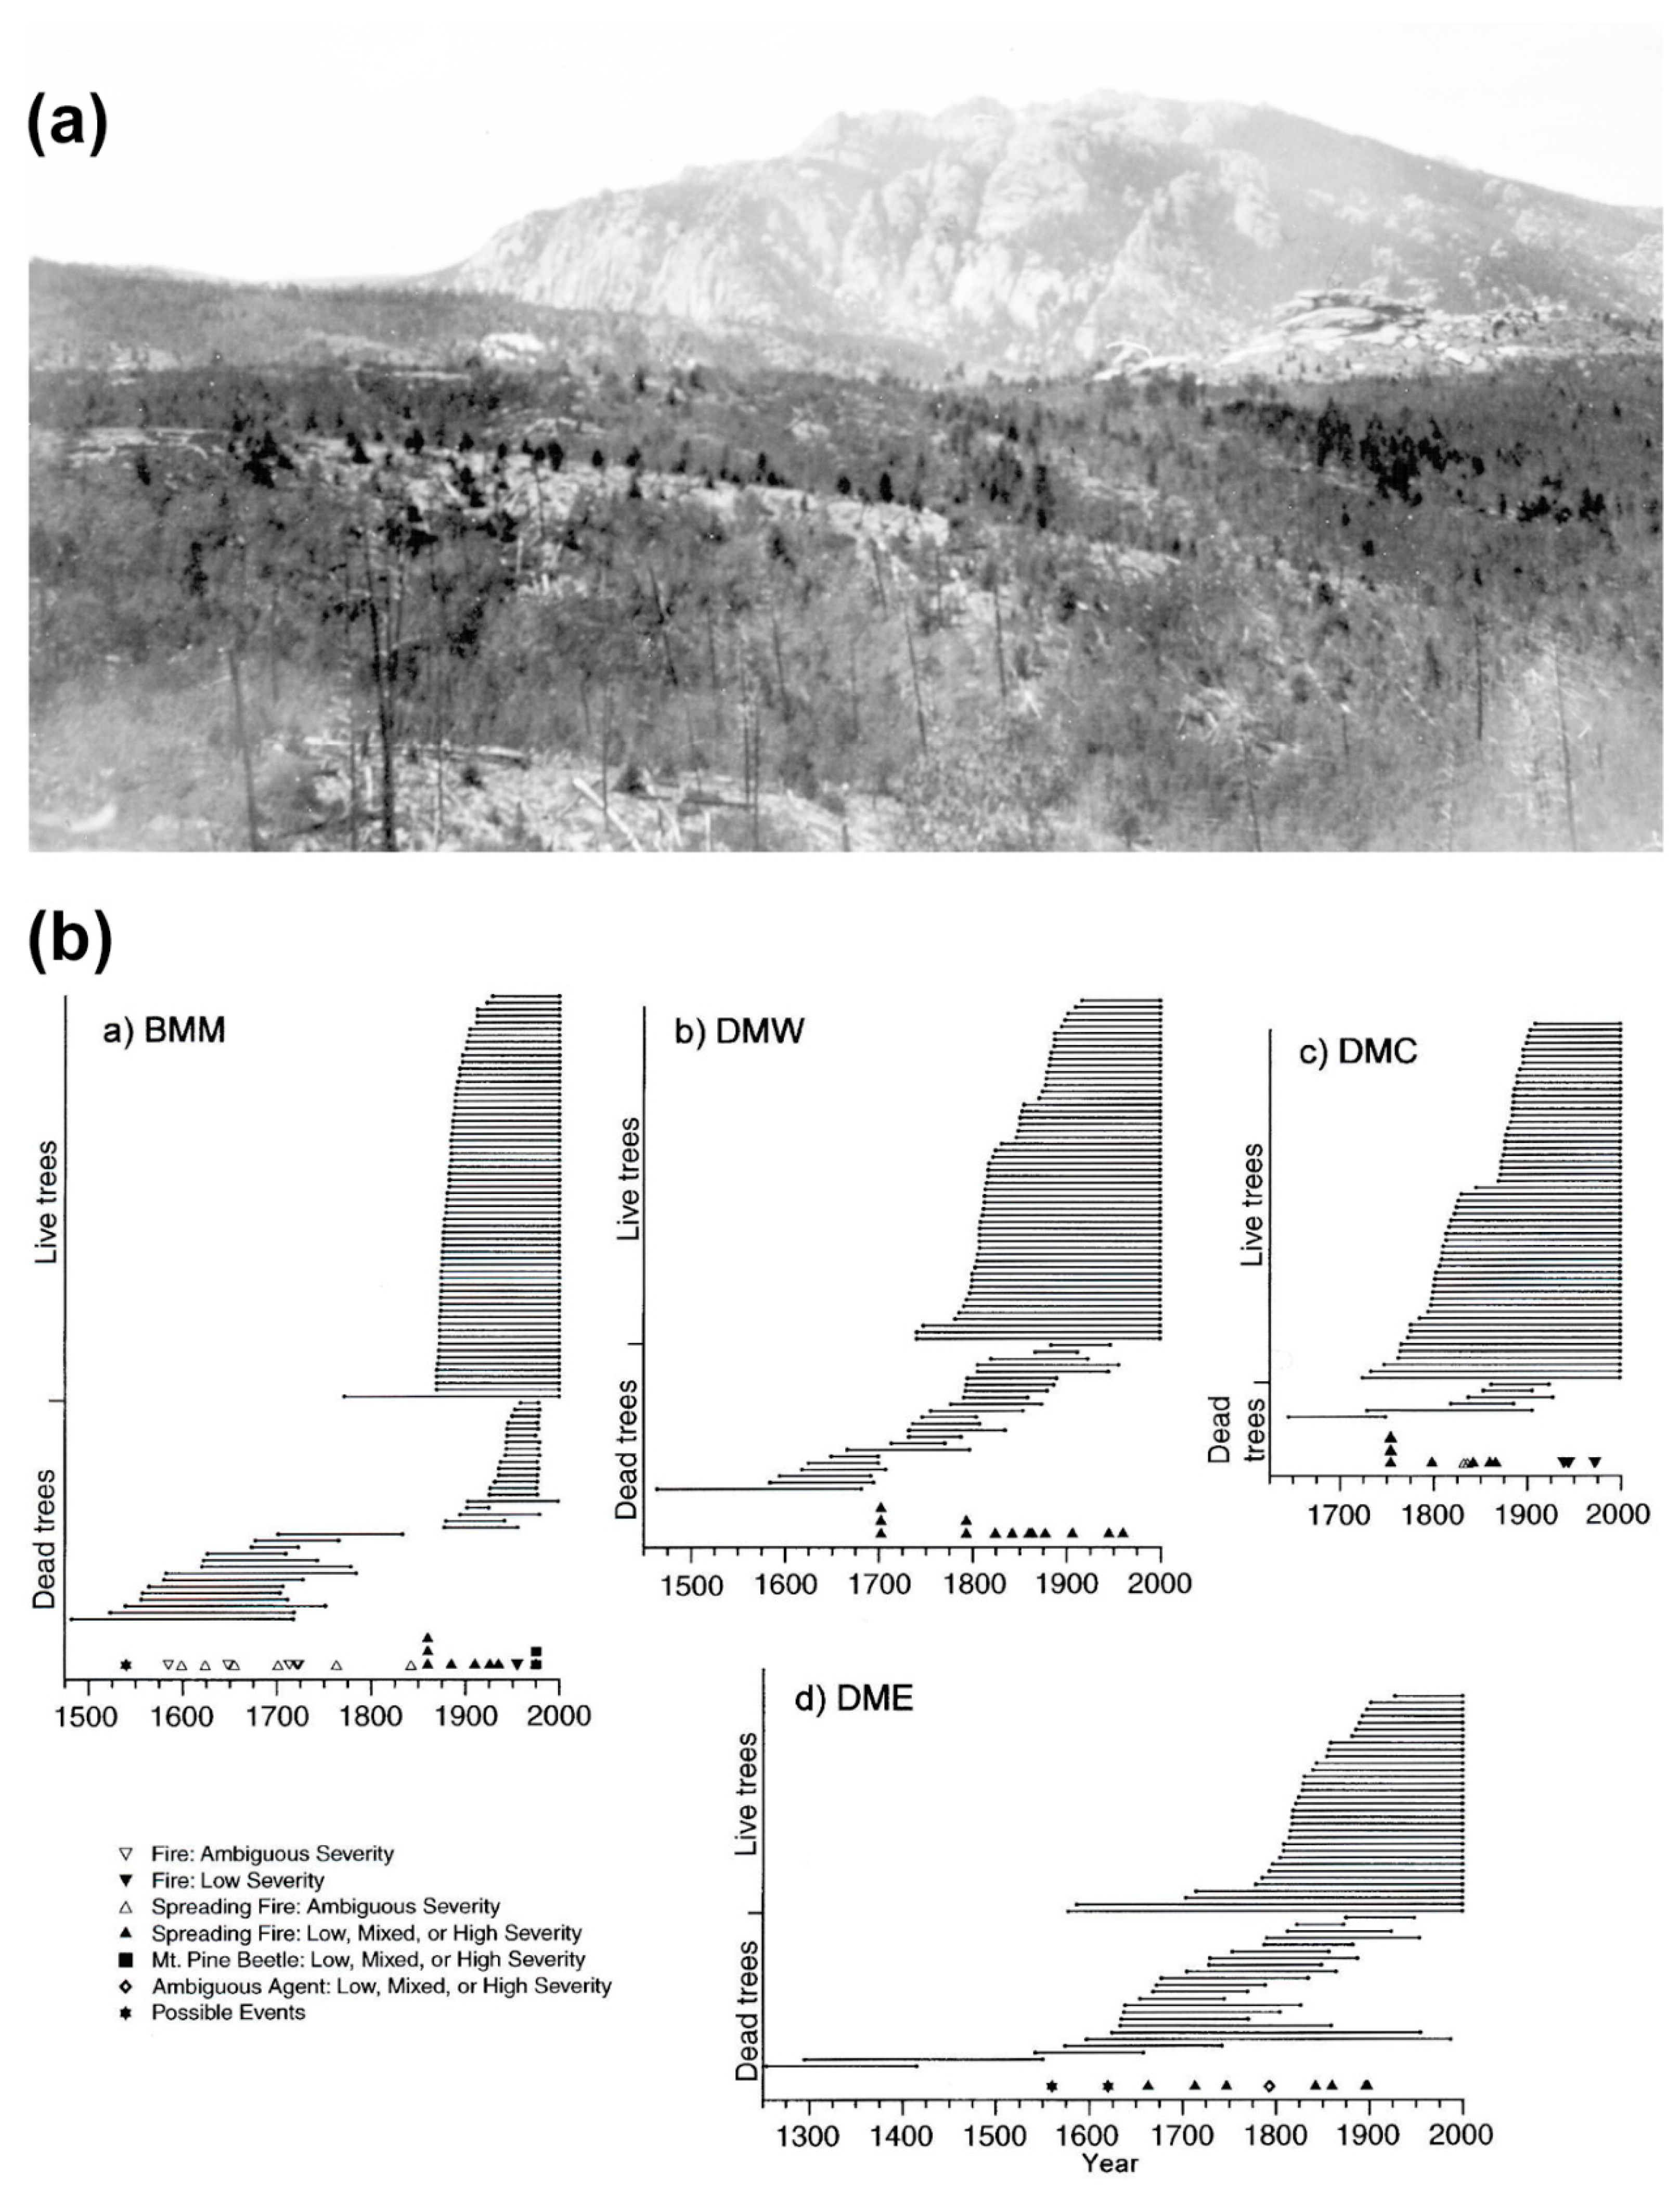
“Permutation analysis showed that mortality-inducing influences of fire and drought played the primary role in initiating pulses as they occurred first for 90% of pulses, significantly more than expected…drought was the most important single initiator…as the first influence for 65% of pulses. Mixed-severity fire was the initial influence for 30% of fires…none of the 20 pulses had a pluvial influence alone”.[52] (p. 704)
| Counter-Evidence | Evaluation of Counter-Evidence | Omitted Rebuttals and Other Published Evidence also Essential to Evaluation of Counter-Evidence | |||
|---|---|---|---|---|---|
| Citations | Counter-premise | Citations | Implications of evaluation | Citations | Implication of omitted evidence |
| Shinneman and Baker [10] | Based on early forest inventory age datasets, “nonequilibrium” areas of extensive, high-severity fires in the Black Hills led to landscapes dominated by dense, closed-canopy forests | Brown [108] | Tree-ring reconstructions of ponderosa pine forest age structures and fire regimes across the Black Hills found synchronous regional tree recruitment largely in response to pluvials and longer intervals between surface fires, especially during the late 1700s/early 1800s, which is when early inventory data report similar patterns of recruitment. No evidence of crown fires was found in relation to past fire dates | Omitted evidence in Brown [108], Dugan and Baker (52] | Brown [108] said “… dense stands were still present at settlement…, and likely contributed to extensive patches of crown fire noted by early explorers and scientists during the late 1800s (Dodge 1965, Graves 1899)” (p. 2509). This is entirely consistent with early reports of severe fires across the Black Hills by Graves and Dodge [10]. However, Brown [108] (p. 2507) also interpreted “abundant synchronous tree recruitment” as caused by climate forcing (e.g., wet periods), without excluding these high-severity fires as also a cause. The lack of control of this potentially confounded causative variable leaves Brown’s conclusion invalid. A test of Brown’s conclusion at the Grand Canyon did not support his findings [52]. |
| Baker et al. [35] | Most ponderosa pine forests in the Rocky Mountains were capable of supporting high-severity crown fires as well as low-severity surface fires | Brown et al. [83] | Tree-ring reconstruction of ponderosa pine forests in the Black Hills of South Dakota (included in Baker et al., 2007) demonstrated that roughly 3.3% of the study area burned as crown fire between 1529 and 1893; however, tree density in most stands in 1870 could not have supported crown fire | Omitted evidence in Baker [25], Baker et al. [35] | This review [25] emphasized that the historical fire regime in the Rocky Mountains included variable fire severities with some areas having mostly low severity in old-growth forests. The 517 ha Mount Rushmore area of [83] is consistent with this review. Additionally, old growth inherently exists because it lacked high-severity fire for long periods, so it is impossible to draw valid conclusions about larger land areas from these old forests, since they are not random samples of larger land areas [25]. |
| Williams and Baker [24], Baker [28,29] | Fire severity inferred from tree density by size class estimated from GLO bearing trees [41] and surveyors’ descriptions suggests low-severity fire dominated only a minority of ponderosa and mixed-conifer forests | Levine et al. [61,62] | Plotless density estimator used by Williams and Baker [41] overestimated known tree densities due to a scaling factor that does not correct for the number of trees sampled and therefore systematically underestimates the area per tree relationship | Omitted Rebuttals by Baker and Williams [34,63] | Levine et al. [61] incorrectly coded and applied the WB method, producing erroneous results that had no bearing on the WB method. Levine et al. [62] corrected their flawed 2017 code [61] but then used incorrect equations. Baker and Williams [63] used corrected equations with their code at their sites and showed that the WB method worked well and that both Levine et al. studies are fatally flawed. |
| Fulé et al. [80], Merschel et al. [97], O’Connor et al. [109] | Substantial errors of method and interpretation invalidate inferences about historical fire severity. These include the fact that (1) tree size is an ambiguous indicator of tree age; (2) tree regeneration is an ambiguous indicator of disturbance severity, particularly in dry forests where climate conditions strongly influence regeneration; and (3) lack of direct documentary evidence (e.g., primary observation) of extensive crown fire in historical ponderosa pine forests has been widely noted for nearly 90 yr. | Omitted Rebuttal in Williams and Baker [79], Omitted evidence in Baker [4,25,28,29] | Williams and Baker [79] showed that Fulé et al. [80] mistook the WB method, misquoted WB, misused evidence, and created three new false narratives. Merschel et al. [97] did not contest the WB method but said there were no reports of high-severity fires in the late 1800s, even though direct reports of them were extensively quoted by Baker [28,29]. O’Connor et al.’s. study [109] has no bearing on the WB method. Extensive evidence of crown fires in historical ponderosa pine forests is widely published and reviewed in [4] and the text here. Baker [25] also showed, using tree-ring reconstructions, that low-severity fire was the primary severity across only ~34% of historical dry forests, mostly in the Southwest. | ||
| Stephens et al. [73], Huffman et al. [94], Miller and Safford [110], Hagmann et al. [54] | Multi-proxy records documented substantially lower levels of high-severity fire in ponderosa and Jeffrey pine and mixed-conifer forests in overlapping study areas | Omitted evidence in Baker and Hanson [17] and Baker [29] | Baker and Hanson [17] showed that Stephens et al.’s lower estimate is because they omitted timber inventory documents that recorded high-severity fires. Huffman et al.’s study does not overlap our study area. Miller and Safford repeated critiques we already refuted (see above). However, GLO reconstructions identify fires before the mining era, and their finding of few trees at low elevations today likely is due to loss of low-elevation forests. Hagmann et al.’s [54] estimate of 6% high-severity fire is similar to that of Baker [29] of 8.9% historically. | ||
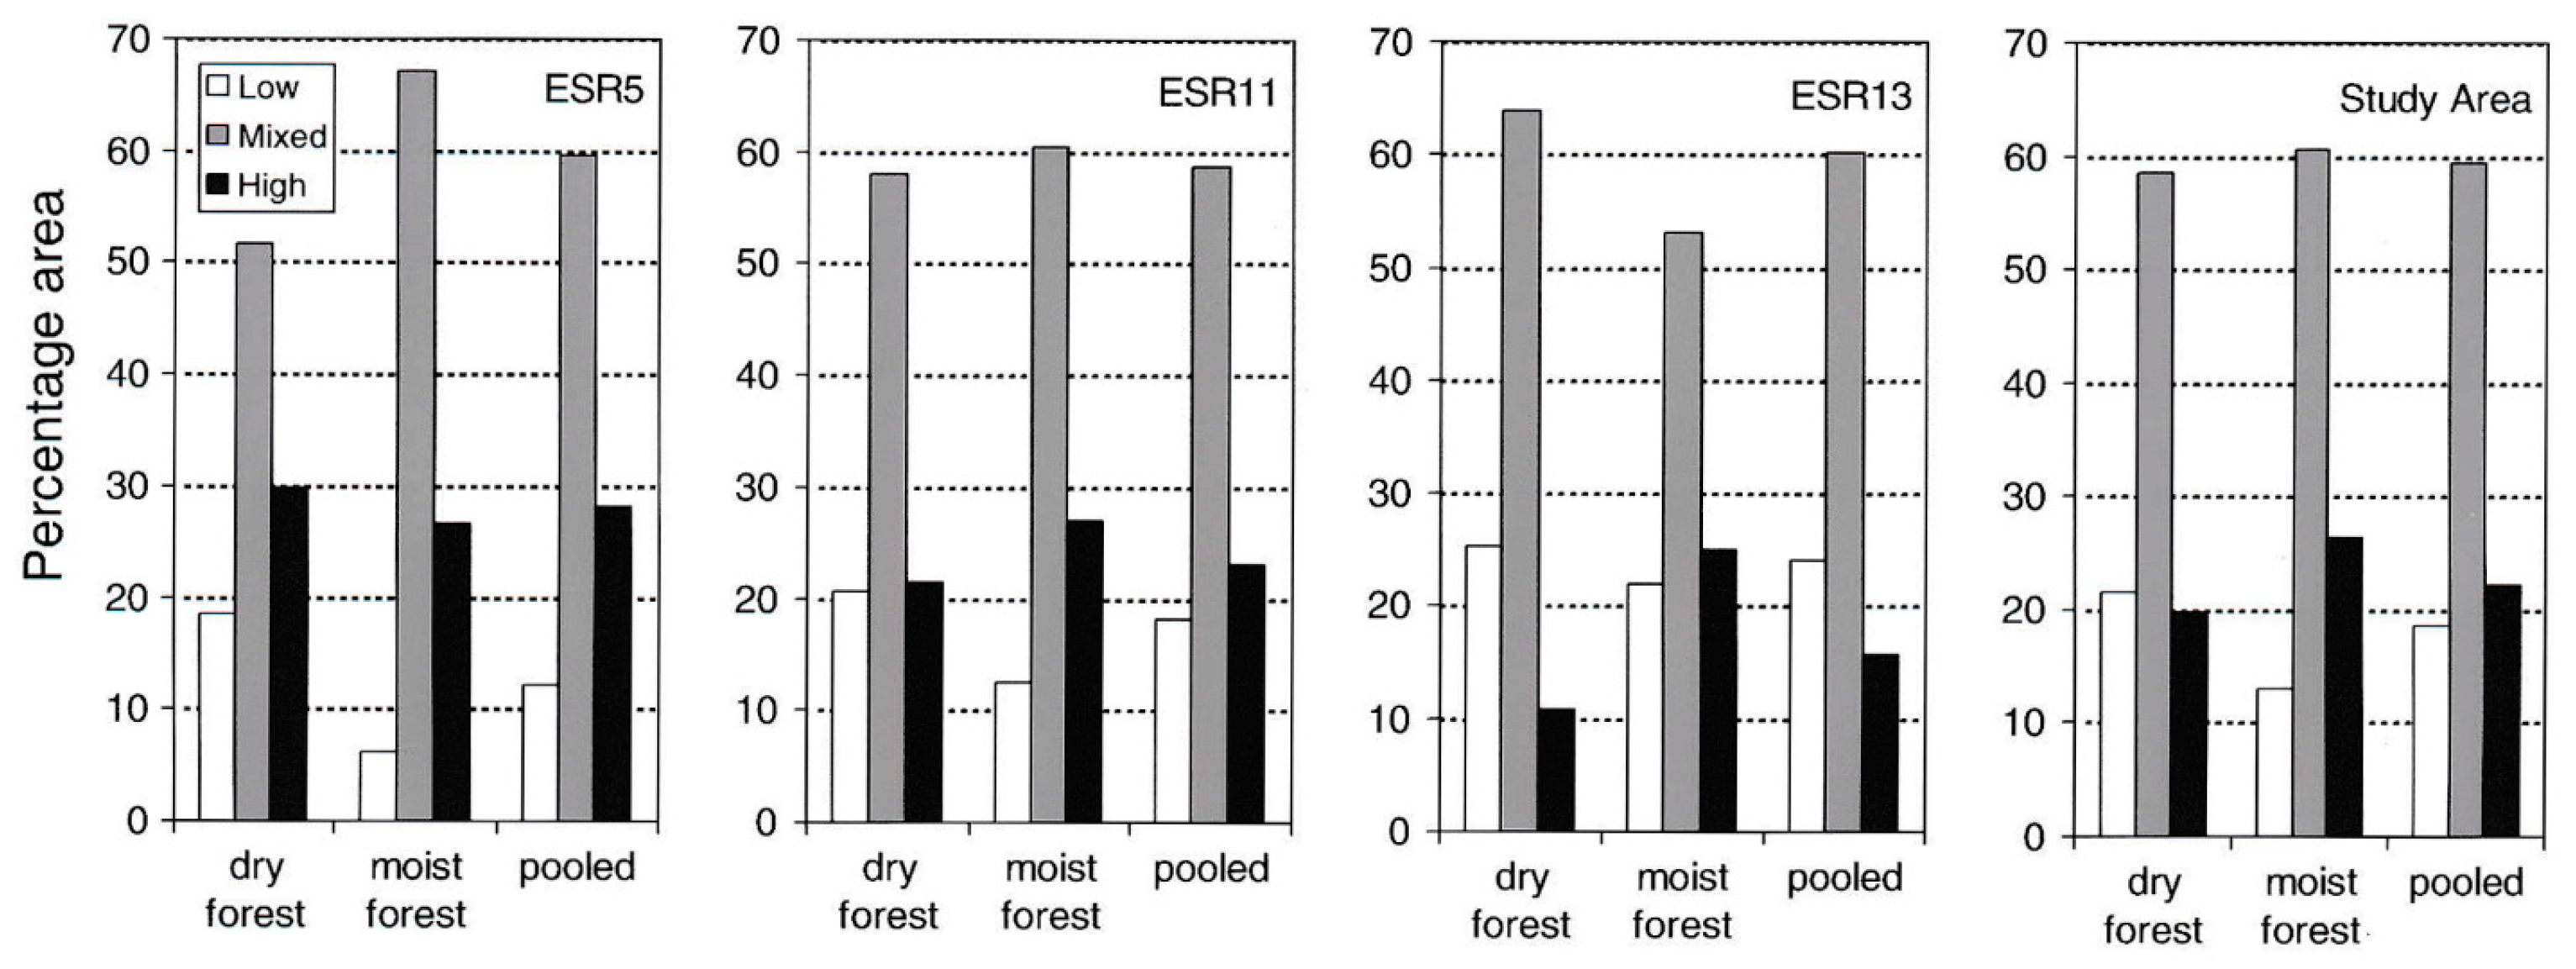
| Baker [29], Baker and Hanson [17] | Estimates of area burned at high severity by Hessburg et al. [11] validate estimates derived using Williams and Baker [41] methods Note: [17] Baker and Hanson 2017 did not belong here, as it has nothing to do with the Hessburg et al. matter, so it was not defended | Hagmann et al. [18], Spies et al. [111] | Inappropriate comparisons are not validation. Baker [29] limited assessment of high-severity fire to tree mortality in dry forests whereas Hessburg et al. [11] estimated high-severity fire in the dominant cover type whether that be grass or tree for “moist and cold forest” type, with lesser amounts of dry forests | Omitted and incorrect evidence in Hessburg et al. [11] | This argument is incorrect. Hessburg et al.’s Table 2 shows that specifically in forest cover types (not grass, shrub), their pooled forest percentages in ESR5 were 20.7% low, 55.0% moderate, and 24.3% high, which are even more similar to the Baker [29] estimates of 18.1% low, 59.9% moderate, and 23.0% high. Hessburg et al. Figure 4 also shows that ponderosa and Douglas-fir cover types had a mean of about 18% low, 59% moderate and 23% high, almost identical to the Baker [29] estimates. |
| Odion et al. [12] | Modern, high-severity crown fires are within historical range of variation. Inferred fire severity from current tree-age data for unmanaged forests in the U.S. Forest Service Inventory and Analysis (FIA) program. Compared inferences about modern fire severity to estimates of historical forest conditions and fire severity inferred using Williams and Baker [41] methods | Fulé et al. [80], Levine et al. [61,62], Knight et al. [64] | Overestimation of historical tree density and unsupported inferences of fire severity from GLO records weaken conclusions based on Williams and Baker [41] methods | Omitted Rebuttals in Williams and Baker [79], Baker and Williams [34,63] | Fulé et al. [80] mistook the WB method, misquoted publications, misused evidence, and created three new false narratives [79]. Levine et al. incorrectly coded the WB method [61], then used incorrect equations [62], and both are fatally flawed. Knight et al. did not use or test the WB method and has no relevance. |
| Stevens et al. [96] | Substantial errors of method and interpretation invalidate inferences about historical fire severity. These include (1) FIA stand age variable does not reflect the large range of individual tree ages in the FIA plots and (2) recruitment events are not necessarily related to high-severity fire occurrence | Omitted rebuttal in Odion et al. [95] | With same definition of high-severity fire, there was 68% agreement between these two studies; 3/4 of evidence of historical high-severity fire not from FIA data and not disputed; Stevens et al. agreed “High-severity fire was undoubtedly a component of fire regimes in ponderosa pine and drier mixed-conifer forests” | ||
| Spies et al. [111] | In contradiction of the counter-premise, Odion et al. [12] documented only three patches of high-severity fire larger than >1000 ha in OR and WA in the early 1900s, which account for 1% of the area of historical low-severity fire regime managed under the Northwest Forest Plan | Omitted rebuttal in Odion et al. [95]; Omitted evidence in DellaSala and Hanson [112,113] | Two sources in omitted 2015 paper, reviewed in the omitted Odion et al. [95] paper, found high-severity patches ∃14,000 ha in OR and WA, two others [112,113] found many large patches in OR and WA; numerous other large patches > 1000 ha reported in OR and WA in omitted [113] paper. | ||
| Baker and Hanson [17] | Stephens et al. [73] underrepresented the historical extent of high-severity fire in their interpretation of surveyor notes in early timber inventory. Note: because they omitted key records of high-severity fire that were readily available in the inventory records. | Hagmann et al. [18] | Substantial errors of method and interpretation invalidate inferences about the historical extent of high-severity fire. Inferences were based on (1) inappropriate assumptions about the size and abundance of small trees given the ambiguity of data describing small trees in the 1911 inventory, (2) averaging of values derived from different areas and vegetation classifications, and (3) inappropriate assumptions that the presence of chaparral (common on sites with thin soils and high solar radiation) indicates high-severity fire | Omitted rebuttal in Baker et al. [19] | Hagmann et al. [18] did not dispute that Stephens et al. [73] had omitted most trees, and when omitted trees were included, forests were 7–17 times as dense as they reported, and they also did not dispute the abundant data, from numerous historical sources, showing occurrence of substantial high-severity fire patches, small and large, including chaparral, presented in Baker and Hanson [17] |
- Evidence historical forests, in general, lacked high-severity fires, falsely based on tree-ring reconstructions of fire targeted in old growth, where high severity is inherently rare
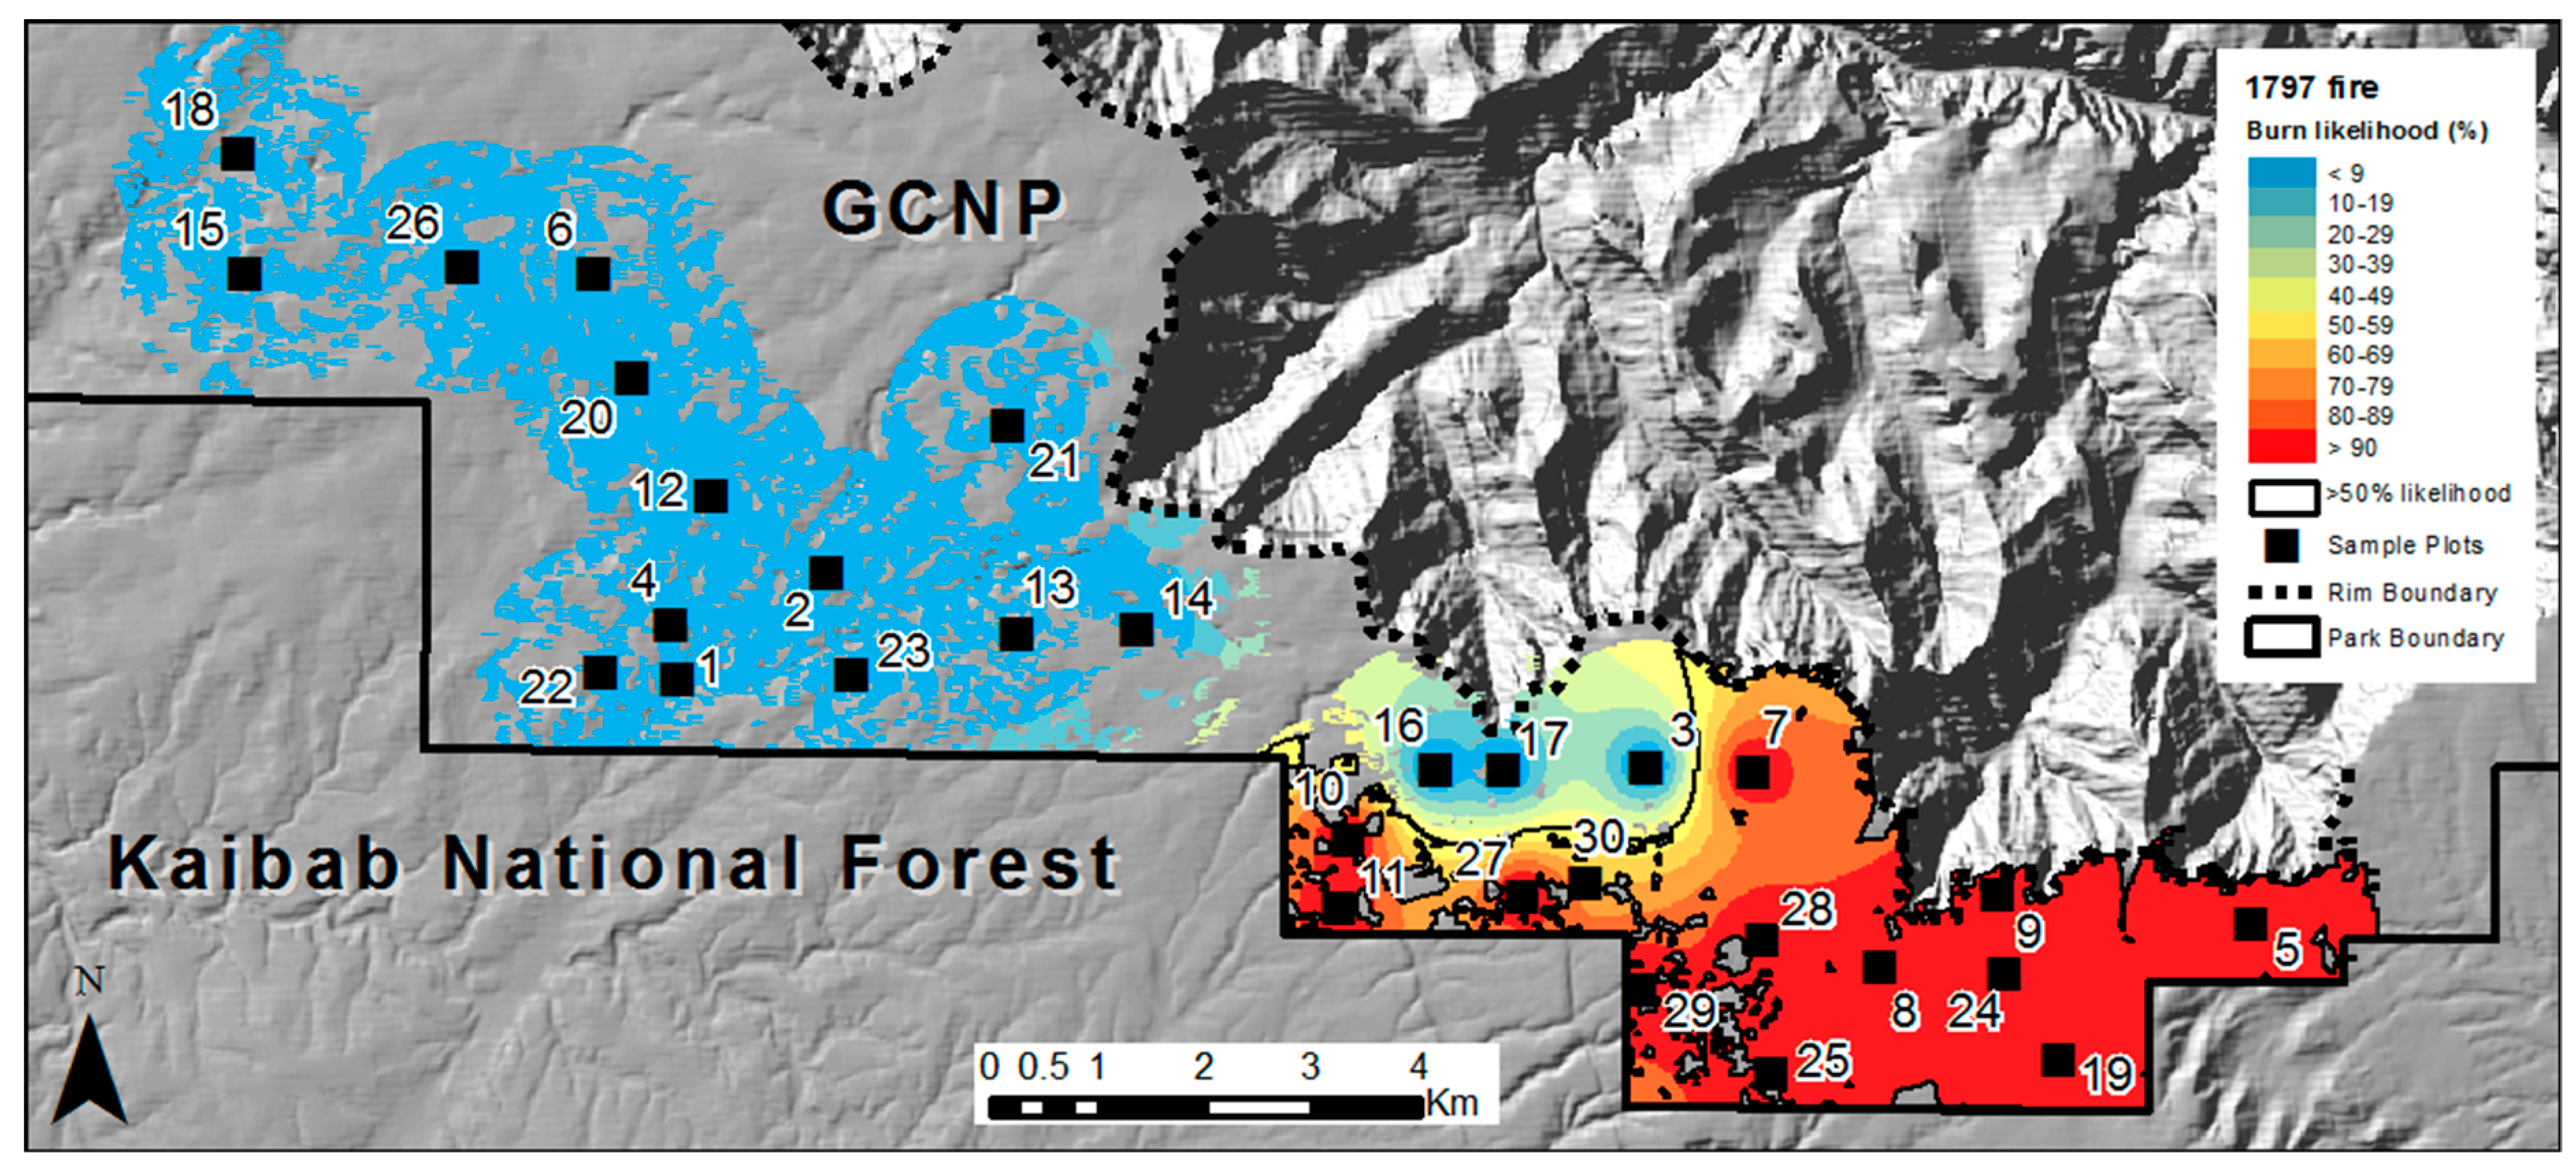
“We found no fire-scarred samples on the kipukas in the northern and eastern portions of the malpais, and found few samples in the southern portions. These areas contained ponderosa forests that appeared younger than elsewhere, perhaps due to more recent, intense stand-replacing fires…”.[114] (p. 136)
- Rebuttal/new evidence of historically large high-severity fire patches, omitted in H
4.2.3. Evidence about Recent Fire Severity Omitted/Misinterpreted in H Table 6
| Counter-Evidence | Evaluation of Counter-Evidence | Omitted Rebuttals and Other Published Evidence also Essential to Evaluation of Counter-Evidence | |||
|---|---|---|---|---|---|
| Citations | Counter-premise | Citations | Implications of evaluation | Citations | Implication of omitted evidence |
| Odion and Hanson [115] | High-severity fire was rare in recent fires in the Sierra Nevada based on analysis of Burned Area Emergency Response (BAER) soil burn severity maps | Safford et al. [116] | BAER maps greatly underestimate stand-replacing fire area and heterogeneity in burn severity for vegetation. BAER maps are soil burn-severity maps, not vegetation burn-severity maps. | Omitted rebuttal in Odion and Hanson [117] | Safford et al. [116] arbitrarily combined two time-since-fire categories, creating slightly higher fire severity in long unburned forests. Odion and Hanson [117] used all categories and found similar or lower fire severity in long unburned forests. |
| Hanson et al. [119] | Change in conservation strategies for northern spotted owl (NSO) were unwarranted due to overestimation of high-severity fire in the NSO recovery plan | Spies et al. [118] | Use of a higher relative delta normalized burn ratio (RdNBR) threshold substantially increased misclassification errors and reduced estimates of high-severity fire extent. Hanson et al. [120] used an RdNBR threshold of 798 rather than 574 as recommended in the literature in Miller et al. [130] they cited as the source of the threshold used | Omitted rebuttal in Hanson et al. [120] | Spies et al. [118] had cited evidence with a math error and incorrect anecdotal evidence to conclude high-severity fire was outpacing old-forest recruitment but did not dispute these and then tried a broader high-severity fire definition. Hanson et al. [120], however, showed this new definition still led to old-forest recruitment outpacing high-severity fire by 7–29 times |
| Williams and Baker [24] | Severity distributions in recent fires do not depart from historical | Steel et al. [121], Guiternam et al. [127], Reilly et al. [56], Steel et al. [125] | Extent and spatial patterns of fire severity in some recent fires have departed from pre-fire exclusion range of variation for some forest types | Omitted evidence in Odion et al. [122], Hanson and Odion [126,129], Della-Sala and Hanson [113], and many others (see text) | Steel et al. [121] based historical high-severity proportions on only a theoretical model. Guiterman et al. [127] was from only one 38 ha patch, with little inferential power. Reilly et al. [56] found no trend in high-severity proportion and more large, high-severity patches, but H omitted the study by DellaSala and Hanson [113] who found no such increase over the last two decades. Steel et al. [125] used a database that Hanson and Odion [126] showed can produce false trends. |
| Hanson and Odion [129] | Previous assessments overestimate extent of high-severity fire in modern fires | Safford et al. [128] | Use of coarse-scale, highly inaccurate, and geographically misregistered vegetation map and averaging across unrelated vegetation types and diverse ownerships undermine confidence in Hanson and Odion [129] | Omitted rebuttal in Hanson and Odion [126] | Hanson and Odion [126] re-analyzed Safford et al.’s [128] initial data, using new methods that Safford et al. proposed, and found Hanson and Odion’s [129] initial conclusions were robust to re-analysis using Safford et al.’s [128] proposed new methods. |
4.2.4. Conclusions—Abundant Multi-Proxy Evidence of Historical Moderate- to High-Severity Fires, including in Their Own Publications, Omitted in H
“Low-severity fires and equilibrium dynamics likely occurred in eastern Washington dry forests, where they fostered fire tolerant, park-like pine stands, however, these dynamics were perhaps ephemeral in nature, lasting one or more centuries at a location, and then switching concordant with regional climate forcing to non-equilibrium states”.
| Study Area | Source | Tree Diam. Recorded (cm) | Trees Recorded | Reported Tree Density (Trees/ha) | Corrected Tree Density (Trees/ha) | Estimated Conifer Plus Hardwood Tree Density (Trees/ha) |
|---|---|---|---|---|---|---|
| Two-chain-wide timber inventories that underestimate tree density by 16–2.3 times (Baker et al., 2018 [19]) | ||||||
| E. Ore. Cascades-N | Hagmann et al. [70] | 15.0+ | Main conifers | 66 | 106–152 a | 106–152 a |
| E. Ore. Cascades-S | Hagmann et al. [69] | 15.0+ | Main conifers | 65 | 104–150 a | 106–152 a |
| E. Ore. Cascades-S | Hagmann et al. [71] | 15.0+ | Main conifers | 68 | 109–156 a | 109–156 a |
| S. California Sierra | Collins et al. [131] | 15.2+ | Only conifers | 44–52 | 70–120 a | 90–155 b |
| S. California Sierra | Collins et al. [72] | 15.2+ | Only conifers | 48 | 77–110 a | 99–142 b |
| S. California Sierra | Scholl & Taylor [132] | 15.2+ | All trees | 99 | 158–228 a | 158–228 a |
| One-chain-wide timber inventory not known to underestimate tree density at this time (Baker et al., 2018 [19]) | ||||||
| S. California Sierra | Stephens et al. [73] | 30.5 | Only conifers | 55 | 244 c | 498 d |
5. Conclusions and Implications of False and Omitted Evidence in H
5.1. All Evidence Not Supporting the Low-Severity Model Omitted in H, Leaving Falsified Science
| Omitted Rebuttal | Article Rebutted | Rebuttal Summarized in Table(s) |
|---|---|---|
| Baker and Williams [34] | Levine et al. [61] | Table 3 and Table 5 |
| Baker and Williams [63] | Levine et al. [62] | Table 3 and Table 5 |
| Baker and Williams [63] | Johnston et al. [65] | Table 3 |
| Baker et al. [19] | Hagmann et al. [18] | Table 3 and Table 5 |
| Hanson and Odion [78] | Collins et al. [77] | Table 3 |
| Williams and Baker [79] | Fulé et al. [80] | Table 5 |
| Odion et al. [95] | Stevens et al. [96] | Table 5 |
| Odion and Hanson [117] | Safford et al. [116] | Table 6 |
| Hanson et al. [120] | Spies et al. [118] | Table 6 |
| Hanson and Odion [126] | Safford et al. [128] | Table 6 |
| Omitted Evidence in These Sources | Evidence Omitted in H |
|---|---|
| Williams and Baker [40] | Omitted all evidence showing low bias and error in land-survey records. |
| Williams and Baker [41] | Omitted all evidence of validations of the WB method. |
| Williams and Baker [24] | Omitted all evidence of validations of the WB method and evidence of historically variable tree density and fire severity in dry forests in Arizona, Colorado, and Oregon. |
| Williams and Baker [31] | Omitted all direct evidence of extensive moderate- to high-severity fire in historical dry forests in the Colorado Front Range, evidence validating the WB method of reconstructing historical moderate- to high-severity fires, and evidence of very large high-severity fire patches (up to 8331 ha). |
| Baker and Williams [34] | Omitted all evidence of validations of the WB method and all evidence of historically variable tree density and fire severity documented in multiple historical sources cited in this paper. |
| Baker et al. [35] | Omitted all evidence from tree-ring reconstructions, forest-reserve reports, and other early scientific reports showing that historical dry forests in the Rocky Mountains had tree densities varying from 17 to 19,760 trees/ha. |
| Baker [29] | Omitted quotes from early forest-reserve reports and other early scientific reports showing that historical dry forests in the eastern Cascades of Oregon had variable tree density as well as many direct reports of moderate- to high-severity fire. |
| Baker [28] | Omitted 47 quotes from early forest-reserve reports and other early scientific reports documenting that Sierran mixed-conifer forests were highly variable in tree density, but typically dense, and omitted numerous early reports of extensive moderate- to high-severity fire in historical Sierran mixed-conifer forests. Omitted 208 quotes from early forest reserve reports and other early scientific reports that documented historical moderate- to high-severity fires in Sierran mixed-conifer forests. Omitted evidence of high-severity fire patches commonly > 250 ha and up to 9400 ha in area. |
| Baker [25] | Omitted all evidence in this monograph analyzing why old CFI-based estimates of historical rates of fire are too short, why moderate- to high-severity fires were seldom found using these old methods, and how these old estimates can be corrected to accurately estimate fire history. |
| Farris et al. [15], Dugan and Baker [52] | Omitted any mention of the development of new landscape-scale methods of conducting fire history studies that overcome the limitations of earlier CFI-based fire history studies that H cite. |
| Hessburg et al. [11] | Omitted evidence of severe fires in northwestern dry forests; even though Hessburg is an author of H, and also authored this publication, H did not review its evidence. Hessburg et al. studied 303,156 ha in E. OR and E. WA and found “widespread evidence of partial stand and stand-replacing fire” [11] (p. 5) in mixed-conifer forests. |
| Baker [45] | Omitted evidence in six early photographs of the aftermath of severe fires in dry forests in the Rocky Mountains. |
| Baker [32,33,44] | Omitted evidence that documented that large moderate- to high-severity fires occurred in the late 1800s in dry forests on the Uncompahgre Plateau and in the San Juan Mountains, Colorado, based on forest atlases, land survey records, early photographs, early scientific publications, and other early records, including newspaper reports. |
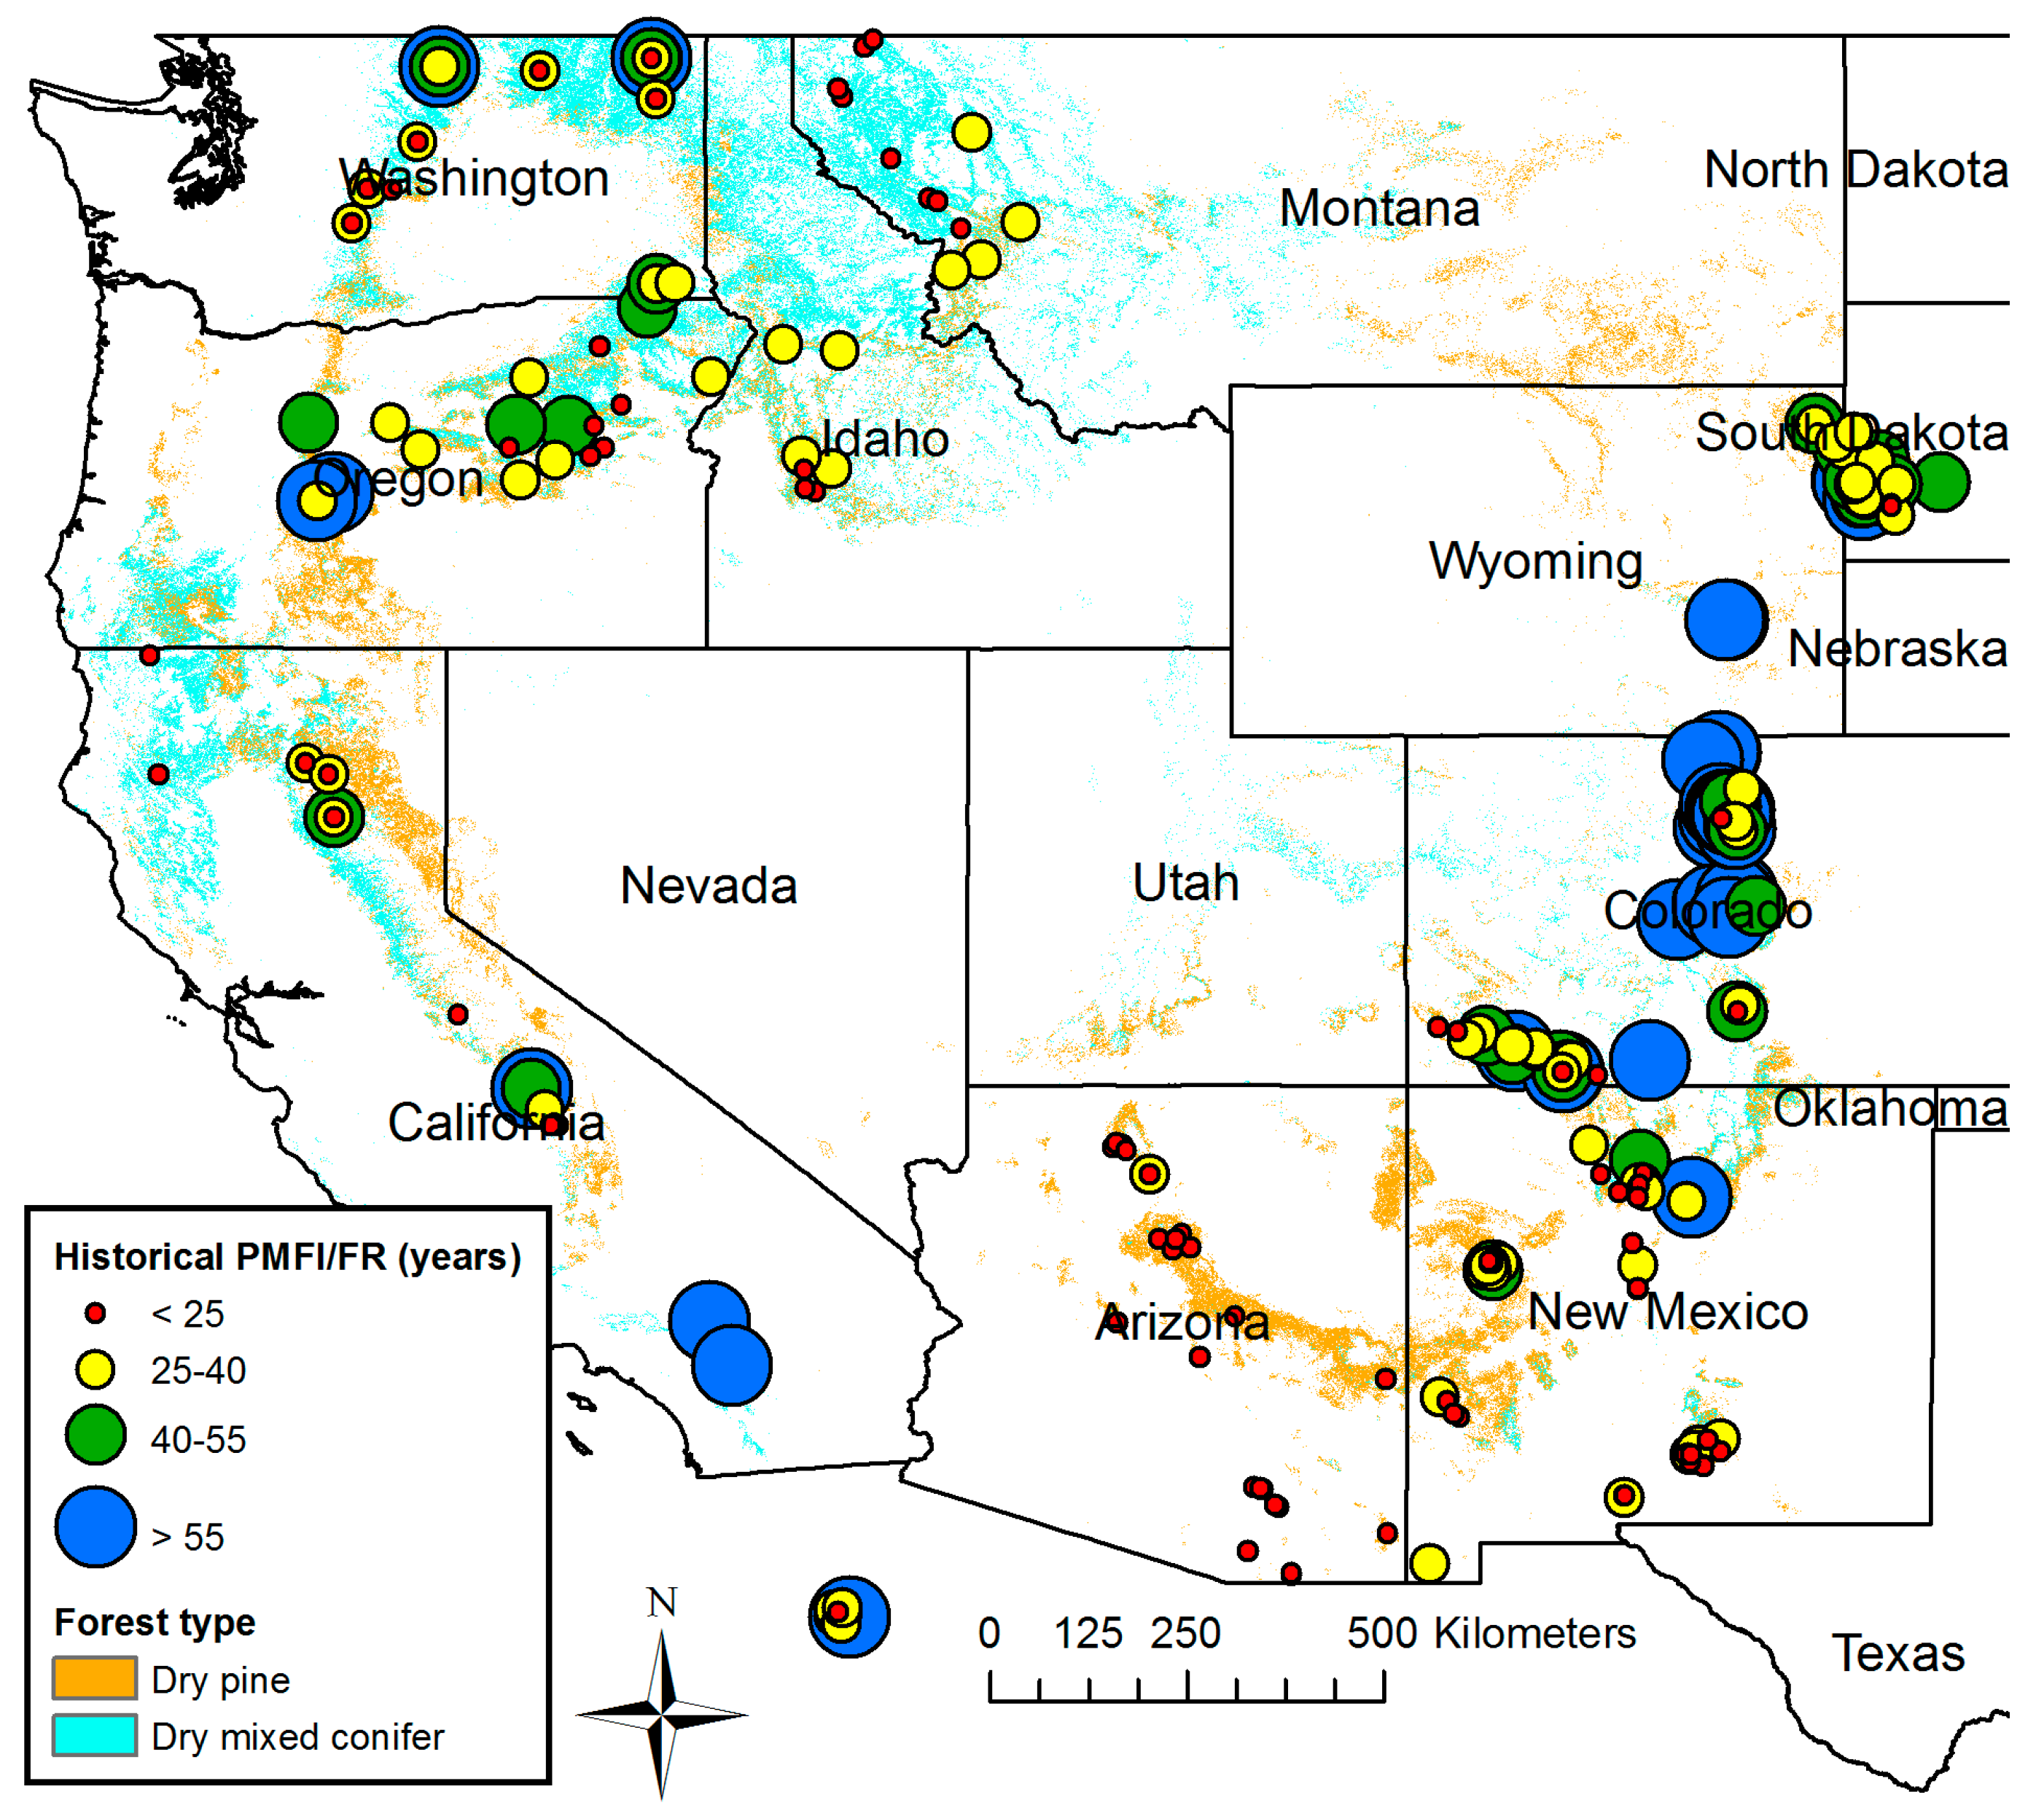
| Pierce et al. [36], Pierce and Meyer [37], Long et al. [103], Fitch [104], Jenkins et al. [105], Bigio [106], Colombaroli and Gavin [107] | Omitted evidence in these paleo-charcoal studies from Arizona, Colorado, Idaho, New Mexico, and Oregon that infrequent moderate- to high-severity fires occurred historically in western USA dry forests. |
| DellaSala and Hanson [112,113] | Omitted evidence of numerous large historical high-severity fire patches in OR, WA, CA, and other parts of the western USA |
5.2. After Correcting False and Omitted Evidence in H, What Are Key Findings?
5.3. Implications and Outlook
Author Contributions
Funding
Institutional Review Board Statement
Informed Consent Statement
Data Availability Statement
Acknowledgments
Conflicts of Interest
References
- Abatzoglou, J.T.; Williams, A.P. Impact of anthropogenic climate change on wildfire across western US forests. Proc. Natl. Acad. Sci. USA 2016, 113, 11770–11775. [Google Scholar] [CrossRef] [PubMed] [Green Version]
- Caggiano, M.D.; Hawbaker, T.J.; Gannon, B.M.; Hoffman, C.M. Building loss in WUI disasters: Evaluating the core components of the wildland-urban interface definition. Fire 2020, 3, 73. [Google Scholar] [CrossRef]
- Hagmann, R.K.; Hessburg, P.F.; Prichard, S.J.; Povak, N.A.; Brown, P.M.; Ful, P.Z.; Keane, R.E.; Knapp, E.E.; Lydersen, J.M.; Metlen, K.L. Evidence for widespread changes in the structure, composition, and fire regimes of western North American forests. Ecol. Appl. 2021, 31, e02431. [Google Scholar] [CrossRef]
- Baker, W.L. Are high-severity fires burning at much higher rates recently than historically in dry-forest landscapes of the Western USA? PLoS ONE 2015, 10, e0136147. [Google Scholar]
- DeFries, R.; Nagendra, H. Ecosystem management as a wicked problem. Science 2017, 356, 265–270. [Google Scholar] [CrossRef] [PubMed]
- Radeloff, V.C.; Helmers, D.P.; Kramer, H.A.; Mockrin, M.H.; Alexandre, P.M.; Bar-Massada, A. Rapid growth of the US wildland-urban interface raises wildfire risk. Proc. Natl. Acad. Sci. USA 2018, 115, 3314–3319. [Google Scholar] [CrossRef] [PubMed] [Green Version]
- DellaSala, D.A.; Baker, B.C.; Hanson, C.T.; Ruediger, L.; Baker, W. Have western USA fire suppression and megafire active management approaches become a contemporary Sisyphus? Biol. Conserv. 2022, 268, 109499. [Google Scholar] [CrossRef]
- Coop, J.D.; Parks, S.A.; Stevens-Rumann, C.S.; Ritter, S.M.; Hoffman, C.M. Extreme fire spread events and area burned under recent and future climate in the western USA. Glob. Ecol. Biogeogr. 2022, 31, 1949–1959. [Google Scholar] [CrossRef]
- Covington, W.W.; Moore, M.M. Southwestern ponderosa forest structure: Changes since Euro-American settlement. J. For. 1994, 92, 39–47. [Google Scholar]
- Shinneman, D.J.; Baker, W.L. Nonequilibrium dynamics between catastrophic disturbances and old-growth forests in ponderosa Pine landscapes of the Black Hills. Conserv. Biol. 1997, 11, 1276–1288. [Google Scholar] [CrossRef]
- Hessburg, P.F.; Salter, R.B.; James, K.M. Re-examining fire severity relations in pre-management era mixed-conifer forests: Inferences from landscape patterns of forest structure. Landsc. Ecol. 2007, 22, 5–24. [Google Scholar] [CrossRef]
- Odion, D.C.; Hanson, C.T.; Arsenault, A.; Baker, W.L.; DellaSala, D.A.; Hutto, R.L.; Klenner, W.; Moritz, M.A.; Sherriff, R.L.; Veblen, T.T.; et al. Examining historical and current mixed-severity fire regimes in ponderosa pine and mixed-conifer forests of western North America. PLoS ONE 2014, 9, e87852. [Google Scholar] [CrossRef] [PubMed] [Green Version]
- Hanson, C.T.; Sherriff, R.L.; Hutto, R.L.; Dellasala, D.A.; Veblen, T.T.; Baker, W.L. Setting the stage for mixed- and high-severity fire. In The Ecological Importance of Mixed-Severity Fires, Nature’s Phoenix; DellaSala, D.A., Hanson, C.T., Eds.; Elsevier: Amsterdam, The Netherlands, 2015; pp. 3–33. [Google Scholar]
- Ehle, D.S.; Baker, W.L. Disturbance and stand dynamics in ponderosa pine forests in Rocky Mountain National Park, USA. Ecol. Monogr. 2003, 73, 543–566. [Google Scholar] [CrossRef]
- Farris, C.A.; Baisan, C.H.; Falk, D.A.; Yool, S.R.; Swetnam, T.W. Spatial and temporal corroboration of a fire-scar-based fire history in a frequently burned ponderosa pine forest. Ecol. Appl. 2010, 20, 1598–1614. [Google Scholar] [CrossRef] [PubMed]
- Sherriff, R.L.; Platt, R.V.; Veblen, T.T.; Schoennagel, T.L. Historical, observed, and modeled wildfire severity in montane forests of the Colorado Front Range. PLoS ONE 2014, 9, e106971. [Google Scholar] [CrossRef] [Green Version]
- Baker, W.L.; Hanson, C.T. Improving the use of early timber inventories in reconstructing historical dry forests and fire in the western United States. Ecosphere 2017, 8, e01935. [Google Scholar] [CrossRef]
- Hagmann, R.K.; Stevens, J.T.; Lydersen, J.M.; Collins, B.M.; Battles, J.J.; Hessburg, P.F.; Levine, C.R.; Merschel, A.G.; Stephens, S.L.; Taylor, A.H.; et al. Improving the use of early timber inventories in reconstructing historical dry forests and fire in the western United States: Comment. Ecosphere 2018, 9, e02232. [Google Scholar] [CrossRef] [Green Version]
- Baker, W.L.; Hanson, C.T.; Williams, M.A. Improving the use of early timber inventories in reconstructing historical dry forests and fire in the western United States: Reply. Ecosphere 2018, 9, e023325. [Google Scholar] [CrossRef]
- Landres, P.B.; Morgan, P.; Swanson, F.J. Overview of the use of natural variability concepts in managing ecological systems. Ecol. Appl. 1999, 9, 1179–1188. [Google Scholar]
- Gougherty, A.V.; Keller, S.R.; Fitzpatrick, M.C. Maladaptation, migration and extirpation fuel climate change risk in a forest tree species. Nat. Clim. Chang. 2021, 11, 166–171. [Google Scholar] [CrossRef]
- Hessburg, P.F.; Prichard, S.J.; Hagmann, R.K.; Povak, N.A.; Lake, F.K. Wildfire and climate change adaptation of western North American forests: A case for intentional management. Ecol. Appl. 2021, 31, e02432. [Google Scholar] [CrossRef] [PubMed]
- Prichard, S.J.; Hessburg, P.F.; Hagmann, R.K.; Povak, N.A.; Dobrowski, S.Z.; Hurteau, M.D.; Kane, V.R.; Keane, R.E.; Kobziar, L.N.; Kolden, C.A.; et al. Adapting western North American forests to climate change and wildfires: 10 common questions. Ecol. Appl. 2021, 31, e02433. [Google Scholar] [CrossRef] [PubMed]
- Williams, M.A.; Baker, W.L. Spatially extensive reconstructions show variable-severity fire and heterogeneous structure in historical western United States dry forests. Glob. Ecol. Biogeogr. 2012, 21, 1042–1052. [Google Scholar] [CrossRef]
- Baker, W.L. Restoring and managing low-severity fire in dry-forest landscapes of the western USA. PLoS ONE 2017, 12, e0172288. [Google Scholar] [CrossRef] [PubMed] [Green Version]
- Wasserman, T.N.; Stoddard, M.T.; Waltz, A.E.M. A Summary of the Natural Range of Variability for Southwestern Frequent-Fire Forests; Ecological Restoration Institute Working Paper 42; Northern Arizona University: Flagstaff, AZ, USA, 2019. [Google Scholar]
- Williams, M.A.; Baker, W.L. Variability of historical forest structure and fire across ponderosa pine landscapes of the Coconino Plateau and south rim of Grand Canyon National Park, Arizona, USA. Landsc. Ecol. 2013, 28, 297–310. [Google Scholar] [CrossRef]
- Baker, W.L. Historical forest structure and fire in Sierran mixed-conifer forests reconstructed from General Land Office survey data. Ecosphere 2014, 5, 1–70. [Google Scholar] [CrossRef]
- Baker, W.L. Implications of spatially extensive historical data from surveys for restoring dry forests of Oregon’s eastern Cascades. Ecosphere 2012, 3, 1–39. [Google Scholar] [CrossRef]
- Baker, W.L. Reconstruction of the Historical Composition and Structure of Forests in the Middle Applegate Area, Oregon, Using the General Land Office Surveys, and Implications for the Pilot Joe Project. 2011. Available online: https://www.blm.gov/or/districts/medford/forestrypilot/files/Citizen7_attachment.pdf (accessed on 15 January 2023).
- Williams, M.A.; Baker, W.L. Comparison of the higher-severity fire regime in historical (A.D 1800s) and modern (A.D 1984–2009) montane forests across 624,156 ha of the Colorado Front Range. Ecosystems 2012, 15, 832–847. [Google Scholar] [CrossRef]
- Baker, W.L. The Landscapes They Are A-Changin’-Severe 19th-Century Fires, Spatial Complexity, and Natural Recovery in Historical Landscapes on the Uncompahgre Plateau; Colorado Forest Restoration Institute, Colorado State University: Fort Collins, CO, USA, 2017. [Google Scholar]
- Baker, W.L. Variable forest structure and fire reconstructed across historical ponderosa pine and mixed conifer landscapes of the San Juan Mountains, Colorado. Land 2020, 9, 3. [Google Scholar] [CrossRef] [Green Version]
- Baker, W.L.; Williams, M.A. Land surveys show regional variability of historical fire regimes and dry forest structure of the western United States. Ecol. Appl. 2018, 28, 284–290. [Google Scholar] [CrossRef]
- Baker, W.L.; Veblen, T.T.; Sherriff, R.L. Fire, fuels and restoration of ponderosa pineBDouglas fir forests in the Rocky Mountains, USA. J. Biogeogr. 2007, 34, 251–269. [Google Scholar] [CrossRef]
- Pierce, J.L.; Meyer, G.A.; Jull, A.J.T. Fire-induced erosion and millennial-scale climate change in northern ponderosa pine forests. Nature 2004, 432, 87–90. [Google Scholar] [CrossRef] [PubMed]
- Pierce, J.L.; Meyer, G.A. Long-term fire history from alluvial fan sediments: The role of drought and climate variability, and implications for management of Rocky Mountain forests. Int. J. Wildland Fire 2008, 17, 84–95. [Google Scholar] [CrossRef] [Green Version]
- Leiberg, J.B. Forest Conditions in the Northern Sierra Nevada, California; U.S. Geological Survey Professional Paper Number 8; U.S. Government Printing Office: Washington, DC, USA, 1902. [Google Scholar]
- Fulé, P.Z.; Covington, W.W.; Moore, M.M. Determining reference conditions for ecosystem management of southwestern ponderosa pine forests. Ecol. Appl. 1997, 7, 895–908. [Google Scholar] [CrossRef]
- Williams, M.A.; Baker, W.L. Bias and error in using survey records for ponderosa pine landscape restoration. J. Biogeogr. 2010, 37, 707–721. [Google Scholar] [CrossRef]
- Williams, M.A.; Baker, W.L. Testing the accuracy of new methods for reconstructing historical structure of forest landscapes using GLO survey data. Ecol. Monogr. 2011, 81, 63–88. [Google Scholar] [CrossRef]
- Veblen, T.T.; Lorenz, D.C. The Colorado Front Range: A Century of Ecological Change; University of Utah Press: Salt Lake City, UT, USA, 1991. [Google Scholar]
- Baisan, C.H.; Swetnam, T.W. Fire history on a desert mountain range: Rincon Mountain Wilderness, Arizona, USA. Can. J. For. Res. 1990, 20, 1559–1569. [Google Scholar] [CrossRef]
- Baker, W.L. Historical fire regimes in ponderosa pine and mixed-conifer landscapes of the San Juan Mountains, Colorado, USA, from multiple sources. Fire 2018, 1, 23. [Google Scholar] [CrossRef] [Green Version]
- Baker, W.L. Fire Ecology in Rocky Mountain Landscapes; Island Press: Washington, DC, USA, 2009. [Google Scholar]
- Jack, J.G.; Pikes, P.; Plum, C.; South, P.R. House of Representatives, 56th Congress, 1st Session, Document no. 5. Annual Reports of the Department of the Interior for the Fiscal Year Ended June 39, 1899, 20th Annual Report of the United States Geological Survey, Part V—Forest Reserves; U.S. Government Printing Office: Washington, DC, USA, 1900; pp. 39–115. [Google Scholar]
- Baker, W.L.; Ehle, D. Uncertainty in surface-fire history: The case of ponderosa pine forests in the western United States. Can. J. For. Res. 2001, 31, 1205–1226. [Google Scholar] [CrossRef]
- Baker, W.L.; Ehle, D. Uncertainty in fire history and restoration of ponderosa pine forests in the western United States. In Fire, Fuel Treatments, and Ecological Restoration: Conference Proceedings. USDA Forest Service Proceedings RMRS-P-29; Omi, P.N., Joyce, L.A., Eds.; Rocky Mountain Research Station: Fort Collins, CO, USA, 2003; pp. 319–333. [Google Scholar]
- Kou, X.; Baker, W.L. A landscape model quantifies error in reconstructing fire history from scars. Landsc. Ecol. 2006, 21, 735–745. [Google Scholar] [CrossRef]
- Kou, X.; Baker, W.L. Accurate estimation of mean fire interval for managing fire. Int. J. Wildland Fire 2006, 15, 489–495. [Google Scholar] [CrossRef]
- Dugan, A.J.; Baker, W.L. Modern calibration and historical testing of small-area, fire-interval reconstruction methods. Int. J. Wildland Fire 2014, 23, 58–68. [Google Scholar] [CrossRef] [Green Version]
- Dugan, A.J.; Baker, W.L. Sequentially contingent fires, droughts and pluvials structured a historical dry forest landscape and suggest future contingencies. J. Veg. Sci. 2015, 26, 697–710. [Google Scholar] [CrossRef]
- Baker, W.L. Restoration of forest resilience to fire from old trees is possible across a large Colorado dry-forest landscape by 2060, but only under the Paris 1.5 °C goal. Glob. Chang. Biol. 2021, 27, 4074–4095. [Google Scholar] [CrossRef] [PubMed]
- Hagmann, R.K.; Merschel, A.G.; Reilly, M.J. Historical patterns of fire severity and forest structure and composition in a landscape structured by frequent large fires: Pumice Plateau ecoregion, Oregon, USA. Landsc. Ecol. 2019, 34, 551–568. [Google Scholar] [CrossRef]
- Nigro, K.; Molinari, N. Status and trends of fire activity in southern California yellow pine and mixed conifer forests. For. Ecol. Manag. 2019, 441, 20–31. [Google Scholar] [CrossRef]
- Reilly, M.J.; Dunn, C.J.; Meigs, G.W.; Spies, T.A.; Kennedy, R.E.; Bailey, J.D.; Briggs, K. Contemporary patterns of fire extent and severity in forests of the Pacific Northwest, USA (1985–2010). Ecosphere 2017, 8, e01695. [Google Scholar] [CrossRef] [Green Version]
- Haugo, R.D.; Kellogg, B.S.; Cansler, C.A.; Kolden, C.A.; Kemp, K.B.; Robertson, J.C.; Metlen, K.L.; Vaillant, N.M.; Restaino, C.M. The missing fire: Quantifying human exclusion of wildfire in Pacific Northwest forests, USA. Ecosphere 2019, 10, e02702. [Google Scholar] [CrossRef] [Green Version]
- Mallek, C.; Safford, H.; Viers, H.J.; Miller, J. Modern departures in fire severity and area vary by forest type, Sierra Nevada and southern Cascades, California, USA. Ecosphere 2013, 4, 1–28. [Google Scholar] [CrossRef]
- Cogbill, C.V.; Thurman, A.L.; Williams, J.W.; Zhu, J.; Mladenoff, D.J.; Goring, S.J. A retrospective on the accuracy and precision of plotless forest density estimators in ecological studies. Ecosphere 2018, 9, e02187. [Google Scholar] [CrossRef] [Green Version]
- Delincé, J. Robust density estimation through distance measurements. Ecology 1986, 67, 1576–1581. [Google Scholar] [CrossRef]
- Levine, C.R.; Cogbill, C.V.; Collins, B.M.; Larson, A.J.; Lutz, J.A.; North, M.P.; Restaino, C.M.; Safford, H.D.; Stephens, S.L.; Battles, J.J. Evaluating a new method for reconstructing forest conditions from General Land Office survey records. Ecol. Appl. 2017, 27, 1498–1513. [Google Scholar] [CrossRef] [PubMed]
- Levine, C.R.; Cogbill, C.V.; Collins, B.M.; Larson, A.J.; Lutz, J.A.; North, M.P.; Restaino, C.M.; Safford, H.D.; Stephens, S.L.; Battles, J.J. Estimating historical forest density from land-survey data: A response to Baker and Williams (2018). Ecol. Appl. 2019, 29, e01968. [Google Scholar] [CrossRef] [PubMed]
- Baker, W.L.; Williams, M.A. Estimating historical forest density from land-survey data: Response. Ecol. Appl. 2019, 29, e02017. [Google Scholar] [CrossRef] [PubMed]
- Knight, C.A.; Cogbill, C.V.; Potts, M.D.; Wanket, J.A.; Battles, J.J. Settlement-era forest structure and composition in the Klamath Mountains: Reconstructing a historical baseline. Ecosphere 2020, 11, e03250. [Google Scholar] [CrossRef]
- Johnston, J.D.; Dunn, C.J.; Vernon, M.J.; Bailey, J.D.; Morrissette, B.A.; Morici, K.E. Restoring historical forest conditions in a diverse inland Pacific Northwest landscape. Ecosphere 2018, 9, e02400. [Google Scholar] [CrossRef] [Green Version]
- Morisita, M. A new method for the estimation of density by spacing method applicable to nonrandomly distributed populations. Physiol. Ecol. 1957, 7, 134–144. [Google Scholar]
- Warde, W.; Petranka, J.W. A correction factor table for missing point-center quarter data. Ecology 1981, 62, 491–494. [Google Scholar] [CrossRef]
- Baker, W.L. Historical northern spotted owl habitat and old-growth dry forests maintained by mixed-severity wildfires. Landsc. Ecol. 2015, 30, 655–666. [Google Scholar] [CrossRef]
- Hagmann, R.K.; Franklin, J.F.; Johnson, K.N. Historical structure and composition of ponderosa pine and mixed-conifer forests in south-central Oregon. For. Ecol. Manag. 2013, 304, 492–504. [Google Scholar] [CrossRef] [Green Version]
- Hagmann, R.K.; Franklin, J.F.; Johnson, K.N. Historical conditions in mixed-conifer forests on the eastern slopes of the northern Oregon Cascade Range, USA. For. Ecol. Manag. 2014, 330, 158–170. [Google Scholar] [CrossRef]
- Hagmann, R.K.; Johnson, D.L.; Johnson, K.N. Historical and current forest conditions in the range of the Northern Spotted Owl in south central Oregon, USA. For. Ecol. Manag. 2017, 389, 374–385. [Google Scholar] [CrossRef]
- Collins, B.M.; Lydersen, J.M.; Everett, R.G.; Fry, D.L.; Stephens, S.L. Novel characterization of landscape-level variability in historical vegetation structure. Ecol. Appl. 2015, 25, 1167–1174. [Google Scholar] [CrossRef] [Green Version]
- Stephens, S.L.; Lydersen, J.M.; Collins, B.M.; Fry, D.L.; Meyer, M.D. Historical and current landscape-scale ponderosa pine and mixed conifer forest structure in the Southern Sierra Nevada. Ecosphere 2015, 6, 1–63. [Google Scholar] [CrossRef] [Green Version]
- Stephens, S.L.; Stevens, J.T.; Collins, B.M.; York, R.A.; Lydersen, J.M. Historical and modern landscape forest structure in fir (Abies)-dominated mixed conifer forests in the northern Sierra Nevada, USA. Fire Ecol. 2018, 14, 7. [Google Scholar] [CrossRef] [Green Version]
- Battaglia, M.A.; Gannon, M.A.B.; Brown, P.M.; Fornwalt, P.J.; Cheng, A.S.; Huckaby, L.S. Changes in forest structure since 1860 in ponderosa pine dominated forests in the Colorado and Wyoming Front Range, USA. For. Ecol. Manag. 2018, 422, 147–160. [Google Scholar] [CrossRef] [Green Version]
- Hanson, C.T.; Odion, D.C. Historical forest conditions within the range of the Pacific fisher and Spotted owl in the central and southern Sierra Nevada, California, USA. Nat. Areas J. 2016, 36, 8–19. [Google Scholar] [CrossRef]
- Collins, B.M.; Miller, J.D.; Stephens, S.L. To the editor: A response to Hanson and Odion. Nat. Areas J. 2016, 36, 234–242. [Google Scholar]
- Hanson, C.T.; Odion, D.C. A response to Collins, Miller, and Stephens. Nat. Areas J. 2016, 36, 229–233. [Google Scholar]
- Williams, M.A.; Baker, W.L. High-severity fire corroborated in historical dry forests of the western United States: Response to Fulé et al. Glob. Ecol. Biogeogr. 2014, 23, 831–835. [Google Scholar] [CrossRef]
- Fulé, P.Z.; Swetnam, T.W.; Brown, P.M.; Falk, D.A.; Peterson, D.L.; Allen, C.D.; Aplet, G.H.; Battaglia, M.A.; Binkley, D.; Farris, C.; et al. Unsupported inferences of high-severity fire in historical dry forests of the western United States, response to Williams and Baker. Glob. Ecol. Biogeogr. 2014, 23, 825–830. [Google Scholar] [CrossRef]
- Van Horne, M.L.; Fulé, P.Z. Comparing methods of reconstructing fire history using fire scars in a southwestern United States ponderosa pine forest. Can. J. For. Res. 2006, 36, 855–867. [Google Scholar] [CrossRef]
- Collins, B.M.; Stephens, S.L. Fire scarring patterns in Sierra Nevada wilderness areas burned by multiple wildland fire use fires. Fire Ecol. 2007, 3, 53–67. [Google Scholar] [CrossRef]
- Brown, P.M.; Wienk, C.L.; Symstad, A.J. Fire and forest history at Mount Rushmore. Ecol. Appl. 2008, 18, 1984–1999. [Google Scholar] [CrossRef] [PubMed]
- Stephens, S.L.; Fry, D.L.; Collins, B.M.; Skinner, C.N.; Franco-Vizcaíno, E.; Freed, T.J. Fire-scar formation in Jeffrey pine B mixed conifer forests in the Sierra San Pedro Mártir, Mexico. Can. J. For. Res. 2010, 40, 1497–1505. [Google Scholar] [CrossRef]
- Baker, W.L. Fire history in ponderosa pine landscapes of Grand Canyon National Park: Is it reliable enough for management and restoration? Int. J. Wildland Fire 2006, 15, 433–437. [Google Scholar] [CrossRef]
- Brown, P.M.; Wu, R. Climate and disturbance forcing of episodic tree recruitment in a southwestern ponderosa pine landscape. Ecology 2005, 86, 3030–3038. [Google Scholar] [CrossRef]
- Yocum Kent, L.L.; Fulé, P.Z. Do rules of thumb measure up? Characteristics of fire-scarred trees and samples. Tree-Ring Res. 2015, 71, 78–82. [Google Scholar] [CrossRef]
- Meunier, J.; Holoubek, N.S.; Sebasky, M. Fire regime characteristics in relation to physiography at local and landscape scales in Lake States pine forests. For. Ecol. Manag. 2019, 454, 117651. [Google Scholar] [CrossRef]
- Polakow, D.A.; Dunne, T.T. Modelling fire-return interval T: Stochasticity and censoring in the two-parameter Weibull model. Ecol. Model. 1999, 121, 79–102. [Google Scholar] [CrossRef]
- Moritz, M.A.; Moody, T.J.; Miles, L.J.; Smith, M.M.; De Valpine, P. The fire frequency analysis branch of the pyrostatistics tree: Sampling decisions and censoring in fire interval data. Environ. Ecol. Stat. 2009, 16, 271–289. [Google Scholar] [CrossRef]
- Fulé, P.Z.; Heinlein, T.A.; Covington, W.W.; Moore, M.M. Assessing fire regimes on Grand Canyon landscapes with fire-scar and fire-record data. Int. J. Wildland Fire 2003, 12, 129–145. [Google Scholar] [CrossRef]
- Farris, C.A.; Baisan, C.H.; Falk, D.A.; Van Horne, M.L.; Fulé, P.Z.; Swetnam, T.W. A comparison of targeted and systematic fire-scar sampling for estimating historical fire frequency in south-western ponderosa pine forests. Int. J. Wildland Fire 2013, 22, 1021–1033. [Google Scholar] [CrossRef]
- O’Connor, C.D.; Falk, D.A.; Lynch, A.M.; Swetnam, T.W. Fire severity, size, and climate associations diverge from historical precedent along an ecological gradient in the Pinaleño Mountains, Arizona, USA. For. Ecol. Manag. 2014, 329, 264–278. [Google Scholar] [CrossRef] [Green Version]
- Huffman, D.W.; Zegler, T.J.; Fulé, P.Z. Fire history of a mixed conifer forest on the Mogollon Rim, northern Arizona, USA. Int. J. Wildland Fire 2015, 24, 680–689. [Google Scholar] [CrossRef]
- Odion, D.C.; Hanson, C.T.; Baker, W.L.; Dellasala, D.A.; Williams, M.A. Areas of agreement and disagreement regarding ponderosa pine and mixed conifer forest fire regimes: A dialogue with Stevens et al. PLoS ONE 2016, 11, e0154579. [Google Scholar] [CrossRef] [Green Version]
- Stevens, J.T.; Safford, H.D.; North, M.P.; Fried, J.S.; Gray, A.N.; Brown, P.M. Average stand age from forest inventory plots does not describe historical fire regimes in ponderosa pine and mixed-conifer forests of western North America. PLoS ONE 2016, 11, e0147688. [Google Scholar] [CrossRef]
- Merschel, A.G.; Spies, T.A.; Heyerdahl, E.K. Mixed-conifer forests of central Oregon: Effects of logging and fire exclusion vary with environment. Ecol. Appl. 2014, 24, 1670–1688. [Google Scholar] [CrossRef]
- Wu, R. Fire History and Forest Structure in the Mixed Conifer Forests of Southwest Colorado. Master’s Thesis, Colorado State University, Fort Collins, CO, USA, 1999. [Google Scholar]
- Tepley, A.J.; Veblen, T.T. Spatiotemporal fire dynamics in mixed-conifer and aspen forests of the San Juan Mountains of southwestern Colorado, USA. Ecol. Monogr. 2015, 85, 583–603. [Google Scholar] [CrossRef]
- Brown, P.M.; Kaufmann, M.R.; Shepperd, W.D. Long-term, landscape patterns of past fire events in a montane ponderosa pine forests of central Colorado. Landsc. Ecol. 1999, 14, 513–532. [Google Scholar] [CrossRef]
- Huckaby, L.S.; Kaufmann, M.R.; Stoker, J.M.; Fornwalt, P.J. Landscape patterns of montane forest age structure relative to fire history at Cheesman Lake in the Colorado Front Range. In Ponderosa Pine Ecosystems Restoration and Conservation: Steps Toward Stewardship. USDA Forest Service Proceedings RMRS-P-22; Vance, R.K., Edminster, C.B., Covington, W.W., Blake, J.A., Eds.; Rocky Mountain Research Station: Fort Collins, CO, USA, 2001; pp. 19–27. [Google Scholar]
- Taylor, A.H.; Skinner, C.N. Fire history and landscape dynamics in a late-successional reserve, Klamath Mountains, California, USA. For. Ecol. Manag. 1998, 111, 285–301. [Google Scholar] [CrossRef]
- Long, C.J.; Power, M.J.; Bartlein, P.J. The effects of fire and tephra deposition on forest vegetation in the central Cascades, Oregon. Quat. Res. 2011, 75, 151–158. [Google Scholar] [CrossRef]
- Fitch, E.P. Holocene Fire-Related Alluvial Chronology and Geomorphic Implications in the Jemez Mountains, New Mexico. Master’s Thesis, University of New Mexico, Albuquerque, NM, USA, 2013. [Google Scholar]
- Jenkins, S.E.; Sieg, C.H.; Anderson, D.E.; Kaufman, D.S.; Pearthree, P.A. Late Holocene geomorphic record of fire in ponderosa pine and mixed-conifer forests, Kendrick Mountain, northern Arizona, USA. Int. J. Wildland Fire 2011, 20, 125–141. [Google Scholar] [CrossRef]
- Bigio, E.R. Late Holocene Fire and Climate History of the Western San Juan Mountains, Colorado: Results from Alluvial Stratigraphy and Tree-Ring Methods. Ph.D. Thesis, University of Arizona, Tucson, AZ, USA, 2013. [Google Scholar]
- Colombaroli, D.; Gavin, D.G. Highly episodic fire and erosion regime over the past 2000 years in the Siskiyou Mountains, Oregon. Proc. Natl. Acad. Sci. USA 2010, 107, 18909–18914. [Google Scholar] [CrossRef] [Green Version]
- Brown, P.M. Climate effects on fire regimes and tree recruitment in Black Hills ponderosa pine forests. Ecology 2006, 87, 2500–2510. [Google Scholar] [CrossRef] [PubMed]
- O’Connor, C.D.; Falk, D.A.; Lynch, A.M.; Swetnam, T.W.; Wilcox, C.P. Disturbance and productivity interactions mediate stability of forest composition and structure. Ecol. Appl. 2017, 27, 900–915. [Google Scholar] [CrossRef] [PubMed]
- Miller, J.D.; Safford, H.D. Corroborating evidence of a pre-Euro-American low- to moderate-severity fire regime in yellow pine-mixed conifer forests of the Sierra Nevada, California, USA. Fire Ecol. 2017, 13, 58–90. [Google Scholar] [CrossRef]
- Spies, T.A.; Hessburg, P.F.; Skinner, C.N.; Puettmann, K.J.; Reilly, M.J.; Davis, R.J.; Kertis, J.A.; Long, J.W.; Shaw, D.C. Chapter 3: Old growth, disturbance, forest succession, and management in the area of the Northwest Forest Plan. In Synthesis of Science to Inform Land Management within the Northwest Forest Plan Area; Gen. Tech. Rep. PNW-GTR-966; Spies, T.A., Stine, P.A., Gravenmier, R., Long, J.W., Reilly, M.J., Eds.; Department of Agriculture, Forest Service, Pacific Northwest Research Station: Portland, OR, USA, 2018; pp. 95–243. [Google Scholar]
- DellaSala, D.A.; Hanson, C.T. Ecological and biodiversity benefits of megafires. In The Ecological Importance of Mixed-Severity Fires, Nature’s Phoenix; DellaSala, D.A., Hanson, C.T., Eds.; Elsevier: Amsterdam, The Netherlands, 2015; pp. 23–34. [Google Scholar]
- DellaSala, D.A.; Hanson, C.T. Are wildland fires increasing large patches of complex early seral forest habitat? Diversity 2019, 11, 157. [Google Scholar] [CrossRef] [Green Version]
- Grissino-Mayer, H.D. Tree-Ring Reconstructions of Climate and Fire History at El Malpais National Monument, New Mexico. Ph.D. Thesis, University of Arizona, Tucson, AZ, USA, 1995. [Google Scholar]
- Odion, D.C.; Hanson, C.T. Fire severity in conifer forests of the Sierra Nevada, California. Ecosystems 2006, 9, 1177–1189. [Google Scholar] [CrossRef]
- Safford, H.D.; Miller, J.; Schmidt, D.; Roath, B.; Parsons, A. BAER soil burn severity maps do not measure fire effects to vegetation: A comment on Odion and Hanson (2006). Ecosystems 2008, 11, 1–11. [Google Scholar] [CrossRef]
- Odion, D.C.; Hanson, C.T. Fire severity in the Sierra Nevada revisited: Conclusions robust to further analysis. Ecosystems 2008, 11, 12–15. [Google Scholar] [CrossRef]
- Spies, T.A.; Miller, J.D.; Buchanan, J.B.; Lehmkuhl, J.F.; Franklin, J.F.; Healey, S.P.; Hessburg, P.F.; Safford, H.D.; Cohen, W.B.; Kennedy, R.S.; et al. Underestimating risks to the northern spotted owl in fire-prone forests: Response to Hanson et al. Conserv. Biol. 2010, 24, 330–333. [Google Scholar] [CrossRef] [PubMed]
- Hanson, C.T.; Odion, D.C.; Dellasala, D.A.; Baker, W.L. Overestimation of fire risk in the Northern Spotted Owl recovery plan. Conserv. Biol. 2009, 23, 1314–1319. [Google Scholar] [CrossRef] [PubMed]
- Hanson, C.T.; Odion, D.C.; Dellasala, D.A.; Baker, W.L. More-comprehensive recovery actions for Northern Spotted Owls in dry forests: Reply to Spies et al. Conserv. Biol. 2010, 24, 334–337. [Google Scholar] [CrossRef]
- Steel, Z.L.; Safford, H.D.; Viers, J.H. The fire frequency-severity relationship and the legacy of fire suppression in California forests. Ecosphere 2015, 6, 1–23. [Google Scholar] [CrossRef]
- Odion, D.C.; Moritz, M.A.; DellaSala, D.A. Alternative community states maintained by fire in the Klamath Mountains, USA. J. Ecol. 2010, 98, 96–105. [Google Scholar] [CrossRef]
- Miller, J.D.; Skinner, C.N.; Safford, H.D.; Knapp, E.E.; Ramirez, C.M. Trends and causes of severity, size, and number of fires in northwestern California, USA. Ecol. Appl. 2012, 22, 184–203. [Google Scholar] [CrossRef]
- van Wagtendonk, J.W.; van Wagtendonk, K.A.; Thode, A.E. Factors associated with the severity of intersecting fires in Yosemite National Park, California, USA. Fire Ecol. 2012, 8, 11–32. [Google Scholar] [CrossRef]
- Steel, Z.L.; Koontz, M.J.; Safford, H.D. The changing landscape of wildfire: Burn pattern trends and implications for California’s yellow pine and mixed conifer forests. Landsc. Ecol. 2018, 33, 1159–1176. [Google Scholar] [CrossRef]
- Hanson, C.T.; Odion, D.C. Sierra Nevada fire severity conclusions are robust to further analysis: A reply to Safford et al. Int. J. Wildland Fire 2015, 24, 294–295. [Google Scholar] [CrossRef] [Green Version]
- Guiterman, C.H.; Margolis, E.Q.; Swetnam, T.W. Dendroecological methods for reconstructing high-severity fire in pine-oak forests. Tree-Ring Res. 2015, 71, 67–77. [Google Scholar] [CrossRef]
- Safford, H.D.; Miller, J.D.; Collins, B.M. Differences in land ownership, fire management objectives and source data matter: A reply to Hanson and Odion (2014). Int. J. Wildland Fire 2015, 24, 286–293. [Google Scholar] [CrossRef] [Green Version]
- Hanson, C.T.; Odion, D.C. Is fire severity increasing in the Sierra Nevada, California, USA? Int. J. Wildland Fire 2014, 23, 1–8. [Google Scholar] [CrossRef] [Green Version]
- Miller, J.D.; Safford, H.D.; Crimmins, M.; Thode, A.E. Quantitative evidence for increasing forest fire severity in the Sierra Nevada and Southern Cascade Mountains, California and Nevada, USA. Ecosystems 2009, 12, 16–32. [Google Scholar] [CrossRef]
- Collins, B.M.; Everett, R.G.; Stephens, S.L. Impacts of fire exclusion and recent managed fire on forest structure in old growth Sierra Nevada mixed-conifer forests. Ecosphere 2011, 2, 1–14. [Google Scholar] [CrossRef]
- Scholl, A.E.; Taylor, A.H. Fire regimes, forest change, and self-organization in an old-growth mixed-conifer forest, Yosemite National Park, USA. Ecol. Appl. 2010, 20, 362–380. [Google Scholar] [CrossRef]
- Bernal, A.A.; Stephens, S.L.; Collins, B.M.; Battles, J.J. Biomass stocks in California’s fire-prone forests: Mismatch in ecology and policy. Environ. Res. Lett. 2022, 17, 044047. [Google Scholar] [CrossRef]
- North, M.P.; Tompkins, R.E.; Bernal, A.A.; Collins, B.M.; Stephens, S.L.; York, R.A. Operational resilience in western US frequent-fire forests. For. Ecol. Manag. 2022, 507, 120004. [Google Scholar] [CrossRef]


Disclaimer/Publisher’s Note: The statements, opinions and data contained in all publications are solely those of the individual author(s) and contributor(s) and not of MDPI and/or the editor(s). MDPI and/or the editor(s) disclaim responsibility for any injury to people or property resulting from any ideas, methods, instructions or products referred to in the content. |
© 2023 by the authors. Licensee MDPI, Basel, Switzerland. This article is an open access article distributed under the terms and conditions of the Creative Commons Attribution (CC BY) license (https://creativecommons.org/licenses/by/4.0/).
Share and Cite
Baker, W.L.; Hanson, C.T.; Williams, M.A.; DellaSala, D.A. Countering Omitted Evidence of Variable Historical Forests and Fire Regime in Western USA Dry Forests: The Low-Severity-Fire Model Rejected. Fire 2023, 6, 146. https://doi.org/10.3390/fire6040146
Baker WL, Hanson CT, Williams MA, DellaSala DA. Countering Omitted Evidence of Variable Historical Forests and Fire Regime in Western USA Dry Forests: The Low-Severity-Fire Model Rejected. Fire. 2023; 6(4):146. https://doi.org/10.3390/fire6040146
Chicago/Turabian StyleBaker, William L., Chad T. Hanson, Mark A. Williams, and Dominick A. DellaSala. 2023. "Countering Omitted Evidence of Variable Historical Forests and Fire Regime in Western USA Dry Forests: The Low-Severity-Fire Model Rejected" Fire 6, no. 4: 146. https://doi.org/10.3390/fire6040146