Article

A Comparison of Analytical Methods for the Determination of Soil pH: Case Study on Burned Soils in Northern Portugal

by
Maria Faria
1,
Tamires Bertocco
1,
Ana Barroso
1,
Manuela Carvalho
2,
Felicia Fonseca
3,4,
Cristina Delerue Matos
2,
Tomás Figueiredo
3,4,
Amália Sequeira Braga
1,
Teresa Valente
1,* and
Raimundo Jiménez-Ballesta
5
1
ICT—Institute of Earth Sciences, University of Minho, Campus de Gualtar, 4710-057 Braga, Portugal
2
REQUIMTE/LAQV, Polytechnic of Porto—School of Engineering (ISEP), 4249-015 Porto, Portugal
3
CIMO—Centro de Investigação de Montanha, Instituto Politécnico de Bragança, Campus de Santa Apolónia, 5300-253 Bragança, Portugal
4
SusTEC—Laboratório Associado para a Sustentabilidade e Tecnologia em Regiões de Montanha, Instituto Politécnico de Bragança, Campus de Santa Apolónia, 5300-253 Bragança, Portugal
5
Department of Geology & Geochemistry, Autonoma University of Madrid, 28049 Madrid, Spain
*
Author to whom correspondence should be addressed.
Fire 2023, 6(6), 227; https://doi.org/10.3390/fire6060227
Submission received: 28 April 2023 / Revised: 21 May 2023 / Accepted: 1 June 2023 / Published: 6 June 2023
(This article belongs to the Special Issue Fire Regimes and Ecosystem Resilience)

Abstract

:
Wildfires can cause serious imbalances in ecosystems, primarily at the soil level, making it vulnerable to degradation processes such as erosion. During and after a fire, changes occur in soil properties, including pH, which affects the solubility and availability of nutrients. Currently, there is a great diversity of protocols, some involving normalized standards, to determine soil pH, but there is no consensual or universal analytical method for this parameter, especially in burned soils, in which mineral and organic fractions could have been modified. Therefore, the objective of the present work is to evaluate the effect that variations in these analytical protocols may have on pH results. For this, five methods commonly found in the international bibliography for the analysis of pH of soil in water (pHH2O) were selected and compared to propose the most precise procedure. The analytical methods were applied to 43 soil samples, collected in a plot subjected to prescribed burning in the Parque Natural de Montesinho (Northern Portugal). The studied methods differ in the following protocol items: water suspension ratio (1:2.5 or 1:5), mechanical stirring time in the suspension (10 min or 1 h), and in the resting time for the solid particles to settle (15 min or 8 h). The obtained results point to the suitability of the five methods used for soil pH analysis, indicating that there are no statistically significant differences. However, results also allow suggesting a more appropriate method concerning practical reasons, such as labor in a lab. Thus, to make the analysis process more profitable, M2 is a good option because it uses a small amount of sample (5 g), short agitation (10 min) and settling time (15 min). In turn, M1 and M5, which use a lower proportion of soil (1:2.5) show lower pH variation in the measurements. This fact may be explained by a smaller dilution effect. Considering that these two methods differ in the settling time, it is suggested to apply M1, because only 15 min are required. Therefore, the main conclusion reached with this work is that the measurement of soil pH using M1, i.e., a soil:water ratio of 1:2.5, with agitation of 10 min and settling time of 15 min, is a robust and more expeditious protocol to be applied to soil samples after a fire.

1. Introduction

The so-called soil reaction (pH) is one of the most routine and traditional measurements performed to interpret chemical and biogeochemical reactions in soils. Indeed, soil pH, by far the most common test performed in soils, represents a measure of the acidity or alkalinity of the soil solution that strongly affects the solubility and availability of nutrients. In this way, soil pH is one factor that allows inferring, among others, the plant nutrition status. Thus, it is a very important parameter for chemical and biological processes [1] to assess potential nutrient deficiencies, crop suitability, correction needs, and to determine appropriate test methods for other parameters such as phosphorus [1,2,3]. All plants are affected by extreme values of pH, but in general, there is wide variation in their tolerance of acidity or alkalinity. Some plants grow well over a wide pH range, while others are very sensitive to small variations in this parameter. Microbial activity in the soil is also affected by soil pH with most activity occurring in soils of pH 5.0 to 7.0. In addition, in extreme conditions of acidity or alkalinity, various species of earthworms and nitrifying bacteria disappear.
The pH of a soil change over time, influenced by factors including parent material, vegetation type, weathering and even management practices. It also varies throughout the year in accordance with climate variables such as precipitation and after disturbing events such as fire. It is well known that fire changes some soil properties depending on fire severity and soil type. For example, it is commonly accepted that after a fire, soil pH can increase [4,5,6]. Most studies on the pH analytical methods and effects of soil pH found in the literature are focused on forest and agricultural soils [7,8,9,10]. Nevertheless, after a fire, the organic and mineral fractions of soil are usually modified. Depending on the intensity of the fire, burnt soil samples could have portions of ashes, unburnt particles, and colloidal material, sometimes in the range of nanoparticles. However, in most of the studies involving burnt soils [11,12,13], there is no standard or consensus on pH analysis method for this specific scenario. In recently burnt soils submitted to low-intensity fires, high amounts of vegetal debris are commonly mixed in the first soil horizons. This mixture of solid organic particles may contribute to instability during pH readings.
Currently, there are several protocols and standards to analyze the soil pH, even in the field. Among some techniques, one can mention colorimetric, electrochemical, and spectrometric [14] methods. However, these techniques may present inherent limitations that impair the pH results, such as the colorimetric technique that has very low accuracy due to the use of standard color tables [15]. The spectrometric method, on the other hand, has a wider range of scale as it allows the use of a mixture of dyes; however, the selection and combination of the dyes is complex to detect the entire pH range and find similar wavelength absorption conditions [15,16]. The diffuse reflectance spectroscopy visible and near-infrared are also used for the measurement of pH [17]; however, besides being an expensive tool, it may present deficiency due to instability to environmental conditions [18].
The literature describes a variety of techniques, including a robust methodology for obtaining the pH with modified glass sensors [19], one based on PVC for flow injection analysis [20] and antimony oxide [21,22], among others. Despite this variety of methods, the most used protocols are based on potentiometric measurement performed by glass or reference electrode. Moreover, the electrode measurement is considered precise and relatively inexpensive [13].
Nevertheless, the determination of the pH of soils within the guidelines of the protocols that make use of electrodes has many variations [8]. Although FAO [23] intends to present a standard operating method for pH determination, there is no consensus or universally accepted procedures, namely regarding preparation of the sample for different types of soil (e.g., drying and/or sieving); there are even proposals for measurement in situ (in Archeology) [22]. In addition, the amount of soil and solution, type of solution (water, KCl or CaCl2), time of agitation, and resting time are commonly variable. Within these variations from method to method, one can cite as an example the resting time used to allow solid particles to settle, before reading, in two standard procedures. Therefore, the ISO 10390 [24] establishes the need for 15 min before reading, in contrast with 8 hours defined in the BS 1377-3 protocol [25] or 1 hour proposed by the FAO operating procedure [23]. The same can be mentioned for the stirring time used in this FAO procedure [23], in the manual of Margesin and Schinner [26], and in EMBRAPA [27], varying from 60 to 10 min, respectively. The FAO protocol, like many others, describes a suspension rate of 1:2.5, but suggests 60 min both for agitation and resting time.
In areas affected by wildfires, namely in Southern Europe, fire causes immediate changes in soils [28] that may persist for several years because of the direct impact and changes in the ecological variables such as vegetation cover [29,30].
The disparities in the methods for pH determination as well as the lack of consensual procedures for soils affected by fire justifies the topic of the present work focused on pH analysis of burnt soils. Issues such as soil drying, presence of ashes, vegetation and other particulate or colloidal material impose the need to perform robust and rigorous pH analysis before interpretations could be made using a specific protocol.
The literature review introduced the evidence of the need to better understand issues such as, the possible effect of stirring time on the same soil:liquid ratio; the possible effect of settling time on the same stirring time; and the possible relation between both times and the mixture ratio.
Considering the identified research needs, especially in disturbed soil samples, the aim of this study is to contrast the analytical soil pH methods applied to burned soil samples. Specifically, it intends to assess whether the following factors might affect the analytical variability of pH measured in water: (i) soil:liquid ratio; (ii) stirring time; and (iii) settling time.

2. Methodology

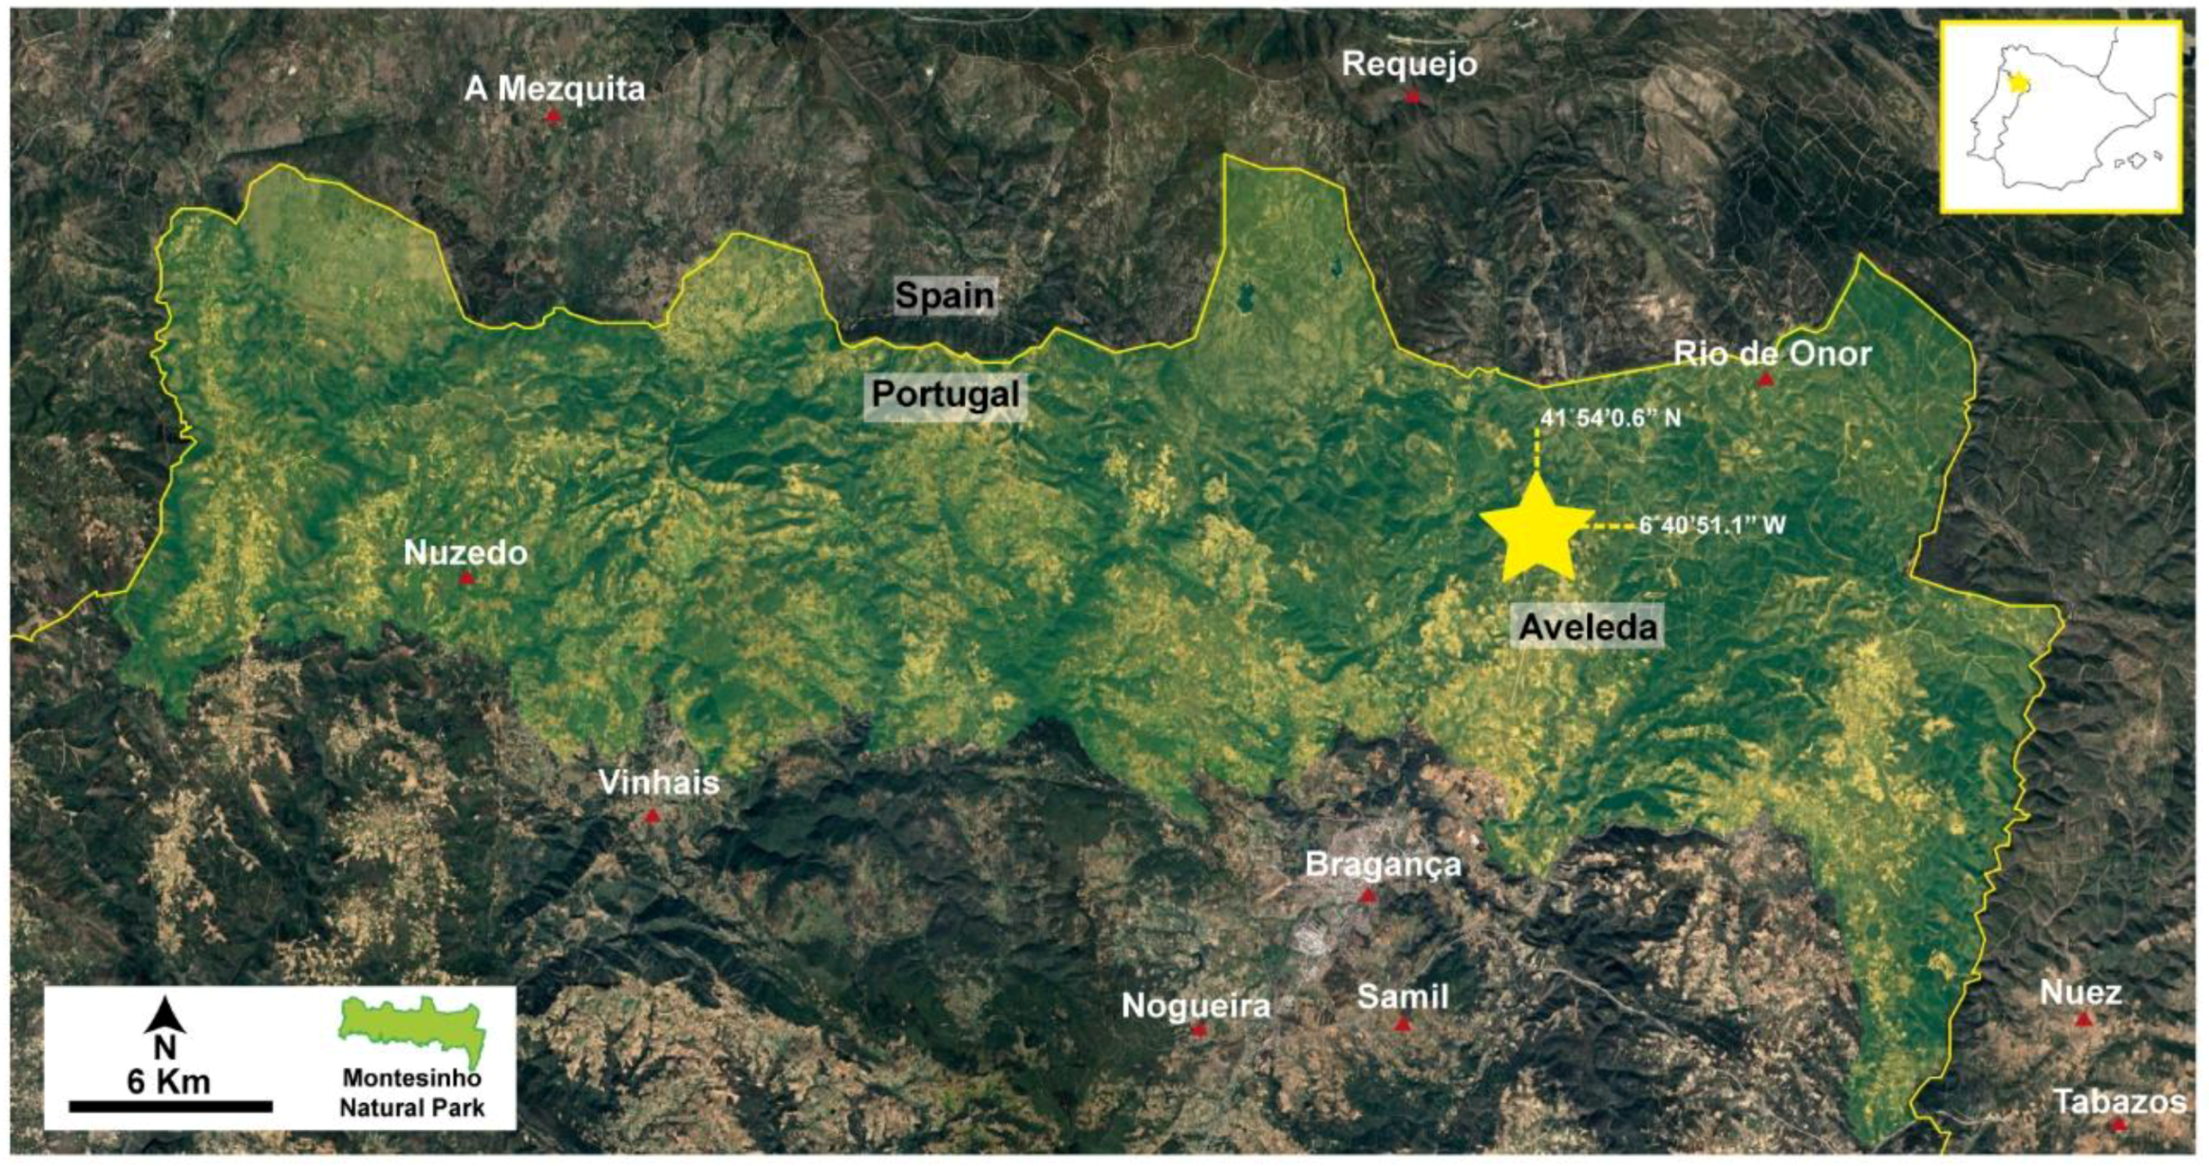
2.1. Characterization of Soil Sampling Site

Soil samples were collected in the area of Aveleda located in a natural protected area—Montesinho Natural Park; N Portugal (Figure 1).
The Montesinho Natural Park is located in northeastern Portugal and covers an area of 75 thousand hectares in the municipalities of Vinhais and Bragança. The region is a plateau, with gentle inclination to elevations exceeding 800 m.a.s.l. The climate, according to the Köppen–Geiger classification, is of the Csb type—temperate climate with a dry and mild summer. The average annual precipitation is of 850 mm, with average annual temperatures between 10 and 12.5 °C [12,31,32,33,34].
About one third of the total area of the natural park is covered by bushes, classified as areas of high risk of fire. Therefore, this is a region characterized by frequent fires, which occur mainly between May and October; an additional contribution is made by the bioclimate conditions associated with a lack of strategy and land management practices, as well as the location, far from population centers, i.e., outside the social control of the territory [31,34].
The area of Aveleda where samples were collected was previously occupied by trees of Pinus pinaster. However, in 1998, a fire destroyed part of the forest. Presently, shrub vegetation predominates, and as described by [12,34], species such as Erica australis (44% of the area), Chaemespartium tridentatum (30%), and Cystus ladanifer (26%) colonize the area.
To reduce the quantity of natural fuel, prescribed fires are a common management practice in the region [12]. This procedure was applied in Aveleda in March 2021. It was a low-intensity fire, with the temperature not exceeding 200 °C.
In the Aveleda plot, the lithology includes gray phyllites of psammitic carbonaceous nature, with greywacke on the top. There are also lenticules of impure litites and quartzites, as well as rare levels of vulcanites. Soil is a scarce resource in the Natural Park (and especially in the shrub areas such as Aveleda). Soils are classified as Humic leptosols of schistose origin, generally of medium texture, acidic and with medium to high organic matter content [12,34]. The top 20 cm of the soil found in the area typically correspond to horizons of type O, A, and sometimes Bw. When there is a high level of erosion, the A horizon is practically absent.

2.2. Sampling and Previous Characterization of Soil Samples

Surface soil samples were collected and stored in plastic bags in the Aveleda area (Figure 1), on the day immediately after the prescribed fire (reaching approximately 200 °C) representing the first 20 cm of depth. The prescribed fire was carried out in March 2021. The samples were transferred to the laboratory where they were dried at room temperature for 48 h. Then, the soils were sieved with a 2 mm sieve. Prior to pH analysis, the samples were characterized according to texture by applying the laser diffraction method with MasterSizer 3000 equipment. In addition, mineralogy was analyzed by X-ray powder diffraction (XRD) using a Philips X’pert Pro-MPD diffractometer (Philips PW 1710, APD) with CuKα radiation. Semi-quantitative analyses were obtained on powders (fraction < 2 mm) and on oriented aggregates (fraction < 2 μm) in the interval of 3 to 65°2θ and 3 to 35°2θ, respectively.

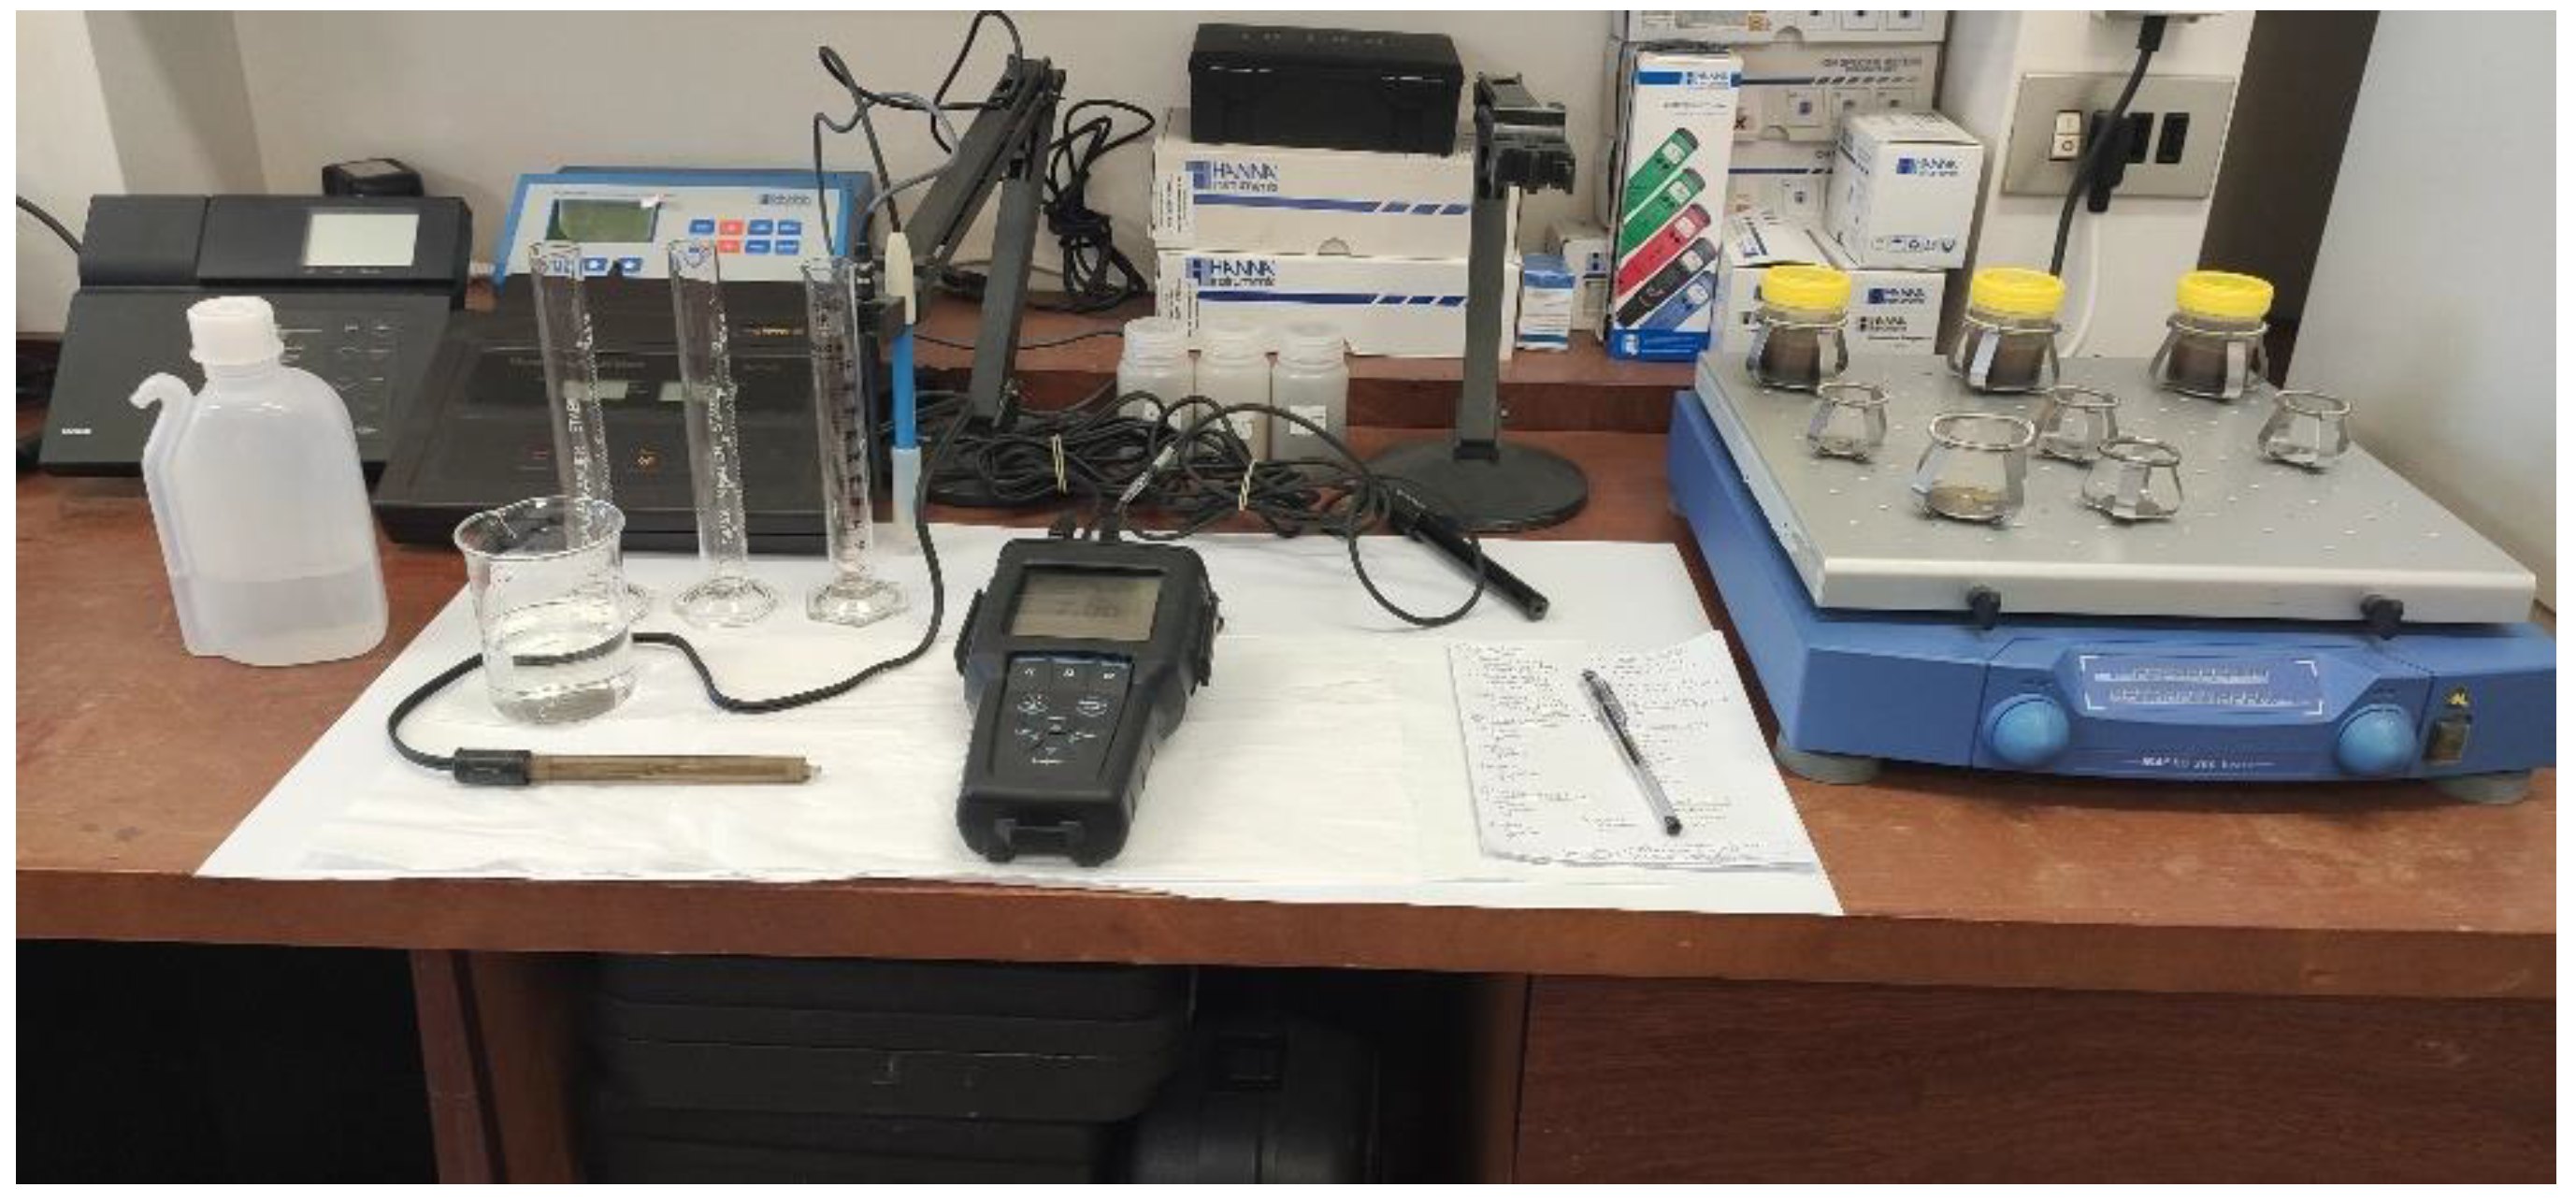
2.3. Methods of pH Analysis

It is known that soil chemical properties may show important changes after fire, in particular the pH, e.g., [35,36]. This emphasizes the need for using precise methods of pH analysis.
There are many different procedures for potentiometric measurement of the soil pH. This parameter is commonly obtained by using water as a solvent, as well as soluble salt extraction solutions, such as CaCl2 0.01 mol.L−1 and KCl 1 mol.L−1 [10,37,38,39,40]. In the present study, five methods for measurement of soil pH in water (pHH2O) were tested (Table 1). This set of methods includes normalized protocols, such as British and ISO standards [24,25], and non-standard references that are commonly found in the international literature (e.g., EMBRAPA) [27]. In general, the selected methods present the following types of variation in the respective analytical procedures: water suspension ratio (1:2.5 or 1:5), mechanical stirring time in the suspension (10 min or 1 h) and in the resting time for the solid particles to settle (15 min or 8 h).
The pH content was analyzed in the fraction of < 2 mm of the dry samples. The pH reading was performed in triplicate for each sample and method by multiparameter and pH electrode instrument, Thermo Scientific Orion Star A325. The electrode (ORION waterproof Triode, model 9107WP) has an Ag/AgCl internal reference system, sealed reference, and automatic temperature compensation. It was calibrated and tested for accuracy according to the manufacturer’s instructions. This calibration was performed every six measurements with Panreac buffer solutions, pH 4.00 and pH 7.00. Ultra-pure water from a Millipore system was used to prepare the soil:water suspensions.
Stirring was performed with mechanical stirrer, the IKA KS 260 basic, using the same stirring speed (250 rpm) for all samples. The experiment was performed in high-density polyethylene containers (60 mL volume) (Figure 2), previously washed with MiliQ water under laboratory-controlled conditions (20 °C temperature).
After the time required for the solid particles to settle, the electrode was inserted into the reactor container. Thus, the pH reading was performed directly on the supernatant, registering a steady reading.
For methods one to four (M1, M2, M3, and M4), 43 samples were used; the fifth method (M5) was applied only to 11 of these 43 samples due to the high settling time and the limiting amount of samples available.

2.4. Statistical Analysis

The obtained results were submitted to descriptive statistical analysis including minimum and maximum values, average, median, standard deviation, standard error, variance, and linear regressions using Excel and R software. Normality (Shapiro–Wilk) and ANOVA (Kaufmann and Schering) [42,43] tests were also conducted to better understand the results and the significance of differences between the used methods. Normal distribution was considered at p > 0.05.

3. Results and Discussion

In the case of soils affected by fire, the pH can vary from the optimal range as observed by [44]. Such behaviour supports the need for monitoring this parameter, which is considered by many researchers as a primary indicator of soil degradation, namely in composting processes, e.g., [45,46]. Therefore, a key issue in this research is to check the performance of common electrometric methods of soil reaction. This methodological comparison investigated the effect of solid–liquid suspension, stirring time, and resting time, as follows, respectively: M1 (1:25-10-15), M2 (1:5-10-15), M3 (1:5-1 h-15), M3 (1.25-10-15), M4 (1:5-10-15 ISO), M5 (1.25-10-8 h).

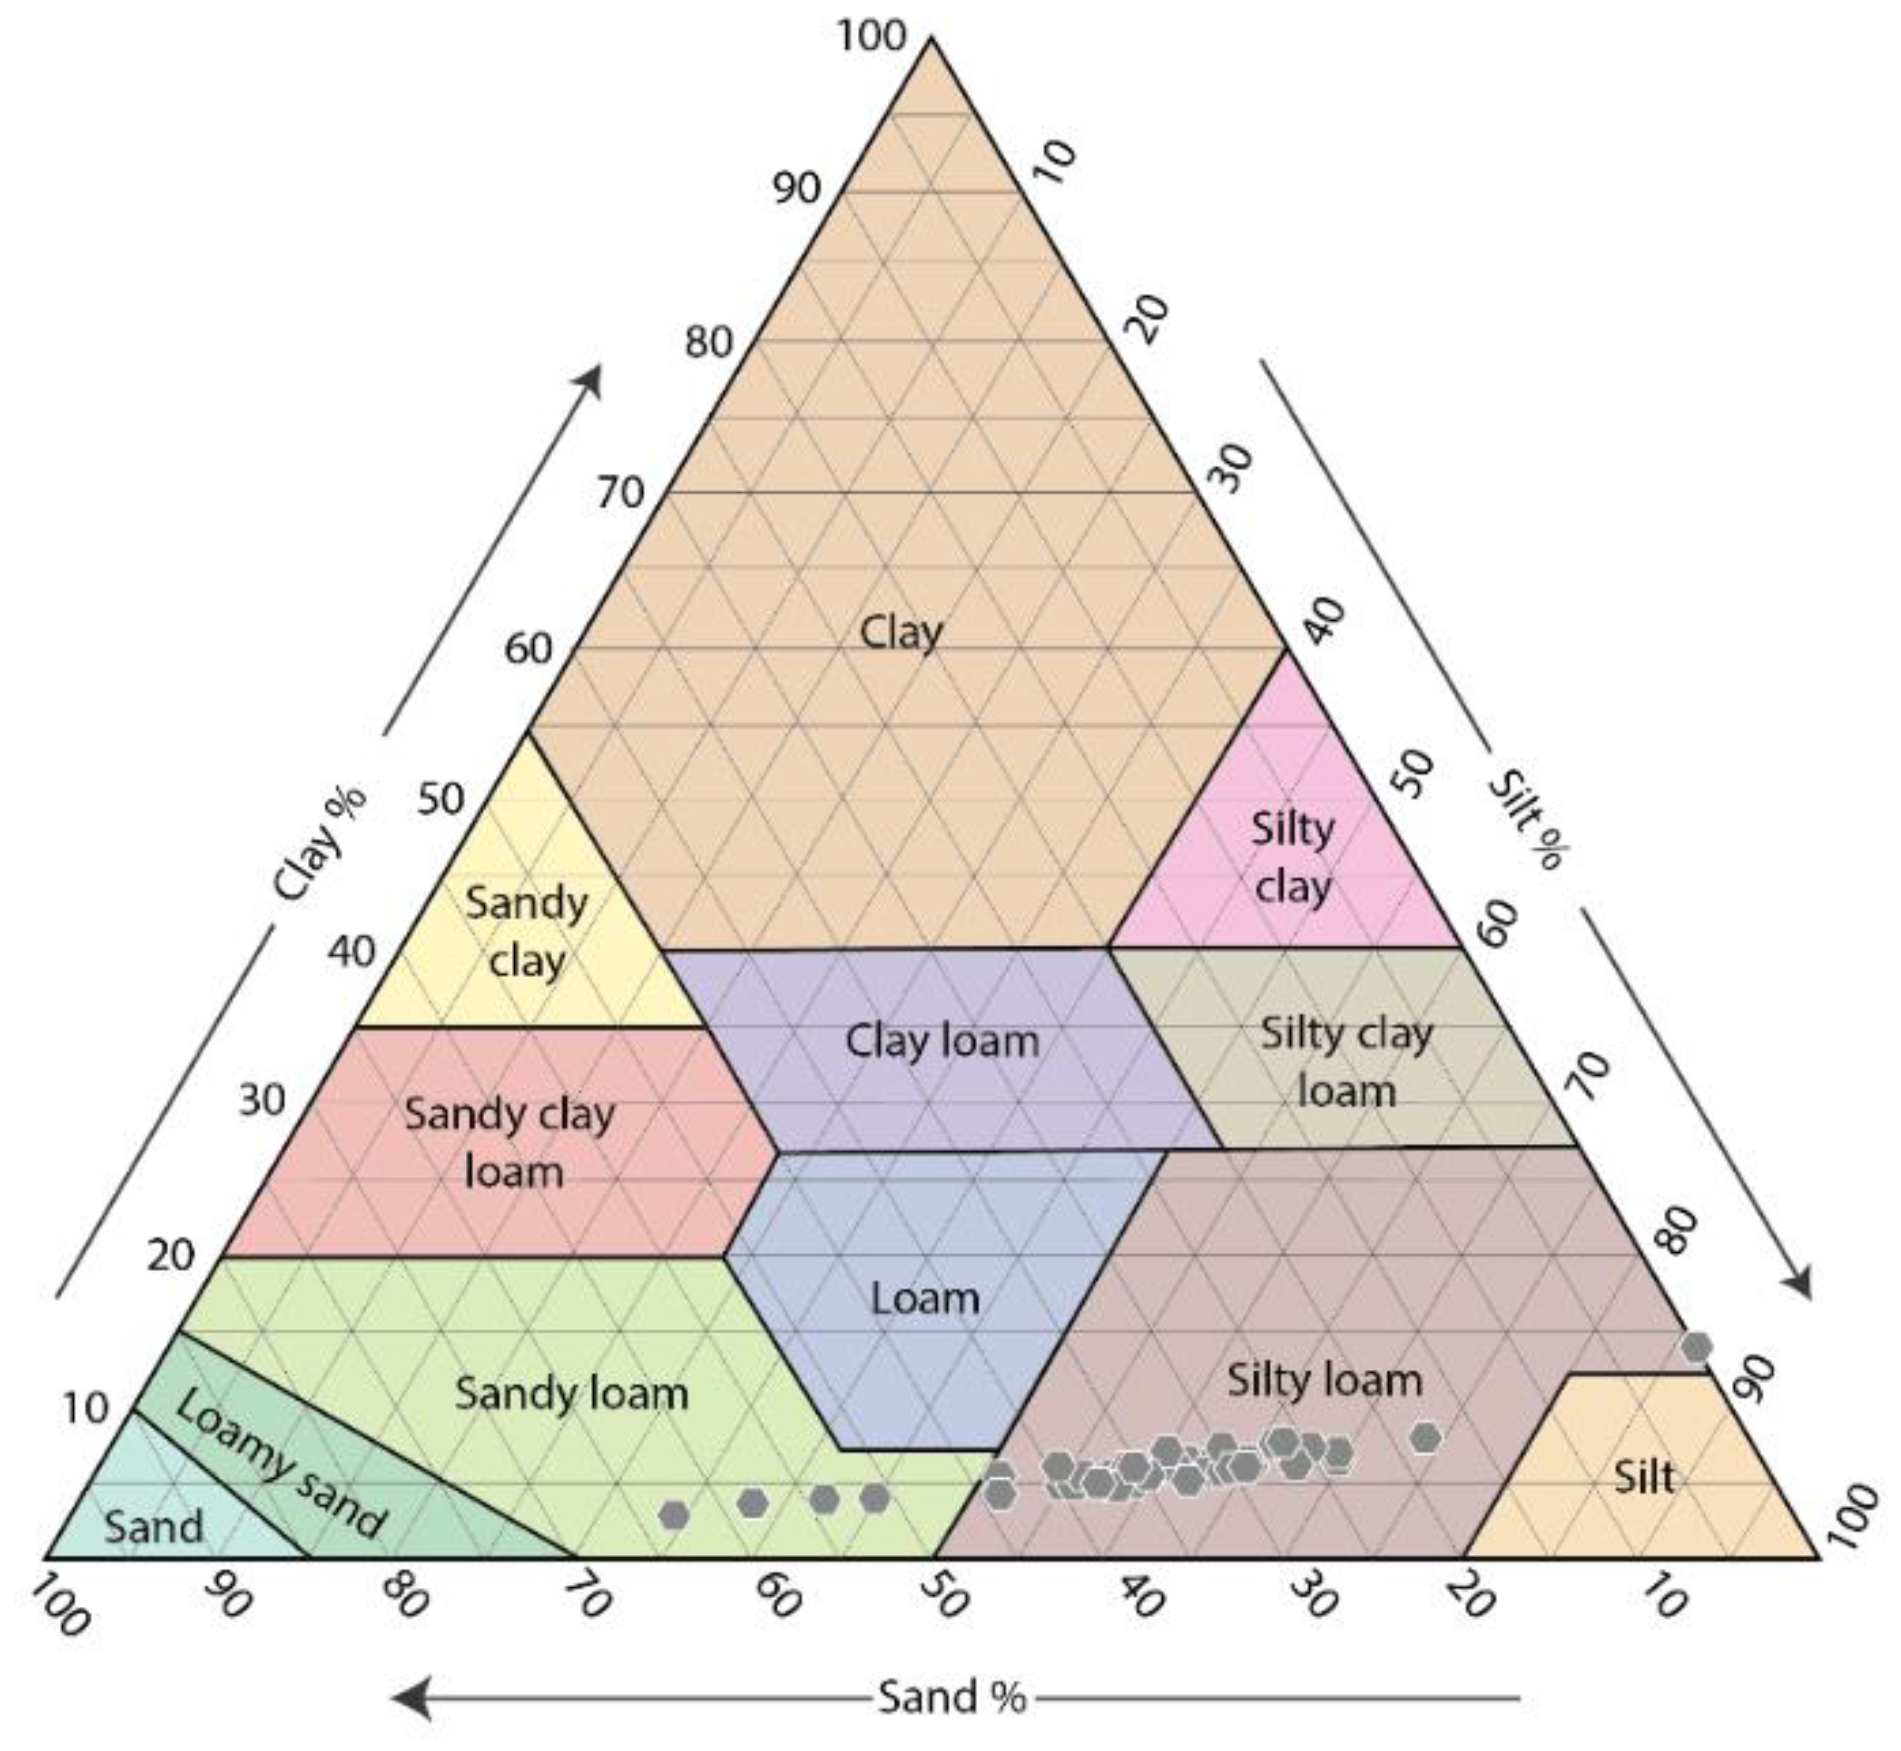
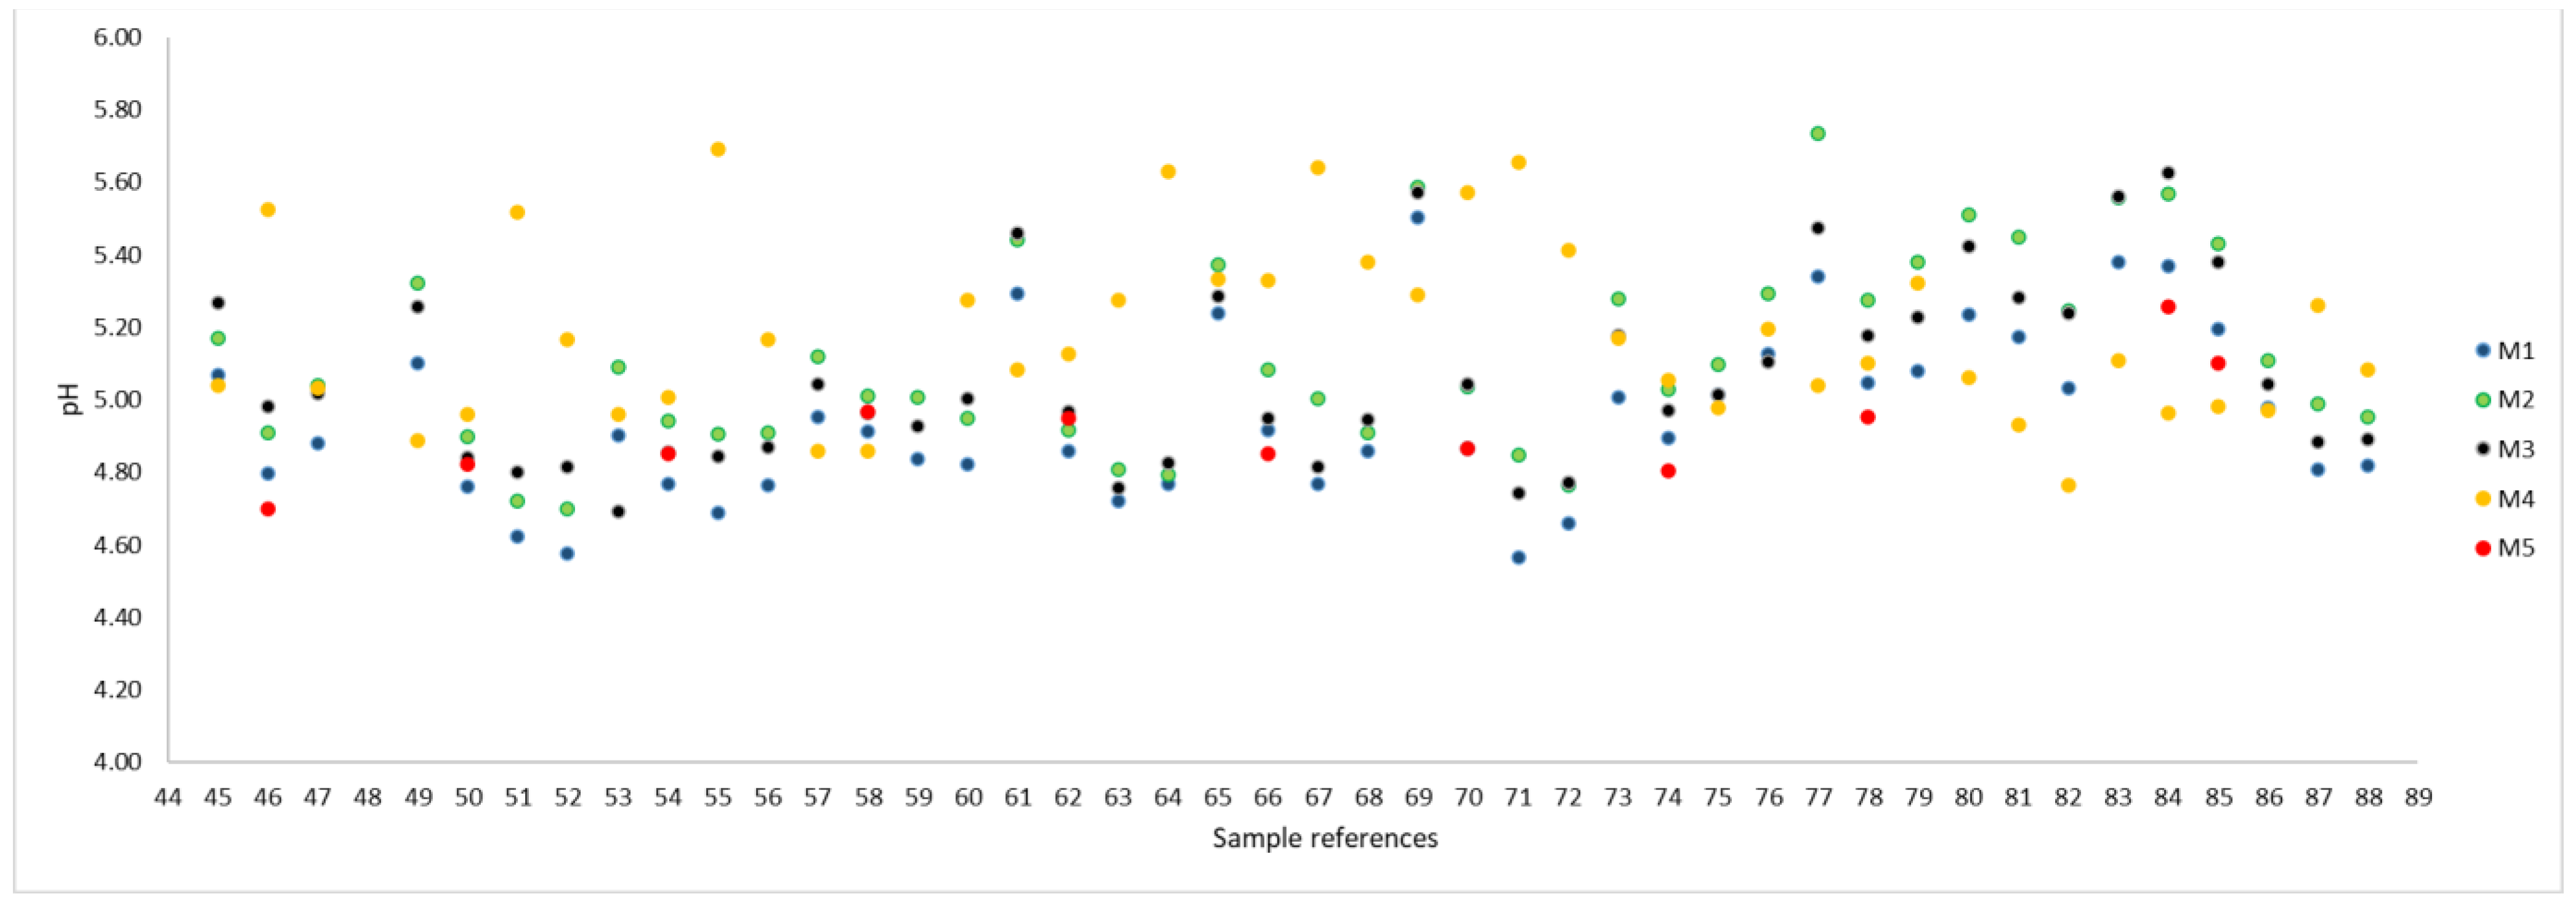
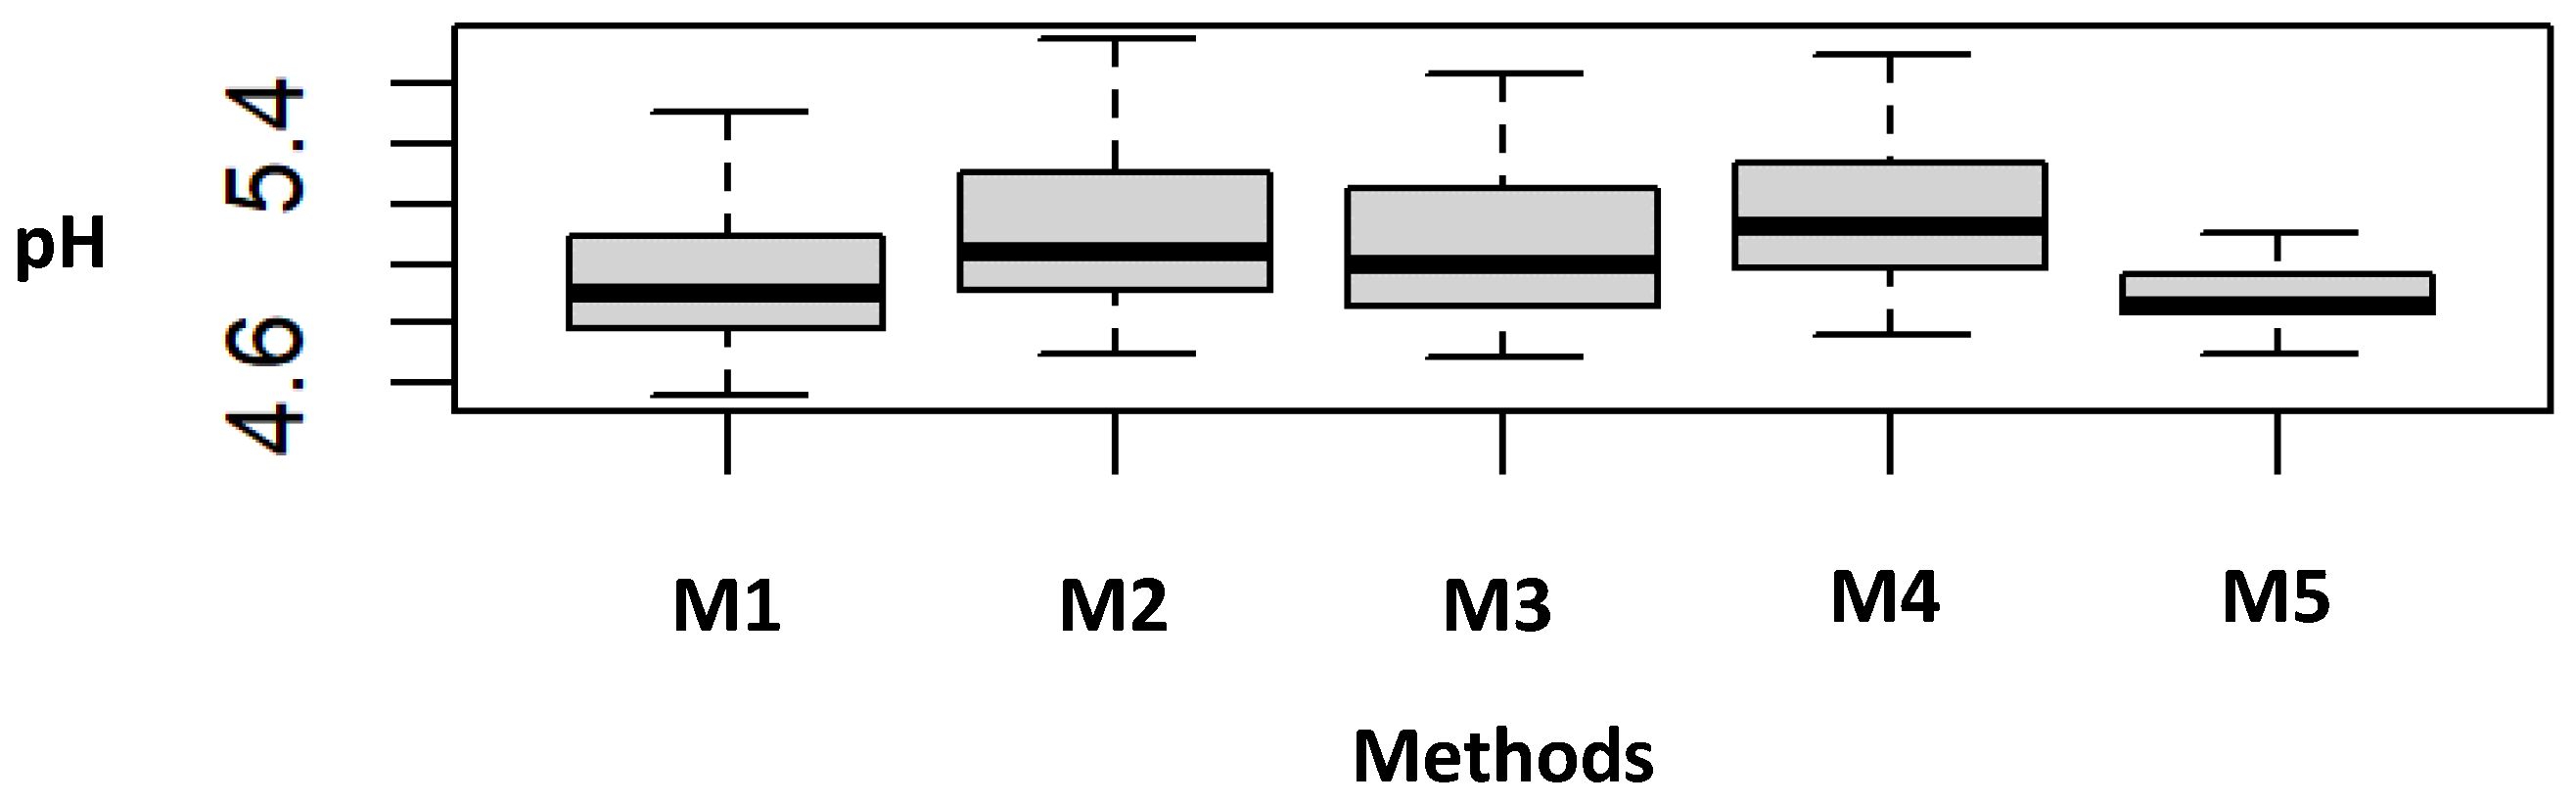
3.1. General Characterization of Soil Samples

The nature of the parent material and the respective mineralogy have an influence on the physical–chemical properties of the soil, such as pH and texture. In the Aveleda plot, mineralogical analysis of a <2 mm fraction by X-ray diffraction indicates the dominance of the following minerals: mica (muscovite) ≥ quartz > plagioclase > K-feldspar >> clay minerals >> goethite. The finest fraction (<2 µm) is generally composed of illite, kaolinite, chlorite, and goethite (Figure 3).
Regarding the soil texture, most of the samples have a classification of silty loam with the same coarser soils falling into the sandy loam domain (Figure 4). This coarse texture is in accordance with the lithology and respective assemblage of the minerals that compose the parent materials, such as quartz and micas.
The literature review indicated that pre-fire soil in this region has similar composition and textural characteristics [12,34].

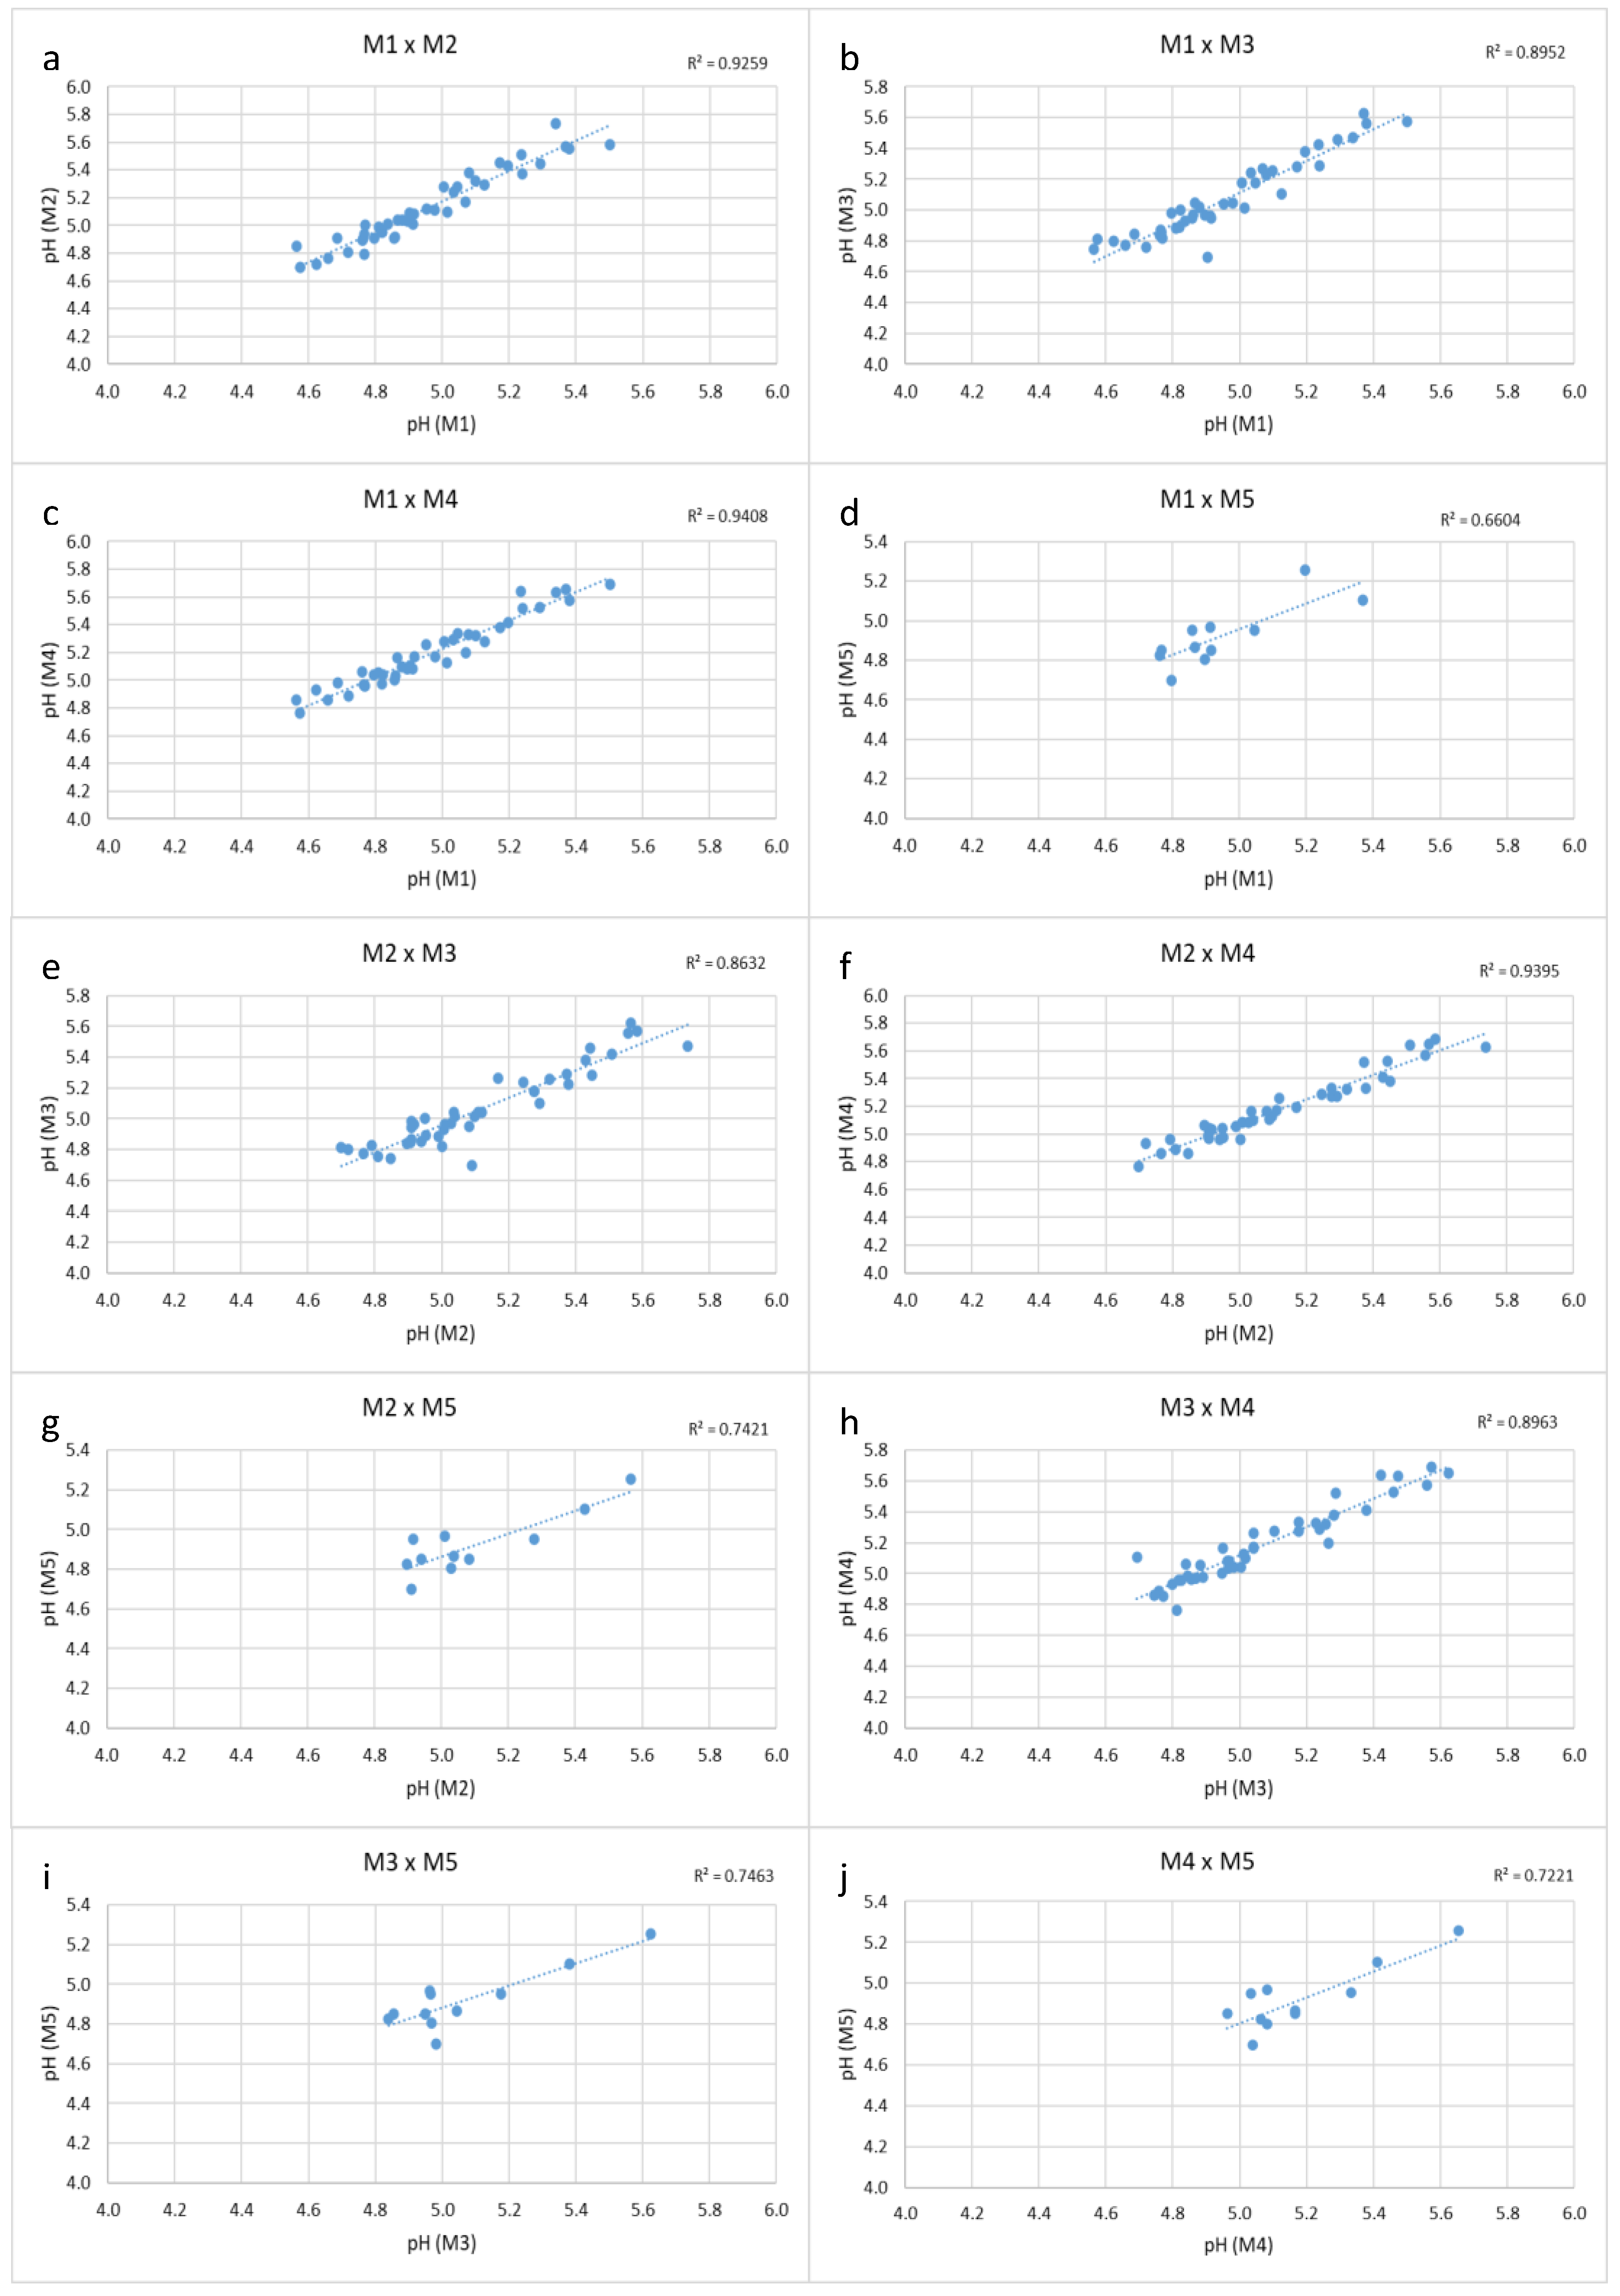
3.2. Contrast of pH Analytical Methods

Table 2 reports the statistical summary of the results obtained through the five methods. In general, the pH varies between 4.4 and 5.8, which indicates that samples correspond to acid soils according to the Pratolongo scale [47]. Like texture and mineralogy, the acidic values agree with the nature of the parent material. In addition, the pH values are in the same acidic range observed in the region of the Montesinho Natural Park for unburnt soils. The low intensity of the prescribed fire should explain this similarity. Therefore, even though it is known that fire affects soil properties in a complex manner, complete combustion should not occur in temperatures below 450–500 °C [48].
Indeed, the washing of soluble salts, especially after the first rains in the summer can promote alkalinity. However, this is not the case of the present study, as the prescribed fire occurred in winter. It is also known that fire can provide ashes, which are rich in bases as magnesium, potassium, and calcium with consequent increase in soil pH in acidic and neutral soils. Nevertheless, as mentioned before, the prescribed fire was of low intensity. Therefore, it was not expected to observe important increases in pH associated with degradation of organic matter and washing of bases since the temperature did not exceed 200 °C.
The analysis of Table 2, integrated with the information in Figure 5 and Figure 6, indicates that the highest average was observed with M4, while the lowest values occurred with M5.
Figure 6 on the variance and dispersion of the data, represented by the amplitude in the boxplot, presents slight differences between the methods, with M5 standing out with the smallest variation and M2 with the greatest variability and amplitude of pH values.
It can also be seen that M1 and M4 have a symmetric distribution, as M2 and M3 are slightly negatively asymmetric with respect to their median [46,49].
A comparison of methods was performed using linear regression (Figure 7a–j). The higher correlations occurred between M1 and M2 (R2 = 0.9259), M1 and M4 (R2 = 0.9408), and M2 and M4 (R2 = 0.9395). Lower correlations were observed in the case of regressions involving M5, which is the method with the lowest number of samples (11). The lowest value was obtained for the correlation between M1 and M5 (R2 = 0.6604). Therefore, the results suggest that the two closest methods might be M1 and M4, in accordance with the obtained correlations.
The state of the art indicates that analysis of soil pH can be affected by factors such as the soil:solution ratio, ionic strength of the soil solution, and stirring of the suspension during pH measurement. Moreover, apparently minor aspects such as the position of the electrodes in the suspension could also affect pH results [50].
An important difficulty in pH measurement is related with the suspension effect and settling of solids in the suspension; research works [51,52] report an apparent decrease in pH values when a probe is moved between the supernatant and the settled solids of the suspension; the explanation for this fact, however, is completely clear [22]. For this reason, the measurements were always performed in the supernatant, avoiding contact with the settled solids.
The obtained results (Figure 5) suggest an increase in pH proportionally to the sample dilution, as stated by the work of Hendershot and Lalande, [53], which defends the notion that pH measurement of soils in water represents the closest pH value of the field solution.
Longer contact time allows greater individualization of the particles and a greater contact surface of the mixture, that is, greater contact between materials of different natures. The resting time allows sedimentation and reduces the effect of the presence of particles that can affect the measurement. Therefore, after agitation, higher resting times should better contribute to exclusion of the particles in the supernatant, allowing a more stable measurement.
The p-values in Table 3 indicate that only M3 and M4 do not follow a normal distribution. However, to perform ANOVA using the F-test, it is not necessary that the data follow a normal distribution. Thus, the analysis proceeded by comparison of the variances of the five methods among themselves.
By analyzing Table 3, given that there are no differences between the variances if p-value is greater than the significance level (α = 0.05), it can be concluded that there are no significant differences between the variances of the methods. This means that any of the five methods is plausible to be used in soil pH analysis of these samples.
It seems reasonable, therefore, that it would be recommended that future studies clearly indicate the analytical methods considered in soil reaction, justifying the chosen method.

4. Conclusions

A comparison of five analytical methods was performed for determination of pH in water in samples of recently burnt soils. Under consistent criteria for soil analysis diagnostic purposes, our finding showed that soil pH measurements indicated acidic values of pH in the range between 4.4 and 5.8 in accordance with the lithology, and in the same acidic range of unburnt soils in the area. The analytical protocols were selected based on their differences regarding the soil:water ratio (1:2.5 or 1:5), the stirring time at 250 rpm (10 min or 1 h), and the settling time before reading (15 min or 8 h).
Although analysis of samples by the five different methods indicated some variation in pH values, the ANOVA suggests that there are no statistically significant differences. Therefore, the obtained results indicate that the protocols tested and discussed in the present study are suitable for measuring the pH of burnt soils. Since different methods presented different amplitudes for each sample, it was not possible to identify one that stood out. However, when it comes to optimizing the process of analysis, it might be interesting to recommend a cost-effective method. Therefore, the present study allows to suggest the best option: M1 fits best based on time and sample consumption. In this method, 10 g of the sample is stirred at 250 rpm for 10 min, and then the measurements are conducted after a settling time of 15 min. Moreover, M1 has a low soil:water ratio (1:2.5). This may be contributing to lower pH variation as indicated by statistical analysis, associated with a reduced dilution.
Following the findings, it is worth emphasizing the importance of defining specific methods for the determination of soil reaction in post-fire soils given the absence of specific methodologies.

Author Contributions

Conceptualization, T.V., T.F. and C.D.M.; methodology, M.F., T.B., M.C., F.F., A.S.B. and A.B.; investigation, T.V., T.F, M.C., C.D.M. and A.S.B.; resources, T.V., T.F., R.J.-B. and C.D.M.; writing—original draft preparation, M.F., T.B. and A.B.; writing—review and editing, R.J.-B., T.V., A.S.B. and M.C. All authors have read and agreed to the published version of the manuscript.

Funding

This research was funded by the European Regional Development Fund (FEDER) through the Interreg V-A Spain-Portugal program (POCTEC) 2014–2020 (Project 0701_TERRAMATER_1_E). This work was also co-funded by Foundation for Science and Technology (FCT, Portugal) through projects UIDB/04683/2020, UIDP/04683/2020 (ICT); and by national funds FCT/MCTES (PIDDAC) to CIMO (UIDB/00690/2020 and UIDP/00690/2020), and SusTEC (LA/P/0007/2020).

Informed Consent Statement

Not applicable.

Data Availability Statement

The data and materials will be made available from the corresponding author(s) upon reasonable request.

Acknowledgments

The authors acknowledge project 0701_TERRAMATER_1_E—Medidas Inovadoras de Recuperação Preventiva em Áreas de Queimadas, co-financed by the European Regional Development Fund (FEDER) through the Interreg V-A Spain-Portugal program (POCTEC) 2014–2020. This work was also co-funded by FCT through projects UIDB/04683/2020, UIDP/04683/2020. The authors also appreciate the valuable comments and suggestions made by the editor and three anonymous reviewers.

Conflicts of Interest

The authors declare no conflict of interest.

References

  1. Bargrizan, S.; Smernik, R.; Mosley, L. Development of a Spectrophotometric Method for Determining pH of Soil Extracts and Comparison with Glass Electrode Measurements. Soil Sci. Soc. Am. J. 2017, 81, 1350–1358. [Google Scholar] [CrossRef]
  2. McCauley, A.; Jones, C.; Olson-Rutz, K. Soil pH and Organic Matter. In Nutrient Management Module No. 8; Montana State University Extension: Bozeman, MT, USA, 2009; p. 16. [Google Scholar]
  3. Motavalli, P.P.; Palm, C.A.; Parton, W.J.; Elliot, E.T.; Frey, S.D. Soil pH and organic C dynamics in tropical forest soils: Evidence from laboratory and simulation studies. Soil Biol. Biochem. 1995, 27, 1589–1599. [Google Scholar] [CrossRef]
  4. Murphy, J.D.; Johnson, D.W.; Miller, W.W.; Walker, R.F.; Carroll, E.F.; Blank, R.R. Wildfire effects on soil nutrients and leaching in a Tahoe basin watershed. J. Environ. Qual. 2006, 35, 479–489. [Google Scholar] [CrossRef] [Green Version]
  5. Bodì, M.; Mataix-Solera, J.; Doerr, S.; Cerdà, A. The wettability of ash from burned vegetation and its relationship to Mediterra-nean plant species type, burn severity and total organic carbon content. Geoderma 2011, 160, 599–607. [Google Scholar] [CrossRef]
  6. Chungu, D.; Ng’andwe, P.; Mubanga, H.; Chileshe, F. Fire alters the availability of soil nutrients and accelerates growth of Eucalyptus grandis in Zambia. J. For. Res. 2020, 31, 1637–1645. [Google Scholar] [CrossRef] [Green Version]
  7. Zbíral, J. Comparison of methods for soil pH determination. Rostl. Vyrob. 2001, 47, 463–466. [Google Scholar]
  8. Elberling, B.; Matthiesen, H. Methodologically controlled variations in laboratory and field pH measurements in waterlogged soils. Eur. J. Soil Sci. 2007, 58, 207–214. [Google Scholar] [CrossRef]
  9. Quigley, M.N.; Reid, W.S. Comparison of a combination pH electrode and field effect transistor electrode for the determination of soil pH and lime requirement. Commun. Soil Sci. Plant Anal. 2008, 26, 3371–3383. [Google Scholar] [CrossRef]
  10. Miller, R.O.; Kissel, D.E. Comparison of Soil pH Methods on Soils of North America. Soil Sci. Soc. Am. J. 2010, 74, 310–316. [Google Scholar] [CrossRef]
  11. Kalra, Y.P. Determination of pH of Soils by Different Methods: Collaborative Study. J. AOAC Int. 1995, 78, 310–324. [Google Scholar] [CrossRef]
  12. Fonseca, F.; Figueiredo, T.; Nogueira, C.; Queirós, A. Effect of prescribed fire on soil properties and soil erosion in a Mediter-ranean mountain area. Geoderma 2017, 307, 172–180. [Google Scholar] [CrossRef]
  13. Fornasier, E.; Fornasier, F.; Di Marco, V. Spectrophotometric methods for the measurement of soil pH: A reappraisal, Spectro-chim. Acta—Part A Mol. Biomol. Spectrosc. 2018, 204, 113–118. [Google Scholar] [CrossRef] [PubMed]
  14. Kumar, S.; Kumar, B.; Thakur, R.; Kumar, M. Soil pH Sensing Techniques and Technologies—A Review. International Journal of Advanced Research in Electrical. Electron. Instrum. Eng. (IJAREEIE) 2015, 4, 2320–3765. [Google Scholar]
  15. Das, P.; Paul, S.; Bhattacharya, S.S.; Nath, P. Smartphone-Based Spectrometric Analyzer for Accurate Estimation of pH Value in Soil. IEEE Sens. J. 2021, 21, 2839–2845. [Google Scholar] [CrossRef]
  16. Bargrizan, S.; Smernik, R.J.; Mosley, L.M. Spectrophotometric measurement of the pH of soil extracts using a multiple indica-tor dye mixture. Eur. J. Soil Sci. 2019, 70, 411–420. [Google Scholar] [CrossRef]
  17. Kuang, B.; Tekin, Y.; Mouazen, A.M. Comparison between artificial neural network and partial least squares for on-line visible and near infrared spectroscopy measurement of soil organic carbon, pH and clay content. Soil Tillage Res. 2015, 146, 243–252. [Google Scholar] [CrossRef]
  18. Mouazen, A.M.; Kuang, B.; De Baerdemaeker, J.; Ramon, H. Comparison among principal component, partial least squares and back propagation neural network analyses for accuracy of measurement of selected soil properties with visible and near infrared spectroscopy. Geoderma 2010, 158, 23–31. [Google Scholar] [CrossRef]
  19. Thiele-Bruhn, S.; Wessel-Bothe, S.; Aust, M.O. Time-resolved in-situ pH measurement in differently treated, saturated and unsaturated soils. J. Plant Nutr. Soil Sci. 2015, 78, 425–432. [Google Scholar] [CrossRef]
  20. Hongbo, C.; Hansen, E.H.; Růǐčka, J. Evaluation of critical parameters for measurement of pH by flow injection analysis de-termination of pH in soil extracts. Anal. Chim. Acta. 1985, 169, 209–220. [Google Scholar] [CrossRef]
  21. Decker, M.; Bause, S.; Teichmann, P.; Schneider, M.; Vonau, W. Development of an automatic system for the on-site pH meas-urement of soil samples. Tech. Mess. 2017, 84, 659–671. [Google Scholar] [CrossRef]
  22. Matthiesen, H. In situ measurement of soil pH. J. Archaeol. Sci. 2004, 31, 1373–1381. [Google Scholar] [CrossRef]
  23. FAO 2021; Standard Operating Procedure for Soil pH Determination. FAO: Rome, Italy, 2021; 23p.
  24. ISO 2021—ISO 10390:2021; Soil Quality—Determination of pH. ISO: Geneva, Switzerland, 2021. Available online: https://www.iso.org/standard/75243.html (accessed on 1 March 2022).
  25. BS 2018. British Standard BS 1377-3:2018 Part 3—Chemical and Electro-Chemical Tests. Available online: https://989me.vn/en/download/Other-Items/BS-1377-3-1990-Methods-of-test-for-Soils-for-civil-engineering-purposes-Part-3-Chemical-and-electro-chemical-tests.html (accessed on 1 March 2022).
  26. Marguesin, R.; Shinner, F. (Eds.) Manual of Soil Analysis-Monitoring and Assessing Soil Bioremediation; Springer: Berlin/Heidelberg, Germany, 2005; 366p. [Google Scholar]
  27. EMBRAPA Manual de Métodos de Análise de Solo. 2017, p. 212. Available online: http://www.infoteca.cnptia.embrapa.br/handle/doc/330804 (accessed on 1 March 2002).
  28. Fernández-García, V.; Marcos, E.; Fernández-Guisuraga, J.M.; Taboada, A.; Suarez-Seoane, S.; Calvo, L. Impact of burn severity on soil pro-perties in a Pinus pinaster ecosystem immediately after fire. Int. J. Wildland Fire 2019, 28, 354–367. [Google Scholar] [CrossRef]
  29. Keesstra, S.; Wittenberg, L.; Maroulis, J.; Sambalino, F.; Malkinson, D.; Cerda, A.; Pereira, P. The influence of fire history, plant species and post-fire management on soil water repellency in a Mediterranean catchment: The Mount Carmel range. Catena 2017, 149, 827–866. [Google Scholar] [CrossRef]
  30. Fernández-García, V.; Miesel, J.; Baeza, M.J.; Marcos, E.; Calvo, L. Wildfire effects on soil properties in fire-prone pine ecosystems: Indicators of burn severity legacy over the medium term after fire. Appl. Soil Ecol. 2019, 135, 147–156. [Google Scholar] [CrossRef] [Green Version]
  31. Pinto de Meireles, C.A.; Pereira, D.Í.; Alves, M.I.C.; Pereira, P. Interesse patrimonial dos aspectos geológicos e geomorfológicos da região de Aveleda-Baçal, Parque Natural de Montesinho, NE de Portugal. Comun. Lnst. Geol. E Min. 2002, 89, 225–238. [Google Scholar]
  32. Bento, A.; Vieira, A. Fire effects on soil properties. In Proceedings of the 3rd International Meeting of Fire Effects on Soil Properties, Guimaraes, Portugal, 15–19 March 2011; Universidade do Minho: Braga, Portugal, 2011; ISBN 978-989-97214-0-1. [Google Scholar]
  33. Figueiredo, T.D.; Fonseca, F.; Queirós, A. Efeitos do fogo na erosão do solo em áreas de matos: Resultados de um ano de en-saio no Parque Natural de Montesinho. In Incêndios Florestais, Erosão, Degrad. e Medidas Recuper. Dos Solos; Bento, A., Vieira, A., Eds.; Universidade do Minho: Braga, Portugal, 2013; pp. 267–277. [Google Scholar]
  34. Figueiredo, T.D. Uma Panorâmica Sobre os Recursos Pedológicos do Nordeste Transmontano; Instituto Politécnico de Bragança: Bragança, Portugal, 2013; ISBN 978-972-745-138-8. [Google Scholar]
  35. Certini, G. Effects of fire on properties of forest soils: A review. Oecologia 2005, 143, 1–10. [Google Scholar] [CrossRef] [PubMed]
  36. Notario, J.; Dorta, I.; Rodríguez, A.; Arbelo, C.; Navarro, F.J.; Mora, J.L.; Armas, C.M.; Guerra, J.A. Analysis of the 1:5 soil: Water extract in burn soils to evaluate fire severity. Catena 2008, 74, 246–255. [Google Scholar] [CrossRef]
  37. Peech, M. Hydrogen Ion Activity. In Methods of Soil Analysis, Part 2; Black, C.A., Angle, J.S., Weaver, R.W., Eds.; American Society of Agronomy: Madison, WI, USA, 1965; pp. 914–926. [Google Scholar]
  38. Van Lierop, W.; Mackenzie, A.F. Soil pH measurement and its application to organic soils. Can. J. Soil Sci. 1977, 57, 55–64. [Google Scholar] [CrossRef] [Green Version]
  39. Davey, B.G.; Conyers, M.K. Determining the pH of acid soils. Soil Sci. 1988, 146, 141–150. [Google Scholar] [CrossRef]
  40. Burt, R.; Staff, S.S. Kellog Soil Survey Laboratory Methods Manual. In Natural Resources Conservation Services, U.S.D.o.A.; National Soil Survey Center: Lincoln, NE, USA, 2014. Available online: https://www.nrcs.usda.gov/sites/default/files/2022-10/SSIR42-v6-pt1.pdf (accessed on 1 March 2022).
  41. Rossa, U. Estimativa de Calagem Pelo Método Smp Para Alguns Solos Do Paraná. Master’s Thesis, Universidade Federal do Paraná, Paraná, Brasil, 2006; 124p. (In English). [Google Scholar]
  42. Shapiro, S.; Wilk, M. An analysis of variance test for normality (complete samples). Biometrika 1965, 52, 591–611. [Google Scholar] [CrossRef]
  43. Kaufmann, J.; Schering, A.G. Analysis of Variance ANOVA; John Wiley & Son: New York, NY, USA, 2014; ISBN 9781118445112. [Google Scholar] [CrossRef] [Green Version]
  44. Pereira, N.J.T. Composting Manual: Low Cost Process; UFV: Vicosa, Brazil, 2007. (In Portuguese) [Google Scholar]
  45. Jiménez, E.I.; García, V.P. Composting of domestic refuse and sewage sludge. I. Evolution of temperature, pH, C/N ratio and cation-exchange capacity, Resources. Conserv. Recycl. 1991, 6, 45–60. [Google Scholar] [CrossRef]
  46. Neves, A.C.; da Costa, P.; Silva, C.A.D.O.; Pereira, F.R.; Mol, M.P.G. Analytical methods comparison for pH determination of composting process from green wastes. Environ. Eng. Manag. J. 2021, 20, 133–139. [Google Scholar] [CrossRef]
  47. Botelho da Costa, J. Caracterização e constituição do solo. In Fundação Calouste Gulbenkian, 5th ed.; Fundação Calouste Gulbenkian: Lisboa, Portugal, 1994; 527p. [Google Scholar]
  48. Ciampa, A.; Benedetti, A.; Sequi, P.; Valentini, M. Effects of a fire event on the soil organic matter of a pine forest and a pasture. Agrochimica 2009, 53, 41–55. [Google Scholar]
  49. Shenhar, A.; Kuselman, I. Uncercainty in chemical analysis and validation of the analytical method: Acid value determination in soils. Accredit. Qual. Assur. 1997, 2, 180–185. [Google Scholar]
  50. Rueter, D.J.; Peverill, K.I.; Sparrow, L.A. Soil pH. In Soil Analysis: An interpretation Manual; CSIRO Publ.: Sydney, Australia, 1999; pp. 104–116. [Google Scholar]
  51. Gorham, E. The pH of fresh soils and soil solutions. Ecology 1960, 41, 563. [Google Scholar] [CrossRef]
  52. Ponnamperuma, F.N.; Martinetz, E.; Loy, T. Influence of redox potential and partial pressure of carbon dioxide on pH values and the suspension effect of flooded soils. Soil Sci. 1966, 101, 421–431. [Google Scholar] [CrossRef]
  53. Hendershot, W.H.; Lalande, H. Soil Reaction and Exchangeable Acidity. In Soil Sampling and Methods of Analysis; Carter, M.R., Gregorich, E.G., Eds.; Taylor & Francis Group: Boca Raton, FL, USA, 2010; pp. 173–217. [Google Scholar]
Figure 1. Location map of the area used for soil sampling within the Montesinho Natural Park. Yellow star represents the Aveleda plot used for samples collection.
Fire 06 00227 g001
Figure 2. Illustration of laboratory material and devices used in the measurement experiments.
Fire 06 00227 g002
Figure 3. XRD patterns (typical sample) of <2 mm fraction (random powder) and of oriented mounts showing d values (Å) of <2 µm fraction, of a typical sample. Mi—Mica; Q—Quartz; F—K-feldspar; P—Plagioclase; C—Chlorite; Il—Illite; K—Kaolinite; Go—Goethite.
Fire 06 00227 g003
Figure 4. Textural classification of soil samples.
Fire 06 00227 g004
Figure 5. Average pH value of each sample in the five methods used.
Fire 06 00227 g005
Figure 6. Boxplot in relation to the analytical results of the five methods.
Fire 06 00227 g006
Figure 7. Linear regression between the five methods used (a—M1 × M2; b—M1 × M3; c—M1 × M4; d—M1 × M5; e—M2 × M3; f—M2 × M4; g—M2 × M5; h—M3 × M4; i—M3xM5; j—M4 × M5).
Fire 06 00227 g007
Table 1. Tested methods for measurement of pHH2O and protocol characteristics.
MethodSolid–Liquid SuspensionStirring TimeResting TimeBibliography Reference
M11:2.5
(10 g to 25 mL)
10 min15 minRossa (2006) [41]
M21:5
(5 g to 25 mL)
10 min15 minEmbrapa (1997) [27]
M31:5
(5 g to 25 mL)
1 h15 minMargesin and Schinner (2005) [26]
M41:5
(10 g to 50 mL)
10 min15 minISO 10390 (2005) [24]
M51:2.5
(10 g to 25 mL)
10 min8 hBS (2018) [25]
Table 2. Statistical summary of the pH readings.
MethodM1M2M3M4M5
N4343434311
Average4.955.125.075.184.92
Median4.905.045.005.124.87
Minimum4.574.704.694.764.70
Maximum5.505.735.625.695.26
Standard Deviation0.230.260.250.240.15
Standard Error0.040.040.040.040.05
Variance0.050.070.060.060.02
Table 3. Summary of the p-values obtained in the R software by comparing the variances of the five methods used.
Methodsp-Value
M1 × M20.3917
M1 × M30.5787
M1 × M40.7581
M1 × M50.5289
M2 × M30.7626
M2 × M40.5865
M2 × M50.2426
M3 × M40.8126
M3 × M50.1784
M4 × M50.3825
Disclaimer/Publisher’s Note: The statements, opinions and data contained in all publications are solely those of the individual author(s) and contributor(s) and not of MDPI and/or the editor(s). MDPI and/or the editor(s) disclaim responsibility for any injury to people or property resulting from any ideas, methods, instructions or products referred to in the content.

