Article

Unraveling the Effect of Fire Seasonality on Fire-Preferred Fuel Types and Dynamics in Alto Minho, Portugal (2000–2018)

1
International PhD School (EDIUS), Department of Agro-Forestry Engineering, University of Santiago de Compostela, Rúa Benigno Ledo, 27002 Lugo, Spain
2
Centre for the Research and Technology of Agro-Environmental and Biological Sciences, CITAB, University of Trás-os-Montes and Alto Douro, Quinta dos Prados, 5000-801 Vila Real, Portugal
3
Department of Agro-Forestry Engineering, University of Santiago de Compostela, Rúa Benigno Ledo, 27002 Lugo, Spain
4
MED—Mediterranean Institute for Agriculture, Environment and Development & CHANGE—Global Change and Sustainability, University of Évora-PM, Apartado 94, 7006-554 Évora, Portugal
5
EaRSLab—Earth Remote Sensing Laboratory, University of Évora-CLV, Rua Romão Ramalho, 59, 7000-671 Évora, Portugal
6
IIFA—Institute for Advanced Studies and Research, University of Évora-PV, Largo Marquês de Marialva, Apartado 94, 7002-554 Évora, Portugal
*
Author to whom correspondence should be addressed.
Fire 2023, 6(7), 267; https://doi.org/10.3390/fire6070267
Submission received: 5 May 2023 / Revised: 28 June 2023 / Accepted: 4 July 2023 / Published: 6 July 2023
(This article belongs to the Special Issue Fire Regimes and Ecosystem Resilience)

Abstract

:
Socio-demographic changes in recent decades and fire policies centered on fire suppression have substantially diminished the ability to maintain low fuel loads at the landscape scale in marginal lands. Currently, shepherds face many barriers to the use of fire for restoring pastures in shrub-encroached communities. The restrictions imposed are based on the lack of knowledge of their impacts on the landscape. We aim to contribute to this clarification. Therefore, we used a dataset of burned areas in the Alto Minho region for seasonal and unseasonal (pastoral) fires. We conducted statistical and spatial analyses to characterize the fire regime (2001–2018), the distribution of fuel types and their dynamics, and the effects of fire on such changes. Unseasonal fires are smaller and spread in different spatial contexts. Fuel types characteristic of maritime pine and eucalypts are selected by seasonal fires and avoided by unseasonal fires which, in turn, showed high preference for heterogeneous mosaics of herbaceous and shrub vegetation. The area covered by fuel types of broadleaved and eucalypt forest stands increased between 2000 and 2018 at the expense of the fuel type corresponding to maritime pine stands. Results emphasize the role of seasonal fires and fire recurrence in these changes, and the weak effect of unseasonal fires. An increase in the maritime pine fuel type was observed only in areas burned by unseasonal fires, after excluding the areas overlapping with seasonal fires.

1. Introduction

Fire is an ecological process that has not only co-evolved with and shaped the structure and composition of a wide range of ecosystems since the advent of land plants, but also played a critical role in regulating vegetation feedbacks in atmospheric oxygen [1,2,3,4]. Although doubts remain about the moment when humans started to control and regularly use fire, there is evidence that in Europe fire began to be used as a technological tool between 300,000 to 400,000 years ago [5,6]. However, Daniau et al. [7] did not find evidence of extensive use of fire for managing ecosystems in western Europe until 10,000 years ago. According to Connor et al. [8], changes in fire regime in the Iberian Peninsula started 7500 years ago, but the most pronounced fire-induced landscape changes only become evident from 5500–5000 years BP onwards and have become more intense and persistent in the last two millennia. In the Iberian regions, fire as a landscape management tool was used by humans to expand pasture areas and soils for cereal production [9,10,11,12], showing additional effects of increasing soil fertility by recycling nutrients (ash-fertilization) and promoting healthy crops by controlling soil pathogens [13].
Currently, about 95% of rural fires in the Mediterranean region are of human origin (negligence, accidents, or arson) [14]. In the cultural landscapes of the Iberian Peninsula, natural fires represent a small fraction of the total number of fires larger than 0.01 ha [15]: 4.1% in Spain, and 1.1% in Portugal. Among the registered anthropogenic fire causes, 34.05% of the ignitions in Portugal [16,17] and 35.96% in Spain [18] are closely related to land management activities (accounting for 16.27% and 36.17% of the total registered burned area, respectively), such as slash-pile and agricultural stubble burnings, and pastoral fires to improve or restore grasslands. These rural fire use practices emerged from ancestral practical knowledge of landscape management [19] and are the result of cumulative and dynamic processes of learning by practice, generational knowledge transfer, and adaptation to changes over a long period [20]. Such cultural practices determine fire regimes at the local level and have contributed since ancient times to landscape heterogeneity and to ecosystems and biodiversity conservation [21,22,23]. Fire, for the traditional pastoral communities of the Iberian Peninsula, continues to be a critical tool for woody vegetation management and to promote and restore an herbaceous layer rich in palatable species to livestock [24,25,26,27], as in other regions across the Mediterranean basin [28,29,30].
However, European landscapes have changed significantly in recent decades [31,32,33]. In southern Europe, except for some regions where land use intensification was possible or encouraged (e.g., [34]), the most frequent processes of land use change are related to agricultural abandonment, decrease in livestock production and in forestry intensity [35,36,37,38,39]. De-intensification processes have often been identified as the factors driving changes in the fire regimes in the Iberian Peninsula as they result in wildland fuels accumulation and connectivity at the local (vertical) and landscape (horizontal) scales [40,41,42,43]. Contributing to this fuel accumulation, the effect of fire exclusion policies is not insignificant, which is translated in the scientific literature into a series of paradoxes [44,45,46]: “wildfire paradox”, “firefighting trap”, and “safe development paradox”. In general, the system is a victim of its own success. By managing to reduce the progression of ignitions that occur within meteorological thresholds favorable to fire suppression and, in the absence of other landscape management mechanisms that allow reducing the fuel load, it reduces pyrodiversity and increases the spatial connectivity of fuels, creating conditions conducive for increasingly larger [47] and extreme fires, such the ones observed in southern Europe in last six years [48,49,50,51,52].
Silvo-pastoral communities that traditionally use fire have been particularly affected by these fire suppression policies [53]. The disruption of these cultural burns, resulting from the successive constraints or prohibitions inscribed in the legislation that converted the traditional use of fire into “proscribed fires” or “proscribed burns”, has multiple effects that contribute to the occurrence of more complex fires: (a) it allows the encroachment of more flammable fuels [54]; (b) the marginalization of these cultural practices enhances the increase in illegal burning that is not properly monitored [55]; and (c) although fire is considered as “(…) an element of our farming culture”, as stated by Coutinho ([56], p. 35), the knowledge that guided its correct use is progressively lost [57].
Landscape–fire interactions are very complex and in face of extreme fire weather conditions, fire spread is not very responsive to land cover types [58,59,60] and, therefore, the role that these traditional fires play in maintaining a pyrodiverse mosaic in the landscape cannot be overlooked. Moreover, the operationalization of the paradigm shift identified by Moreira et al. [61], in the sense of measuring the effectiveness of fire management policies in terms of damage and losses in socio-ecological systems instead of the annual variation in the burned area, implies distinguishing the regimes and effects of different types of fires. Considering that the resilience of individuals, populations, and communities is determined by the fire regime [62], and not by the simple presence of the disturbance factor, the above-mentioned changes in fire regimes can catalyze dynamics in landscape structure and composition [63,64].
The need to apply “let it burn” approaches and adaptive prescribed burns is growing and is urgent, considering not only the most expected climate change scenarios [65], but also the current and future landscape trajectories that are strongly driven by rural abandonment [66], and respective effects in reducing the fire regulation capacity [43]. However, little is known about the fire regime associated with the unseasonal fires, and what effects they have on landscape and fuel dynamics. Fire seasonality is a critical component of the fire regime that, in cultural landscapes, reflects the combined effects of human activity, the use of fire for landscape management and local biophysical conditions, and understanding of which allows defining effective strategies to reduce the prevalence of extreme fires during the fire season [67,68,69].
In this way, this paper intends to contribute to consolidating scientific knowledge about: the fire regime in an area of northwest mainland Portugal, Alto Minho, where the traditional use of fire still has a strong presence; the fuel types affected by seasonal and unseasonal fires; and their role in fuel-type changes. To accomplish the overall objective, we compared the areas burned between 2001 and 2018 by seasonal (summer fires) and unseasonal fires to assess variability in: (a) fire metrics and regime sensu stricto (following Krebs et al.’s [70] definition); (b) the types of fuels affected through the Jacobs index [71]; and (c) the dynamics between fuel types in the period considered using transition matrices and applying logistic regression.

2. Materials and Methods
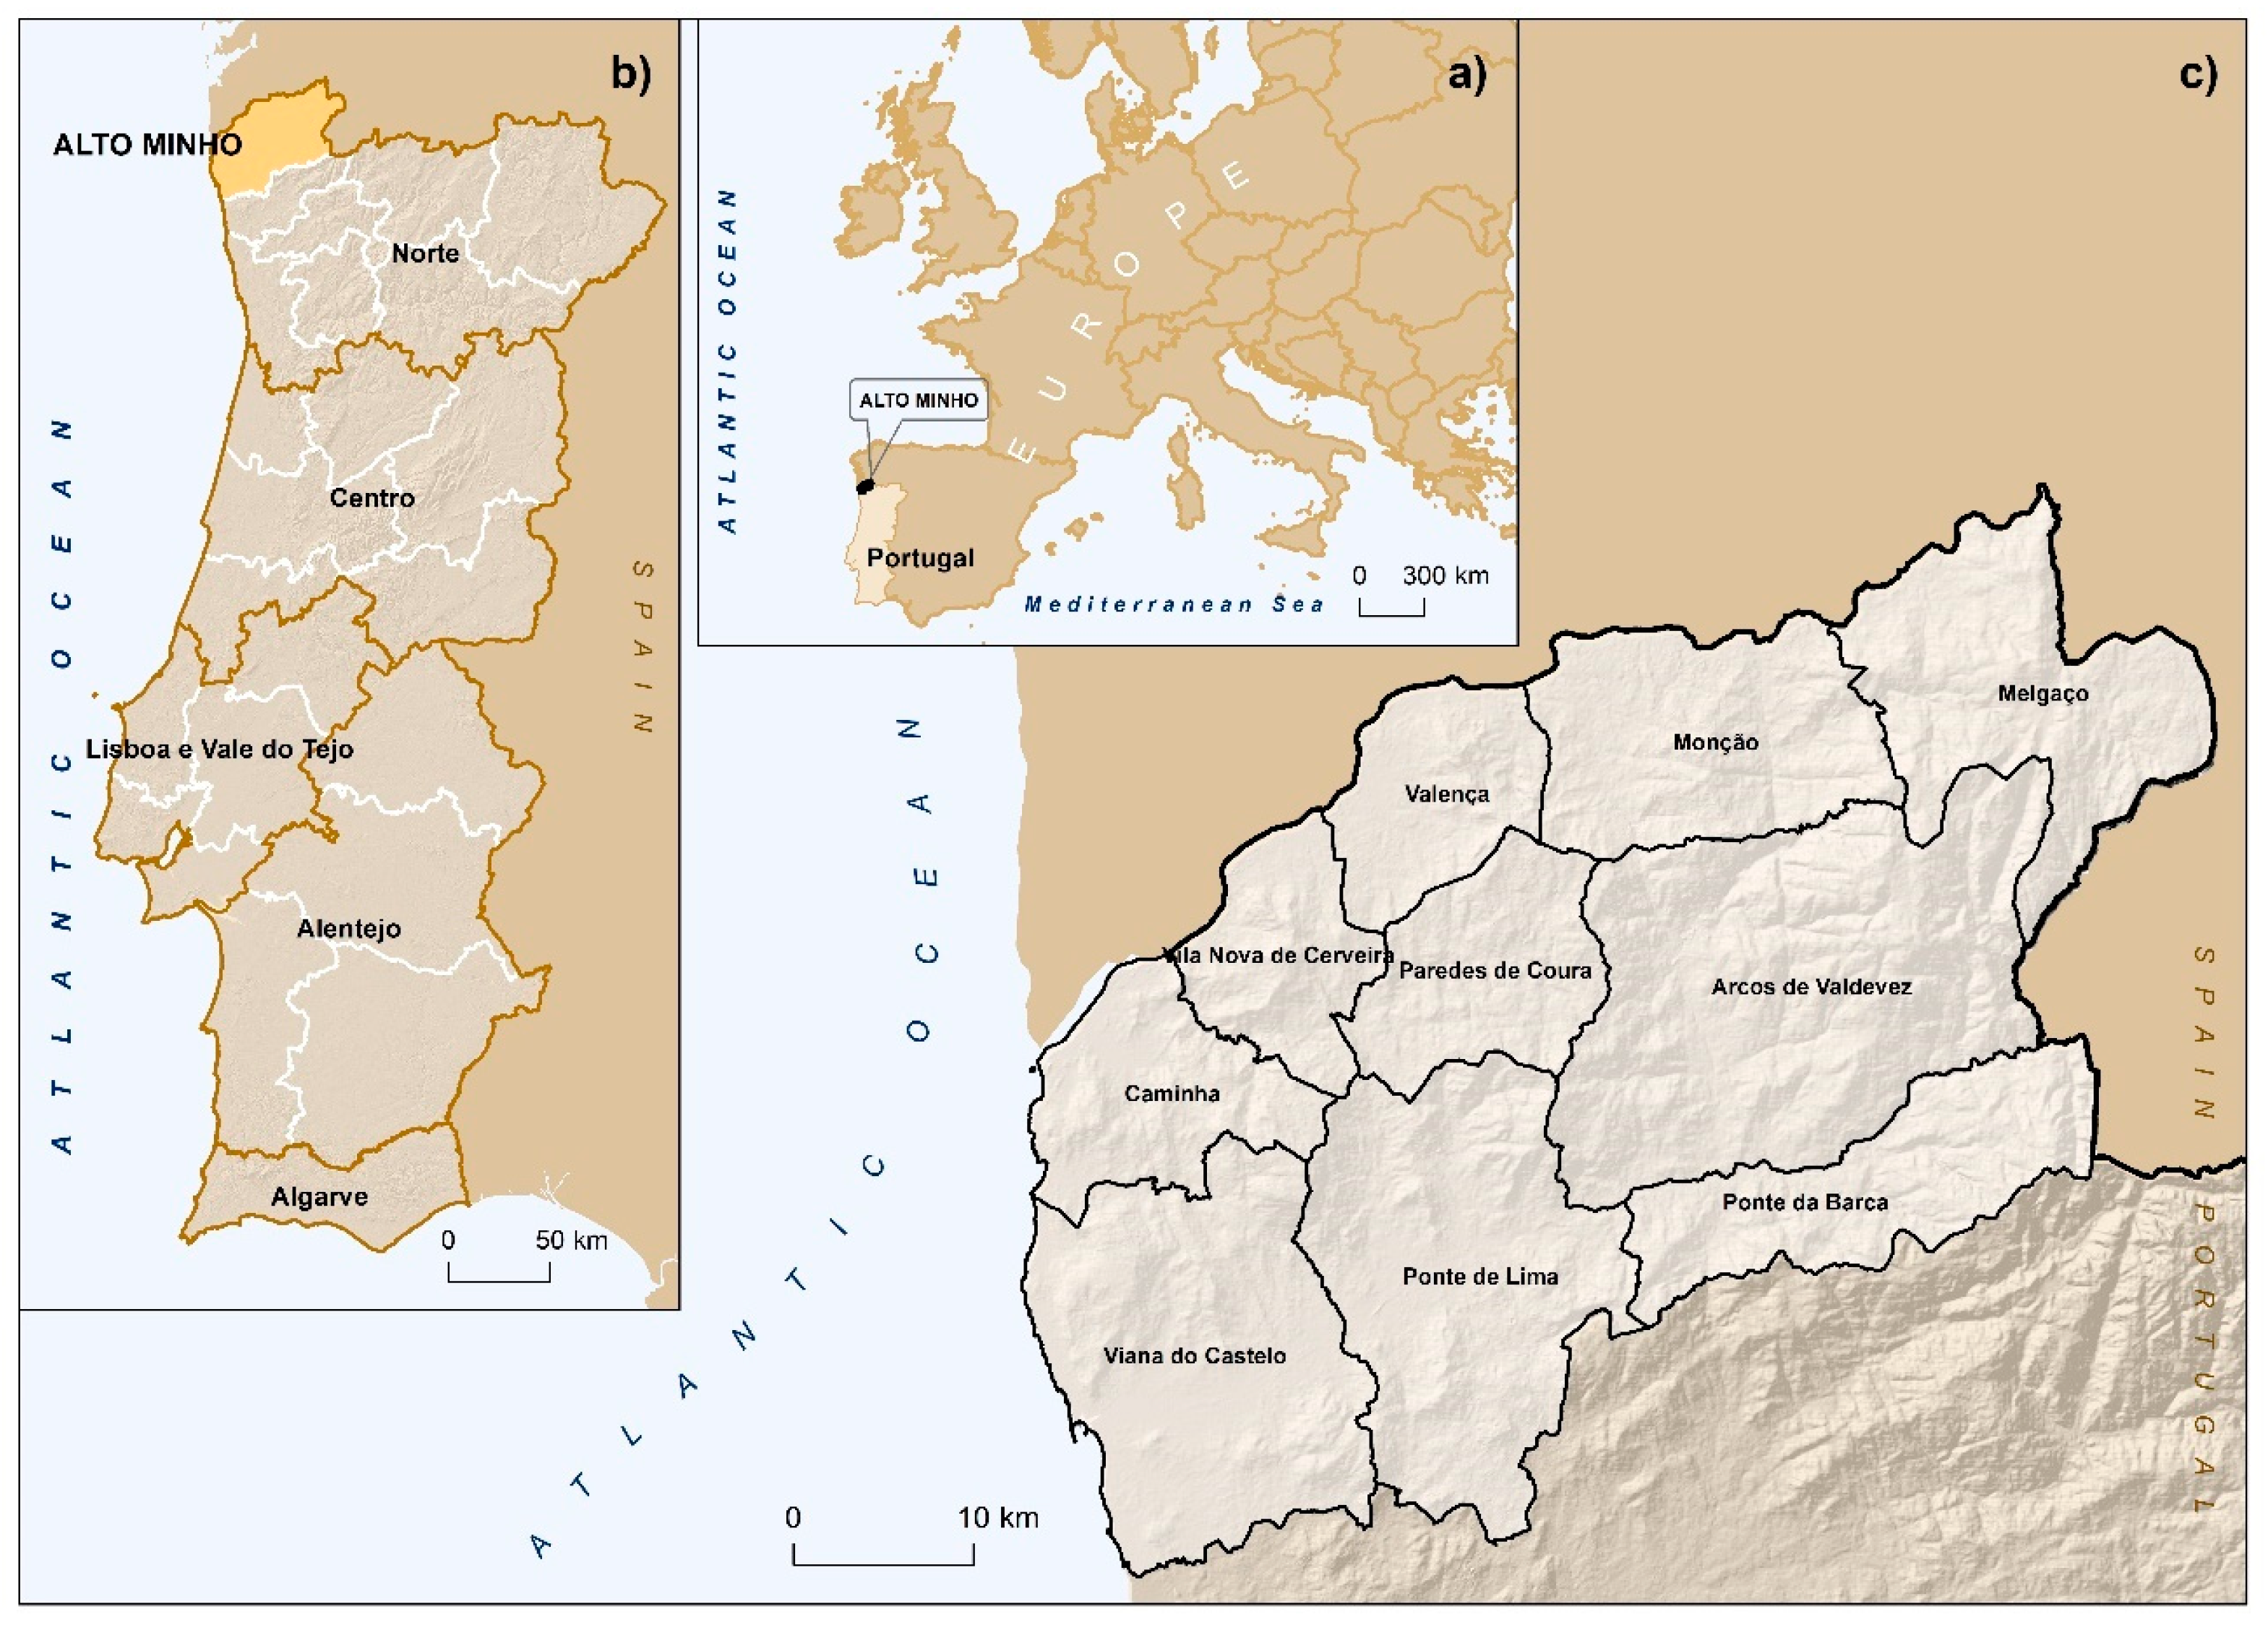
2.1. Study Area

The study area is located in the extreme northwest of mainland Portugal, comprising the entire sub-region of Alto Minho (NUTS III level) and covering 10 municipalities (221,884 hectares; Figure 1).
The study region is predominantly mountainous, and the average altitudes exceed 400 m, attaining elevations higher than 1000 m, except in the coastal area and the floodplain of the main valleys of the Minho and Lima rivers [72]. According to the Intermunicipal Plan for Adaptation to Climate Change [73], the annual mean temperatures vary between 14 °C and 16 °C in most of the region but can be substantially lower at higher elevations (≤9.5 °C). The mean annual rainfall is above 1100 mm, but the distribution of precipitation is highly variable between the coastal strip and the most continental and mountainous areas of the study region, in the latter reaching values between 2400 and 2800 mm [73]. The dominant soils are Regosols (51.6%), followed by Anthrosols (24.1%) and Leptosols associated with rocky outcrops (13.8%) [74]. Regosols and Leptosols are poorly developed soils and are common in mountains and Anthrosols are highly modified soils through long-term human land use [75].
The cultural landscapes of Alto Minho, as in other rural areas of the Iberian Peninsula, result from a long process of deforestation that began in the Neolithic for establishing agricultural areas for cereal production and pastures for livestock [76,77]. Agricultural expansion reached its peak at the beginning of the 20th century (according to the 1910 agriculture and forest map, arable crops covered 33.2% of the study region), resulting from the cereal protectionist policies (“Hunger Law” between 1889 and 1914 and “Wheat Campaign” between 1928 and 1938) that started in the second half of the 19th century [78,79]. In the middle of the 20th century, afforestation of common lands with maritime pine (Pinus pinaster) was intensified (the common lands currently cover 37.8% of the study region), as a response of public policies to soil degradation in marginal areas [80]. Afforestation of common lands, critical to mountain agriculture and livestock production in the multifunctional landscapes of Alto Minho, was imposed by the state forest service [81] and implied grazing and fire exclusion [82]. Currently, shrubland and forest stands dominate the Alto Minho landscapes, covering ~72% of the study region, followed by agriculture, ~18% [83].
The biophysical characteristics of Alto Minho, and public policies with an impact on rural landscapes management, determined not only the spatial pattern of land cover types but also the land systems and respective temporal dynamics, in close connection with the fire regime. Fire was the preferred instrument in the land systems that shaped these landscapes over time, having been used for multiple functions within an ancestral agro-silvo-pastoral system that defines the territories of northwest Iberia [84].

2.2. Burned Area Maps

We used the dataset of burned areas in Alto Minho between 2001 and 2018 produced by Oliveira and Fernandes [85]. The burned areas were obtained from images captured by the Landsat 5 (TM), Landsat 7 (ETM+), Landsat 8 (Operational Land Imager—OLI) and Sentinel-2 (Multispectral Instrument—MSI) satellites. These images (about 400) were extracted and pre-processed from the Semi-Automatic Classification Plugin 6.0.1.1 (SCP) application developed by Congedo [86] for the QGIS software 3.24.1 [87]. Oliveira and Fernandes [85] selected images without clouds or with minimum cloud cover to cover the maximum number of months of each year, allowing the identification of seasonal patterns in the burned areas in Alto Minho. The authors produced false-color RGB compositions and the Normalized Burn Ratio [88] and edited the burned areas manually with the support of auxiliary data, such as high-resolution orthophotos, to avoid errors resulting from other types of land cover changes that could compromise results [89,90]. The resulting burned areas, with a minimum map unit of 0.04 ha for burned areas mapped from Sentinel-2 images and of 0.4 ha for burned areas mapped from Landsat images, were classified according to the period in which they occurred, whether in the “fire season”, i.e., during the summer months, or “non-fire season”, for fires that spread during the period between autumn and spring. To establish this classification, Oliveira and Fernandes [85] used the national rural fire database (from the Portuguese Institute for Nature Conservation and Forests), which brings together a set of relevant data such as the date the fire started and pairs of coordinates with its location, and also the hotspots from the MODIS and VIIRS sensors, available since November 2000 and since January 2012, respectively, and obtained through the NASA’s Fire Information for Resource Management System (FIRMS) web archive (https://firms.modaps.eosdis.nasa.gov/ (accessed on 20 August 2020)).

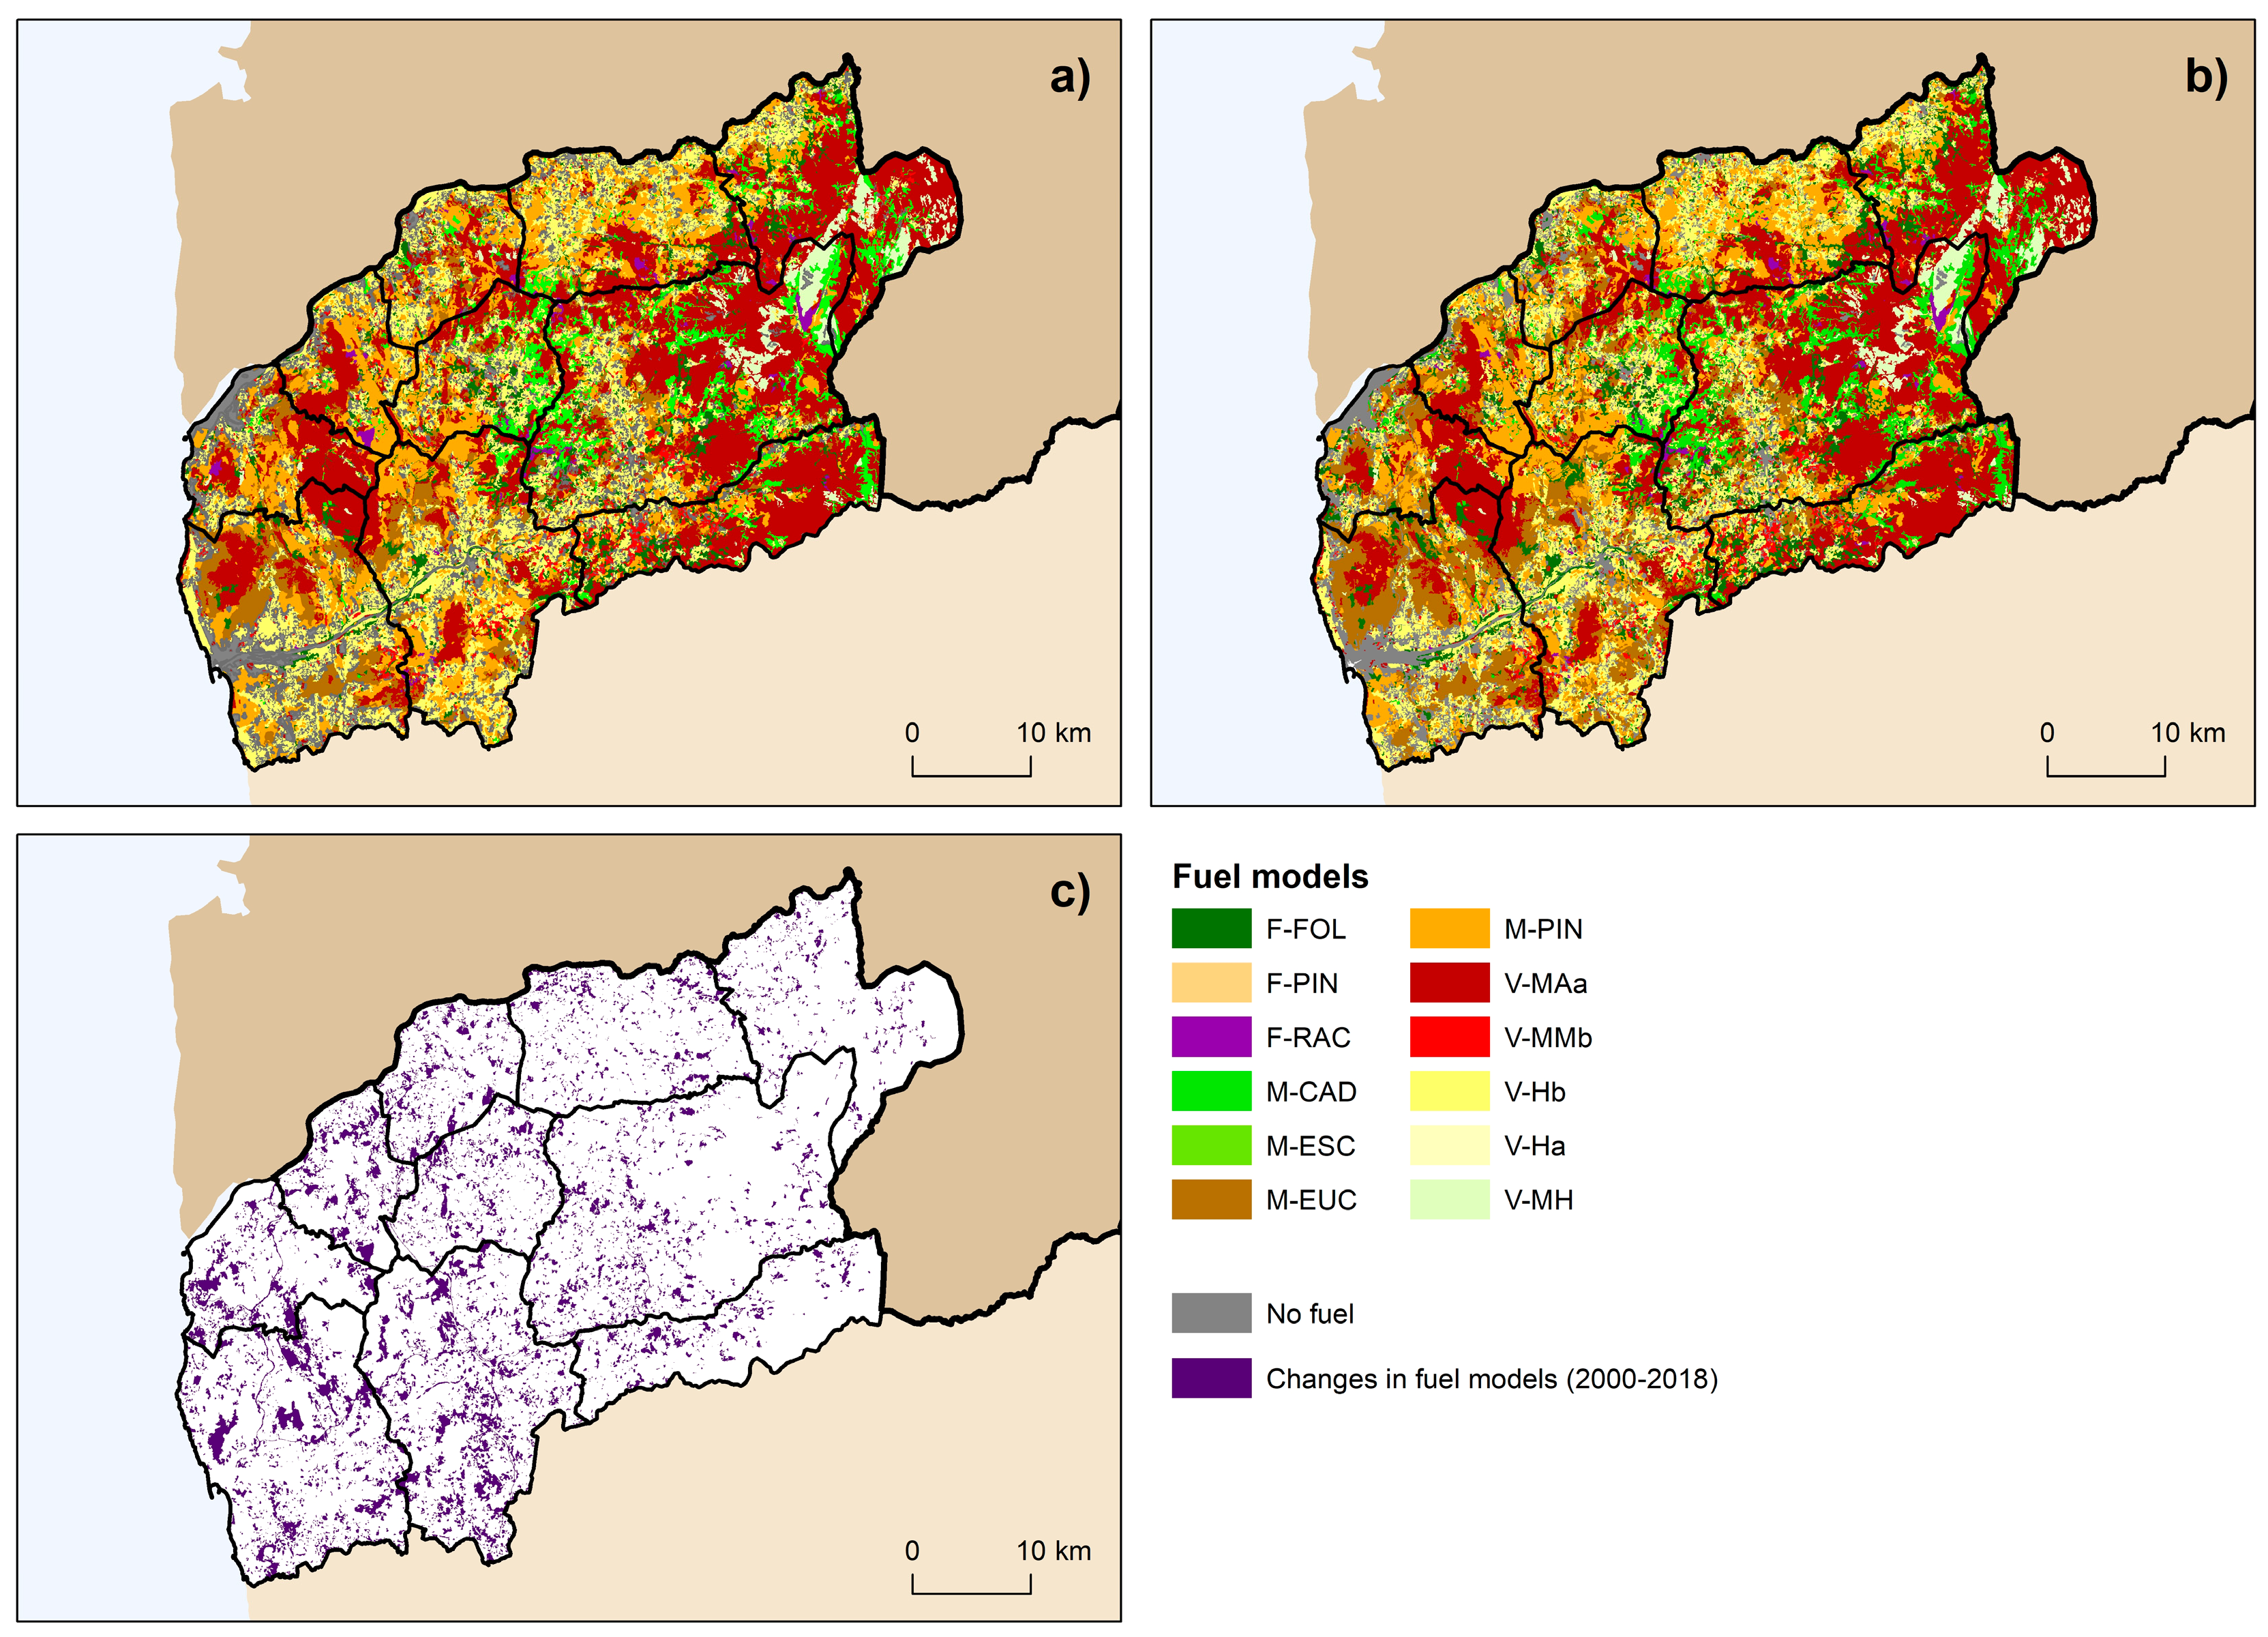
2.3. Spatial Distribution of Fuel Types

We used the fuel types based on the fuel models of Fernandes et al. [91], built by combining published and field inventories data and also from the National Forest Inventory [92] that describes the composition and vertical structure of vegetation. The fuel types are divided into three groups based on the structure and relative importance of the different components of the fuel complexes in fire behavior (Table 1, where only the fuel types identified in the study region are listed): (i) litter (F), referring to forest stands in which fire behavior is dominated by the litter layer; (ii) litter and understory vegetation (M), referring to forest stands in which fire behavior results from the combined effect of litter and understory layers; (iii) and other vegetation (V), which involves plant communities, with or without a tree canopy, in which fire behavior is determined by the shrub or herbaceous layers.
The combination of structural and vegetation type criteria that defines the fuel types of Fernandes et al. [91] allows its easy recognition in the field as well as its association with land cover classes. Therefore, the construction of the fuel-type maps referring to the years 2000 and 2018 was based on the official Land Cover Maps produced by the Portuguese General Directorate of the Territory at 1:25,000 scale. This map series has thematic, spatial and temporal consistency allowing comparative analysis between different periods [93,94], including Land Cover Maps for the years 1995, 2007, 2010, 2015, and 2018. The classification system, comprising 83 thematic classes, allows the relationships to be established between these and the fuel types based on their generic description included in Table 1. This relationship was established directly for the 2018 land cover map (FC2018), but for the starting point of our fire data series we do not have the same temporal congruence. To build the fuel map in 2000 (FC2000), we established the relationships between land cover classes and fuel types for the years 1995 and 2007 (FC1995 and FC2007, respectively), following the same procedure used to define the FC2018. We then carried out a bi-temporal analysis combining FC1995 and FC2007 to extract patches that showed changes in fuel types over that period to reclassify in accordance with the procedure set out below. We used the land cover data from CORINE Land Cover 2000 (CLC2000) [95,96], at 1:100,000 scale and 44 thematic classes, as auxiliary data to identify divergences and convergences in the land cover classes between 1995 and 2000. The lower thematic and geometric resolution of the CLC2000 does not allow its direct use for comparison with the layers mentioned in the previous paragraphs, but for the patches that changed between 1995 and 2007 it was useful to adjust the land cover classes to the year 2000. We assumed that divergences between the FC1995 and CLC2000 patch classes were indicative of changes occurring between 1995 and 2000, implying the attribution of the 2007 fuel type to these ones, and that their convergence was indicative that changes would have occurred between 2000 and 2007, keeping the 1995 fuel type in these cases.

2.4. Data Analysis

All statistical analyses were performed using R software 4.2.3 [97]. We analyzed the annual distribution of fire patches and burned areas. In addition to annual global values, we also evaluated their distribution in the fire season and non-fire season. We extracted the main descriptive statistics (e.g., mean, coefficient of variation) and tested the time series for temporal trends through the R package funtimes 9.1 [98]. We inspected the existence of linear and monotonic trends by enhanced versions of the t-test [99] and Mann–Kendall test [100] through sieve-bootstrap approaches for time series [101,102]. The Mann–Kendall tau and t-values were extracted, and respective significance, and also the coefficient p of the autoregressive model (AR(p)) obtained through the robust difference-based estimator proposed by Hall and van Keleigom [103].
Violin plots [104] built with the R software package ggplot2 3.4.2 [105] were used to compare the distribution of sizes of individual fires that occurred during and outside the fire season, and differences between the distributions were tested through the Mann–Whitney U test [106]. Raincloud plots [107] were also produced to analyze the distribution of burned area and number of fire patches by fire size classes considering all events, and also those that occur during and outside the fire season. To build the raincloud plots, the following R software packages were used: ggplot2 3.4.2 [105], tidyverse 2.0.0 [108], tidyquant 1.0.7 [109], ggdist 3.2.0 [110] and ggthemes 4.2.4 [111]. We fitted the Weibull distribution [112] using the mean intervals between successive fires from the recurrence maps (censored plus complete intervals), to assess fuel-age dependency [113,114], using the R software package fitdistrplus 1.1-10 [115]. We fitted the parameters b, representing the fire intervals that will not be exceeded 63.2% of the time, and c, which describes the change in burn probability through time.
Fire preference or avoidance was assessed through the Jacobs index [71], considering all burned areas, and also the areas affected by seasonal and unseasonal fires (total and excluding the overlapped patches between the burned areas during and outside the fire season). The spatial overlay of the fuel type maps (FC2000 and FC2018), and of these with the burned area layers (2001–2018) allowed identifying the incidence of the seasonal and unseasonal fires in the different fuel complexes and quantification of the contribution of these fires to the fuel-type changes observed in the Alto Minho landscapes. Sankey diagrams were suggested by Cuba [116] to compare categorical maps and to identify and represent the main flows between land cover classes. We have computed the Sankey diagrams to show changes across the study region, and also for the areas burned by seasonal and non-seasonal fires, through the R software packages raster 3.6-22 [117], networkD3 0.4 [118] and dplyr 1.1.1 [119,120]. Additionally, cross-tabulation matrices (provided in the Supplementary Materials) were built to improve the description of the observed changes. We also carried out a logistic regression [121] to determine the role of different fire (recurrence, fire size, seasonality) and landscape (composition of the patch in 2000, patch area) metrics to assess the effects of fire on fuel type changes. In this analysis we focused on the transitions involving the typical fuel types of forest stands with higher representativity in the study region (F-RAC, F-FOL, M-CAD, M-EUC, M-PIN, see Table 1 for a general description of each one). F-FOL fuel type was established as the reference category. The transitions from the fuel types mentioned were all considered and classified as 1 (n = 7267) and the stable areas as 0 (n = 7221), the latter being randomly distributed by burned and unburned areas, conditioning the distribution of two points in the same patch. In the group of independent variables, in addition to the tree species already mentioned, we considered patch size of pre-fire fuel types (FC2000PS), since smaller fragments may be more prone to change. Regarding fire metrics, we considered fire recurrence (FIRErec), fire seasonality (FIREfs for fire-season fires and FIREnfs for non-seasonal fires), and the size of the largest fire that affected each burned patch (FIREfslf). We used the R software package rcompanion [122] to compute the Efron, McFadden, Cox and Snell, and Nagelkerke/Cragg and Ubler pseudo-R2 measures [123,124,125] to assess model performance.

3. Results

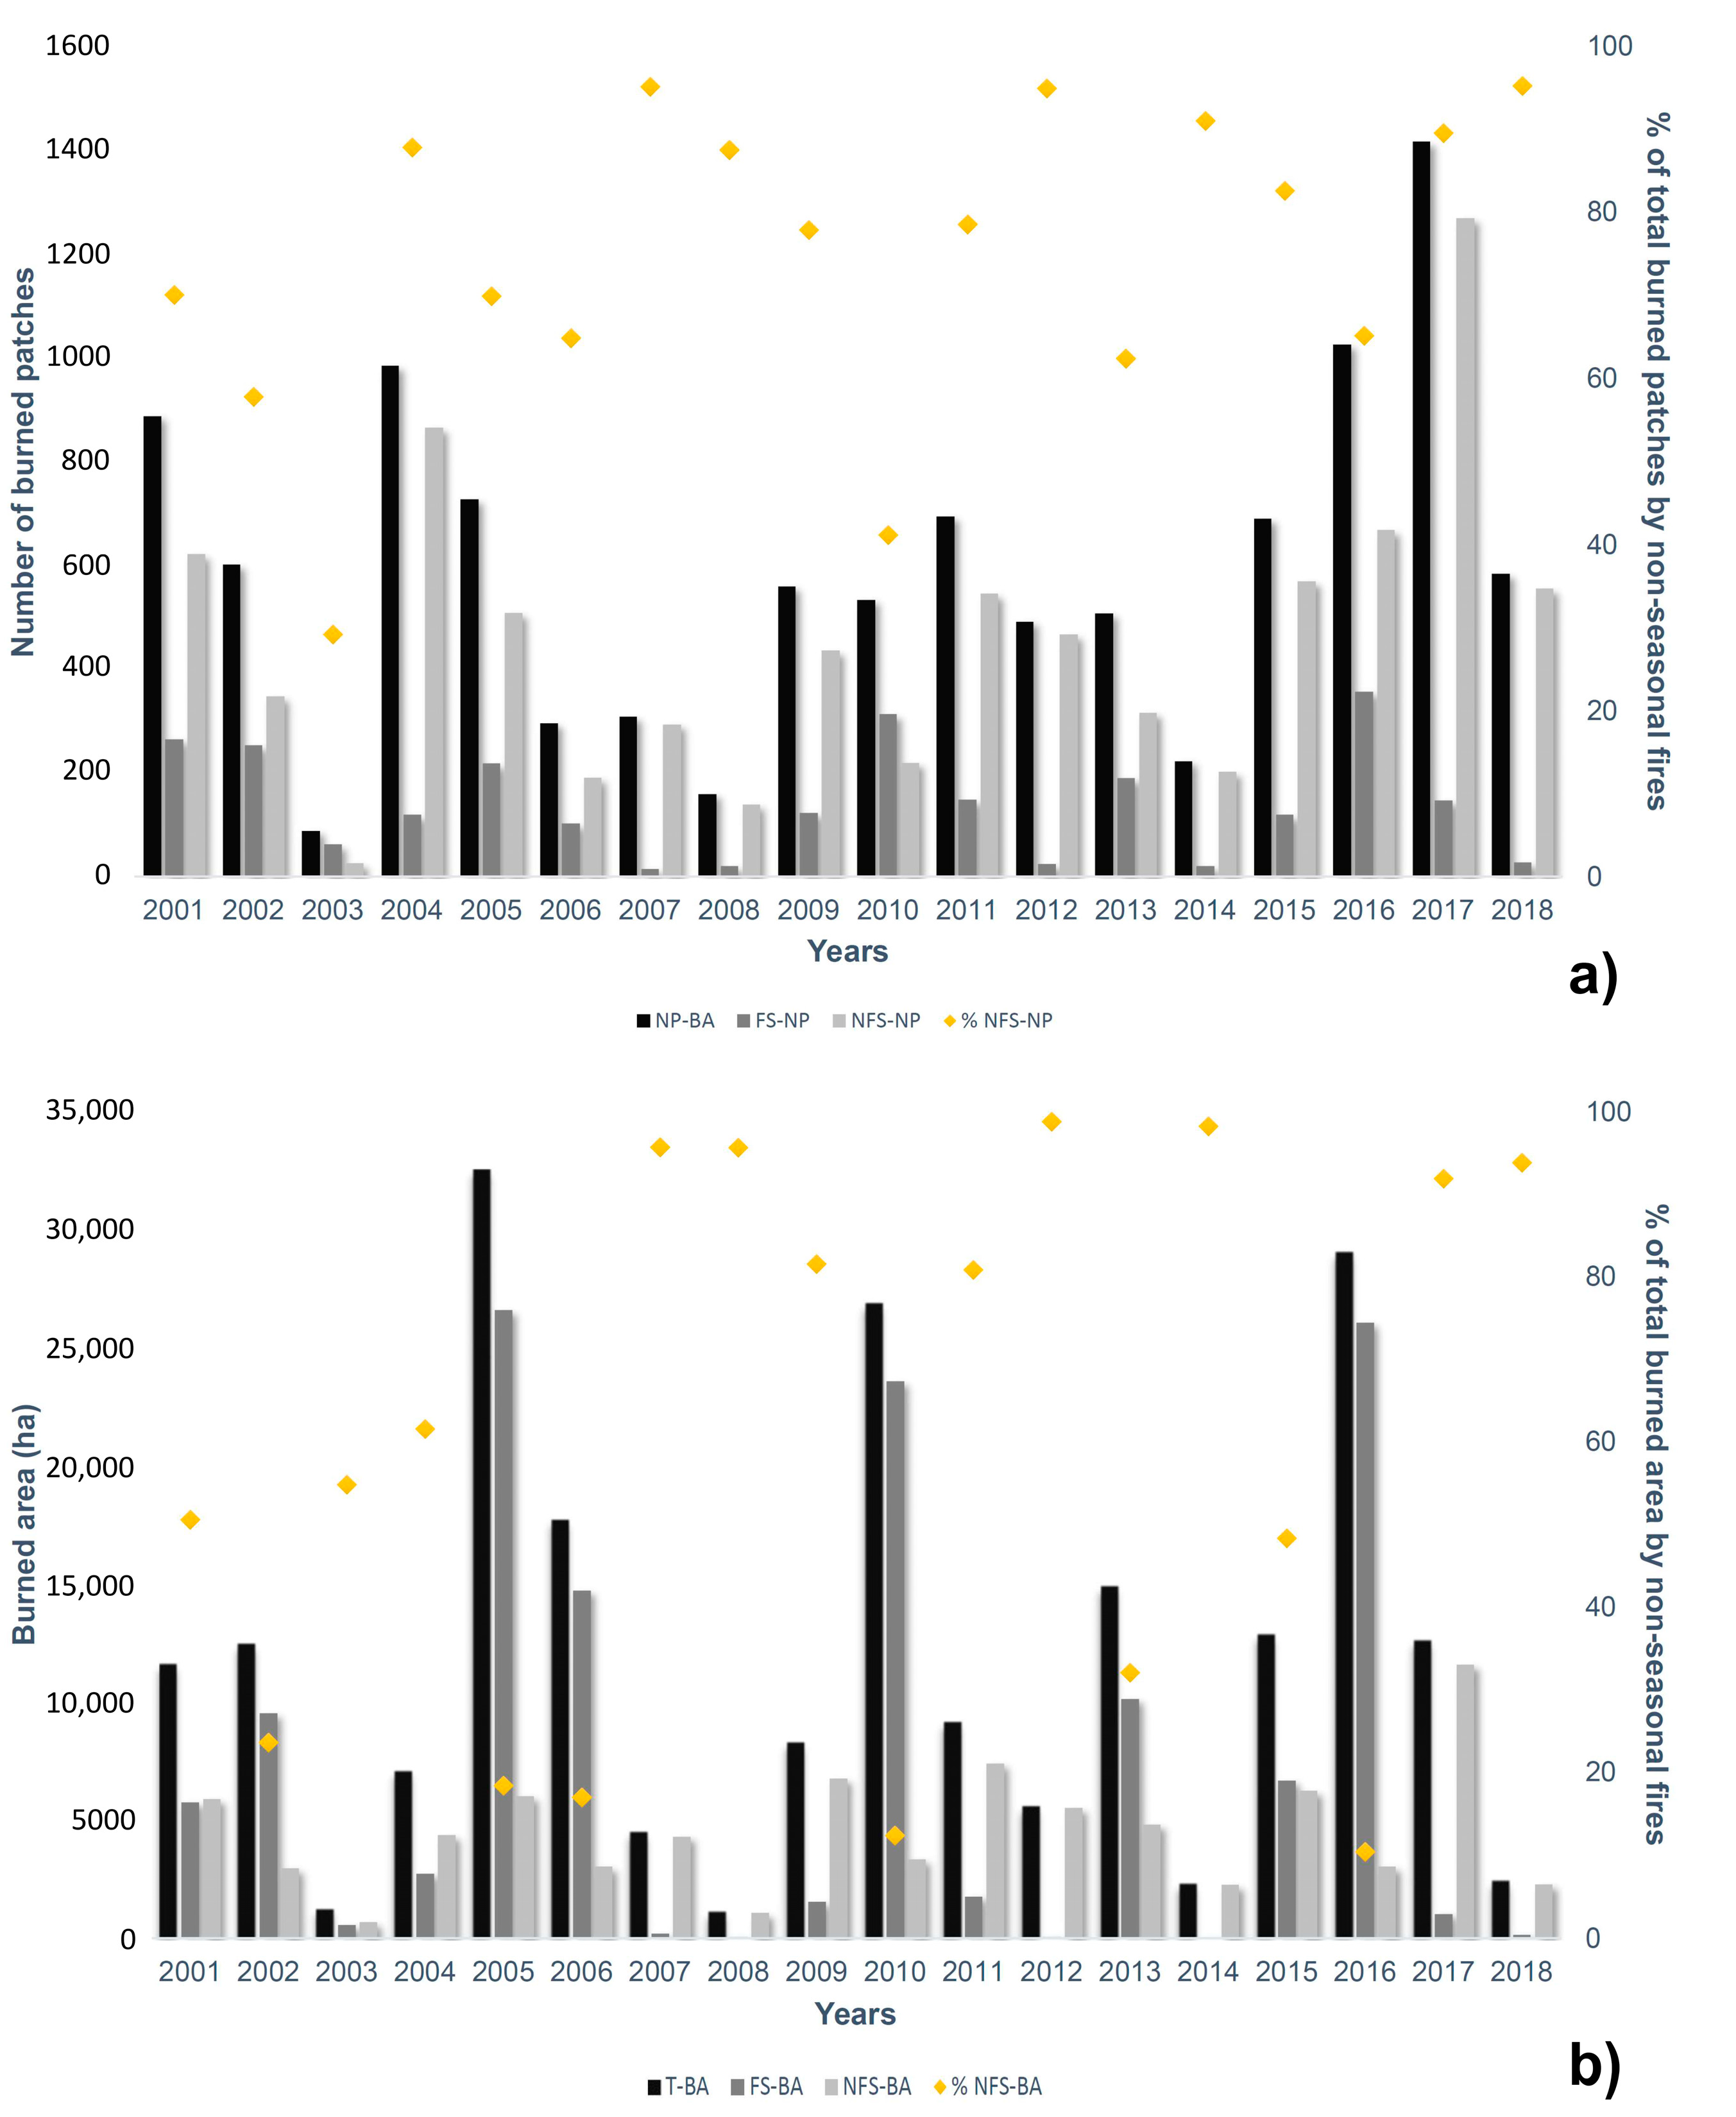
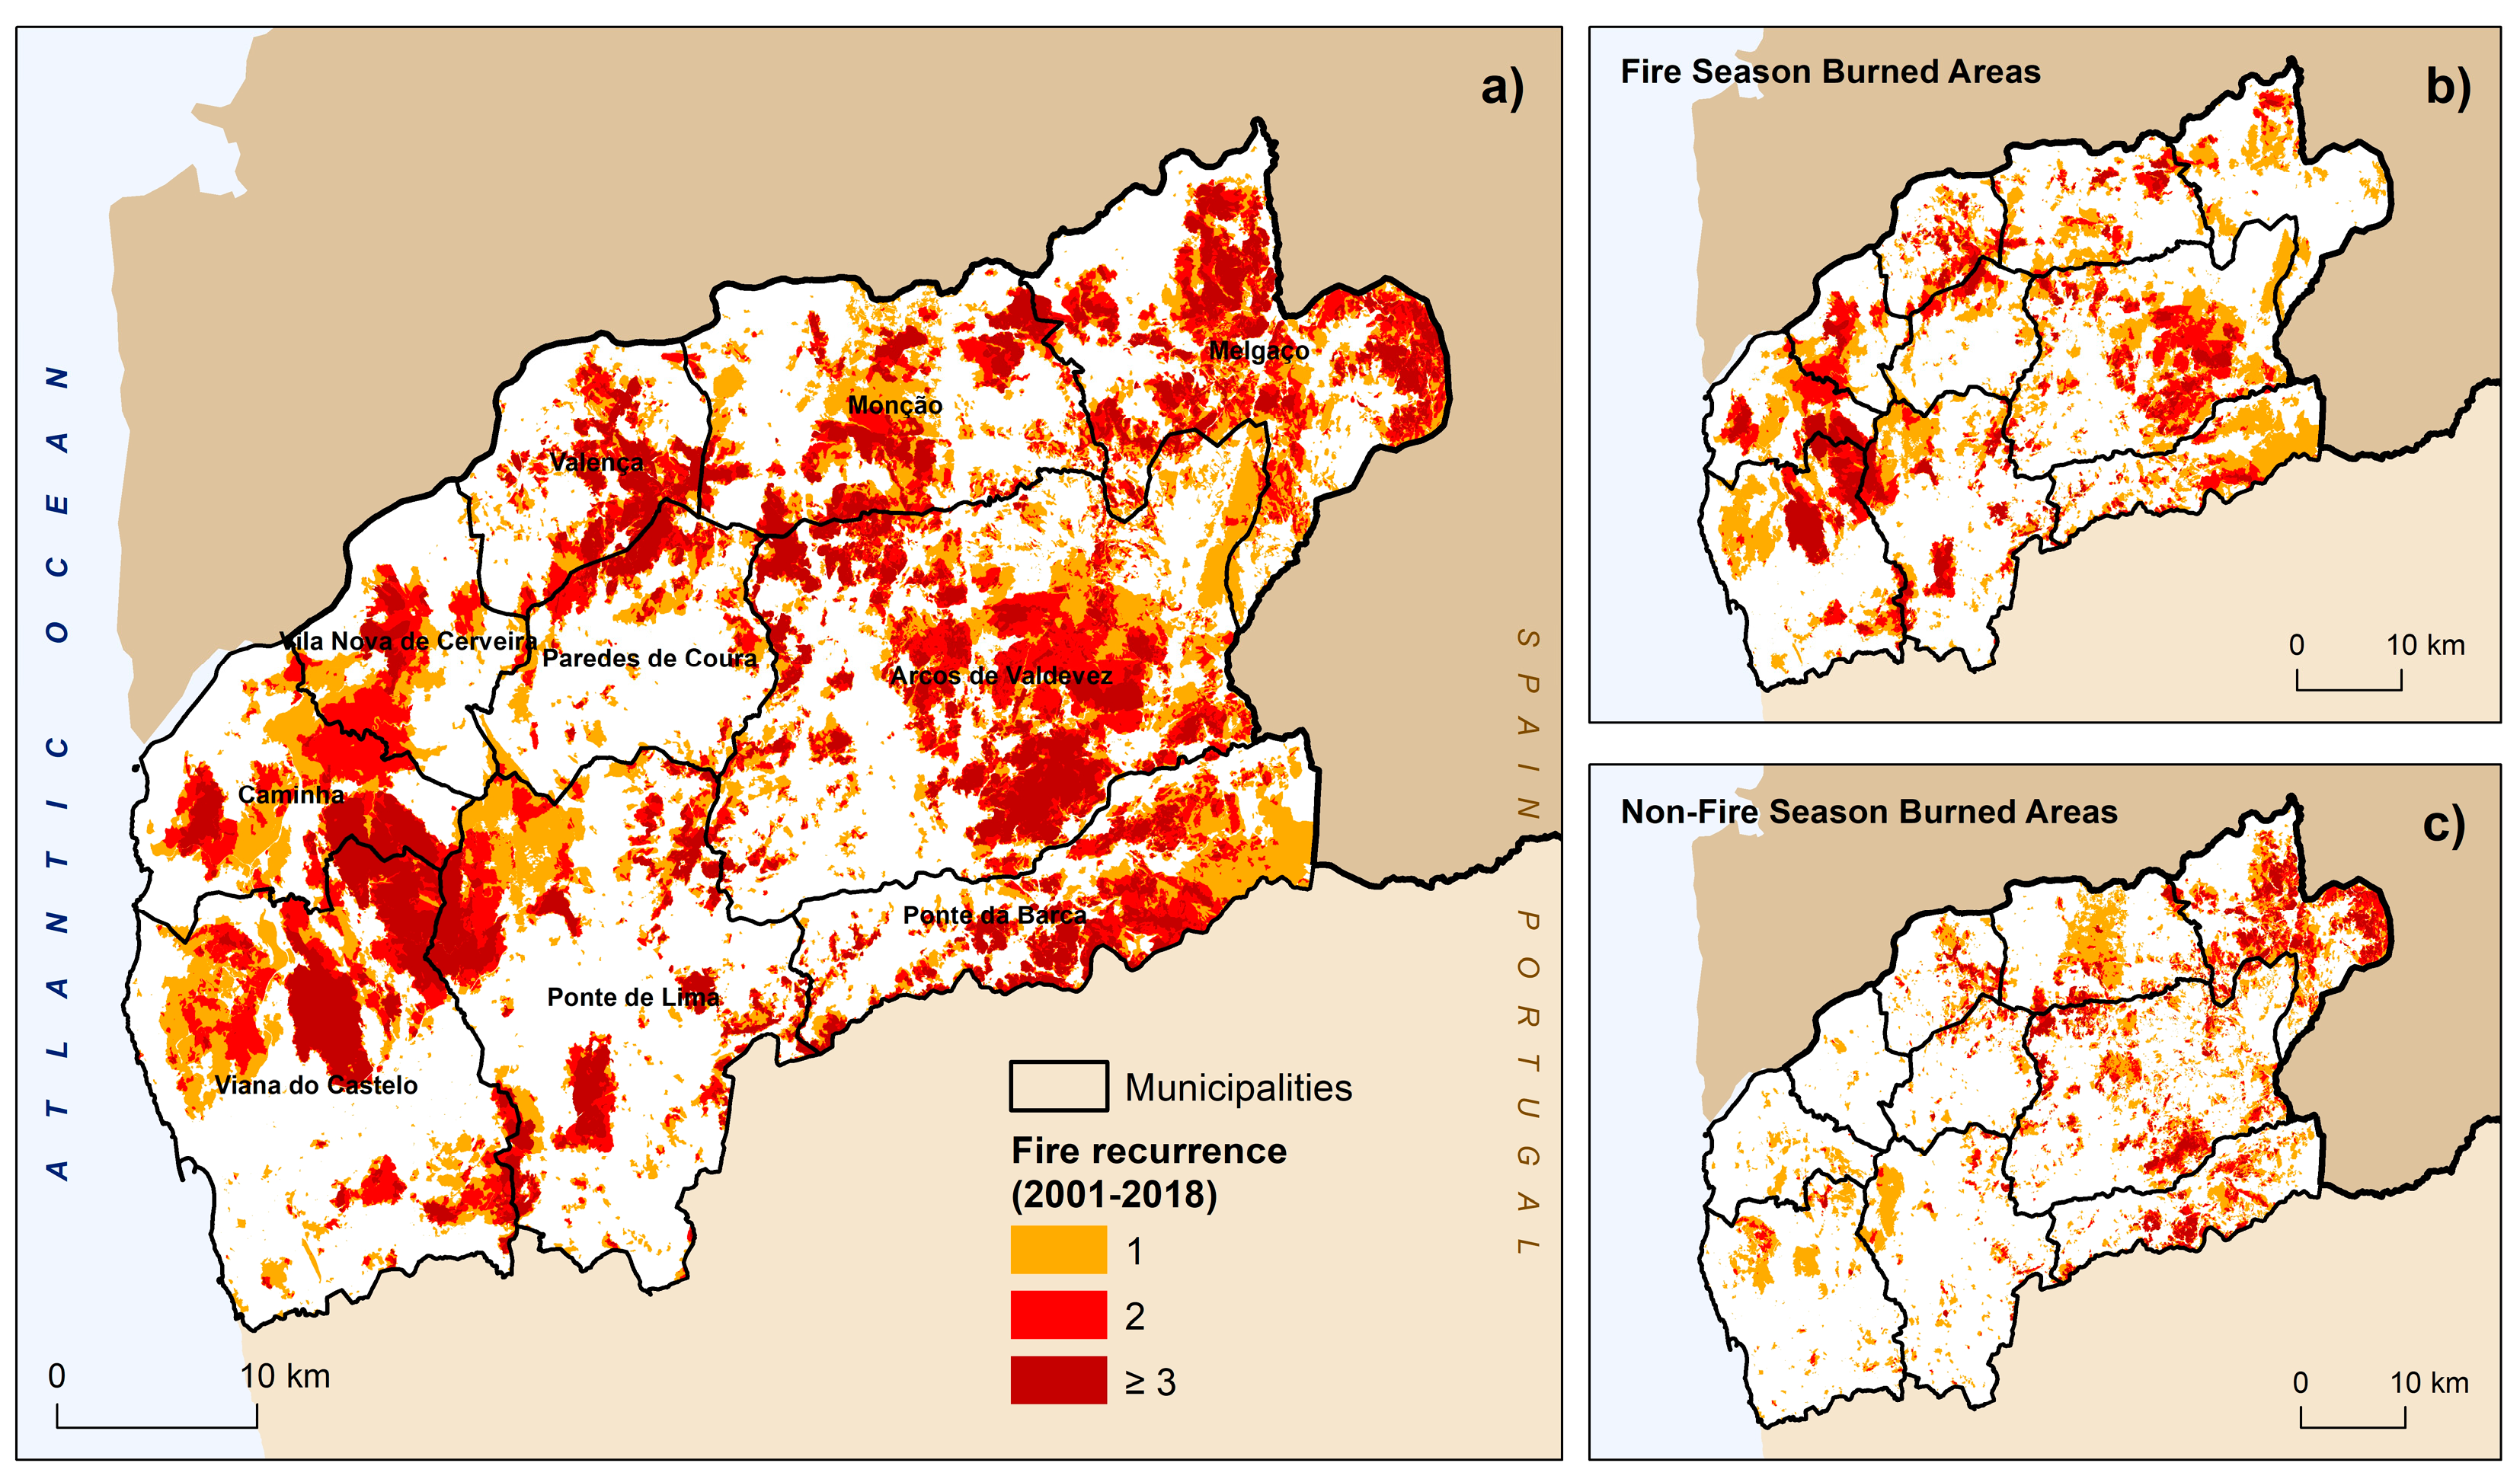
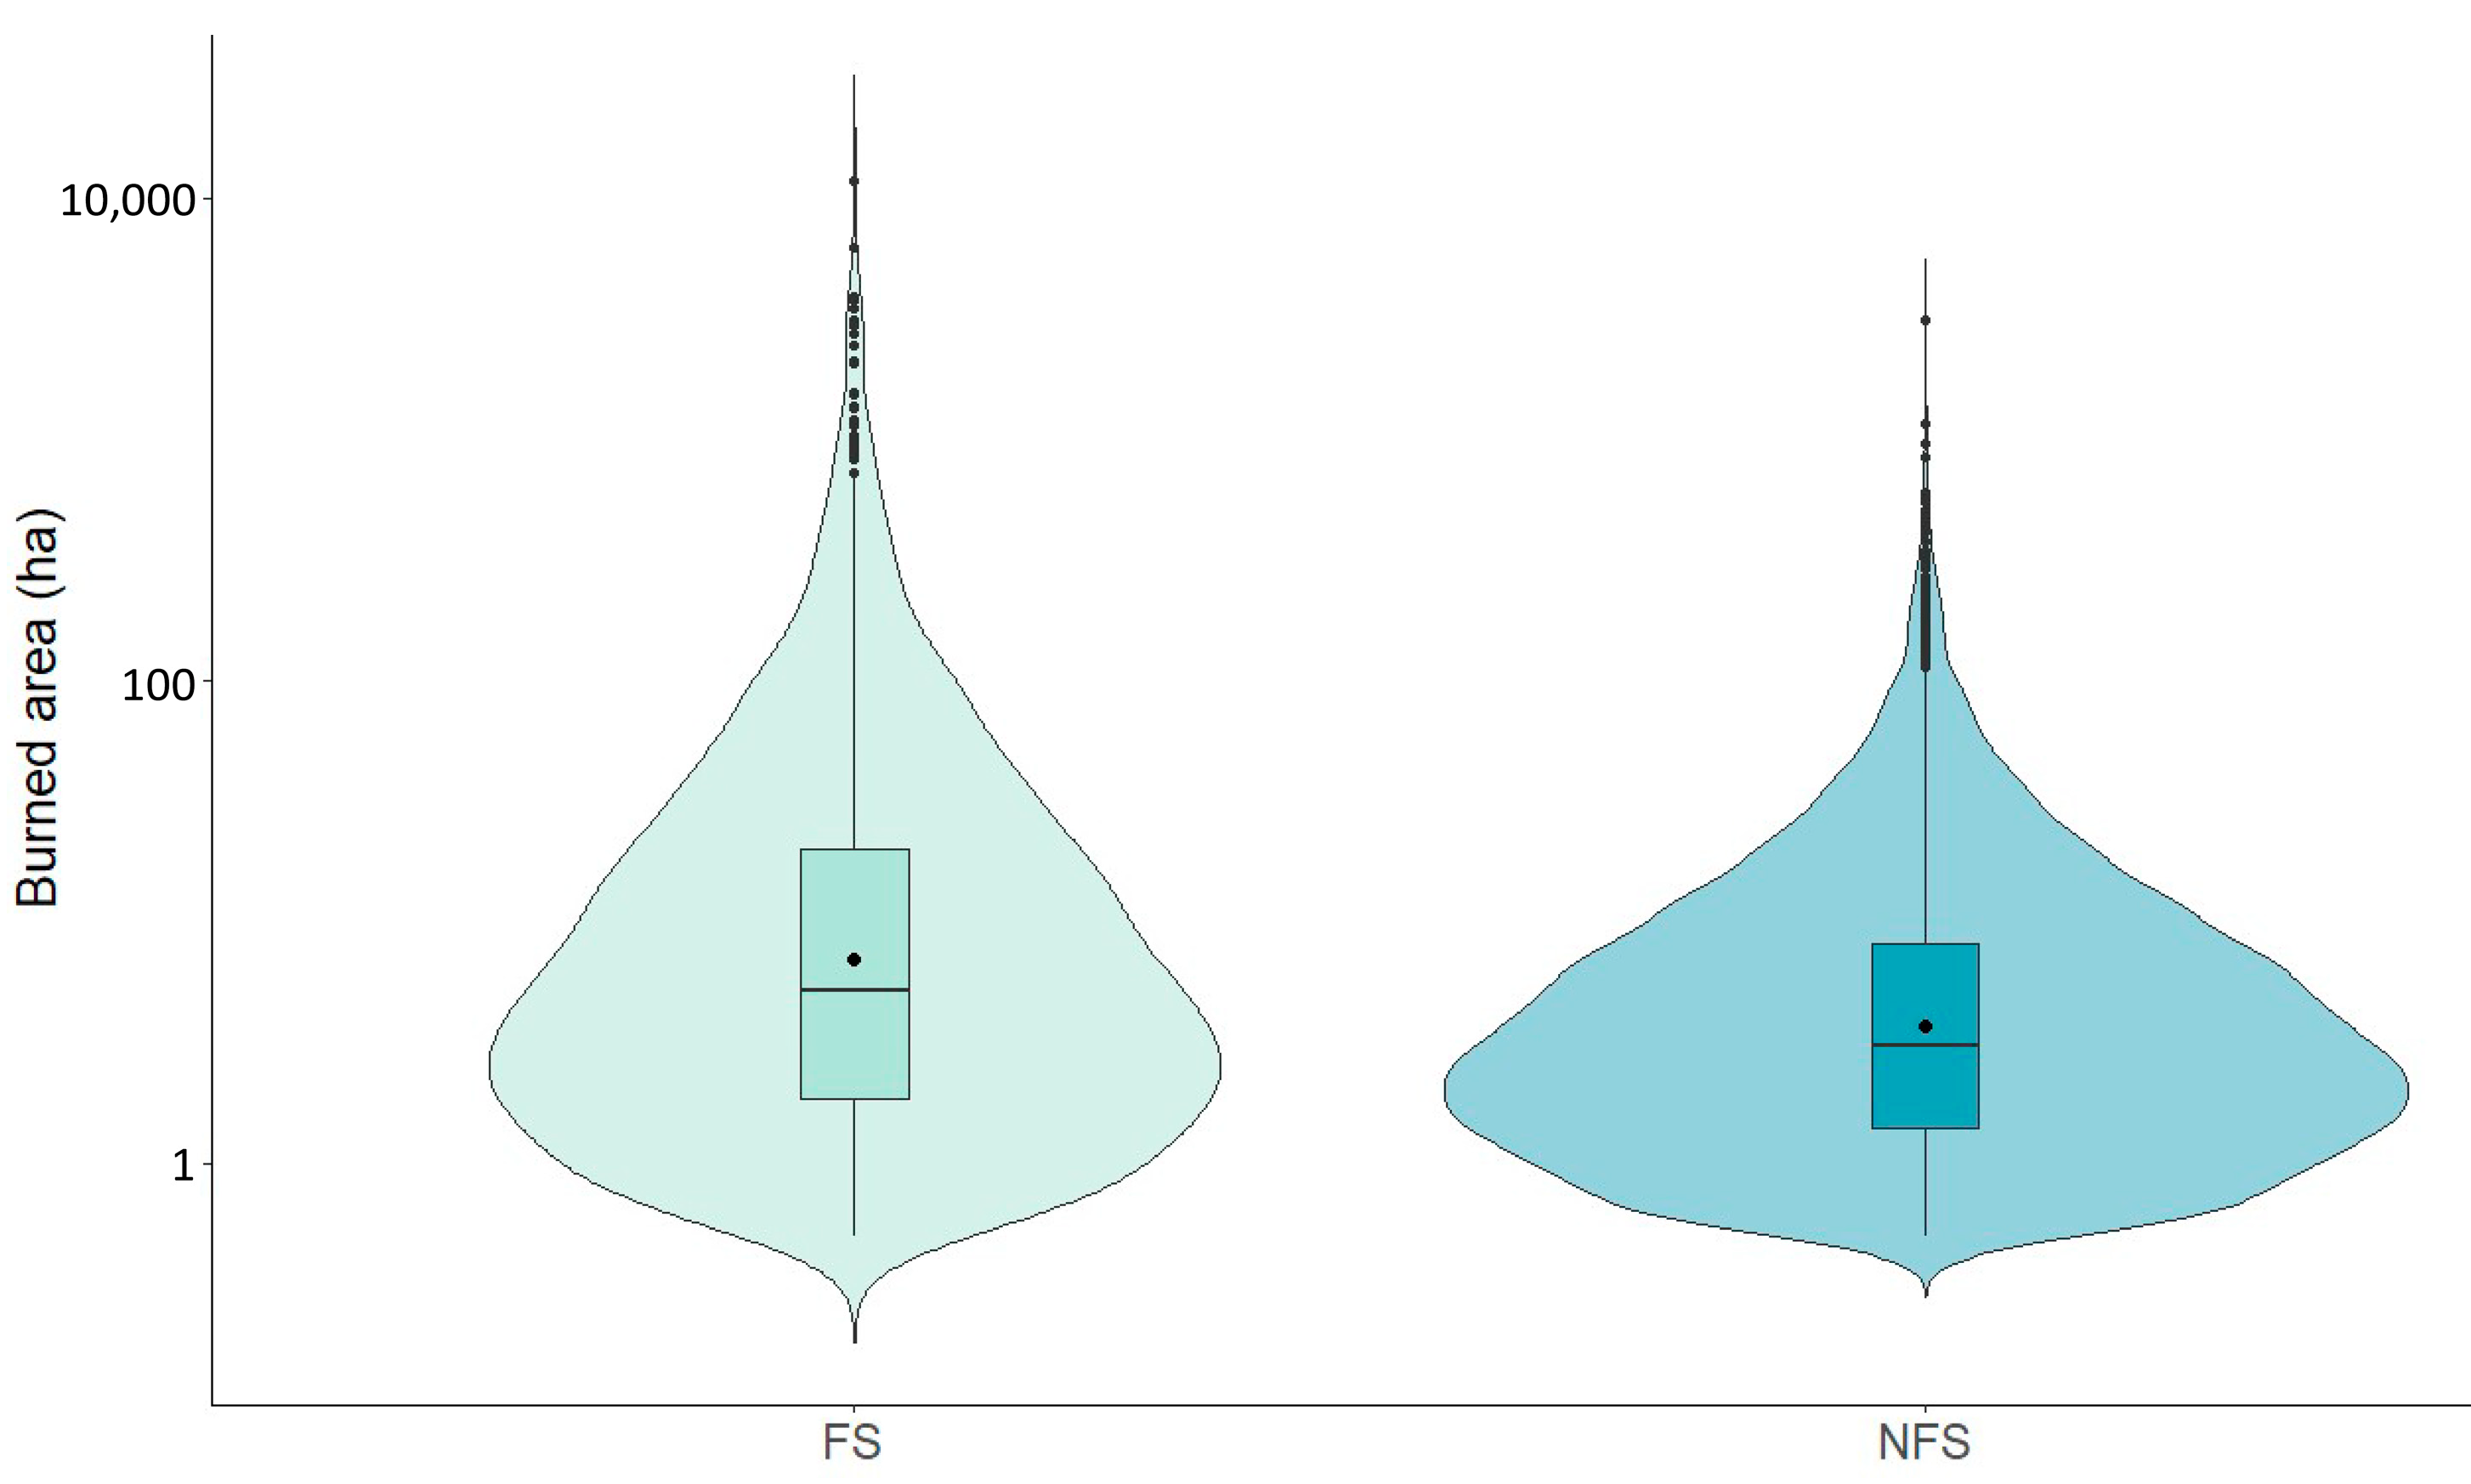
3.1. Fire Regime in Alto Minho

The dataset of burned areas developed by Oliveira and Fernandes [85] contains 10,784 perimeters in the period between 2001 and 2018, representing a cumulative area of 211,942.44 ha.
However, only 23.5% of the identified polygons belong to fires that started in the fire season, but this represents 61.8% of the burned area. The mean annual burned area is 11,774.58 ha, and the mean annual number of fire patches is 599. The annual variability in both indicators (Figure 2) is high, with coefficients of variation of 54.39% and 78.64%, for the number of fire patches and burned area, respectively. The number of seasonal fire patches exceeded those of non-seasonal fires only in the exceptional years of 2003 and 2010 (Figure 2a). The area burned by non-seasonal fires is higher than the area burned by seasonal fires in 61.1% of the years, but only in those that have an annual area burned below the annual mean value (Figure 2b).
All the trend tests carried out allowed to eliminate the “no trend” null hypothesis (Table 2). However, the p-values of the tests are high and, therefore, the evidence is not robust enough to reject the hypothesis of no trend. The coefficients of the autoregressive model all had a null value, suggesting purely random processes, not capturing any type of trend in the annual distribution of our fire data (Table 2).
Approximately 45.6% of the study region burned at least once between 2001 and 2018. The difference between the cumulative value (211,942.4 ha) and the surface effectively burned (110,735.3 ha) shows the relevance of fire recurrence in certain locations (Figure 3a). Of the total burned area, 39.8% burned once, 29.7% burned twice, and 30.5% burned three or more times between 2001 and 2018. The fires that occurred in the fire season affected 35.7% of the study region, representing 78.3% of the total burned area. Approximately 16.0% of the area affected by fire-season fires burned three or more times, 27.7% twice, and 56.3% only once (Figure 3b). Fires spreading outside the fire season affected a smaller area, about 23.22% of the study region representing 50.9% of the total area burned between 2001 and 2018. Recurrence is also lower when compared to fire-season fires, considering that only 14.0% burned three or more times (23.4% burned twice, and 62.6% only once) (Figure 3c). There is still a relevant aspect to point out, since the areas burned by seasonal and unseasonal fires intersect in 29.2% (29,555.9 ha) of the total burned area, that potentially may lead to confounding effects of their individual impacts.
The Weibull distribution fit allowed estimation of the parameters b and c, which correspond to the scale and shape of the distribution, respectively. For the complete dataset of fires, the estimated value of the parameter b is 12.9 (σμ = 0.02), for unseasonal fires is 15.4 (σμ = 0.55) and for fire-season fires is 15.0 (σμ = 0.55). The dimensionless parameter c, which defines the shape of the distribution, is always higher than 1 and thus indicates that fire hazard increases over time and is fuel-age dependent: 2.20 for all fires (σμ = 0.01), 2.90 for non-seasonal fires (σμ = 0.26), and 2.83 for the fire-season events (σμ = 0.24).
The distribution of individual fire sizes during and outside the fire season (Figure 4) shows relevant differences; in particular, the smallest size of unseasonal fires and the higher flattening of the base of its violin plot highlights a lower probability of large fires, and the smaller size of the outliers (larger fires). The Mann–Whitney U Test performed indicates that the distributions are statistically different (U = 9,101,548, p-value < 2.2 × 10⁻¹⁶).
According to the distribution of fire patches and area burned by fire size class (Figure 5a) the fire patches smaller than 10 ha represent ~75% of the total fire patches, but account for less than ~15% of the burned area. Larger fire patches (>100 ha) are less than 5% of the total, but their contribution to burned area is high variable, and may exceed 75%. However, doing the same analysis on seasonally disaggregated data shows differences between the two distributions, mainly in the fire patches larger than 10 ha and in their contribution to area burned. While the number of fire patches decreases with increasing fire size in both distributions, their contribution to burned area is completely different: during the fire season it increases with fire size (Figure 5b) and outside the fire season it decreases with fire size (Figure 5c).

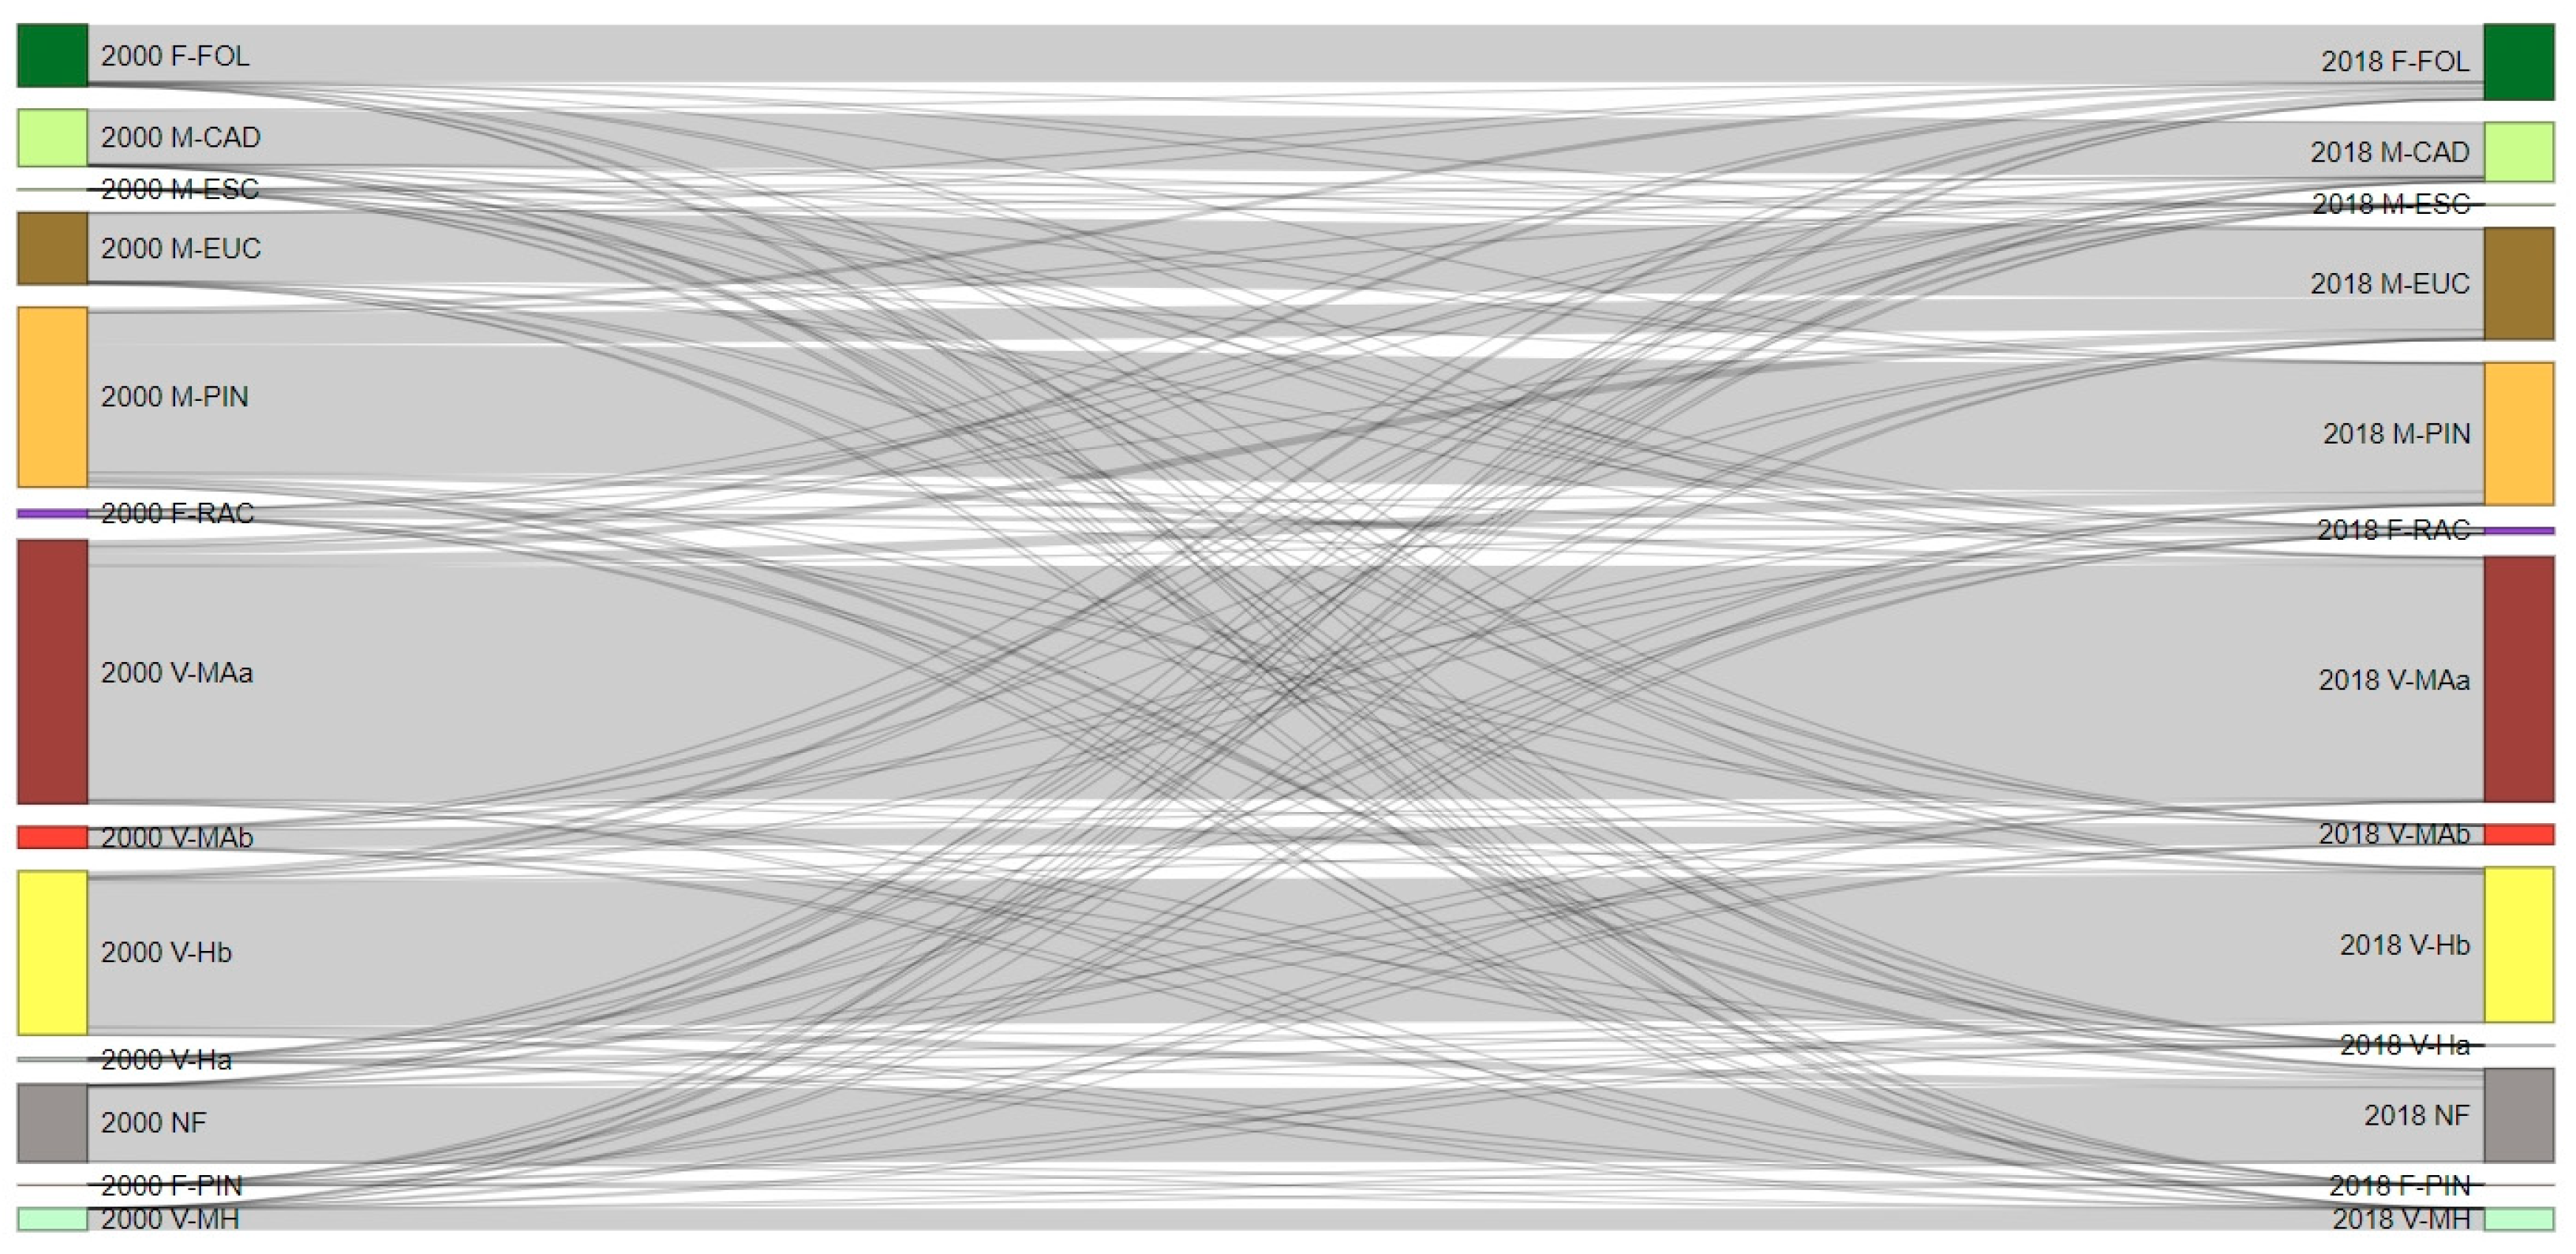
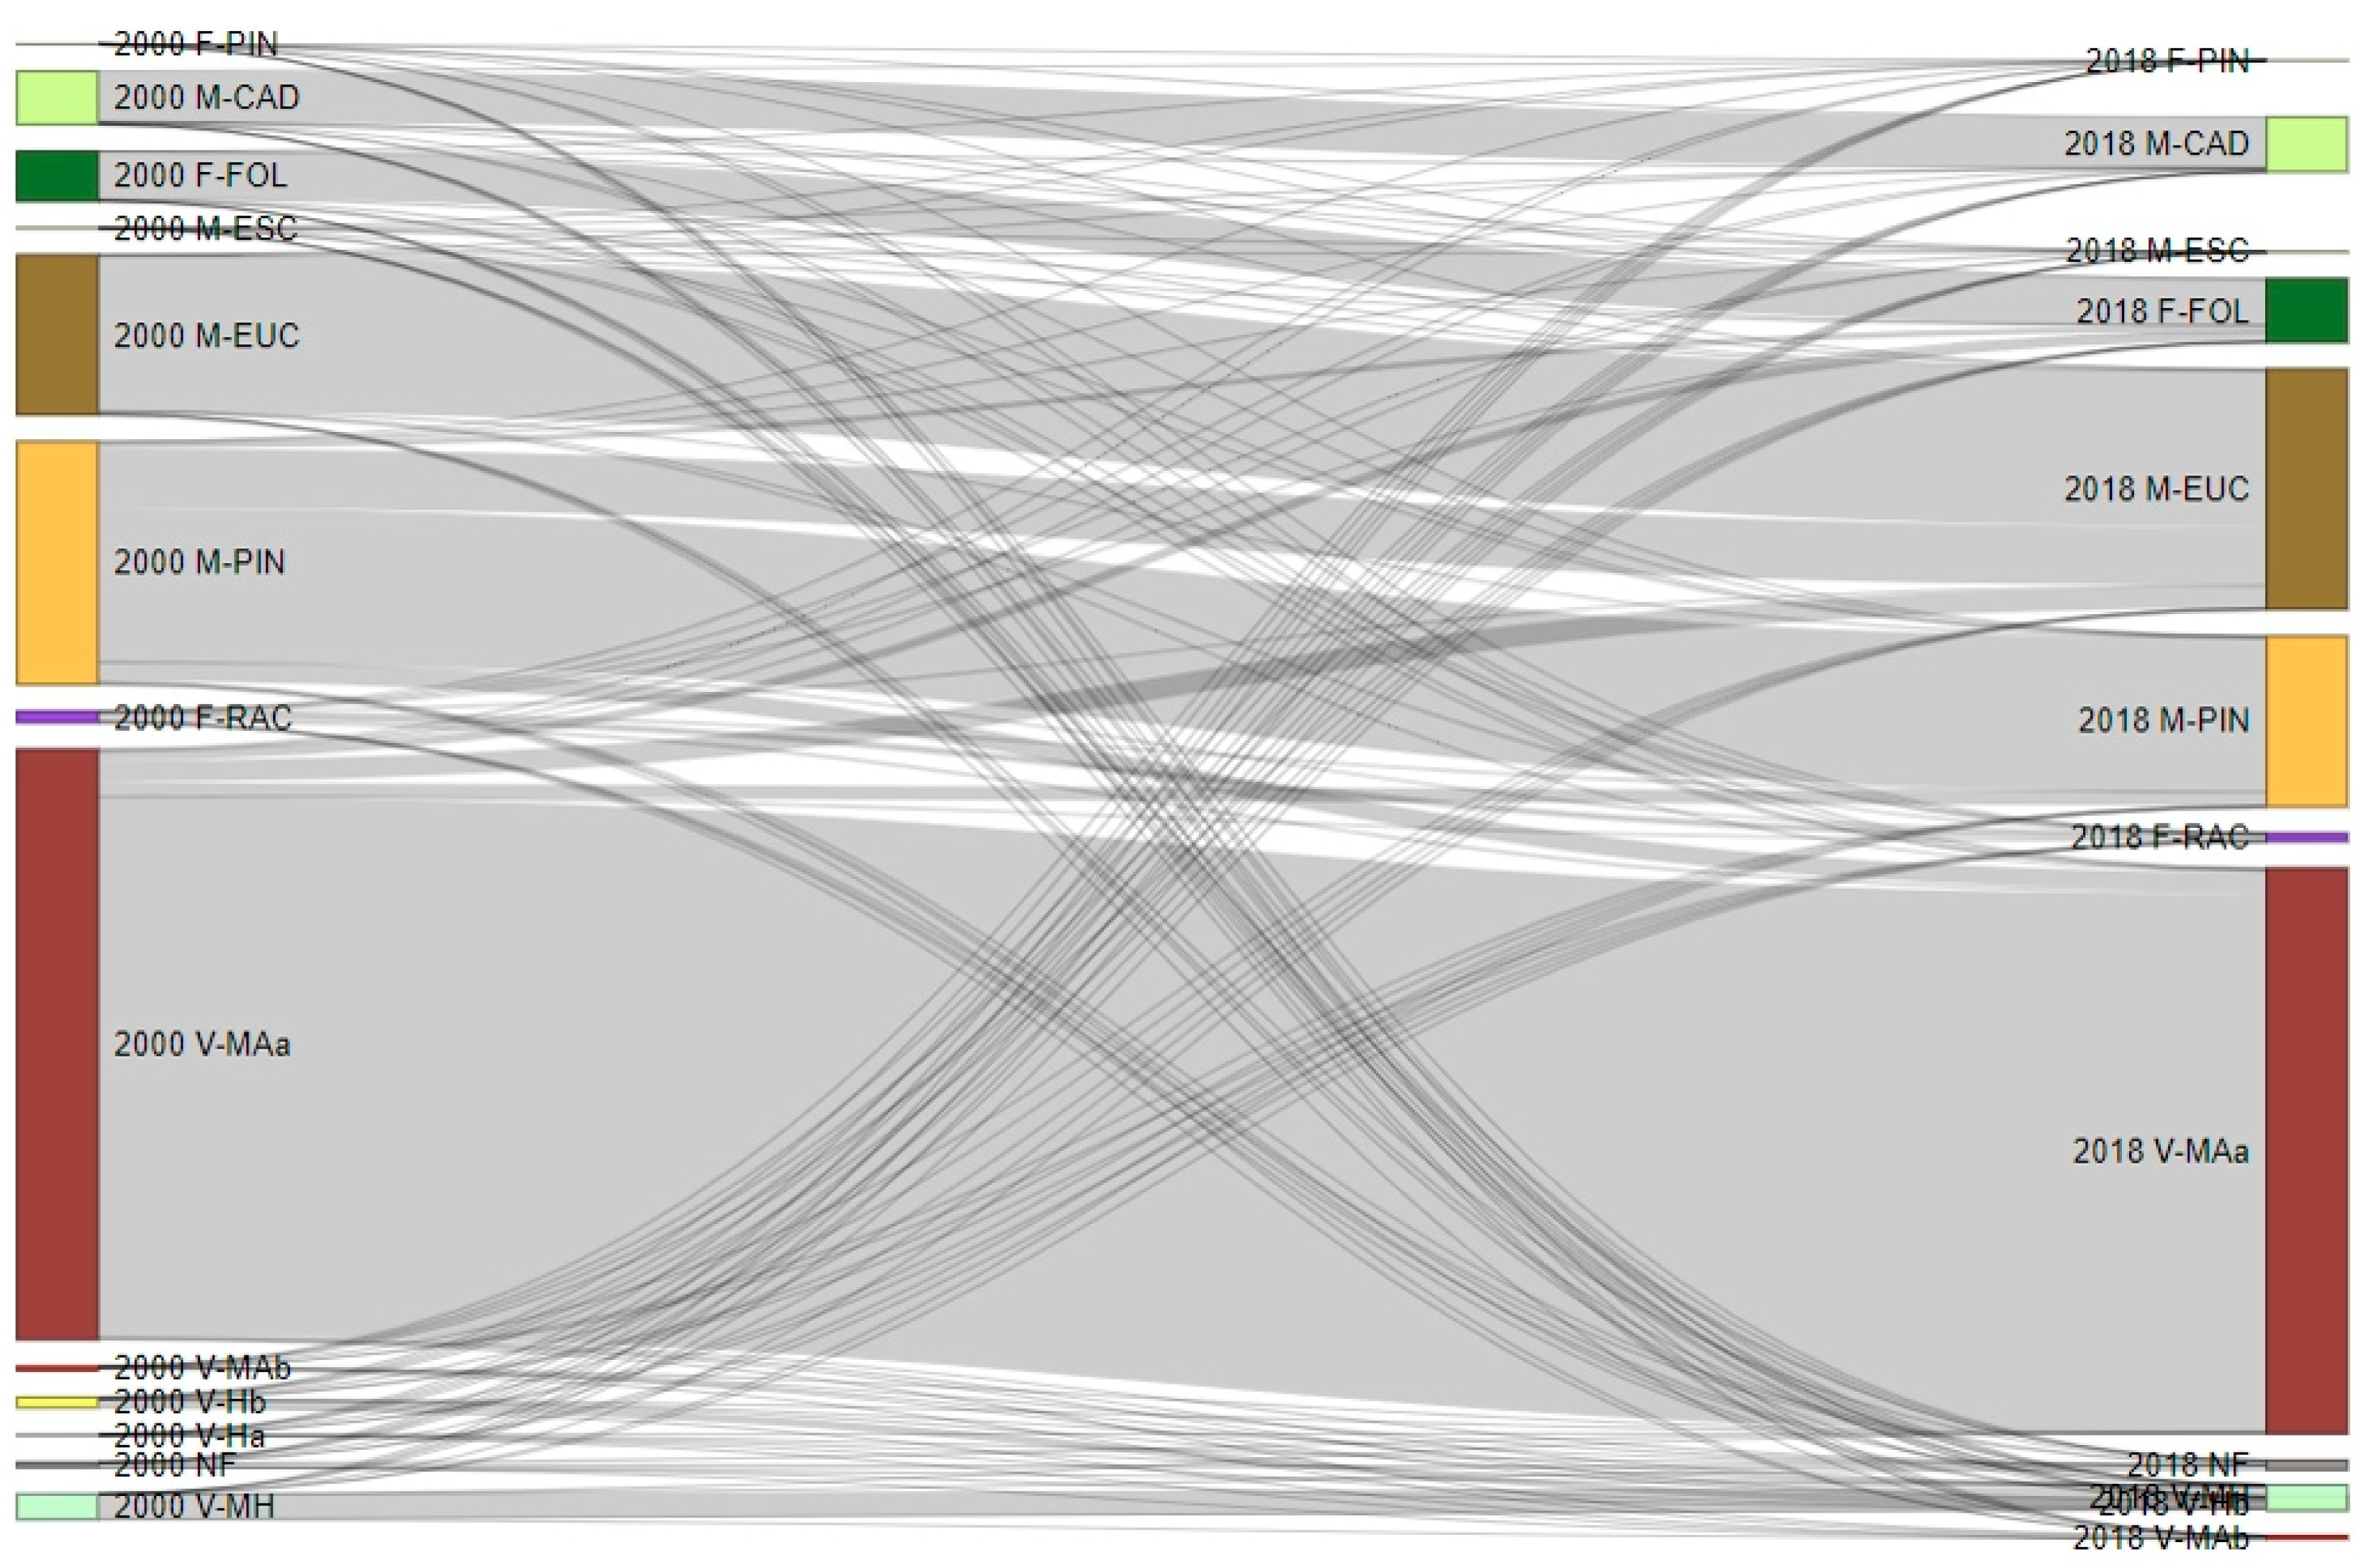
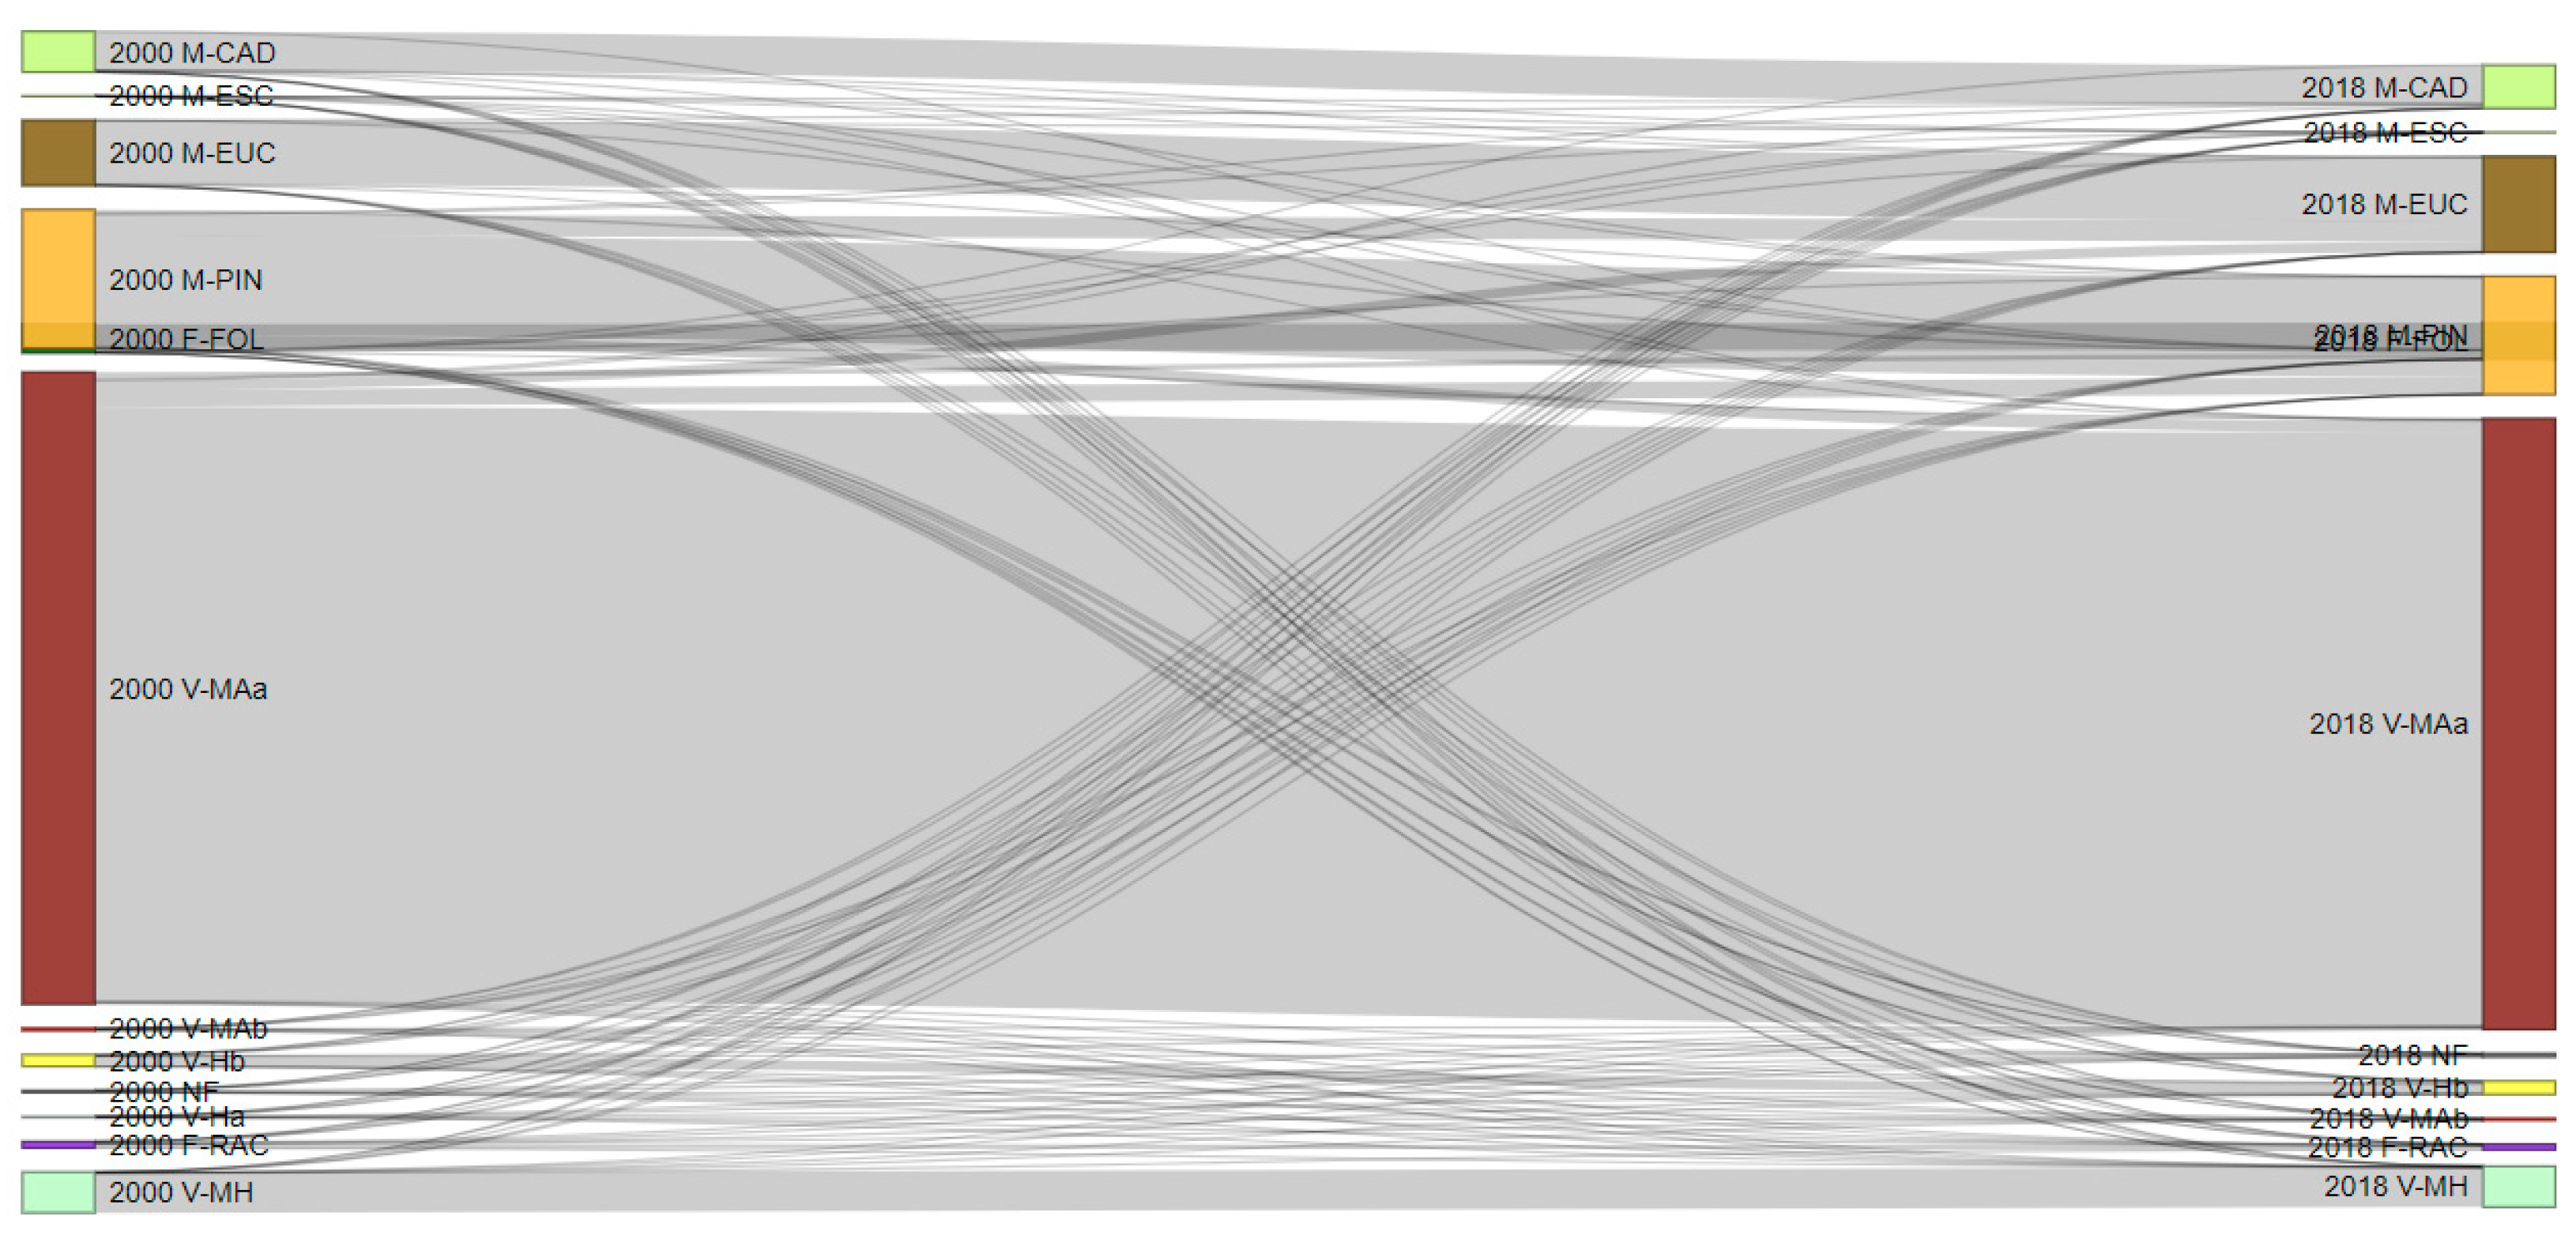
3.2. Changes in Fuel Types between 2000 and 2018

The fuel-type maps (Figure 6a,b) allow fuel-type dynamics to be compared between 2000 and 2018 in the Alto Minho region (Table 1). In 2000, the three dominant fuel types covered 65.4% of the study region: tall shrublands (V-MAa; 28.4%), fuel complexes including litter and woody understory in forest stands of medium-long needle pines (M-PIN; 19.4%), and short grasslands or pastures (V-Hb; 17.6%). Between 2000 and 2018 there was a considerable reduction (−20.9%) in the area covered by the M-PIN type, which is essentially dominated by maritime pine. V-MAa and V-Hb fuel types also lost area, showing smaller percentage decreases than M-PIN, but still −7.1% and −5.4%, respectively. In the opposite direction, we observed considerable increases in 2018 referring to fuel types typical of eucalypts (M-EUC) and broadleaved (F-FOL) forest stands, with percentage increases of 55.6% and 21.1%, respectively.
We detected fuel type changes in 25,695.02 ha of the study region (11.58% of the total area) between 2000 and 2018 (Figure 6c). The Sankey diagram (Figure 7) shows the main flows between fuel types, in which the thickness of the lines is shown proportionally to the flow quantity.
An analysis of the diagram clearly highlights the increase in typical fuels of eucalypt forest (M-EUC) because of the loss of fuel types related to maritime pine stands (M-PIN), with 7644.7 ha flow from M-PIN to M-EUC (see cross-tabulation matrices in Supplementary Materials), corresponding to 17.8% of M-PIN area in 2000. The fuel type M-PIN still lost considerable areas that flowed to shrubland fuel types (V-MAa), and to fuels of broadleaved forest (F-FOL), increasing these fuel types by 1374.6 ha and 1100.0 ha, respectively. Of the most representative fuel types in the study region, V-MAa also presents some dynamics with flows of 2524.2 ha (4.0%) to M-PIN, 1833.2 ha to M-EUC (2.9%), and 1039.9 ha to F-FOL (1.7%).
The sharp increase in broadleaved forests (F-FOL) fuel types should also be noted, which, in addition to the area transferred by the aforementioned M-PIN and V-MAa fuel types, also gained area (963.9 ha) from V-Hb (short grassland communities).

3.3. Fires and Fuels in Alto Minho: Identifying “Winners” and “Losers”

Between 2001 and 2018, more than half of the burned area (52.8%) in Alto Minho resulted from fires that spread on tall shrublands and post-fire pine regeneration (V-MAa), followed by maritime pine (M-PIN; 20.0%) and eucalypt forest (M-EUC; 11.7%). The Jacobs index D shows that fuel types V-Hb and V-MMb are strongly avoided by fire (D = −0.9 and D = −0.7, respectively), and fuel types F-FOL and M-CAD are only moderately avoided (D = −0.3 and D = −0.1, respectively), while fuel types M-EUC and V-MH are moderately preferred by fire (D = 0.2), and V-MAa is strongly fire-selected (D = 0.5) (Table 3). Although M-PIN burned in proportion to its availability in the landscape (D-value near 0), its vulnerability to fire is high. About 32.5% of the burned M-PIN changed to another fuel type, representing more than half of all observed changes in fire-affected landscapes (see Table S2 in Supplementary Materials). M-PIN present the most significant negative balance in the burned area (−4934.2 ha), having lost area to M-EUC (−4462.7 ha) and to V-MAa (−1285.9 ha). V-MAa is, in turn, another of the most significant losers in fire-affected areas, showing a negative balance of −2646.6 ha. The typical fuel types of eucalypts (M-EUC) and broadleaved (F-FOL) forest gained the most area in the fire-affected landscapes, with positive balances of 6035.3 ha and 1160.1 ha, respectively. In addition to the area gained from the M-PIN fuel type, M-EUC also received 1522.1 ha from V-MAa. In turn, the F-FOL type gained area from V-MAa (712.0 ha) and M-PIN (440.5 ha) fuel types (see cross-tabulation matrices in Supplementary Materials). In general, the balance between gains and losses that determine the “winners” and “losers” is similar to what was described in the previous section.
We found differences both in the affected area and in the flow between fuel types when we separated the fires according to the period in which they occurred (Figure 8 and Figure 9, and Tables S3 and S4 in Supplementary Materials). The distribution of the fire-season burned area by fuel types is similar to that determined through the analysis conducted on the global burned areas. Around 51.3% of the fire-season burned area was occupied by V-MAa, 21.1% by M-PIN and 13.9% by M-EUC. However, in this case the V-MH type is not preferred by fire, as mentioned above, being proportionally affected in relation to its availability in the study region (D-value near 0), such as M-PIN. Regarding the fuel types affected by unseasonal fires, about 65.2% of their area was covered by shrublands in 2000, represented by the V-MAa fuel type, while the percentage of area of fuel types M-PIN and M-EUC was lower (14.3% and 6.7%, respectively), than observed for the fires that occurred during the fire season. Regarding the Jacobs index, the major differences, when compared with the results obtained for the area affected by fires during the fire season, are in fuel types M-PIN and M-EUC, which are moderately avoided by these fires (D = −0.2 and D = −0.1), and in the V-MH fuel type which is moderately selected by fire (D = 0.3) (Table 3).
By removing the effect of the area that was cumulatively affected by seasonal and unseasonal fires (29.2% of the total burned area), the ranking of fuel types affected by seasonal fires did not change substantially, but the percentages between the three types of most affected fuel became more balanced. In this way, and considering the area affected by fire-season fires only, about 40.0% was covered by V-MAa, 25.8% by M-PIN, and 16.8% by M-EUC. Larger differences were found in areas affected by unseasonal fires only, with dominance of areas occupied by V-MAa (58.4%), followed by M-PIN (15.9%), V-MH (8.1%), and M-CAD (6.7%). According to the Jacobs index, while M-EUC and M-PIN are moderately selected by fire during the fire season (D = 0.4 and D = 0.2, respectively), they are moderately avoided outside this period (D = −0.4 and D = −0.1, respectively). M-CAD burns proportionally to its availability during the fire season (D-value near 0), while it is moderately selected by unseasonal fires. In turn, V-MH is moderately selected by fire-season fires, and strongly selected by unseasonal fires (D = 0.6) (Table 3).
Regarding the total area burned during the fire season, about 24.3% (4066.1 ha) of the M-PIN affected by these fires changed to M-EUC (Figure 8), which in turn also gained 3.5% (1412.2 ha) of the V-MAa burned area. M-EUC is the main “winner” from out-of-season fires, with an increase of 5697.0 ha (overall balance of 5523.5 ha). The 933.8 ha balance of F-FOL is also significant, gaining 571.8 ha of V-MAa and 376.6 ha of M-PIN. V-MAa also gained 1235.2 ha of M-PIN, but lost 1412.2 ha to M-EUC, with an overall negative balance of −1723.3 ha. However, the main “loser” during the fire season is M-PIN, with a negative balance of −4998.4 ha (58.8% of the overall losses in the fuel types affected by fire-season fires).
The pattern is similar for all the area affected by unseasonal fires (Figure 9), highlighting the same “winners” and “losers”, but exhibiting much less pronounced balances between gains and losses: M-EUC, +1622.3 ha; F-FOL, +409.2 ha; M-PIN, −1094.4 ha; and V-MAa, −1101.2 ha). However, differences between them are highlighted when removing the areas that represent the cumulative effect of fires that occurred in both periods (see Table S5 in Supplementary Materials). While M-PIN losses represent 59.0% of all losses in fuel types mapped in 2000 in the areas burned during the fire season, the unseasonal fires exert more expressive successional dynamics in the fuel type V-MAa, which represents 57.7% of all losses in this period. The “winners” and “losers” remain the same in the areas burned during the fire season, highlighting positive balances in fuel types M-EUC (+4412.9 ha) and F-FOL (+750.9 ha), and negative balances in fuel types M-PIN (−3839.8 ha) and V-MAa (−1545.4 ha) (see Table S6 in Supplementary Materials). However, in the areas burned by unseasonal fires, the only relevant “loser” is V-MAa (−923.3 ha), and balances are positive for M-EUC (+511.7 ha), F-FOL (226.3 ha), and also M-PIN (+64.2 ha) (see Table S7 in Supplementary Materials). The cumulative effect between areas burned by seasonal and by unseasonal events is relevant. Contrary to most fuel type transitions, part of the M-PIN losses in these areas burned by unseasonal fires overlaps areas burned during the fire season, and thus only 416.4 ha are exclusive of the non-seasonal fires, which were compensated by gains of 636.5 ha.
Figure 10 shows the percentage of the area covered by each fuel type that changed in burned areas (total, seasonal and unseasonal) as a function of their overall losses (transitions to other fuel types) in the study region.
Approximately 64.8%, 55.4%, and 5.3% of the areas that changed in the three fuel types with the highest losses in absolute terms (V-MAa, M-PIN, and V-Hb, respectively) were affected by fires between 2001 and 2018. While most of the V-MAa transitions seem to be driven by fire, any changes from communities typical of early stages of ecological succession, such as V-Hb (short grasslands), to other fuel types result from the prolonged absence of disturbance factors. In the case of M-PIN, the contribution of fire to the distribution of areas that changed to other fuel types is very relevant, but it reveals the existence of other factors explaining its overall loss in the study region. Figure 10 also highlights that the contribution of unseasonal fires to fuel type transitions is much lower than that observed in areas burned during the fire season, except for the V-MH fuel type, which represents mosaics of herbaceous and scattered low shrubs, characteristic of recently burned areas.
The logistic regression results (Table 4) help clarify the effect of different fires on fuel-type changes. Pseudo-R2 values are not too high because we only wanted to assess the effects of fire and pre-fire fuel types on fuel type transitions, excluding the effects of other drivers that boost changes in vegetation structure and composition. Of all variables, only FIREnfs was not statistically significant (z-value < 2; p-value = 0.35), evidencing its small contribution to transitions between fuel types affected by fire. Fires that spread in the fire season (FIREfs) and higher fire recurrence (FIRErec) are critical in explaining the transitions observed in the study region. FIREfs and FIRErec multiply by 1.75 and 1.62 (odds ratios), respectively, the probability of observing fuel-type transitions when compared to other areas. Despite the statistical significance, the contribution of fire size (FIREfslf) to the distribution of transitions is low. Considering the effect of the fuel types affected by fires, it is relevant to highlight the weaker level of statistical significance of M-CAD when compared to those obtained for the remaining variables. Considering that these are moderately selected by unseasonal fires, and moderately avoided by fire-season fires, it is expected that the transition probability or its contribution to the distribution of transitions will not be very effective. The results highlight the higher probability of post-fire transition in fuel types that are characteristic of forest stands dominated by conifers (M-PIN and F-RAC). These values substantially reinforce the “loser” character of M-PIN highlighted in the previous analyses and its higher vulnerability to fires. In contrast, the transition probability is reduced by 41.1% when the fuel type affected by fire is M-EUC, the most prominent “winner” among the forest stands in the previous analyses; the same can be applied to the F-FOL type, which was established as reference category in the logistic regression. We did not find a relevant effect of the patch size of forest stands on the probability of transitioning to other fuel types after fire.

4. Discussion

4.1. Fire Regime

Alto Minho is one of the European regions with the highest number and recurrence of rural fires [84,114,126,127]. However, our results show high annual variability both in burned area and fire patches number. Fire weather is the main factor in explaining the annual variability of burned area in mainland Portugal [128] and the determining fire driver in fire-prone areas with high primary productivity, such as our study region, and drought-driven fire regimes [40,129]. Both the number of unseasonal fires and their burned area exceed, in most years, those of seasonal fires. However, this only happens when the annual burned area is lower than the annual average for the study period. This observation was used by Barreiro and Rodrigues [130] to state that the empowerment of traditional communities allowing them to use fire for landscape management must be eradicated to avoid the costs of wildfires. However, the authors disconnected the percentage distribution from the absolute variation in a wider universe of years, which resulted in a mistaken conclusion, one that could motivate policy options that will make the fire regime more severe by contributing to fuel accumulation and increasing the probability of large and/or extreme fires. The fire return period is between 13 and 15 years and is similar to those obtained by other authors [113,114,131] using different timeframes and fire data. The Weibull parameter estimation also pointed out that fire hazard increases over time and is fuel-age dependent [113,114]. Fire size increases with high fuel connectivity and low pyrodiversity [46] and excluding unseasonal fires from the landscape will contribute to fuel buildup and increase spatial homogeneity of wildland fuels, as observed elsewhere [132,133,134]. Less heterogeneous cultural landscapes due to the disruption of cultural burning leads to the encroachment of more flammable fuels [13,135,136], mainly where fire-supported cultural practices have been banned. The distinctive character of the vegetation mosaics of the cultural landscapes of the Alto Minho region is gradually changing, with the exception of the mountain areas where ancestral agro-silvopastoral practices are still maintained. This is indicative of the importance that fire as a management tool still has in the region [131], and these unseasonal fires have lower damage potential when compared with fires spreading during the fire season, which is supported by the positive relation between fire size and high fire severity established by Fernández-Guisuraga et al. [137].
The distribution of fire patches and area burned by fire size class follows a typical pattern already observed and discussed in other geographical contexts [138,139,140]. Most of the fire-affected area (in some years exceeding 75%) results from the contribution of less than 5% of the total number of fires (fires >100 ha). However, unseasonal fires had a different pattern, since their contribution to annual burned area decreases with fire size. This difference reflects the number of events, but also the lower suppression capacity in the summer months when fire-weather conditions exceed the typical thresholds that allow fast wildfire growth in this geographic context [141], reinforcing the need to maintain a landscape with sufficient structural heterogeneity to guarantee a set of potential opportunities that can be used effectively by firefighting resources.

4.2. Effects of Fire Seasonality on Fuel Types Preferred by Fire

The assessment of fire selectivity by land cover types has already been addressed in different geographic contexts and scales (e.g., [58,59,142,143,144,145,146,147,148,149]). However, there are not many studies addressing the effect of fire seasonality on fire preferences. Bajocco et al. [69] analyzed seasonal patterns of fire occurrence in Sardinia (Italy) to identify land cover types where wildfires occur earlier or later than expected in a random model, and concluded that agricultural fires occur earlier, while ignitions in forests, shrublands and pastures occur later than expected. V-MAa fuel type (tall shrublands) is preferred by fire regardless of the period in which fires occur. This fire selection of shrublands is highlighted by different studies carried out in Europe at different scales and using different methodological approaches (e.g., [58,59,142,146,147]). According to Bergonse et al. [150], the area covered by shrublands controls the extent of burned area. The representative fuel types of herbaceous communities (V-Ha and V-Hb), where agricultural areas are included, are clearly avoided by fire, also corroborating other studies [58,59,147]. Still, Oliveira et al. [142], in a comparative study among southern European countries, found that grasslands are among the most preferred types of fuel. Our results reveal an interesting difference in the shrubland fuel types, since the V-MMb fuel type (short shrublands) burned less than expected, regardless of the period in which the fires occur, and contrary to the observed for the V-MAa fuel type. This difference may result from the easier fire suppression in fuel complexes with less fuel load, thus limiting the burned area in that fuel complex (1-h fuel load of 9.5 t.ha−1 for V-MAa and 4.0 t.ha−1 for V-MMb [91]). The V-MH fuel type, which represents heterogeneous mosaics of herbaceous and shrub species and is typical of recently burned or affected by other disturbance factors [91], burns proportionally to its availability in the landscape during the fire season, but is strongly selected by unseasonal fires. The results of Bajocco et al. [68] show that, in Central Italy, a proportion of the vegetation communities is affected by fires during the winter-spring rainy season and that this bimodal fire regime is strongly determined by human fire use for landscape management. On the global scale, Benali et al. [67] pointed out that in regions showing bimodal fire regimes the fraction of fires occurring in crops and pastures is closely related with the use of fire as a land management tool. These cultural fires are started by humans to clear land and renew pastures, and to obtain fresh and nutritious herbaceous vegetation for livestock [25,151]. The difference in fire selectivity highlighted in V-MH between seasonal and unseasonal fires is indicative of the importance that fire as a management tool still has in the region [131]. According to Oliveira and Fernandes [131] pastoral fires: accounted for 20% of the total area burned between 2000 and 2020 in our study region, are more frequent and mostly prevail over seasonal fires in parishes with a higher livestock density and occur mainly between December and April, the rainiest months, which guarantee the conditions for the renewal of pastures and the self-extinction of fire. The concentration of area burned by non-seasonal fires in V-MAa is not surprising, as most of these fires are intended to increase the availability of livestock forage through shrubland burning [25,26,131,152,153].
Concerning the fuel types typical of forest stands, we found relevant differences resulting from fire seasonality and also contrasting with findings from other studies. Our results show that the F-FOL fuel type (typical of broadleaved forests) is moderately avoided by fire, being independent of fire seasonality. The results obtained by Moreira et al. [147] for the study region are coincident with ours—F-FOL fuel types also burned less than expected—while Silva et al. [145] showed the opposite since, in their findings, unspecified broadleaved forests were among the forest types most preferred by fire. These differences may be due to the fact that this heterogeneous group of forest stands has a high diversity of vegetation communities, from less fire-prone riparian galleries to areas covered by invasive species such as Acacia spp. [62] highly susceptible to fire. Barros and Pereira [59] highlight the greater land cover proneness of the maritime pine, similar to what we obtained for M-PIN for the fires that spread during the fire season. However, our findings indicate that the M-PIN fuel type is avoided by unseasonal fires. The same pattern was observed for type M-EUC (typical of eucalyptus forest stands).

4.3. The Role of Fire in Changing Fuel Types

According to our results, the “loser” that stands out in our study region is the M-PIN fuel type. In a logistic regression, fire metrics emerge that can explain this greater vulnerability of M-PIN to fire. The effect of fire recurrence is very high, since Pinus pinaster generically needs fire intervals higher than 14 years to guarantee the sexual maturity of the individuals [154], whose effect was observed in other pine species, such as Pinus attenuata which is also an obligatory post-fire seeder with serotinous cones [155]. The logistic regression also highlighted the effect of seasonal fires on the transitions from M-PIN. Post-fire regeneration of maritime pine is also extremely affected by fire severity [156,157,158,159]. Considering the positive relationship established by Fernández-Guisuraga et al. [137] between fire size and the proportion of high fire severity, it is expected that larger seasonal fires have a negative impact on the survival of individuals, as observed in other land systems [63]. Moreover, large-scale disturbances are associated with high uncertainty in the succession pathways, which increases with the destruction of biological legacies required for post-fire response and the need of colonization from unburned edges [160]. Maritime pine, like other conifers (e.g., [158,161,162,163,164]), has regeneration mechanisms allowing its survival and regeneration after surface fires of low to moderate severity. Although unseasonal fires did not have significant effects on the probability of change, it is relevant to note that the only positive balance between losses and gains (Table S7 in Supplementary Materials) in M-PIN was registered in areas affected by unseasonal fires only (excluding the overlapped areas with seasonal fires). Moreover, the lower Pseudo-R2 values indicate that there are other factors driving the observed changes in fuel types. In the case of the M-PIN fuel type, ~55% of its overall gains and losses occurred in fire-affected areas. Outside the burned area, gains may result from colonization and growth in areas burned before 2001, while losses may be related to the development of pine wilt disease that has spread across the country in recent decades [165].
Another relevant “loser” in the study region was V-MAa fuel type, which lost area to M-PIN and M-EUC. Despite the negative balance verified in this time period, the V-MAa fuel type is the one whose dynamics are most determined by fire, since 73.8% of its global gains and 64.7% of its global losses occurred in areas affected by fires. The V-MAa to M-PIN transition may correspond to pine development in previously burned areas, since V-MAa also includes dense natural pine regeneration up to a certain growth stage. M-EUC, which was the main “winner” between 2000 and 2018, gained area from M-PIN and V-MAa. Despite the low mortality rate and the natural establishment of eucalypts in burned areas [166,167], this increase in M-EUC (62.1% of global gains occurred in the burned areas) seems to be due to changes promoted by land owners or managers as a result of opportunities provided by fire. This replacement of forest species, allowing eucalypt (mainly Eucalyptus globulus) expansion, had already been highlighted by Moreira et al. [57]. F-FOL fuel type, characteristic of broadleaved forest stands, also showed positive balance between gains and losses in the burned areas. However, it should be noted that the broadleaved land cover classes re-classified as fuel types also include alien invaders such as Acacia spp. [62], whose expansion essentially results from the effect of ecological and management-induced disturbances, including wildfires [168]. However, only 35.5% of the global gains were observed in burned areas. The overall increase in the F-FOL fuel type may also be related to colonization processes by natural vegetation, including trees, after abandonment of agricultural activity, in particular where the observed transitions arise from the V-Hb fuel type associated with herbaceous plant communities. Agriculture abandonment and decreased grazing intensity had also been emphasized by Moreira et al. [57] as drivers of change in fire regimes, since they cause shrub encroachment and/or tree expansion (e.g., [169,170,171,172]), and consequently in fuel accumulation and fuel structure homogenization.

5. Conclusions

Our results showed, at the landscape scale, relevant dynamics in the distribution of the fuel types most representative in Alto Minho between 2000 and 2018, due to the high burned area in the same period. The fuel types representing maritime pine stands are being replaced by fuel complexes related to eucalypt plantations. This change is the result of the loss of income in burned pine forest stands and rural landowners’ recognition of an opportunity for change. Another significant change that occurs in parallel with the gain of eucalypt fuel types at the expense of pine fuel types stems from the expansion of broadleaved-tree fuel types, which partially result from the post-fire expansion of invasive species; this process has not yet been addressed on a spatial scale allowing accurate assessment of the global effects of fire on the current expansion of alien species. However, these processes occur mainly in areas that were affected by fire-season fires. Unseasonal fires are more selective, are smaller, and induce less perceptible changes at this scale of analysis. Furthermore, the spatial distribution of seasonal and unseasonal fires is substantially different, despite the spatial overlap in ~29% of the global burned area that cannot be neglected. This overlap may be due to the increased marginalization of cultural fires that starts to have unintended consequences; on the one hand related to unattended ignitions occurring closer to the fire season, and on the other hand with the increased fuel load resulting from the de-intensification of land use. In the past, fire was used in northwest Iberia as an instrument for clearing land for farming, for soil fertilization, for pasture restoration, and for burning agricultural and forest residues. Currently, such use of fire, which emerges from ancestral traditional practices of land use, is also one of the main causes of rural fires, as a result of fire suppression policies. However, the simple fact that they constitute one of the main causes of ignition does not directly imply that the damage caused by these fires is high. To avoid large fires, with the potential to induce changes in the landscape and threaten people and property, fire management policies will have to meet shepherds’ needs, making them allies in the pursuit of landscape management objectives.

Supplementary Materials

The following supporting information can be downloaded at: https://www.mdpi.com/article/10.3390/fire6070267/s1, Table S1: Cross-tabulation matrix of changes in fuel types in the study region between 2001 and 2018; Table S2: Cross-tabulation matrix of changes in fuel types between 2000 and 2018 in the burned area; Table S3: Cross-tabulation matrix of changes in fuel types between 2000 and 2018 in the burned area by fire-season fires; Table S4: Cross-tabulation matrix of changes in fuel types between 2000 and 2018 in the burned area by non-seasonal fires; Table S5: Cross-tabulation matrix of changes in fuel types between 2000 and 2018 in the burned area resulting from the spatial intersection between seasonal and non-seasonal fires; Table S6. Matrix of changes in fuel types (in hectares) between 2000 and 2018 in the burned area by fire-season fires only; Table S7. Matrix of changes in fuel types (in hectares) between 2000 and 2018 in the burned area by unseasonal fires only.

Author Contributions

Conceptualization, E.O. and N.G.; methodology, E.O. and N.G.; formal analysis, E.O. and N.G.; investigation, E.O.; data curation, E.O. and N.G.; writing—original draft preparation, E.O. and N.G.; writing—review and editing, E.O., P.M.F., D.B. and N.G; visualization, E.O., P.M.F., N.G. and D.B. All authors have read and agreed to the published version of the manuscript.

Funding

N.G. was funded by the European Union through the European Regional Development Fund in the framework of the Interreg V-A Spain-Portugal program (POCTEP) under the CILIFO (Ref. 0753_CILIFO_5_E) and FIREPOCTEP (Ref. 0756_FIREPOCTEP_6_E) projects and by National Funds through FCT under the Project UIDB/05183/2020. P.M.F. contributed in the frame of the nationally-funded FCT Project UIDB/04033/2020.

Institutional Review Board Statement

Not applicable.

Informed Consent Statement

Not applicable.

Data Availability Statement

Not applicable.

Acknowledgments

The authors thank Eng. Bruno Caldas (Inter-Municipal Community of Alto Minho) for providing historical series of orthophotos between 2001 and 2020, and Eng.ª Susana Pereira (Forestry Technical Office of the Municipality of Ponte de Lima) for providing orthophotos from the late 1990s.

Conflicts of Interest

The authors declare that there are no conflict of interest.

References

  1. He, T.; Lamont, B.B. Baptism by Fire: The Pivotal Role of Ancient Conflagrations in Evolution of the Earth’s Flora. Natl. Sci. Rev. 2018, 5, 237–254. [Google Scholar] [CrossRef] [Green Version]
  2. Pausas, J.G.; Keeley, J.E. A Burning Story: The Role of Fire in the History of Life. Bioscience 2009, 59, 593–601. [Google Scholar] [CrossRef] [Green Version]
  3. Belcher, C.M.; Mills, B.J.W.; Vitali, R.; Baker, S.J.; Lenton, T.M.; Watson, A.J. The Rise of Angiosperms Strengthened Fire Feedbacks and Improved the Regulation of Atmospheric Oxygen. Nat. Commun. 2021, 12, 503. [Google Scholar] [CrossRef]
  4. McLauchlan, K.K.; Higuera, P.E.; Miesel, J.; Rogers, B.M.; Schweitzer, J.; Shuman, J.K.; Tepley, A.J.; Varner, J.M.; Veblen, T.T.; Adalsteinsson, S.A.; et al. Fire as a Fundamental Ecological Process: Research Advances and Frontiers. J. Ecol. 2020, 108, 2047–2069. [Google Scholar] [CrossRef]
  5. MacDonald, K. Fire-Free Hominin Strategies for Coping with Cool Winter Temperatures in North-Western Europe from before 800,000 to Circa 400,000 Years Ago. Paleo Anthropol. 2018, 16, 7–26. [Google Scholar] [CrossRef]
  6. Roebroeks, W.; Villa, P. On the Earliest Evidence for Habitual Use of Fire in Europe. Proc. Natl. Acad. Sci. USA 2011, 108, 5209–5214. [Google Scholar] [CrossRef]
  7. Daniau, A.L.; D’Errico, F.; Goñi, M.F.S. Testing the Hypothesis of Fire Use for Ecosystem Management by Neanderthal and Upper Palaeolithic Modern Human Populations. PLoS ONE 2010, 5, e9157. [Google Scholar] [CrossRef] [PubMed]
  8. Connor, S.E.; Vannière, B.; Colombaroli, D.; Anderson, R.S.; Carrión, J.S.; Ejarque, A.; Gil Romera, G.; González-Sampériz, P.; Hoefer, D.; Morales-Molino, C.; et al. Humans Take Control of Fire-Driven Diversity Changes in Mediterranean Iberia’s Vegetation during the Mid–Late Holocene. Holocene 2019, 29, 886–901. [Google Scholar] [CrossRef]
  9. Abel-Schaad, D.; López-Sáez, J.A. Vegetation Changes in Relation to Fire History and Human Activities at the Peña Negra Mire (Bejar Range, Iberian Central Mountain System, Spain) during the Past 4000 Years. Veg. Hist. Archaeobot 2013, 22, 199–214. [Google Scholar] [CrossRef] [Green Version]
  10. Bal, M.C.; Pelachs, A.; Perez-Obiol, R.; Julia, R.; Cunill, R. Fire History and Human Activities during the Last 3300cal Yr BP in Spain’s Central Pyrenees: The Case of the Estany de Burg. Palaeogeogr. Palaeoclim. Palaeoecol. 2011, 300, 179–190. [Google Scholar] [CrossRef]
  11. Santos, L.; Romani, V., Jr.; Jalut, G. History of Vegetation during the Holocene in the Courel and Queixa Sierras, Galicia, Northwest Iberian Peninsula. J. Quat. Sci. 2000, 15, 621–632. [Google Scholar] [CrossRef]
  12. Carrión, J.S.; Sánchez-Gómez, P.; Mota, J.F.; Yll, R.; Chaín, C. Holocene Vegetation Dynamics, Fire and Grazing in the Sierra de Gádor, Southern Spain. Holocene 2003, 13, 839–849. [Google Scholar] [CrossRef] [Green Version]
  13. Johansson, M.U.; Fetene, M.; Malmer, A.; Granström, A. Tending for Cattle: Traditional Fire Management in Ethiopian Montane Heathlands. Ecol. Soc. 2012, 17, 19. [Google Scholar] [CrossRef]
  14. Leone, V.; Lovreglio, R.; Martín, M.P.; Martínez, J.; Vilar, L. Human Factors of Fire Occurrence in the Mediterranean. In Earth Observation of Wildland Fires in Mediterranean Ecosystems; Chuvieco, E., Ed.; Springer: Berlin/Heidelberg, Germany, 2009; pp. 149–170. [Google Scholar]
  15. Fernandes, P.M.; Santos, J.A.; Castedo-dorado, F.; Almeida, R. Fire from the Sky in the Anthropocene. Fire 2021, 4, 13. [Google Scholar] [CrossRef]
  16. ICNF. Sistema de Gestão de Incêndios Florestais—Versão1.1 2015; Instituto de Conservação da Natureza e das Florestas: Lisboa, Portugal; Available online: https://fogos.icnf.pt/sgif_app/FiltraMapasGraficos.asp (accessed on 10 March 2023).
  17. Pereira, M.G.; Malamud, B.D.; Trigo, R.M.; Alves, P.I. The History and Characteristics of the 1980-2005 Portuguese Rural Fire Database. Nat. Hazards Earth Syst. Sci. 2011, 11, 3343–3358. [Google Scholar] [CrossRef] [Green Version]
  18. Santalla, A.L.; García, M.L. Los Incendios Forestales En España—Decenio 2006–2015; Ministerio de Agricultura, Pesca y Alimentación: Madrid, Spain, 2019.
  19. Rego, F.; Rigolot, E.; Fernandes, P.; Joaquim, C.M.; Silva, S. Towards Integrated Fire Management; EFI Policy Brief No. 4., European Forest Institute: Joensuu, Finland, 2010; Available online: https://gfmc.online/wp-content/uploads/Fire-Paradox-Policy-Brief-Integrated-Fire-Management-ENG.pdf (accessed on 18 March 2022).
  20. Reyes-García, V. Conocimiento Ecológico Tradicional Para La Conservación: Dinámicas y Conflictos. Papeles 2009, 107, 39–55. [Google Scholar]
  21. Welch, J.R.; Coimbra, C.E.A. Indigenous Fire Ecologies, Restoration, and Territorial Sovereignty in the Brazilian Cerrado: The Case of Two Xavante Reserves. Land Use Policy 2021, 104, 104055. [Google Scholar] [CrossRef]
  22. Fernandes, P.M.; Davies, G.M.; Ascoli, D.; Fernández, C.; Moreira, F.; Rigolot, E.; Stoof, C.R.; Vega, J.A.; Molina, D. Prescribed Burning in Southern Europe: Developing Fire Management in a Dynamic Landscape. Front. Ecol. Environ. 2013, 11, e4–e14. [Google Scholar] [CrossRef] [Green Version]
  23. Mistry, J.; Bilbao, B.A.; Berardi, A. Community Owned Solutions for Fire Management in Tropical Ecosystems: Case Studies from Indigenous Communities of South America. Philos. Trans. R. Soc. B Biol. Sci. 2016, 371, 20150174. [Google Scholar] [CrossRef] [PubMed] [Green Version]
  24. Lasanta, T.; Cortijos-López, M.; Errea, M.P.; Khorchani, M.; Nadal-Romero, E. An Environmental Management Experience to Control Wildfires in the Mid-Mountain Mediterranean Area: Shrub Clearing to Generate Mosaic Landscapes. Land Use Policy 2022, 118, 106147. [Google Scholar] [CrossRef]
  25. Ruiz-Mirazo, J.; Martínez-Fernández, J.; Vega-García, C. Pastoral Wildfires in the Mediterranean: Understanding Their Linkages to Land Cover Patterns in Managed Landscapes. J. Environ. Manag. 2012, 98, 43–50. [Google Scholar] [CrossRef]
  26. San Emeterio, L.; Múgica, L.; Ugarte, M.D.; Goicoa, T.; Canals, R.M. Sustainability of Traditional Pastoral Fires in Highlands under Global Change: Effects on Soil Function and Nutrient Cycling. Agric. Ecosyst. Environ. 2016, 235, 155–163. [Google Scholar] [CrossRef]
  27. Coughlan, M.R. Errakina: Pastoral Fire Use and Landscape Memory In the Basque Region of the French Western Pyrenees. J. Ethnobiol. 2013, 33, 86–104. [Google Scholar] [CrossRef]
  28. Ascoli, D.; Bovio, G. Prescribed Burning in Italy: Issues, Advances and Challenges. iForest 2013, 6, 79–89. [Google Scholar] [CrossRef] [Green Version]
  29. Meddour-Sahar, O.; Lovreglio, R.; Meddour, R.; Leone, V.; Derridj, A. Fire and People in Three Rural Communities in Kabylia (Algeria): Results of a Survey. Open J. 2013, 3, 30–40. [Google Scholar] [CrossRef] [Green Version]
  30. Castoldi, E.; Quintana, J.R.; Mata, R.G.; Molina, J.A. Early Post-Fire Plant Succession in Slash-Pile Prescribed Burns of a Sub-Mediterranean Managed Forest. Plant Ecol. Evol. 2013, 146, 272–278. [Google Scholar] [CrossRef]
  31. van Vliet, J.; de Groot, H.L.F.; Rietveld, P.; Verburg, P.H. Manifestations and Underlying Drivers of Agricultural Change in Europe. Landsc. Urban. Plan. 2015, 133, 24–36. [Google Scholar] [CrossRef] [Green Version]
  32. Plieninger, T.; Draux, H.; Fagerholm, N.; Bieling, C.; Bürgi, M.; Kizos, T.; Kuemmerle, T.; Primdahl, J.; Verburg, P.H. The Driving Forces of Landscape Change in Europe: A Systematic Review of the Evidence. Land Use Policy 2016, 57, 204–214. [Google Scholar] [CrossRef] [Green Version]
  33. Schulp, C.J.E.; Levers, C.; Kuemmerle, T.; Tieskens, K.F.; Verburg, P.H. Mapping and Modelling Past and Future Land Use Change in Europe’s Cultural Landscapes. Land Use Policy 2019, 80, 332–344. [Google Scholar] [CrossRef]
  34. Weissteiner, C.J.; Strobl, P.; Sommer, S. Assessment of Status and Trends of Olive Farming Intensity in EU-Mediterranean Countries Using Remote Sensing Time Series and Land Cover Data. Ecol. Indic. 2011, 11, 601–610. [Google Scholar] [CrossRef]
  35. Kuemmerle, A.T.; Levers, C.; Erb, K.; Estel, S.; Martin, R. Hotspots of Land Use Change in Europe. Environ. Res. Lett. 2016, 11, 1–48. [Google Scholar] [CrossRef] [Green Version]
  36. Levers, C.; Müller, D.; Erb, K.; Haberl, H.; Jepsen, M.R.; Metzger, M.J.; Meyfroidt, P.; Plieninger, T.; Plutzar, C.; Stürck, J.; et al. Archetypical Patterns and Trajectories of Land Systems in Europe. Reg. Environ. Chang. 2018, 18, 715–732. [Google Scholar] [CrossRef]
  37. Plutzar, C.; Kroisleitner, C.; Haberl, H.; Fetzel, T.; Bulgheroni, C.; Beringer, T.; Hostert, P.; Kastner, T.; Kuemmerle, T.; Lauk, C.; et al. Changes in the Spatial Patterns of Human Appropriation of Net Primary Production (HANPP) in Europe 1990–2006. Reg. Environ. Chang. 2016, 16, 1225–1238. [Google Scholar] [CrossRef]
  38. Weissteiner, C.J.; Boschetti, M.; Böttcher, K.; Carrara, P.; Bordogna, G.; Brivio, P.A. Spatial Explicit Assessment of Rural Land Abandonment in the Mediterranean Area. Glob. Planet. Chang. 2011, 79, 20–36. [Google Scholar] [CrossRef]
  39. Debolini, M.; Marraccini, E.; Dubeuf, J.P.; Geijzendorffer, I.R.; Guerra, C.; Simon, M.; Targetti, S.; Napoléone, C. Land and Farming System Dynamics and Their Drivers in the Mediterranean Basin. Land Use Policy 2018, 75, 702–710. [Google Scholar] [CrossRef]
  40. Fernandes, P.M.; Loureiro, C.; Guiomar, N.; Pezzatti, G.B.; Manso, F.T.; Lopes, L. The Dynamics and Drivers of Fuel and Fire in the Portuguese Public Forest. J. Environ. Manag. 2014, 146, 373–382. [Google Scholar] [CrossRef]
  41. Viedma, O.; Moity, N.; Moreno, J.M. Changes in Landscape Fire-Hazard during the Second Half of the 20th Century: Agriculture Abandonment and the Changing Role of Driving Factors. Agric. Ecosyst. Environ. 2015, 207, 126–140. [Google Scholar] [CrossRef]
  42. Azevedo, J.C.; Moreira, C.; Castro, J.P.; Loureiro, C. Agriculture Abandonment, Land- Use Change and Fire Hazard in Mountain Landscapes in Northeastern Portugal. In Landscape Ecology in Forest Management and Conservation: Challenges and Solutions for Global Change; Li, C., Lafortezza, R., Chen, J., Eds.; Springer: Berlin/Heidelberg, Germany, 2011; pp. 329–351. [Google Scholar]
  43. Sil, Â.; Fernandes, P.M.; Paula, A.; Alonso, J.M.; Honrado, J.P.; Perera, A.; Azevedo, J.C. Farmland Abandonment Decreases the Fire Regulation Capacity and the Fire Protection Ecosystem Service in Mountain Landscapes. Ecosyst. Serv. 2019, 36, 100908. [Google Scholar] [CrossRef] [Green Version]
  44. Collins, R.D.; de Neufville, R.; Claro, J.; Oliveira, T.; Pacheco, A.P. Forest Fire Management to Avoid Unintended Consequences: A Case Study of Portugal Using System Dynamics. J. Environ. Manag. 2013, 130, 1–9. [Google Scholar] [CrossRef]
  45. Ingalsbee, T. Whither the Paradigm Shift? Large Wildland Fires and the Wildfire Paradox Offer Opportunities for a New Paradigm of Ecological Fire Management. Int. J. Wildland Fire 2017, 26, 557–561. [Google Scholar] [CrossRef]
  46. Leone, V.; Tedim, F.; Xanthopoulos, G. Fire Smart Territory as an Innovative Approach to Wildfire Risk Reduction. In Extreme Wildfire Events and Disasters: Root Causes and New Management Strategies; Tedim, F., Leone, V., McGee, T.K., Eds.; Elsevier: Amesterdam, The Netherlands, 2020; pp. 201–215. ISBN 9780128157213. [Google Scholar]
  47. Fernandes, P.M.; Monteiro-Henriques, T.; Guiomar, N.; Loureiro, C.; Barros, A.M.G. Bottom-up Variables Govern Large-Fire Size in Portugal. Ecosystems 2016, 19, 1362–1375. [Google Scholar] [CrossRef]
  48. Castellnou, M.; Guiomar, N.; Rego, F.; Fernandes, P.M. Fire Growth Patterns in the 2017 Mega Fire Episode of October 15, Central Portugal. In Advances in Forest Fire Research 2018; Viegas, D.X., Ed.; ADAI/CEIF; University of Coimbra: Coimbra, Portugal, 2018; pp. 447–453. ISBN 9789892616506. [Google Scholar]
  49. Rodrigues, M.; Cunill Camprubí, À.; Balaguer-Romano, R.; Coco Megía, C.J.; Castañares, F.; Ruffault, J.; Fernandes, P.M.; Resco de Dios, V. Drivers and Implications of the Extreme 2022 Wildfire Season in Southwest Europe. Sci. Total Environ. 2023, 859, 160320. [Google Scholar] [CrossRef]
  50. Dossi, S.; Messerschmidt, B.; Ribeiro, L.M.; Almeida, M.; Rein, G. Relationships between Building Features and Wildfire Damage in California, USA and Pedrógão Grande, Portugal. Int. J. Wildland Fire 2022, 32, 296–312. [Google Scholar] [CrossRef]
  51. Pinto, P.; Silva, Á.P.; Viegas, D.X.; Almeida, M.; Raposo, J.; Ribeiro, L.M. Influence of Convectively Driven Flows in the Course of a Large Fire in Portugal: The Case of Pedrógão Grande. Atmosphere 2022, 13, 414. [Google Scholar] [CrossRef]
  52. Giannaros, T.M.; Papavasileiou, G.; Lagouvardos, K.; Kotroni, V.; Dafis, S.; Karagiannidis, A.; Dragozi, E. Meteorological Analysis of the 2021 Extreme Wildfires in Greece: Lessons Learned and Implications for Early Warning of the Potential for Pyroconvection. Atmosphere 2022, 13, 475. [Google Scholar] [CrossRef]
  53. Seijo, F.; Cespedes, B.; Zavala, G. Traditional Fire Use Impact in the Aboveground Carbon Stock of the Chestnut Forests of Central Spain and Its Implications for Prescribed Burning. Sci. Total Environ. 2018, 625, 1405–1414. [Google Scholar] [CrossRef]
  54. Mariani, M.; Connor, S.E.; Theuerkauf, M.; Herbert, A.; Kuneš, P.; Bowman, D.; Fletcher, M.S.; Head, L.; Kershaw, A.P.; Haberle, S.G.; et al. Disruption of Cultural Burning Promotes Shrub Encroachment and Unprecedented Wildfires. Front. Ecol. Environ. 2022, 20, 292–300. [Google Scholar] [CrossRef]
  55. Souza, M.E.B.; Pacheco, A.P.; Teixeira, J.G. Systematizing Experts’ Risk Perception on Rural Fires Resulting from Traditional Burnings in Portugal: A Mental Model Approach. In Advances in Forest Fire Research 2022; Imprensa da Universidade de Coimbra: Coimbra, Portugal, 2022; pp. 1520–1525. [Google Scholar]
  56. Coutinho, J.M.P. Incêndios Florestais: Causas e Atitudes; Númena: Porto Salvo, Portugal, 2009. [Google Scholar]
  57. Salgueiro, A. The Portuguese National Programme on Suppression Fire: GAUF Team Actions. In Best Practices of Fire Use—Prescribed Burning and Suppression Fire Programmes in Selected Case-Study Regions in Europe; Montiel, C., Kraus, D., Eds.; European Forest Institute: Joensuu, Finland, 2010; pp. 123–136. [Google Scholar]
  58. Moreira, F.; Viedma, O.; Arianoutsou, M.; Curt, T.; Koutsias, N.; Rigolot, E.; Barbati, A.; Corona, P.; Vaz, P.; Xanthopoulos, G.; et al. Landscape-Wildfire Interactions in Southern Europe: Implications for Landscape Management. J. Environ. Manag. 2011, 92, 2389–2402. [Google Scholar] [CrossRef] [Green Version]
  59. Nunes, M.C.S.; Vasconcelos, M.J.; Pereira, J.M.C.; Dasgupta, N.; Alldredge, R.J.; Rego, F.C. Land Cover Type and Fire in Portugal: Do Fires Burn Land Cover Selectively? Landsc. Ecol. 2005, 20, 661–673. [Google Scholar] [CrossRef]
  60. Barros, A.M.G.; Pereira, J.M.C. Wildfire Selectivity for Land Cover Type: Does Size Matter? PLoS ONE 2014, 9, e84760. [Google Scholar] [CrossRef]
  61. Moreira, F.; Ascoli, D.; Safford, H.; Adams, M.A.; Moreno, J.M.; Pereira, J.M.C.; Catry, F.X.; Armesto, J.; Bond, W.; González, M.E.; et al. Wildfire Management in Mediterranean-Type Regions: Paradigm Change Needed. Environ. Res. Lett. 2020, 15, 011001. [Google Scholar] [CrossRef]
  62. Keeley, J.E.; Pausas, J.G.; Rundel, P.W.; Bond, W.J.; Bradstock, R.A. Fire as an Evolutionary Pressure Shaping Plant Traits. Trends Plant Sci. 2011, 16, 406–411. [Google Scholar] [CrossRef] [PubMed] [Green Version]
  63. Silva, J.S.; Vaz, P.; Moreira, F.; Catry, F.; Rego, F.C. Wildfires as a Major Driver of Landscape Dynamics in Three Fire-Prone Areas of Portugal. Landsc. Urban. Plan. 2011, 101, 349–358. [Google Scholar] [CrossRef] [Green Version]
  64. Guiomar, N.; Godinho, S.; Fernandes, P.M.; Machado, R.; Neves, N.; Fernandes, J.P. Wildfire Patterns and Landscape Changes in Mediterranean Oak Woodlands. Sci. Total Environ. 2015, 536, 338–352. [Google Scholar] [CrossRef] [PubMed] [Green Version]
  65. Duane, A.; Aquilué, N.; Canelles, Q.; Morán-Ordoñez, A.; De Cáceres, M.; Brotons, L. Adapting Prescribed Burns to Future Climate Change in Mediterranean Landscapes. Sci. Total Environ. 2019, 677, 68–83. [Google Scholar] [CrossRef]
  66. Perpiña Castillo, C.; Jacobs-Crisioni, C.; Diogo, V.; Lavalle, C. Modelling Agricultural Land Abandonment in a Fine Spatial Resolution Multi-Level Land-Use Model: An Application for the EU. Environ. Model. Softw. 2021, 136, 104946. [Google Scholar] [CrossRef]
  67. Benali, A.; Mota, B.; Carvalhais, N.; Oom, D.; Miller, L.M.; Campagnolo, M.L.; Pereira, J.M.C. Bimodal Fire Regimes Unveil a Global-Scale Anthropogenic Fingerprint. Glob. Ecol. Biogeogr. 2017, 26, 799–811. [Google Scholar] [CrossRef]
  68. Bajocco, S.; Ferrara, C.; Guglietta, D.; Ricotta, C. Easy-to-Interpret Procedure to Analyze Fire Seasonality and the Influence of Land Use in Fire Occurrence: A Case Study in Central Italy. Fire 2020, 3, 46. [Google Scholar] [CrossRef]
  69. Bajocco, S.; Pezzatti, G.B.; Mazzoleni, S.; Ricotta, C. Wildfire Seasonality and Land Use: When Do Wildfires Prefer to Burn? Environ. Monit. Assess. 2010, 164, 445–452. [Google Scholar] [CrossRef]
  70. Krebs, P.; Pezzatti, G.B.; Mazzoleni, S.; Talbot, L.M.; Conedera, M. Fire Regime: History and Definition of a Key Concept in Disturbance Ecology. Theory Biosci. 2010, 129, 53–69. [Google Scholar] [CrossRef] [Green Version]
  71. Jacobs, J. Quantitative Measurement of Food Selection A Modification of the Forage Ratio and Ivlev’s Electivity Index. Oecologia 1974, 14, 413–417. [Google Scholar] [CrossRef]
  72. Monteiro, A.; Ferreira, C.; Madureira, H. Atlas Agroclimatológico Do Entre Douro e Minho. Relatório Final. 2005. Available online: https://repositorio-aberto.up.pt/handle/10216/21260 (accessed on 15 March 2023).
  73. CIM Alto Minho; Instituto Politécnico de Viana do Castelo. PIAAC—Plano Intermunicipal de Adaptação Às Alterações Climáticas Do Alto Minho—Contextualização e Cenarização Climática; Comunidade Intermunicipal do Alto Minho: Viana do Castelo, Portugal, 2017. [Google Scholar]
  74. LEAF. EPIC WebGIS Portugal; Linking Landscape, Environment, Agriculture and Food, Instituto Superior de Agronomia, Universidade de Lisboa, Portugal. Available online: http://epic-webgis-portugal.isa.ulisboa.pt/ (accessed on 10 May 2023).
  75. FAO. World Reference Base for Soil. Resources 2014: International Soil. Classification System for Naming Soils and Creating Legends for Soil. Maps; Food and Agriculture Organization of the United Nations: Rome, Italy, 2015; ISBN 9789251083697. [Google Scholar]
  76. Sweeney, L.; Harrison, S.P.; Linden, M. Vander Assessing Anthropogenic Influence on Fire History during the Holocene in the Iberian Peninsula. Quat. Sci. Rev. 2022, 287, 107562. [Google Scholar] [CrossRef]
  77. Martínez-Cortizas, A.; Costa-Casais, M.; López-Sáez, J.A. Environmental Change in NW Iberia between 7000 and 500 Cal BC. Quat. Int. 2009, 200, 77–89. [Google Scholar] [CrossRef]
  78. Reis, J. A «Lei Da Fome»: As Origens Do Proteccionismo Cerealífero (1889–1914). Anal. Soc. 1979, 15, 745–793. [Google Scholar]
  79. Pais, J.M.; Valadas de Lima, A.M.; Baptista, J.F.; Marques de Jesus, M.F.; Gameiro, M.M. Elementos Para a História Do Fascismo Nos Campos: A «Campanha Do Trigo»: 1928-38 (Ii). Anal. Soc. 1978, 14, 321–389. [Google Scholar]
  80. Mendonça, J.C. 75 Anos de Actividade Na Arborização de Serras; Direcção-Geral dos Serviços Florestais e Aquícolas: Lisboa, Portugal, 1961. [Google Scholar]
  81. Brouwer, R. Between Policy and Politics: The Forestry Services and the Commons in Portugal. For. Conserv. Hist. 1993, 37, 160–168. [Google Scholar] [CrossRef]
  82. Brouwer, R. Planting Power—The Afforestation of the Commons and State Formation in Portugal; Wageningen University and Research: Wageningen, The Netherlands, 1995. [Google Scholar]
  83. DGT. Carta de Uso e Ocupação do Solo Para 2018; Direção-Geral do Território: Lisboa, Portugal, 2018. Available online: https://www.dgterritorio.gov.pt/Carta-de-Uso-e-Ocupacao-do-Solo-para-2018 (accessed on 15 March 2023).
  84. Díaz-Fierros, F. Forest Fires in Galicia and Portugal: An Historical Overview. Territ. Rev. Port. De. Riscos Prevenção E Segurança 2019, 26, 97–114. [Google Scholar] [CrossRef]
  85. Oliveira, E.; Fernandes, P. Uma Cartografia Aperfeiçoada Das Áreas Ardidas No Alto Minho (Noroeste de Portugal) Entre 2001 e 2020. Finisterra, 2023; 58, online first. [Google Scholar] [CrossRef]
  86. Congedo, L. Semi-Automatic Classification Plugin: A Python Tool for the Download and Processing of Remote Sensing Images in QGIS. J. Open Source Softw. 2021, 6, 3172. [Google Scholar] [CrossRef]
  87. QGIS Development Team. QGIS Geographic Information System; Open Source Geospatial Foundation Project, 2023; Available online: https://www.qgis.org/ (accessed on 15 March 2023).
  88. Key, C.H.; Benson, N.C. Landscape Assessment (LA): Sampling Analysis and Methods. In FIREMON: Fire Effects Monitoring and Inventory System; Lutes, D.C., Keane, R.E., Caratti, J.F., Key, C.H., Benson, N.C., Sutherland, S., Gangi, L.J., Eds.; USDA Forest Service: Ogden, UT, USA, 2006; pp. LA-1–LA-51. [Google Scholar]
  89. Chuvieco, E.; Congalton, R.G. Mapping and Inventory of Forest Fires from Digital Processing of Tm Data. Geocarto Int. 1988, 3, 41–53. [Google Scholar] [CrossRef]
  90. Tanaka, S.; Kimura, H.; Suga, Y. Preparation of a 1:25,000 Landsat Map for Assessment of Burnt Area on Etajima Island. Int. J. Remote Sens. 1983, 4, 17–31. [Google Scholar] [CrossRef]
  91. Fernandes, P.; Gonçalves, H.; Loureiro, C.; Fernandes, M.T.; Costa, T.; Cruz, M.G.; Botelho, H. Modelos de Combustível Florestal para Portugal. In Actas do 6º Congresso Florestal Nacional; SPCF: Lisboa, Portugal, 2009; pp. 348–354. [Google Scholar]
  92. DGF. Inventário Florestal Nacional, Portugal Continental. 3a Revisão, 1995–1998; Direção-Geral das Florestas: Lisboa, Portugal, 2001.
  93. Caetano, M.; Igreja, C.; Marcelino, F. Especificações Técnicas da Carta de Uso e Ocupação do Solo (COS) de Portugal Continental para 1995, 2007, 2010 e 2015; Direção-Geral do Território: Lisboa, Portugal, 2018; Available online: https://www.dgterritorio.gov.pt/sites/default/files/documentos-publicos/2019-12-26-11-47-32-0__ET-COS-2018_v1.pdf (accessed on 12 March 2022).
  94. DGT. Especificações Técnicas da Carta de Uso e Ocupação do Solo (COS) de Portugal Continental Para 2018; Direção-Geral do Território: Lisboa, Portugal, 2019.
  95. Büttner, J.; Feranec, J.; Jaffrain, G. Corine Land Cover Update 2000: Technical Guidelines. EEA Technical Report. no 89; European Environmental Agency: Copenhagen, Denmark, 2002.
  96. Caetano, M.; Marcelino, F. CORINE Land Cover de Portugal Continental 1990–2000–2006–2012; Direção-Geral do Território: Lisboa, Portugal, 2017. [Google Scholar]
  97. R Core Team. R: A Language and Environment for Statistical Computing. 2023. Available online: https://www.gbif.org/tool/81287/r-a-language-and-environment-for-statistical-computing (accessed on 14 April 2023).
  98. Lyubchich, V.; Gel, Y.R.; Brenning, A.; Chu, C.; Huang, X.; Islambekov, U.; Niamkova, P.; Ofori-Boateng, D.; Schaeffer, E.D.; Vishwakarma, S.; et al. Package ‘Funtimes’—Functions for Time Series Analysis. Available online: https://cran.r-project.org/web/packages/funtimes/funtimes.pdf (accessed on 30 April 2023).
  99. Noguchi, K.; Gel, Y.R.; Duguay, C.R. Bootstrap-Based Tests for Trends in Hydrological Time Series, with Application to Ice Phenology Data. J. Hydrol. 2011, 410, 150–161. [Google Scholar] [CrossRef]
  100. Lyubchich, V.; Gel, Y.R.; El-Shaarawi, A. On Detecting Non-Monotonic Trends in Environmental Time Series: A Fusion of Local Regression and Bootstrap. Environmetrics 2013, 24, 209–226. [Google Scholar] [CrossRef]
  101. Kreiss, J.P.; Lahiri, S.N. Bootstrap Methods for Time Series. In Handbook of Statistics; Rao, T.S., Rao, S.S., Rao, C.R., Eds.; Elsevier: New York, NY, USA, 2012; Volume 30, pp. 3–26. [Google Scholar]
  102. Bühlmann, P. Sieve Bootstrap for Time Series. Bernoulli 1997, 3, 123–148. [Google Scholar] [CrossRef]
  103. Hall, P.; van Keilegom, I. Using Difference-Based Methods for Inference in Nonparametric Regression with Time Series Errors. J. R. Stat. Soc. Ser. B 2003, 65, 443–456. [Google Scholar] [CrossRef]
  104. Hintze, J.L.; Nelson, R.D. Violin Plots: A Box Plot-Density Trace Synergism. Am. Stat. 1998, 52, 181–184. [Google Scholar] [CrossRef]
  105. Wickham, H. Ggplot2—Elegant Graphics for Data Analysis; Springer: New York, NY, USA, 2009. [Google Scholar]
  106. Mann, H.B.; Whitney, D.R. On a Test of Whether One of Two Random Variables Is Stochastically Larger than the Other. Ann. Math. Stat. 1947, 18, 50–60. [Google Scholar] [CrossRef]
  107. Allen, M.; Poggiali, D.; Whitaker, K.; Marshall, T.R.; Kievit, R.A. Raincloud Plots: A Multi-Platform Tool for Robust Data Visualization. Wellcome Open Res. 2019, 4, 63. [Google Scholar] [CrossRef] [Green Version]
  108. Wickham, H.; Averick, M.; Bryan, J.; Chang, W.; McGowan, L.; François, R.; Grolemund, G.; Hayes, A.; Henry, L.; Hester, J.; et al. Welcome to the Tidyverse. J. Open Source Softw. 2019, 4, 1686. [Google Scholar] [CrossRef] [Green Version]
  109. Dancho, M.; Vaughan, D. Package “tidyquant”—Tidy Quantitative Financial Analysis. Available online: https://github.com/business-science/tidyquant/issues (accessed on 14 April 2023).
  110. Kay, M.; Wiernik, B.M. Package ‘ggdist’—Visualizations of Distributions and Uncertainty. Available online: https://github.com/mjskay/ggdist/ (accessed on 30 April 2023).
  111. Arnold, J.B.; Daroczi, G.; Werth, B.; Weitzner, B.; Kunst, J.; Auguie, B.; Rudis, B.; Talbot, J. Package “ggthemes”—Extra Themes, Scales and Geoms for “Ggplot2”. Available online: http://github.com/jrnold/ggthemes (accessed on 30 April 2023).
  112. Weibull, W. A Statistical Distribution Function of Wide Applicability. J. Appl. Mech. 1951, 18, 293–297. [Google Scholar] [CrossRef]
  113. Fernandes, P.M.; Loureiro, C.; Magalhães, M.; Ferreira, P.; Fernandes, M. Fuel Age, Weather and Burn Probability in Portugal. Int. J. Wildland Fire 2012, 21, 380–384. [Google Scholar] [CrossRef] [Green Version]
  114. Oliveira, S.L.J.; Pereira, J.M.C.; Carreiras, J.M.B. Fire Frequency Analysis in Portugal (1975–2005), Using Landsat-Based Burnt Area Maps. Int. J. Wildland Fire 2012, 21, 48–60. [Google Scholar] [CrossRef]
  115. Delignette-Muller, M.L.; Dutang, C. Fitdistrplus: An R Package for Fitting Distributions. J. Stat. Softw. 2015, 64, 1–34. [Google Scholar] [CrossRef] [Green Version]
  116. Cuba, N. Research Note: Sankey Diagrams for Visualizing Land Cover Dynamics. Landsc. Urban. Plan. 2015, 139, 163–167. [Google Scholar] [CrossRef]
  117. Hijmans, R.J.; van Etten, J.; Sumner, M.; Cheng, J.; Baston, D.; Bevan, A.; Bivand, R.; Busetto, L.; Canty, M.; Fasoli, B.; et al. Package “raster”—Geographic Data Analysis and Modeling. Available online: https://github.com/rspatial/raster/issues/ (accessed on 12 April 2023).
  118. Allaire, J.J.; Ellis, P.; Gandrud, C.; Kuo, K.; Lewis, B.W.; Owen, J.; Russell, K.; Rogers, J.; Sese, C.; Yetman, C.J.; et al. Package “networkD3”—D3 JavaScript Network Graphs from R. Available online: https://github.com/christophergandrud/networkD3/issues (accessed on 20 April 2023).
  119. Jockers, M.L.; Thalken, R. Text Analysis with R For Students of Literature; Springer: Cham, Switzerland, 2020. [Google Scholar]
  120. Mailund, T. Manipulating Data Frames: Dplyr. In R Data Science Quick Reference; Apress: Berkeley, CA, USA, 2019; pp. 109–160. [Google Scholar]
  121. Hosmer, D.W.; Lemeshow, S. Applied Logistic Regression, 2nd ed.; John Wiley & Sons: New York, NY, USA, 2000. [Google Scholar]
  122. Mangiafico, S. Package “rcompanion”—Functions to Support Extension Education Program Evaluation. Available online: http://rcompanion.org (accessed on 6 May 2023).
  123. Cox, D.R.; Snell, E.J. A General Definition of Residuals. J. R. Stat. Society Ser. B 1968, 30, 248–275. [Google Scholar] [CrossRef]
  124. Smith, T.J.; Mckenna, C.M. A Comparison of Logistic Regression Pseudo R2 Indices. Mult. Linear Regres. Viewp. 2013, 39, 17–26. [Google Scholar]
  125. Mcfadden, D. Regression-Based Specification Tests for the Multinomial Logit Model. J. Econ. 1987, 34, 63–82. [Google Scholar] [CrossRef]
  126. Pereira, J.M.C.; Carreiras, J.; Silva, J.M.N.; Vasconcelos, M.J.P. Alguns Conceitos Básicos Sobre Os Fogos Rurais Em Portugal. In Incêndios Florestais em Portugal—Caracterização, Impactes e Prevenção; ISAPress: Lisboa, Portugal, 2006; pp. 133–158. [Google Scholar]
  127. Trigo, R.M.; Sousa, P.M.; Pereira, M.G.; Rasilla, D.; Gouveia, C.M. Modelling Wildfire Activity in Iberia with Different Atmospheric Circulation Weather Types. Int. J. Climatol. 2016, 36, 2761–2778. [Google Scholar] [CrossRef]
  128. Fernandes, P.M.; Guiomar, N.; Rossa, C.G. Analysing Eucalypt Expansion in Portugal as a Fire-Regime Modifier. Sci. Total Environ. 2019, 666, 79–88. [Google Scholar] [CrossRef]
  129. Pausas, J.G.; Fernández-Muñoz, S. Fire Regime Changes in the Western Mediterranean Basin: From Fuel-Limited to Drought-Driven Fire Regime. Clim. Change 2012, 110, 215–226. [Google Scholar] [CrossRef] [Green Version]
  130. Barreiro, P.; Rodrigues, P. Cost Management: The Use of Fire for Pasture Renewal in Alto Minho. Rev. Floresta 2023, 53, 46–55. [Google Scholar] [CrossRef]
  131. Oliveira, E.; Fernandes, P.M. Pastoral Burning and Its Contribution to the Fire Regime of Alto Minho, Portugal. Fire 2023, 6, 210. [Google Scholar] [CrossRef]
  132. Iglesias, M.C.; Hermoso, V.; Campos, J.C.; Carvalho-Santos, C.; Fernandes, P.M.; Freitas, T.R.; Honrado, J.P.; Santos, J.A.; Sil, Â.; Regos, A.; et al. Climate- and Fire-Smart Landscape Scenarios Call for Redesigning Protection Regimes to Achieve Multiple Management Goals. J. Environ. Manag. 2022, 322, 116045. [Google Scholar] [CrossRef] [PubMed]
  133. Mori, A.S.; Lertzman, K.P. Historic Variability in Fire-Generated Landscape Heterogeneity of Subalpine Forests in the Canadian Rockies. J. Veg. Sci. 2011, 22, 45–58. [Google Scholar] [CrossRef]
  134. Airey-Lauvaux, C.; Pierce, A.D.; Skinner, C.N.; Taylor, A.H. Changes in Fire Behavior Caused by Fire Exclusion and Fuel Build-up Vary with Topography in California Montane Forests, USA. J. Environ. Manag. 2022, 304, 114255. [Google Scholar] [CrossRef]
  135. Christianson, A.C.; Sutherland, C.R.; Moola, F.; Gonzalez Bautista, N.; Young, D.; MacDonald, H. Centering Indigenous Voices: The Role of Fire in the Boreal Forest of North America. Curr. For. Rep. 2022, 8, 257–276. [Google Scholar] [CrossRef]
  136. Moreira, F.; Leal, M.; Bergonse, R.; Canadas, M.J.; Novais, A.; Oliveira, S.; Ribeiro, P.F.; Zêzere, J.L.; Santos, J.L. Recent Trends in Fire Regimes and Associated Territorial Features in a Fire-Prone Mediterranean Region. Fire 2023, 6, 60. [Google Scholar] [CrossRef]
  137. Fernández-Guisuraga, J.M.; Martins, S.; Fernandes, P.M. Characterization of Biophysical Contexts Leading to Severe Wildfires in Portugal and Their Environmental Controls. Sci. Total Environ. 2023, 875, 162575. [Google Scholar] [CrossRef]
  138. Strauss, D.; Bednar, L.; Mees, R. Do One Percent of Forest Fires Cause Ninety-Nine Percent of the Damage? For. Sci. 1989, 35, 319–328. [Google Scholar]
  139. Malamud, B.D.; Millington, J.D.A.; Perry, G.L.W. Characterizing Wildfire Regimes in the United States. Proc. Natl. Acad. Sci. USA 2005, 102, 4694–4699. [Google Scholar] [CrossRef]
  140. Hantson, S.; Pueyo, S.; Chuvieco, E. Global Fire Size Distribution: From Power Law to Log-Normal. Int. J. Wildland Fire 2016, 24, 589–596. [Google Scholar] [CrossRef]
  141. Fernandes, P.M. Variation in the Canadian Fire Weather Index Thresholds for Increasingly Larger Fires in Portugal. Forests 2019, 10, 838. [Google Scholar] [CrossRef] [Green Version]
  142. Oliveira, S.; Moreira, F.; Boca, R.; San-Miguel-Ayanz, J.; Pereira, J.M.C. Assessment of Fire Selectivity in Relation to Land Cover and Topography: A Comparison between Southern European Countries. Int. J. Wildland Fire 2014, 23, 620–630. [Google Scholar] [CrossRef]
  143. Bajocco, S.; Ricotta, C. Evidence of Selective Burning in Sardinia (Italy): Which Land-Cover Classes Do Wildfires Prefer? Landsc. Ecol. 2008, 23, 241–248. [Google Scholar] [CrossRef]
  144. Mermoz, M.; Kitzberger, T.; Veblen, T.T. Landscape Influences on Occurrence and Spread of Wildfires in Patagonian Forests and Shrublands. Ecology 2005, 86, 2705–2715. [Google Scholar] [CrossRef] [Green Version]
  145. Silva, J.S.; Moreira, F.; Vaz, P.; Catry, F.; Godinho-Ferreira, P. Assessing the Relative Fire Proneness of Different Forest Types in Portugal. Plant Biosyst. 2009, 143, 597–608. [Google Scholar] [CrossRef]
  146. Pereira, M.G.; Aranha, J.; Amraoui, M. Land Cover Fire Proneness in Europe. Systems 2014, 23, 598–610. [Google Scholar] [CrossRef]
  147. Moreira, F.; Vaz, P.; Catry, F.X.; Silva, J.S. Regional Variations in Wildfire Susceptibility of Land-Cover Types in Portugal: Implications for Landscape Management to Minimize Fire Hazard. Int. J. Wildland Fire 2009, 18, 563–574. [Google Scholar] [CrossRef]
  148. Pezzatti, G.B.; Bajocco, S.; Torriani, D.; Conedera, M. Selective Burning of Forest Vegetation in Canton Ticino (Southern Switzerland). Plant Biosyst. 2009, 143, 609–620. [Google Scholar] [CrossRef]
  149. Cumming, S.G. Forest Type and Wildfire in the Alberta Boreal Mixedwood: What Do Fires Burn? Ecol. Appl. 2001, 11, 97–110. [Google Scholar] [CrossRef]
  150. Bergonse, R.; Oliveira, S.; Zêzere, J.L.; Moreira, F.; Ribeiro, P.F.; Leal, M.; Lima e Santos, J.M. Biophysical Controls over Fire Regime Properties in Central Portugal. Sci. Total Environ. 2022, 810, 152314. [Google Scholar] [CrossRef] [PubMed]
  151. Coughlan, M.R. Farmers, Flames, and Forests: Historical Ecology of Pastoral Fire Use and Landscape Change in the French Western Pyrenees, 1830-2011. Ecol Manag. 2014, 312, 55–66. [Google Scholar] [CrossRef]
  152. Coughlan, M.R. Traditional Fire-Use, Landscape Transition, and the Legacies of Social Theory Past. Ambio 2015, 44, 705–717. [Google Scholar] [CrossRef] [PubMed] [Green Version]
  153. Múgica, L.; Canals, R.M.; San Emeterio, L.; Peralta, J. Decoupling of Traditional Burnings and Grazing Regimes Alters Plant Diversity and Dominant Species Competition in High-Mountain Grasslands. Sci. Total Environ. 2021, 790, 147917. [Google Scholar] [CrossRef] [PubMed]
  154. Fernandes, P.M.; Rigolot, E. The Fire Ecology and Management of Maritime Pine (Pinus pinaster Ait.). Ecol. Manag. 2007, 241, 1–13. [Google Scholar] [CrossRef]
  155. Keeley, J.E.; Ne’eman, G.; Fotheringham, C.J. Immaturity Risk in a Fire-Dependent Pine. J. Mediterr. Ecol. 1999, 1, 41–48. [Google Scholar]
  156. Maia, P.; Pausas, J.G.; Arcenegui, V.; Guerrero, C.; Pérez-Bejarano, A.; Mataix-Solera, J.; Varela, M.E.T.; Fernandes, I.; Pedrosa, E.T.; Keizer, J.J. Wildfire Effects on the Soil Seed Bank of a Maritime Pine Stand—The Importance of Fire Severity. Geoderma 2012, 191, 80–88. [Google Scholar] [CrossRef]
  157. Maia, P.; Pausas, J.G.; Vasques, A.; Keizer, J.J. Fire Severity as a Key Factor in Post-Fire Regeneration of Pinus Pinaster (Ait.) in Central Portugal. Ann. Sci. 2012, 69, 489–498. [Google Scholar] [CrossRef] [Green Version]
  158. Cruz, O.; García-Duro, J.; Casal, M.; Reyes, O. Role of Serotiny on Pinus Pinaster Aiton Germination and Its Relation to Mother Plant Age and Fire Severity. iForest 2019, 12, 491–497. [Google Scholar] [CrossRef] [Green Version]
  159. Fernandes, P.M.; Guiomar, N. Os Incêndios Como Causa de Desarborização Em Portugal. AGROTEC 2017, 3, 28–32. [Google Scholar]
  160. Turner, M.G.; Baker, W.L.; Peterson, C.J.; Peet, R.K. Factors Influencing Succession: Lessons from Large, Infrequent Natural Disturbances. Ecosystems 1998, 1, 511–523. [Google Scholar] [CrossRef]
  161. Hernández-Serrano, A.; Verdú, M.; González-Martínez, S.C.; Pausas, J.G. Fire Structures Pine Serotiny at Different Scales. Am. J. Bot. 2013, 100, 2349–2356. [Google Scholar] [CrossRef]
  162. Pausas, J.G. Evolutionary Fire Ecology: Lessons Learned from Pines. Trends Plant Sci. 2015, 20, 318–324. [Google Scholar] [CrossRef]
  163. Pausas, J.G. Bark Thickness and Fire Regime. Funct. Ecol. 2015, 29, 315–327. [Google Scholar] [CrossRef]
  164. Guiote, C.; Pausas, J.G. Fire Favors Sexual Precocity in a Mediterranean Pine. Oikos 2023, 2023. [Google Scholar] [CrossRef]
  165. Mota, M.M.; Vieira, P.C. Pine Wilt Disease in Portugal. In Pine Wilt Disease; Springer: Tokyo, Japan, 2008; pp. 33–38. [Google Scholar]
  166. Águas, A.; Ferreira, A.; Maia, P.; Fernandes, P.M.; Roxo, L.; Keizer, J.; Silva, J.S.; Rego, F.C.; Moreira, F. Natural Establishment of Eucalyptus Globulus Labill. in Burnt Stands in Portugal. Ecol. Manag. 2014, 323, 47–56. [Google Scholar] [CrossRef] [Green Version]
  167. Catry, F.X.; Moreira, F.; Tujeira, R.; Silva, J.S. Post-Fire Survival and Regeneration of Eucalyptus Globulus in Forest Plantations in Portugal. Ecol. Manag. 2013, 310, 194–203. [Google Scholar] [CrossRef] [Green Version]
  168. Moreira, F.; Ferreira, A.; Abrantes, N.; Catry, F.; Fernandes, P.; Roxo, L.; Keizer, J.J.; Silva, J. Occurrence of Native and Exotic Invasive Trees in Burned Pine and Eucalypt Plantations: Implications for Post-Fire Forest Conversion. Ecol. Eng. 2013, 58, 296–302. [Google Scholar] [CrossRef]
  169. Sanjuán, Y.; Arnáez, J.; Beguería, S.; Lana-Renault, N.; Lasanta, T.; Gómez-Villar, A.; Álvarez-Martínez, J.; Coba-Pérez, P.; García-Ruiz, J.M. Woody Plant Encroachment Following Grazing Abandonment in the Subalpine Belt: A Case Study in Northern Spain. Reg. Environ. Chang. 2018, 18, 1103–1115. [Google Scholar] [CrossRef]
  170. Komac, B.; Kefi, S.; Nuche, P.; Escós, J.; Alados, C.L. Modeling Shrub Encroachment in Subalpine Grasslands under Different Environmental and Management Scenarios. J. Environ. Manag. 2013, 121, 160–169. [Google Scholar] [CrossRef] [Green Version]
  171. Palombo, C.; Chirici, G.; Marchetti, M.; Tognetti, R. Is Land Abandonment Affecting Forest Dynamics at High Elevation in Mediterranean Mountains More than Climate Change? Plant Biosyst. 2013, 147, 1–11. [Google Scholar] [CrossRef]
  172. Romero-Calcerrada, R.; Perry, G.L.W. The Role of Land Abandonment in Landscape Dynamics in the SPA ‘Encinares Del Rio Alberche y Cofio, Central Spain, 1984–1999. Land. Urban Plan 2004, 66, 217–232. [Google Scholar] [CrossRef]
Figure 1. Geographical context of the study area, Alto Minho: (a) Location of the study region in western Europe; (b) Administrative regions of mainland Portugal (NUTS II); (c) Municipalities in the study region. Source: Official Administrative Map of Portugal, Direção-Geral do Território—DGT 2020.
Fire 06 00267 g001
Figure 2. Annual distribution of the fire patches (a) and the burned area (b). The yellow dots represent the percentage of the fire patches and the burned area by non-seasonal fires. NP-BA: total number of fire patches; FS-NP: number of patches of seasonal fires; NFS-NP: number of patches of non-seasonal fires; T-BA: burned area by all fires; FS-BA: burned area by seasonal fires; NFS-BA: burned area by non-seasonal fires.
Fire 06 00267 g002
Figure 3. Spatial distribution of fire recurrence between 2001 and 2018 considering all fires (a), and the areas burned during the fire season (b) and outside the fire season (c).
Fire 06 00267 g003
Figure 4. Violin plots with the distribution of fire size by individual fires between 2001 and 2018 during the fire season (FS) and outside the fire season (NFS) (burned area by individual fires is represented in log scale on the y-axis).
Fire 06 00267 g004
Figure 5. Raincloud plots showing the distribution of fire patches and burned area by fire size classes considering the total number of events (a), the fire-season fires (b) and the non-seasonal fires (c).
Fire 06 00267 g005
Figure 6. Spatial distribution of fuel types in 2000 (a) and in 2018 (b), and changes between 2000 and 2018 (c).
Fire 06 00267 g006
Figure 7. Sankey diagram showing the main flows between 2000 and 2018 in the fuel types in the study region (see Table 1 for a brief description of the fuel types).
Fire 06 00267 g007
Figure 8. Sankey diagram displaying the main flows between 2000 and 2018 in the fuel types affected by fires during the fire season (see Table 1 for a brief description of the fuel types).
Fire 06 00267 g008
Figure 9. Sankey diagram displaying the main flows between 2000 and 2018 in the fuel types affected by non-seasonal fires (see Table 1 for a brief description of the fuel types).
Fire 06 00267 g009
Figure 10. Contribution of the seasonal and non-seasonal fires to changes in fuel types in the burned areas between 2000 and 2018 in Alto Minho.
Fire 06 00267 g010
Table 1. Fuel types identified in the study region according to the classification of Fernandes et al. [91], respective distribution in 2000 and 2018 (%), and percentage change (%C).
Fuel TypesShort Description of the Fuel Types% Area in 2000% Area in 2018%C
F-RACShort-needle conifers (Pseudotsuga, Cedrus, Cupressus, Pinus sylvestris, P. nigra) (litter)0.750.62−17.84
F-PINMedium-long needle pines (P. pinaster, P. pinea, P. halepensis, P. radiata) (litter)0.010.0112.34
F-FOLBroadleaved forest stands (litter)6.648.0521.21
M-PINMedium-long needle pines (litter + understory vegetation)19.3615.33−20.85
M-EUCEucalyptus stands (litter + understory vegetation)7.7112.0155.60
M-CADBroadleaved forest stands, including marcescent and deciduous oaks and Castanea sativa (litter + understory vegetation)6.146.383.87
M-ESCSclerophyllous hardwood stands (cork oak, holm oak, strawberry tree) (litter + understory vegetation)≤0.01≤0.01−50.05
V-MAaTall shrublands (>1 m) (heather, gorse)28.3626.38−7.05
V-MMbShort shrublands (<1 m) (cistus, broom)2.292.08−9.49
V-HbShort herbs, including agricultural areas17.6316.70−5.35
V-HaTall herbs0.36≤ 0.01−98.61
V-MHMosaics of young shrublands and herbs2.382.38−0.10
Areas without vegetation covered 8.38% and 10.07% of the area of the study region in 2000 and 2018, respectively.
Table 2. Statistics obtained through the Mann–Kendall test and Student’s t-test enhanced by sieve-bootstrap procedures for monotonic and linear trends, respectively.
Sieve-Bootstrap Mann–Kendall TestSieve-Bootstrap Student’s t-Test
MK taup-ValueH0: No TrendAR pt-Valuep-ValueH0: No TrendAR p
T-NP0.110.51Rejected01.050.32Rejected0
T-BA0.031.00Rejected00.060.96Rejected0
FS-NP−0.070.75Rejected0−0.490.63Rejected0
FS-BA−0.140.44Rejected0−0.220.83Rejected0
NFS-NP0.230.20Rejected01.410.18Rejected0
NFS-BA0.120.51Rejected01.040.33Rejected0
T-NP: total number of fire patches; FS-NP: number of patches of seasonal fires; NFS-NP: number of patches of non-seasonal fires; T-BA: burned area by all fires; FS-BA: burned area by seasonal fires; NFS-BA: burned area by non-seasonal fires.
Table 3. Fire selectivity for fuel types through the Jacobs index.
Jacobs Index
Fuel TypesTBAFStBANFStBAFStBA∩NFStBAFSoNFSo
F-FOL−0.25−0.22−0.40−0.44−0.12−0.35
F-PIN−0.43−0.33−1.00−1.00−0.11−1.00
F-RAC0.080.11−0.06−0.110.20−0.01
M-CAD−0.10−0.15−0.20−0.46−0.010.05
M-ESC0.040.170.220.46−0.24−1.00
M-EUC0.220.32−0.070.090.41−0.37
M-PIN0.020.05−0.18−0.230.18−0.12
V-MAa0.480.450.650.710.250.56
V-MMb−0.74−0.75−0.81−0.89−0.68−0.72
V-MH0.19−0.040.29−0.290.070.57
V-Ha−0.61−0.65−0.62−0.75−0.59−0.48
V-Hb−0.89−0.92−0.89−0.98−0.88−0.78
NF−0.92−0.92−0.95−0.96−0.89−0.94
TBA: Total burned area; FStBA: fire-season burned area; NFStBA: unseasonal burned area; FSo: fire-season burned area only (excluding the overlapped area between FStBA and NFStBA); NFSo: unseasonal burned area only (excluding the overlapped area between FStBA and NFStBA).
Table 4. Results from the logistic regression to assess the factors explaining transitions between fuel types between 2000 and 2018.
EstimateStd. Errorz-Valuep-Value
Intercept−2.250.06−36.86<0.001
FIRErec0.480.0410.64<0.001
FIREfs0.560.087.18<0.001
FIREnfs0.060.070.920.35
FIREfslf0.000.00−5.29<0.001
FC2000F-RAC1.720.1214.59<0.001
FC2000M-CAD0.190.082.310.02
FC2000M-EUC−0.530.08−6.39<0.001
FC2000M-PIN2.700.0641.66<0.001
FC2000PS0.000.005.57<0.001
Efron’s pseudo-R20.42
McFadden pseudo-R20.34
Cox and Snell pseudo-R20.37
Nagelkerke pseudo-R20.50
Null deviance20,084 (14,487 d.f.)
Residual deviance13,314 (14,478 d.f.)
AIC13,334
FIRErec: fire recurrence; FIREfs: fire-season fires; FIREnfs: unseasonal fires; FIREfslf: fire size of the largest fire that affected each burned patch; FC2000F-RAC: area covered by fuel type F-RAC in 2000; FC2000M-CAD: area covered by fuel type M-CAD in 2000; FC2000M-EUC: area covered by fuel type M-EUC in 2000; FC2000M-PIN: area covered by fuel type M-PIN in 2000; FC2000PS: patch size of pre-fire fuel types.
Disclaimer/Publisher’s Note: The statements, opinions and data contained in all publications are solely those of the individual author(s) and contributor(s) and not of MDPI and/or the editor(s). MDPI and/or the editor(s) disclaim responsibility for any injury to people or property resulting from any ideas, methods, instructions or products referred to in the content.

