1. Introduction
Vacuum arc deposition (VAD) as one of the most established physical vapor deposition (PVD) techniques is often applied to produce hard, wear-resistant, or decorative coatings and thin films. The main applications are, for example, wear protection of tools to improve their resilience and reliability or the design of the optical appearance of different kinds of products. The VAD process commonly relies on a high-current arc discharge in a vacuum chamber in which the base material from a large-area cathode—the so-called target—is vaporized and ionized on its surface by the action of the cathodic arc spot. The produced plasma is then guided to the substrate, condenses, and forms the intended metallic films on their surfaces. In some cases, reactive background gases are also added to deposit ceramic or composite films, or inert background gases to improve the arc stability. Short overviews over the early history and more recent developments of the VAD technology were given by Boxman [
1,
2].
The physics of the cathode spots and its mathematical description is the most interesting topic of the VAD technique from a theoretical point of view. A comprehensive overview over the relevant phenomena is given by Anders [
3]. These comprise electron emission processes, the sophisticated arc spot structure, different arc modes, energetic considerations, and cathode erosion, as well as plasma formation and composition. Despite the existing large body of knowledge, the discussion on the physical nature and parameters of cathode spots is not settled due to the complexity of the spot itself and the extreme physical conditions with regard to temperature, pressure, and non-stationarity [
4].
Nevertheless, it is quite important to understand the cathode spot behavior under the conditions of technically applicable parameter ranges. From a practical point of view, understanding and proper control of the macroscopic phenomenological cathodic arc spot motion is one of the most challenging issues in vacuum arc deposition applications because failing to adequately control it can result in heat flux concentration in particular local regions of the cathode, giving rise to local overheating, droplet formation, and non-uniform cathode erosion [
5]. The most established method to control the arc spot motion relies on the use of magnetic fields. In the case of an applied outer magnetic field, the arc spot motion is defined by three superimposed components, namely a random walk motion, the retrograde motion, and the Robson drift.
The random walk contribution of the arc spot motion is related to its non-stationary nature with the tendency to jump stochastically across the cathode surface [
6]. In fact, the random walk motion is a displacement of the spot location, i.e., it extinguishes after a particular time interval at one location and reignites at another location. Beilis [
7] reasoned this behavior by a circularly symmetric distribution of the self-magnetic pressure and by the conclusion that there is no preferred direction for ignition of a new cathode spot. The main characteristics of the random walk arc spot motion, as well as descriptive mathematical relationships, were derived by Daalder [
8] and Hantzsche et al. [
9]. They introduced a diffusion coefficient as a characteristic quantity of the random walk and showed that the characteristic distances between arc spot locations after particular time intervals follow a Rayleigh distribution. Based on this assumption, the values of the diffusion coefficient can be derived from experiments by measuring the distance between the start and finish of a large number of arcs for a constant arcing time [
8].
However, this erratic and random-walk-like movement of an arc spot on the surface of the cathode is strongly altered by magnetic fields, and as a result, the arc spot is steered and can be controlled under the influence of an applied magnetic field. However, as a feature of cold-cathode arcs, which are characterized by cathode spots of very high current density, the arc spot is not moved in the Amperian direction according to the action of the Lorentzian force, but instead into the opposite or retrograde direction. This retrograde motion in a dominantly transverse magnetic field is one of the more intriguing phenomena of the arc discharge [
10]. It has been studied over decades without reaching a unanimously accepted explanation [
4]. Drouet [
11] examined the motion of the cathodic arc attachment in a transverse magnetic field and attributed the observed retrograde sense of direction to an asymmetrical combination of the self-magnetic and the applied magnetic field. He also found that the direction of the arc spot motion changes to the Amperian direction if the gas pressure rises above a critical value which varies with the nature of the gas. Beilis [
12] proposed a physical model of retrograde motion based on a plasma flow study. He also explained the retrograde motion by an asymmetrical distribution of the magnetic pressure resulting from the superposition of the external magnetic field and the self-magnetic field of the arc, and found ignition of a new spot more probable under the larger pressure on the side opposite to the Amperian, i.e., the retrograde, direction. Beilis also noted that the retrograde spot velocity in vacuum arcs increases linearly with the magnetic field strength and saturates at the maximum velocity determined during random spot motion observed when a magnetic field is not applied. Jüttner and Kleberg [
13] found by experimental observations that the retrograde motion is mainly due to jumps over a distance of 50–300 µm which are provoked by the ejection of plasma jets in the retrograde direction, and that the spots follow these jets, or more precisely, the new spots are ignited in the direction of these jets.
In the very common case of practical vacuum arc applications where the magnetic field is inclined to some extent to the cathode surface, there is an additional component of velocity in the direction of the acute angle between the magnetic field and the cathode surface [
14]. As pointed out by Beilis [
15], this effect was first reported by Smith (1946) and Kesaev (1957) and is called the acute angle effect or Robson drift, respectively. Numerical investigations of the Robson drift were recently presented by Shi et al. [
16]. Kleberg [
17] distinguished the two cases in which the current density vector and the axial magnetic field vector are aligned either in parallel or anti-parallel. Zimmer [
18] pointed out that—as a logical consequence of retrograde motion and Robson drift—the arc spot can be guided inside so-called tunnel fields with arched magnetic field lines. However, the adjustment of optimal magnetic field configurations for changed material and processing conditions can be a tedious task, particularly if the arc spot motion cannot be observed directly. Thus, it would be beneficial to have a design tool at hand that predicts the arc motion pattern as a function of magnetic field strength and distribution and allows for an evaluation and optimization of parameter settings. The development of a corresponding model of the arc spot motion on cathodic targets was the purpose of the conducted study. This model describes the arc spot motion under the influence of a magnetic field in a semi-empirical way. Contributions from the random walk, the retrograde motion, and the Robson drift are considered based on the known facts about arc spot motion. Empirical coefficients, such as a diffusion coefficient for the random walk motion and a coefficient of the magnetic velocity, were introduced to achieve a quantitative agreement with the recorded experimental data. After this kind of calibration, the model can be used as an evaluation tool of different magnetic field configurations.
It should be noted that this model aims to describe the time-dependent coordinates of the phenomenological movement of the spot. The complex structure of the arc spot itself, the involved physics of plasma generation and distribution, its interplay with the arc spot motion, and its dependence on processing conditions—as, e.g., investigated and reported by Oh et al. [
19,
20]—are outside of the scope of this study.
2. Materials and Methods
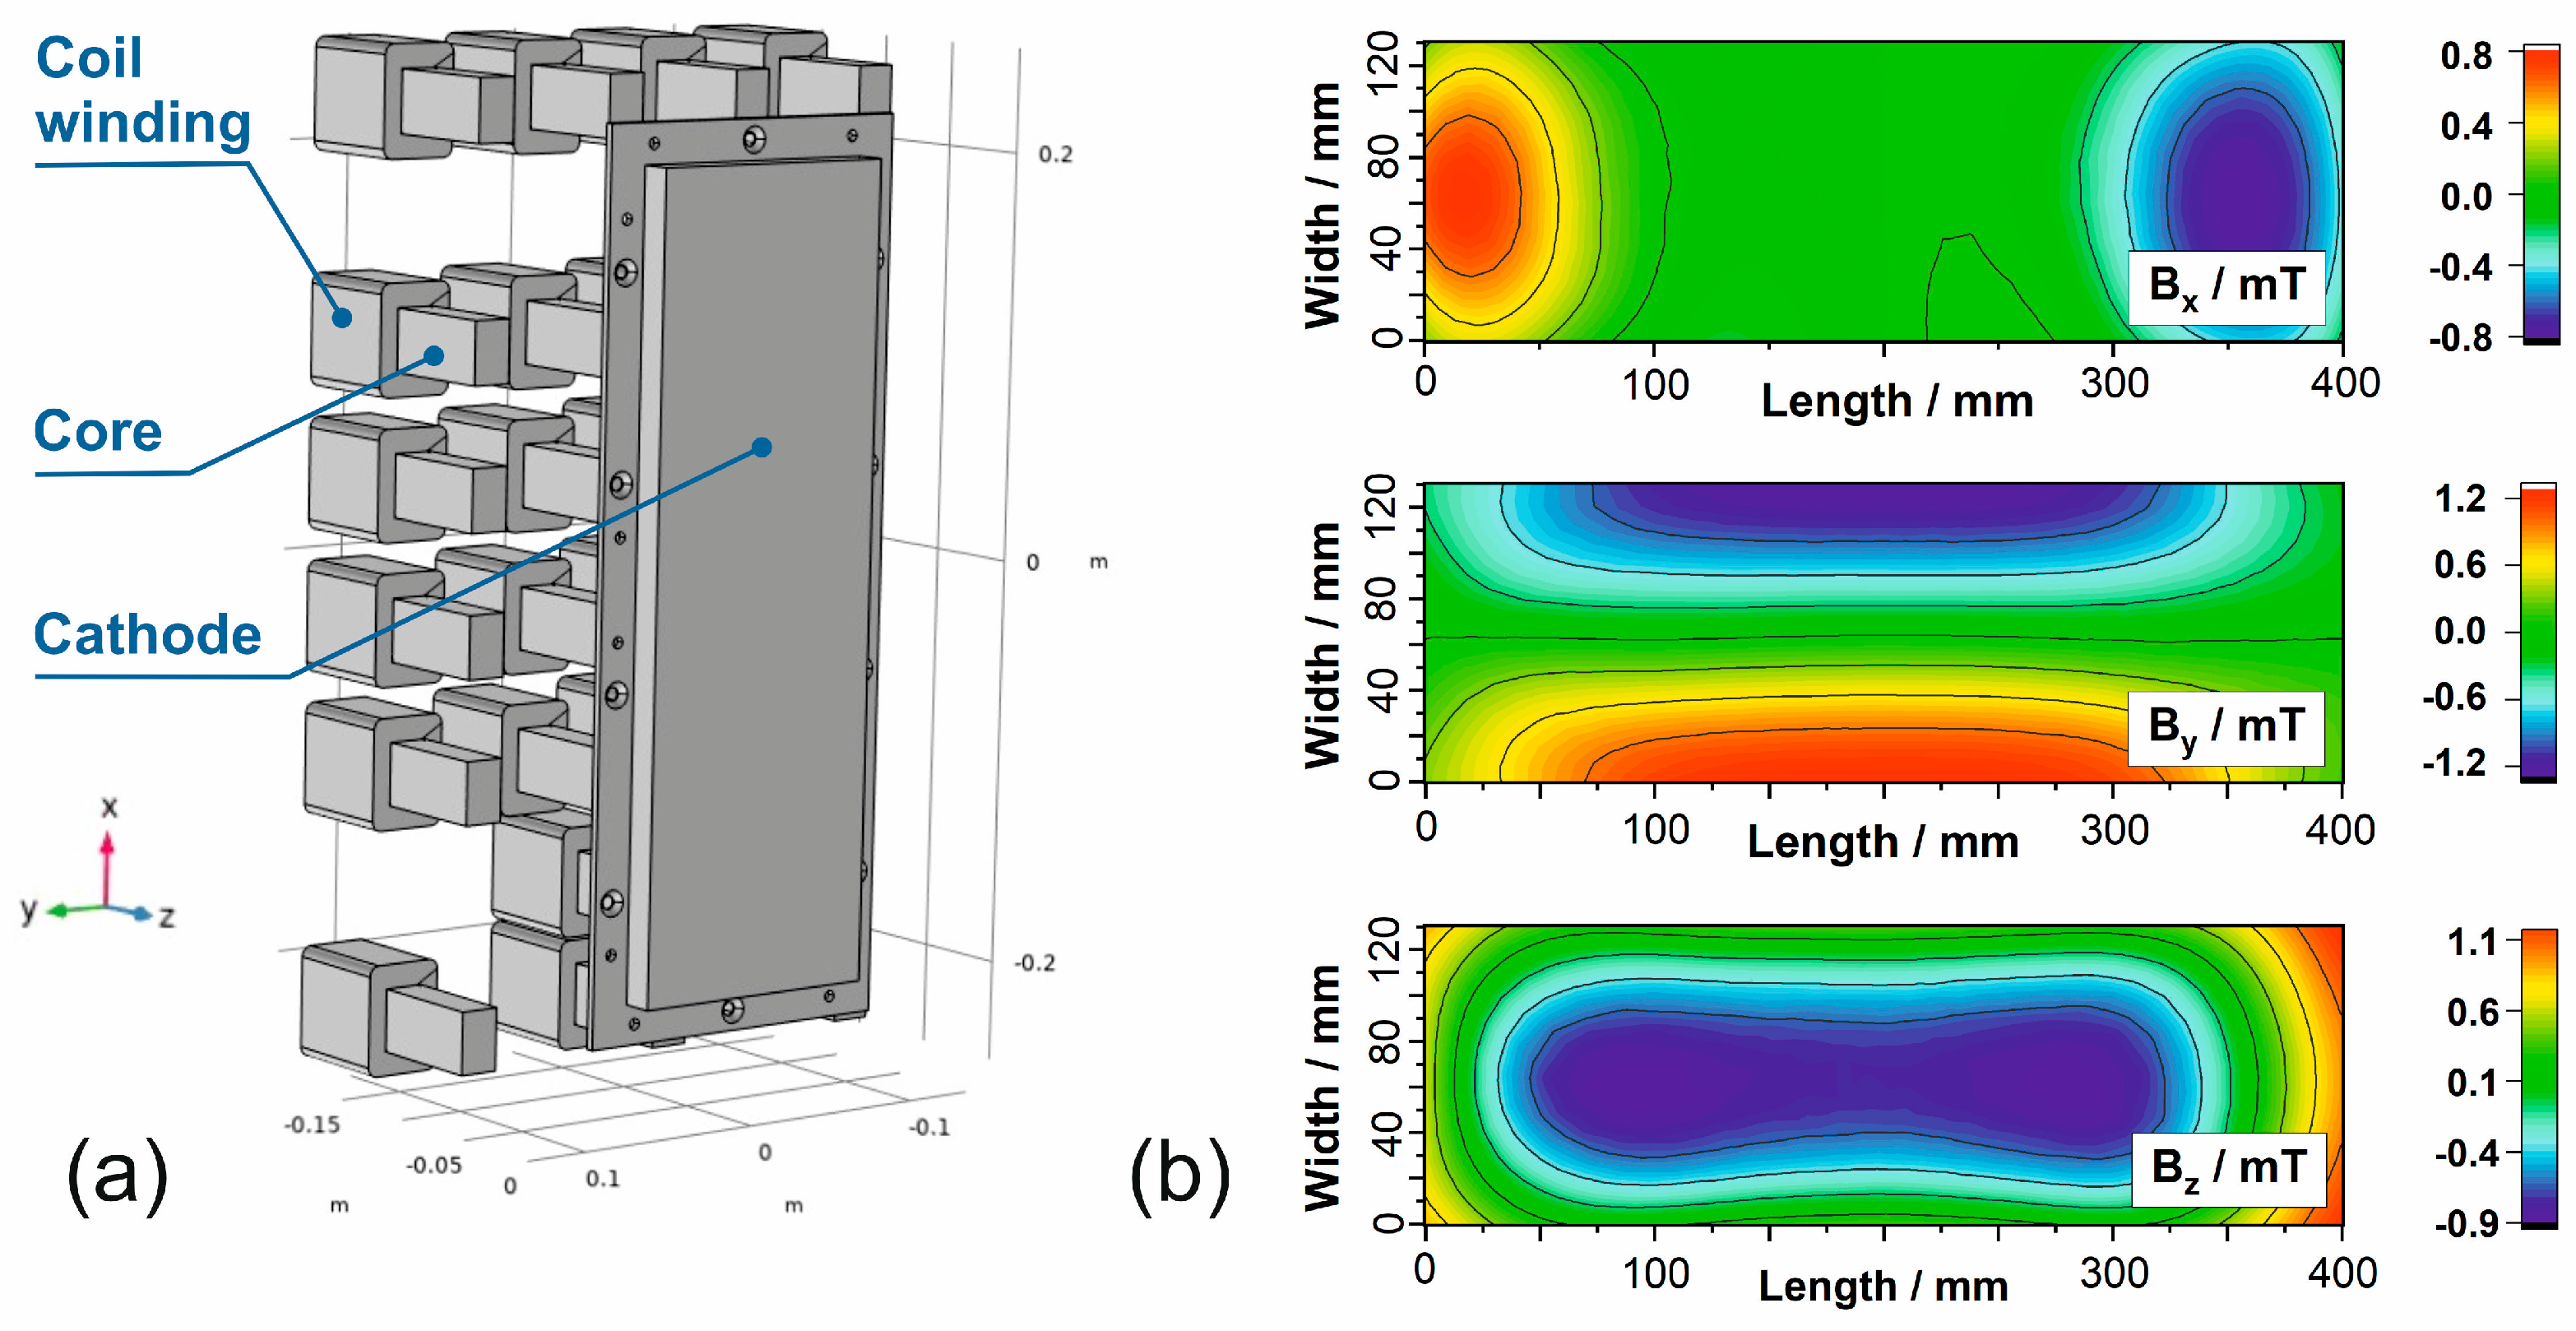
Experimental and numerical methods are applied to describe the spot motion of a vacuum arc on a chromium target. A semi-empirical approach aligns the derived governing equations of the arc spot model to the experimental results by introducing phenomenological mathematical concepts. Empirical coefficients in otherwise physically reasoned relationships are used to reach an agreement between theoretical descriptions and experimental data. Experiments were performed in the device MR313 (Metaplas Ionon GmbH) which is usually applied to tool coating by use of the physical vapor deposition (PVD) process. The vacuum chamber with a volume of
can be evacuated to pressures down to
by a two-step pumping system. By default, the device is equipped with two arc-evaporators—one with a circular cathode shape of
in diameter and the other one with a rectangular shape and an evaporation area of
—and with a thickness of 20 mm of both targets. The applied cathode material is Chromium (Cr 99.8%, Manufacturer: Plansee Composite Materials GmbH). While the stochastic random walk motion of the arc spot was studied for the circular cathode, the steered arc motion under the influence of a magnetic field was investigated for the rectangular cathode. The arc spot motion on the rectangular cathode is controlled by an array of 24 magnetic coils which is mounted on the back side of the cathode and allows for a definition of the magnetic field distribution and magnitude in the sphere of the target area [
21]. The magnetic field distribution as the state condition for the computation of the arc spot motion was computed by using a commercial FEM software package (COMSOL Multiphysics 6.1) and evaluated by field measurements using a 3D magnetic sensor (Matesy Hall Line Sensor MHLS 80, Manufacturer: Matesy GmbH, Jena (Germany)). The used sensor is able to measure the components
and
of the magnetic flux density
B in the three spatial dimensions with a measuring width of
by 32 single sensors with a measurement accuracy of
. This sensor was moved over the whole cathode surface by means of a specially designed fixture and, in such a way, the magnetic field distribution could be captured in the region of interest. The comparison between the computed and measured values gives local maximum deviations of about 10%.
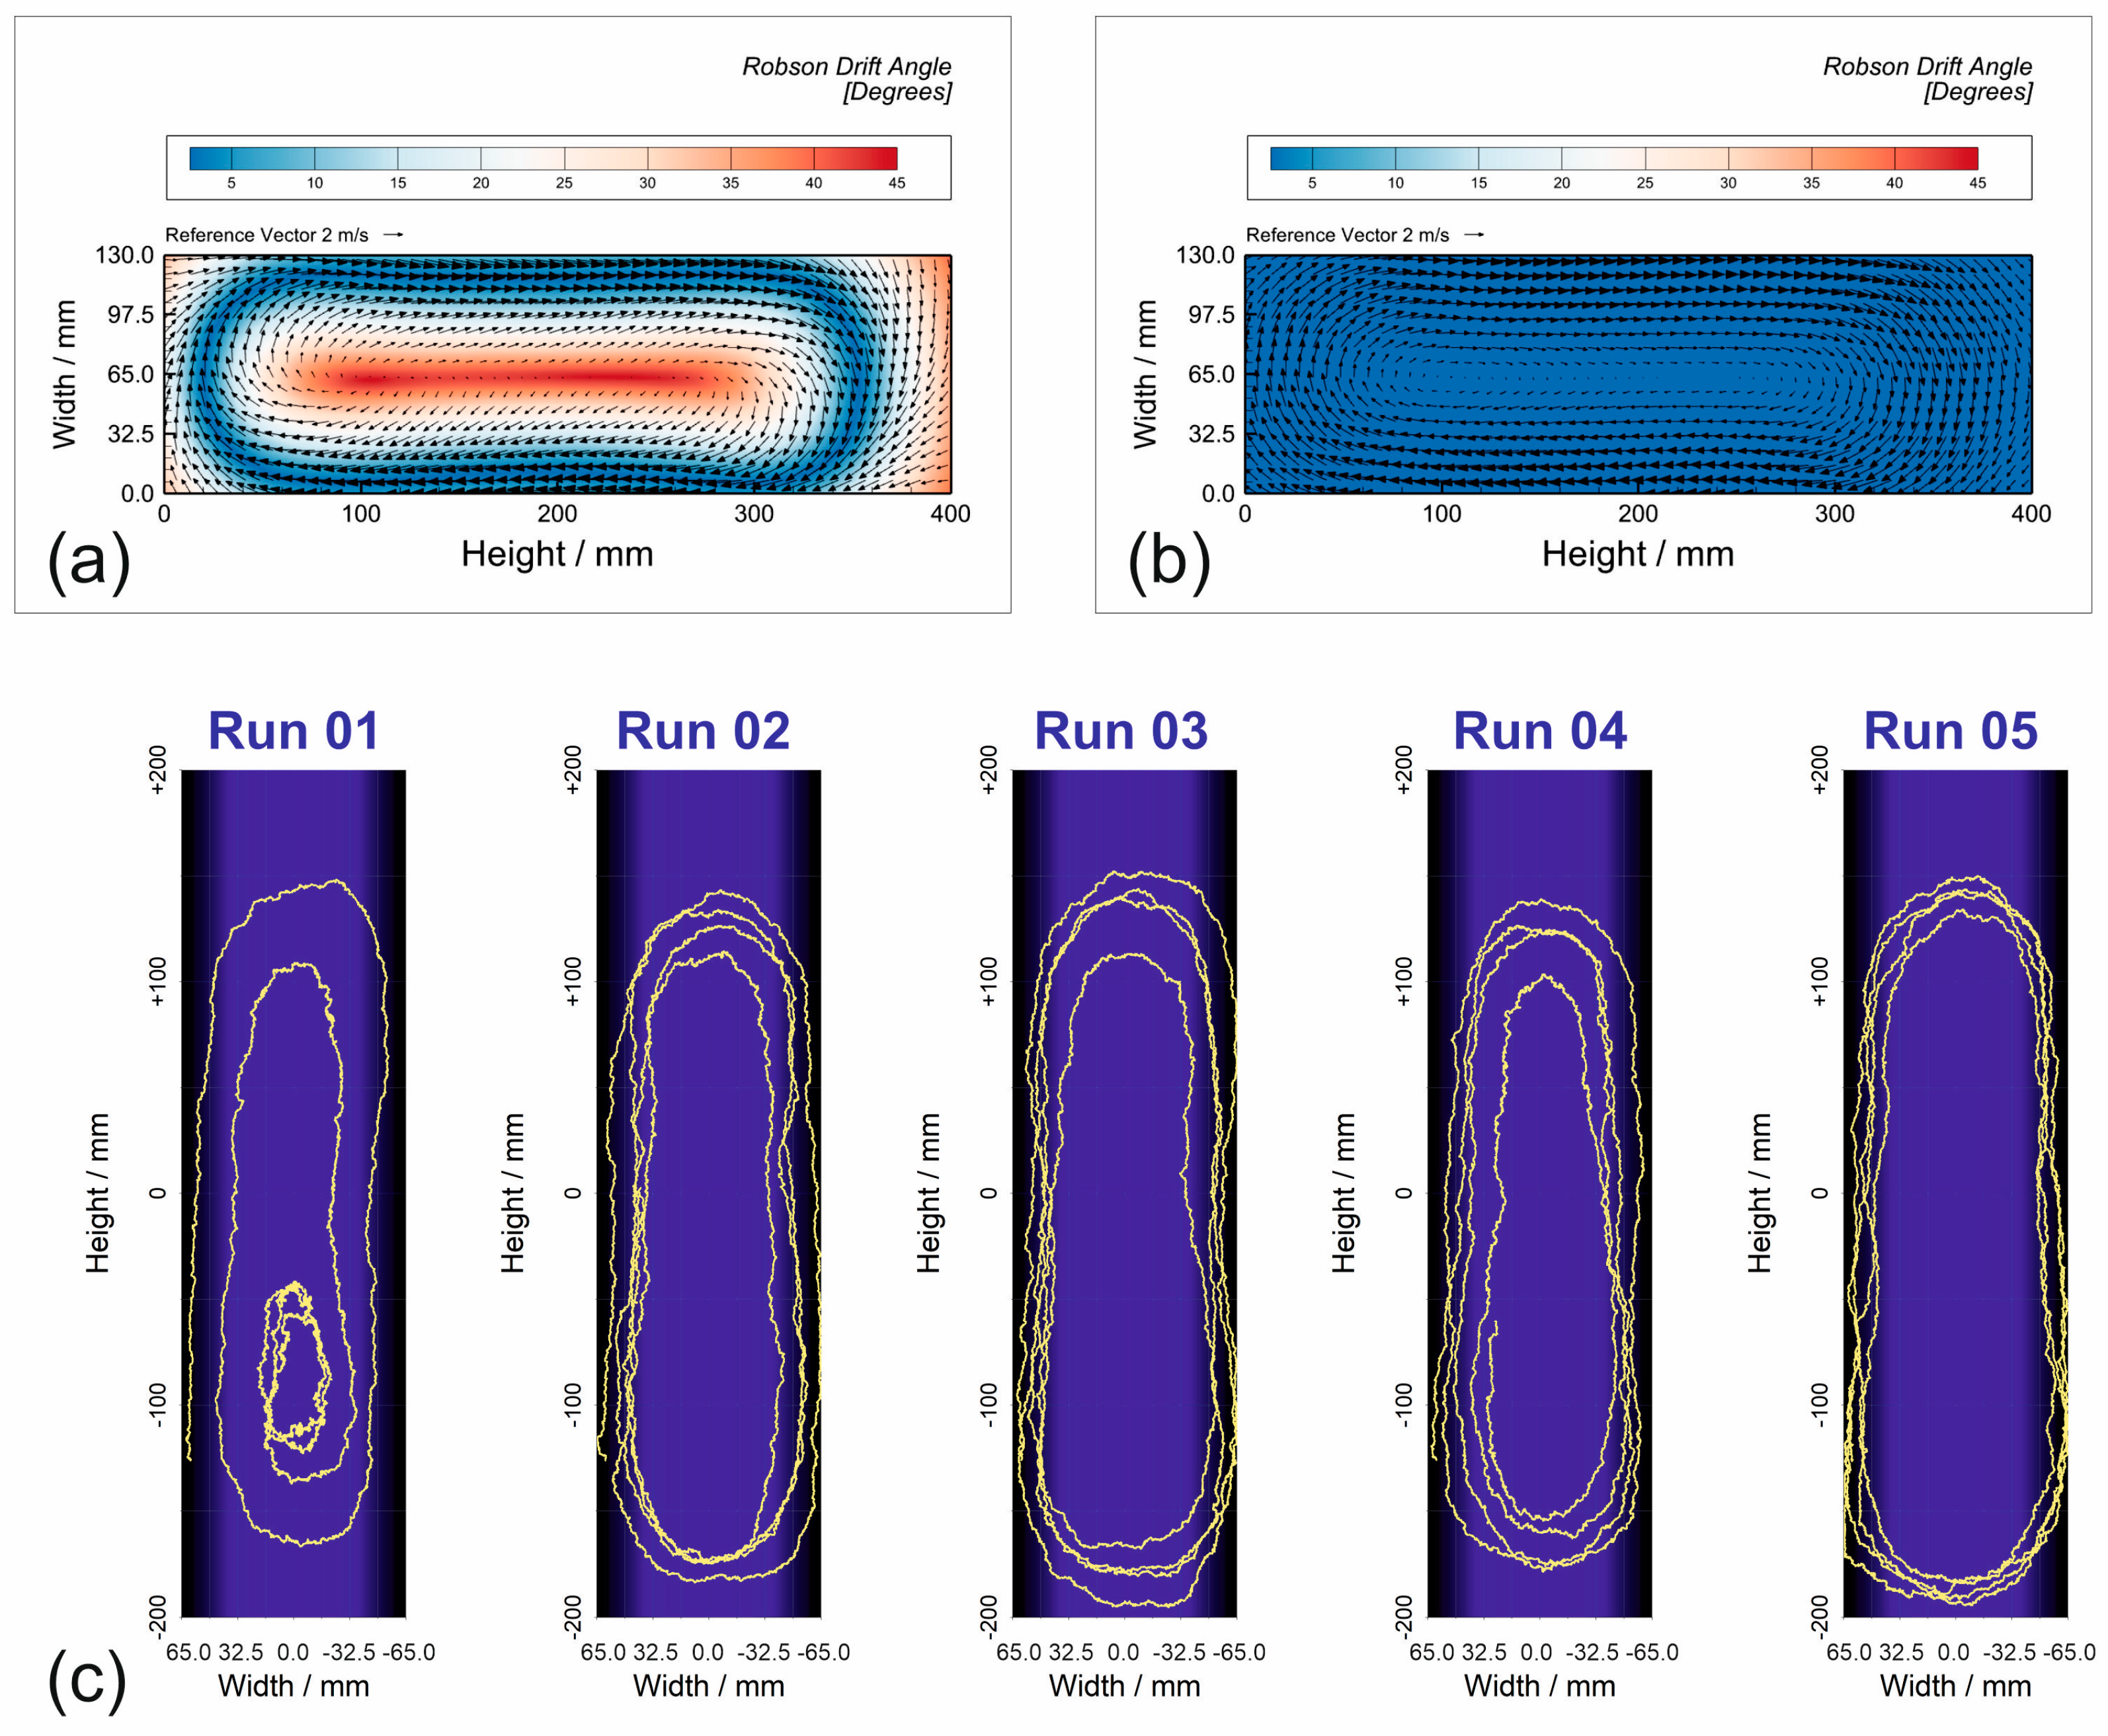
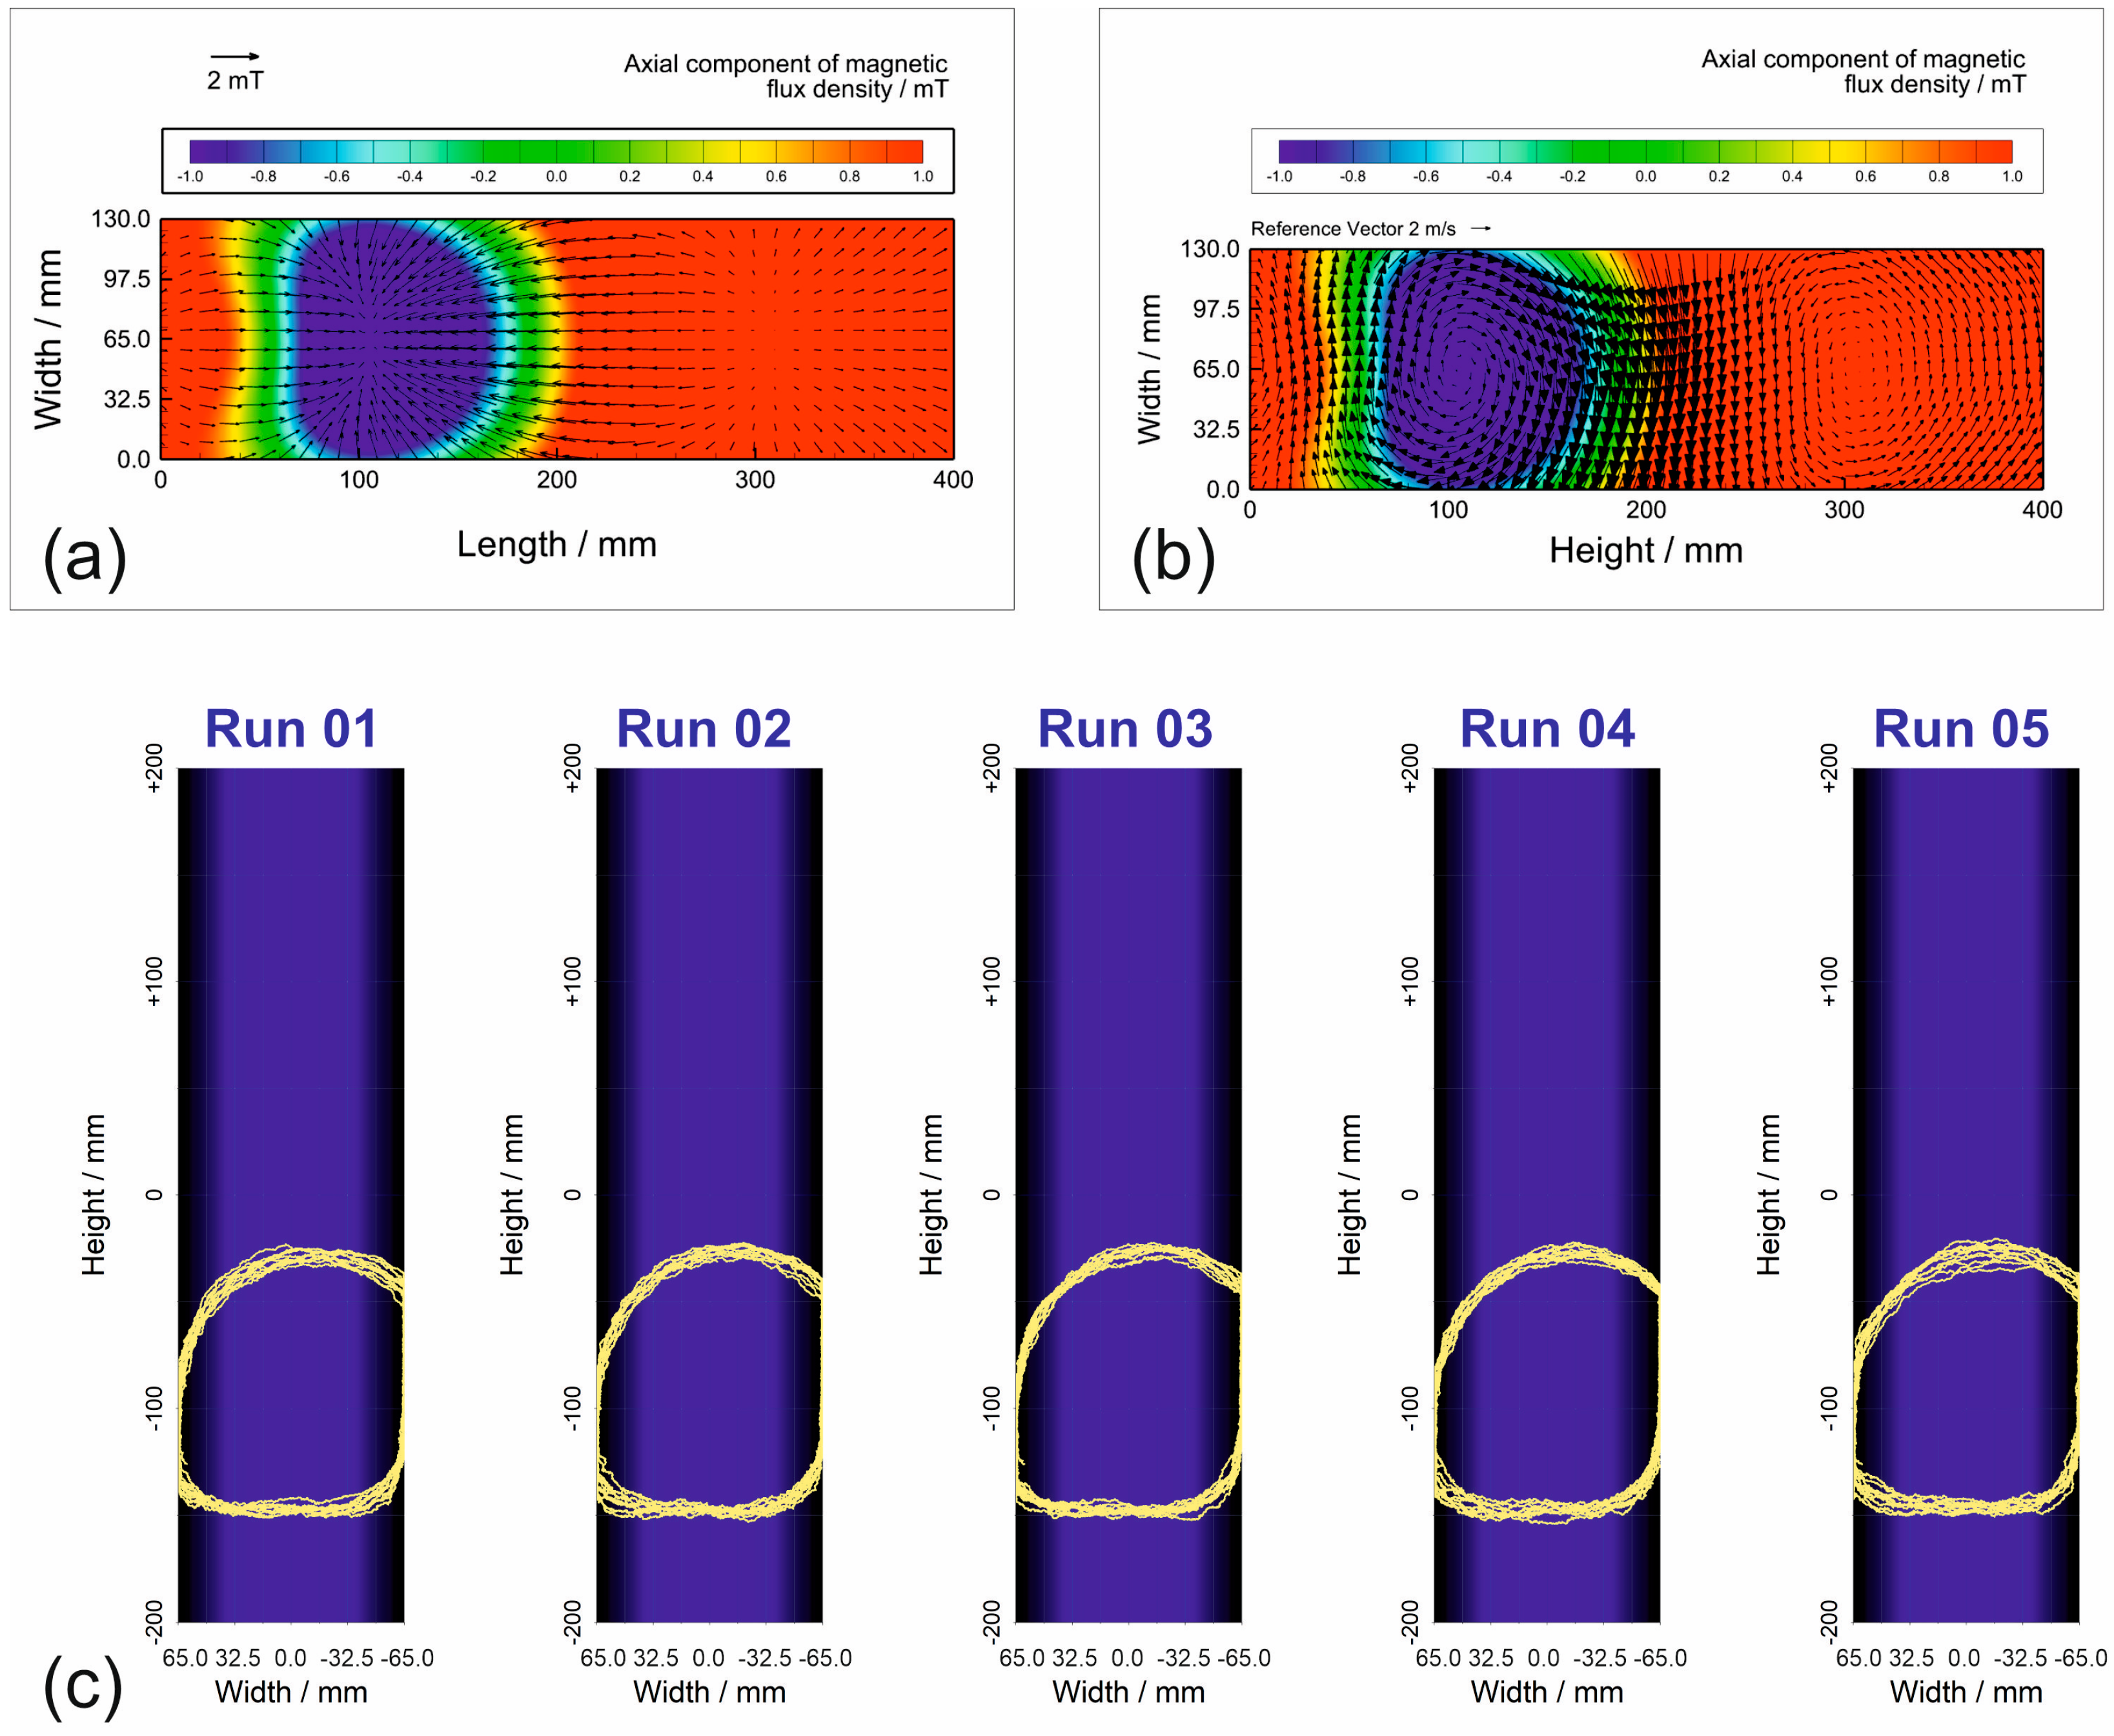
Figure 1a shows the geometrical model of the magnetic field control system and
Figure 1b exemplarily depicts the computed and experimentally validated distributions of the components of the magnetic flux density for a particular setup of the coil array.
A theoretical approach—as suggested by Rackwitz [
22]—is used to describe the arc spot motion under the influence of the imposed magnetic field. Consecutive discrete locations of the arc spot as specified by the position vector
with the Cartesian coordinates
and
of the target surface, i.e., the evaporation area, follow from an explicit equation of motion written as:
where
is an appropriate time step to resolve the temporal dynamics of the arc spot and
is the velocity field of the arc spot motion as a superposition of (i) a deterministic contribution
due to an outer magnetic field with the distribution
of the magnetic flux density and (ii) a stochastic contribution
due to the random walk characteristics of the arc spot.
Quantitative contributions from a self-magnetic field of the arc are neglected in this first approximation but the very likely influence of the self-magnetic field itself is considered—as reasoned by Beilis [
12]—in the assumed retrograde motion of the spot. While the imposed magnetic field of the 24 magnetic coils of the arc spot motion control is three-dimensional in its spatial distribution, the two-dimensional retrograde motion of the arc spot over the upper surface of the target with the velocity
is related to the tangential vector
of the magnetic field and a physically reasoned description of the retrograde motion bases on the relation
where
is the Lorentzian force density.
is the vector of the current density of positively charged carriers, and
is the vector of the surface normal pointing to the same direction as the current density vector but in the opposite sense of direction. The introduced empirical coefficients are
and
. The first one is related to the retrograde Lorentzian formula of the arc spot motion, and the second one is related to the alternative formula by use of the surface normal that is opposite to the direction sense of the current density of the positively charged carriers. The values of the magnetic velocity coefficient
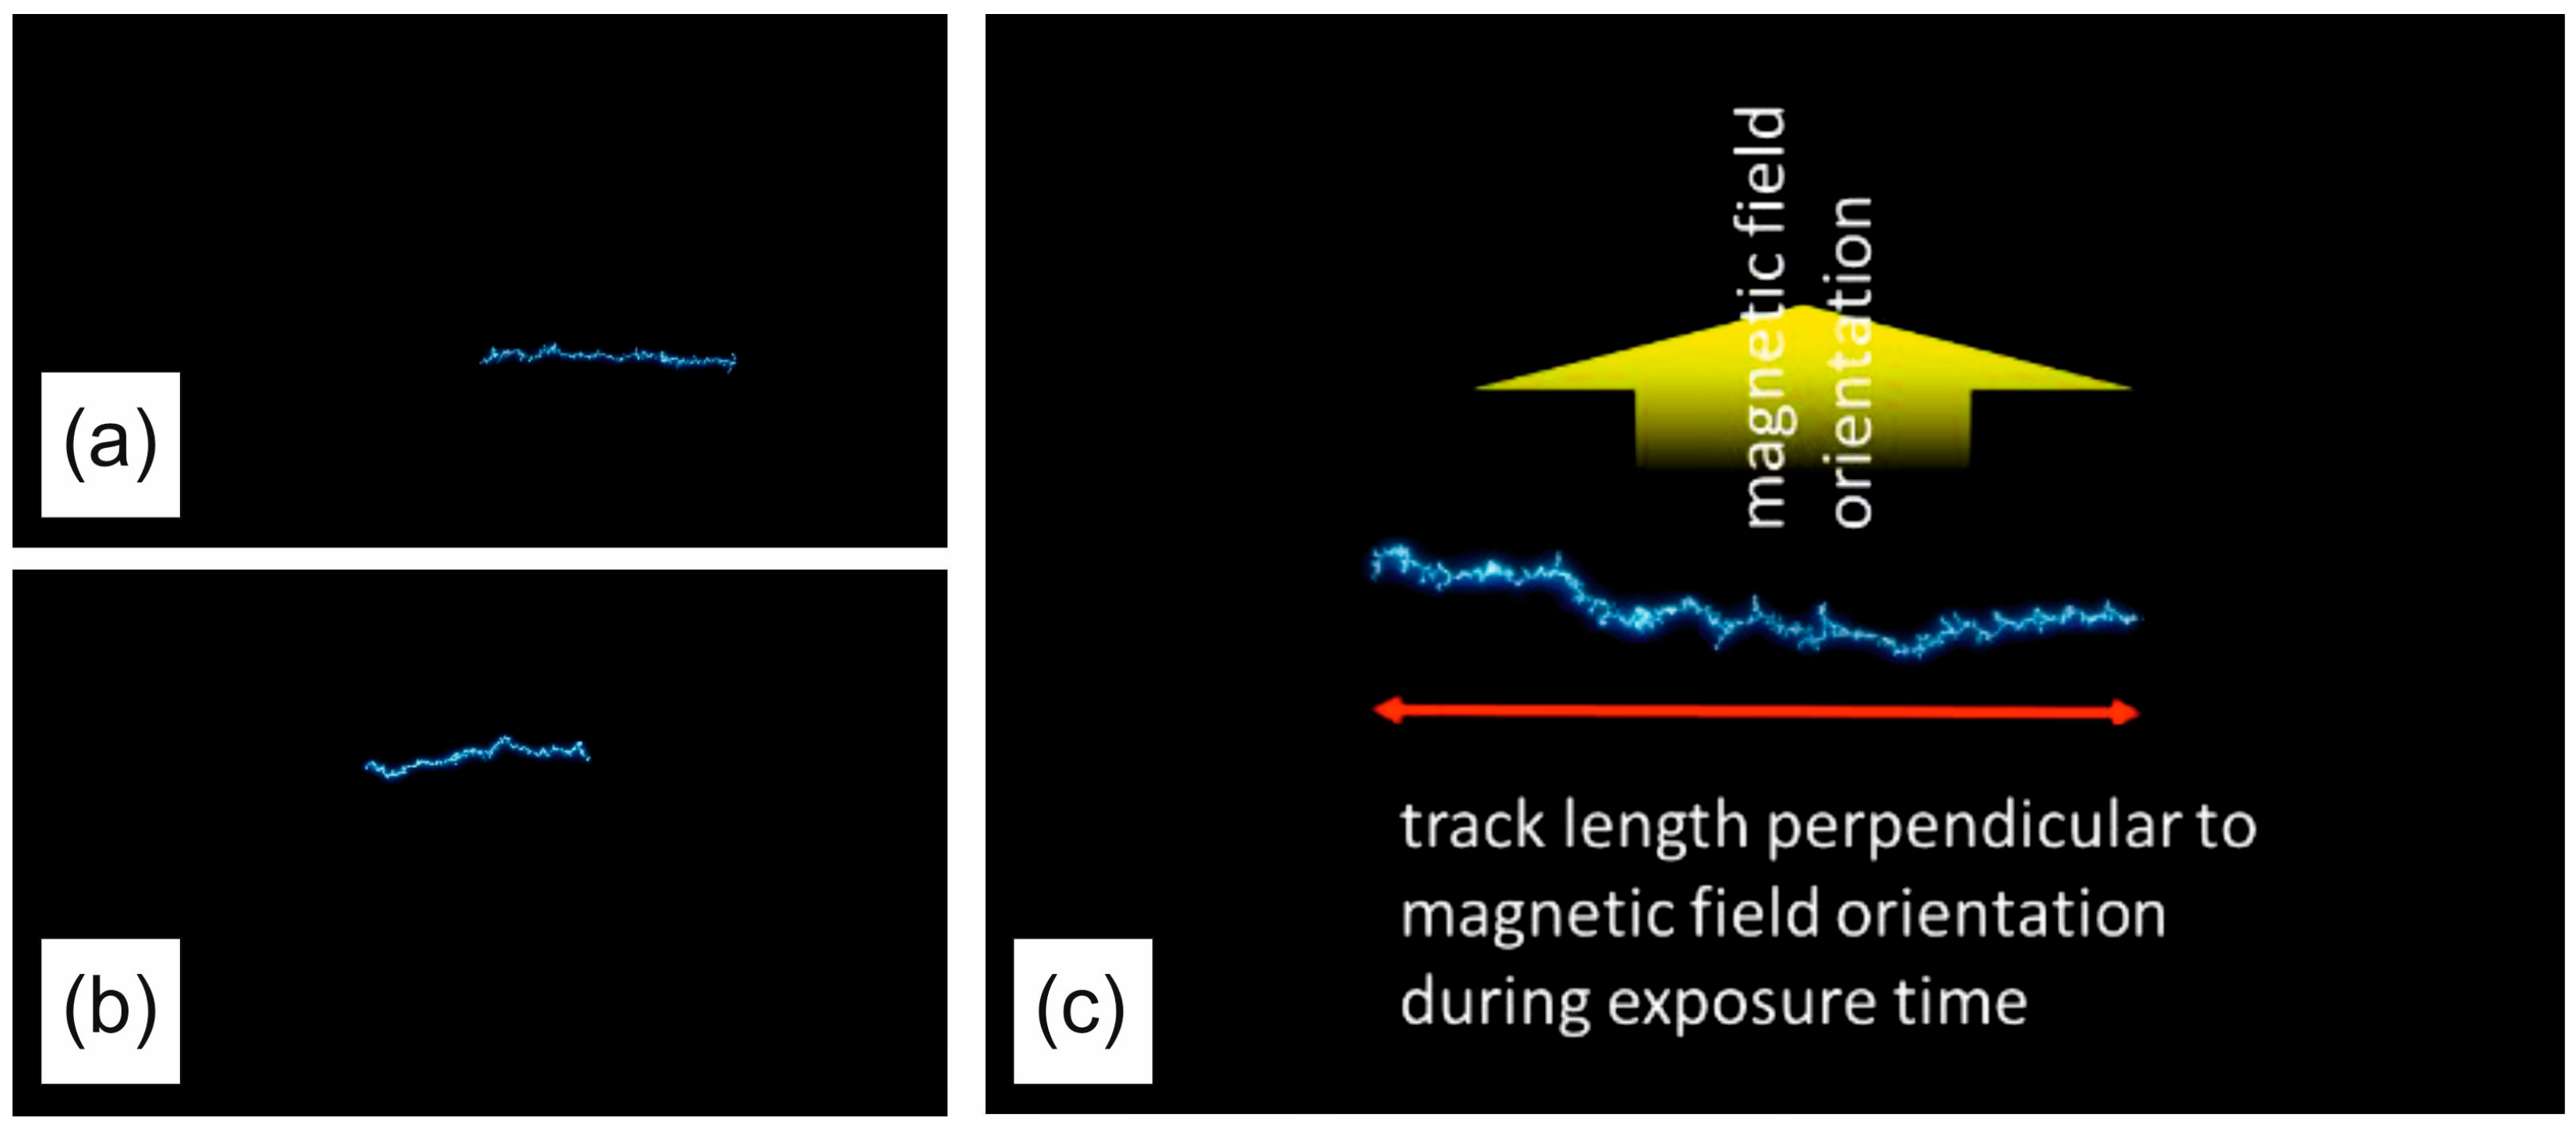
were determined by experimental observations of arc spot traces after an initial discharge operation of a few minutes to decontaminate the cathode surface and the atmosphere of the vacuum chamber. Photographs were taken with a fixed exposure time of the used camera systems (Sony RX100M3 and Sony Alpha 7 III, Manufacturer: Sony Corporation, Minato, Tokio, Japan) under the influence of a constant and well-measured magnetic field.
Figure 2 shows some of those tracks and illustrates the measuring principle of the magnetic velocity coefficient. Track lengths were measured parallel to the longitudinal section of the cathode where the tangential magnetic field at the cathode surface possesses a dominant transversal magnetic flux component
and a negligible component
in the longitudinal direction. In addition, the magnetic flux densities were selected to be high enough to dominate the arc spot motion in comparison to the stochastic distribution from the random walk motion. As a beneficial result of the defined conditions, the measured tracks are almost linear and parallel to the longitudinal direction of the cathodic target.
For the known magnetic flux density, track lengths were measured from the taken photographs. The corresponding coefficients of the magnetic velocity follow from the relationship:
The measured coefficients of the magnetic velocity lie in a range between
and
under the given processing conditions with an average value of
. This value was eventually used to calculate the velocity field
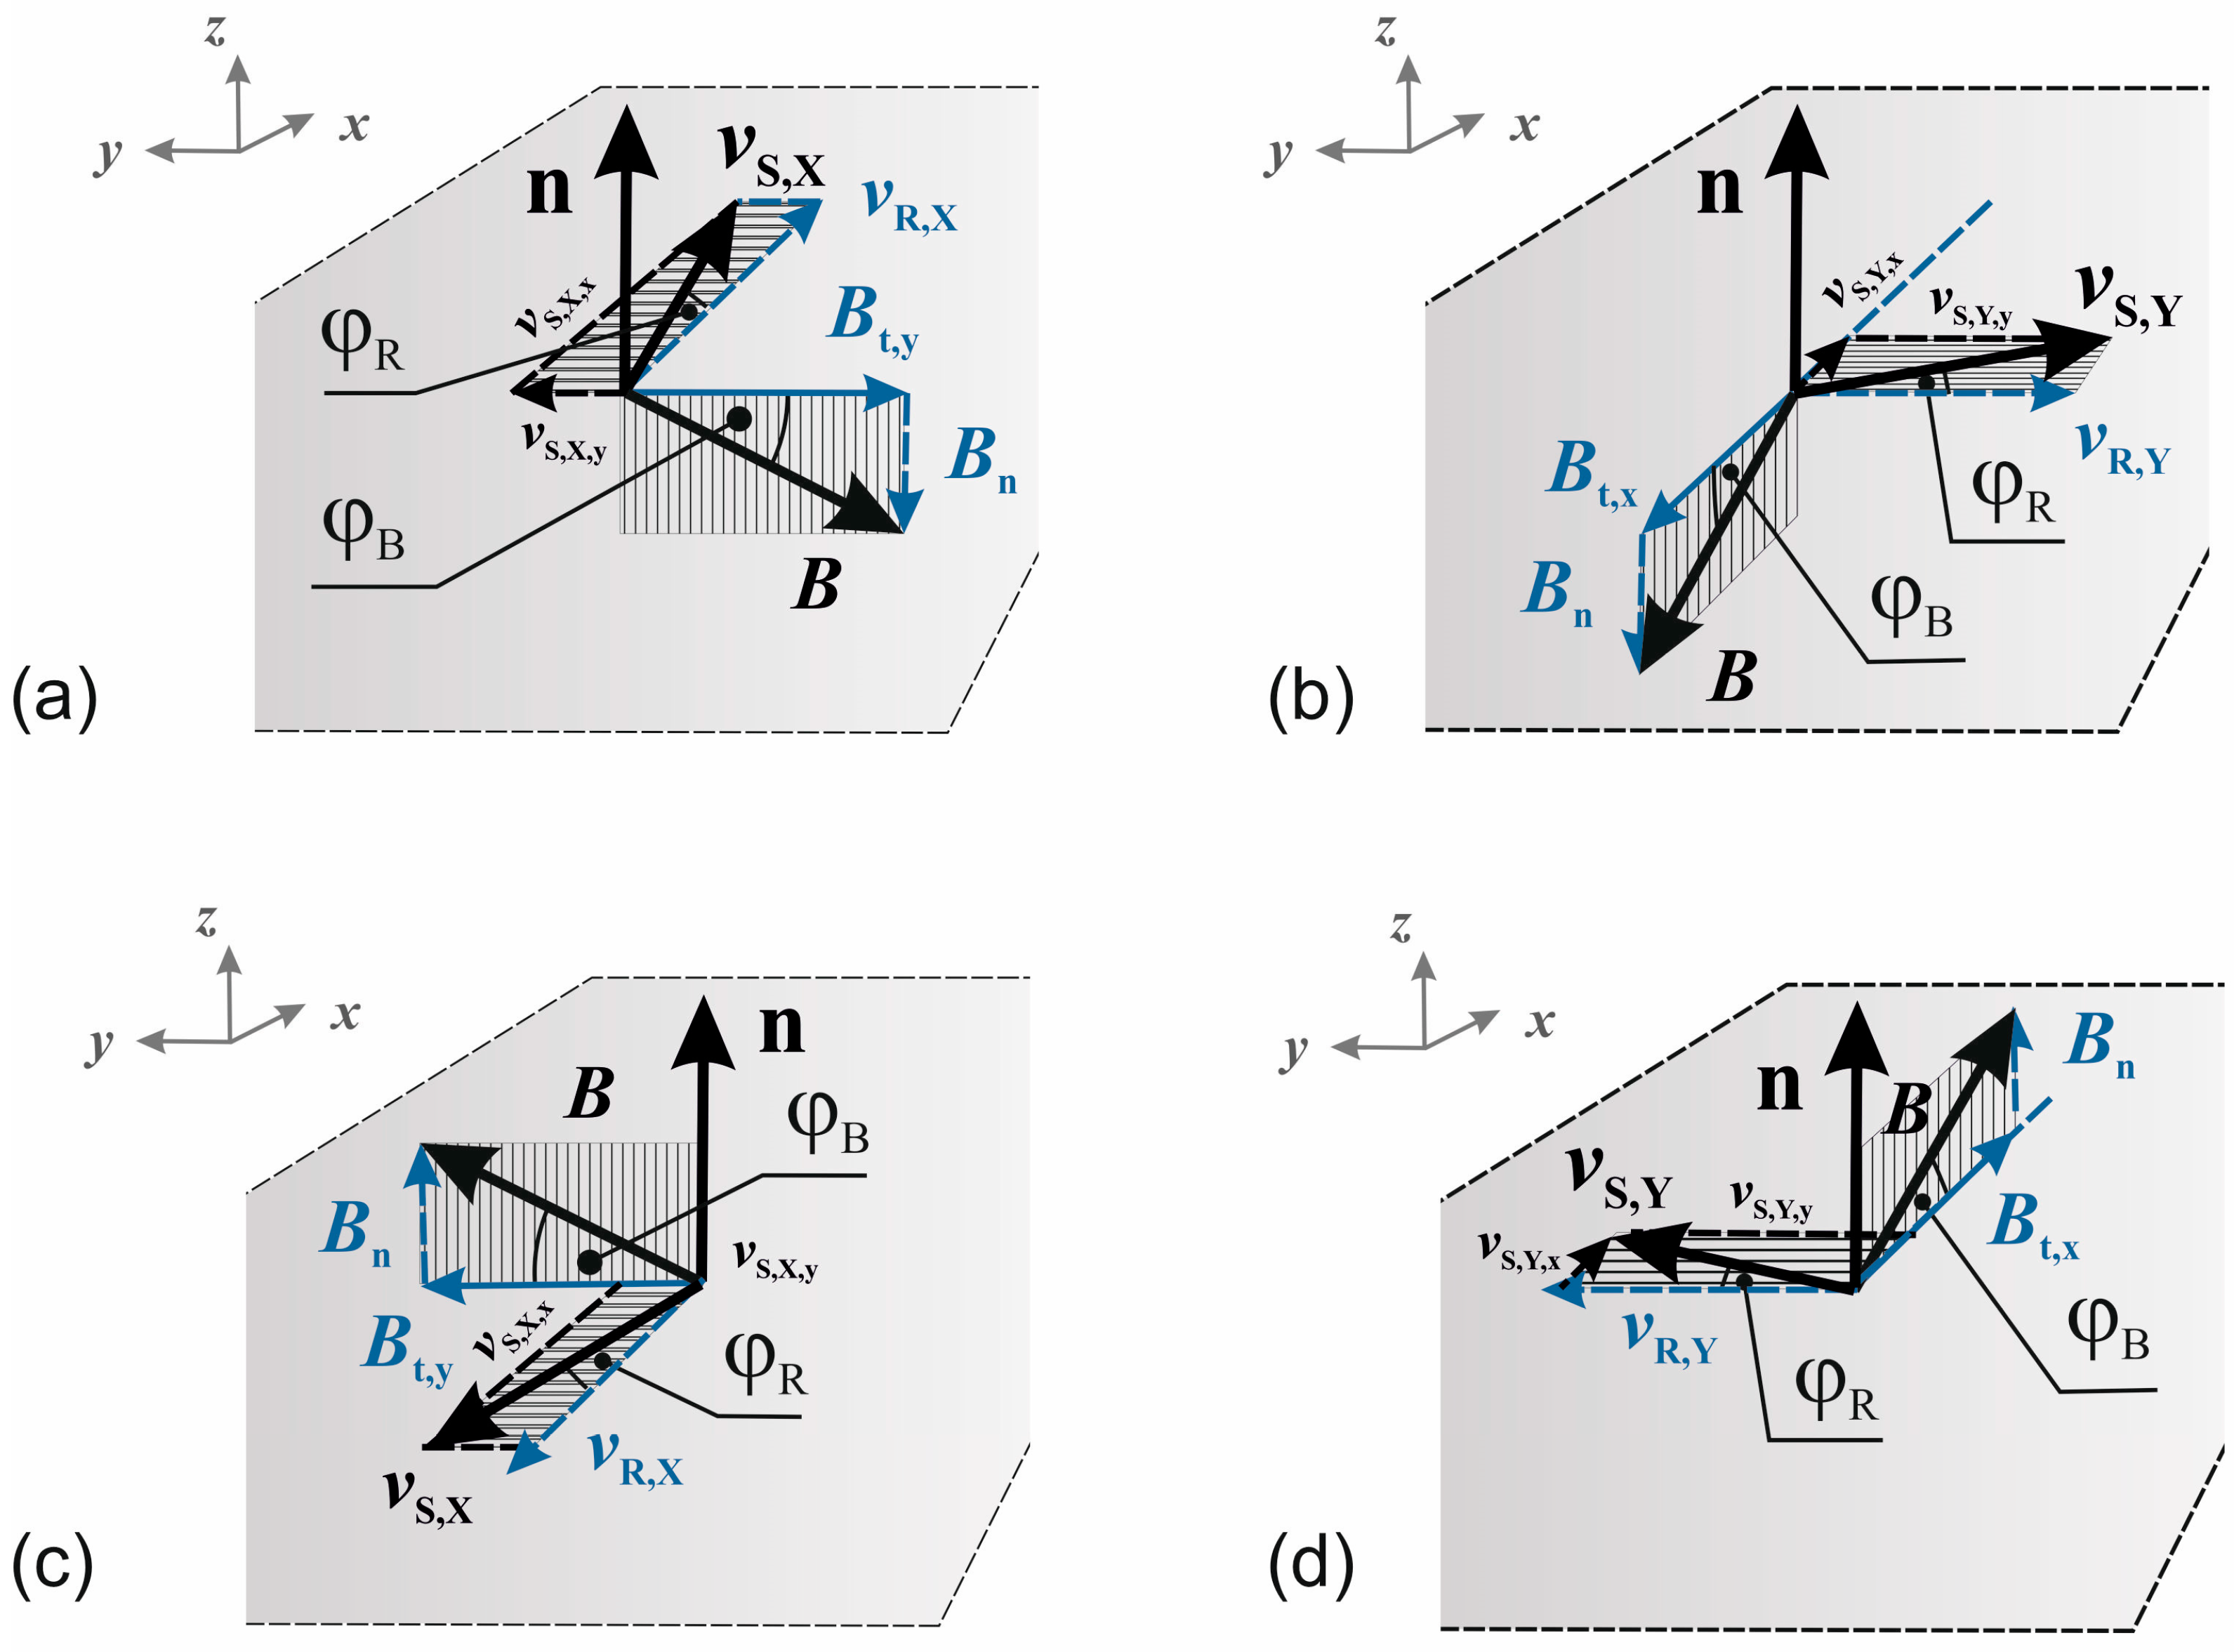
of the retrograde motion. As the applied magnetic field additionally possesses an axial component in the region of the cathode surface, the acute angle effect, or Robson drift, respectively, also influences the arc spot motion. In fact, the Robson drift causes a deviation from the retrograde motion, whereby the angle of this drift is related to the angle between the magnetic field vector
and the tangential vecor
. Kleberg [
17] distinguished two cases, namely (i) the case in which the axial magnetic field component is parallel to the current flux density, and (ii) the case in which the axial magnetic field component is anti-parallel or opposite to the direction of the current flux density. For the sake of a better comprehensibility, the mathematical formulation of the resultant dependencies is detailed for the velocity vectors
and
for a parallel alignment of magnetic field vector and current density, as well as
and
for the anti-parallel alignment. The components of these vectors as a function of the acute angle
of the magnetic field, the corresponding Robson angle
, and the components
and
of the velocity vector of the retrograde motion are illustrated in
Figure 3. In case of the parallel alignment, the components of the velocity vector of the spot motion follow to:
whereas in case of the anti-parallel alignment, one obtains
The velocity vectors for the spot motion follow from the derived relationships for the velocity components. In combination with the cross product of the surface normal and the magnetic field vector with
for an assumed plane target surface, one obtains:
The value of the acute or Robson drift angle
is related to the inclination of the magnetic field vector by
with
as a first reasonable approximation. The inclination angle
between the vectors of the magnetic flux density
and the surface normal
is calculated from the definition of the direction cosine according to
In dependence on the sign of the axial component of the magnetic field, the acute inclination angle becomes for and for .
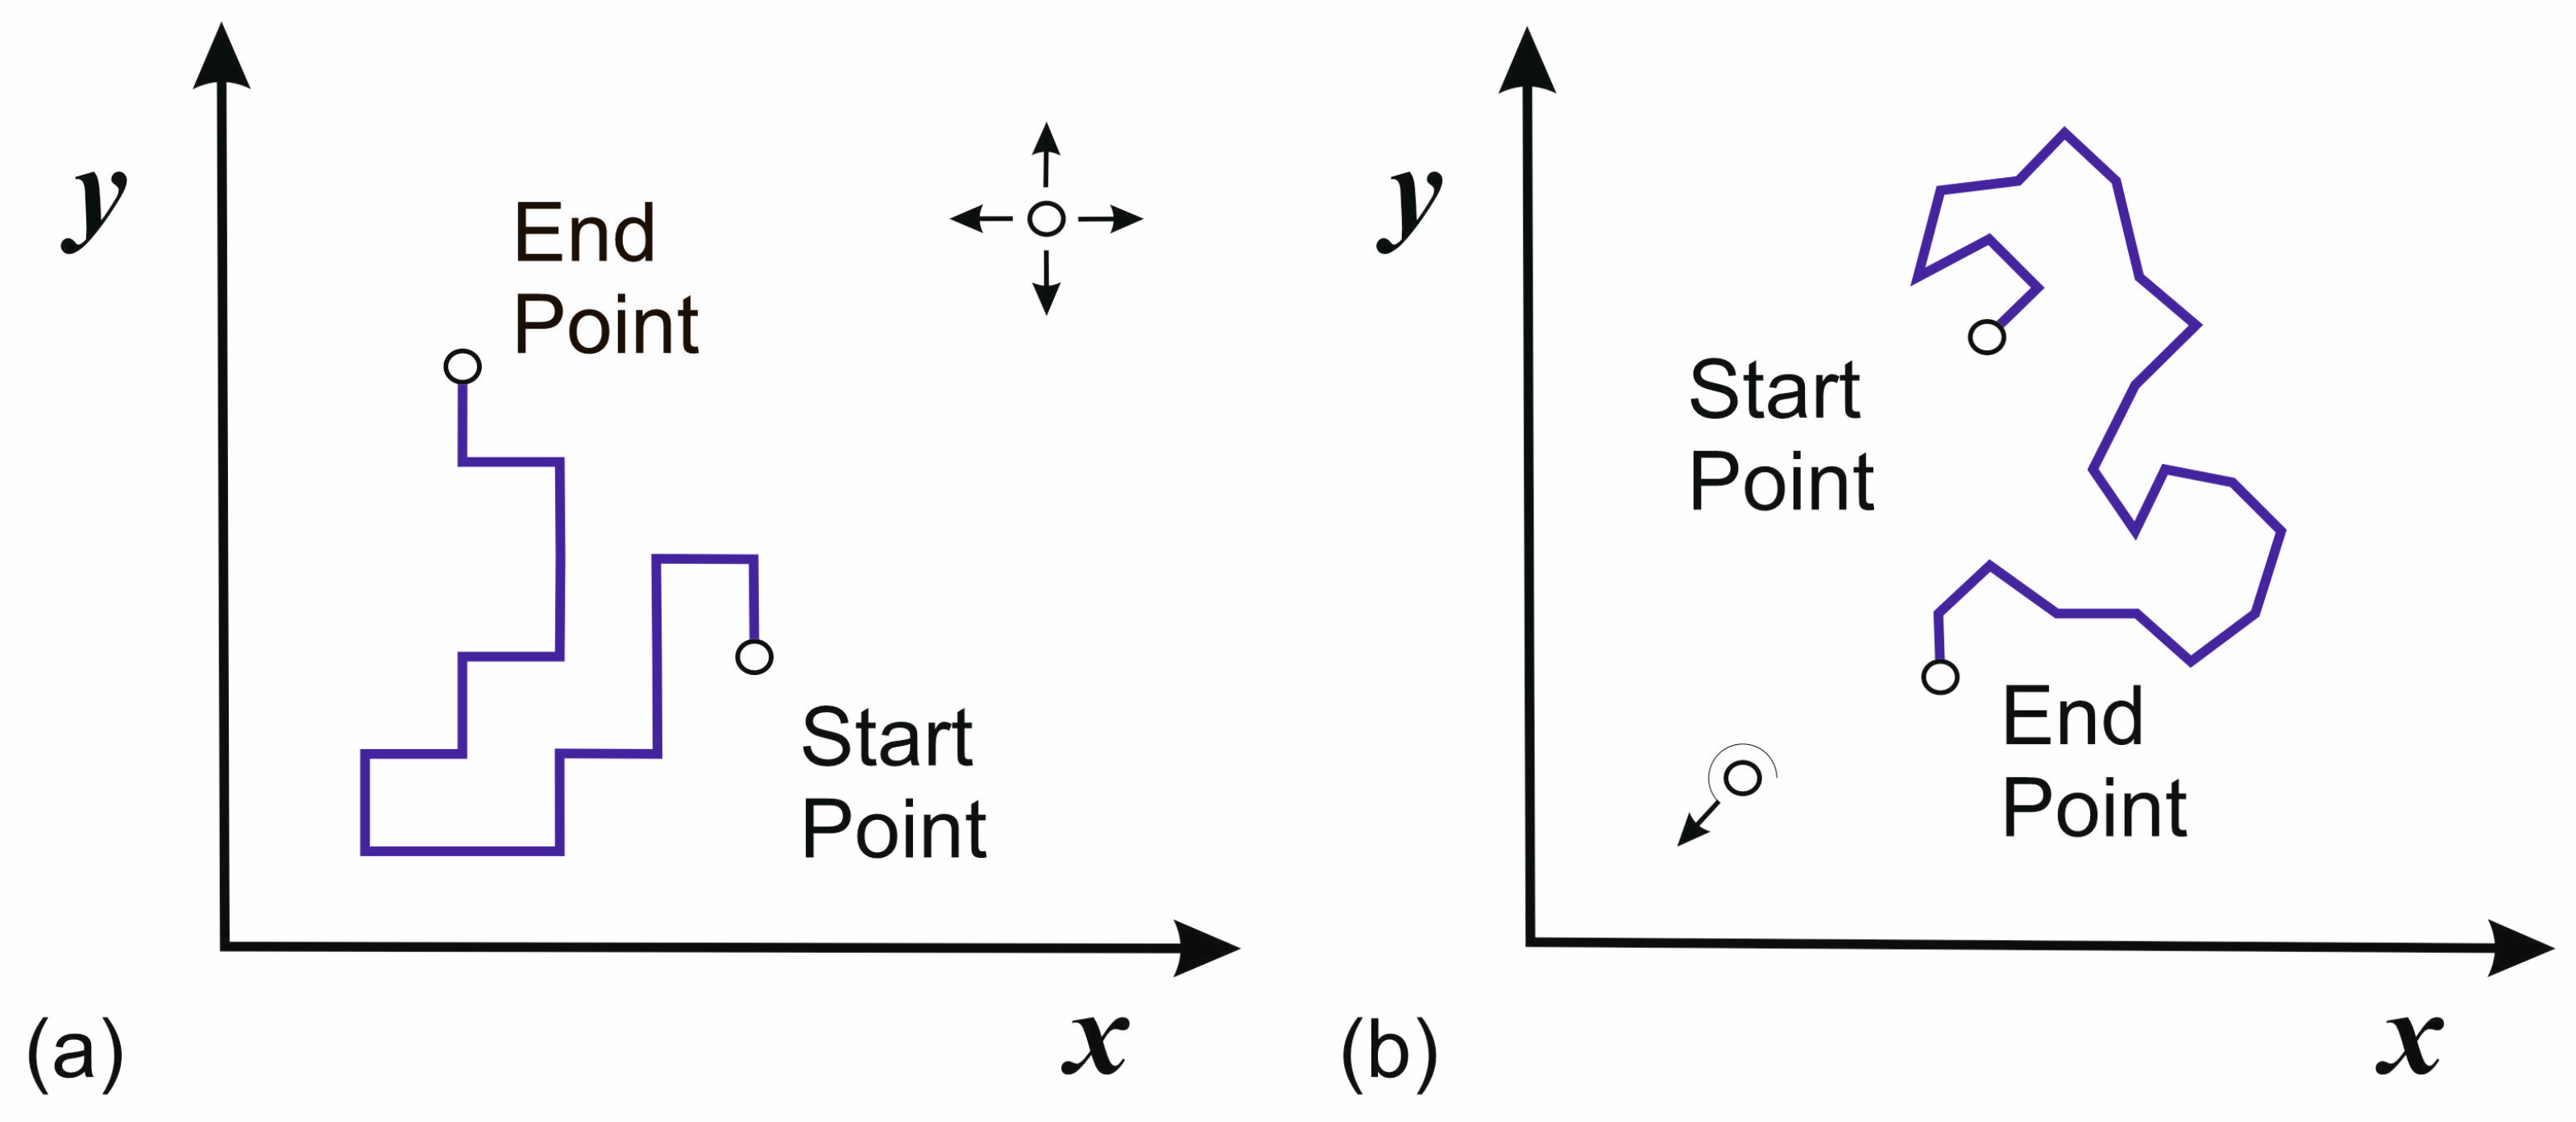
The description of the stochastic contribution from the random walk arc spot motion commonly based on the assumption that the probability function of the arc spot motion suffices a Rayleigh distribution according to
with the probabilities
and
of a one-dimensional random walk in the x- and y-direction that each corresponds to a normal distribution, and with the scaling factor
with the time
and the diffusion coefficient
. This diffusion coefficient can be considered as a quantitative measure of the macroscopic spot mobility. One drawback of this common approach is the fact that the limitation of arc spot displacements only along the x- and y-direction of an arbitrary Cartesian coordinate system is not obvious at all, see
Figure 4a. Therefore, this conventional classical approach was extended for random directions by using cylindrical coordinates
with a step size of
that allows for a more realistic spot path. The angle
is determined by a uniformly-distributed integer random number generator that produces non-deterministic random numbers in a range between 0 and 360°, see
Figure 4b.
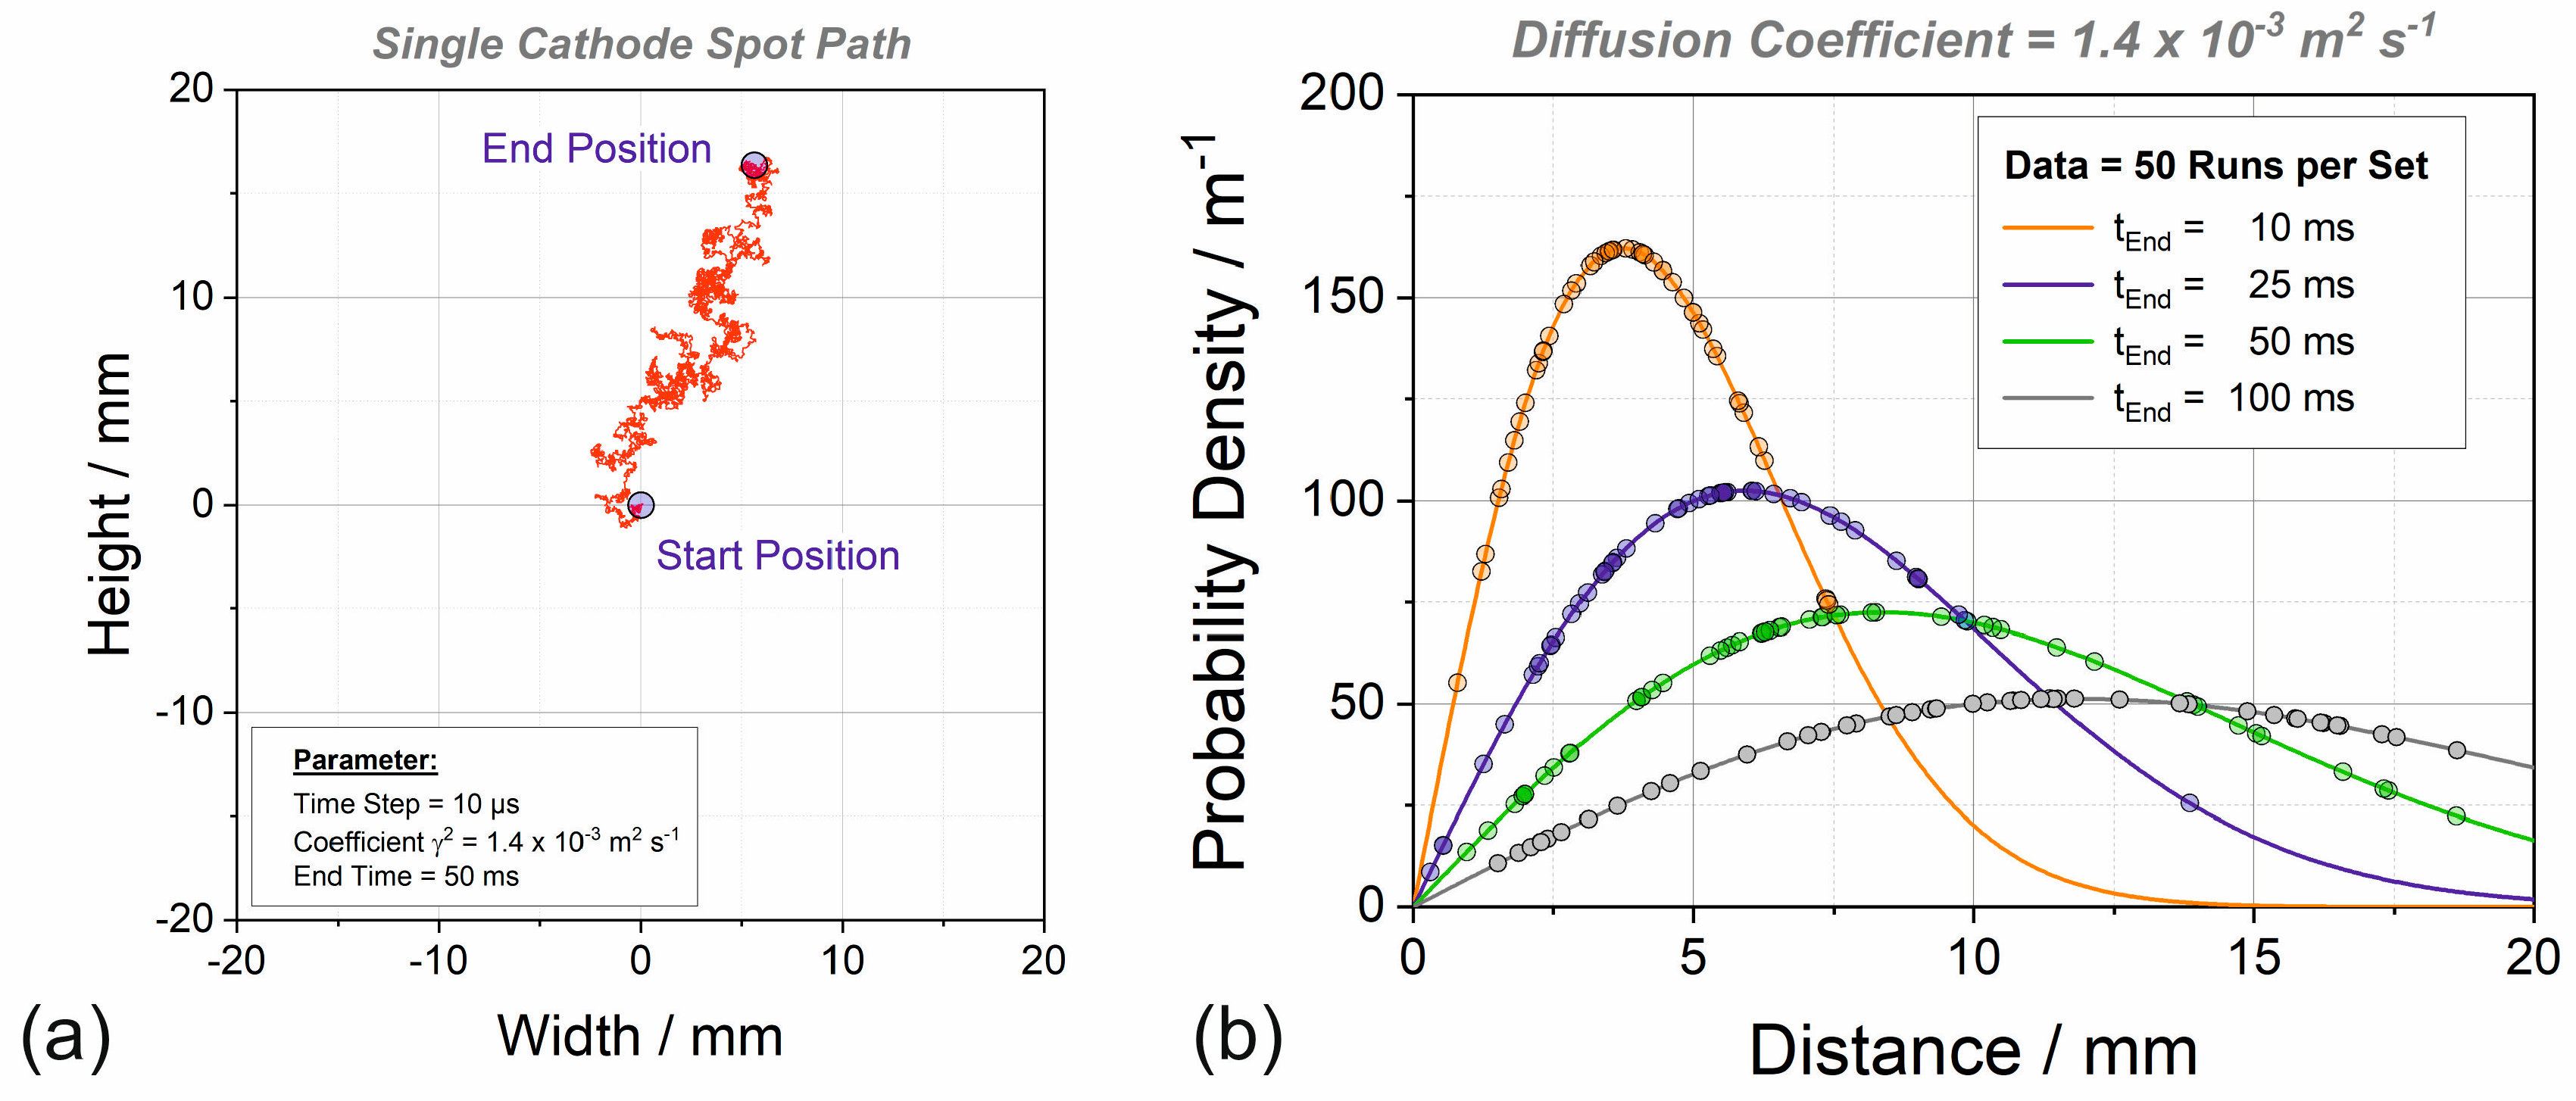
Calculated spot paths are exemplarily shown in
Figure 5a with indicated start and end positions. Furthermore, it could be shown by variational calculations that the distance between the start and end points correspond to a Rayleigh distribution as in the case of the conventional approach, see
Figure 5b.
The theory of the Rayleigh probability function also provides a relationship for the average distance
between the start and end point of the random walk displacement within a particular time period
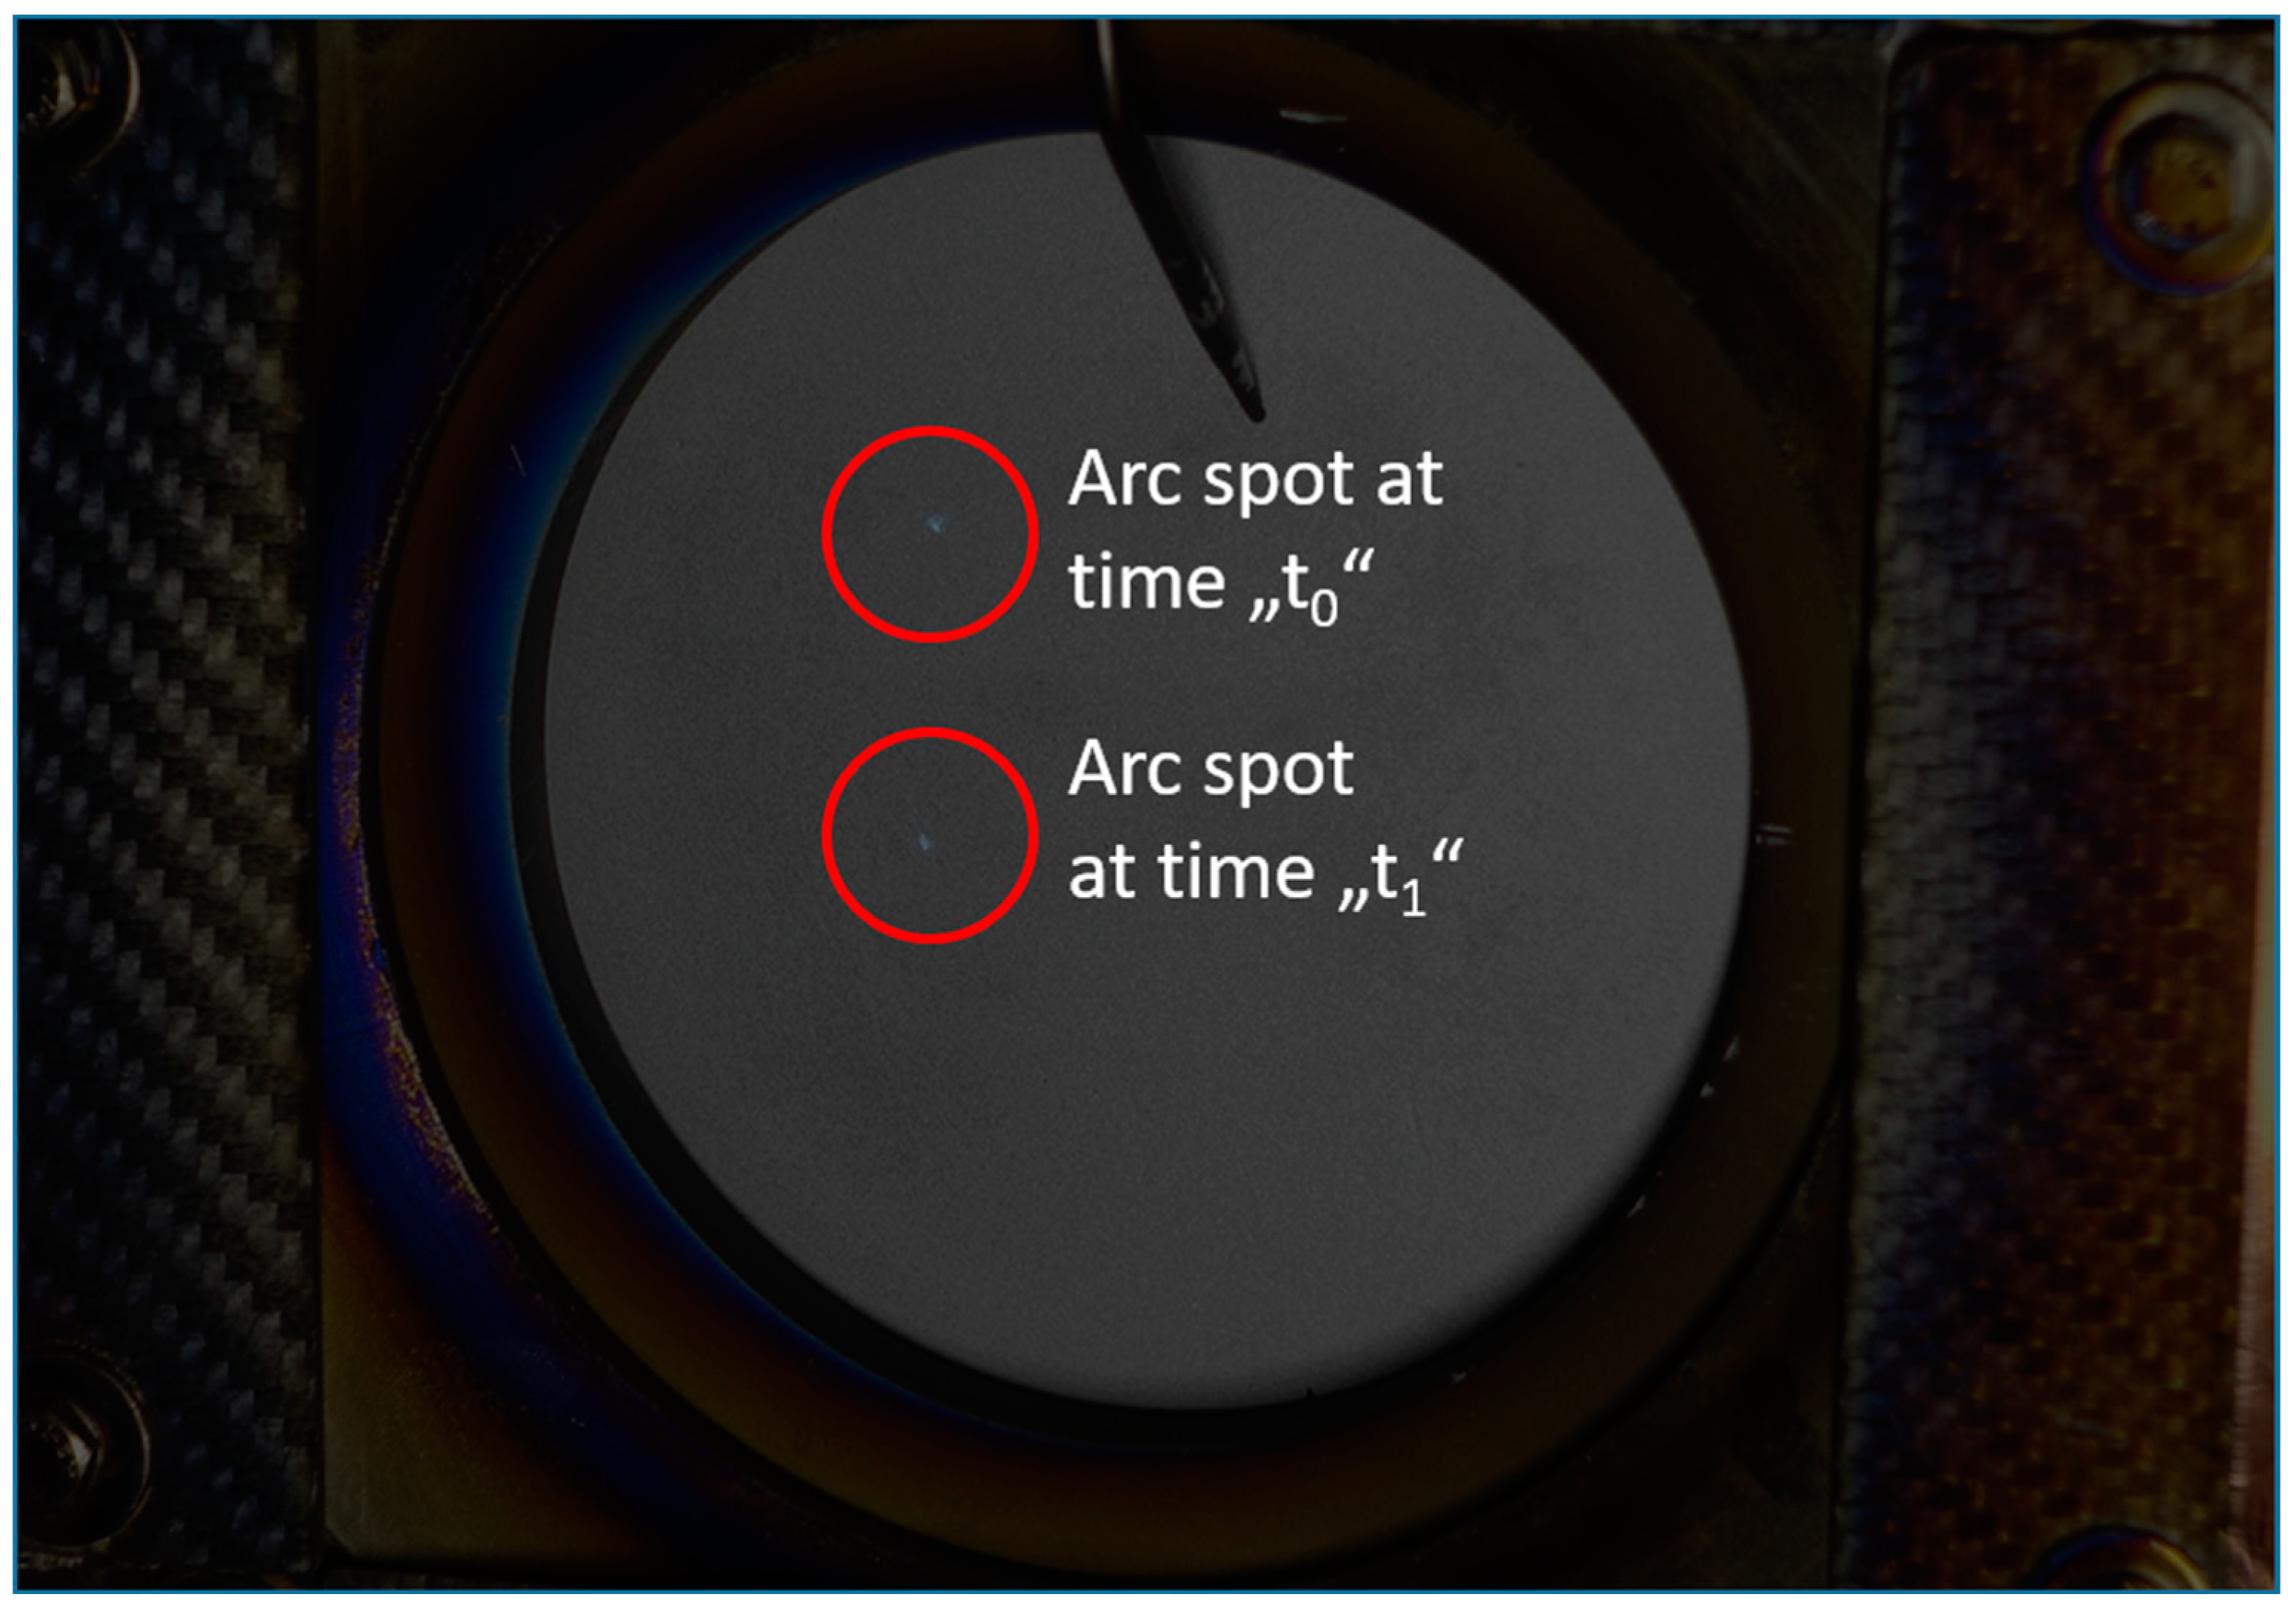
This average value can be taken from experiments. For this purpose, experiments on the circular cathode were conducted that allow for arc discharges at low amperages of 20 A so that only one spot is burning at a definite time. In contrast to the determination of the magnetic velocity coefficient, very short exposure times were used to detect subsequent spot positions.
Figure 6 shows typical photographs of the evaluation procedure.
The distance between the two subsequent positions was measured for different delay times
. Several hundreds of photos were taken and evaluated to obtain the statistical average value
of the covered distance for time intervals in a range between 10 and 100 ms. From these values, the diffusion coefficient
was calculated according to:
The evaluation of the experimental data provided diffusion coefficients in a range between
and
. Those values are in very reasonable agreement with the literature data [
8].
3. Results
The calibrated model with the experimentally derived phenomenological coefficients of magnetic velocity and diffusive displacement can be used to compute the arc spot motion for arbitrary magnetic field configurations.
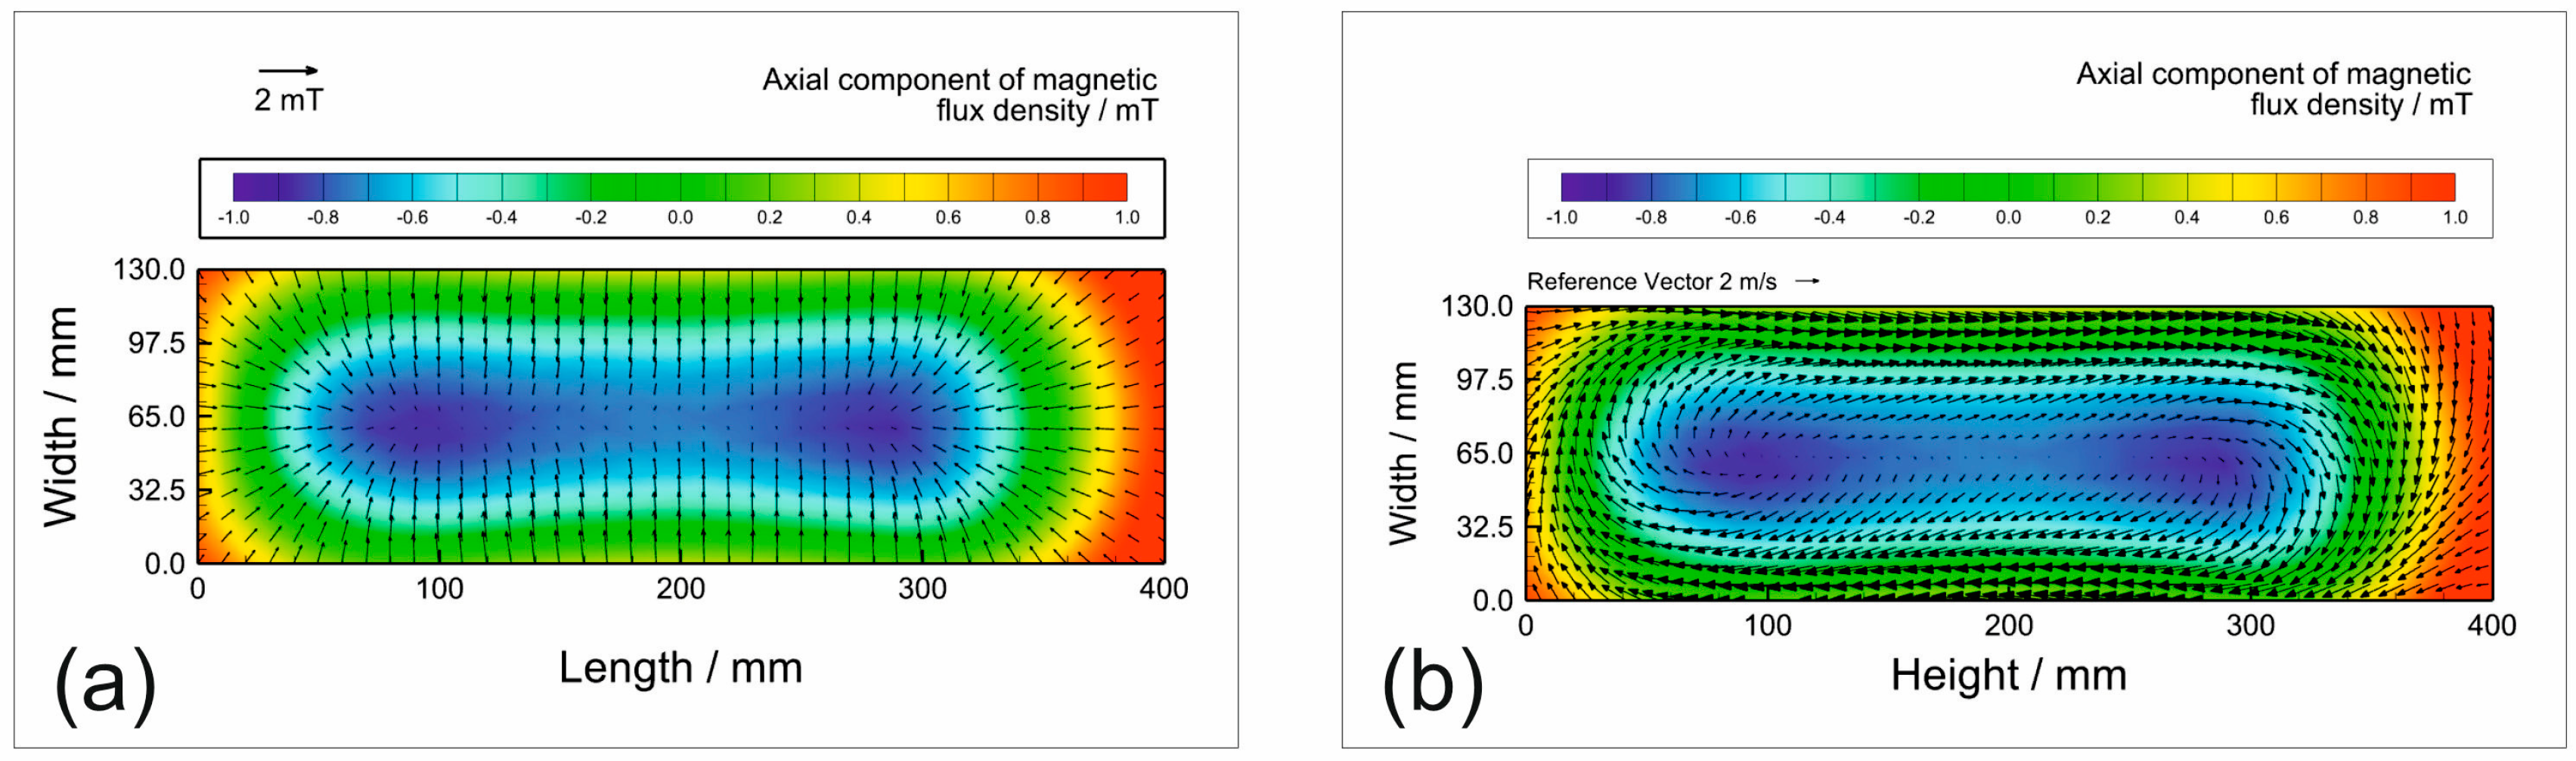
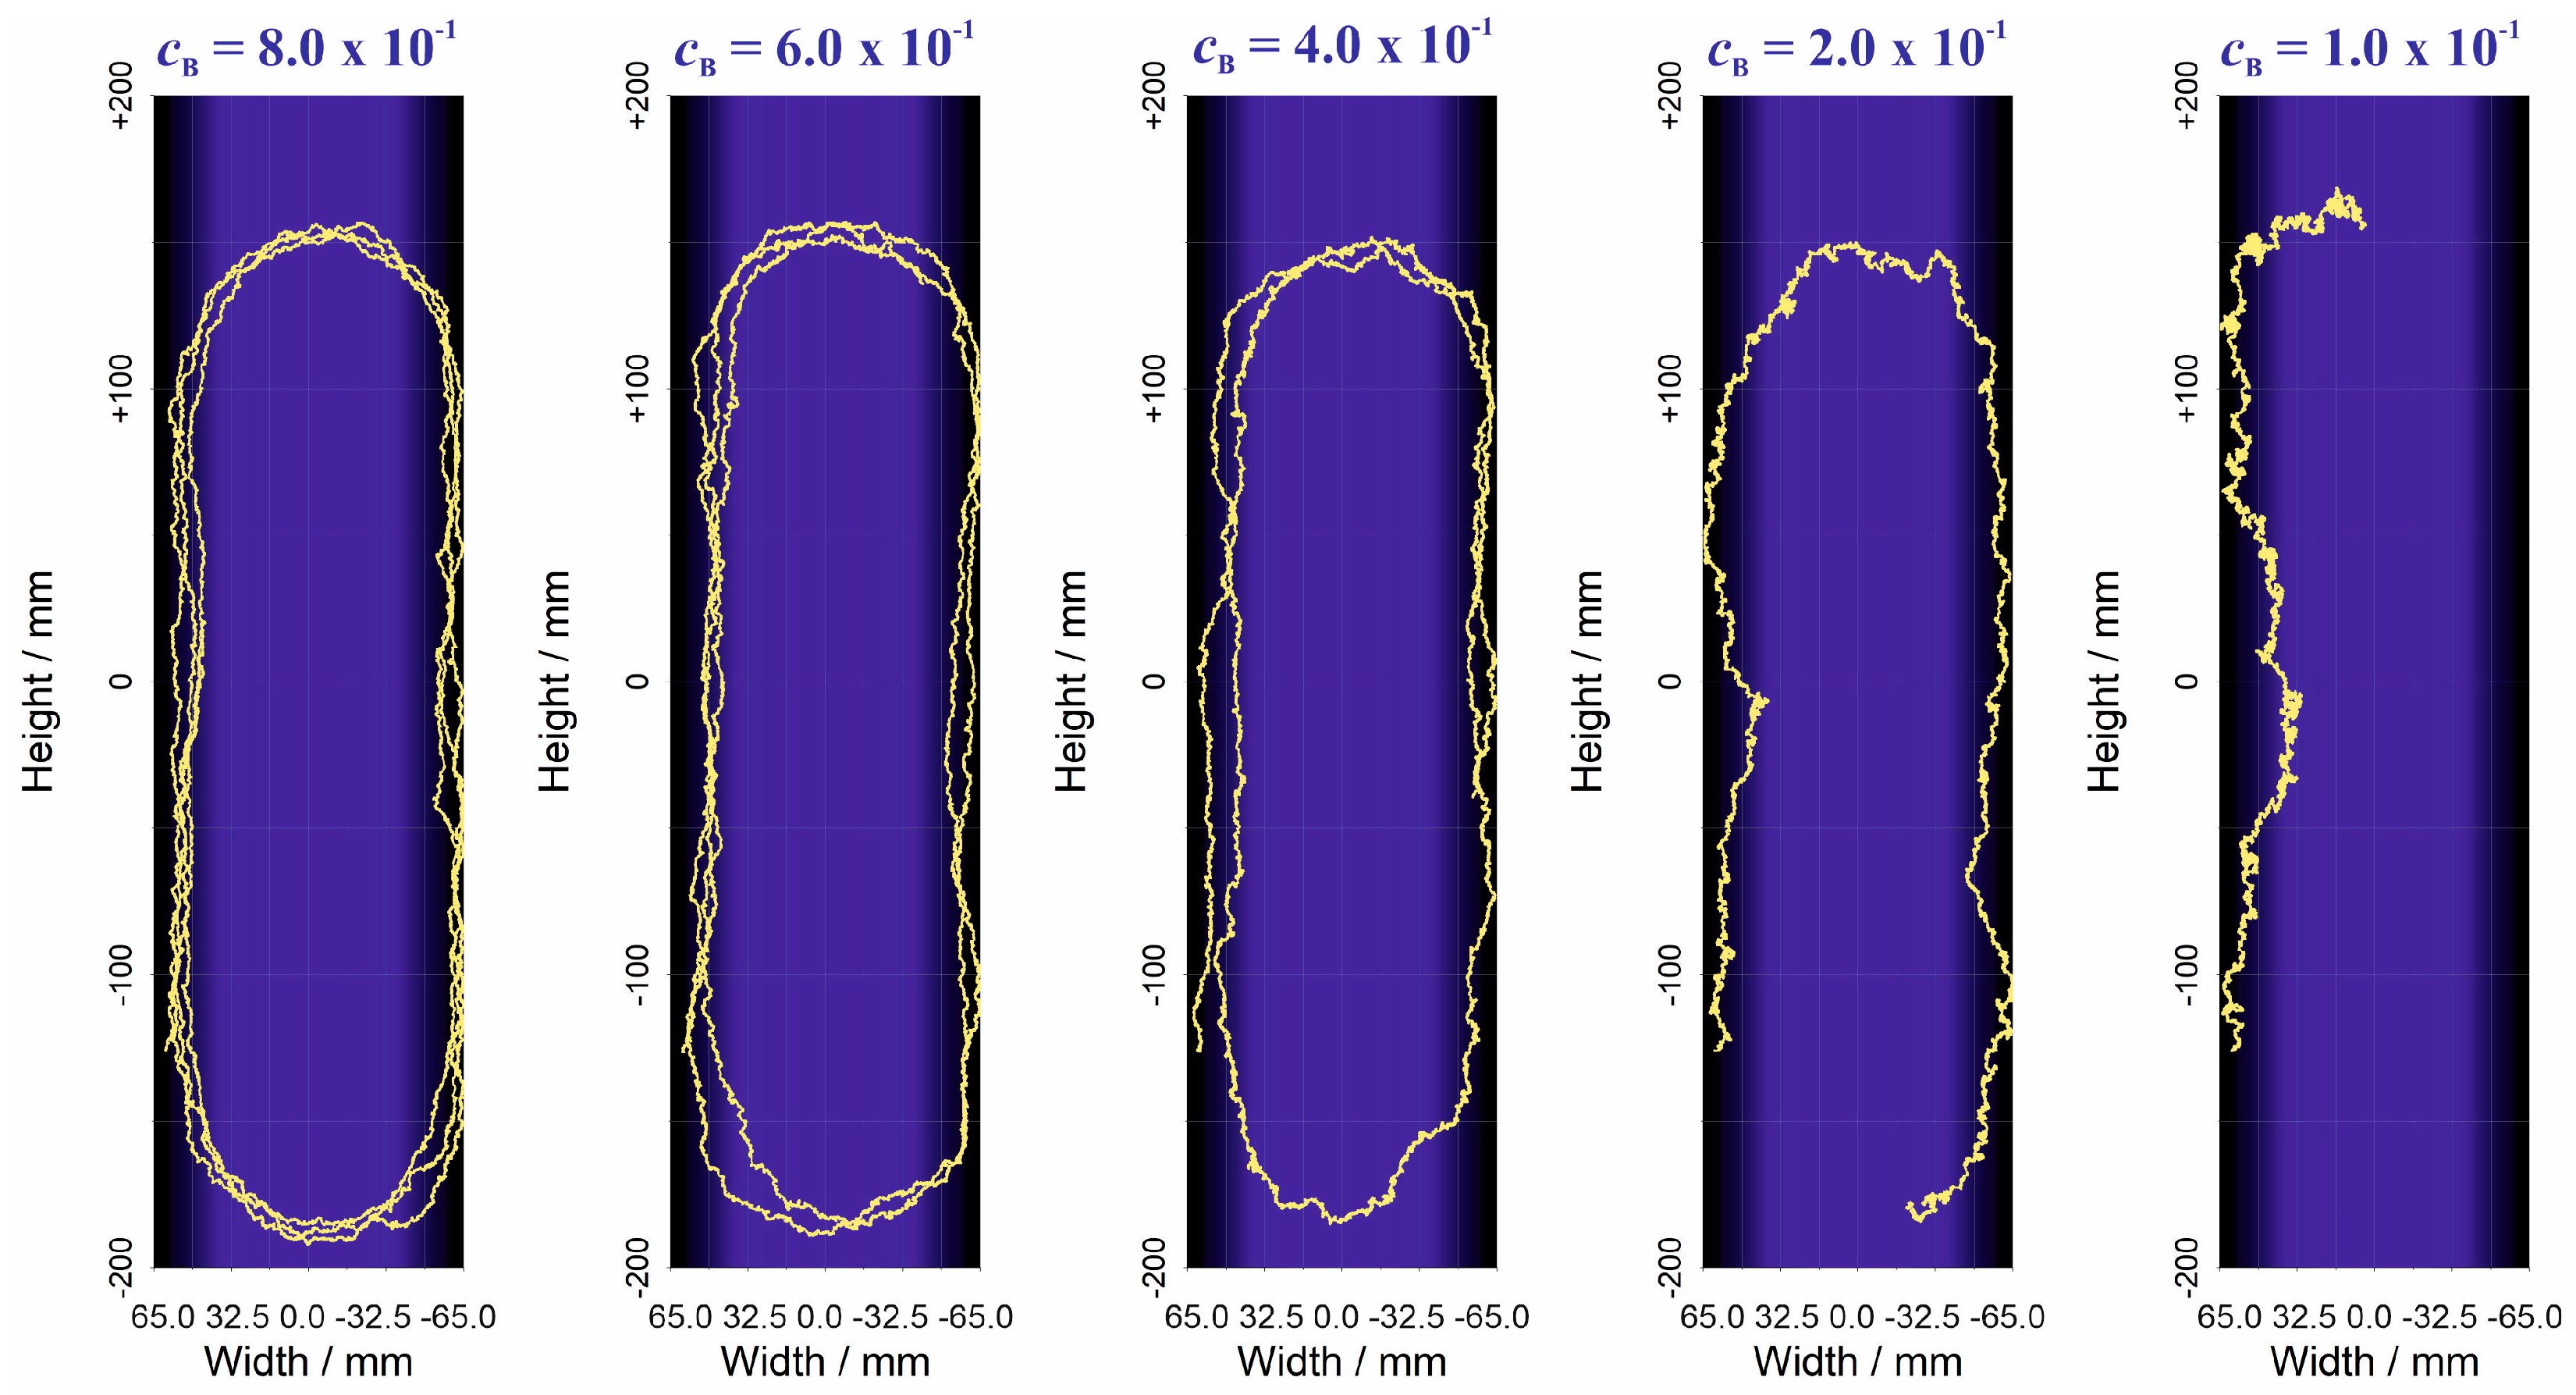
Figure 7a shows a first magnetic field configuration MF-01 with the vector field of the tangential component and a false-color image of the axial component of the magnetic field. Such a particular distribution was designed as a tunnel-like field to steer the arc spot along a closed loop across the cathode surface. The resultant velocity field
with consideration of the retrograde motion and Robson drift is depicted in
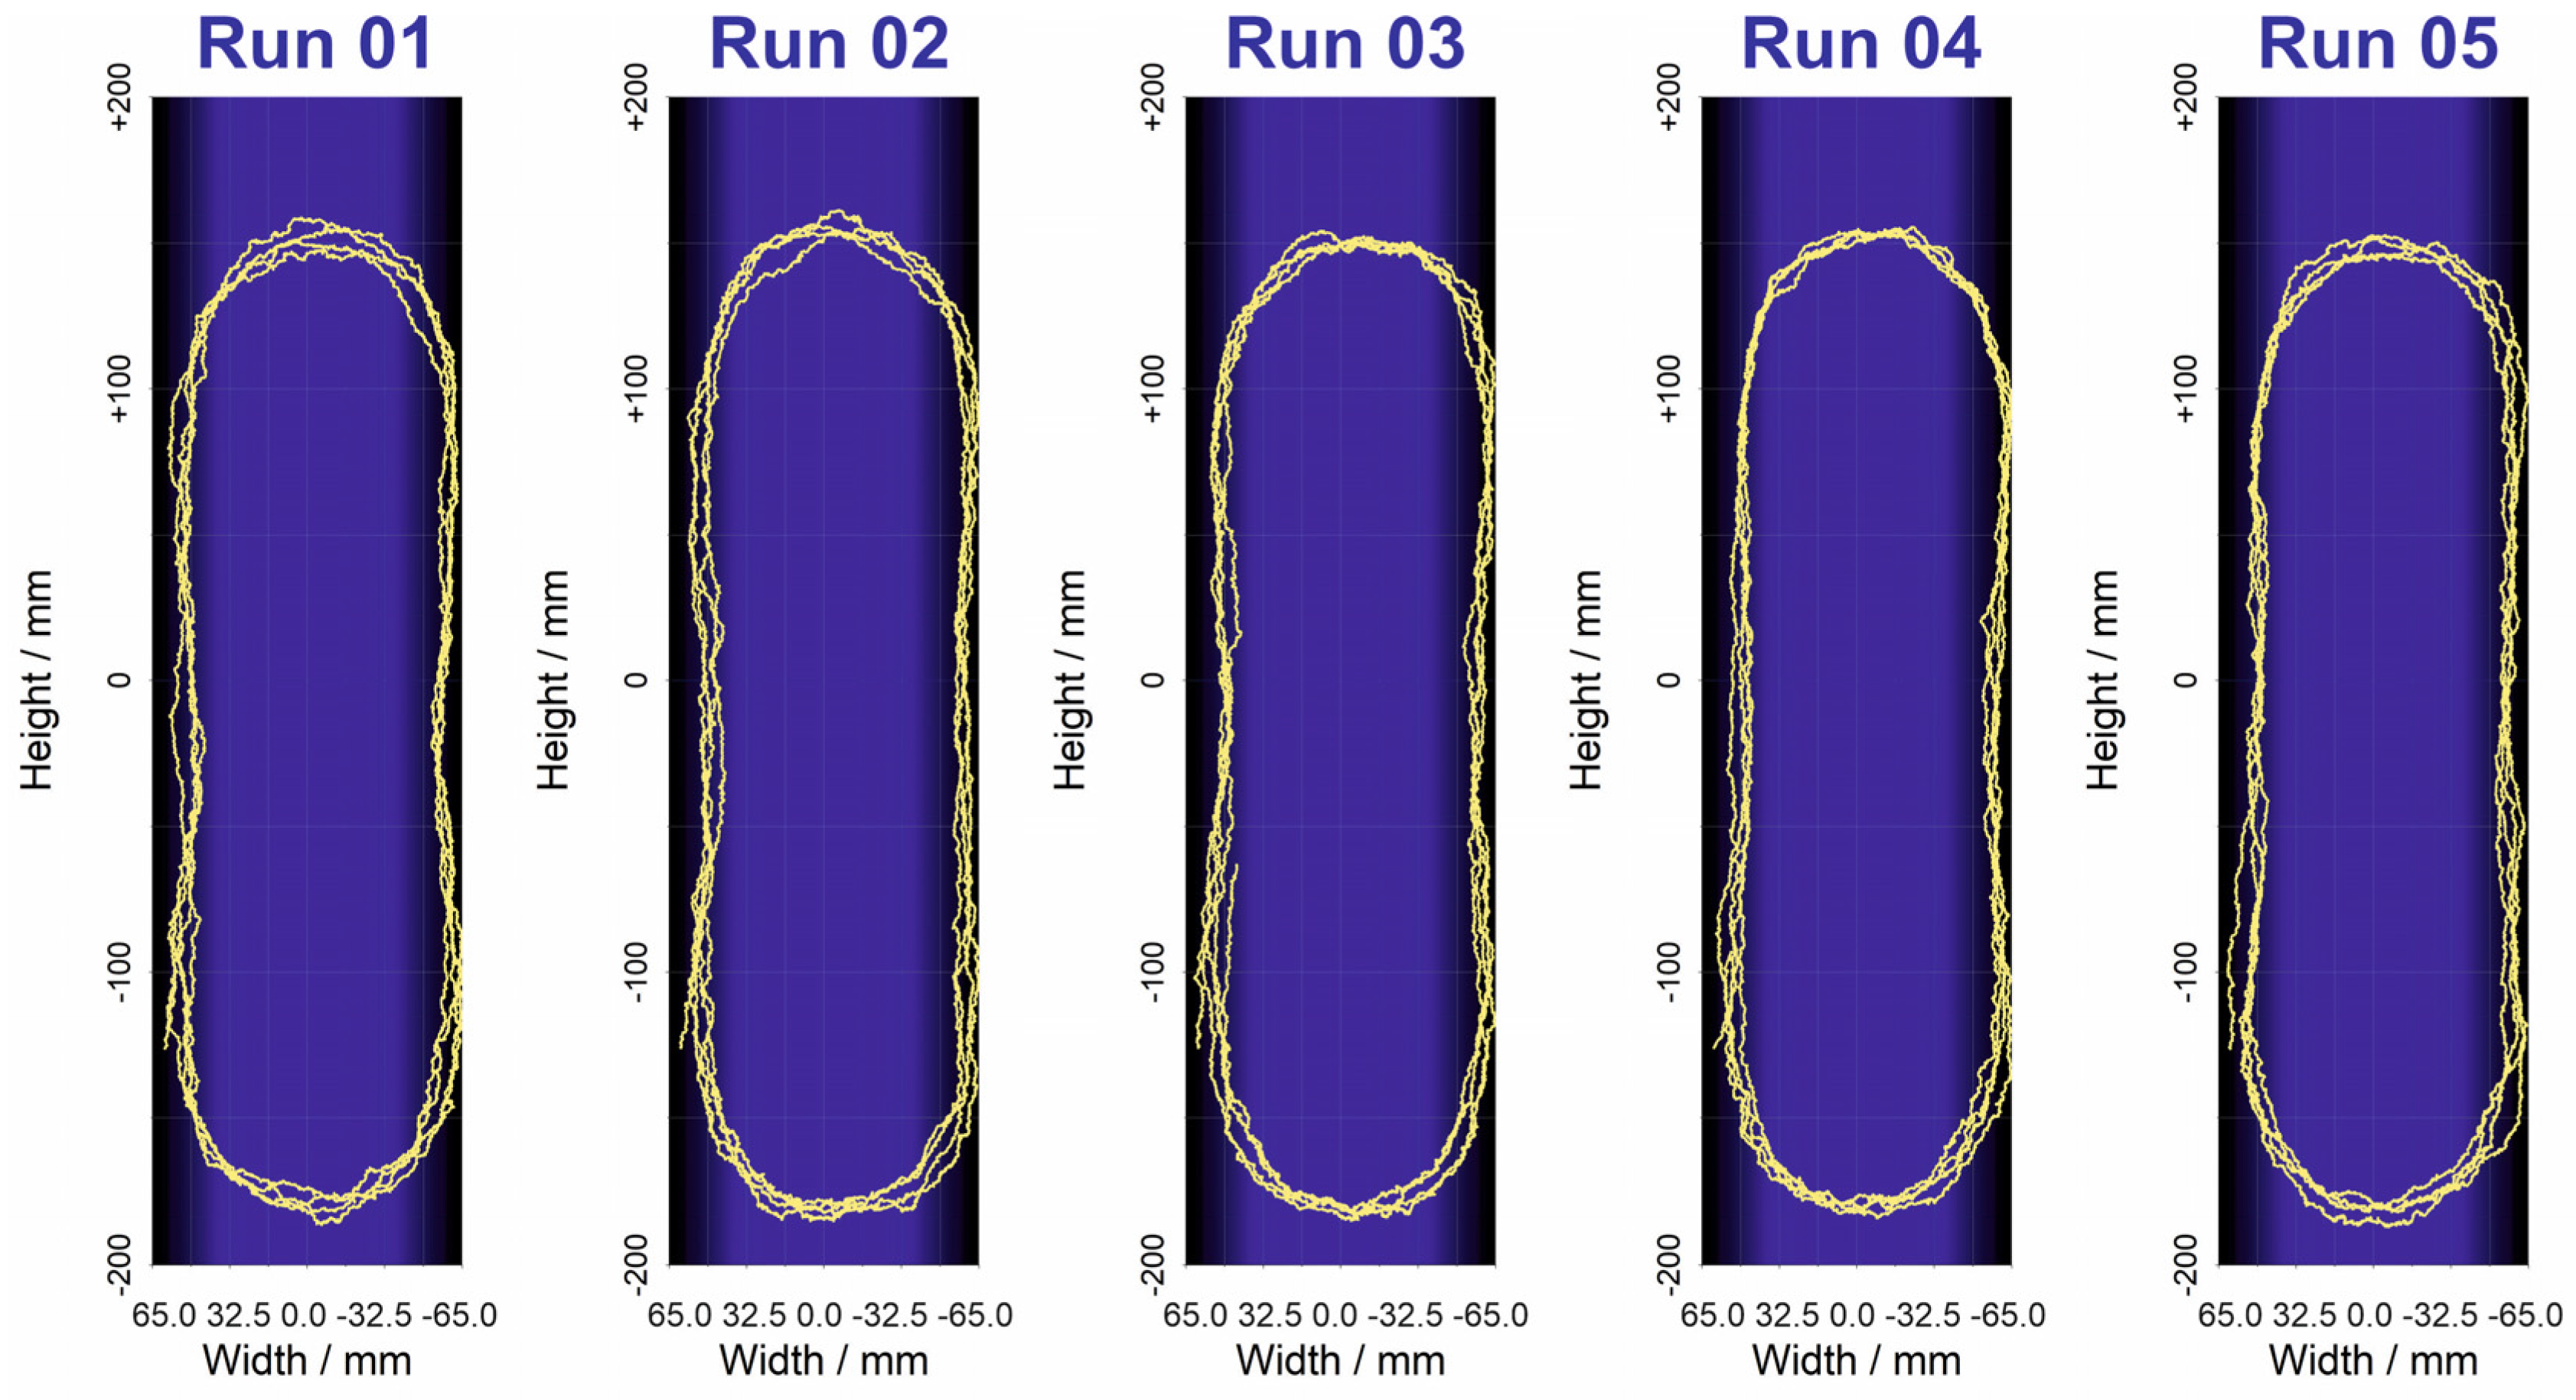
Figure 7b. Resultant spot tracks are shown in
Figure 8 for five different runs. Theses trails are calculated according to Equation (1). Additional reflection conditions are implemented for the case that the calculated spot coordinates fall outside the defined target dimensions. This empirical approach is in accordance with the experimental experience that the spot always remains inside the target area under normal operating conditions. The slight deviations of the calculated spot paths between the different runs obviously result from the stochastic random walk contribution.
The arc spot trails in
Figure 8 appear as continuous arc spot paths but in fact—as shown in
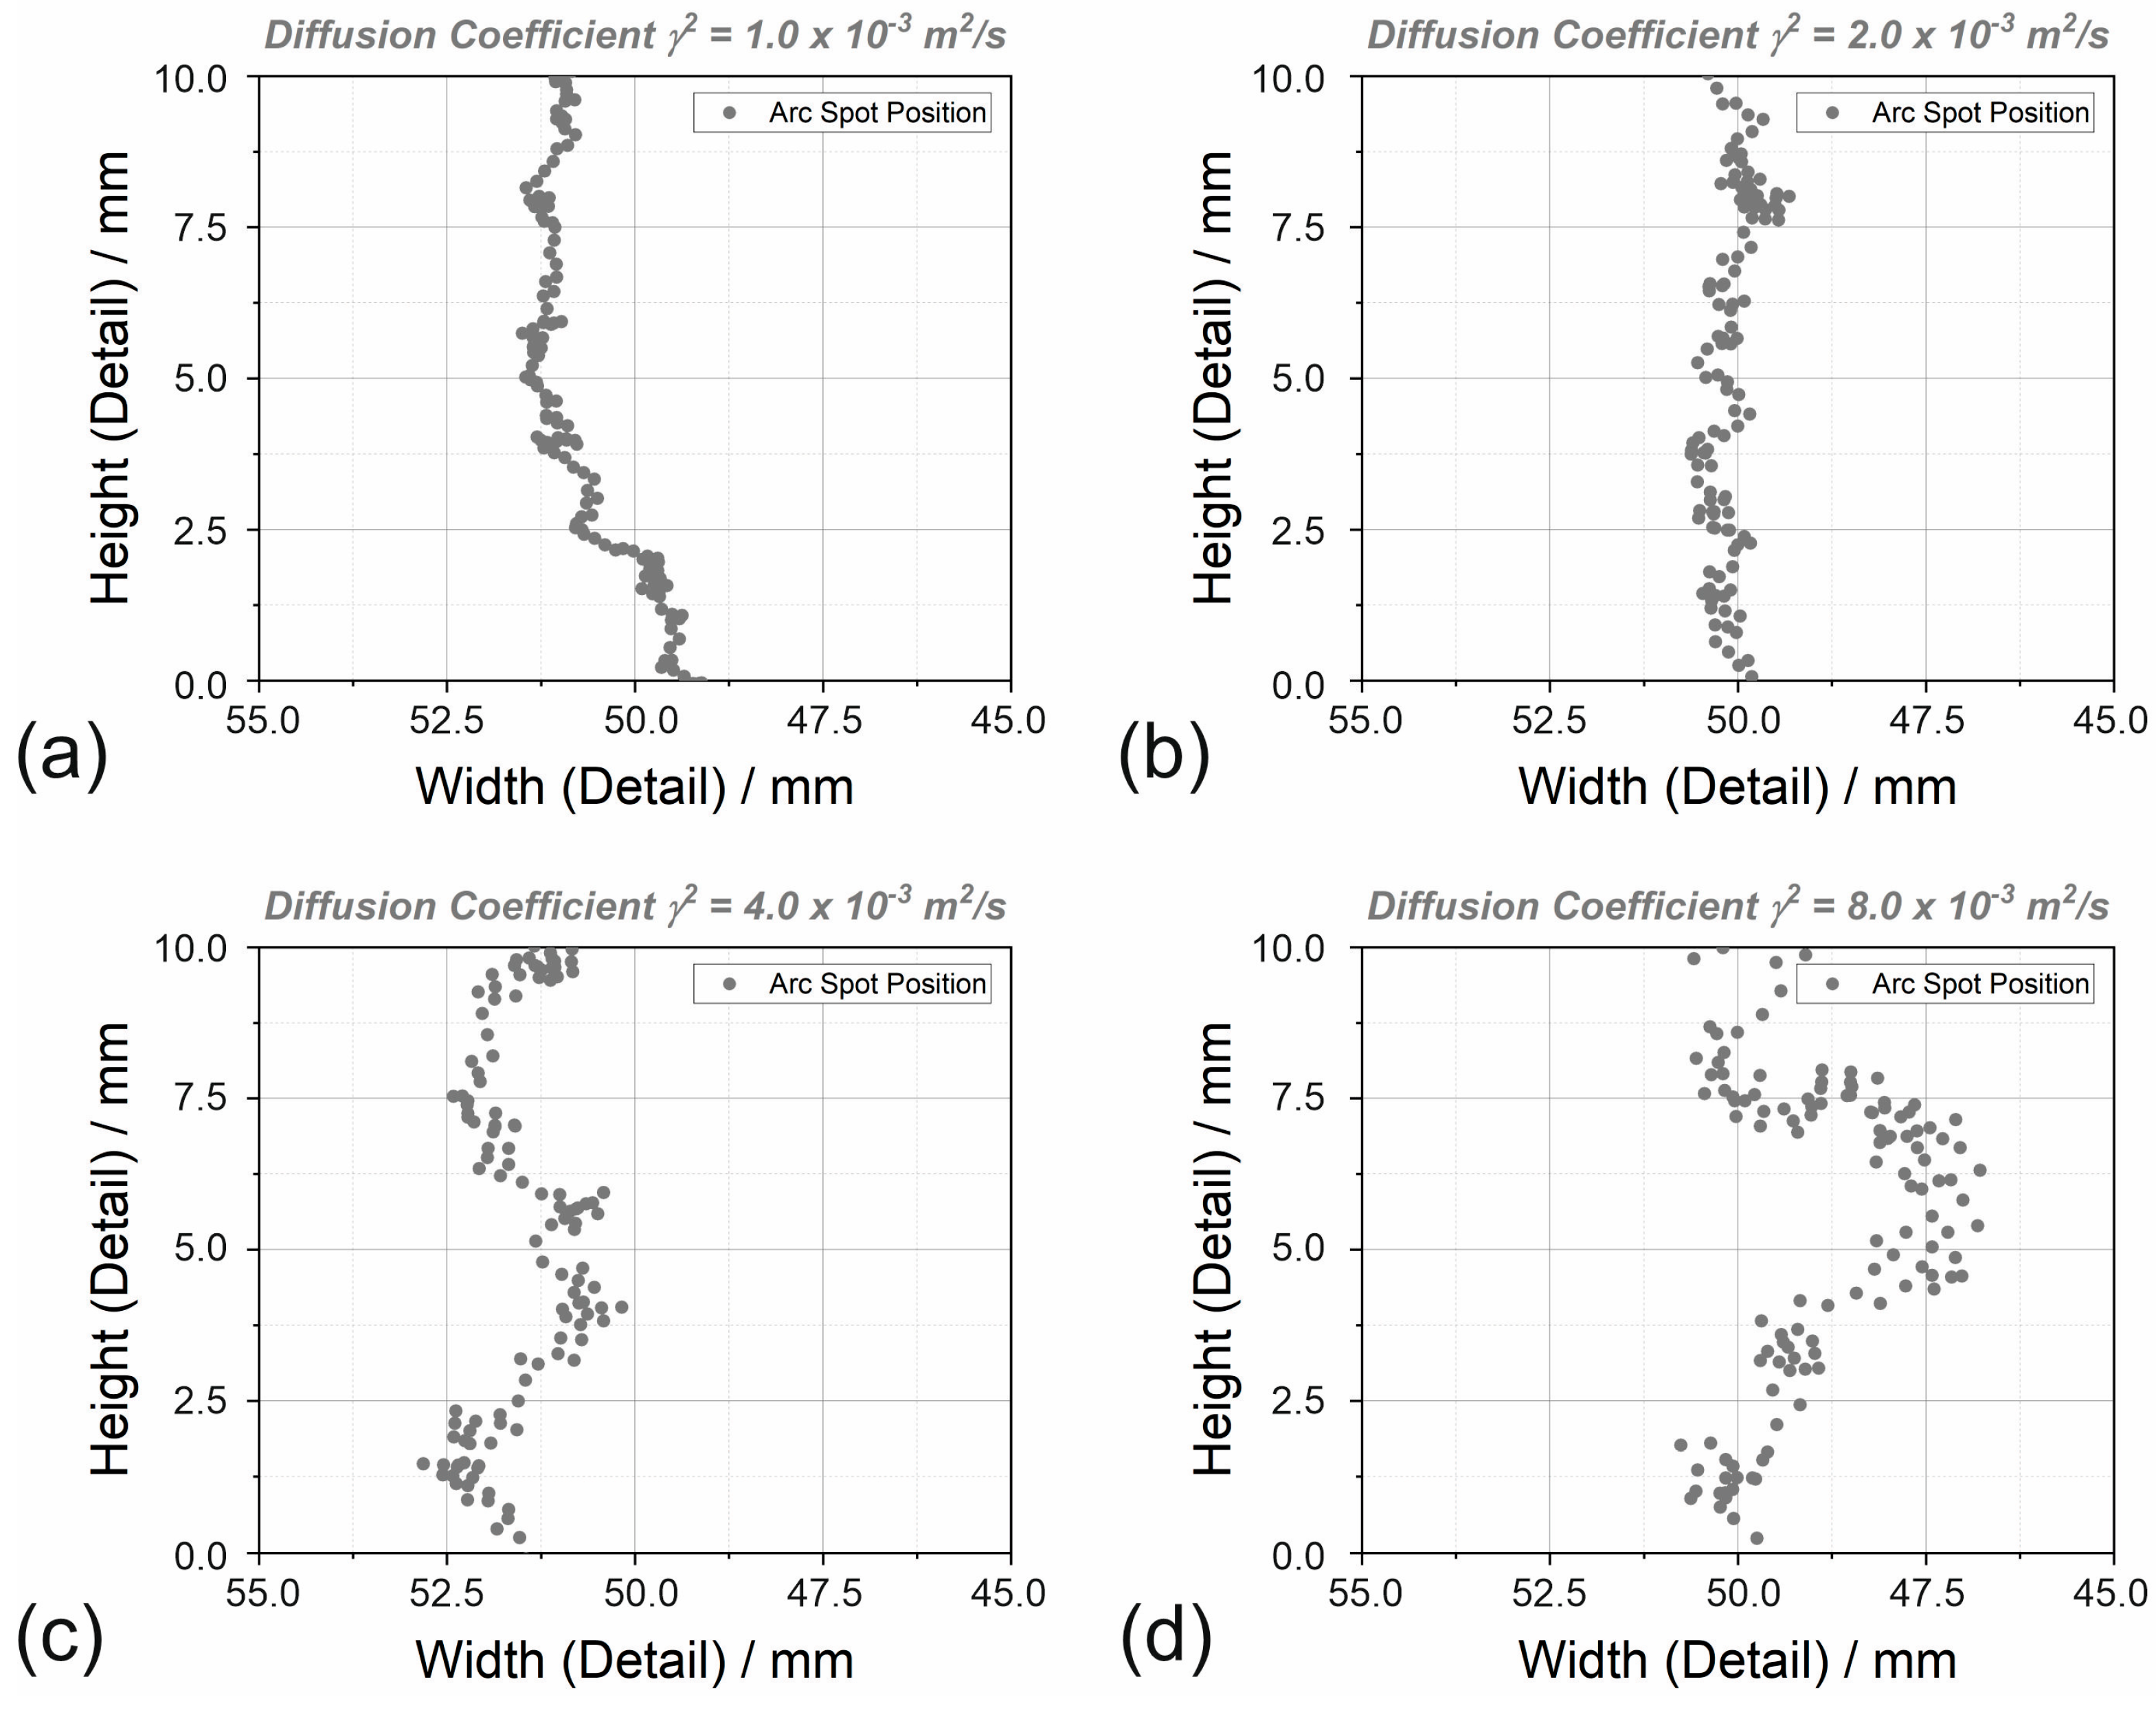
Figure 9 with a higher spatial resolution—the arc spot trail is composed from successive and discrete arc spot positions. This is a direct result of the implemented random walk algorithm with the defined displacements
according to Equation (10) from one position to the next and corresponds in an intriguing manner to the experimental observation that the arc spot dies after a particular burning time at one position and reignites at another position. For adequate time steps, the amount of displacement correlates with the diffusion coefficient of the material being processed as shown in
Figure 9 for different values of this coefficient as a measure of the spot mobility. Higher values cause higher spatial distances between consecutive locations of the spot and also larger deviations from the spot path of the steered magnetic field motion. This particular feature of the model principally opens up the possibility to determine appropriate values of the diffusion coefficient by setting up typical time cycles of the spot or by measuring and averaging the distances between two successive arc spot positions from experimental measurements.
For a given diffusion coefficient of the random walk motion, deviations from the steered spot path strongly depend on the applied strength of the magnetic field. This is shown in
Figure 10 for different attenuation factors
of the whole magnetic field, i.e., the distribution of the magnetic field is unchanged but the magnitude of the field strength was multiplied with the attenuation factor. Obviously, the magnetic field strength also influences the macroscopic spot velocity in accordance with the experimental experience. This particular feature of the arc spot motion means that for a given spot mobility, the range of magnetic field strengths is limited to a narrow range of suitable magnitudes to achieve the steered effect.
From a theoretical point of view, it was an interesting research question in which way or to what extent the Robson drift theoretically influences the computed arc spot motion because this characteristic feature of the arc spot motion was not explicitly investigated by experimental means. It is quite a beneficial feature of theoretical models that different effects can be easily included or excluded from the computation.
Figure 11 depicts the results of such an analysis and emphasizes the vital role of the Robson drift.
Figure 11a shows the distribution of the calculated Robson drift angle for the magnetic field configuration MF-01. The blue and stadium-like area indicates the peak region of the applied tunnel field with vanishing magnitudes of the axial component of the magnetic flux density. In addition to the Robson drift angle distribution, the resultant velocity field of the steered motion is also shown. In comparison,
Figure 11b depicts the velocity field for the case of a neglected Robson drift effect. The differences between the two velocity fields appear to be small at first sight. However, computed spot paths without consideration of the Robson drift—as shown in
Figure 11c—show clear differences to the spot paths in
Figure 10. Particularly, the arc spot paths show a higher degree of variance and it can be concluded that the action of the Robson drift needs to be considered in the model. This influence opens up a further possibility to calibrate the model with regard to the particular value of the Robson drift angle as a function of the magnetic field inclination with regard to the target surface. However, those investigations need very careful evaluations of the arc spot motion and are expectably very expensive with regard to experimental efforts. This is why those investigations were excluded from the current study of the development of a base model of the arc spot motion.
Nevertheless, the developed model allows for a phenomenological computation of the arc spot motion in good agreement with experimental observations. It is reasonable to assume that the experimentally determined values of the coefficients of magnetic velocity do not depend on a particular magnetic field distribution. As a direct result, the computed model is not limited to predictions of the arc spot motion for the magnetic field of the calibration procedure but allows investigation of the effect of different magnetic field configurations. As an example,
Figure 12a shows a magnetic field configuration that was designed to restrict the arc spot motion to a particular area of the target surface. Such a field distribution can be used to control the target erosion and/or the coating process. The resultant vector field of the corresponding velocity, as well as computed arc spot paths, are shown in
Figure 12b,c.
4. Discussion and Conclusions
A model was developed that simulates the spot motion of a vacuum arc under conditions of industrial PVD coating processes with magnetic control systems. In contrast to available previous studies which tried to explain the characteristics of the arc spot motion based on the first principles of arc and plasma physics, the current application-oriented study is based on a semi-empirical approach: features of the arc spot motion including the phenomena of random walk, retrograde motion, and Robson drift are described in accordance with the existing experience but need calibration of the introduced empirical coefficients to match experimental data. As a result, the developed model is able to describe the macroscopic behavior of the arc spot in a reliable quantitative way. However, the model is still limited to the operating conditions of the current study. It is expected that it also works under changed conditions of the process but always needs a new calibration with regard to the introduced empirical coefficients.
The intended main purpose of the current model is the calibration, evaluation, and optimization of magnetic field configuration with respect to magnitude and distribution to steer the arc spot in a desired way. This offers an important application field for the practice of vacuum arc deposition because an alternative experimental approach must be considered as a tedious and often challenging task because most industrial vacuum arc PVD chambers do not provide any possibilities to observe the arc spot motion in a direct visual way.
In addition, future directions of the further model development include a calibration of the model to different target materials (size and composition), different processing conditions (pressure, ambient gas), and different arc steering systems (e.g., in addition to coil systems, permanent magnet configurations can also be used to steer the arc). In addition to this main purpose of the model, characteristic delay times can also be determined from the calculated arc spot path as a function of time. In combination with appropriate energy and mass balance equations, theoretical projections of plasma composition and target erosion seem to be feasible.


