1. Introduction
In recent years, additive manufacturing procedures have gained great influence on the manufacturing industry on a global scale. The main advantages of 3D printing procedures are the ability to instantly manufacture composite and complex components and structures without specialized implements as well as reductions in material waste, time and manufacturing costs. In general, thermoplastic polymers are mostly utilized as 3D printing materials, especially using the fused filament fabrication (FFF) technique. However, thermoplastic polymers lack improved mechanical performance. For that reason, it is broadly recognized that there is a vast development increase in composite 3D printing filaments for complex applications as a consequence of their superb mechanical properties. In particular, the inclusion of advanced additives in the polymer matrix such as carbon fibers and glass fibers could improve/enhance the mechanical properties of 3D-printed structures.
For instance, Anwer et al. [
1] investigated the mechanical behavior of composite PLA reinforced with carbon nanofiber (CNF) specimens in different concentrations, particularly in 1, 3, 5, 10 and 15 wt%. The tensile modulus constantly increased with an increase in carbon nanofiber content (CNF) in the polymer matrix from PLA, reaching an increase of 42% for 15% wt CNF content compared to neat PLA. However, the tensile strength of composite specimens increased slightly up to 3 wt% carbon nanofiber content and then acquired a constant value—about 80 MPa for a higher CNF content in the PLA polymeric matrix. This is because tensile strength depends much more on the strength of the matrix-reinforcing component interface than the measure of elastic modulus. The CNF-PLA interface was not strong, and for this reason, there was fiber disconnection. Therefore, the weak shear strength of the surfaces is probably the reason why the tensile strength did not show a significant increase in higher CNF contents.
Yao et al. [
2] studied the mechanical properties of printed carbon-fiber-reinforced PLA structures. Based on the results of the uniaxial tensile and three-point flexural tests, the continuous carbon fibers significantly improved the mechanical strength of the 3D-printed structures; particularly, an increase of over 70% was observed for the tensile strength and 18.7% for the flexural strength, respectively. Also, a weight reduction of up to 26% as well as a reduced printing time of up to 11.41% was achieved without reducing the tensile strength.
According to a study by Ferreira et al. [
3], the incorporation of short carbon fibers (CFs) into the PLA polymer matrix resulted in an increase in the elastic modulus of the test specimens compared to unfilled thermoplastic PLA specimens in both the 0° and 90° printing directions, respectively. In particular, the value of the elastic modulus for PLA without any addition was equal to 3376 MPa, and after carbon fiber reinforcement, the value of the elastic modulus reached 7541 MPa for a print direction at 0°. As in the print direction of 0°, the print direction of 90° revealed an increase in the elastic modulus with the inclusion of carbon fibers in the polymeric PLA matrix; specifically, the elastic modulus of the neat PLA, which was equal to 3125 MPa, increased to 3920 MPa. Regarding the tensile strength, the results of the study showed that for both the 0° and 90° printing directions, the admixture of carbon fibers in the PLA polymer matrix did not lead to an increase in strength compared to PLA without any addition. In contrast, the tensile strength of neat PLA for both print directions was slightly higher than that of PLA/CF.
Shofner et al. [
4] fabricated composite specimens from acrylonitrile butadiene styrene (ABS) reinforced with carbon nanofibers through the fused filament fabrication (FFF) method. The results revealed that there was an average increase of 39% and 60% in tensile strength and tensile modulus, respectively, for 10 wt% of carbon nanofibers, compared to ABS specimens without any inclusions. Also, the composite specimens showed a drastic reduction in elongation at failure, as the breaking mode changed from ductile to brittle. The brittle behavior resulted from the low resistance to fiber detachment as well as the reduced fusion between the layers.
Yang et al. [
5] manufactured composite specimens using acrylonitrile butadiene styrene (ABS) reinforced with 10 wt% carbon fiber via 3D printing. The flexural and tensile strength of the composite test specimens was improved and increased by 127 MPa and 147 MPa, respectively, compared to acrylonitrile butadiene styrene (ABS) specimens without any addition. Additionally, Tian et al. [
6] fabricated specimens from continuous carbon-fiber-reinforced PLA. The results showed that in composite specimens with 27 wt% continuous carbon fiber in the polymer matrix made of PLA, the maximum flexural strength and flexural modulus were achieved, which were equal to 335 MPa and 30 GPa, respectively. Van der Klift et al. [
7] printed tensile specimens of polyamide reinforced with continuous carbon fibers in different percentages. The results were quite promising for the composite specimens with the highest carbon fiber percentages, both for tensile modulus and tensile strength, respectively.
Also, Karakoç et al. [
8] conducted tensile experiments to study the mechanical behavior of neat polylactic acid (PLA) test specimens, nanodiamond-enhanced polylactic acid (uDiam-PLA), polyamide without any impurity (PA6/66) and glass-fiber-reinforced polyamide (GF-PA6) specimens. According to the results, with the incorporation of nanodiamonds in the polymeric matrix of polylactic acid (PLA), there was an increase in the elastic modulus of the composite specimens, while finally, a small increase in tensile strength was observed for PLA without any addition compared to uDiam-PLA.
Liao et al. [
9] fabricated composite specimens of the polyamide 12 (PA12) carbon-fiber-reinforced polymer (CF) matrix in various percentages (0, 2, 4, 6, 8, 10 wt% carbon fibers) and then investigated the mechanical properties of composite specimens through tensile and flexural experiments. In these experiments, it was observed that the incorporation of carbon fibers in the polymeric matrix PA12 led to a significant increase in the tensile strength as well as the tensile modulus of composite specimens compared to PA12 without any addition. Specifically, the mixture of the polymeric matrix PA12 with 10 wt% carbon fibers led to an increase in the tensile strength of the composite specimens from 46.4 MPa to 93.8 MPa, which reflects an improvement of 102.2%. Similar to the tensile strength, in the tensile modulus, a significant increase was observed with the admixture of carbon fibers in the polymer matrix, specifically from 978.8 MPa to 3581.1 MPa. On the contrary, the elongation at break showed a sharp drop, from 192.1% to 8.1% after the addition of carbon fibers. The same work presented the bending properties of the composite specimens. The outcome disclosed that the addition of carbon fibers to the polymer matrix significantly improved the flexural strength as well as the flexural modulus of the composite specimens. By adding 10 wt% carbon fibers in the polymer matrix, an increase in flexural strength and flexural modulus was observed, particularly from 35.6 MPa to 124.9 MPa and 1178.75 MPa to 5257.6 MPa, respectively. After adding 2, 4, 6, 8, 10 wt% carbon fibers in the polymer matrix, an increase in the flexural strength of the specimens was observed by 50.0%, 98.7%, 168.4%, 203.1% and 251.1% compared to unfilled PA12 specimens, respectively. Also, the flexural modulus increased by 53.0%, 116.7%, 252.7%, 278.9% and 346.0%, respectively. The above results show that the carbon fibers effectively reinforce the polymeric matrix PA12 due to the homogeneous dispersion and the good connection between the matrix and the reinforcing component. Finally, the fracture surface of the composite specimens was examined by scanning electron microscopy (SEM) to understand the effect of the reinforcing component on the carbon-fiber-reinforced PA12 composite specimens. SEM micrographs showed that the carbon fibers were incorporated into the polymer and covered by the matrix, facilitating the adequate transfer of the load to the carbon fibers as well as increasing the tensile strength and the tensile modulus.
Moreover, combining such advanced materials with honeycomb constructs can potentially lead to lighter and more robust structures with better mechanical behavior. Honeycombs can be utilized in sandwich structures in cases where a combination of high strength and lightweight construction is required. Polymers reinforced with fibers or particles, hard foam polymers, metals, glass fibers or stone wool impregnated with polymer resin are usually used as cores in sandwich structures.
Honeycomb structures frequently display composite orders of hierarchy while each hierarchical level affects the mechanical stability and sturdiness of the final design. Ajdari et al. [
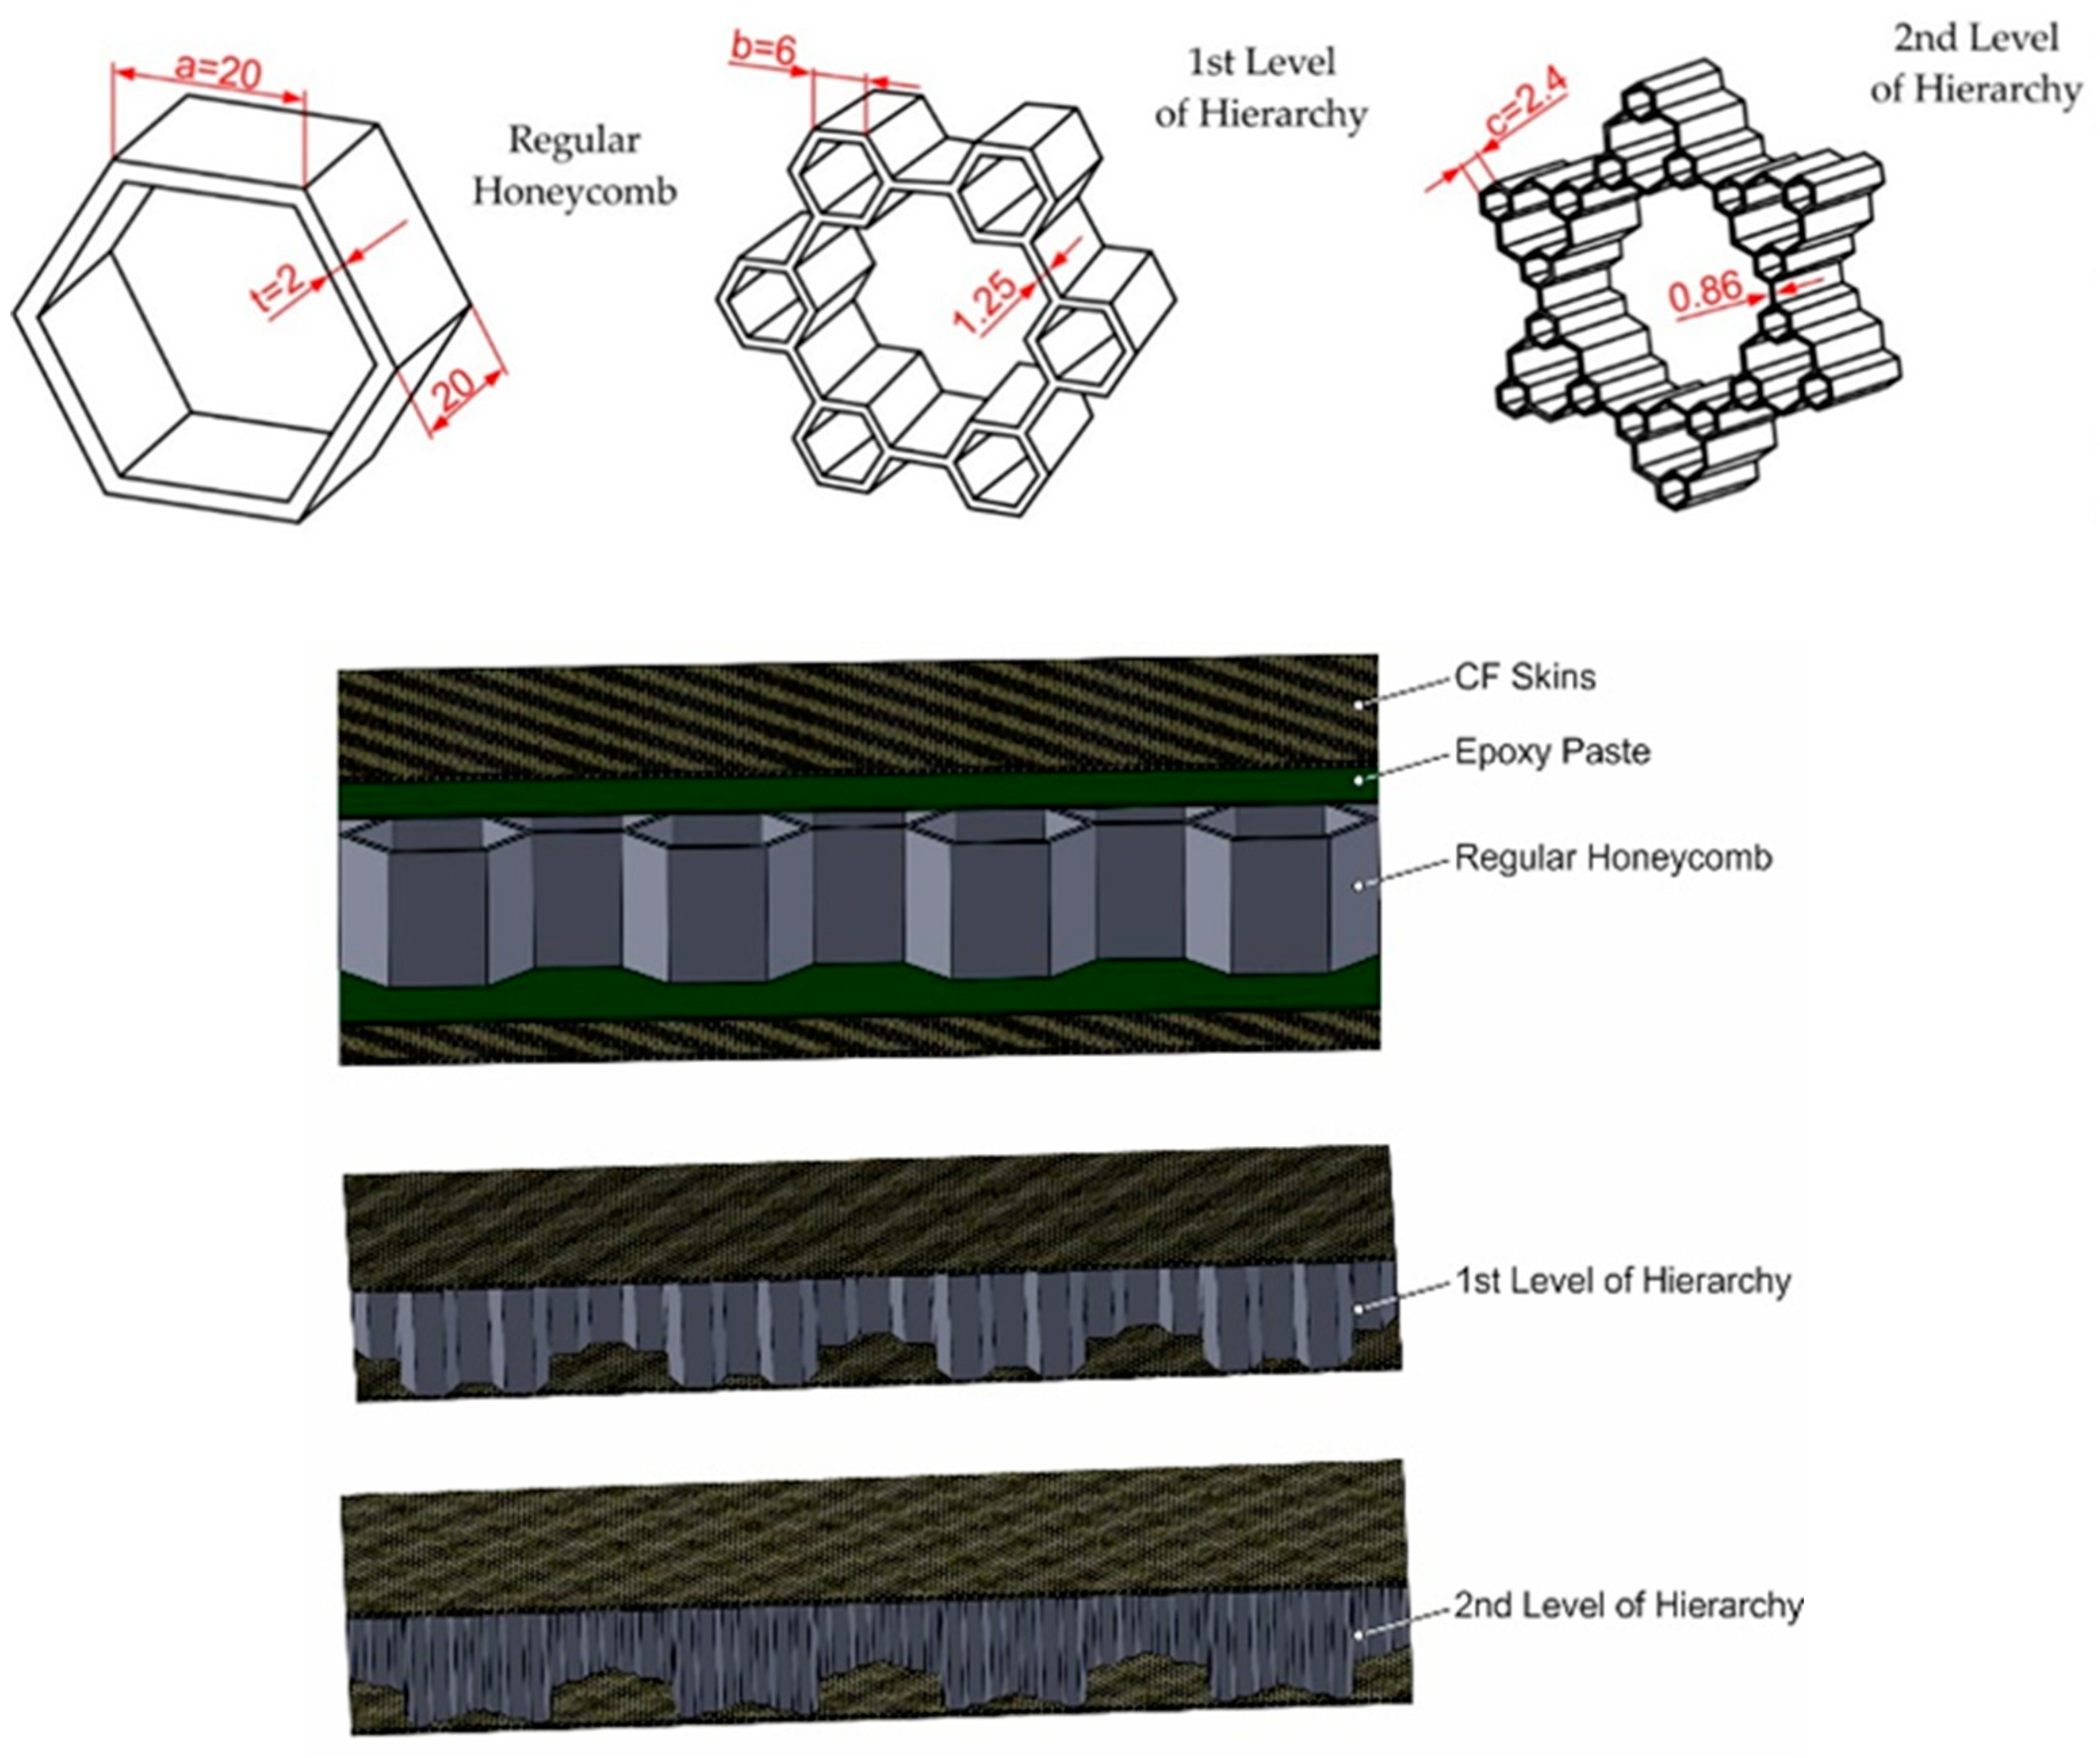
10] studied the mechanical behavior of hierarchical honeycomb structures, particularly the regular hexagonal structure (zeroth hierarchy), the first hierarchy and the second hierarchy, with the same relative density. The results of their research revealed that the honeycomb structures of the first hierarchy and the second hierarchy showed up to 2 and 3.5 times more robustness, respectively, compared to the regular hexagonal structure with the same mass (same total average density).
Mozafari et al. [
11] studied the compressive behavior of foamed aluminum cellular structures and, after evaluating the results, observed much greater robustness compared to simple cellular structures. In addition, Paik et al. [
12] examined the maximum strength of aluminum sandwich cellular structures of different thicknesses as well as different core heights through three-point bending and compression experiments.
Furthermore, Song et al. [
13] proposed a new type of sandwich structure, in particular, the Kagome sandwich honeycomb structure. This structure had special properties, such as high strength, robustness, easy processing and low cost, but also showed a significant drawback—the ease of detachment between the outer sheets and the core as well as the weak edges, of which significantly reduced the strength and rigidity of the structure. The innovative proposal of this research is the filling of high-strength PMI foams inside the complex Kagome cellular structure to create a new type of sandwich structure. The proposed structure (PKCSS) was compared with the PMI and Kagome sandwich structures through three-point bending and compression experiments. The compressive and flexural behavior of the proposed structure was examined experimentally as well as theoretically through finite element analysis. The results showed that the proposed sandwich structure significantly improved the overall strength and robustness compared to the other two sandwich structures, with a small weight gain. Specifically, the compressive strength for the proposed sandwich structure was 420 MPa as opposed to 197 MPa for the Kagome sandwich structure and 203 MPa for the PMI sandwich structure. Also, the shear strength of the core for the proposed sandwich structure was estimated at 5.9 MPa, while for the Kagome sandwich structure, the shear strength was 2.6 MPa, and for the PMI sandwich structure, 2.9 MPa, respectively. Furthermore, the limitations of the weak ends of the Kagome cellular structure were effectively overcome. The proposed structure also presented a significantly enhanced anti-detachment capacity.
Tao et al. [
14] constructed square hierarchical honeycombs using a commercial 3D printer and then studied the mechanical properties of the structures under consideration. The square hierarchical structures were constructed by replacing each cellular wall of a regular square honeycomb structure with different numbers of smaller square structures. The results revealed an increased compressive strength for the square hierarchical structures compared to the normal square structures of the same mass.
Chen et al. [
15] studied a group of hierarchical metallic structures constructed by replacing the cellular walls of normal cellular structures with hexagonal, Kagome and triangular grids, respectively. The Kagome structures and triangular hierarchical structures showed remarkable mechanical properties, and in particular, increased robustness and strength compared to normal cellular structures. Their analysis revealed that the improved mechanical properties of the examined hierarchical structures are attributed to the introduction of the structural hierarchy.
Harizi et al. [
16] investigated the flexural behavior of various carbon-fiber-reinforced sandwich composite thermoplastic structures through three-point bending tests. The outer sheets (skins) were made of thermoplastic polyphenylsulfone (PPSU) carbon-fiber-reinforced resin. Also, different core materials (Nomex, aluminum and polyetherimide PEI) with different topological characteristics (honeycomb, straight tubular and inclined tubular at 15°) and two different densities (48 and 64 kg/m
3) were used to construct the examined sandwich structures. The results showed that the sandwich structure with aluminum core showed the highest stiffness compared to the other sandwich structures. However, the sandwich structures with a PEI core showed the highest plasticity.
Sun et al. [
17] investigated the mechanical properties of sandwich structures with an aluminum honeycomb core through compressive and three-point bending experiments. The experimental results showed that the fracture and reliability of the sandwich structures were significantly affected by the structural parameters under the three-point bending test. They also found that compressive behavior can be influenced by structural parameters as well as the gluing parameters in the compression test. Based on the experimental results, theoretical solutions were defined for the three-point bending experiment to predict the maximum load, energy absorption and fracture mode.
Sun et al. [
18] studied the mechanical behavior of three sandwich structures with carbon-fiber-reinforced sheets. Specifically, the three examined sandwich structures were first the sandwich structure with a honeycomb core, then the lattice sandwich structure and finally the sandwich structure with a combination of a honeycomb and lattice core. The honeycomb and lattice core of the examined sandwich structures was made of aluminum. The experimental results of the research revealed that sandwich specimens with a combination of honeycomb and lattice core presented high strength, robustness and energy absorption capacity, which are particularly features for a variety of aerospace applications, the automotive industry and in other sectors where the use of lightweight structures with superior mechanical properties are considered necessary. Also, the results of research disclosed that the interaction between the honeycomb and the lattice core provided a high tolerance for damage compared to the single core. The combination of honeycomb and lattice core prevented both interfacial detachment and local buckling of the core. A finite element model (FEM) was then proposed for the calculation of a critical bending load of sandwich structures with a combination of honeycomb and lattice core. Finally, the experimental and theoretical outcomes divulged that the sandwich structure with a combination of honeycomb and lattice core can offer improved structural properties for various mechanical constructions.
Chen et al. [
19] designed and manufactured a new class of hierarchical honeycomb structures through 3D printing. Then, there was an investigation of the compressive behavior of the new order of hierarchical honeycomb structures, which was created after the replacement of the cellular walls of the regular honeycomb structure with triangular grids. The proposed hierarchical honeycomb structures presented particularly increased stiffness as well as improved energy absorption capacity under uniaxial compression. Specifically, it was observed that the stiffness of the hierarchical honeycomb structures is 6.6 times higher than that of the regular honeycomb structure, for the same relative density (ρ/ρs = 0.16) in both cases. The improved stiffness and energy absorption capacity of hierarchical honeycomb structures were related to the introduction of the internal triangular lattice structure into the regular honeycomb structure. In addition, the hierarchical honeycomb structures presented high energy dispersion and shape integrity in large, imposed deformations (up to 60%) under cyclic loading.
This work presents a research study that investigates the mechanical and dynamic behavior of 3D-printed materials and hierarchical honeycombs made from PLA, PLA/uDiamond, and PLA/CF. It is widely acknowledged that using standardized testing protocols for the mechanical characterization of materials is important. ASTM D638, for example, is commonly employed for testing the tensile properties of plastics. This test, although basic and commonly used in the literature, does not provide any experimental testing novelty. In the current study, the focus was on more advanced materials testing procedures such as nanoindentation, quasi-static and cyclic compression, as well as modal analysis testing along with testing of complex hierarchical sandwich structures. These tests offer unique and interesting research data to the readers. Furthermore, these advanced experimental tests hold potential for further exploitation in the future with different materials. The investigation also involves a combination of experimental tests and simulations, which can provide valuable insights into the design and development of new and improved materials for various applications. The results of this study demonstrate the potential benefits of using nanodiamonds and hierarchical structures to enhance the mechanical properties of 3D-printed materials, which can have important implications for the field of materials science and engineering.
2. Materials and Test Methods
2.1. Materials and Fabrication of Examined Specimens
The materials utilized in the present study are polylactic acid (PLA), PLA reinforced with nanodiamonds (PLA/uD, Carbodeon Ltd., Vantaa, Finland), whose weight percentage is 0.5 wt%, as well as PLA reinforced with carbon fibers (PLA/CF) in a weight percentage of 15%. The fabrication of 3D-printed specimens was achieved through a commercial open-source Ultimaker 2+ 3D printer via the fused filament fabrication (FFF) method. The examined specimens were cylindrical with a diameter and thickness of 29 mm and 12.5 mm, respectively. In addition, the Ultimaker Cura software (Ultimaker, Utrecht, The Netherlands) was used to define the printing parameters of the printed specimens. Some basic printing parameters used in the current paper were a 2.85 mm extrusion nozzle; a nozzle diameter of 0.6 mm, which was made of hardened steel for the abrasive reinforcing nanoparticles and fibers used; a printing temperature of 200–240 °C; a build-plate temperature of 55–90 °C and a print speed of 35 mm/s. In particular, the printing and build-plate temperatures for the PLA specimens were 200 °C and 60 °C, respectively. Also, the printing and build-plate temperatures for PLA/uD specimens were 240 °C and 55 °C, respectively, while the respective temperatures for PLA/CF were 230 °C and 90 °C.
2.2. Design and Manufacturing of Printed Hierarchical Honeycomb Structures + SKINS
Hierarchical honeycomb structures were designed in Solidworks™ CAD software (Dassault Systemes, SolidWorks Corporation, Waltham, MA, USA) and exported as an STL file. The manufacturing of FFF-printed honeycomb structures was accomplished by using a commercial open-source BCN3D Sigma R17 (BCN3D, Barcelona, Spain) 3D printer with a 2.85 mm extrusion nozzle; Ultimaker Cura was used as slicing software. The deposition line (layer) had a height of 0.2 mm, and the deposition line width was 0.4 mm. The selection of a constant extrusion velocity for all specimens was based on device parameters, and the deposition speed was not varied in this study. It is worth noting that high printing speeds have been reported to cause adhesion problems in 3D printing, which could negatively impact the mechanical properties of the printed parts [
20]. Therefore, the optimal printing speed of 40 mm/s for manufacturing the honeycomb cores was carefully chosen to ensure proper adhesion and mechanical performance. Additionally, all specimens were fabricated in room temperature conditions. The final FFF-printed core of the sandwich structures had a length of 190 mm, width of 90 mm and height of approximately 18 mm. The composite skins were manufactured using an epoxy resin EPIKOTE™ Resin 828 LVEL hardened with the appropriate amount of EPIKURE™ Curing Agent 866 and EPIKURE™ Catalyst 101 reinforced with TORAYCA T700S twill carbon fiber materials. Three layers of 0.3 mm thick were vacuum-infused with the epoxy resin, achieving a thickness of 1 mm. A symmetrical composite-woven laminate was formed with a stacking sequence of ±45°, 0°/90°, ±45°. The composite skins were glued, using an epoxy paste, to the 3D-printed hierarchical cores, as portrayed in
Figure 1.
2.3. Compressive Experiments
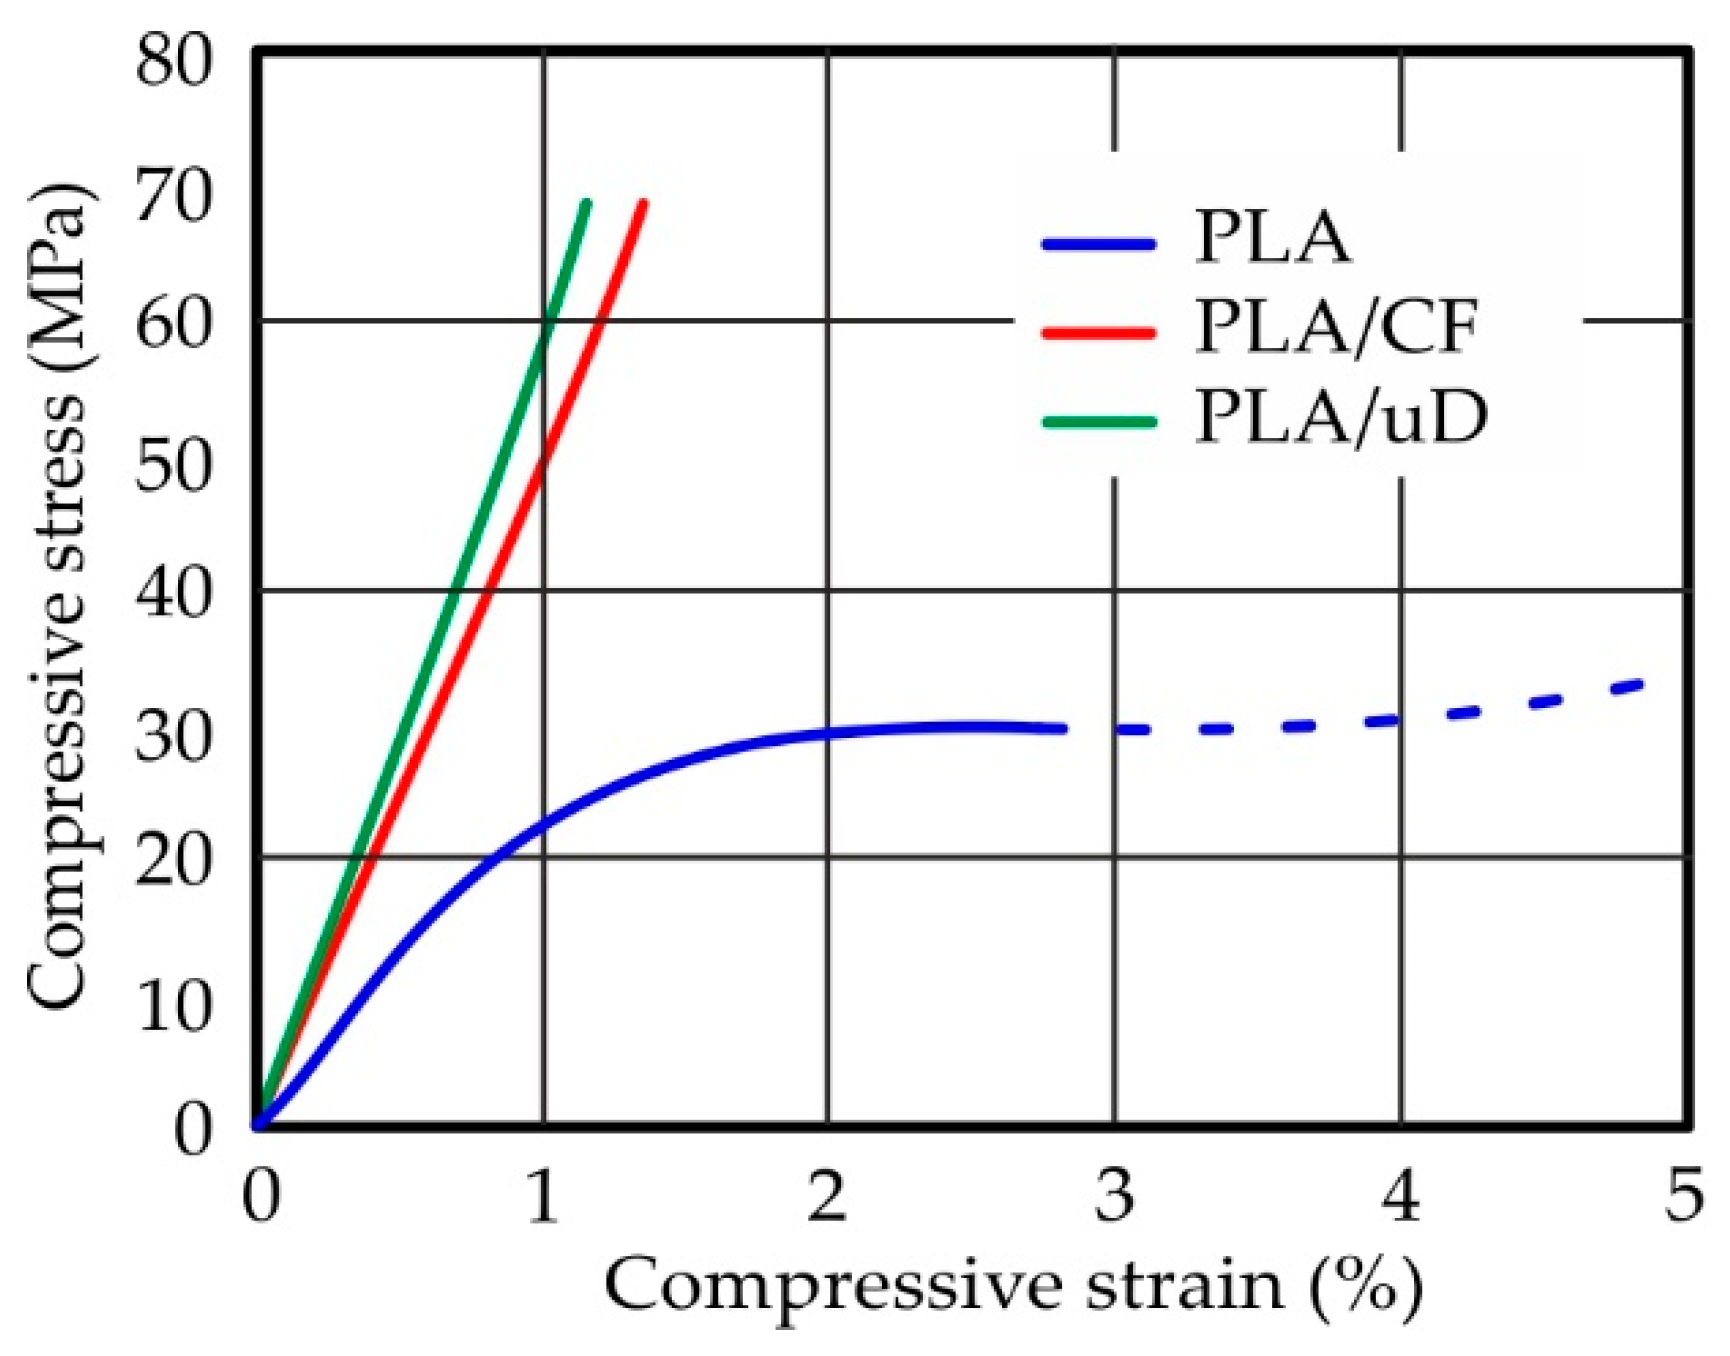
The compressive behavior of the printed specimens was evaluated by a universal mechanical testing machine (Testometric M500-50 AT, Rochdale, United Kingdom) equipped with a 50 kN load cell. For each material, five sets of compressive tests were performed to obtain a satisfactory approach. The experiments were performed at a strain rate of 5 mm/min.
2.4. Cyclic Compressive Experiments
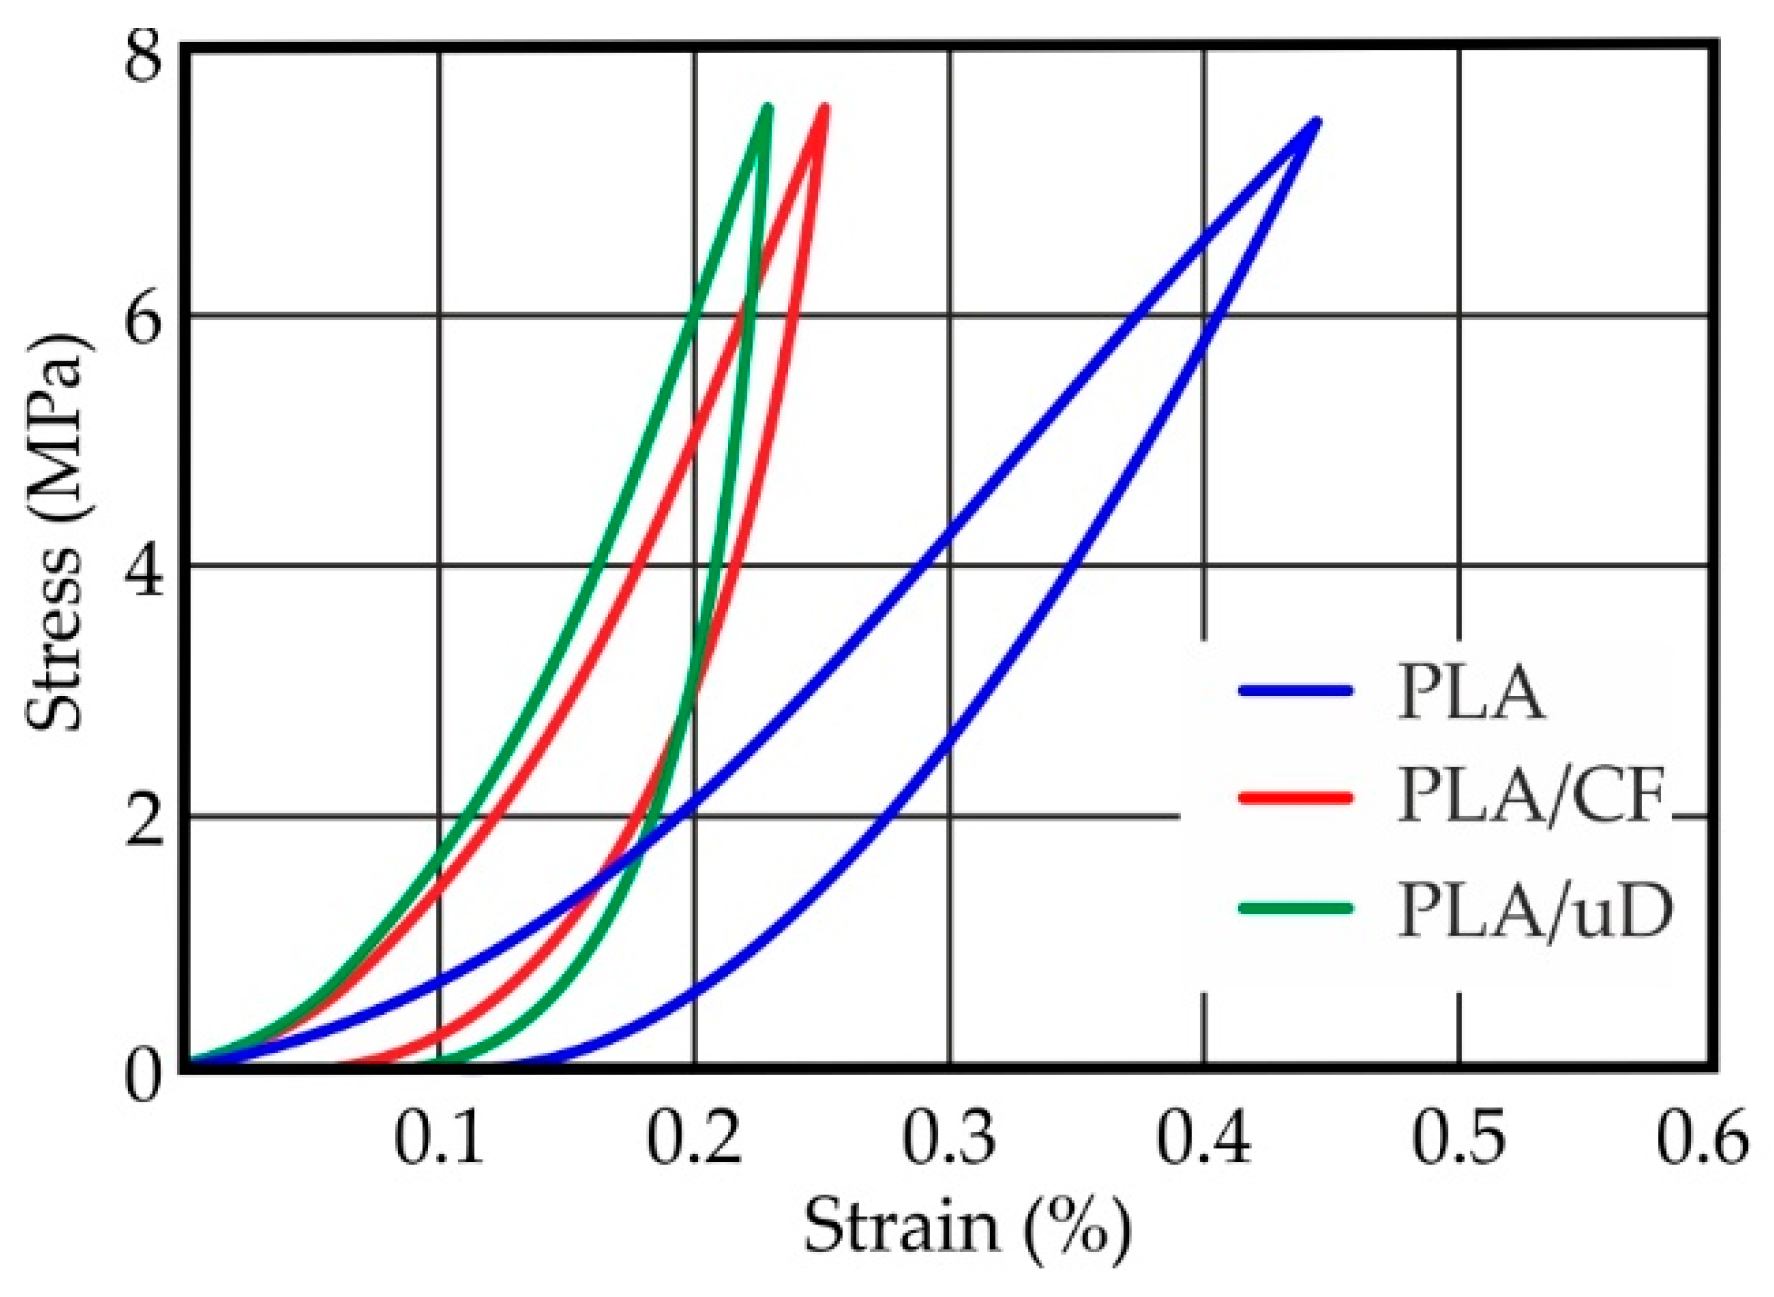
Cyclic compression tests were conducted with a constant strain rate for the loading and unloading phase, and all experiments were performed at an ambient temperature. In particular, all measurements were performed using the same testing machine as compressive experiments with a peak load up to 5 kN and a frequency of 0.01 Hz. The speed of the load cell during the loading and unloading phase was set constant with an exact value of 5 mm/min. In addition, the dimensions of the 3D-printed cylindrical samples for cyclic compression testing were the same as those used in compressive tests. At least five 3D-printed samples were investigated under the cyclic compressive regime. In this quasi-static regime, the stress–strain performance was acquired during the loading–unloading stage, and all of the samples displayed hysteretic behavior. The energy loss in each loading cycle was measured by the area of the corresponding hysteresis loops.
2.5. Nanoindentation Experiment
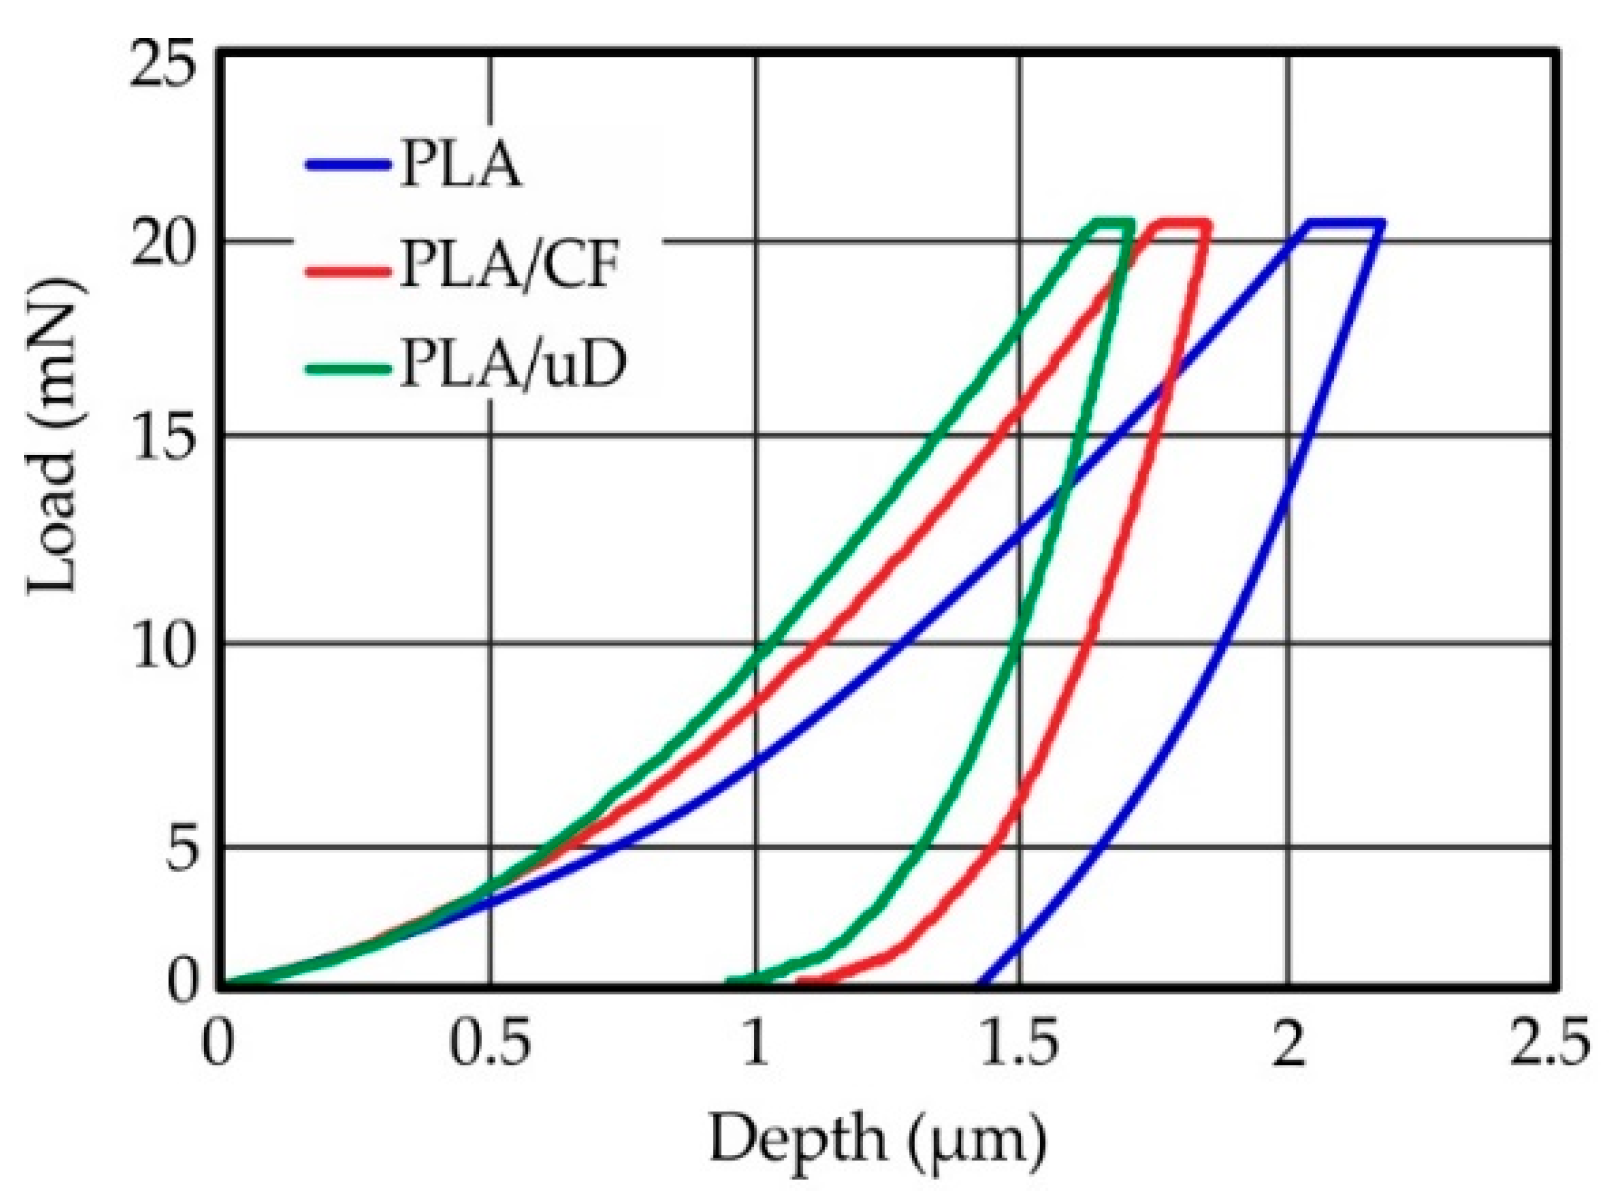
The nanomechanical properties of PLA, PLA reinforced with nanodiamonds (PLA/uD), and PLA reinforced with carbon fiber (PLA/CF) filaments were investigated using nanoindentation. A dynamic ultra-microhardness tester DUH-211 (Shimadzu Co., Kyoto, Japan) utilizing a 100 nm radius triangular pyramid indenter tip (Berkovich-type indenter) was used to determine the mechanical performance of PLA nanocomposites. During nanoindentation testing, a controlled load with a peak load of 20 mN was applied through a diamond tip on the surface of the nanocomposite filaments and was held for 3 s. As a function of load, the indentation depth was recorded. The indenter was then unloaded, resulting in a load of zero. During the creep time, the maximum indentation load was applied to the indenter. The average value of ten measurements was used to calculate the modulus and hardness.
2.6. Modal Tests
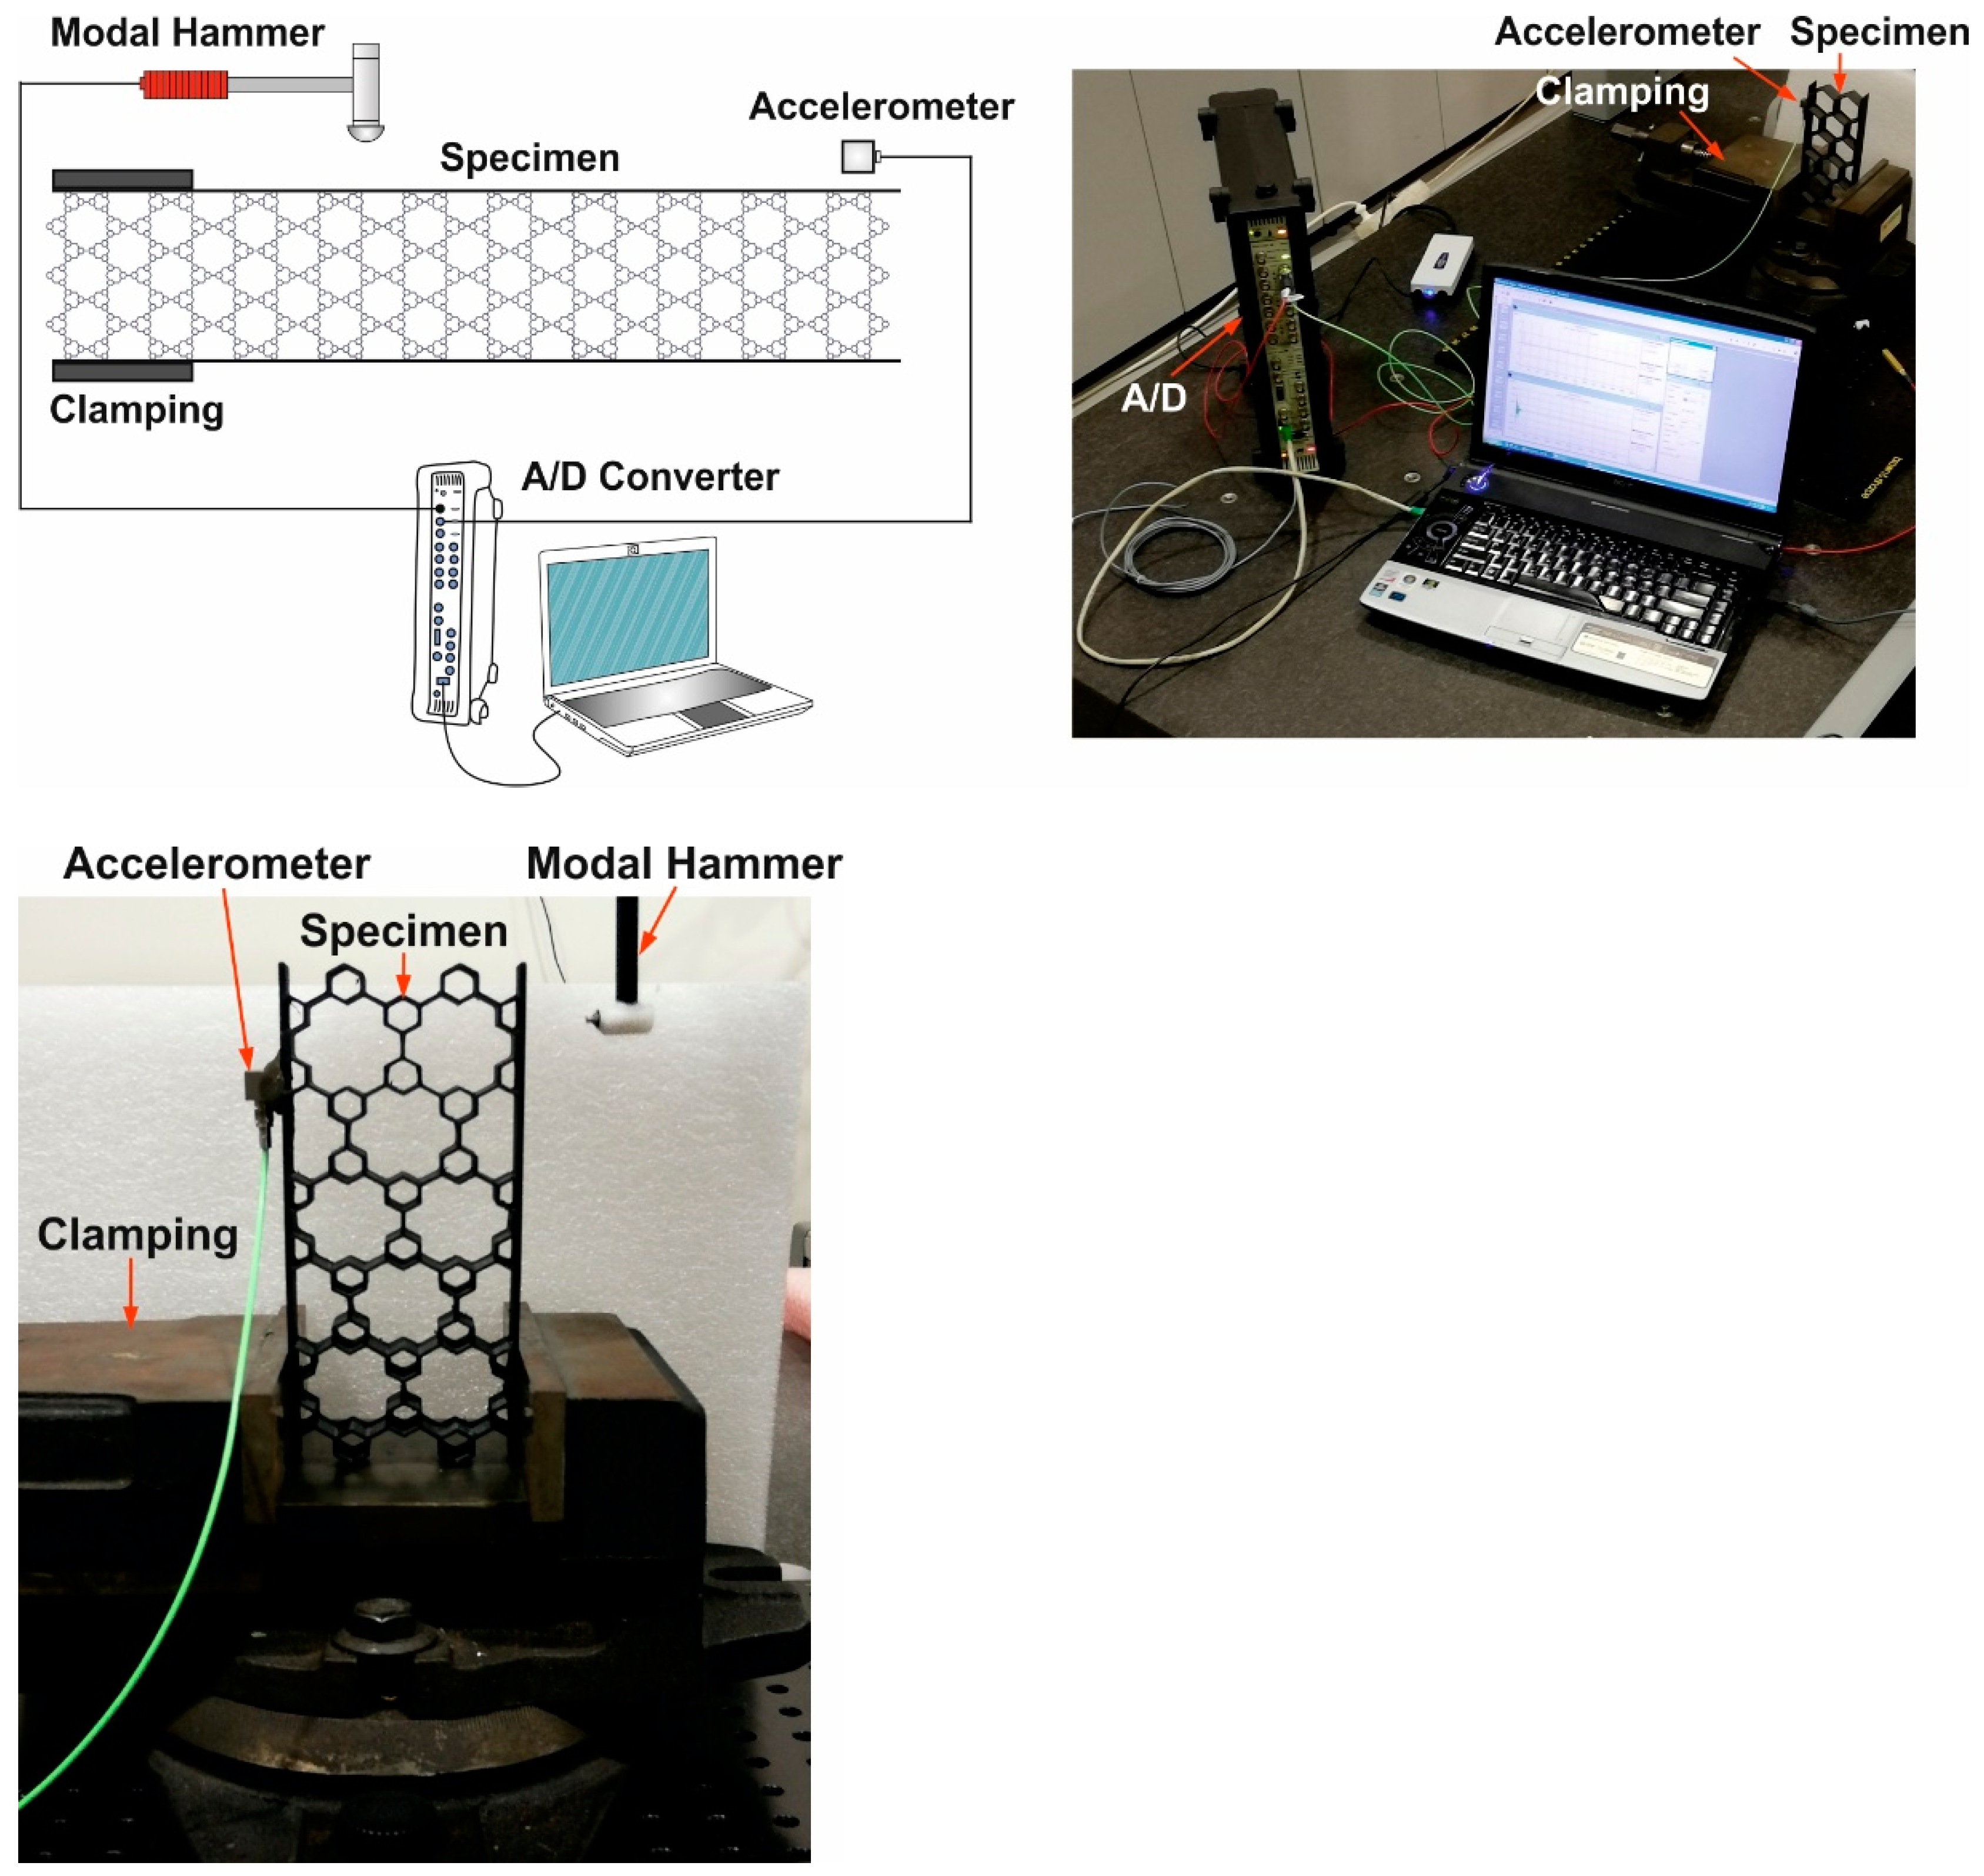
An impact hammer with a high-quality piezoelectric force transducer (Endevco Model 2302-10, San Juan Capistrano, CA, USA) was used to give the input load (pulse) to the specimen. The output was captured by an acceleration transducer with a sensitivity of 100 mV/g, Brüel & Kjaer 4507 B (Nærum, Denmark), mounted on the free end, while the sensing cables were kept in a free state to have little influence on the vibration test. Both the force and acceleration signals were acquired and amplified by a PULSE analyzer by Brüel & Kjaer (Nærum, Denmark), and the corresponding results were recorded on a computer. The frequency span of acceleration signals was up to 3200 Hz, the sampling time interval was 0.12207 μs and the sampling frequency was 8192 samples per second (Hz). Thus, the FFT resolution for a block size of 8192 samples was 1 Hz. The resolution of the analytical transfer function was the same as the experimental for the identification procedure. The modal hammer was calibrated by adjusting the level of the signal trigger force. Each specimen was tested 10 times and linear averaging was performed.
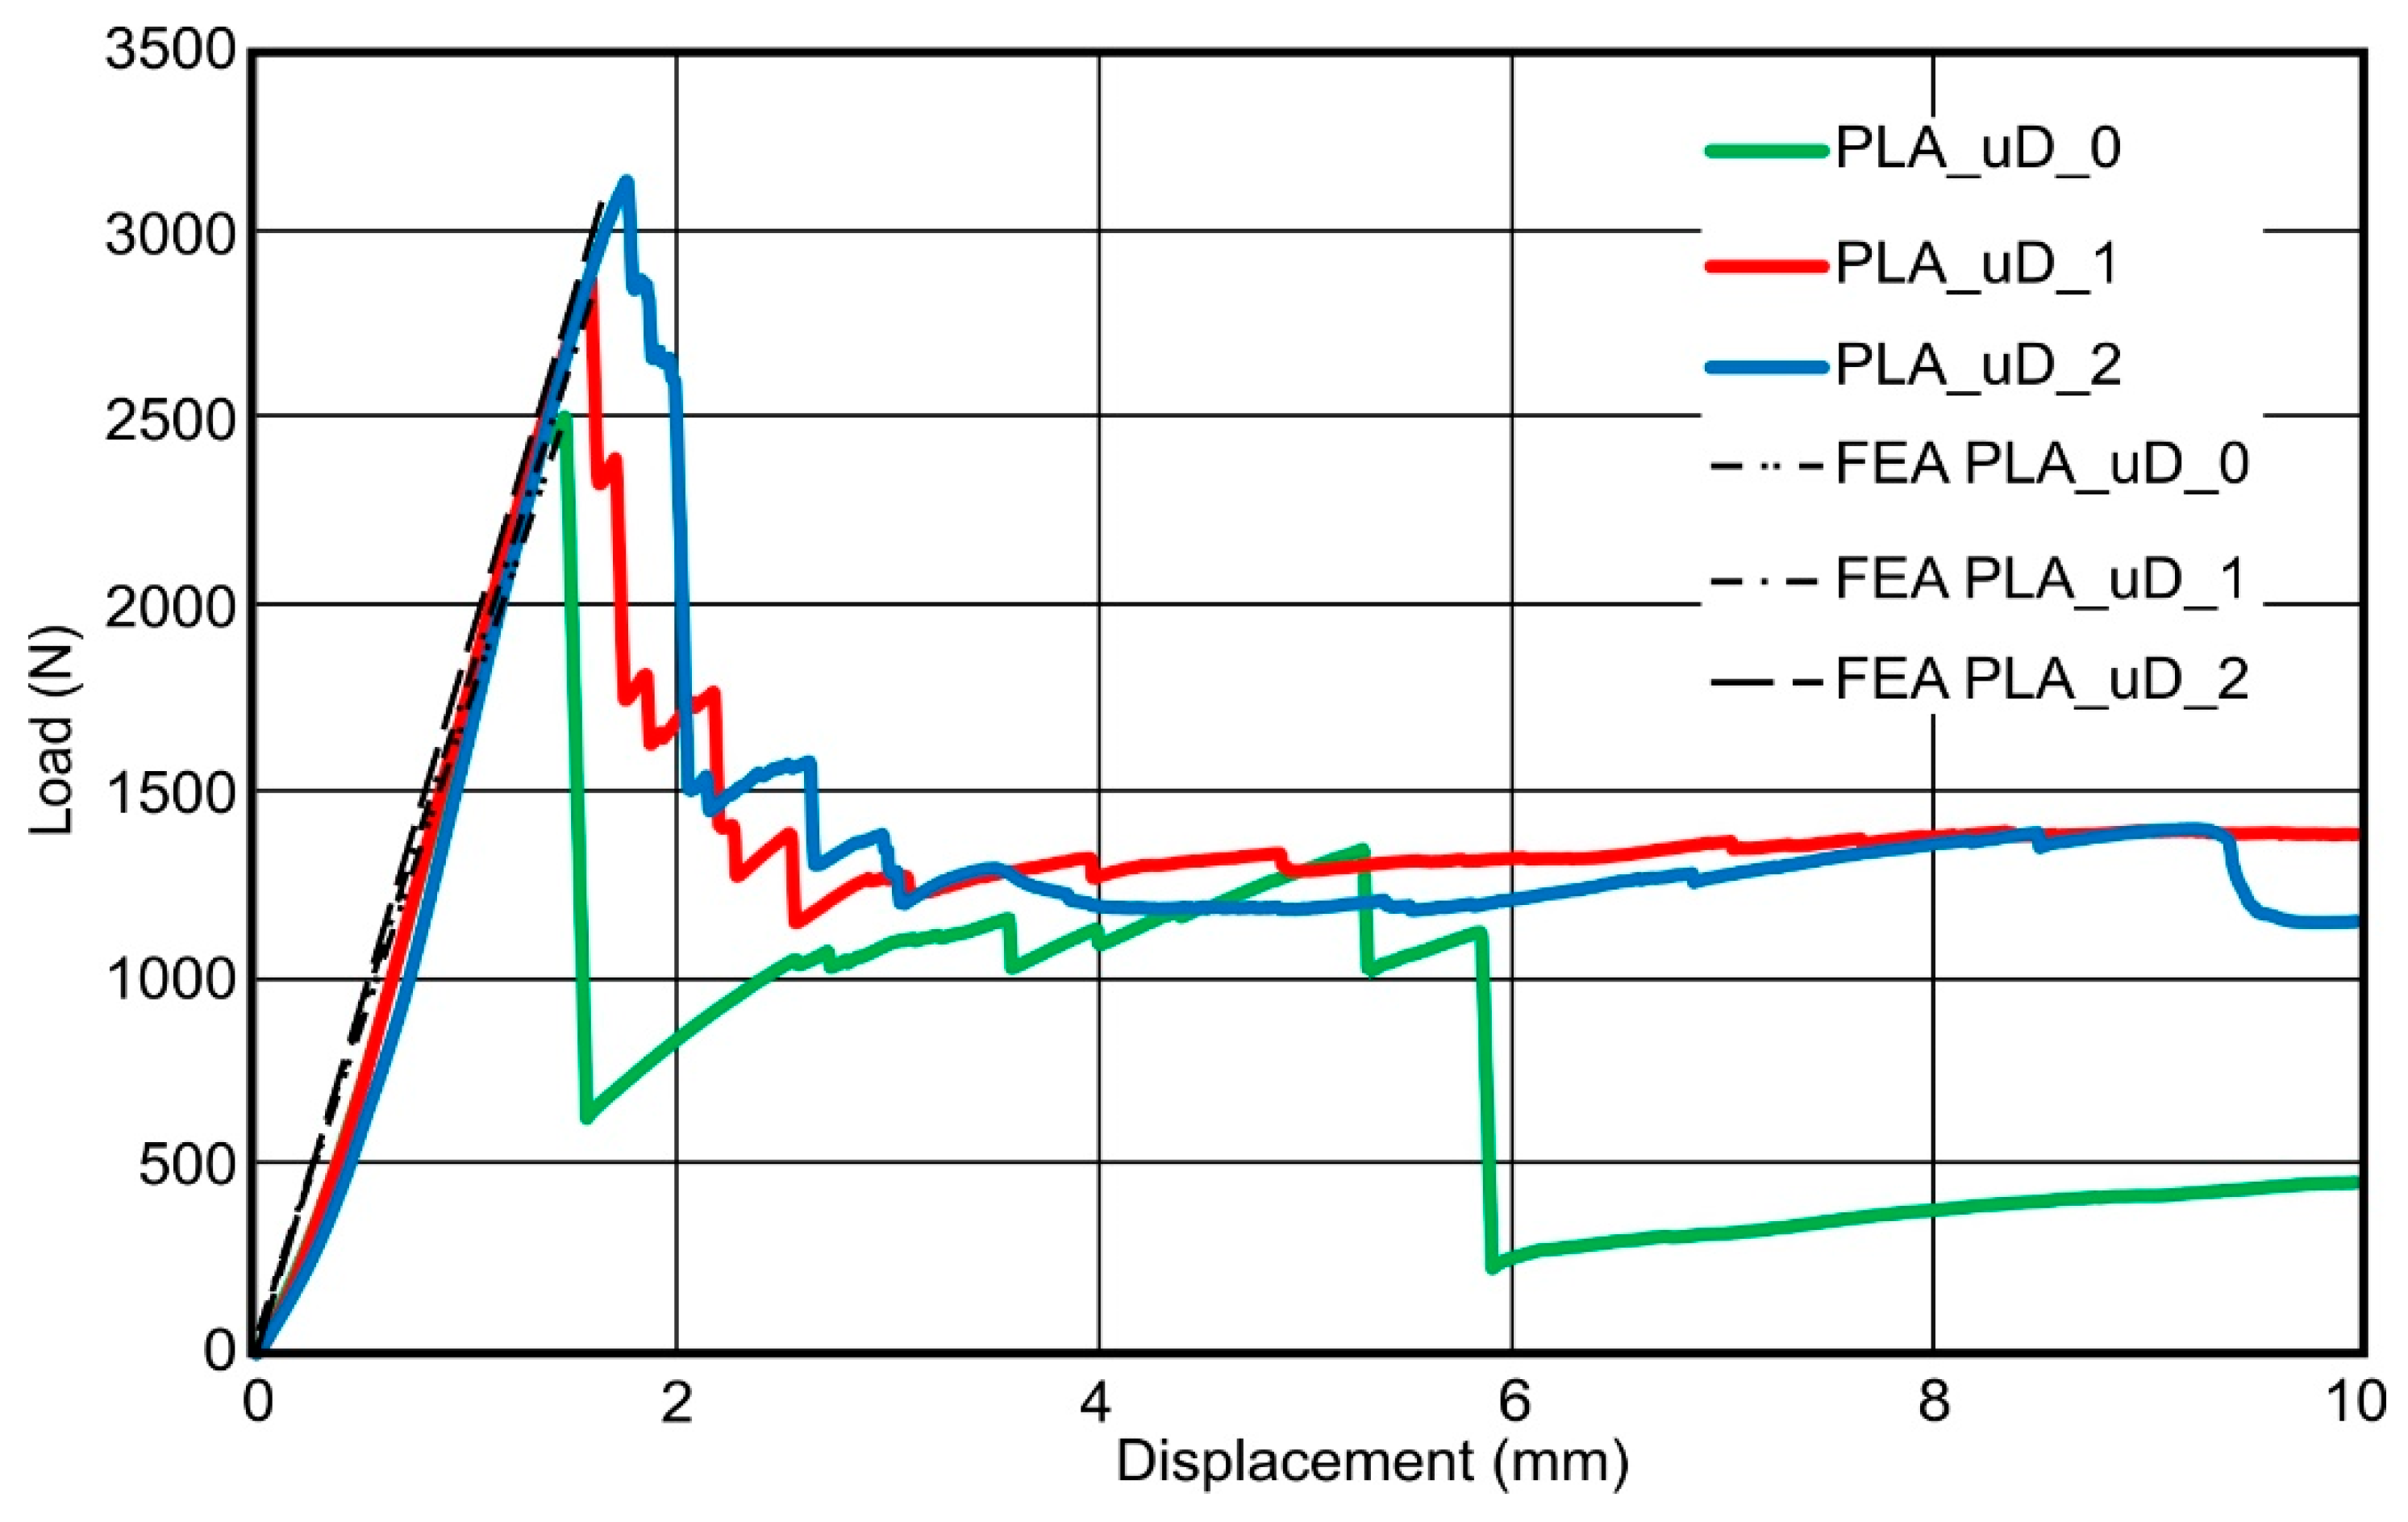
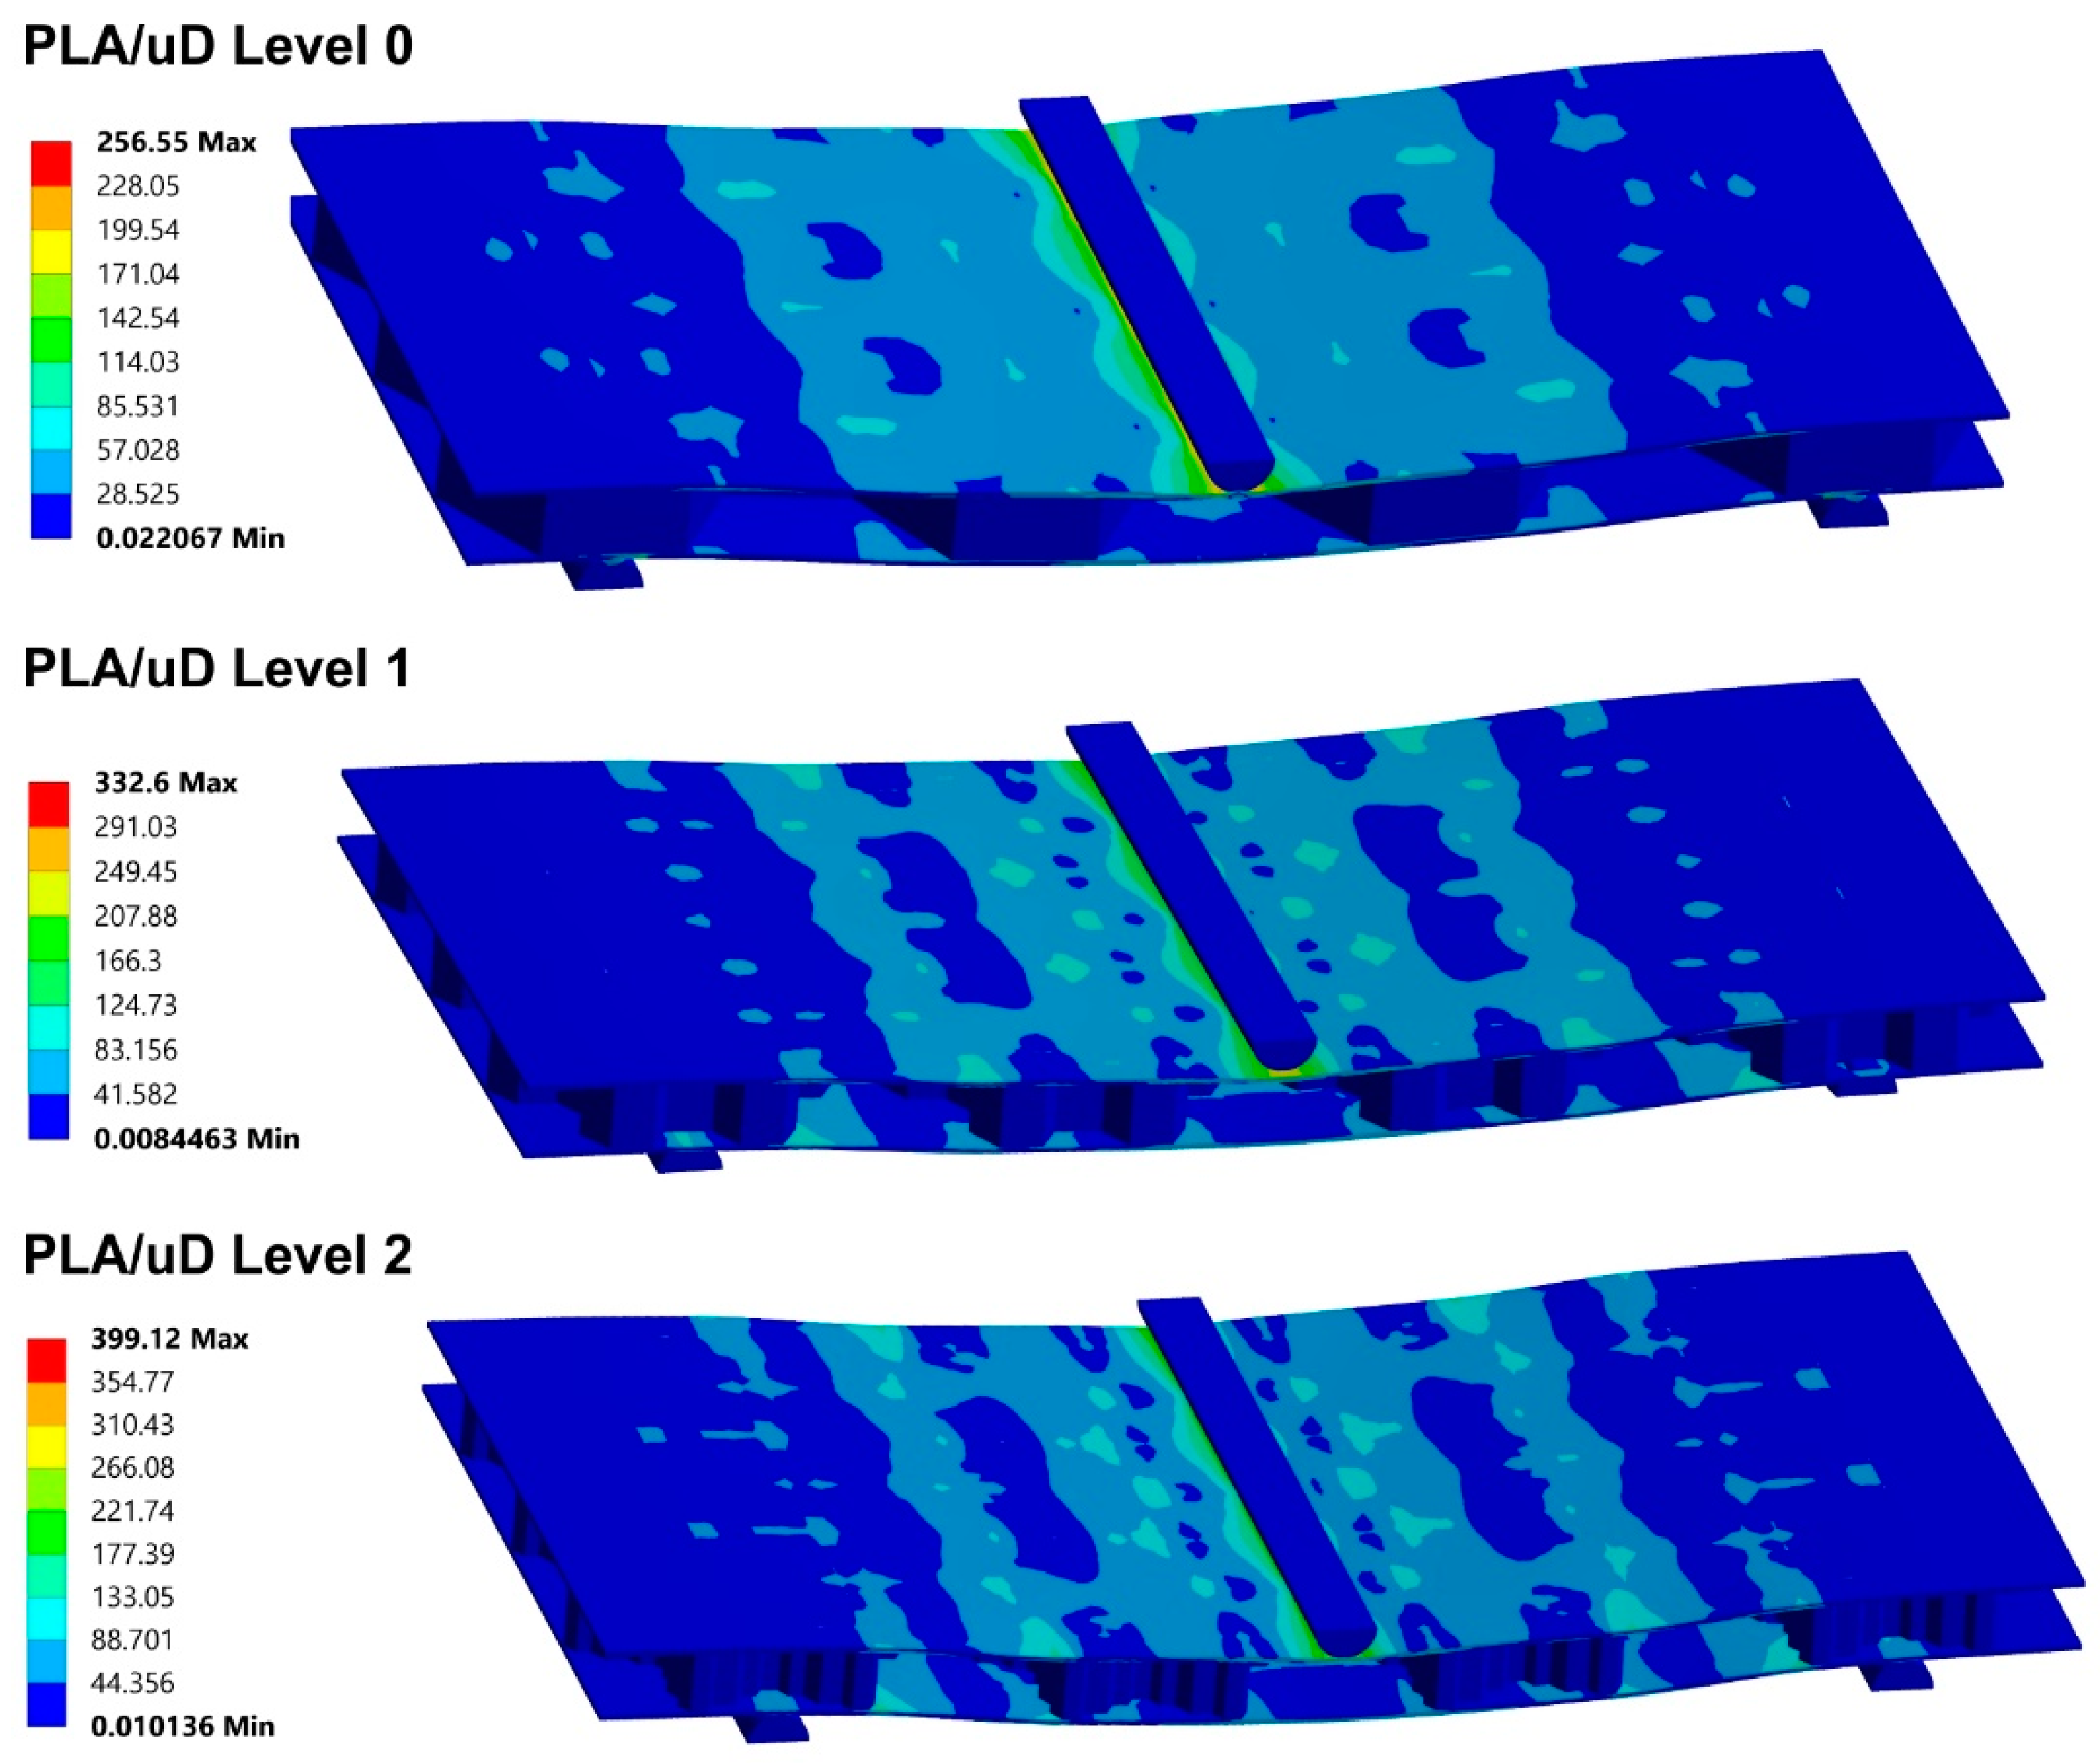
2.7. Bending Tests Augmented by FEA
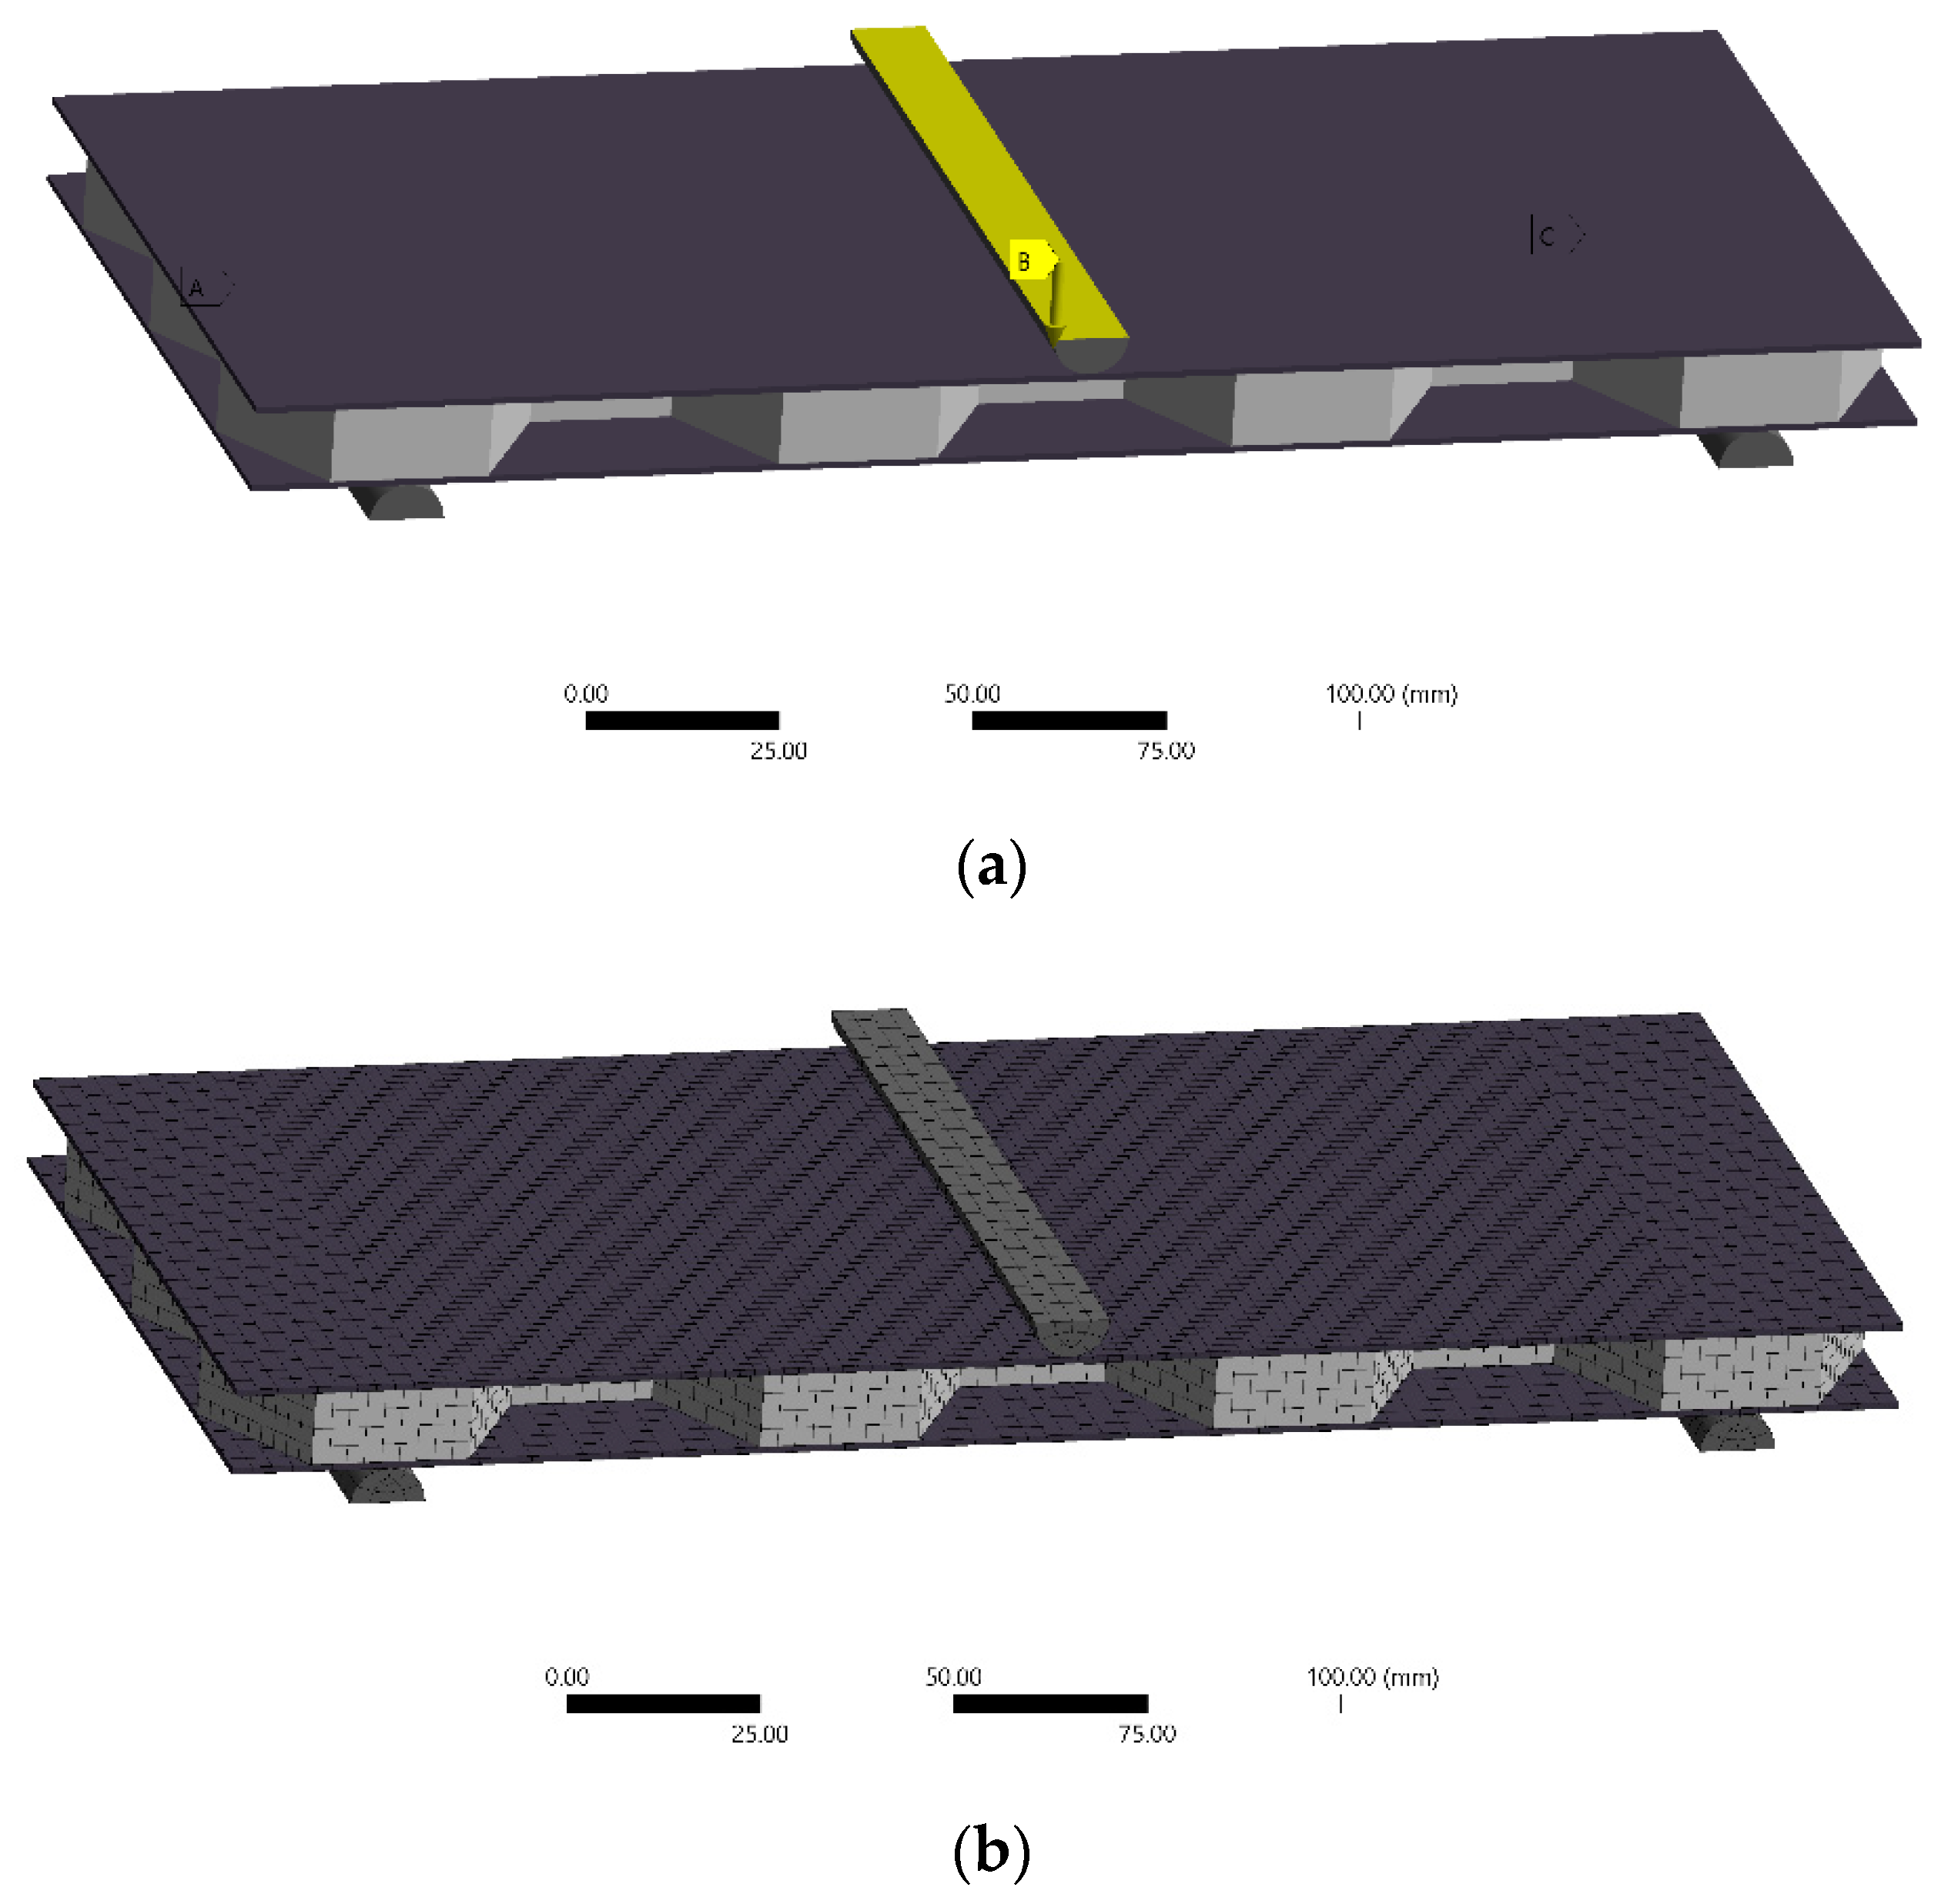
The bending behavior of the optimal AM-produced sandwiches with hierarchical honeycombs structures in various core hierarchies was investigated using the universal testing machine Testometric-M500-50AT equipped with a 50 kN load cell with a crosshead speed of 5 mm/min. All specimens were tested at a room temperature of about 22–23 °C. The dimensions of the produced parts for the three-point bending tests were 190 × 90 × 20 mm. It is worth mentioning that all experiments were performed three times to secure the reliability and repeatability of the experimental bending results. The setup of the sandwich structures simply supported on the 10 mm pins and loaded by a 10 mm pin is shown in
Figure 2a.
To advance the calculation accuracy of the bending tests, a finite element analysis (FEA) model was developed [
21,
22,
23]. A structural FE analysis based on the ANSYS code (Ansys® Academic Research Mechanical, Release 23.1) was utilized to investigate the deformation process of 3D-printed bending honeycomb structures and to extract a constitutive model of their mechanical behavior. Different material parameters were assumed in order to fit the experimental mechanical response of the honeycomb sandwich structures under bending in terms of force–displacement. The mechanical behavior of the carbon skins was modeled linearly with an upper strength limit that was defined by the tensile tests, while the PLA honeycomb core was defined by a bilinear stress–strain model. An imposed displacement was applied for each structure. This value corresponds to an experimental displacement from the bending tests. This procedure was repeated until the last pair of force–depth values were converged, and the solution process ended. The connections of the steel support, the loading pin and the sandwich specimens’ surface were assumed to be frictionless. The surfaces under the supports were considered fixed. The FE model along with the corresponding discretization is shown in
Figure 2b. The FFF printing defects were neglected during the simulation.


