Article

Electrical Characterization of Carbon Nanotube Reinforced Silver and Copper Composites for Switching Contacts

Chair of Functional Materials, Saarland University, Campus D 3.3, 66123 Saarbrücken, Germany
*
Authors to whom correspondence should be addressed.
J. Compos. Sci. 2023, 7(7), 284; https://doi.org/10.3390/jcs7070284
Submission received: 7 June 2023 / Revised: 20 June 2023 / Accepted: 6 July 2023 / Published: 11 July 2023
(This article belongs to the Special Issue Metal Composites)

Abstract

:
Carbon nanotube (CNT)-reinforced silver and copper metal matrix composites—at three different reinforcement phase concentrations (0.5 wt.%, 0.75 wt.%, and 1 wt.%)—were produced via powder metallurgy and sintered via hot uniaxial pressing. Optical and electron microscopy techniques were used to characterize the powder mixtures and sintered composites. The latter were also electrically characterized via load-dependent electrical contact resistance (ECR) and surface fatigue tests. Particle size and morphology play a crucial role in CNT deposition onto the metallic powder. CNT were deposited exceptionally well onto the dendritic copper powder regardless of its larger size (compared with the silver flakes) due to the higher surface area caused by the grooves and edges of the dendritic structures. The addition of CNT to the metallic matrices improved their electrical performance, in general outperforming the reference material. Higher CNT concentrations produced consistently low ECR values. In addition, high CNT concentrations (i.e., 1 wt.%) show exceptional contact repeatability due to the elastic restitutive properties of the CNT. The reproducibility of the contact surface was further evaluated by the fatigue tests, where the composites also showed lower ECR than the reference material, rapidly reaching steady-state ECR within the 20 fatigue cycles analyzed.

Graphical Abstract

1. Introduction

Low-voltage, direct-current switches are crucial components in modern life. These small—yet important—devices can be ubiquitously found in many fields of application, e.g., consumer electronics, sensing devices, transport vehicles, etc. The task that these components must complete is simple: make and break the electrical circuit (i.e., close and open the circuit, respectively). Despite the simple nature of the switch’s action, different mechanisms and circumstances at play during the making and breaking of the circuit—such as atmospheric conditions and other external factors, contact wear and corrosion, material transfer and degradation, as well as switch design and material selection—can considerably complicate the system.
In order to efficiently make and break the circuit, switches must fulfill several requirements. The main requirement is a low electrical contact resistance (ECR), since this will reduce energy loss at the contact interface, thus increasing the system’s efficiency and reducing heat production. As a repercussion of lower contact temperatures, welding of the two surfaces is less likely to occur, improving the reliability of the system. This is a crucial requirement since contact welding could potentially prevent the breaking of the circuit when prompted. Therefore, low energy loss and high thermal dissipation capacity are essential in electrical switches. Other requirements include, but are not limited to, arc extinguishing capabilities, wear, erosion, and corrosion resistance, and minimizing contact bounce and chatter, among others.
The focus of this work is on material selection, describing a production method, and evaluating the low-current performance of carbon nanotube (CNT)-reinforced silver and copper-based metal matrix composites (MMC). The proposed composite materials could prove advantageous, presenting a multiscale approach to fulfilling the aforementioned requirements by tailoring the contact material employed in the electrical switch. Foremost, CNT presents the capability of conducting electricity exceptionally well, showing the interesting capability of behaving similar to a metallic conductor or semiconductor, depending on their chirality (structure-dependent electrical conductivity) [1,2,3,4,5,6,7,8,9]. Multi-walled carbon nanotubes (MWCNT), however, have the particular characteristic that they statistically always possess at least one metallic wall [10], where conduction takes place. Therefore, MWCNT ensures the metallic conduction of electrons, with metallic tubes having a longer electron mean free path than copper and quasi-ballistic electron transport properties [11,12,13,14]. Since MWCNT are easier to synthesize while having similar current carrying capacity as metallic single-walled CNT [15], MWCNT were implemented in the proposed composites.
In addition to CNT’s electron transport properties, these sp2-hybridzed one-dimensional nanostructures present exceptional thermal conductivity, albeit with anisotropy caused intrinsically by their structure. Although the conductance (thermal as well as electrical) is highly dependent on nanotubes’ structural integrity, theoretical thermal conductivity values range from 3000 to 6000 W/m·K [16,17,18], higher than silver’s and copper’s (approximately 430 and 400 W/m·K, respectively) and even that of pure single-crystalline diamond (2400–2500 W/m·K) [19]. This high thermal conduction thus aids in heat dissipation at the contact interface generated by friction and/or constriction and film resistance [20]. Consequently, the likelihood of switch welding is considerably reduced when CNT are present in the system, even at elevated current levels. Moreover, multiple studies have reported that the addition of CNT as a reinforcement phase in nickel matrices has significantly reduced friction and wear [21,22,23], as well as CNT coatings providing wear protection while having a marginal impact on ECR [24,25,26]. Furthermore, the incorporation of CNT into the system could provide the electrical switch with secondary advantages due to the chemical inertness and hydrophobic wetting behavior of this carbon nanostructure [27,28,29], in addition to their exceptional mechanical properties [30,31,32,33].
Due to all the aforementioned properties and characteristics of CNT—in addition to the outstanding electrical properties of silver and copper—the objective of this study is to produce and characterize CNT-reinforced silver and copper metallic matrices. Production will follow conventional powder metallurgical methods since this is an industrially accepted technique. The powder mixtures will be prepared by colloidal mixing, and the green pellets will be densified by hot uniaxial pressing (HUP). These methods are simple, versatile, and allow a near-net-shaped manufacturing process. After sintering, the produced MMC will be characterized by optical and electron microscopy—using confocal laser scanning microscopy (CLSM) and scanning electron microscopy (SEM), respectively. Electrical characterization consisted of load-dependent ECR and surface fatigue tests on composite and reference samples. These methods provide insight into the impact of the reinforcement phase on the electrical behavior of the metallic matrix, on the repeatability of the contact when subjected to different normal loads, as well as the evolution of ECR after consecutive making and breaking cycle simulations.

2. Materials and Methods

2.1. MMC Production

Silver and Copper matrices were reinforced with MWCNT using three different concentrations through powder metallurgy—namely 0.5 wt.%, 0.75 wt.%, and 1 wt.%—and then sintered via HUP. Silver flakes having 99.9% purity, over 80% of which were below 20 µm in size, and 99.9% pure dendritic copper powder with a mesh size of 90%-325 (i.e., 90% of the particles are smaller than 44 µm) were used as metallic matrices (Alfa Aesar GmbH, Kandel, Germany). Pristine, chemical vapor deposition-grown MWCNT (Graphene Supermarket, New York, USA) with an outer diameter distribution between 50–85 nm, an as-received state length from 10–15 µm, and a carbon purity above 94% were used as reinforcement phases.
The production of the MMC is comprised of three distinct processes:
  • CNT dispersion and metallic powder mixture (colloidal mixing process);
  • Cold pressing (consolidation of green pellet);
  • Sintering (densification via HUP).
The first process consists of dispersing the CNT in ethylene glycol (EG). Therefore, 0.2 mgCNT/mLEG are added in a beaker and then subjected to a homogenization (Ultra-Turrax T-25, IKA, Staufen, Germany) at 7500 rpm for 5 min. Large CNT agglomerates (formed by van der Waals interactions [34,35]) are thus broken down through shear forces. Subsequently, the colloid is placed in an ultrasound bath to further disentangle the smaller CNT bundles. After CNT dispersion, the metallic powder can be incorporated into the colloid, followed by homogenization for 5 additional minutes at 7500 rpm. The solvent must then be evaporated by placing the colloid in a ventilated furnace set at 150 °C for 24 h. The CNT-metallic powder mixture is then removed from the furnace and crushed using an agate mortar and pestle for 5 min to break apart powder agglomerates. The crushed powder is then returned to the furnace for 24 more hours to ensure proper drying since the presence of moisture during sintering negatively impacts MMC density. These steps are schematically represented and shown in Figure 1.
The dry powder mixtures are then pressed with a hydraulic press (Matra-Werke GmbH, Hainburg, Germany) using a cylindrical steel die at 990 MPa, thus obtaining an 8 mm diameter disk-shaped sample (green pellet) with typical heights between 3 and 5 mm. To significantly increase sample density, the green pellet is then sintered via HUP in a vacuum chamber (working pressure of 2 × 10⁻⁶ mbar), a process that eliminates internal and open porosities. For HUP, the green pellet is placed between two alumina pistons inside a graphite die and pressed at 264 MPa. The sample, alumina pistons, and graphite die are then placed inside a cylindrical steel die and placed inside a water-cooled induction coil within the vacuum chamber (schematically represented in Figure 2). The sample is then heated to 750 °C with an approximate heating ramp of 15 °C/min, followed by an isothermal holding time of 2.5 h. The sample then cools inside the vacuum chamber until it reaches a temperature between 150 and 200 °C. The sintered sample can then be removed from the chamber.

2.2. Characterization Techniques

The powder mixtures were characterized by SEM (HeliosTM G4 PFIB CXe DualBeamTM Super, Thermo-Fisher Scientific, Eindhoven, The Netherlands) using Everhart-Thornley (ETD) and Through-the-Lens (TLD) detectors and a 5 keV acceleration voltage. With this technique, the deposition of the CNT on the metallic powders could be observed, and the homogeneity of the mixture could be qualitatively assessed.
After sintering the powder blends, relative density and microhardness measurements were carried out. Relative density was measured using distilled water and an adjusted 10 mL pycnometer, according to Gay-Lussac. Vickers hardness measurements were carried out using a microhardness tester (Dura Scan 50, Struers Inc., Cleveland, USA), a load of 0.098 N (HV0.01), and a holding time of 15 s, the resulting imprints were optically micrographed using 40× magnification. A 3 × 3 indentation grid (separated from one another by 0.5 mm) was carried out per sample. The final hardness value considered is the average of the nine indentations.
Electrical characterization was conducted using a custom testing rig using four-terminal sensing with a constant current of 100 mADC (sourced by a Keithley 2400 SMU, Cleveland, USA) [36,37]. This current level was chosen to ensure dry circuit conditions [38]. Two different electrical tests were performed: (1) load-dependent ECR and (2) surface fatigue tests. The former consists of conducting two loading and unloading semi-cycles (following the sequence: 0.5, 1, 1.5, 2, 2.5, 3, 3.5, 4, 4.5, 5, 6, 7, 8, 9, and 10 N), whereas the latter consists of loading and unloading for 20 cycles at 1 N, 3 N, and 5 N to evaluate the performance of the MMC during monotonic loading. The results from surface fatigue tests are complex to graphically represent; therefore, 2D kernel density estimations were also plotted. These plots provide information on the overall trend of electrical performance during fatigue. ECR was measured ten times per load (using a Keithley 2182a nanovoltmeter with a range of 1 V, Cleveland, USA) and averaged. Silver-nickel core (AgNi0.15), hard-gold-coated rivets (AuCo0.2)—average coating thickness of 6.47 ± 0.18 µm—were used as counter electrodes (Adam Bornbaum GmbH, Neuhausen, Germany). These rivets have a curved head—a mean diameter of curvature of 4 mm—and a root mean squared roughness of 0.26 µm. A new counter electrode was used after every test. Both load-dependent ECR and surface fatigue tests were carried out at least three times per sample to ensure result reproducibility. The tests were conducted under laboratory conditions, with temperature and relative humidity ranging from 19–23 °C and 35–45% r.h., respectively. The electrical performance of the MMC was contrasted with high-purity reference materials, namely: 99.95% and 99.9% purity silver (Alfa Aesar GmbH, Kandel, Germany) and copper (Goodfellow Cambridge Limited, Huntingdon, England) rods, respectively.

3. Results and Discussions

3.1. Powder Characterization

The metallic powders used in this study were micrographed by SEM (Figure 3a,b). The SEM micrographs in Figure 3c,d show the result of colloidal mixing after fully evaporating the solvent and drying the mixture, whereas Figure 3e,f show a magnified feature of the mixture. SEM micrographs of the pristine CNT used as reinforcement are shown in Figure S1.
Observing the silver-CNT mixture, regions with high CNT content can be observed, as highlighted by the green square in Figure 3e as well as at the bottom left of Figure 3c. Although the CNT dispersion is not as homogeneous as desired, regions with CNT depletion still present individual or small CNT bundles. These are found primarily at or near the edges of the silver flakes, as highlighted by the cyan arrows. The copper-CNT mixture, on the other hand, shows a much more homogeneous CNT distribution throughout the powder mixture. Small CNT bundles are deposited uniformly on the grooves and edges of the dendritic copper powder. This has also been observed and reported by Guiderdoni et al. for higher CNT concentrations [39]. They state that a proper distribution of the dispersed CNT leads to improved integration into Cu matrices after sintering. However, the final density of the high CNT content composites was strongly reduced (73%). Although the silver flakes are smaller than the dendritic copper (average particle sizes of 20 µm and 44 µm, respectively), the morphology of the copper powder increases surface area. This increased surface area in turn promotes CNT deposition onto the metallic powder. Nonetheless, this powder mixture presents the potential drawback of relatively large CNT agglomerates found within the mixture (highlighted by the red arrow). The presence of CNT agglomerates (similar to those observed in Figure S1a) could negatively impact the resulting CNT distribution in the sintered MMC. In this case, the silver-CNT mixture could prove more adequate since only small CNT bundles are found within the powder. A more uniform CNT distribution is desired not only to ensure consistency throughout the composite but also to maximize the sought-after properties of the reinforcement phase. A longer dispersion process could prove counterproductive since the shear forces and sonication shorten the tubes as well as damage the carbon lattice [40]. Consequently, a trade-off between agglomerate breakdown and tolerable incurred damage must be made [41], since structural damage and inter-tube interactions diminish the intrinsic physical properties of the CNT.

3.2. Characterization of Sintered MMC

The relative density of the composite samples is a crucial parameter to evaluate the effectiveness of the sintering process—results shown in Table 1. As observed, the copper MMC reached remarkable density levels. However, this was not the case with silver MMC (Ag-p), with values below 80%. The graphs in Figure S2 show the pressure variation in HUP during the heating stage. In both metallic matrices, pressure gradually decreases as the temperature increases, reaching final values of approximately 175 MPa.
Low densities in silver MMC will not only lower the mechanical properties of the resulting composite but also the electrical performance since internal porosities are potential electron scattering sites. Therefore, a re-pressing process was incorporated into the production process of silver MMC. Re-pressing consisted of an additional HUP process with the same conditions but with an isothermal holding time of 7.5 h. The longer holding time allows for improved diffusion of the metallic matrix, thus eliminating internal porosities and consequently improving density. Observing Table 1, the re-pressing process indeed improved density, with silver MMC now reaching satisfactory values above 90%. Therefore, electrical characterization of silver MMC was carried out after the re-pressing process.
It is unclear as to why silver requires longer isothermal holding times compared with copper under identical HUP parameters. Considering the equation of diffusion, shown in Equation (1) [42], there are two parameters that could justify the prolonged thermal energy required by silver MMC, namely: the self-diffusion coefficient (D0) and the activation energy (Ea)—i.e., thermal energy—which are both independent of temperature [42]. However, both the self-diffusion coefficient and activation energy are lower for silver [43,44,45], thus resulting in an approximate diffusion coefficient at 750 °C of 1.09 × 10⁻⁹ cm2/s and 3.98 × 10⁻¹¹ cm2/s for silver and copper (determined via Equation (1), respectively).
D ( T ) = D 0 · e E a R · T
Moreover, since the melting point of silver is lower than that of copper (961 °C and 1083 °C, respectively [46]), the sintering temperature of both these metallic matrices is closer to the melting point of silver than copper. Therefore, the different isothermal holding times could be caused by different degrees of porosity prior to the sintering process. Accordingly, CLSM measurements of the pre-sintered surfaces were micrographed to further understand the state of the green pellets (see Figure S3). This analysis shows that copper MMC has larger open porosities and a more heterogeneous surface prior to sintering. The silver MMC, on the other hand, shows a considerably more homogeneous surface with few open porosities. This could explain the better densification of copper, since open porosities are more easily eliminated compared with internal porosities due to the bloating of internal pores during sintering [47,48]. At the consolidated state (i.e., only cold pressed), superficial oxidation of the powder plays a fundamental role in the green pellet density since there is significantly less diffusion driving force than when the samples are sintered. Silver is chemically very stable and mechanically softer, therefore rendering a more ‘homogeneous’ and finer porosity structure than the copper samples.
To gain further insight into the porosity levels of the green pellets, two reference pellets were produced using silver flakes and dendritic copper powder. Focused ion beam (FIB) cross sections were performed on each green pellet to observe the sub-surface porosity state of each green pellet, as shown in Figure 4. Furthermore, Figure S4 shows a micrograph of the consolidated pellets’ surface. It is clear that dendritic copper generates green pellets with large pores, both internally and superficially. Silver flakes, on the other hand, produce a surface with fewer open porosities, as demonstrated by Figures S3 and S4. The cross section shown in Figure 4 highlights the considerable number of pores within the consolidated silver pellets. Although the pores observed in silver are smaller than the ones in copper, the magnified micrograph (Figure 4c) shows that these are pervasively found throughout the entirety of the green pellet. The abundance of internal micro-pores within the silver pellet is the main cause of the extended sintering requirements [47,48]. The larger pores observed in the copper pellets, on the other hand, are less abundant. Therefore, 2.5 h of isothermal holding time is sufficient to achieve sintered relative densities above 90%.
CLSM light scans of the sintered composite samples are shown in Figure 5. From these micrographs, insight into CNT distribution and homogeneity can be obtained. The micrographs show that CNT are better distributed in silver MMC, with smaller, more evenly spaced clusters. For copper, on the other hand, larger CNT bundles are observed, especially at higher concentrations (e.g., Figure 5f). These larger clusters in copper composites are caused by the greater affinity between CNT and CNT agglomerates rather than with copper. Consequently, higher reinforcement phase uniformity is observed in silver composites. A uniform distribution promotes homogeneous behavior regardless of the site contacted. This plays a crucial role not only in the repeatability of ECR but also in the elastic restitution of the contacting surfaces.
The Vickers hardness (HV0.01) of the composites and reference samples is also shown in Table 1. These results show that no mechanical reinforcement during the second phase took place in the composite samples. However, it should be noted that these hardness values are compared with high-purity reference materials. Softer composites were to be expected on account of the sintering process at relatively high temperatures and prolonged holding times—particularly in the silver MMC due to the re-pressing process. As reported by Garcia et al. [49], a reduction in the sintering temperature of 200 °C yields much harder composites as a consequence of shorter coarsening times for microstructural processes to occur (i.e., recovery and grain growth). Consequently, a trade-off must be made between better mechanical performance and proper densification of our composite samples. Since the intended application for the MMC produced is electrical switches, higher composite densities take precedence over mechanical properties. Moreover, proper densification also plays an important role in the composite’s mechanical behavior, as exemplified by the re-pressed Ag 0.75% MMC. This sample shows the lowest relative density (92%) even after re-pressing, which negatively impacts the hardness of the composite, showing a hardness value that is approximately 30% lower than the denser silver MMC. Therefore, even though the CNT reinforcement phase weakens—to a certain extent—the mechanical performance of the MMC, adequate densification also plays an important role.

3.3. Electrical Tests

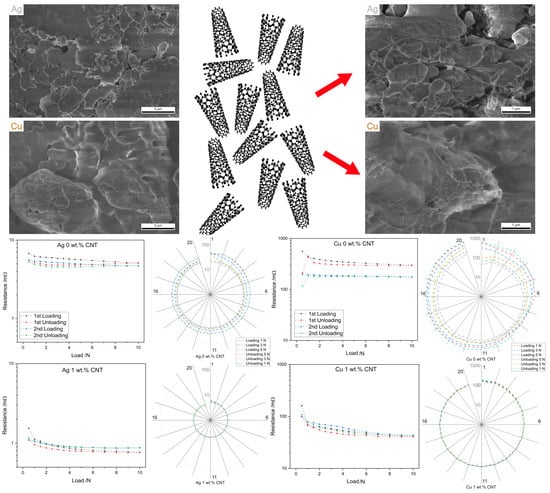
3.3.1. Load-Dependent ECR

The load-dependent ECR of the reference and CNT-reinforced silver matrices is shown in Figure 6. Comparing the ECR values of the reference sample with the reinforced samples, it is clear that the addition of CNT promotes lower resistances. At all loads in both cycles, the reference sample shows an ECR that ranges from 5 to 7 mΩ. Ag 0.5%, on the other hand, shows ECR values that range from 2 to 6 mΩ, whereas Ag 0.75% and Ag 1% achieved ECR values of approximately 1 mΩ, even falling below that value for higher normal loads.
Although all MMC show exceptional densities post-sintering, it was not expected that they would outperform the reference sample since the interface between CNT clusters and the metallic matrix can act as electron scattering sites, thus increasing the electrical resistance of the system. It is hypothesized that the reduction in ECR observed is both a direct result of the reinforcement phase and also due to the relative softness of the contact material. Although silver is considered a soft metal, the resulting silver MMC are, on average, about 40% softer than the reference (see Table 1)—with Ag 0.75% resulting in even lower hardness values. Therefore, the combination of the considerably harder counter electrode and the softer silver MMC favors lower ECR values due to an enlarged contact area. As the hard counter electrode (Vickers microhardness: 1.38 ± 0.01 GPa) is pressed against the soft composites, topographic features on the surface of the composites are flattened while the topographic features of the counter electrode are imprinted onto the MMC’s surface. As a consequence of the permanent deformation of the MMC’s surface, the real contacting area of the two surfaces approaches the apparent contact area, thus improving the electrical performance of the system. This hypothesis is further supported by the fact that Ag 0.75% (sample with the lowest hardness) shows the lowest ECR values.
To validate the proposed hypothesis, post-ECR CLSM measurements were carried out on the reference and composite samples. The root mean squared roughness of the polished surface prior to ECR and the imprint left by the counter electrode after ECR, as well as the diameter of the imprint left by the counter electrode, are shown in Table 2. As the table demonstrates, the roughness of the composites’ surfaces increases after ECR measurements. The degree to which the roughness increases appears to depend on the hardness of the sample since the increase is negligible in the reference sample, with Ag 0.75% showing the highest increase. The increment in roughness is due to the roughness present in the counter electrode (which has a root mean square roughness of 260 nm). Similarly, contacting softer surfaces generates a larger imprint. Therefore, the CLSM results validate the hypothesis, thus explaining the behavior of Ag 0.75%.
These tests were conducted for two loading and unloading cycles; therefore, the repeatability of the contacting surfaces can be evaluated by the difference in ECR values in the second measurement cycle compared with the first. As shown in Figure 6, higher CNT concentrations promote more repeatable contacting surfaces. Comparing the reference sample with Ag 0.75% and Ag 1%, the former shows a higher mechanical hysteresis than the reinforced samples. The improved contact repeatability is likely a consequence of the high elastic restitution provided by the addition of CNT, coupled with the relative softness of the composite samples. Ag 0.5% on the other hand, shows the largest mechanical hysteresis. This could be caused by contact heterogeneity. Since this sample contains the lowest concentration of CNT, the presence of larger CNT clusters instead of a homogeneous CNT distribution could cause differences in the contacting situation throughout the contact material. Therefore, regions with more CNT clusters could prove more repeatable, whereas regions with fewer CNT clusters would show higher mechanical hysteresis (see Figure 5). Consequently, composites with higher concentrations—and therefore higher likelihood of larger CNT clusters—show improved elastic restitutive behavior. Furthermore, the lack of restitution coupled with a softer—and thus a more easily deformed surface—negatively impacts the contact area. Consequently, the ECR during unloading will tend to be higher than while loading.
The load-dependent ECR results for the copper-based composites are shown in Figure 7. As for silver, the average roughness prior to and post-ECR was measured—shown in Table 2. These values correlate with the microhardness values measured (see Table 1). The imprint on the reference sample could not be observed using CLSM due to the higher hardness value.
Since the hardness and, correspondingly, the imprint size for the reinforced copper samples are—to a certain extent—similar, the influence of reinforcement phase concentration on the electrical performance of the composite can be better evaluated. Observing Figure 7, higher CNT concentrations promote lower ECR values throughout the measurement cycles, the same tendency that was observed in silver-based composites. All reinforced samples outperformed the reference, with values below 100 mΩ at 10 N after both cycles. The reference sample, on the other hand, showed three-fold and two-fold resistance after the first and second cycles, respectively. Therefore, load-dependent ECR on copper-based composites proves that the addition of CNT within the metallic matrix improves electrical performance.
Interestingly, the second measurement cycle showed higher resistance in the reinforced samples, whereas in the reference sample the opposite was true. This behavior, in combination with the mechanical hysteresis observed in the reinforced samples, demonstrates the elastic restitution of the resulting contact material as a consequence of the CNT. Although all copper composites show some degree of elastic restitution, Cu 1% displays the highest contact repeatability, as demonstrated by the low mechanical hysteresis exhibited.

3.3.2. Fatigue Cycles

Fatigue tests aim to evaluate the ECR evolution during monotonic loading. Therefore, 20 loading and unloading cycles were performed, tracking the ECR of the composites and reference samples at 1 N, 3 N, and 5 N. The results for silver MMC are shown in Figure 8. The reference sample performed consistently throughout the fatigue tests, with ECR values ranging from 20 to 48 mΩ. Ag 0.5% and Ag 0.75%, on the other hand, performed well initially—9–20 mΩ and 2.5–6.5 mΩ, respectively. However, as the fatigue test progressed, ECR steadily increased, stabilizing at 50–70 mΩ and 17–21.6 mΩ, respectively. Although the resistance increased during fatigue cycles, the steady-state values resemble or even outperform those measured for the reference sample. Ag 1% behaves akin to the reference sample, however, with significantly lower resistance values—between 4 and 6 mΩ throughout the fatigue test. It is unclear as to why the ECR of Ag 0.5% and Ag 0.75% increases. One possible explanation is that higher CNT concentrations favor a more homogeneous contact, thus improving contacting surface uniformity and consequently showing an electrical performance that resembles that of the unreinforced sample. As was the case with load-dependent ECR, the lower ECR values observed during fatigue tests are attributed to the larger contact area achieved due to the softer composites.
The electrical behavior during fatigue tests of the silver MMC can be better visualized in a 2D kernel density estimation plot, shown in Figure S5. Here, the tendencies of the MMC can be more easily observed. The plot shows that for CNT concentrations greater than 0.75 wt.% the steady-state ECR values outperform the unreinforced reference. Furthermore, CLSM analysis prior to and post-fatigue tests was carried out, with the results shown in Table S1. The results obtained correlate with the results from load-dependent ECR.
The evolution of ECR during fatigue tests in copper MMC is shown in Figure 9, with the 2D kernel density estimation plot shown in Figure S6. The behavior of the reference sample oscillates considerably throughout the test, with ECR values ranging from 45 to 950 mΩ (between 200 and 300 mΩ at 5 N). This constant fluctuation in ECR could jeopardize the reliability of the electrical contacts. The reinforced samples, on the other hand, show uniform electrical behavior. In all cases, the ECR values fluctuate from 50 to 190 mΩ. Not only does the reinforcement phase improve the repeatability of the contact, but it also stabilizes and reduces the overall resistance of the system. Cu 0.5% showed the most constant results, with Cu 0.75% showing a slight increase in ECR and Cu 1% a slight decrease. Nonetheless, the steady-state values outperform the reference sample for all CNT concentrations. Results from CLSM analysis prior to and post-fatigue tests are shown in Table S2.

4. Conclusions

Carbon nanotube-reinforced silver and copper metal matrix composites at three different reinforcement concentrations (0.5 wt.%, 0.75 wt.%, and 1 wt.%) were produced via powder metallurgy. The powder blends and sintered samples were characterized using light and electron microscopy techniques, followed by in-depth electrical characterization—namely, load-dependent ECR and surface fatigue tests. From this study, the following conclusions can be drawn:
  • Not only does particle size play an important role in CNT integration but also particle morphology, with the larger-sized copper powder showing better CNT deposition than the smaller-sized silver powder;
  • Green pellets formed with silver flakes present an abundance of internal micro-pores. Consequently, a re-pressing post process with prolonged isothermal holding times was required to achieve acceptable silver composite densities;
  • The MMC produced did not show the reinforcement effect due to the prolonged sintering process at relatively elevated temperatures. As a consequence, the composites showed low hardness values, which in turn allowed the hard counter electrode to imprint onto the composites’ surfaces—an effect that was more noticeable in the softer silver composites. Nonetheless, the addition of CNT reduced the contact resistance throughout all normal loads measured, with higher concentrations producing the lowest resistance values. Higher CNT concentrations also produced highly reproducible contact surfaces;
  • All MMC outperformed the reference material in fatigue tests, rapidly reaching steady-state ECR values and maintaining low resistance throughout the 20 fatigue cycles measured.
In future work, it would be of interest to evaluate the viability of different metallic powder morphology. Furthermore, studies on the influence of CNT size and chemical state (i.e., pristine or functionalized/oxidized state) could provide insight into the mechanisms behind the integration of the reinforcement phase onto the metallic powder, as well as on the homogeneity/uniformity of the reinforcement phase distribution. Moreover, microstructural analysis of the sintered samples would grant deeper insight into the lack of reinforcement effect with the addition of CNT.

Supplementary Materials

The following supporting information can be downloaded at: https://www.mdpi.com/article/10.3390/jcs7070284/s1. Figure S1: SEM micrographs of pristine CNT at different magnifications; Figure S2: Pressure variation during heating stage of HUP for (a) Ag-MMC and (b) Cu-MMC; Figure S3: 50× surface CLSM scan of green pellets (pre-sintered samples) showing three linear roughness scans in regions with open porosities; Figure S4: Surface SEM micrograph of consolidated a) silver flakes and b) dendritic copper powder; Figure S5: Kernel density estimation plot of ECR during multiple fatigue cycles of CNT reinforced Ag matrices. (a) Ag 0%, (b) Ag 0.5%, (c) Ag 0.75%, and (d) Ag 1%. Note the different y-axis ranges; Table S1: Roughness values prior to and post-fatigue tests of silver MMC, as well as approximate imprint diameter left by counter electrode; Figure S6: Kernel density estimation plot of ECR during multiple fatigue cycles of CNT reinforced Cu matrices. (a) Cu 0%, (b) Cu 0.5%, (c) Cu 0.75%, and (d) Cu 1%. Note the different y-axis ranges; Table S2: Roughness values prior to and post-fatigue tests of copper MMC, as well as approximate imprint diameter left by counter electrode.

Author Contributions

Conceptualization, B.A. and S.S.; methodology, B.A. and S.S.; validation, B.A.; formal analysis, B.A.; investigation, B.A.; resources, F.M.; data curation, B.A.; writing—original draft preparation, B.A.; writing—review and editing, S.S.; visualization, B.A.; supervision, S.S.; project administration, F.M. and S.S.; funding acquisition, F.M. and S.S. All authors have read and agreed to the published version of the manuscript.

Funding

This research received no external funding.

Data Availability Statement

Data available upon reasonable request from the corresponding author.

Acknowledgments

B. Alderete wishes to acknowledge the support from the German Academic Exchange Service (DAAD) and the Roberto Rocca Education Program (RREP). The authors gratefully acknowledge funding in the ZuMat project, supported by the State of Saarland from the European Regional Development Fund (Europäischen Fonds für Regionale Entwicklung, EFRE). Funding for the PFIB/SEM instrument by German Research Foundation is greatly acknowledged (INST 256/510-1 FUGG). The authors wish to thank Christoph Pauly for his assistance in the acquisition of SEM micrographs.

Conflicts of Interest

The authors declare no conflict of interest.

References

  1. Saito, R.; Dresselhaus, G.; Dresselhaus, M.S. Physical Properties of Carbon Nanotubes; Imperial College Press: London, UK, 1998; ISBN 978-1-86094-223-5. [Google Scholar]
  2. Dresselhaus, M.S.; Dresselhaus, G.; Saito, R. Physics of Carbon Nanotubes. Carbon 1995, 33, 883–891. [Google Scholar] [CrossRef]
  3. Popov, V.N. Carbon Nanotubes: Properties and Application. Mater. Sci. Eng. R Rep. 2004, 43, 61–102. [Google Scholar] [CrossRef]
  4. Saifuddin, N.; Raziah, A.Z.; Junizah, A.R. Carbon Nanotubes: A Review on Structure and Their Interaction with Proteins. J. Chem. 2013, 2013, 18. [Google Scholar] [CrossRef] [Green Version]
  5. Nasir, S.; Hussein, M.Z.; Zainal, Z.; Yusof, N.A. Carbon-Based Nanomaterials/Allotropes: A Glimpse of Their Synthesis, Properties and Some Applications. Materials 2018, 11, 295. [Google Scholar] [CrossRef] [Green Version]
  6. Ebbesen, T.W. Carbon Nanotubes. Chem. Eng. News 2001, 79, 11. [Google Scholar]
  7. Maiti, A.; Svizhenko, A.; Anantram, M.P. Electronic Transport through Carbon Nanotubes: Effects of Structural Deformation and Tube Chirality. Phys. Rev. Lett. 2002, 88, 4. [Google Scholar] [CrossRef] [Green Version]
  8. Yanagi, K.; Udoguchi, H.; Sagitani, S.; Oshima, Y.; Takenobu, T.; Kataura, H.; Ishida, T.; Matsuda, K.; Maniwa, Y. Transport Mechanisms in Metallic and Semiconducting Single-Wall Carbon Nanotube Networks. ACS Nano 2010, 4, 4027–4032. [Google Scholar] [CrossRef]
  9. Krupke, R.; Hennrich, F.; Löhneysen, H.V.; Kappes, M.M. Separation of Metallic from Semiconducting Single-Walled Carbon Nanotubes. Science 2003, 301, 344–347. [Google Scholar] [CrossRef] [Green Version]
  10. Robertson, J.; Zhong, G.; Hofmann, S.; Bayer, B.C.; Esconjauregui, C.S.; Telg, H.; Thomsen, C. Use of Carbon Nanotubes for VLSI Interconnects. Diam. Relat. Mater. 2009, 18, 957–962. [Google Scholar] [CrossRef]
  11. Ando, T.; Matsumura, H.; Nakanishi, T. Theory of Ballistic Transport in Carbon Nanotubes. Physica B 2002, 323, 44–50. [Google Scholar] [CrossRef]
  12. Svizhenko, A.; Anantram, M.P.; Govindan, T.R. Ballistic Transport and Electrostatics in Metallic Carbon Nanotubes. IEEE Trans. Nanotechnol. 2005, 4, 557–562. [Google Scholar] [CrossRef]
  13. Li, H.J.; Lu, W.G.; Li, J.J.; Bai, X.D.; Gu, C.Z. Multichannel Ballistic Transport in Multiwall Carbon Nanotubes. Phys. Rev. Lett. 2005, 95, 086601. [Google Scholar] [CrossRef] [PubMed] [Green Version]
  14. Van Der Veen, M.H.; Barbarin, Y.; Kashiwagi, Y.; Tokei, Z. Electron Mean-Free Path for CNT in Vertical Interconnects Approaches Cu. In Proceedings of the 2014 IEEE International Interconnect Technology Conference/Advanced Metallization Conference, San Jose, CA, USA, 20–23 May 2014; pp. 181–184. [Google Scholar]
  15. Li, H.; Yin, W.Y.; Banerjee, K.; Mao, J.F. Circuit Modeling and Performance Analysis of Multi-Walled Carbon Nanotube Interconnects. IEEE Trans. Electron. Devices 2008, 55, 1328–1337. [Google Scholar] [CrossRef] [Green Version]
  16. Che, J.; Tahiŗ, T.; Gın, Ť.; Iii, W.A.G. Thermal Conductivity of Carbon Nanotubes. Nanotechnology 2000, 11, 65–69. [Google Scholar] [CrossRef]
  17. Osman, M.A.; Srivastava, D. Temperature Dependence of the Thermal Conductivity of Single-Wall Carbon Nanotubes. Nanotechnology 2001, 12, 21–24. [Google Scholar] [CrossRef]
  18. Kim, P.; Shi, L.; Majumdar, A.; McEuen, P.L. Thermal Transport Measurements of Individual Multiwalled Nanotubes. Phys. Rev. Lett. 2001, 87, 215502. [Google Scholar] [CrossRef] [Green Version]
  19. Graebner, J.E. Thermal Conductivity of Diamond. In Diamond: Electronic Properties and Applications; Springer: Boston, MA, USA, 1995; pp. 285–318. [Google Scholar]
  20. Braunovic, M. Effect of Connection Design on the Contact Resistance of High Power Overlapping Bolted Joints. IEEE Trans. Compon. Packag. Technol. 2002, 25, 642–650. [Google Scholar] [CrossRef]
  21. Suarez, S.; Rosenkranz, A.; Gachot, C.; Mücklich, F. Enhanced Tribological Properties of MWCNT/Ni Bulk Composites—Influence of Processing on Friction and Wear Behaviour. Carbon 2014, 66, 164–171. [Google Scholar] [CrossRef]
  22. Reinert, L.; Suarez, S.; Rosenkranz, A. Tribo-Mechanisms of Carbon Nanotubes: Friction and Wear Behavior of CNT-Reinforced Nickel Matrix Composites and CNT-Coated Bulk Nickel. Lubricants 2016, 4, 11. [Google Scholar] [CrossRef] [Green Version]
  23. Suarez, S.; Souza, N.; Lasserre, F.; Mücklich, F. Influence of the Reinforcement Distribution and Interface on the Electronic Transport Properties of MWCNT-Reinforced Metal Matrix Composites. Adv. Eng. Mater. 2016, 18, 1626–1633. [Google Scholar] [CrossRef] [Green Version]
  24. Alderete, B.; Mücklich, F.; Suarez, S. Characterization and Electrical Analysis of Carbon-Based Solid Lubricant Coatings. Carbon Trends 2022, 7, 100156. [Google Scholar] [CrossRef]
  25. Alderete, B.; Suarez, S.; Tejeda, D.B.; Mücklich, F. Fretting and Electrical Contact Resistance Characteristics of Carbon Nanoparticle-Coated Cu Electrical Contacts. In Proceedings of the 2022 IEEE 67th Holm Conference on Electrical Contacts (HLM), Tampa, FL, USA, 23–26 October 2022; pp. 1–8. [Google Scholar]
  26. Alderete, B.; Mücklich, F.; Suarez, S. Wear Reduction via CNT Coatings in Electrical Contacts Subjected to Fretting. Tribol. Lett. 2023, 71, 54. [Google Scholar] [CrossRef]
  27. Kozbial, A.; Zhou, F.; Li, Z.; Liu, H.; Li, L. Are Graphitic Surfaces Hydrophobic? Acc. Chem. Res. 2016, 49, 2765–2773. [Google Scholar] [CrossRef] [PubMed]
  28. Alderete, B.; Lößlein, S.M.; Bucio Tejeda, D.; Mücklich, F.; Suarez, S. Feasibility of Carbon Nanoparticle Coatings as Protective Barriers for Copper─Wetting Assessment. Langmuir 2022, 38, 15209–15219. [Google Scholar] [CrossRef]
  29. Alderete, B.; MacLucas, T.; Espin, D.; Brühl, S.P.; Mücklich, F.; Suarez, S. Near Superhydrophobic Carbon Nanotube Coatings Obtained via Electrophoretic Deposition on Low-Alloy Steels. Adv. Eng. Mater. 2021, 23, 2001448. [Google Scholar] [CrossRef]
  30. Feng, Y.; Yuan, H.L.; Zhang, M. Fabrication and Properties of Silver-Matrix Composites Reinforced by Carbon Nanotubes. Mater. Charact. 2005, 55, 211–218. [Google Scholar] [CrossRef]
  31. Silvestre, N. State-of-the-Art Review on Carbon Nanotube Reinforced Metal Matrix Composites. Int. J. Compos. Mater. 2013, 2013, 28–44. [Google Scholar] [CrossRef]
  32. Jamwal, A.; Mittal, P.; Agrawal, R.; Gupta, S.; Kumar, D.; Sadasivuni, K.K.; Gupta, P. Towards Sustainable Copper Matrix Composites: Manufacturing Routes with Structural, Mechanical, Electrical and Corrosion Behaviour. J. Compos. Mater. 2020, 54, 2635–2649. [Google Scholar] [CrossRef]
  33. Suarez, S.; Lasserre, F.; Mücklich, F. Mechanical Properties of MWNT/Ni Bulk Composites: Influence of the Microstructural Refinement on the Hardness. Mater. Sci. Eng. A 2013, 587, 381–386. [Google Scholar] [CrossRef]
  34. Pérez, E.M.; Martín, N. π-π Interactions in Carbon Nanostructures. Chem. Soc. Rev. 2015, 44, 6425–6433. [Google Scholar] [CrossRef]
  35. Klinovaja, J.; Schmidt, M.J.; Braunecker, B.; Loss, D. Carbon Nanotubes in Electric and Magnetic Fields. Phys. Rev. B 2011, 84, 085452. [Google Scholar] [CrossRef] [Green Version]
  36. Puyol, R.; Suarez, S. A Contact Resistance Measurement Setup for the Study of Novel Contacts. In Proceedings of the IEEE URUCON, Montevideo, Uruguay, 23–25 October 2017; pp. 3–6. [Google Scholar]
  37. Suarez, S.; Alderete, B.; Puyol, R.; Mücklich, F. Load-Dependent Electrical Contact Resistance of Carbon Nanotube-Reinforced Metal Matrix Composites. In Proceedings of the 2022 IEEE 67th Holm Conference on Electrical Contacts (HLM), Tampa, FL, USA, 23–26 October 2022; pp. 1–6. [Google Scholar]
  38. Bock, E.M. Low-Level Contact Resistance Characterization. AMP J. Technol. 1993, 3, 64–68. [Google Scholar]
  39. Guiderdoni, C.; Pavlenko, E.; Turq, V.; Weibel, A.; Puech, P.; Estournes, C.; Peigney, A.; Bacsa, W.; Laurent, C. The preparation of carbon nanotube (CNT)/copper composites and the effect of the number of CNT walls on their hardness, friction and wear properties. Carbon 2013, 58, 185–197. [Google Scholar] [CrossRef] [Green Version]
  40. Hilding, J.; Grulke, E.A.; George Zhang, Z.; Lockwood, F. Dispersion of Carbon Nanotubes in Liquids. J. Dispers. Sci. Technol. 2003, 24, 1–41. [Google Scholar] [CrossRef]
  41. Reinert, L.; Zeiger, M.; Suárez, S.; Presser, V.; Mücklich, F. Dispersion Analysis of Carbon Nanotubes, Carbon Onions, and Nanodiamonds for Their Application as Reinforcement Phase in Nickel Metal Matrix Composites. RSC Adv. 2015, 5, 95149–95159. [Google Scholar] [CrossRef] [Green Version]
  42. Zener, C. Theory of D0 for Atomic Diffusion in Metals. J. Appl. Phys. 1951, 22, 372–375. [Google Scholar] [CrossRef]
  43. Tomizuka, C.T.; Sonder, E. Self-Diffusion in Silver. Phys. Rev. 1956, 103, 1182–1184. [Google Scholar] [CrossRef]
  44. Kuper, A.; Letaw, H.; Slifkin, L.; Sonder, E.; Tomizuka, C.T. Self-Diffusion in Copper. Phys. Rev. 1954, 96, 1224–1225. [Google Scholar] [CrossRef]
  45. Burton, J.J. Analysis of Silver Self-Diffusion Data. Philos. Mag. A J. Theor. Exp. Appl. Phys. 1974, 29, 121–133. [Google Scholar] [CrossRef]
  46. Slade, P.G. Electrical Contacts Principles and Applications, 2nd ed.; Slade, P.G., Ed.; Taylor & Francis: Boca Raton, FL, USA, 2014; ISBN 13:978-1138077102. [Google Scholar]
  47. Kang, S.-J. Sintering: Densification, Grain Growth and Microstructure, 1st ed.; Butterworth-Heinemann: Oxford, UK, 2005; ISBN 9780750663854. [Google Scholar]
  48. Suarez, S. Development of Carbon Nanotube-Reinforced Nickel Matrix Composites: Processing, Microstructure and Physical Properties. Ph.D. Thesis, Universität des Saarlandes, Saarbrücken, Germany, 2014. [Google Scholar]
  49. García, D.; Suárez, S.; Aristizábal, K.; Mücklich, F. Powder-Metallurgical Fabrication and Electrical Contact Resistance Characterization of Copper–Nickel Composites Reinforced by Multiwalled Carbon Nanotubes. Adv. Eng. Mater. 2022, 24, 2100755. [Google Scholar] [CrossRef]
Figure 1. Powder mixture process, schematic representation.
Jcs 07 00284 g001
Figure 2. Schematic representation of HUP.
Jcs 07 00284 g002
Figure 3. SEM micrograph of: (a) pristine silver flakes and (b) dendritic copper, CNT reinforced (c) silver flakes and (d) dendritic copper. (e,f) show a magnified micrograph of the CNT reinforced silver and copper powder, respectively.
Jcs 07 00284 g003
Figure 4. FIB cross section of consolidated (a) silver flakes and (b) dendritic copper powder. Magnified view of the consolidated (c) silver and (d) copper pellets.
Jcs 07 00284 g004
Figure 5. 3 × 3 stitching at 50× CLSM scan of CNT reinforced samples’ surface. (a) Ag 0.5%, (b) Cu 0.5%, (c) Ag 0.75%, (d) Cu 0.75%, (e) Ag 1%, and (f) Cu 1%.
Jcs 07 00284 g005
Figure 6. Two cycles of load dependent ECR of CNT reinforced Ag matrices. (a) Ag 0%, (b) Ag 0.5%, (c) Ag 0.75%, and (d) Ag 1%.
Jcs 07 00284 g006
Figure 7. Two cycles of load dependent ECR of CNT reinforced Cu matrices. (a) Cu 0%, (b) Cu 0.5%, (c) Cu 0.75%, and (d) Cu 1%.
Jcs 07 00284 g007
Figure 8. Fatigue cycle tests of CNT reinforced Ag matrices. (a) Ag 0%, (b) Ag 0.5%, (c) Ag 0.75%, and (d) Ag 1%. The radial lines indicate the progression of fatigue cycles (clockwise). Error in measurements below 5%.
Jcs 07 00284 g008
Figure 9. Fatigue cycle tests of CNT reinforced Cu matrices. (a) Cu 0%, (b) Cu 0.5%, (c) Cu 0.75%, and (d) Cu 1%. The radial lines indicate the progression of fatigue cycles (clockwise). Error in measurements below 5%.
Jcs 07 00284 g009
Table 1. Sintered MMC relative density and hardness.
Reinforcement Concentration/wt.%Ag-p *Ag **Cu
Relative density/%0.5649995
0.75749299
1789999
Hardness/MPa0 ***847 ± 61-1335 ± 82
0.5-515 ± 21582 ± 93
0.75-351 ± 18467 ± 96
1-505 ± 37619 ± 88
* Low density silver samples sintered for 2.5 h isothermal holding time. ** Re-pressed silver samples sintered for an additional 7.5 h isothermal holding time. *** Reference samples from high-purity rods.
Table 2. Roughness values prior to and post-ECR of silver and copper MMC, as well as approximate imprint diameter left by counter electrode.
Roughness Prior to ECR/nmRoughness Post-ECR/nmImprint Diameter/µm
Ag 0%10 ± 1040 ± 1047.7 ± 4.4
Ag 0.5%20 ± 10100 ± 1087.2 ± 1.5
Ag 0.75%40 ± 10130 ± 20119.9 ± 5.1
Ag 1%60 ± 10110 ± 1098.2 ± 2.1
Cu 0.5%10 ± 10110 ± 2095.2 ± 5.9
Cu 0.75%10 ± 10120 ± 20101.5 ± 3.6
Cu 1%10 ± 10110 ± 2094.2 ± 2.8
Disclaimer/Publisher’s Note: The statements, opinions and data contained in all publications are solely those of the individual author(s) and contributor(s) and not of MDPI and/or the editor(s). MDPI and/or the editor(s) disclaim responsibility for any injury to people or property resulting from any ideas, methods, instructions or products referred to in the content.

