1. Introduction
The use of 3D printing has recently begun to emerge as an important commercial manufacturing technology [
1]. After thorough development, this technology is used to produce functional parts made from a variety of metals, polymers, ceramics and composite materials depending on the application [
2] and has swiftly occupied a key position in modern manufacturing [
3]. For instance, in the biomedical industry, 3D printing has enabled competent manufacture of implants, hip and knee replacements [
4,
5,
6], which have successfully replaced some conventionally manufactured parts. Consequently, 3D manufacturing technology is fast growing with a current estimation of USD 55.8 billion global value in 2027 with a compound annual growth rate (CAGR) of 23% [
7].
However, consistent challenges, such as non-uniform material properties, poor interlaminar bonding and a knowledge gap in relation to the material properties and behaviour of 3D-printing materials hinders its growth and application in structural applications. The most common challenge is the knowledge gap in terms of the material properties of additive manufactured materials. There are a limited number of materials that have been studied for additive manufacturing applications, especially in different environmental conditions [
8]. Due to the lack of materials knowledge, there is poor repeatability and consistency in the properties of printed parts. Another challenge is the lack of transparent certification and qualification standards for 3D-printed processes [
9], which occasionally leads to relatively poor and inconsistent material properties of parts. Industries are seeking new opportunities for manufacturing complex components with enhanced mechanical properties. Exploring the possibilities of additive manufactured materials and eliminating the challenges could bring a paradigm shift from design for manufacture to manufacture for design and potentially provide a broad range of materials for various applications.
At the manufacturing stage, individual layers are deposited one at a time. As such, there is a duration of time between each layer deposition where the properties of the deposited material can change, and can, therefore, now differ from the fresh material to be deposited. This difference in properties typically results in the greatest weakness of 3D printing—poor interlaminar strength. As shown in many articles in the literature [
10,
11,
12], the strength between layers of extruded material tends to be the weakest point in a printed component. Interlayer strength can be decreased further through the presence of voids and non-homogeneous materials. The addition of fillers into a polymer matrix often exacerbates these issues, significantly promoting void propagation due to the increased stiffness of the material, reducing its capability to adhere to the previous layer upon extrusion [
13]. As such, the direction of the print layer is an important factor to consider in 3D printing.
Equally important to this study is polyamide 6 (PA6), which is a widely used thermoplastic in multiple applications, including engineering, biotechnology, textile, manufacturing and for everyday products. This is due to its many attractive properties, such as high mechanical strength [
14,
15,
16], toughness [
17], high crystalline melting point and resistance to hydrocarbons [
18]. However, its favourable characteristics are limited by its high hygroscopic nature which is common to all polyamides. To improve the properties of PA6, researchers have explored using reinforcements, such as nanofillers, fibre, additive materials and solid lubricants. Common examples of these materials are fibres, glass beads, molybdenum disulfide, ceramic particles, graphite and graphene [
19]. In particular, GO nanofiller has proven to significantly improve not only the mechanical properties, but also the electrical and thermal properties of polymer composites [
20,
21,
22,
23]. Similarly, various studies have confirmed the material improvements of glass-fibre-reinforced polymer composites.
In the literature, researchers have investigated PA6 polymer matrix and graphene nanoplatelets (GNP), among other fillers, using fused deposition modelling (FDM). One of the studies [
8] showed the addition of fibre and nanofiller yielded a great increase in mechanical strength and the Young’s modulus of PA6. An even greater increase was seen in a combination of both. The addition of just 0.1% of GNP increased the tensile strength of PA6 by 100% and a combination of both graphene nanoplatelets amine (GNP-NH
2) 1 wt.% and Kevlar demonstrated greater tensile strength and a Young’s modulus of elasticity of 87.6 MPa and 4.41, respectively. Further related works [
24,
25] on PA6 fibre-reinforcement (isotropic and concentric infill) using glass, carbon and Kevlar fibre-reinforcement on PA6 reported significant increase in tensile strength. One study [
24] reported brittle and ductile behaviours for CFRC and GFRC specimens, respectively. However, both failures exhibited an angled/shearing tensile displacement, whereas, regarding Kevlar specimens, a ductile yet lateral failure was observed.
Another recent study [
26] examined the infill orientation of 3D-printed fibre-reinforced composites using a condition-based approach. The relation between the mechanical properties and the effects of moisture was examined. Whilst using relative humidity as a benchmark for data collection, findings of moisture-induced samples showed that the stiffness and strength of the PA/CF samples decreased by 25% and 18%, respectively, when printed longitudinally (referred to as isotropic in another study [
25]) and by 45% and 70% when in a transverse configuration. Similarly, the PA/GF specimens showed a strength decrease of 25% when structured longitudinally, and an 80% and 45% decrease in stiffness and strength, when structured transversely. This suggests that there is greater significance for mechanical property retention when compositions are fashioned longitudinally.
Further studies have been performed on graphene-reinforced 3D-printed composites. Recently, two different investigations were conducted on acrylonitrile butadiene styrene (ABS) polymer composite [
27,
28]. One study investigated the behaviour of ABS polymer with GO reinforcement, and the other, graphene nanoplatelets (GNP). The first study [
27] reported the addition of GO content led to increase in the tensile strength and Young’s modulus of the ABS composites at the expense of elongation that decreased by a considerable factor. Similarly, an increase was observed in the tensile strength of ABS/GNP; however, the increase in GNP concentration demonstrated an inverse correlation [
28], whereby a direct correlation was observed between incrementally increasing GO reinforcement and the ductility of the sample.
Furthermore, despite the prior established correlation between high(er) tensile strength and brittle failures of 3D-printed fibre reinforced composites, behavioural patterns established within other applicational areas of such composites differ. This is shown in a study [
29], where the ability to simultaneously improve ductility, compressive strength, and flexural stiffness within glass-fibre-reinforced plastic (GFRP) column and beam structures for civil engineering applications is presented. Continuing with compressive and flexural strength, a study [
30] investigated these properties in 3D-printed PA6/CF composites where increasing fibre content also yielded an increase in strength and, in turn, their corresponding compression and flexural moduli. Another study [
31] investigated the manufacturing process using acetone dispersion techniques for graphene oxide. The difficulty in dispersion of larger graphene quantities (0.1 wt%) was noted by the researchers, which led to bundling and stacking of the platelets during the filament fabrication process. This, in turn, resulted in a decrease in the mechanical properties, attributed to the now lower available interfacial area for reinforcement bonding.
A recent study [
32] demonstrated that print orientation is an important factor in 3D-printed fibre-reinforced compression testing composites. This was validated through 3D-printing experiments and subsequent compression testing of PA6/GF samples along both the x- and z-axes. The authors also drew comparisons with respect to the Young’s moduli; however, a contrast in results was obtained, with x-axis samples producing a larger average Young’s modulus. This was a product of the differing behaviours experienced throughout the loading cycle. Generally, both sample types exhibited an initially elastic stress–strain relation, until the yield stress (σ
y) was reached. After this point, a non-linear plasticization tendency follows, until the point of fracture. However, z-axis specimens showed a solely linear elastic portion, whereas x-axis prints upheld differing variances of non-linear elastic regions. In turn, a higher degree of accuracy (less typical deviation) was obtained by z-axis samples over x-axis samples. Upon further investigation, the sporadic failures experienced by the x-axis samples could be accounted for. Amid the compression process, x-axis samples experienced local buckling. This was due to their configuration not allowing a directly downward crumpling effect. In turn, a lack of consistency in sample movement and failure was established.
Considering all this evidence, questions are raised about the material properties of 3D-printed PA6/GO and PA6/GF composites, which will be investigated in this study to assess their applicability in electrically motorized car battery box manufacture. Several studies [
8] have been conducted on the behaviour and mechanical properties of PA6 and its composites. However, a comprehensive study on the properties of the 3D-printed materials, specifically in different temperature conditions, are lacking to support product manufacture due to a lack of consensus concerning the mechanical properties. Thus, this study considers three conditions: dry/ambient temperature (20 °C), wet/ambient temperature (soaked in water at 10 °C for 2 h), and dry/high temperature at (120 °C). The importance and originality of this study is that it provides a comprehensive understanding of the behaviour of 3D-printed PA6 and its modified GO and GF composites for structural application under ambient, wet and high temperature conditions related to battery box operating conditions.
2. Materials and Methods
2.1. Materials
Commercially available filaments supplied by POLYMAKER CA were used in this study for neat PA6 filament and glass-fibre-reinforced polyamide 6 (PA6/GF 30%wt), each with a diameter of 1.75 mm. It should be noted that the ‘neat PA6′ denotation refers to a co-polymer of PA6 and PA66 (PolyMide CoPA) without any reinforcement. One of the most common challenges of 3D printing PA6 is its high susceptibility to warping. Therefore, PolyMide CoPA, a thermoplastic material based on a copolymer of PA6 and PA6,6, was used in place of pure PA6 filaments due to its advantage of providing remarkable dimensional stability during printing with negligible deformations, indicating minimal warping. The neat PA6 sample provides a medium for dispersion of graphene and the PA6/GF 30%wt sample a benchmark for reinforced filament for comparison between both. The acquired filaments were stored in an airtight box to minimise moisture absorption.
Graphite flakes were sourced from Sigma Aldrich and 99% liquid methanol was sourced from Acron. Potassium permanganate, hydrogen peroxide, hydrochloric acid and sulphuric acid were also supplied by Sigma Aldrich for in situ synthesis of GO.
2.1.1. GO Synthesis/Sample Preparation
GO was synthesised using a modified Hummers method [
33]. The improved method involves the oxidisation of graphite by treating it with a solution primarily made up of sulphuric acid and potassium permanganate. The use of this chemical treatment minimises the toxic by-product associated with the regular Hummers method and has been shown to produce equally potent graphene oxide in significantly less time. In the synthesis, 1 g of natural graphite flake was stirred in 23 mL of sulphuric acid for 15 min with the temperature maintained below 5 °C. Potassium permanganate (3 g) was added slowly with the temperature maintained at around 45 °C. The reaction mixture was stirred for 2 h. Deionised water (50 mL) was then added, and the temperature was observed to increase to 90 °C. The reaction mixture was stirred for a further 30 min before adding 150 mL of water and 5 ml of 30% hydrogen peroxide solution to stop the reaction. Graphite oxide was separated from the reaction mixture by vacuum filtration. Graphite oxide filtrate was then washed and filtered with 250 mL of 10% hydrochloric acid and subsequently 250 mL of deionised water was added to the yield.
The graphene oxide ‘cake’ was then powdered through milling the segments using a mortar and pestle, followed by using an IKA Ultra Turrax ball mill, and then left to dry at room temperature for 3 days. This process of drying at room temperature occurred in stages. A 5 g load of GO was milled at each time period—the quantity was limited to 5 g in order to maintain high-speed collisions. An excessively filled vial produces low-speed collisions and, in turn, produces larger particles. For each GO sample size of 5 g, the milling process was completed in a total of 50 min. To begin with, the sample was milled at a speed setting of 7 for 25 min. After the initial run of milling, the vial was shaken by hand to properly mix the sample and prevent it from settling at the bottom. Following the agitation process, the second milling process was performed at the same speed setting for another 25 min to ensure the sample was completely ground and no large particles remained. Once the milling process was complete, the powder was collected in a clean beaker through a fine mesh sieve and characterised using SEM. The milling cycle was repeated to convert a total of 15 g of GO required for this study.
2.1.2. Filament Manufacturing
The dispersion of graphene is one of the crucial factors that determines the material property of the composite [
34]. The interaction between GO powder and the PA6 matrix is paramount to this study and is important to ensure efficient stress distribution of the GO reinforcement; thus, additional precautions were taken to ensure adequate graphene dispersion. Ball-milling, solvent-blending and melt-extrusion physical methods were employed in this study.
PA6 filaments (19.98 g) were chopped into 2–3 mm length sizes using a pelletiser and mixed with paraffin oil (2 drops), ensuring that all pellets absorbed the oil. A quantity of 0.02 g of GO (0.1 wt%) was then added to the pellet and oil mixture and this was allowed to rest for 5 min to ensure the GO powder was completely dispersed in the mixture. A visual examination was performed to verify all pellets were coated with GO powder and GO had not concentrated to form lumps. Visible agglomerations of GO powder were separated using a spatula and the sample was left to mix for an additional 5 min. The weight of the sample was monitored and logged throughout the entire process to maintain accuracy. These materials were then fed to a twin-screw extruder (TwinTech Extrusion Ltd.) to manufacture modified filaments. A cooling system was featured in the twin extruder to moderate the temperature zones and limit heat creep effects. Zone temperatures were set to 180 °C, 250 °C, 240 °C, 220 °C and 220 °C in Zones 1, 2, 3, 4 and the die, respectively, with the twin-screw extruder rotating at a speed of 50 rpm [
35].
Double extrusion was employed in this study to ensure homogeneous dispersion of graphene oxide in the matrix. Filament exiting the die first underwent a post-cure treatment by submerging in a cold-water bath and was pelletised again into 2–3 mm length sizes. The chopped filaments were fed into the extruder in the second round and the process was repeated, producing a PA6/GO filament sample using a double-extrusion method, resulting in final sets of filaments of 1.75 mm diameter. Visual observation and periodic measurements using a calliper were taken to maintain a consistent filament diameter. After production, a quality control process was performed to verify no irregularities existed in the filaments. Following filament verification, the samples were wound onto empty filament spools and stored at room temperature in an airtight box.
2.1.3. Test Samples Manufacturing
Due to the hygroscopic nature of PA6, the filaments were dried in a convection oven at 80 °C for 12 h to remove all moisture present in the sample prior to all printing. This process significantly improves the quality of the print and minimises the risk of warping. Tensile (ASTM D638 Type I) and compression (ASTM D695) test samples were 3D-printed using fused-deposition modelling (FDM) technique. Intamsys Funmat HT PRO FDM 3D printer was used to print dry/ambient samples. A further set of samples to be tested under differing conditions were printed on a modified Ender 5 Pro 3D printer manufactured by Shenzhen Creality 3D Technology Co., Ltd. in China. The printer features an upgraded all-metal hot-end with accompanying firmware and a hardened steel nozzle. These modifications of the Ender 5 Pro printer were necessary to allow for both the higher temperatures required by PA6 and the use of abrasive fillers (glass fibre) which can degrade brass nozzles. The steel nozzle was maintained for all prints to ensure accuracy. Samples were printed for differing parameters due to their composition, with the key parameters detailed in
Table 1.
The infill configuration is fundamental to the structural integrity of the samples; however, current engineering testing standards do not stipulate the infill requirements for 3D-printed samples. Due to this lack of information, it was decided to utilise an infill which would provide the strongest sample possible, so the sample would fail due to exceeding the material’s capabilities rather than based on a manufacturing decision. For tensile samples, both concentric and parallel line infills were considered. Concentric infills were initially selected due to the uniform join between the walls and infill; however, this was dismissed as a possible choice after test prints revealed an increased density of filament deposited at the centre of the sample. This resulted in an uneven density distribution across the sample, and, in some cases, burning of the filament due to an increased number of passes by the hot-end, which, in turn, led to thermal degradation of the polymer. Instead, a parallel line configuration was selected, with infill lines parallel to the length of the sample and, thus, perpendicular to the direction of strain. This resulted in the inter-layer joins facing opposite to the direction of strain, increasing the sample strength. This configuration presented its own drawbacks, however, such as the termination of infill lines at the point of maximum strain, which could lead to weakness in the sample. To mitigate this issue, an increased overlap percentage between the infill and the walls was used to impregnate the infill termination points deep within the wall, increasing strength.
The compression samples faced similar considerations with regards to infill, as the infill shape was likely to influence the type of failure experienced, and, thus, the strength of the sample. A concentric infill was chosen; this was employed at the centre of the cylinder at a point where the circles would have become too small to produce with the accuracy required by FDM technology. With these considerations and parameters set, sample CAD files were sliced within Cura (Ultimaker for Ender-printed samples, and Intamsuite (Intamsys Technology Co. Ltd.) for the Funmat printer. Differing slicers were used due to the proprietary nature of the Intamsys printer; however, it was noted that the Intamsuite software was heavily based on Cura, with the same settings and modifications available, and, additionally, utilising the same slicing engine.
Samples were printed individually to ensure the parameters were correct and that the material printed smoothly. After a successful print which met quality control standards, four additional samples were manufactured in pairs using the “one at a time” function within each slicer to produce the remaining samples, while still ensuring consistency of layer adhesion between the samples, as printing “all at once” may result in differing characteristics as the material has additional time to cool between extrusions. After printing, the samples were stored in airtight bags to prevent the ingress of moisture prior to their being subjected to the conditions for testing.
2.2. Material Characterisation
2.2.1. Thermogravimetric Analysis (TGA)
TGA was used to determine the thermal degradation of the various material compositions, as well as the impact of the number of extrusion iterations used throughout the production process. A TGA pellet sample size of 8 mg was used for this analysis. Three samples of each material were analysed. The pellets were produced by chopping the filament materials using a pelletiser. A platinum-based pan was used to position the TGA sample. A careful procedure was followed to ensure the pans were free from contamination and tared prior to the experiment run. Following the sample placement, TA Instruments Q500 Model equipment was used to perform the analysis. The process began at ambient temperature; then, the 8 mg pellet sample temperature was gradually increased at a constant heating rate of 10 C/min and nitrogen flowrate of 10 mL/min until an end temperature of 600 °C was achieved.
2.2.2. Scanning Electron Microscopy (SEM)
SEM was performed to characterise the modified samples. To achieve accuracy, the sample setup and parameter input of testing were investigated to establish appropriate methods. A Zeiss Evo LS10 device was used, and the samples were prepared using a Stanley knife to cut across the filament to reveal the morphology. Care was taken to ensure the size of the sample was measured according to the sample holder and gloves were used for sample preparation to avoid contamination of samples. Then, the vacuum chamber pressure was set to 100 Pa with an accelerating potential of 20 kV to investigate the behaviour of the sample with varied pressure settings at a 5 mm working distance (WD). The same input parameters were replicated across three magnifications (1000×, 2000×, and 4000×) for all samples. As a result, three microscopic images of each pellet sample (with varying filler composition and extrusion iteration) were produced.
2.2.3. Differential Scanning Calorimetry (DSC)
DSC samples were studied through the four-phase cycle method of heating followed by cooling (repeated twice). This method employed a TA Instruments Q100 Model differential scanning calorimeter. The process began at a constant initial temperature of 20 °C followed by a gradual temperature increase at a rate of 10 °C/min until a temperature of 250 °C was achieved. Next, the temperature of the sample was held again at a constant temperature, this time at 250 °C, for approximately 5 min before the uniform temperature rate was used to reverse the process, cooling the samples back to 20 °C. Once more, samples remained at 20 °C for 5 min. Similar to the TGA process, TA Instruments software was used to collect the data and to provide a plot representing the results.
2.3. Mechanical Testing
Following the printing process, the test samples went through various stages of preparation for testing. To begin with, excess brim at the edge of the samples was trimmed off using a cutter and filed using emery cloth. This created a smooth finish on the samples, thus eliminating risk of premature sample failure. Then, three different conditioning procedures were performed for each environmental condition under investigation: dry/ambient, dry/high temperature and wet/ambient. Similar to the filament preparation, the dry/ambient samples were dried in a vacuum chamber for 12 h at 80 °C prior to testing and stored in an airtight bag to allow for gradual cooling back to ambient condition. In contrast, the high/dry temperature samples were heated for 2 h at 120 °C. Thereafter, the samples were immediately tested, allowing no cooling time. This process involved adequate heating that initiated visible change in the samples and reduced strength after loading. Lastly, the wet/ambient samples were submerged in a container filled with water at a depth of about 0.1 m. The samples were left to soak for 2 h which allowed for detectable changes to occur. Following the soaking process, the samples were left to air dry for 10 min in open air to attain the condition required for testing. Next, a 50 mm gauge length of each sample was measured and marked using a measuring ruler and an ink marker that had no effect on the property of the material. Then, three measurements of the length and thickness of each sample were taken to verify that the dimensions conformed to the standards. The average measurement of each sample was also noted for result calculations. After these procedures were completed, the samples were prepared for testing.
A calibrated Instron 3382 universal testing system was used to conduct both tensile and compression tests. This was used with the Bluehill 3 software package and a universal pump. The software was configured to input data and the parameters for testing. In addition, the set-up included 500 Hz data acquisition and a 10 Hz data bandwidth rate. The maximum loading magnitude capacity of the equipment was 100 kN with a ±0.5% accuracy and a 1/200 load cell capacity.
The tensile and compression testing were conducted according to the ASTM D638 (Type I) and the ASTM D695 testing standards, respectively. The testing rate was set at 5 mm/min (tensile) and 1.3 mm/min strain (compression) at a sampling rate of 10 Hz per second. Five samples of each material specification were tested as recommended in the standards, making a total of 45 samples each for the tensile and compression tests.
3. Results and Discussion
3.1. Effect of Manufacturing Process on Thermal Properties
The material behaviour of each 3D-printed sample was studied in dry/ambient (DA), dry/high temperature (DH) and wet/ambient (WA) conditions. As is commonly known, the performance of a polymer is determined by its structure. Every condition treatment alters the structure; thus, the effects of these treatments were investigated in relation to strength, stiffness, toughness, ductility and modulus of elasticity properties.
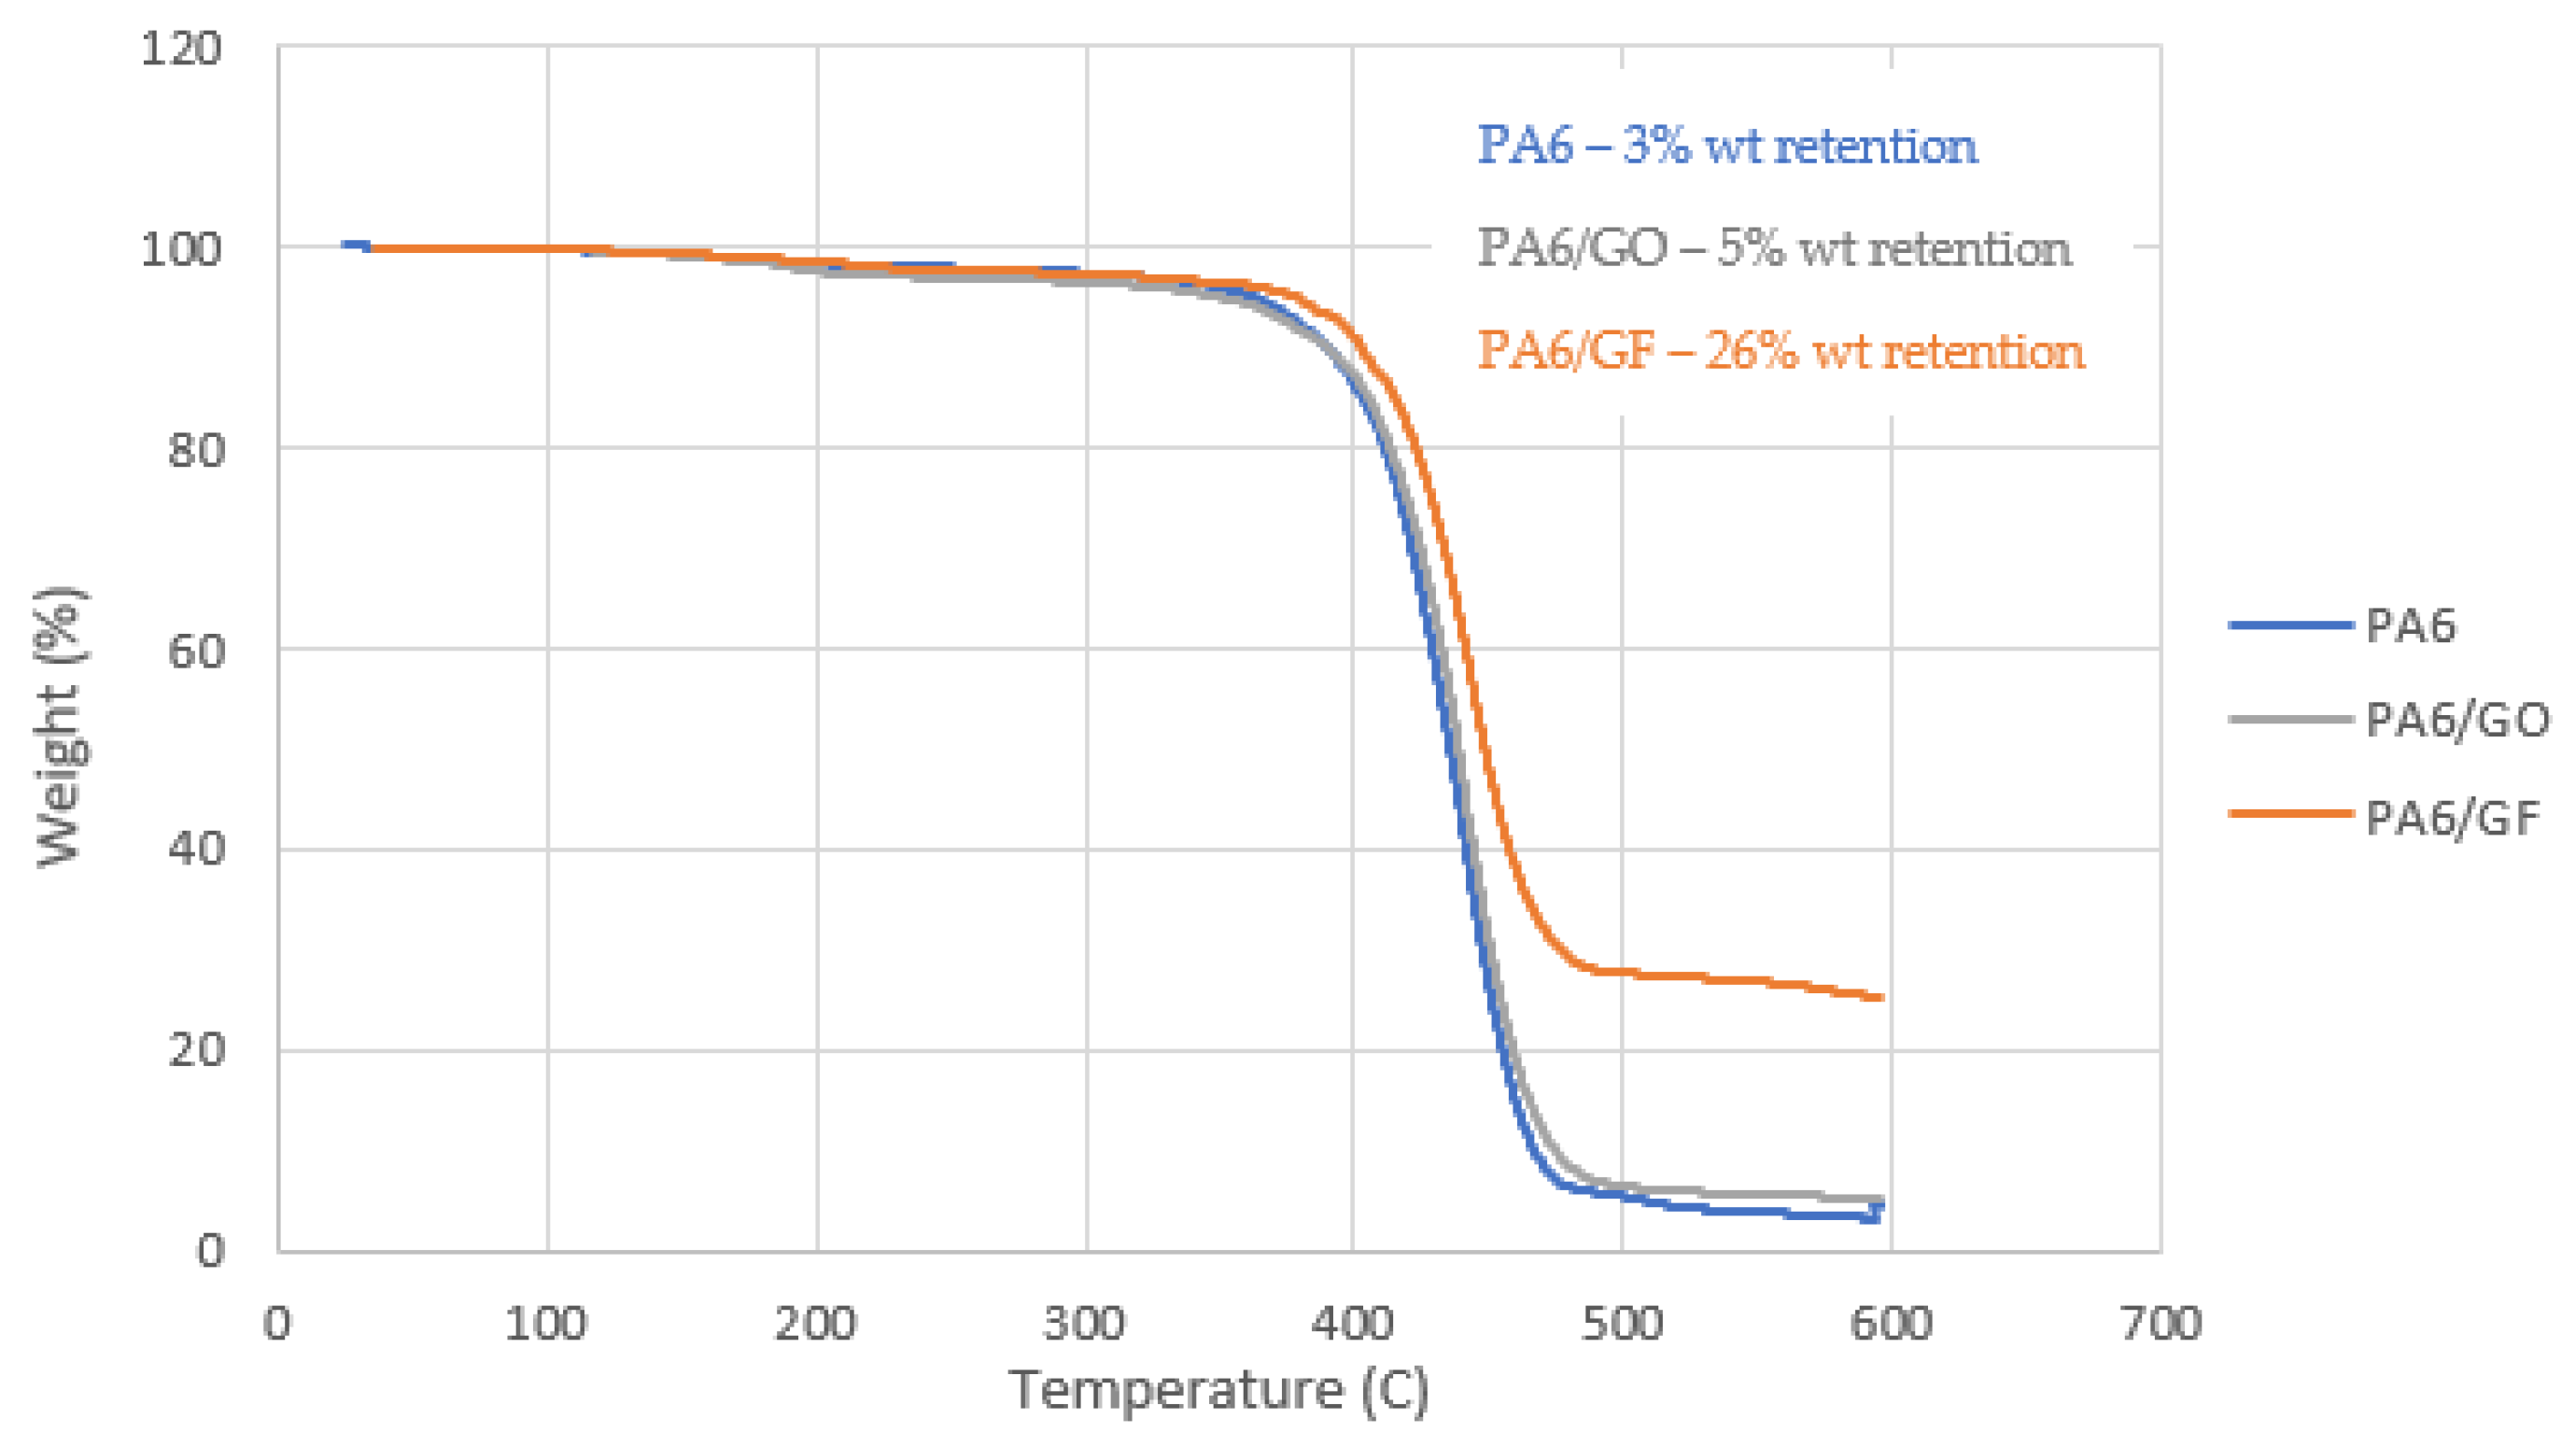
The thermal stability of a material depends on the structure of the material and the bonds that hold the material together. TGA was used to determine the thermal properties as well as the impact of the extrusion process on the filament manufacture. It measured the sample weight variation as the temperature increased from room temperature to 600 °C. The TGA thermograms indicated the materials studied maintained thermal stability during the material manufacturing stage. The extrusion iteration is important in obtaining a homogenous sample. Thus, the thermal stability of the modified sample was investigated over three extrusion iterations to ascertain its effects on the thermal properties of the material. The results showed the thermally progressing properties continued to be transferred to the PA6 matrix composite as the GO was dispersed, resulting in an inverse correlation. Therefore, increase in the number of extrusions showed a decrease in weight changes. Although up to three iterations were investigated in this study, two iterations were selected for sample manufacturing to limit the heating process samples underwent and to save time in sample manufacturing.
While less significant, the PA6 samples were also taken through three extrusion iterations to derive a baseline comparison with filled samples. As was expected, all the changes in the neat PA6 samples were not significant; however, there was a direct correlation between the weight changes and the number of extrusions. This was because the non-filled sample was put through multiple heating processes that affected the sample. Thus, while it comes to weight retention of Neat PA6 samples at high temperatures, the original off-the-shelf filament exhibited the most suitable properties.
Figure 1 shows a comparison thermogram of all three samples. As can be observed, there were no significant weight changes observed up to 155 °C in all three samples. As the temperature increased, the weight variation gradually increased. At 350 °C, a plateau in the weight was observed, followed by a steep slope which ended at different stages for each material and tended to the final weight reading until degradation occurred and the maximum temperature was achieved. A 26% weight retention was observed for the PA6/GF sample, representing the glass fibre content of the sample. Similarly, 3% and 5% weight were retained from the PA6 and PA6/GO samples, respectively.
Generally, an improvement was noted in the thermal stability of the samples with a filler content in comparison to their pure form. It should also be noted that TGA was also performed on the samples that were exposed to moisture at room temperature for three days and there were negligible differences in the results. Thus, it can be assumed that the moisture content of PA6 had no significant effect on the weight changes of the samples with temperature.
Further characterisation was performed on the samples using DSC to investigate the effects of the inclusion of filler on the melting and crystallisation behaviour of the modified samples. The minimum temperature was set to 20 °C and the maximum temperature to 250 °C, which was in accordance with the technical datasheets for PA6 and the melting behaviour experienced during extrusion. The lower range of the temperature was set to 20 °C to allow the test to capture the glass transition behaviour and the temperature of the sample, which was as low as 30 °C for moisture saturated PA6 [
36].
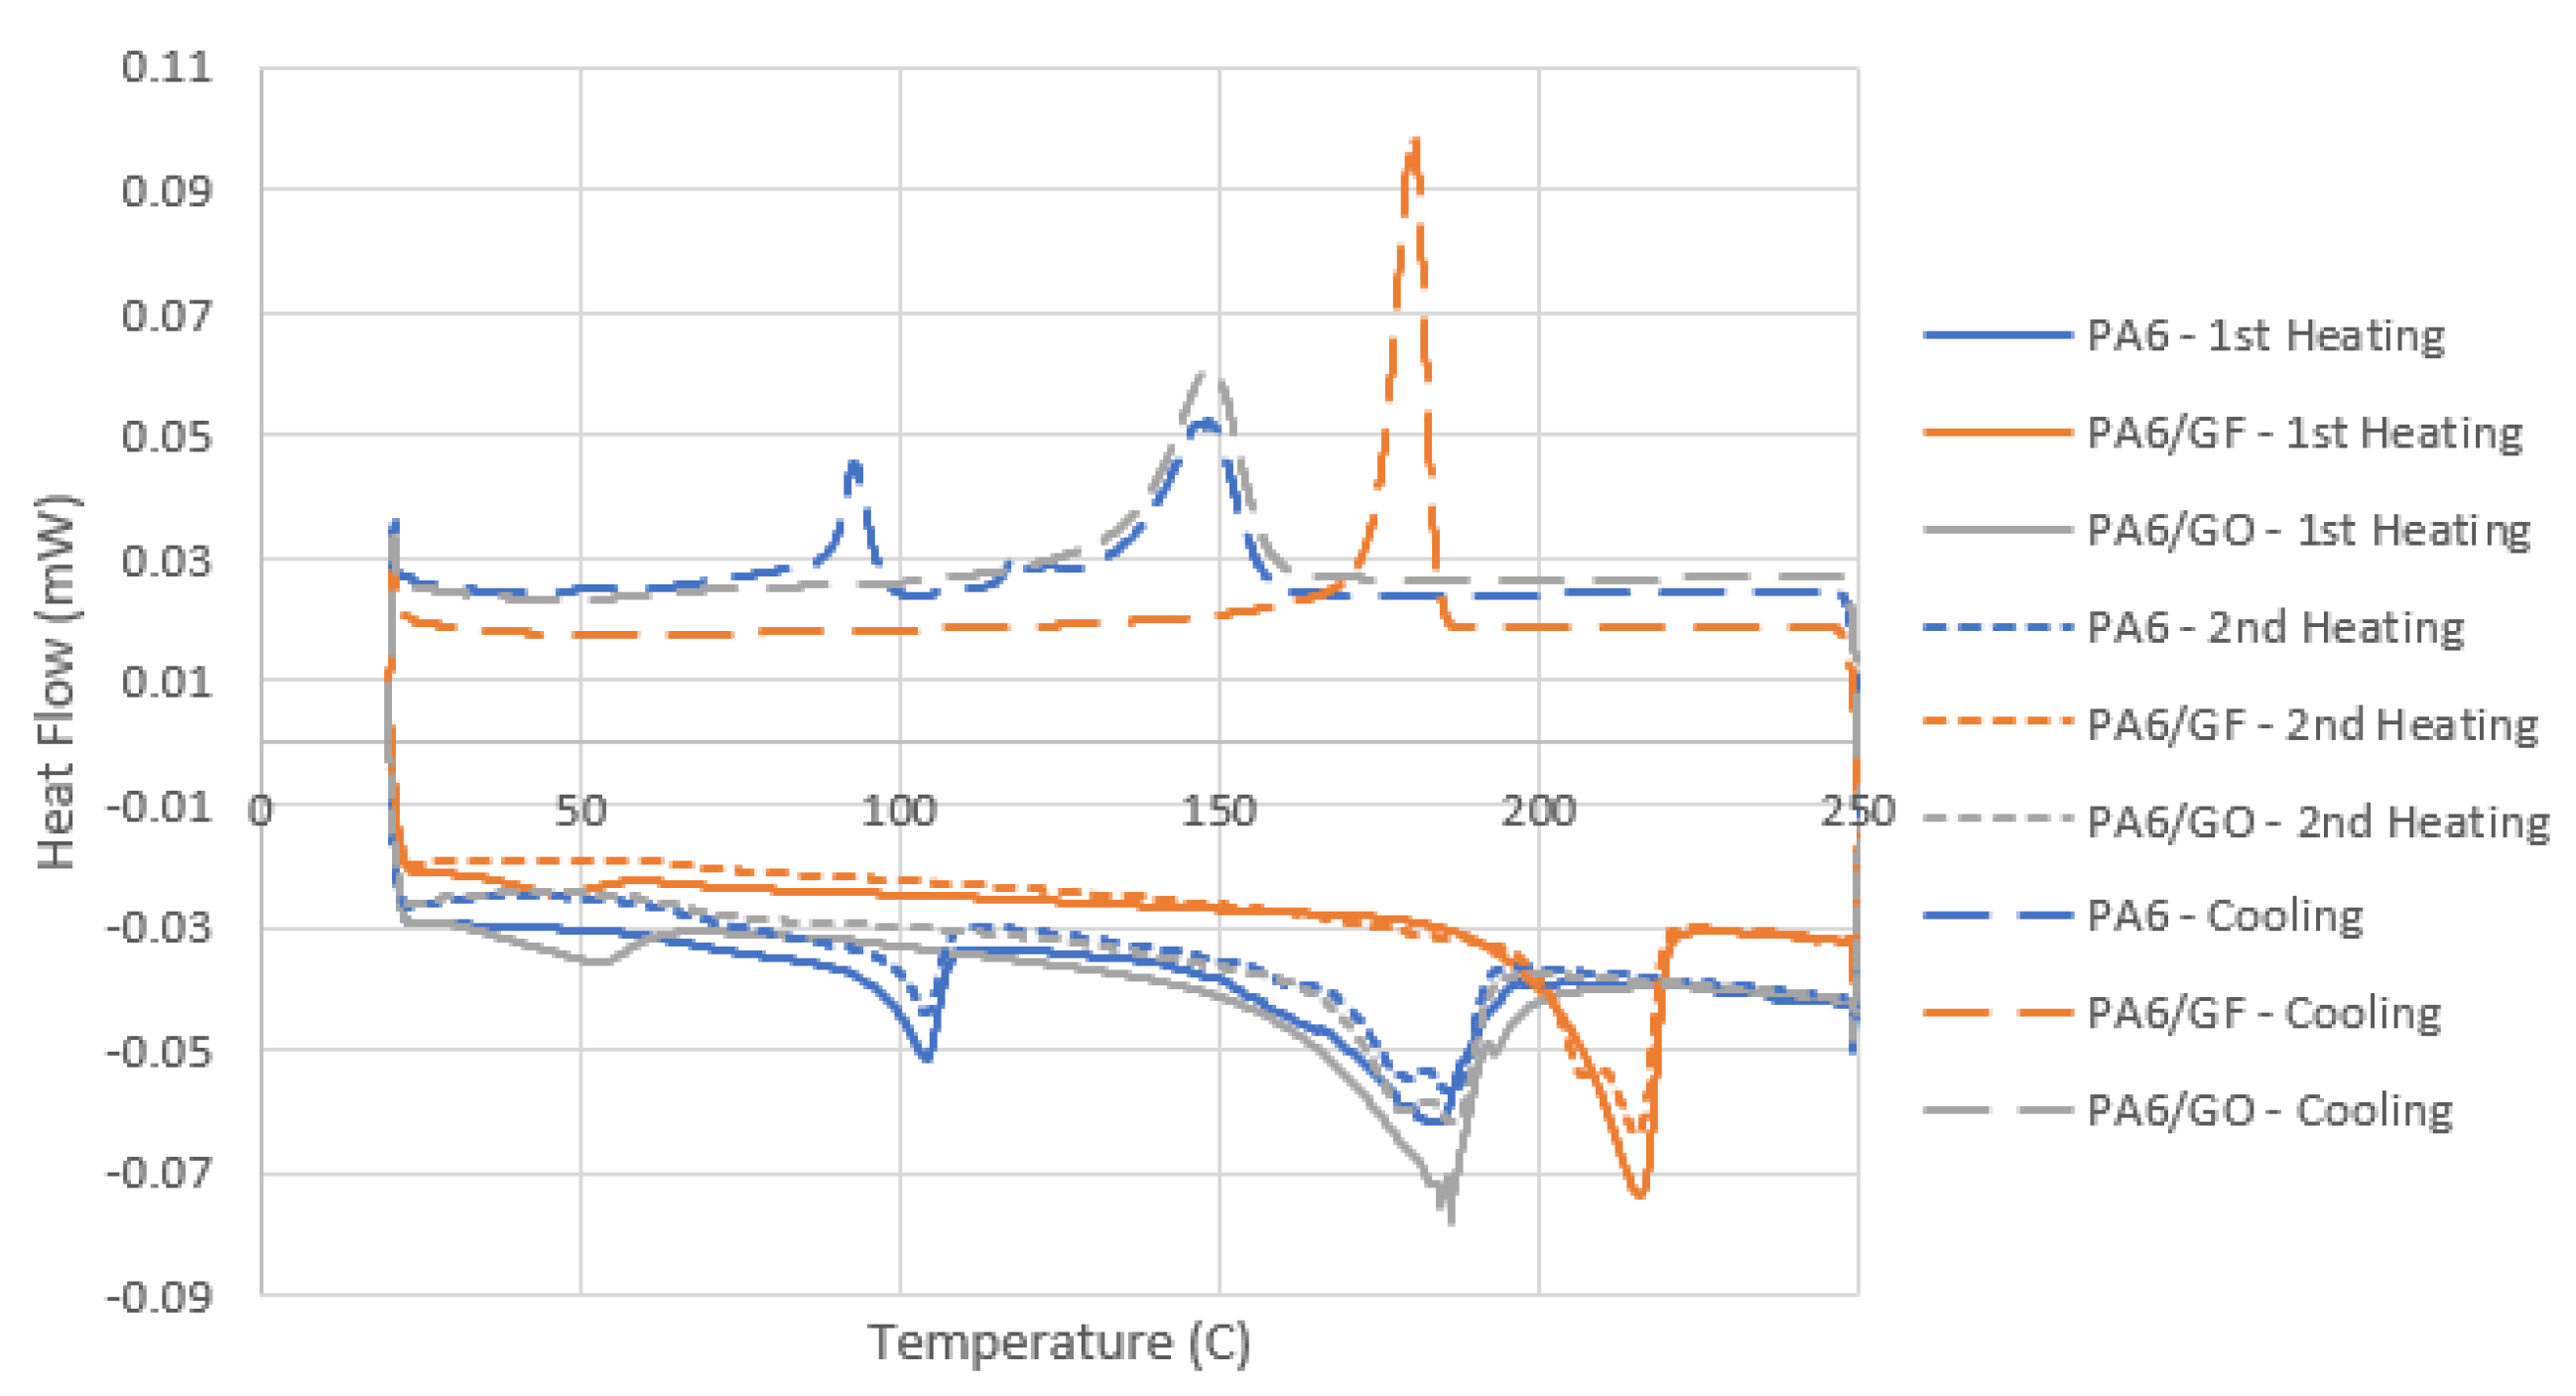
Figure 2 shows the curve for the first and second heating and cooling processes. The first and second cooling produced the same curve; thus, one diagram was used to represent both. The characteristics of interest were the glass transition and melting temperature and the crystallisation behaviour.
The DSC results showed cold crystallization did not occur in any of the samples and that the samples were fully crystallized throughout the manufacturing process, as also noted in [
37]. First heating is usually performed to erase the thermal history of the polymer composite. However, the first heating curve is important to this study as it reveals the material production history and the effects of the processes on each sample. Analysing the curve in
Figure 2, it can be seen that, during the first heat cycle, samples with fillers (PA6/GF and PA6/GO) showed minor peaks at 47 °C and 53 °C, representing the glass transition temperatures, which were lower than the 67 °C and 70 °C mentioned in the supplier’s datasheet for PA6 and PA6/GF. This could be due to the fact the thermal history is reflected in the first heating. However, the second heating curve showed results similar to the datasheet, with glass transition at a point ranging between 62 °C and 70 °C in all three samples, as summarized in
Table 2.
On further analysis, the PA6 sample showed two melting point peaks in both the first and second heating. The first peak resembled that of a semi-crystalline polymer material, confirming the nature of the sample.
In
Figure 2, the PA6/GF endothermic peak shows a bimodal structure in the second heating cycle, with maxima at 207 °C and 215 °C. The two cycles were found to be nearly identical after cooling, with a constant overlap across the graphs. At 175 °C, a single peak (the crystallisation peak) was observed. The melting temperature of both PA6 and PA6/GF were confirmed at 195 °C and 215 °C, respectively. In samples exposed to further extrusion from their processed counterparts, no change in melting temperature was detected. Furthermore, when GO was added to PA6, no change in melting temperature was detected.
The melting (endothermic) and crystallization (exothermic) peaks were also examined. Within the crystallisation peaks, there was no difference in the peak heat flow between the PA6-based samples and the PA6/GO samples, with the PA6-based samples averaging 0.06 W/g and the PA6/GO samples averaging 0.11 W/g. At their endothermic peaks, however, all sample types had identical peak heat flows, with peak values averaging 0.065 W/g. According to the literature, higher GO loading lowers the melting temperature of the sample and reduces the peak heat flow; however, the effects are much less at low loadings, such as the 0.1 wt% used in this analysis [
38]. The bimodal shape observed in the endothermic zone of the second heat cycles can be attributed both to the presence of both the α- and the γ-phase crystals PA6 induced with the constant cooling temperature of the first cooling cycle [
39].
The crystals of the α phase are more stable than those of the γ phases, so the temperature at which the γ melts is lower than that of the α phase [
40]. The assumption is that samples will enter the α phase disproportionately, with the distribution increasing even after the first heat cycle. This difference in crystal composition may also be responsible for the absence of a glass transition peak during the second heat cycle. The conduct of additional heating cycles is recommended as additional research to investigate the repeatability of this crystallization behaviour; it is predicted that the percentage of crystallinity will decrease as the GO loading increases [
41]. However, as previously discussed for the melting temperature, this effect was most noticeable at higher GO loadings than those considered in this study.
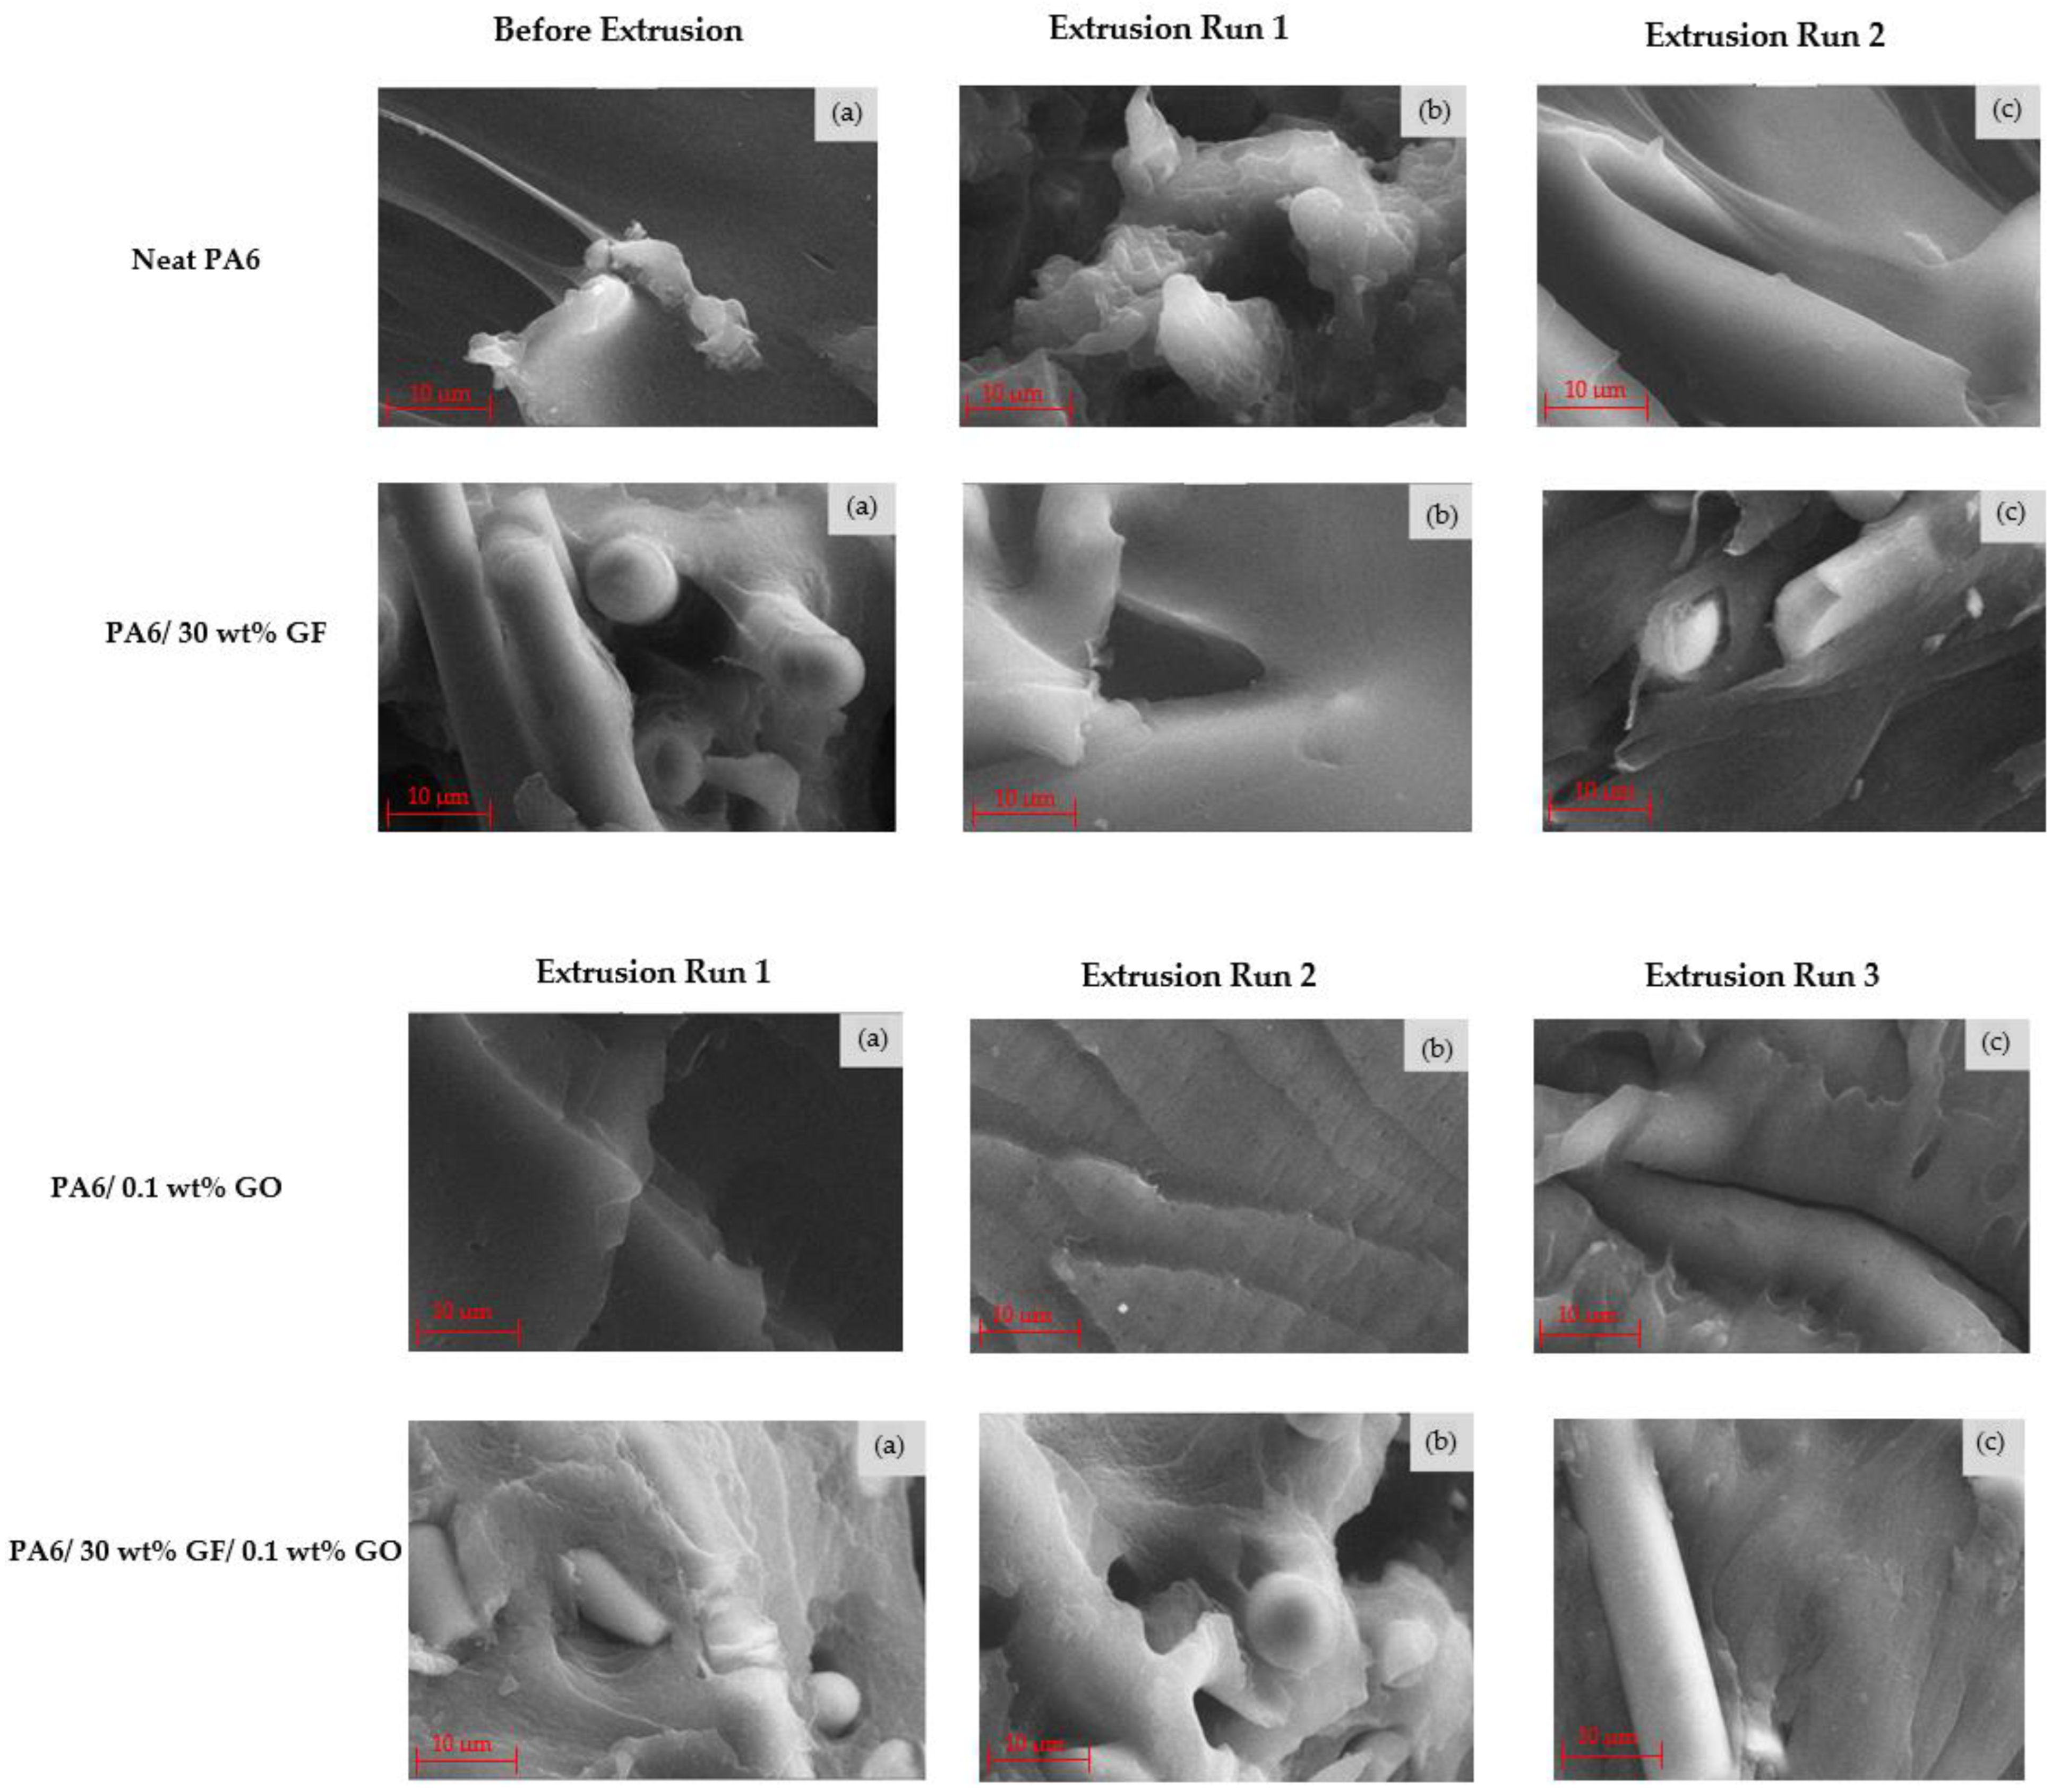
SEM images for the sample set are shown in
Figure 3. The fibres present throughout the PA6 matrix were dispersed in the matrix in a multidirectional and sporadic way, followed by alignment in the following extrusion run, leading to uniformity in the fibre direction tendency along the longitudinal direction of the filament as all fibre-fractured faces showed coinciding behaviour. In turn, given the nature of the fibre-enhancing capabilities with respect to direction [
42], greater tensile strength is assumed to be achieved in such multi-extruded filaments. The GO-reinforced samples underwent three iterations in the extrusion compounding process, leading to improved dispersion. Continuing with the GO-reinforced filament evaluations, the visual indication of GO presence was marked by the lighter-tinged powder collections, as was also observed in a previous study [
43]. As no considerable agglomeration of granules was present within the microscopic areas evaluated, this further confirmed that the GO dispersion was performed effectively throughout the entire filament. In turn, this provided a justification for the expected increase in the mechanical properties of the GO-reinforced samples. The same outcome did not occur with respect to assessment of the cross-sections of the PA6/GF/GO samples, given the saturated nature of the images with similarly tinged glass-fibre strands, allowing for no accurate determination of which reinforcement material coincided with which imaging visual.
3.2. Effect of Temperature on Tensile and Compression Properties
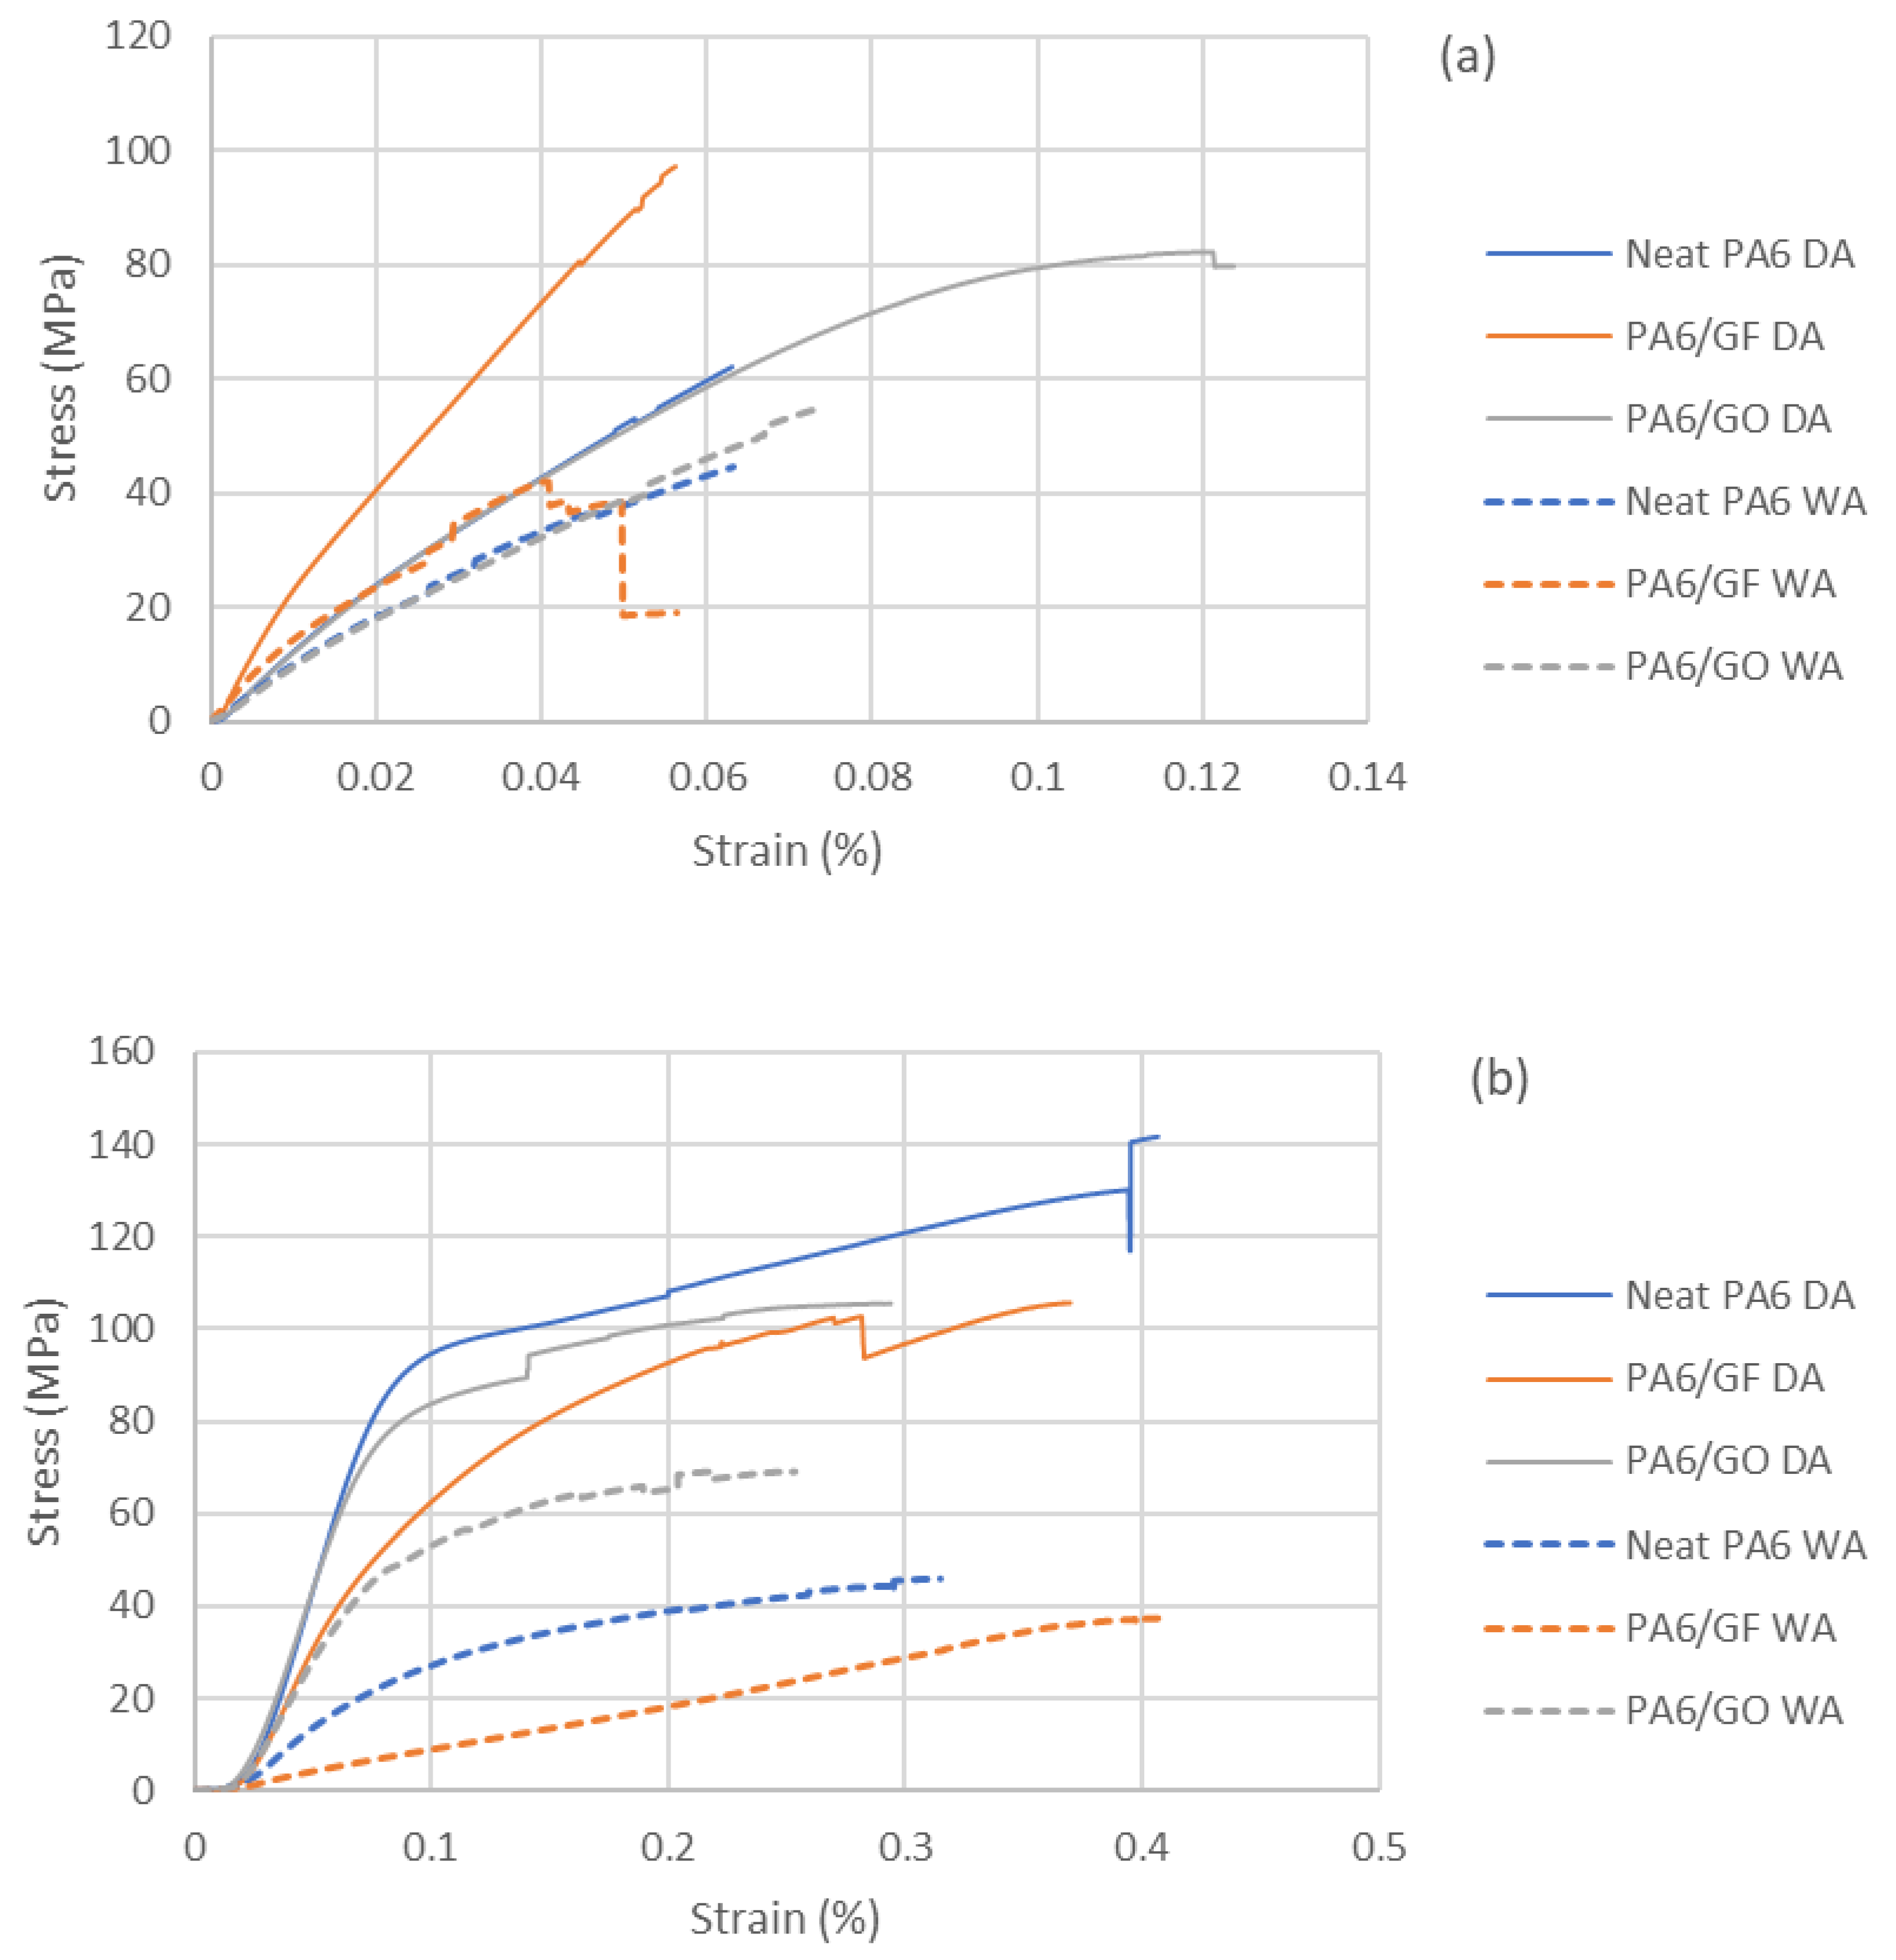
The findings of tensile tests undertaken showed that all the samples experienced both elastic and plastic deformation before failing (breaking) and exhibited ductile behaviour.
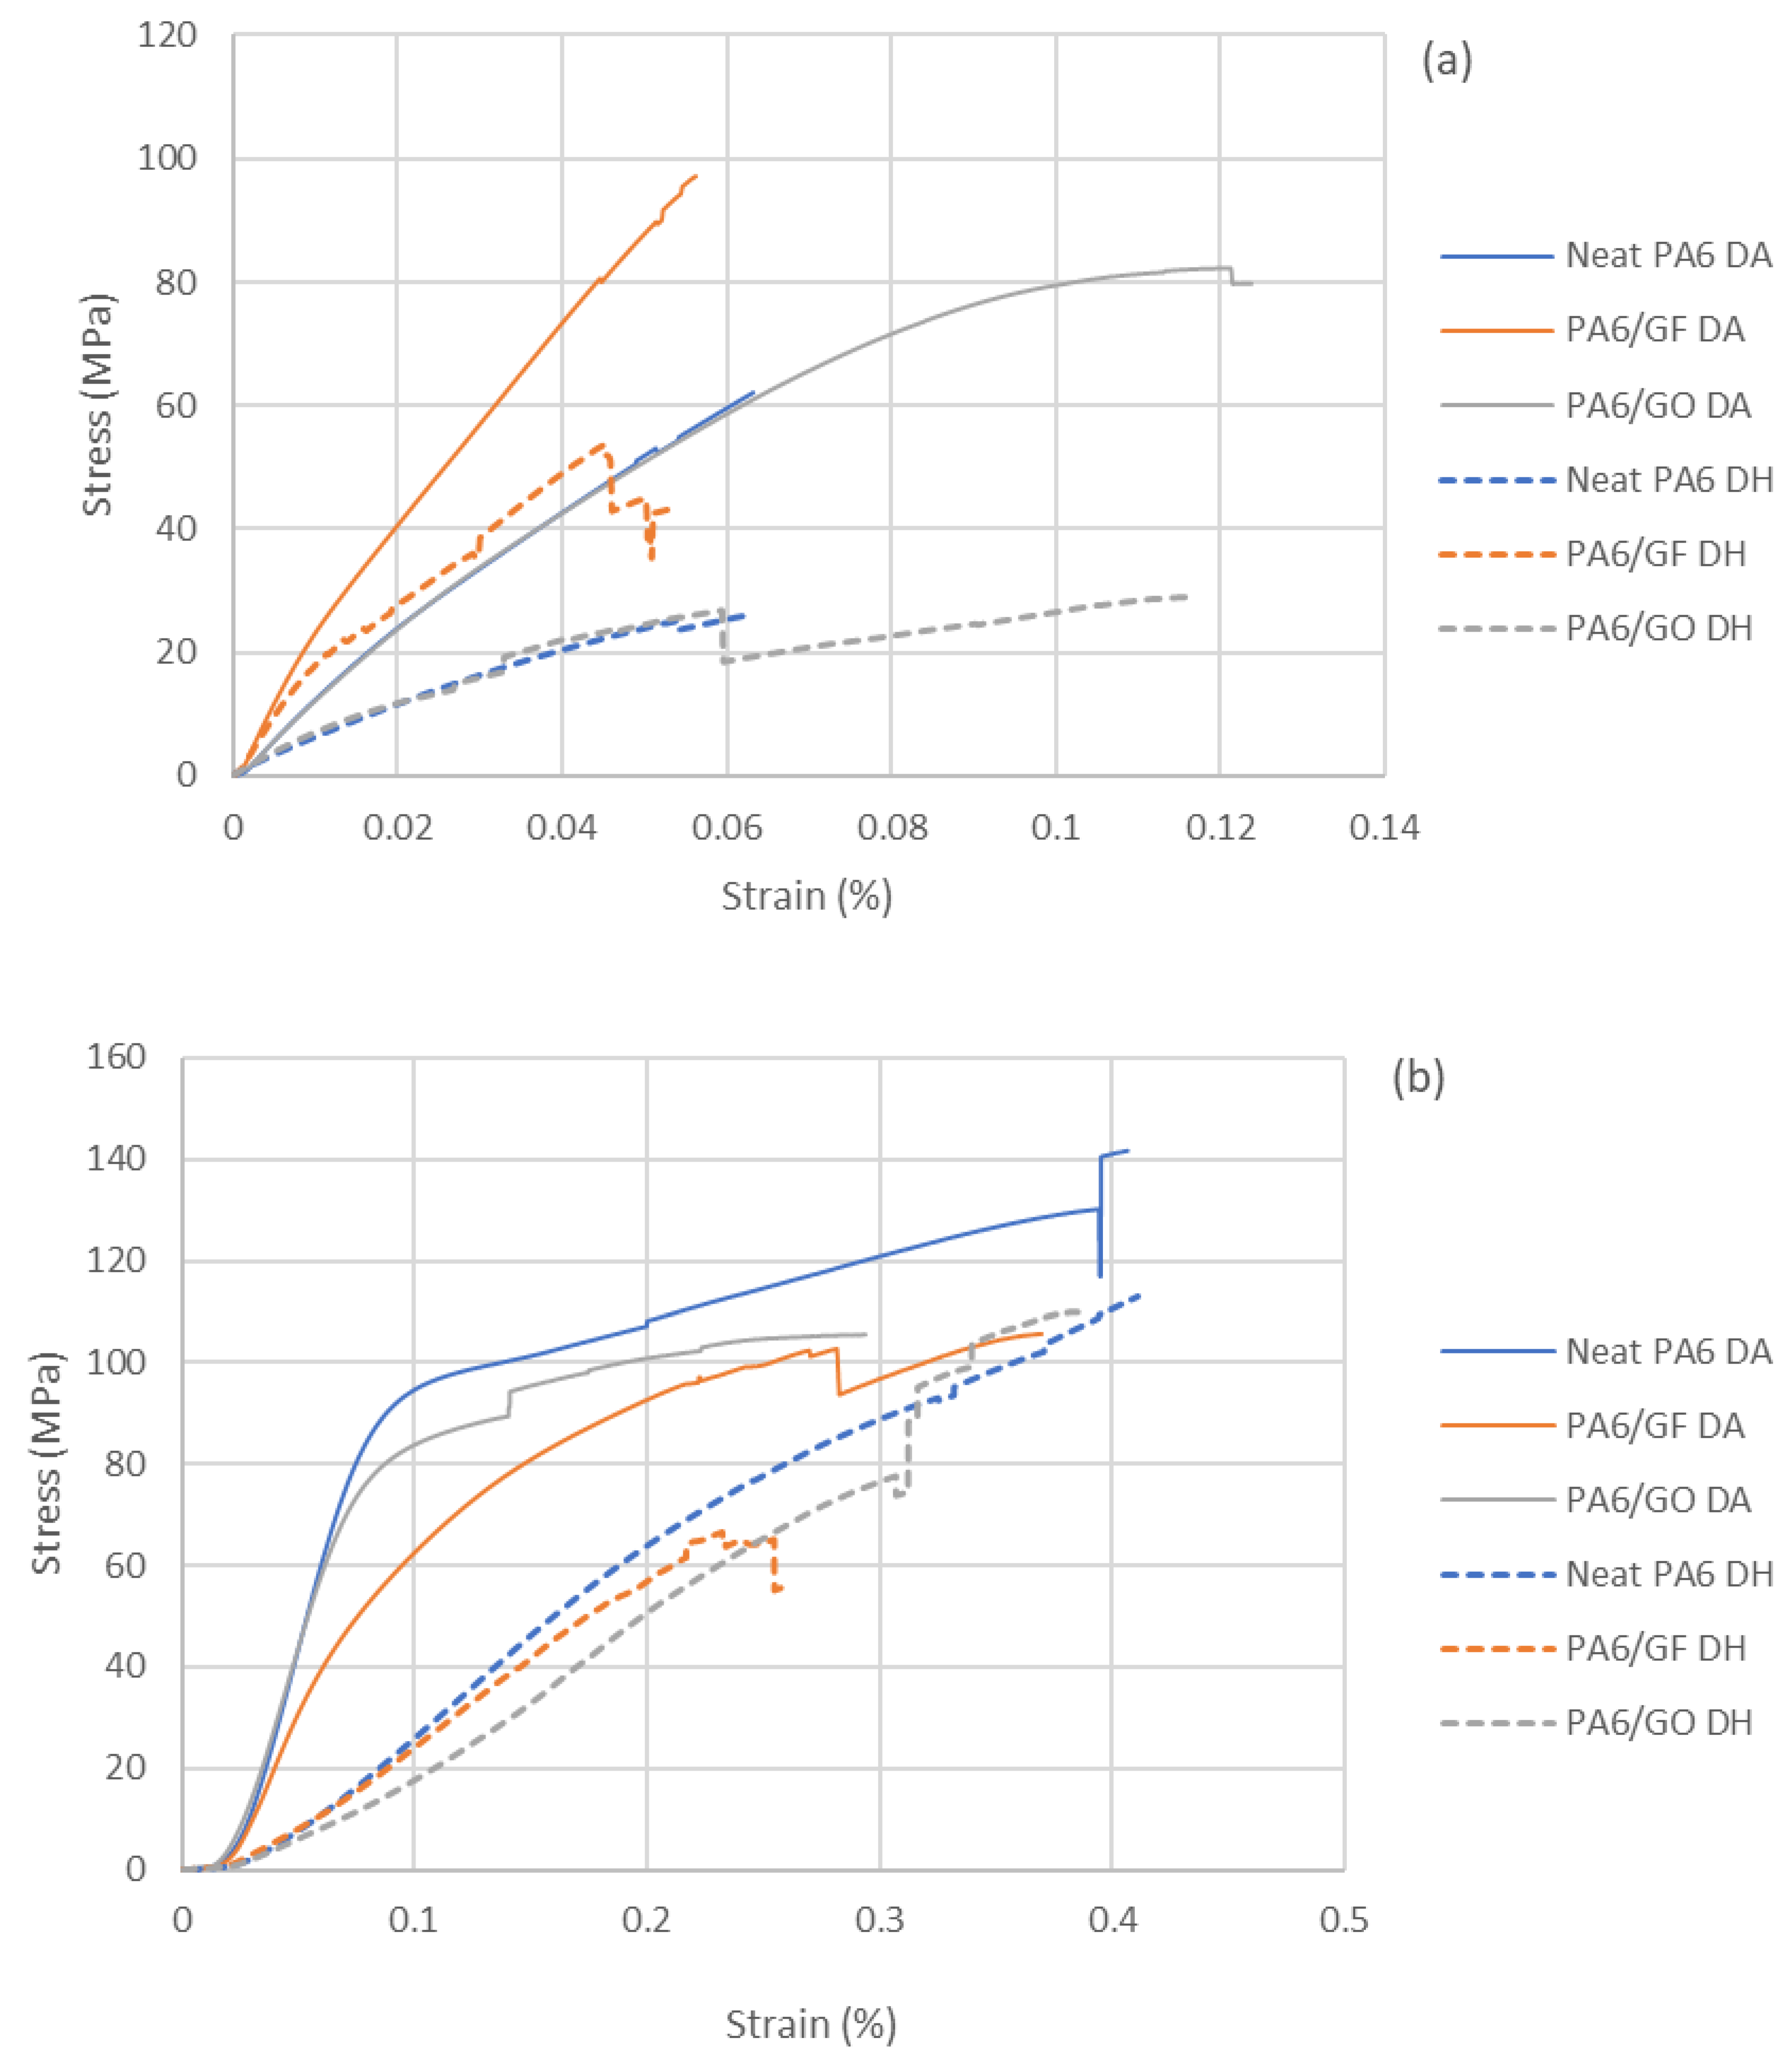
Figure 4 shows a comparison between the tensile behaviour of the samples in dry/ambient conditions and dry/high temperature conditions. Further investigation on the effects of high temperature on the samples revealed that the neat PA6 sample presented the most consistent graph in tension, with negligible variation, whilst PA6/GO had the most inconsistencies in the graph curve. This was due to the presence of GO reinforcement and the property of the GO-permeated sample. Moreover, whilst the neat PA6 samples demonstrated the least stress and strain, PA6/GF was able to withstand the most stress and PA6/GO the most strain in high-temperature conditions, as illustrated in
Figure 4.
Notwithstanding the variability of each sample in high temperature, some homogeneity was observed from the results.
Figure 5b shows all the samples conditioned in high temperature could withstand only 50% of the stress the samples in dry/ambient conditions could. This means the DA samples were able to withstand 50% more load before failure, and, thus, are more suitable for structural application. In addition, the strain of the neat PA6 samples was constant in both ambient and high temperature conditions, with a negative and positive difference of 3% and 10% in PA6/GF and PA6/GO, respectively.
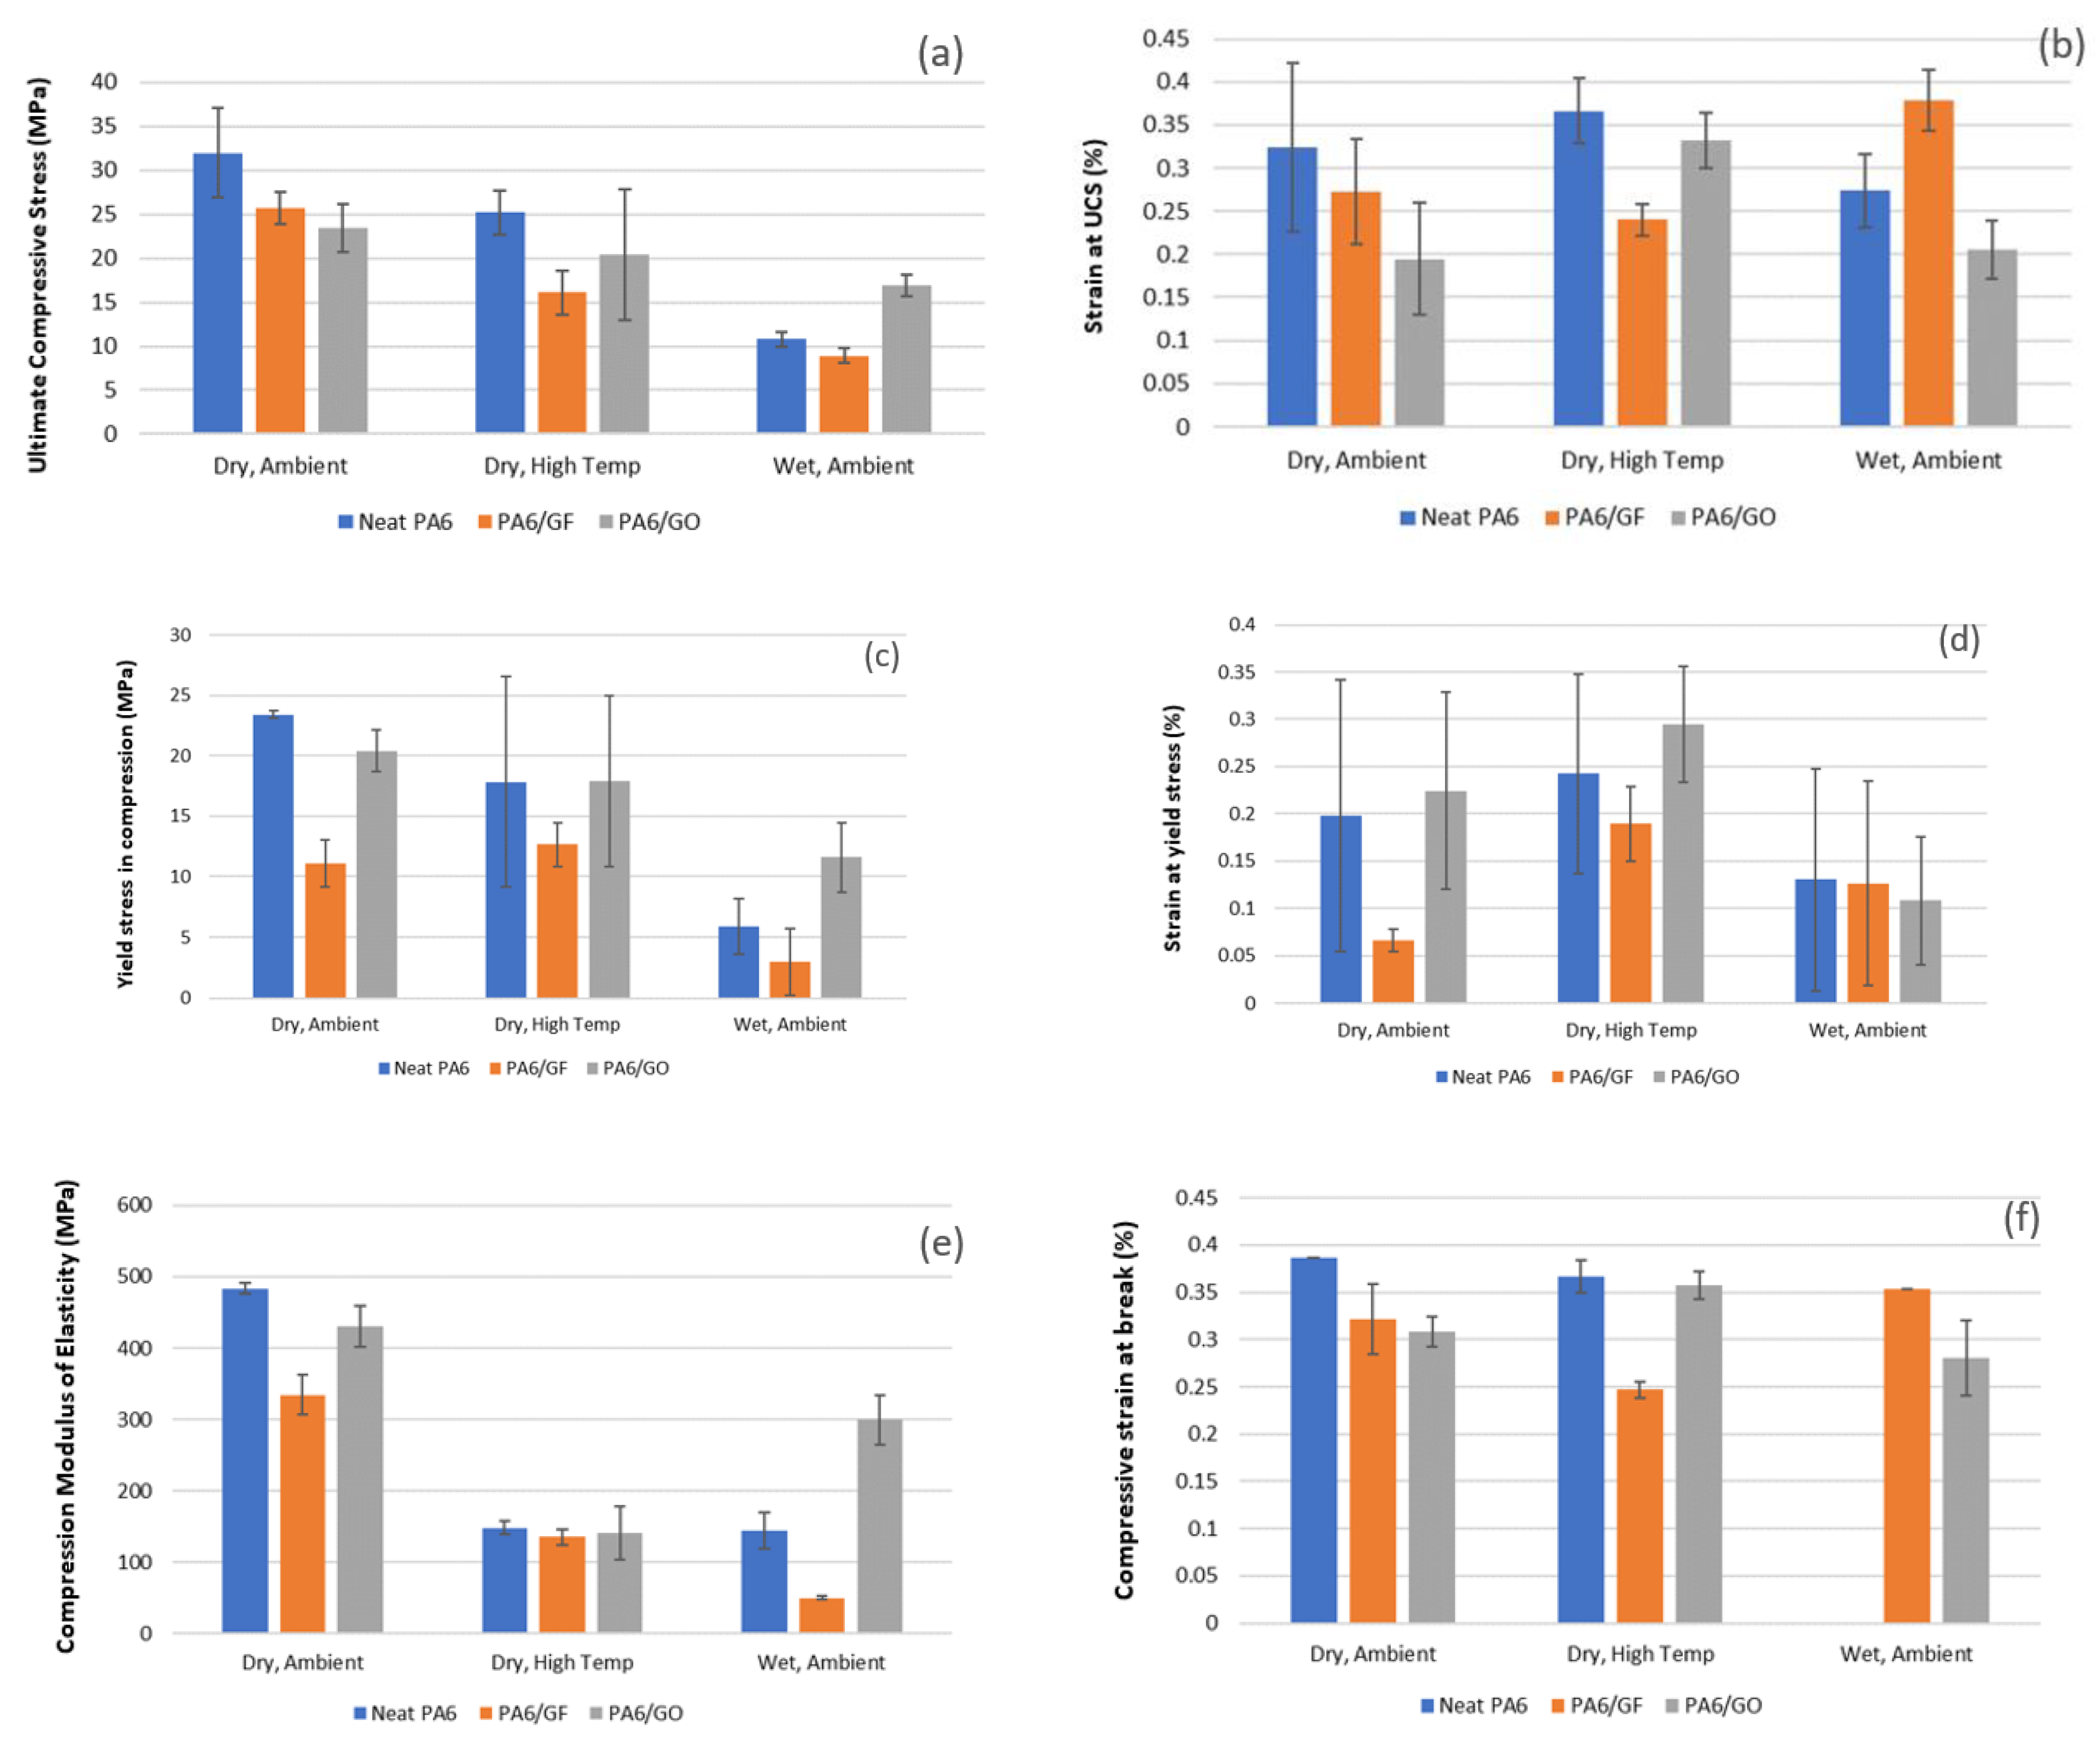
On the other hand, the compression samples (
Figure 6) revealed neat PA6 possessed the greatest stress and strain in both the DA and DH samples. Similarly, the neat PA6 compression samples conditioned in high temperature demonstrated the most consistent results, whilst the PA6/GO samples exhibited the least consistent graph curve. However, in contrast to the tensile samples, the PA6/GF samples demonstrated the least stress and strain when compared to all DH samples.
3.3. Effect of Water Uptake on Tensile and Compression Properties
The effect of water on these samples was also examined.
Figure 7 highlights the results obtained from the tensile and compression experiments. As can be seen in
Figure 7a, there was a noticeable variation in the curve of the graph in all samples. However, the samples conditioned in dry/ambient temperature had negligible variations in the elastic region in comparison to the samples treated in water. Furthermore, both the dry and wet variation of each sample showed a similar trend in relation to the strain. The GO-reinforced samples in both conditions demonstrated the most strain and the GF-reinforced sample the least strain, which meant it was the stiffest sample. The PA6/GF samples treated in water possessed the highest resistance to deformation in tension; however, they possessed the least strength in both tension and compression.
When a polymer composite is submerged in water, moisture is absorbed through permeation and diffusion [
44]. As can be seen in
Figure 7a, the result of this was a decrease in the tensile strength and strain. The inconsistency in the material behaviour in the water-treated samples can be attributed to the hygroscopic nature of PA6. This deteriorates the mechanical, physical and thermal properties of the material. Water has the same hydrogen bonding as PA6; therefore, when water penetrates into PA6 it is as susceptible to becoming loosely attached to the PA6 chain as PA6 is to another PA6 chain. The reaction between water molecules and the PA6 structure weakens the intermolecular bonds, thereby increasing the mobility of the molecules present in the PA6 sample and its GO and GF composites. The absorbed water molecules act as a plasticizer and decrease the tensile and compressive strength and elastic modulus. The three main locations the water can reside in the composite are: the matrix, the fibre, and the point of intersection between the fibre and the matrix. An unequal amount of water penetrates into these regions, creating an imbalanced volumetric expansion between the matrix and the fibre/matrix interface that leads to the formation of localised stress and strain.
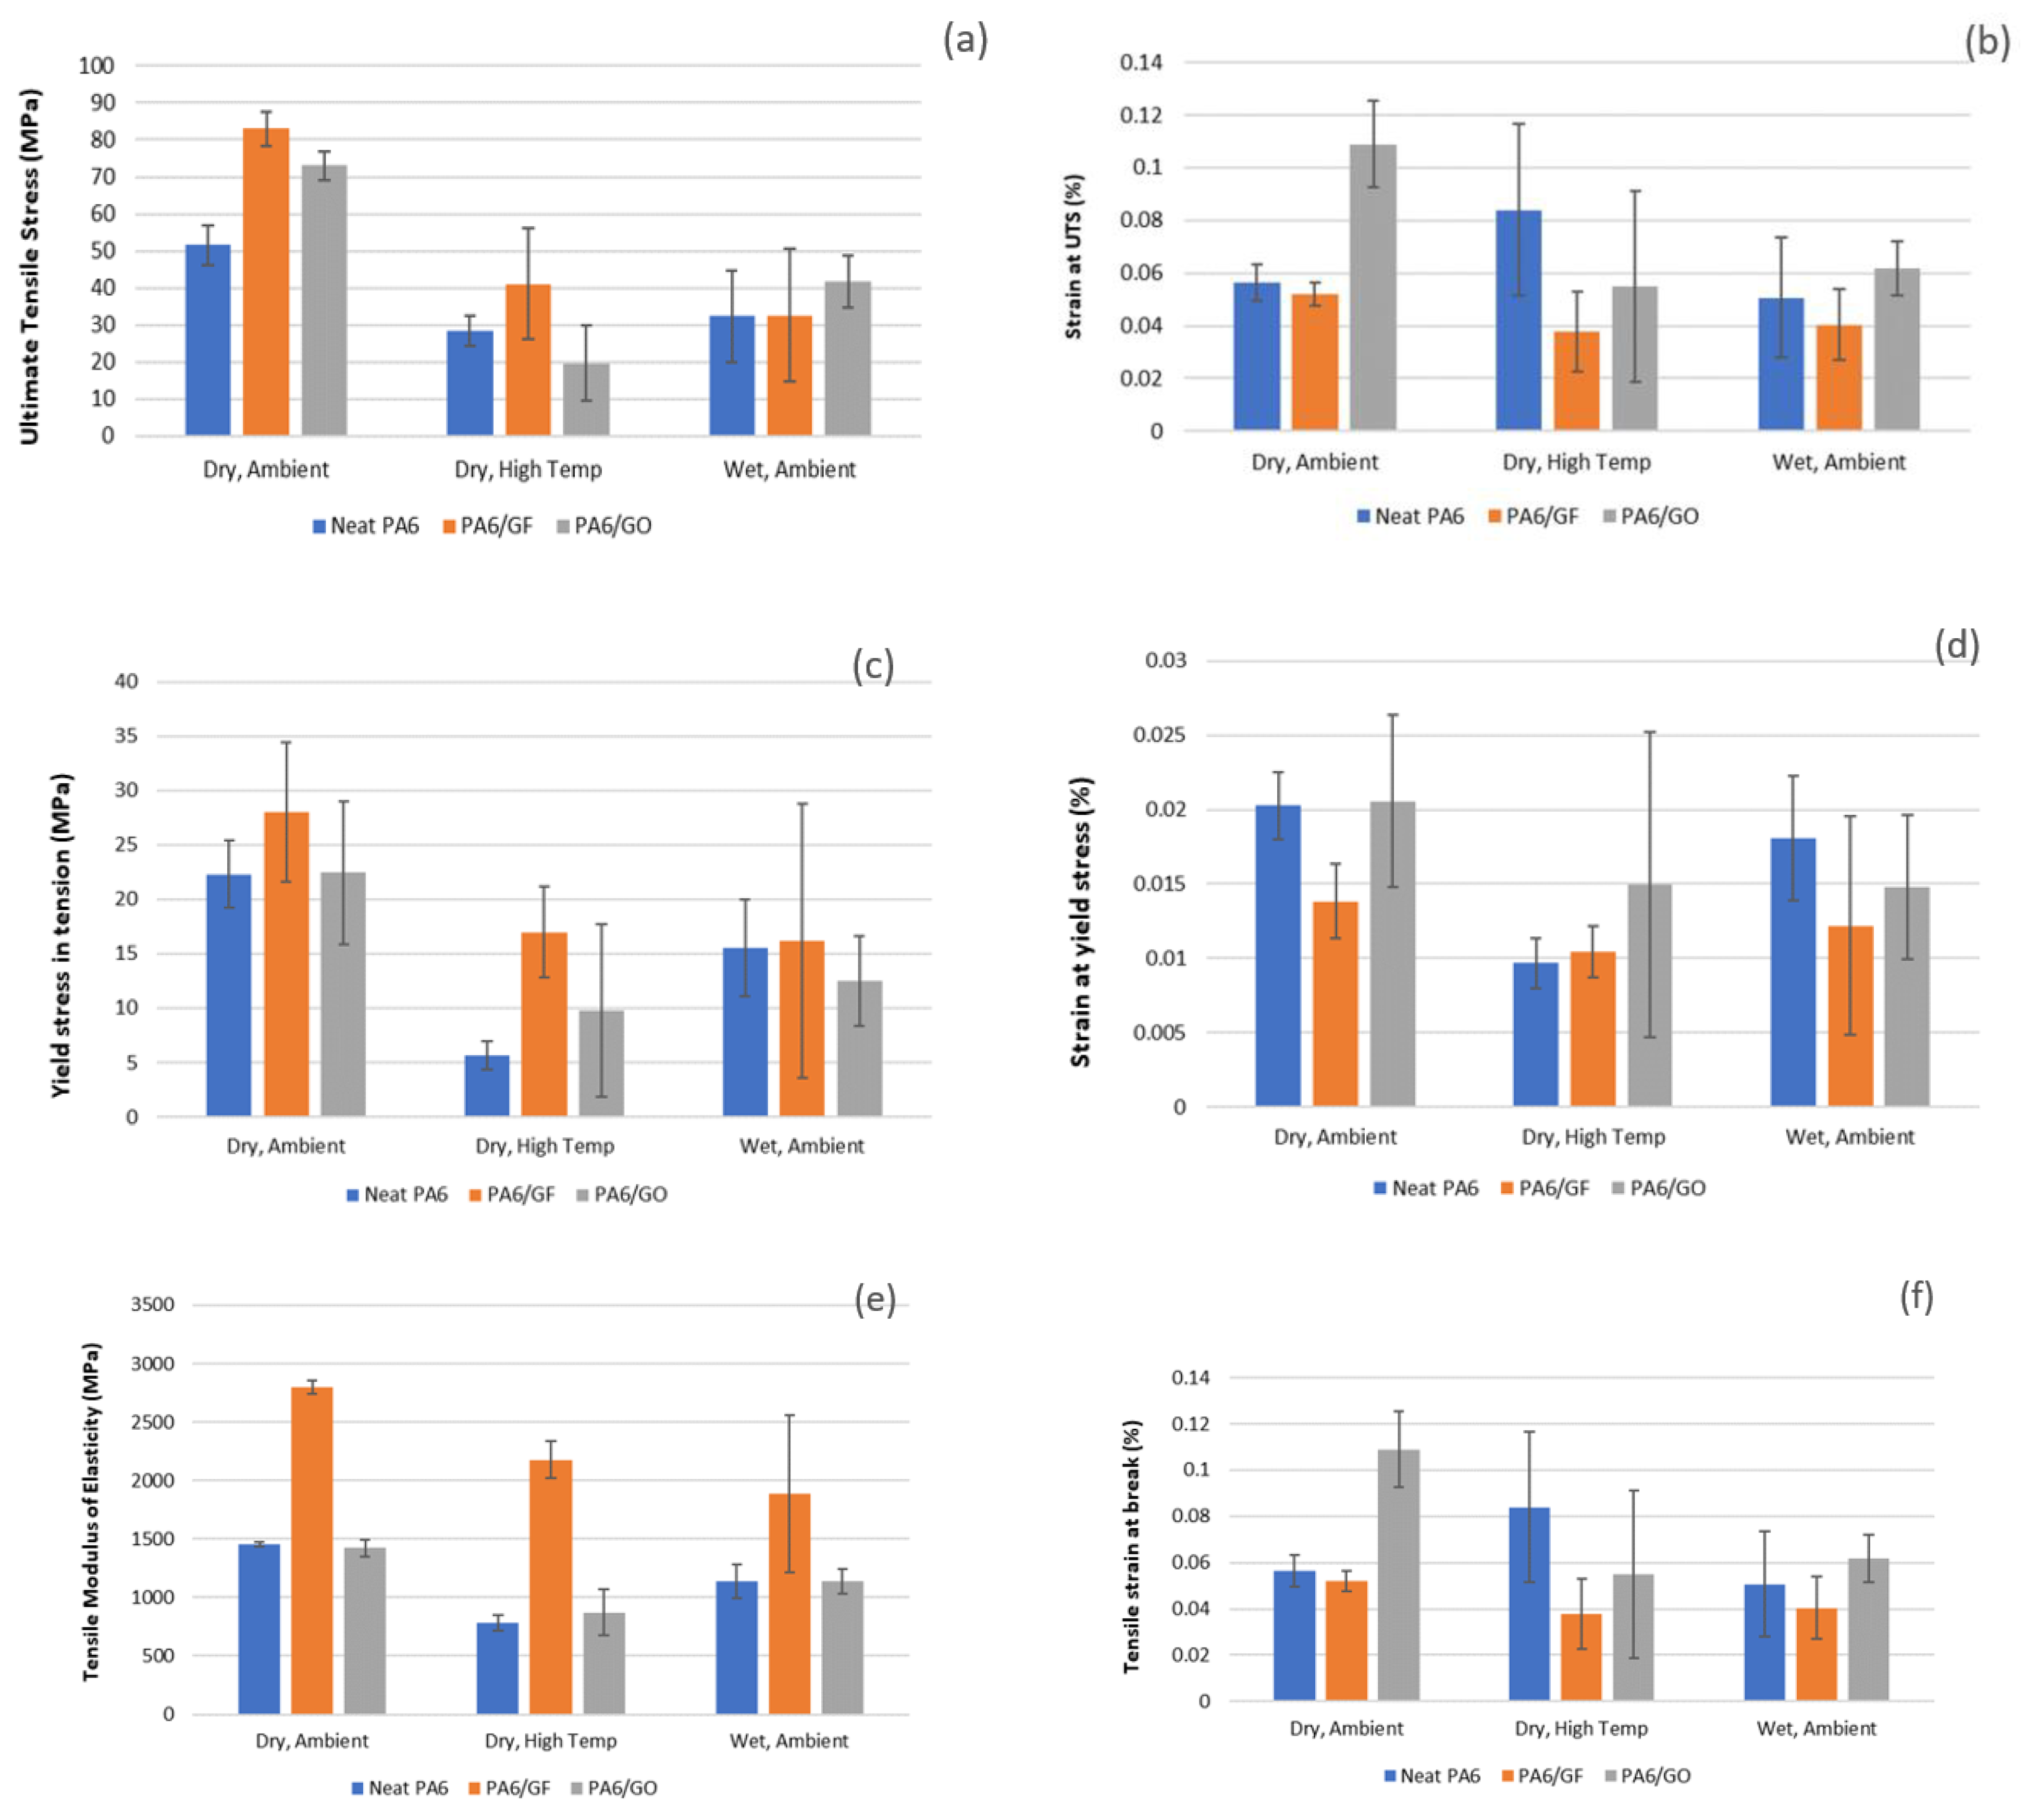
3.4. Effect of GF and GO Matrix Composition
Further investigation on the tensile samples revealed that PA6/GF demonstrated the highest tensile and yield strength and the greatest resistance to deformation in both dry/ambient and dry/high temperature conditions, with a 55% and 103% increase, respectively. This surpassed the tensile strength of the GO samples, which was increased by 33%, 10% and 23%, respectively, in the dry/ambient, dry/high temperature and wet/ambient conditions. The major factors affecting the properties of a fibre-reinforced composite are the fibre content and fibre length. This study investigated the behaviour of 30 wt% GF, which has been proven to be the optimal proportion by other studies. Additionally, the failure mechanism of the GF-reinforced tensile samples (fibre breakage) verified that the composite assumed the strength of the fibre [
45]. However, PA6/GF turned out to be the weakest for tensile application in the wet condition, with a tensile strength decrease of 6% in comparison to its neat PA6 equivalent, making PA6/GF WA the only sample that demonstrated a decrease in ultimate tensile strength.
Figure 5 outlines the strength and Young’s modulus of elasticity values of all the samples. As can be seen, a 57% and 33% increase in the ultimate tensile strength property of the PA6/GF and PA6/GO samples, respectively, was obtained in comparison to the neat PA6 samples in dry/ambient conditions. Similarly, in dry/high temperature conditions, a 103% and 10% increase in PA6/GF and PA6/GO, respectively, was obtained.
In contrast, in wet/ambient conditions, there was a 6% decrease in PA6/GF and a 23% increase in PA6/GO, making PA6/GF WA the only sample that demonstrated a decrease in ultimate tensile strength. The interfacial bond between glass fibre and PA6 was broken in water. A previous study [
46] demonstrated a similar result. The study further showed that bond fractures in glass fibres are generally caused by osmotic pressure present at the point of contact of fibres and the PA6 matrix. This pressure occurs as a result of the leaching of water-soluble constituents from the fibre, which leads to higher concentration at the PA6/GF interface, causing growth of cracks into the PA6 matrix from the surface of the fibre. This is in line with a recent study [
47], which reported that there was a general hierarchy to composite constituent strengths, with the strength from the strongest to the weakest being first fibre, second matrix, and third interface. The poor behaviour of fibre in water significantly decreased the tensile strength of the material.
The introduction of GO to the PA6 matrix altered the properties of the composite, including its crystallinity. The crystalline region of the sample consisted of uniformly arranged atoms. This region is impermeable to gas and water molecules due to the fact the size of these molecules is too large to pass through the lattice. The only passage for gas and water molecules is through the free volume present in the amorphous region. Thus, the addition of GO to the PA6 matrix improved the structural properties, but to a lesser degree in comparison to GF. This confirms that significant improvements are obtained by the addition of fibre reinforcement to PA6.
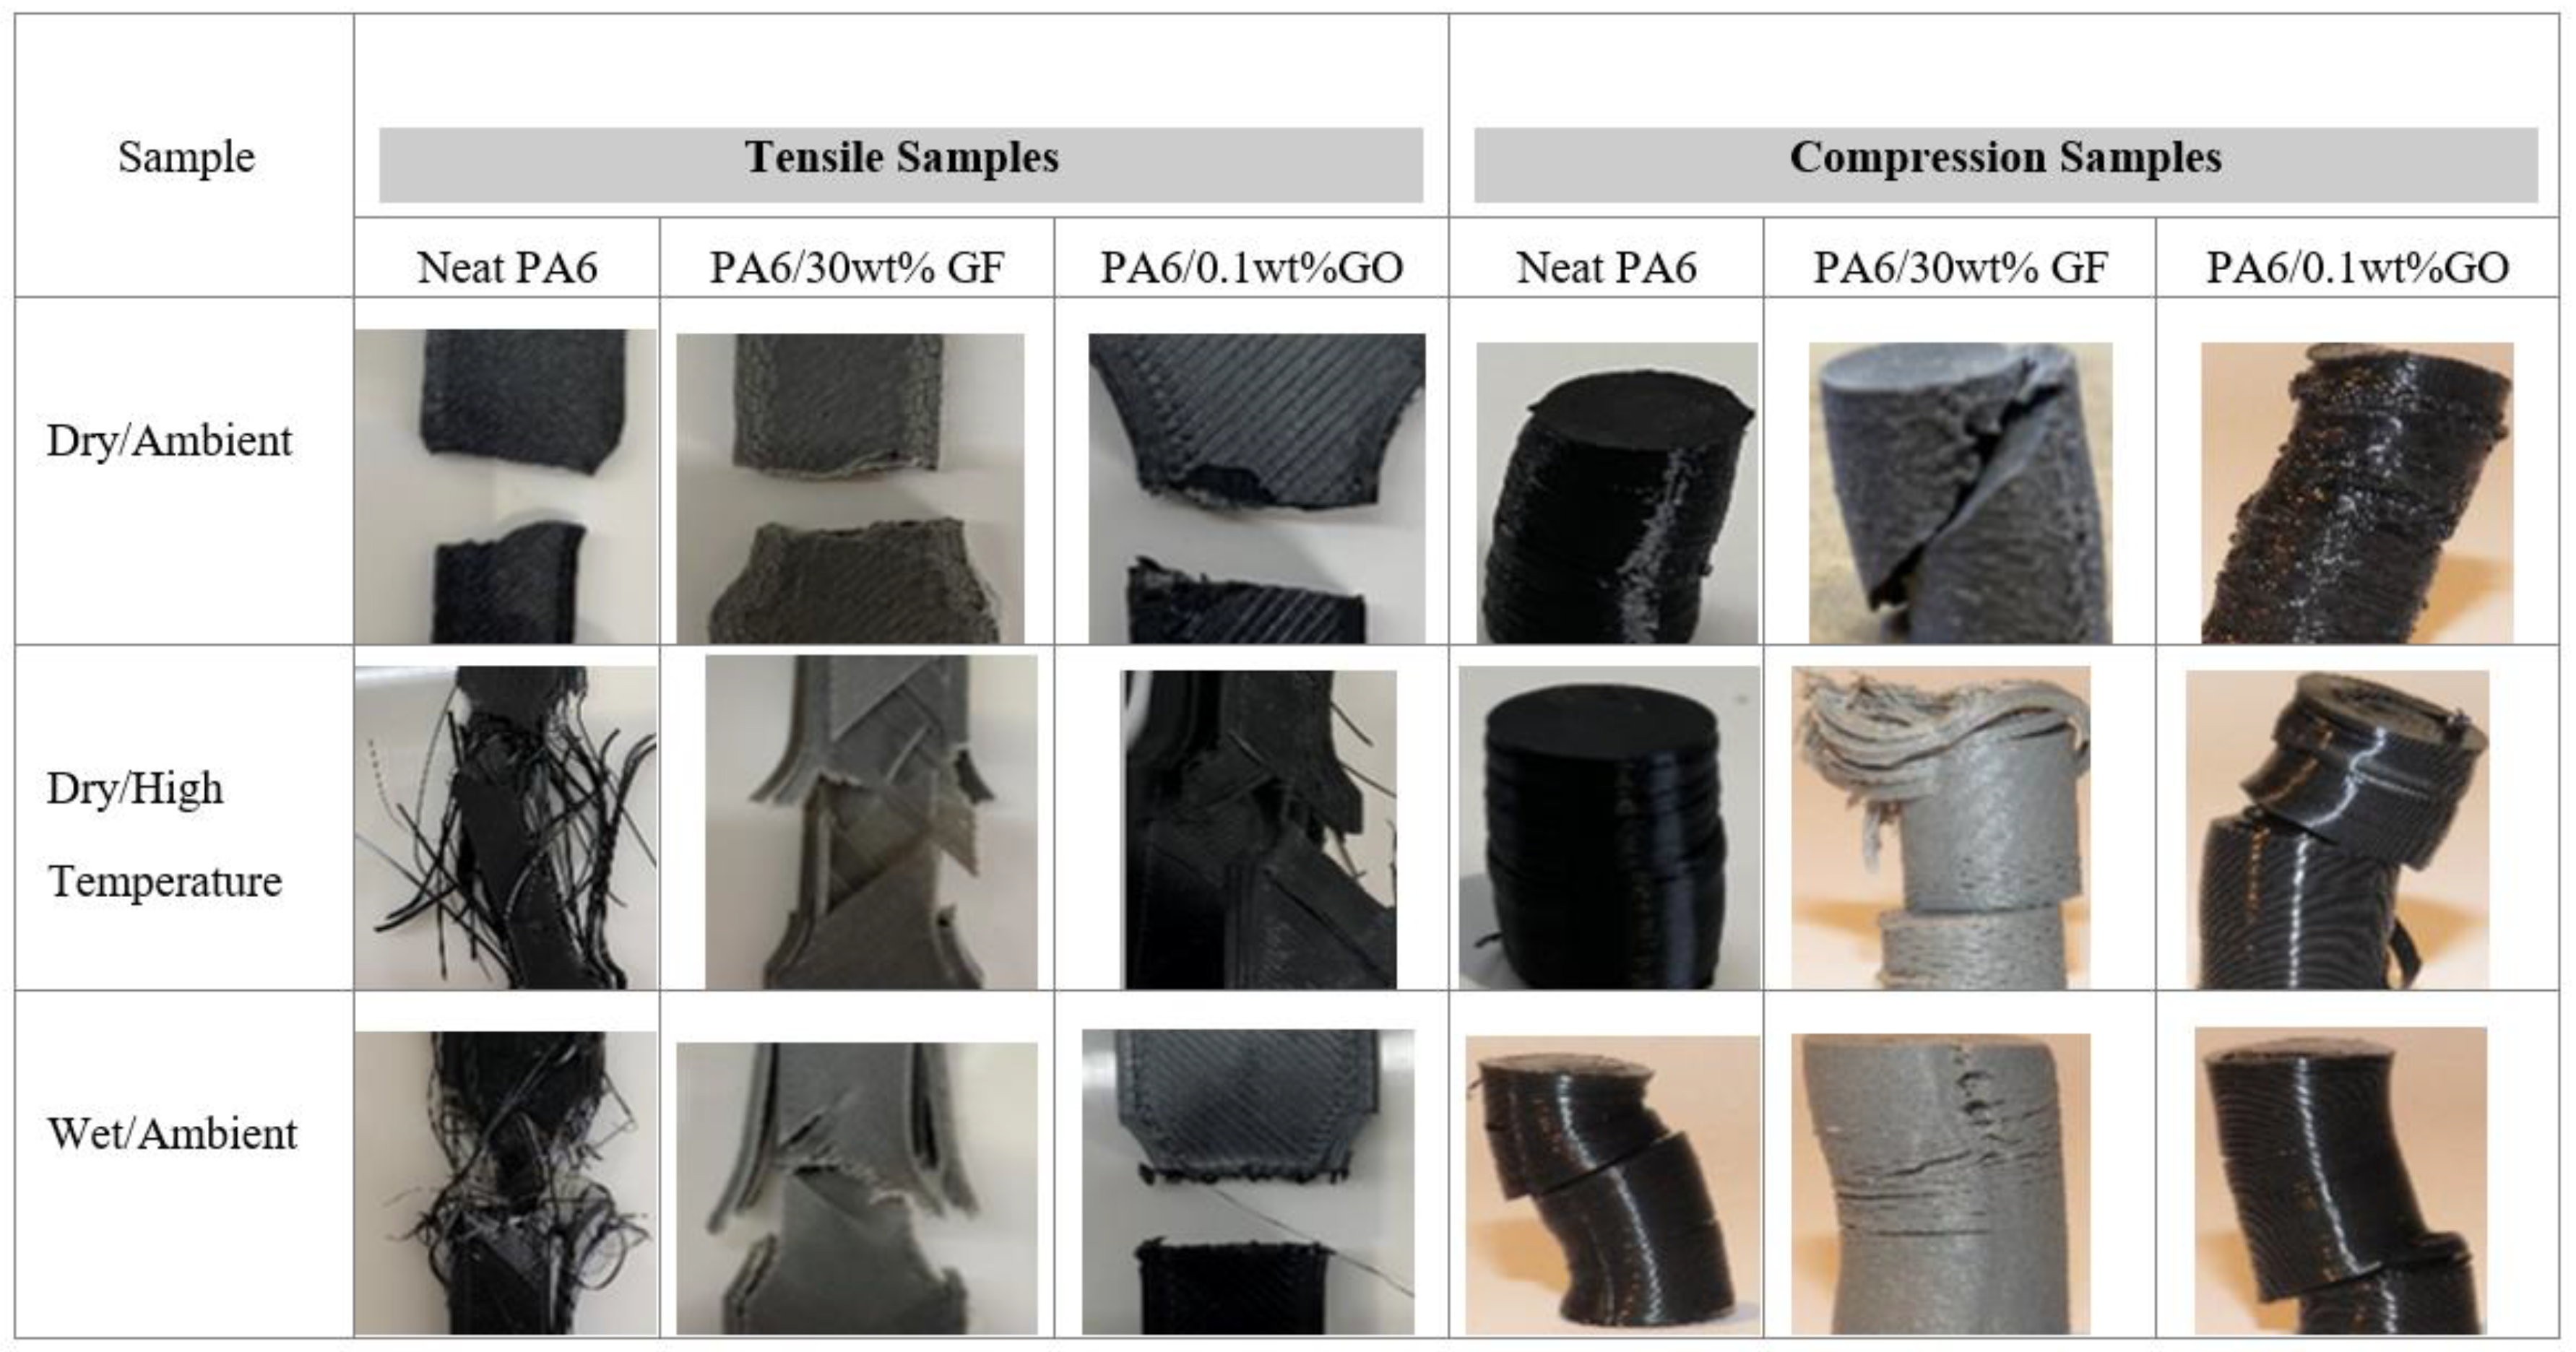
On further analysis of the GO-infused compression samples, the results revealed a drop in the reliability of the sample finish, including visible porous regions, non-uniform diameters and excessive protruding print deposits as seen in
Figure 8. The rough finish was traced back to irregularities present in the PA6/GO samples. Evidently, the flaws caused PA6/GO to maintain the lowest average ultimate compressive stress (UCS) value under dry/ambient circumstances. In contrast, neat PA6 is known to have the highest average UCS, whereas PA6/GF has an intermediate value.
3.5. Damage Characterisation of Samples
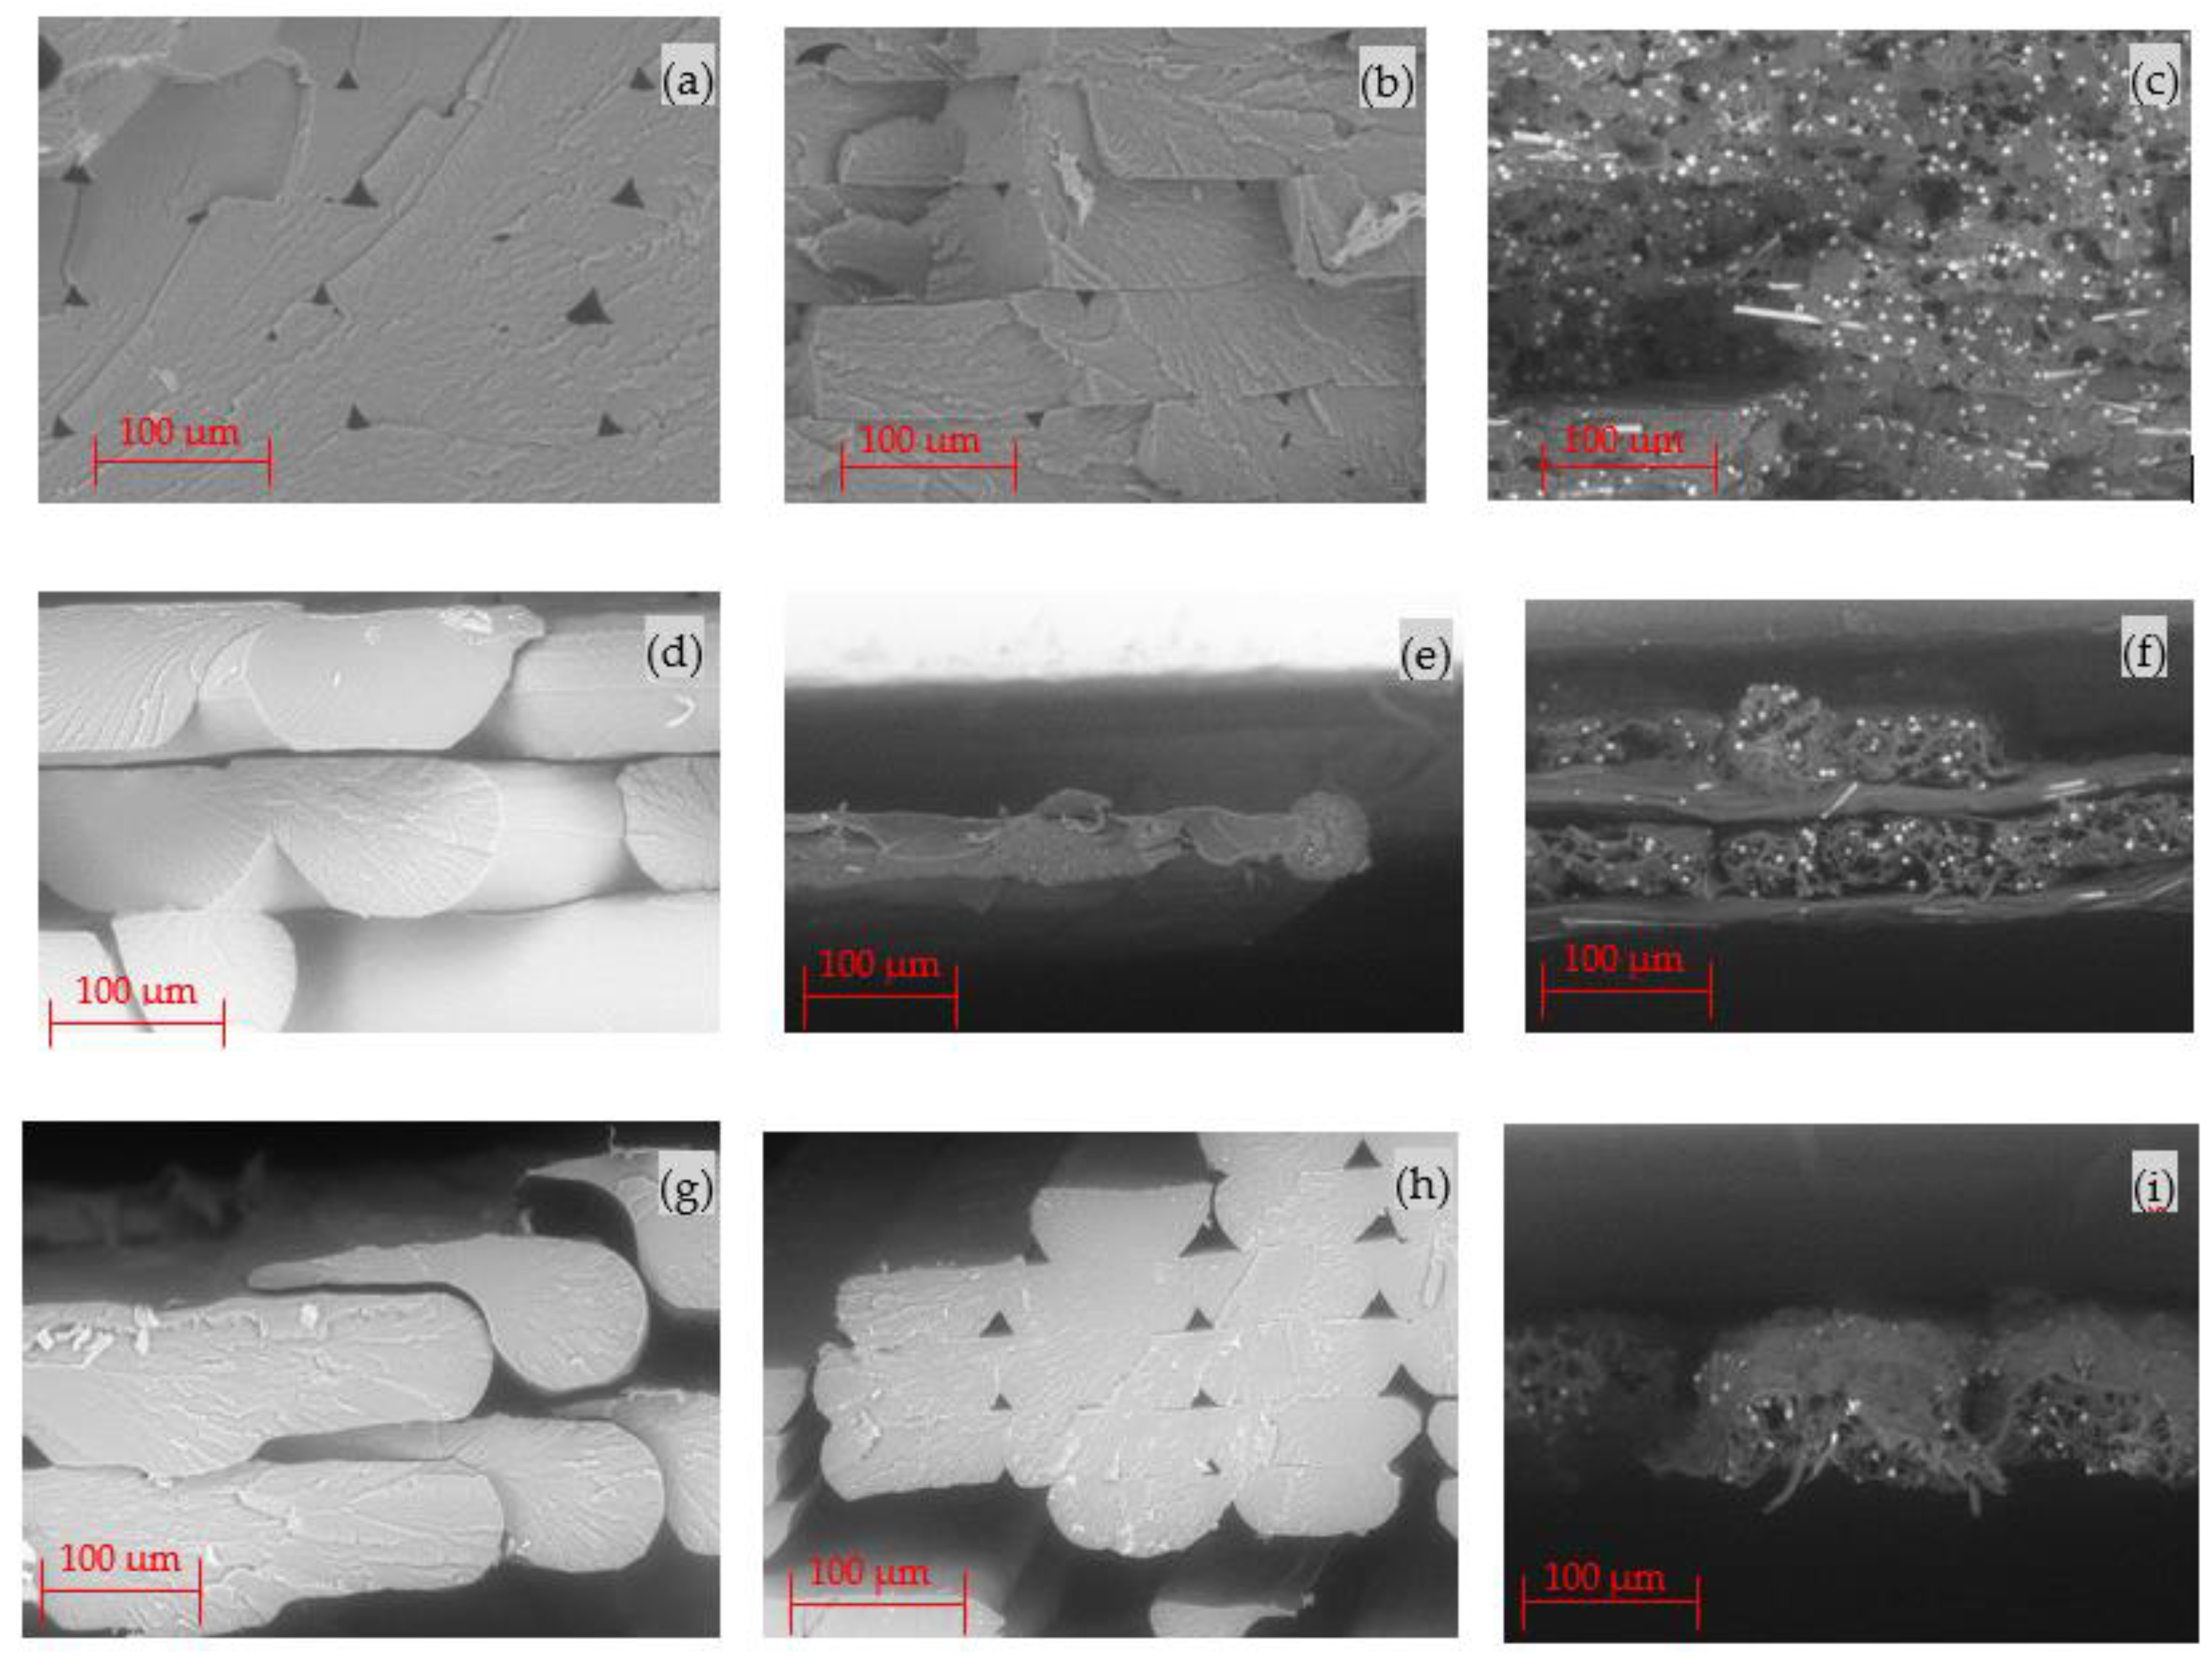
The damage characterisation was investigated for all tensile samples. The morphology of the fractured surface was studied using SEM. The backscattered micrographs presented in
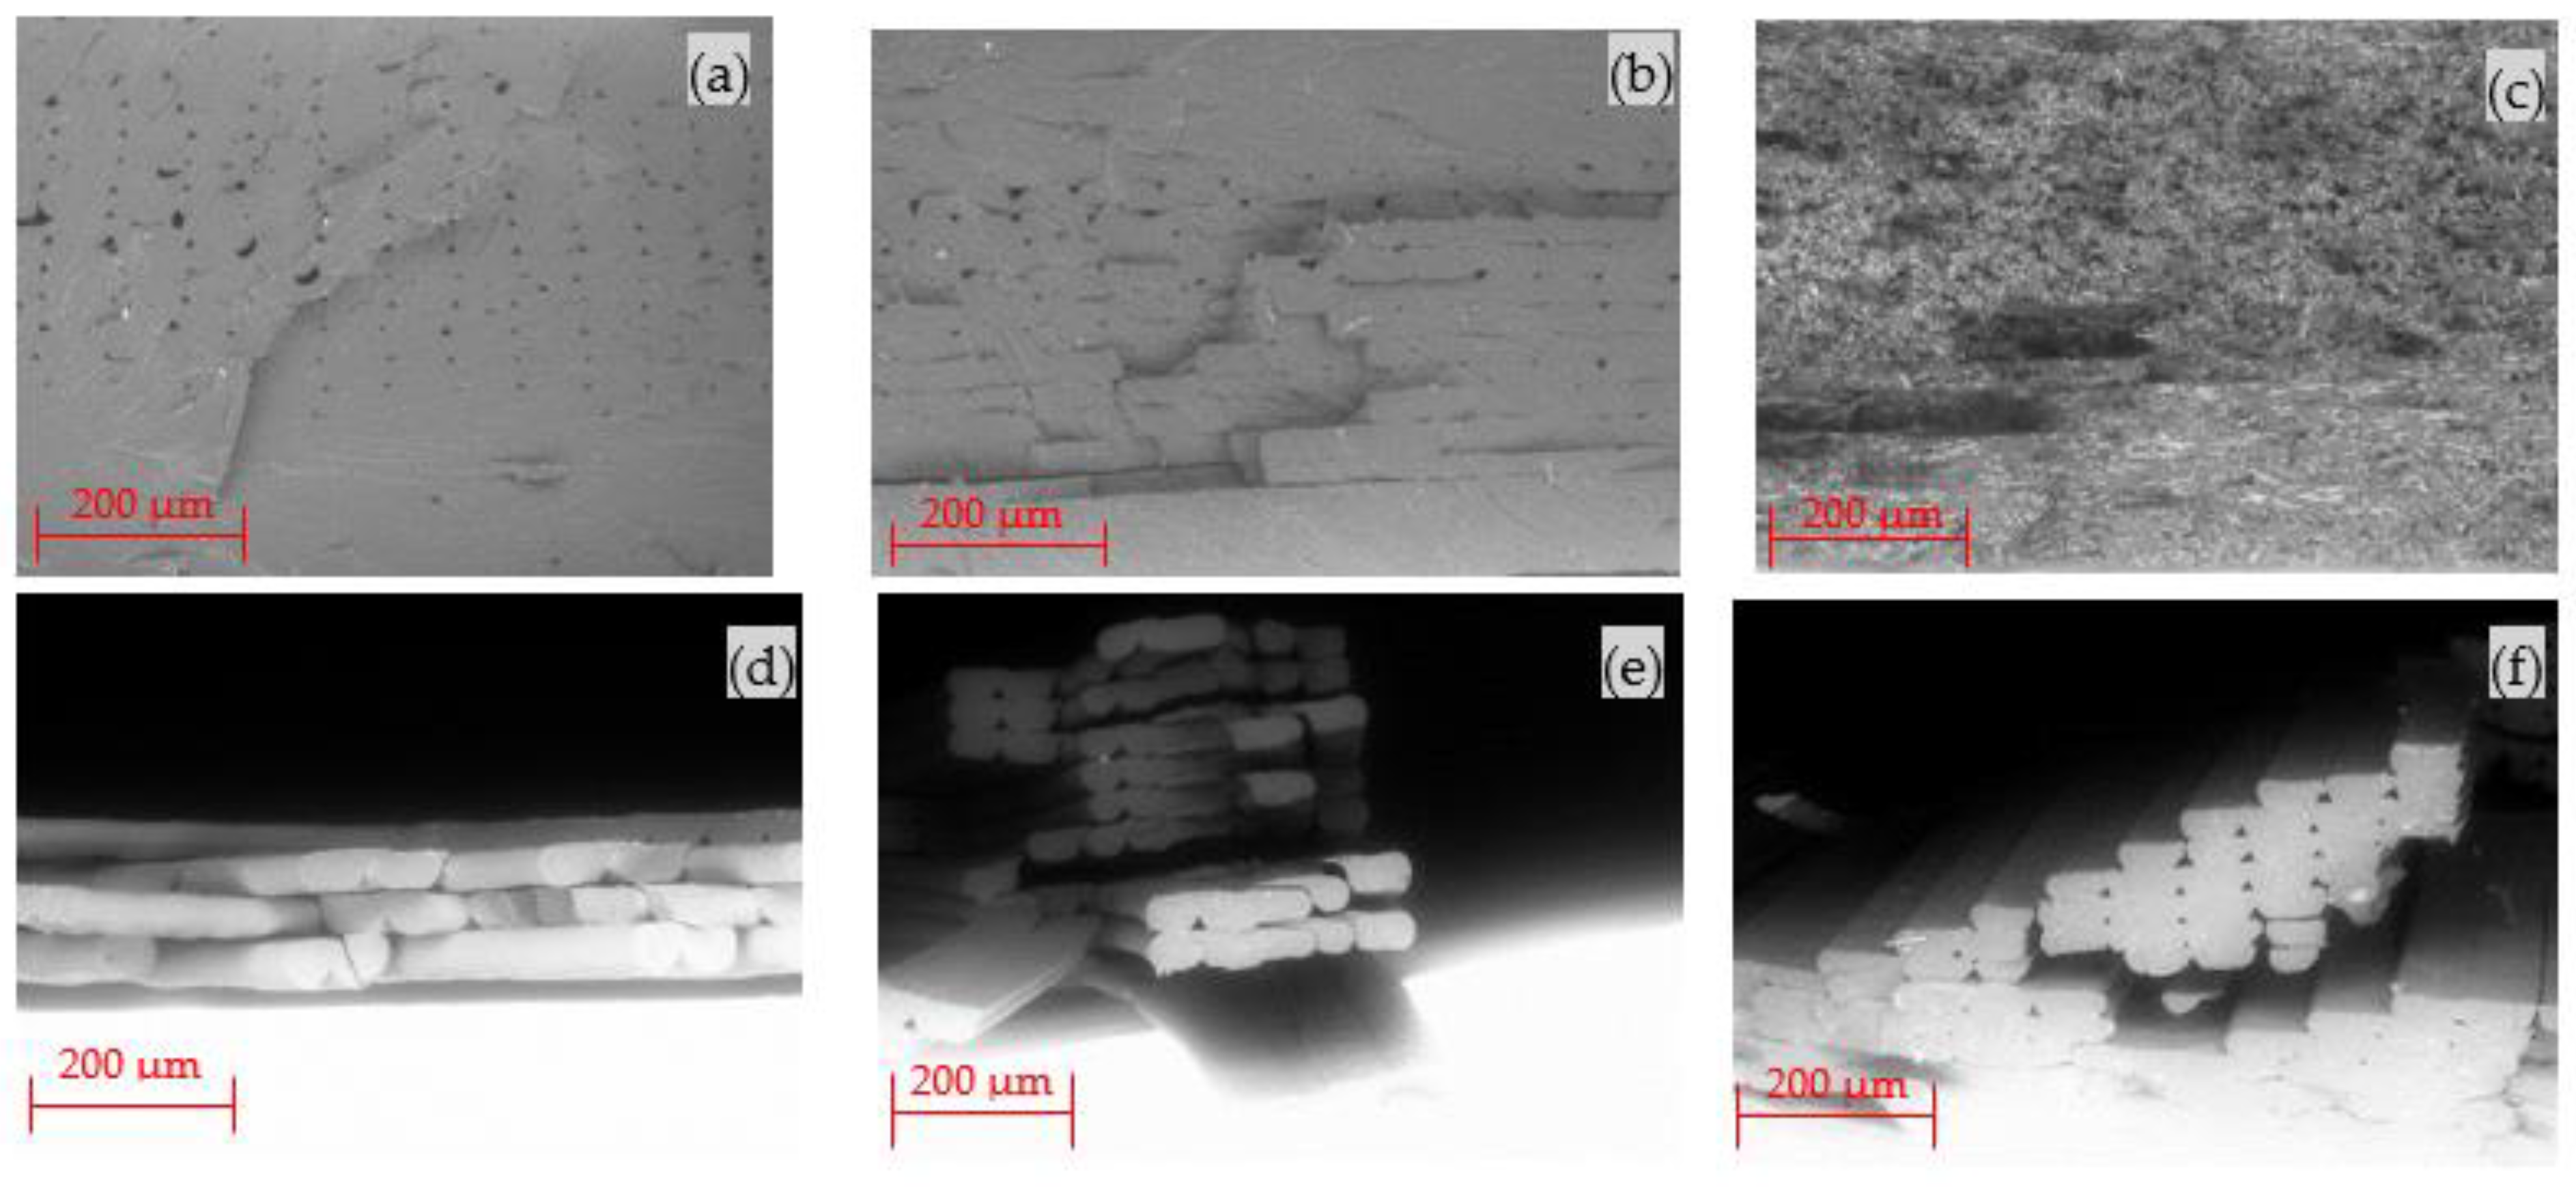
Figure 9a–i were investigated using a magnification of 300×, while a magnification of 64× was used for the micrographs in
Figure 10a–f. As can be seen in
Figure 9a, visible pores are noticeable in the neat PA6 samples. The darker regions that resemble tiny holes represent the pores present in the sample. These pores affect the uniform properties of the sample and, thus, its ability to uniformly distribute stress in structural applications. The micrograph in
Figure 9b shows the introduction of 0.1%wt GO significantly decreased the voids present, making the bonding strength of graphene very evident. This increased the interlaminar strength and improved the stress distribution and structural integrity of the material. Voids were also noticeable in the PA6/GF sample, although the pores took on a round shape with the long white particles representing the fibres and displaying the fibre breakage of the samples. The improved tensile properties of the GO- and GF-infused samples in the dry/ambient conditions were due to the improved bonding of the printing interlayers, which aided in efficient stress transfer. In addition, despite the fact that voids were created during the FDM process, the deposition of a 90° printing direction (fibre orientation) also compensated the mechanical properties.
From the tensile analysis, all samples with GF and GO yielded an increase in tensile strength, with the exception of PA6/GF in the wet condition. Comparing the micrographs in
Figure 9c,i, the fibre debonding action of the sample in the wet condition was detectible, resulting in fibre pull-out and exposing the fibres. Due to the different failure mechanisms of each sample, it was challenging to conduct an extensive analysis on some of the samples that failed due to fibre pull-out, as seen in the micrographs in
Figure 9e,f,i. Despite this, the results are consistent with that of a previous study [
48] conducted on the effects of microscopic voids on the mechanical performance of 3D-printed PA6. Similarly, the results in
Figure 10a–f are identical to that reported in the literature on the micrographs of FDM-printed samples, with a layer height of 0.1 mm and 0.2 mm thickness [
49].
4. Conclusions
The attractive properties of fibre and nanofillers have received a lot of attention in relation to composites, particularly polymer matrix composite materials. The introduction of fillers in 3D-printing materials is redefining the properties, and, in turn, the performance of these materials. In this study, polyamide (PA6) filled with 0.1% graphene oxide (GO) and 30% glass-fibre (GF) reinforcement were extruded into 3D-printing filaments using a twin-screw extruder. The filaments were used to 3D-print test samples which were investigated under three conditions: dry/ambient (DA), dry/high temperature (DH) and wet/ambient (WA). Each sample underwent material characterization and tensile and compression mechanical testing to study its behaviour. The major findings are summarised as follows:
Strong interfacial adhesion between the GO and PA6 matrix improved the tensile properties of the composite.
Addition of GO and GF increased the tensile strength by 33% and 57% in DA, and 10% and 103% in the DH condition, respectively. Similarly, a 22% tensile strength increase was obtained for the WA GO sample; however, a 6% decrease was found for the GF WA sample.
The PA6/GF samples exhibited the highest strength in DA and DH temperatures and the lowest in WA, which occurred as a result of osmotic pressure in the fibre/matrix interface leading to fibre breakage.
All DA samples were able to withstand 50% more load before failure in comparison to the DH samples.
It is evident that the introduction of any filler to the matrix of the polymer improves the quality of the material. However, the degree of polymer nanocomposite improvement is greatly influenced by the dispersion technique of the nanofiller. Therefore, key factors that can impact the dispersion, such as the polymer and filler type, solvent addition, filler concentration and the sample preparation method, are relevant in this investigation.
It is important to note a minimal (0.1 wt%) amount of GO was used for the initial study and significant variation was still observed. Thus, there is potential to study the behaviour of the material under similar hydrothermal conditions with increased GO content.


 ,
, 


