1. Introduction
Construction costs have been increasing over time, typically from increased material costs [
1], including 23 consecutive months of increased costs [
2]. The majority of the cost increases over the past 70 years have been due to increased incomes and increased home prices [
3], which is good for society but a limitation for the construction industry. To combat these increasing costs, alternate materials, especially composite materials, may provide an environmentally friendly and cost-effective solution that does not negatively impact society.
The earliest recorded composites were those composed of a clay binder (or matrix) and utilizing straw as reinforcement [
4]. In the 19th century, steel-reinforced concrete was invented [
5] and continues to have widespread use in the world today, being one of the most common composite materials. The use of the term composite itself originates from aircraft manufacturing during World War II [
6]. During this time, substantial improvements were made to composite research, particularly for military applications, such as aircraft [
7]. What brought about this research was an attempt to incorporate the strengths of materials predicted from solid-state theory and crystalline material into practical applications [
8]. Significant amounts of research regarding composites are focused on composites with small features, such as fibers, with less extensive research on macro-scale composites [
9]. This, however, should not be seen as a negative with respect to civil infrastructure composites, which tend to be macro-scale composites, as many of the determinations of research regarding these composites with smaller features apply to macro-scale composites. One example is sizing agents, chemicals utilized for glass fiber composites to allow the glass to bond appropriately to polymer matrices (or binders). Some examples of macro-scale composites utilized for civil engineering applications include concrete, reinforced concrete (the most similar material to glass reinforced composite columns (GRCCs)), asphalt, cased drilled shafts, and fiber-reinforced polymers using carbon and glass fibers. In general, the importance of composites in civil engineering has increased over time [
10].
A glass compressive strength of 1000 MPa is assumed in this paper. While this is not commonly known information, there are select sources that indicate that a value of 1000 MPa is conservative. For instance, Ref. [
11] indicates that the compressive strength of fused quartz is greater than 1100 MPa. Ref. [
12] indicates that, when loaded with a compressive load that is dynamic, borosilicate glass can have a strength of 2000 MPa. Ref. [
13] indicates that a strength of 1000 MPa can be assumed for glass in a general case.
It should be clarified that bulk glass refers to glass manufactured through continuous-sheet processes, such as float glass, as opposed to batch or fiberglass. Glass fibers, while having a substantial tensile strength, have an unfavorable strength to cost ratio due to their increased cost. Glass fibers also perform more poorly in compression than bulk glass (~700 MPa strength [
14]), compiling to an even less ideal compressive strength to cost ratio when compared to bulk glass.
It should be said that significant research has been conducted regarding pultruded glass fibers, which have a different potential market. Examples include Refs. [
15,
16,
17], which feature related tests of similar material: pultruded-fiber-reinforced polymers (PFRPs). Ref. [
17] is particularly relevant, as it provides failure of this similar material in a related compressive testing to determine the delamination.
This is also a stark contrast with polymers reinforced with pultruded glass fibers, such as those indicated by Refs. [
18,
19,
20,
21]. This paper suggests the incorporation of bulk glass sheets as reinforcement due to their low cost and high strength, in place of the use of glass fibers. Pultruded glass fibers have their place in practical applications, but the focus is on a structural lumber alternative, which requires exceedingly low costs.
It would be incomplete to not include a section on the bonding strength of polyurethane to glass. A similar composite structure developed by Mohamad et al. [
22] resulted in failure due to debonding of the composite to the glass fibers. The failure mechanisms noted by Mohamad et al. were similar to the failure mechanisms noted in this work. The bonding of glass to polyurethane is primarily due to hydrogen bonding as opposed to ionic, covalent, or chemical bonding [
23]. The typical specific bond strength of polyurethane thermoset resin to borosilicate glass is unknown. However, the eventually manufactured glass-reinforced composite columns utilizing high-density polyethylene (or other lower-cost thermoplastic resin) will utilize sizing agents that can provide a typical strength of 44 MPa [
24,
25].
The works presented here have additional supporting literature. The incorporation of glass as a load-bearing material has been attempted by many others (e.g., [
26,
27,
28,
29]). These applications tend to seek transparent material for aesthetic reasons. These types of structures, when designed to allow for maximum loading, require post-tensioning of the glass to build compression in the glass, which is not practical for the column-type applications we envision.
What is interesting about properly designed composites is that the method of manufacture, design requirements, and configuration all work together to provide an appropriate material that can be applied to industry [
30]. That is to say, the eventual configuration of GRCCs, after they have been vetted, will likely change to incorporate additional advantages that can be found by manufacturing the reinforcement to fit the requirements of a compressive reinforcement. The complexities of composite designs are dictated by the manufacturing techniques available to the composite manufacturing industry [
7].
This paper seeks to demonstrate that a cost-competitive material composed of a polymer binder and bulk glass reinforcement can be produced, and that it can maintain appropriate safety factors. To confirm this, samples are manufactured using a thermoset polymer casting process. The eventual manufacturing process proposed for GRCCs is an overjacketing extrusion process (also referred to as coextrusion, such as by Ref. [
5]), which is similar to a pultrusion process. In an overjacketing extrusion process, the bulk glass would be fed into the extrusion head of an extruder; as the glass feeds into the head of the extruder, the polymer is extruded over the outside surface of the glass. The polymer exterior sheeting serves two purposes: it provides a protective coating on the glass and greatly improves the critical buckling load of the columns. So while the samples manufactured for this work are manufactured using a casting process, the eventual process will be an overjacketing extrusion process, as this manufacturing method leads to significantly improved manufacturing costs per unit [
31].
There are additional benefits to bulk glass. Bulk glass, when compared on the basis of CO
2 generated and embodied energy per unit strength, produces only 15% of the CO
2 of concrete manufacturing (assuming recycled glass) and 20% of the embodied energy of concrete [
30]. Additionally, the materials utilized for GRCCs are resistant to degradation that normally occurs with many civil infrastructure materials.
This paper aims specifically to determine the possibility of practical GRCCs being utilized with appropriate safety factors. The practical GRCCs were first researched in our earlier publication [
25], in which we concluded that a 2 × 4 stud replacement could be manufactured at an 11% savings over structural timber and a GRCC replacement for steel columns could be manufactured at a 50% savings. Accordingly, we produced samples utilizing thermoset polyurethane resin and a PVC inner core, which is explained in the procedure section. Following this, we discuss the results, which come in the form of load vs. displacement graphs for the columns. After this, we analyze these results using both analytical equations and finite element modeling. A discussion and conclusion section finish the paper, discussing that there is strong evidence that the bond strengths necessary for practical GRCCs are far below the bond strengths that developed during our testing.
2. Design Methodology
The design methodology has never been explained in detail in any of the associated glass-reinforced composite column papers. A design explanation is provided here.
The columns are required to be hollow. There are a number of reasons for this: (1) the material contained in the center of a column is not loaded sufficiently to justify its use, (2) the weight increase from a filled column will greatly increase shipping costs, and (3) the cost of raw materials to fill the column will greatly reduce the cost-effectiveness of the columns. Concrete infill is one example. In the case of a concrete infill, the weight of a filled column would be excessive without the development of novel mixtures. For example, a typical 38.1 mm by 88.9 mm lumber column (a standard 2 × 4 stud in the United States) at a 2.4 m length (an 8-foot length, which is a standard length in the United States) would increase the mass by 283% (from 5.5 kg to 20.9 kg or from 12 lbs to 46 lbs), with a standard weight concrete of 2400 kg/m3. While other, lightweight concretes may be available, the costs are less known and may not justify their use.
For GRCCs filled with concrete, attaching fixtures to the column becomes difficult. Typical fasteners used in industry, such as ring-shank nails and wood screws, cannot be driven into standard concretes using standard equipment. The incorporation of additional equipment will introduce added installation time or cost.
Due to these issues, in our research, we have steered away from the concept of using an interior-filled column. To fully investigate this would require an additional paper.
Design Intention
The design intention for these columns should also be described. GRCCs are intended as a drop-in replacement for structural lumber, or, more specifically, structural lumber columns. By this, we specifically mean a column that provides equivalent or greater strength than lumber and is installed in the same, or similar, way as structural lumber. This is intended to encourage widespread adoption of the technology.
The specific approach of a drop-in replacement may seem counterintuitive, as there may exist alternate methods of installation that can be improved within the construction industry. However, construction and building material installers are prone to non-adoption of new technologies that modify their standard modes of installation. The specific reason for this prevalence of older installation methods is unknown but can be theorized to be caused by several reasons, such as general hesitancy, the ease of use of structural lumber, the ability to cut and place material as necessary in difficult-to-frame situations, and the cost-competitive nature of lumber. As for the specific end use, due to the wide usage of lumber, it is unrealistic to cover all the potential uses with a single design. Certain uses will require certain modifications. For example, in order to pass fire-code requirements for structures in many municipalities, the polymers utilized may require the addition of fire retardants during manufacture. One usage of these columns would be for landscaping or agricultural uses as a fencing material, as the requirements for such uses are less stringent when compared to structures intended for the occupation of humans.
It may be more appropriate in the future to develop multiple systems that emulate the “drop-in replacement” technique for other installation modes or framing methods. For example, a redesign of the system may allow for a cost-competitive alternative to light-gauge steel studs. A single drop-in replacement cannot be foreseeably and economically manufactured to fit all cases.
The maximum possible dimensions are not known and are heavily dependent on the manufacturing process. Extrusions up to 1.2 m in diameter are possible in high-density polyethylene, though the required thicknesses for a GRCC at these dimensions are unknown, as it is far outside the intended application being investigated in our initial studies.
3. Materials and Methods
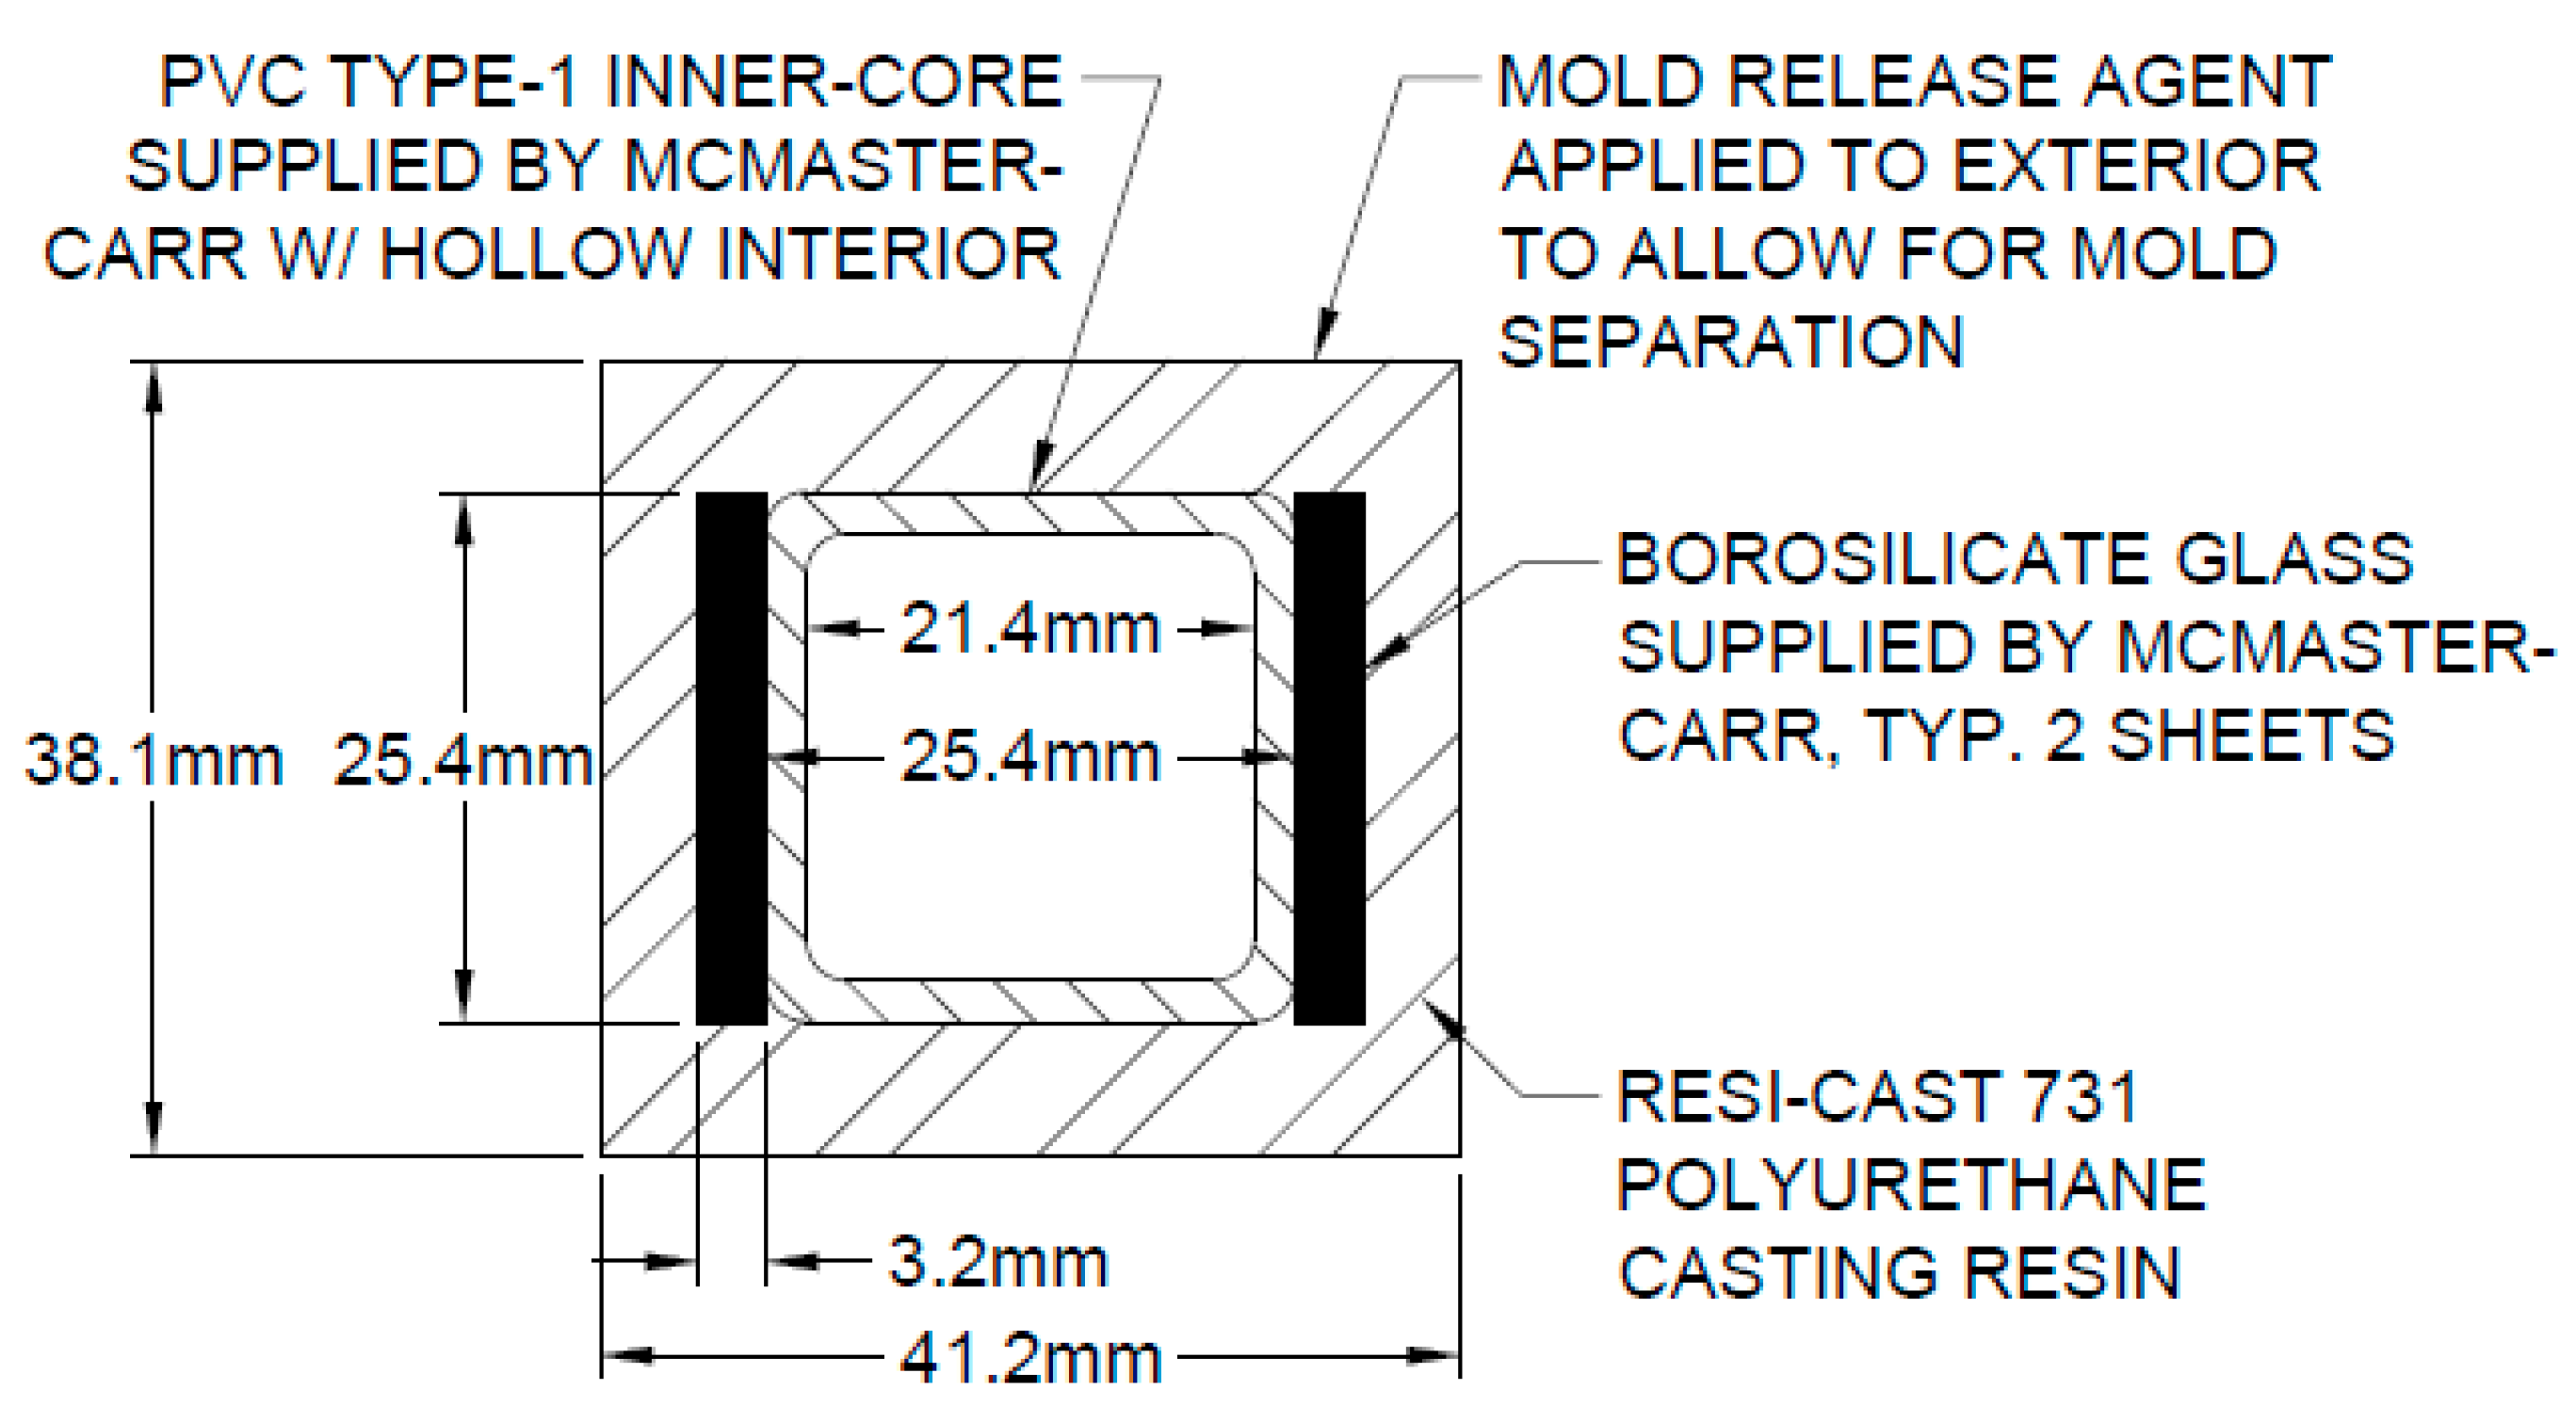
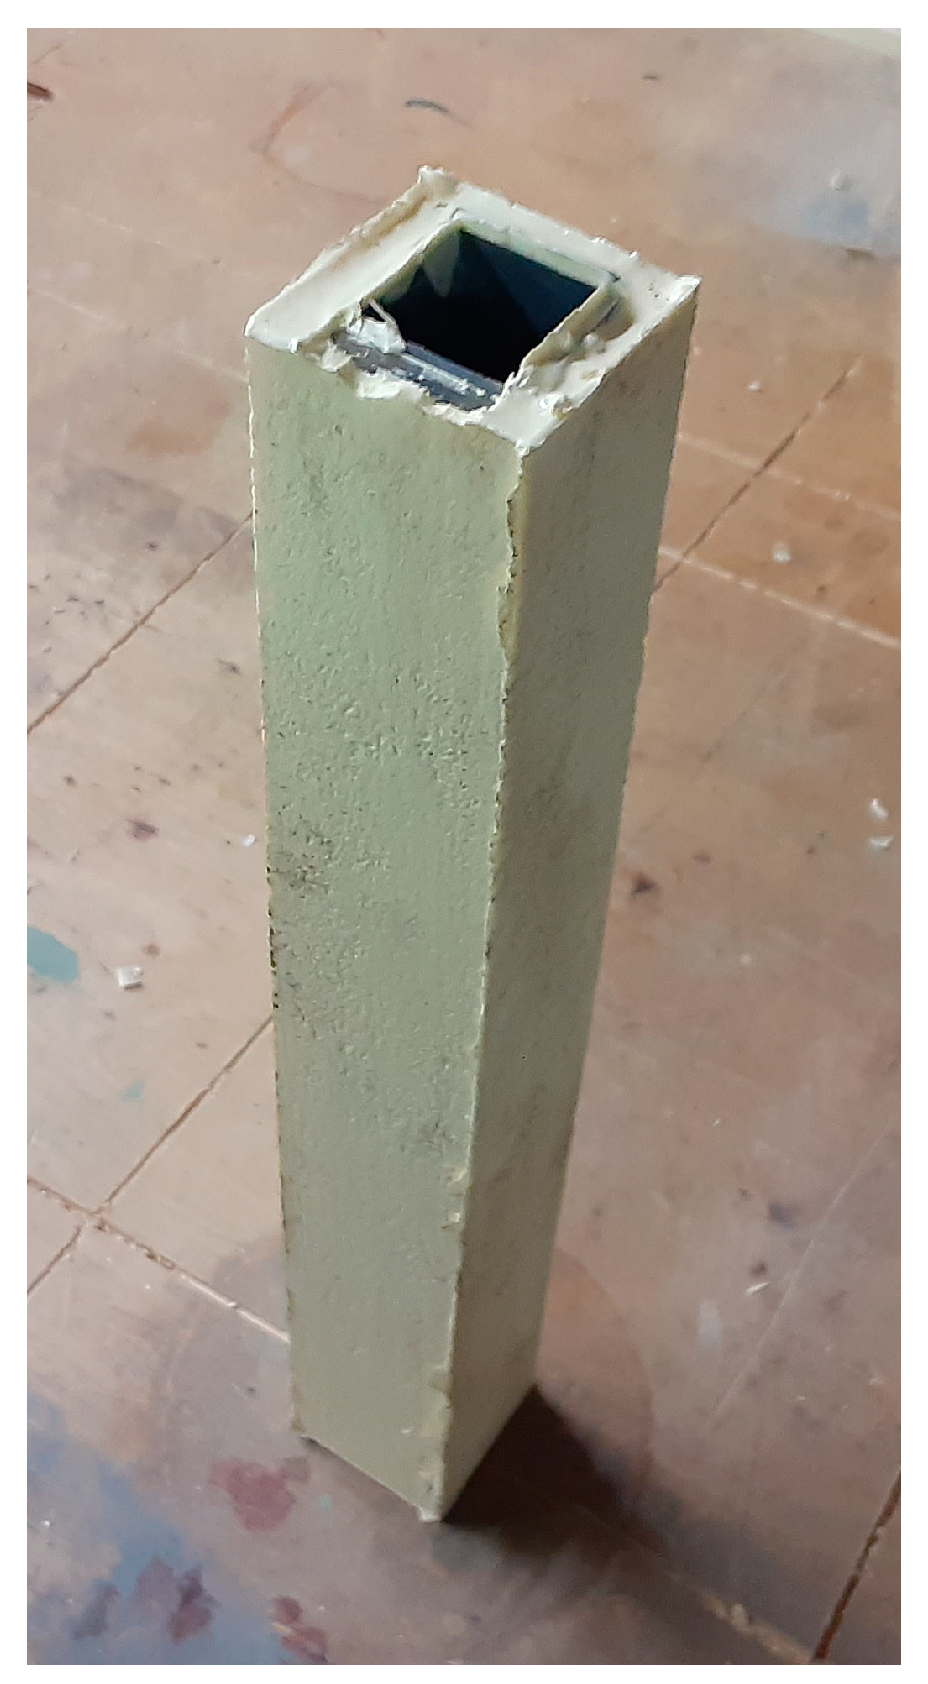
The procedure began with the fabrication of the columns. This was accomplished through a custom mold created using wood fabrication techniques. The column selected for fabrication is a GRCC utilizing Resi-Cast 731 polyurethane casting resin as the binder, a Type-1 PVC inner-core (supplied by McMaster-Carr) with two panes of borosilicate glass (also supplied by McMaster-Carr). The columns’ finished height was 304.8 mm. The other column dimensions can be seen in
Figure 1 below.
It should be noted as to why the specific dimensions are used in this experiment. We had considered using the full profile intended (88.9 mm by 38.1 mm, standard dimensions for 2 × 4 studs in the United States); however, to develop a buckling failure as intended, the columns would have needed to be manufactured in much longer specimens. The issue with the production of a longer column given the available manufacturing methods becomes impractical due to the exceedingly low working time of the Resi-Cast 731 resin; this resin begins setting up in approximately one minute, including mixing time. This gives approximately 30 s of mixing time and 30 s of pouring time. These working and mixing times vary between individual batches and on conditions of the surroundings during casting. With the pouring time of 30 s available, casting a column of 500 mm, for example, would be extremely difficult without a designed injection system. Even at a column height of 304.8 mm, the resin could be placed within this time frame, but several failures resulted from inadequate flow of the resin. Using this manufacturing system in the future will require finding an alternative polyurethane casting resin that has a longer working time.
Therefore, given the reduced column height, a smaller cross-section was desired that emulates more closely the aspect ratios of the intended application. This allows for the establishment of practical buckling strengths of the materials used as well as the loading system of the columns.
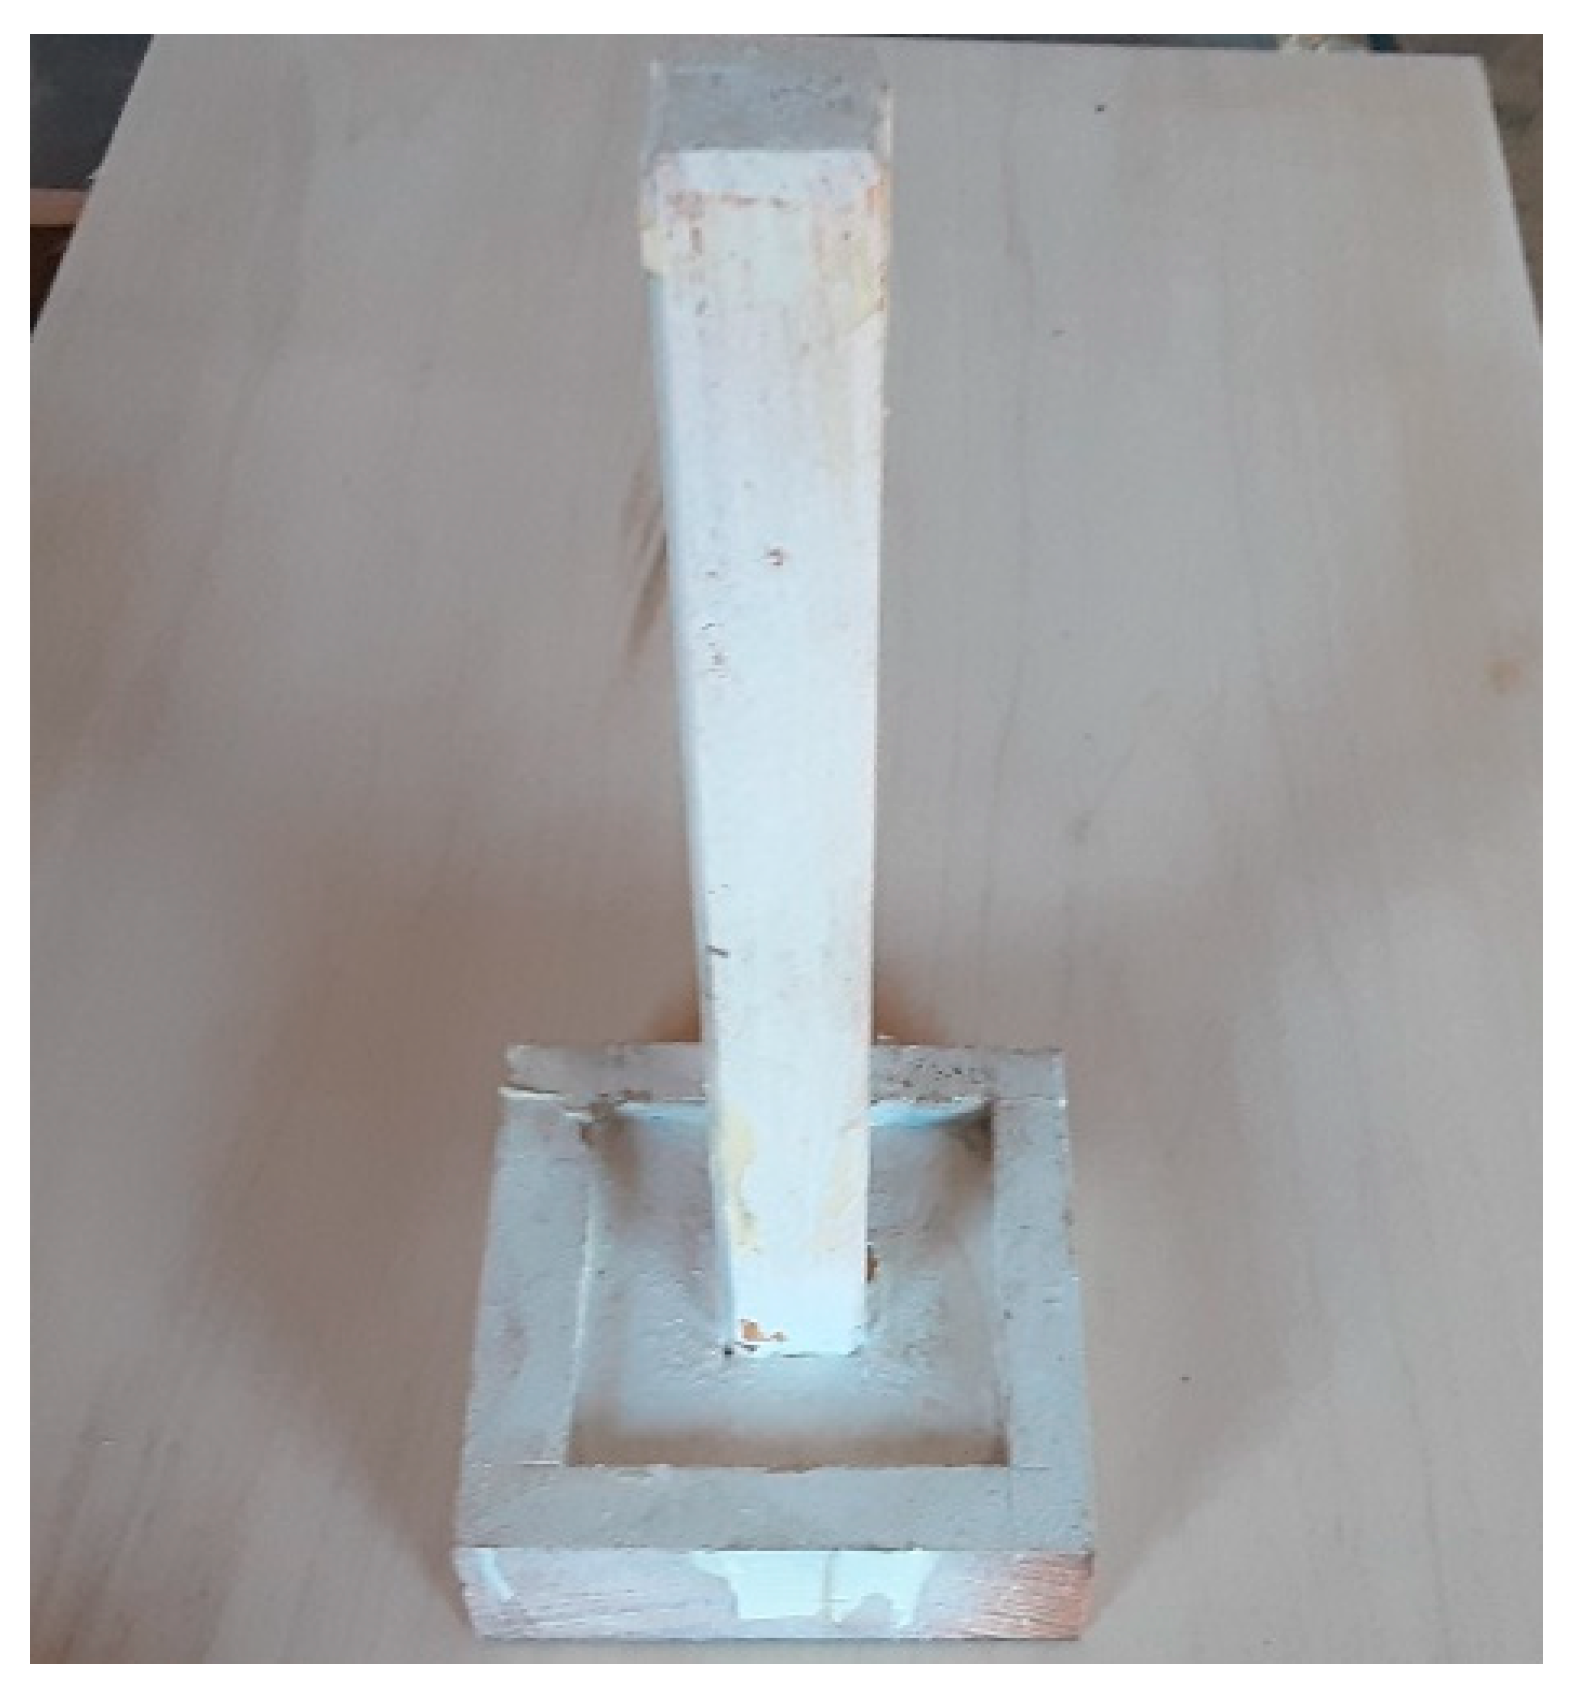
Figure 2 shows the custom mold base, which includes a square dowel to allow for alignment of the inner-core PVC sleeve.
Figure 3 illustrates the PVC inner core installed onto the square dowel. Double-sided tape was utilized to temporarily stick the glass to the inner core to allow for these pieces to be held in place during the manufacturing of the samples. Note that the glass was excluded for the control column, instead leaving the inner core installed with no additional glass pieces.
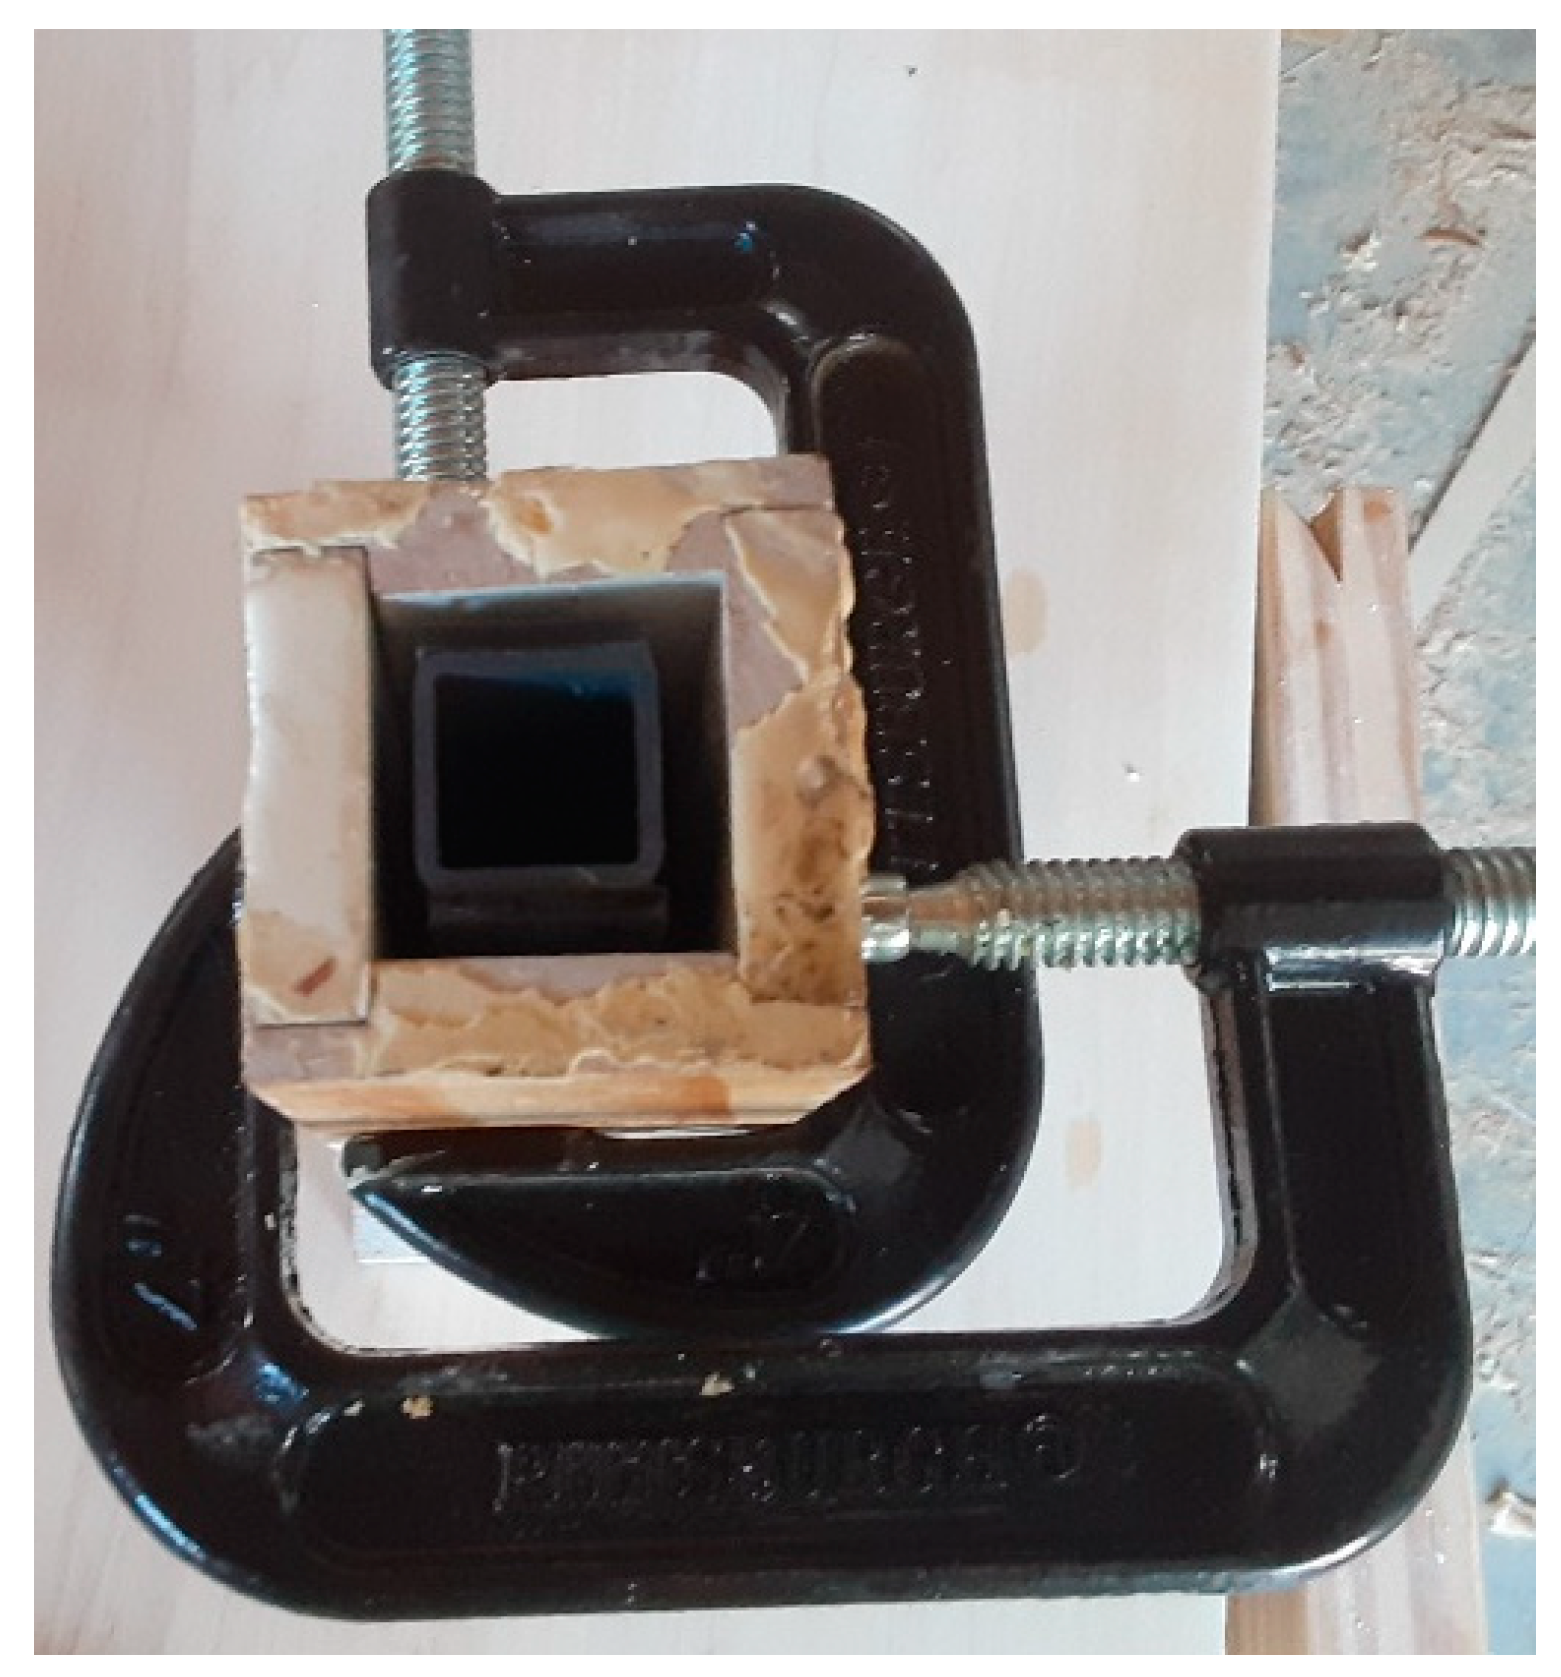
Figure 4 shows the final assembly, in which the wooden planks have been installed around the inner core and have been clamped into position. The region between the wooden planks and the outside of the PVC inner core will be filled with polyurethane casting resin to the top of the mold.
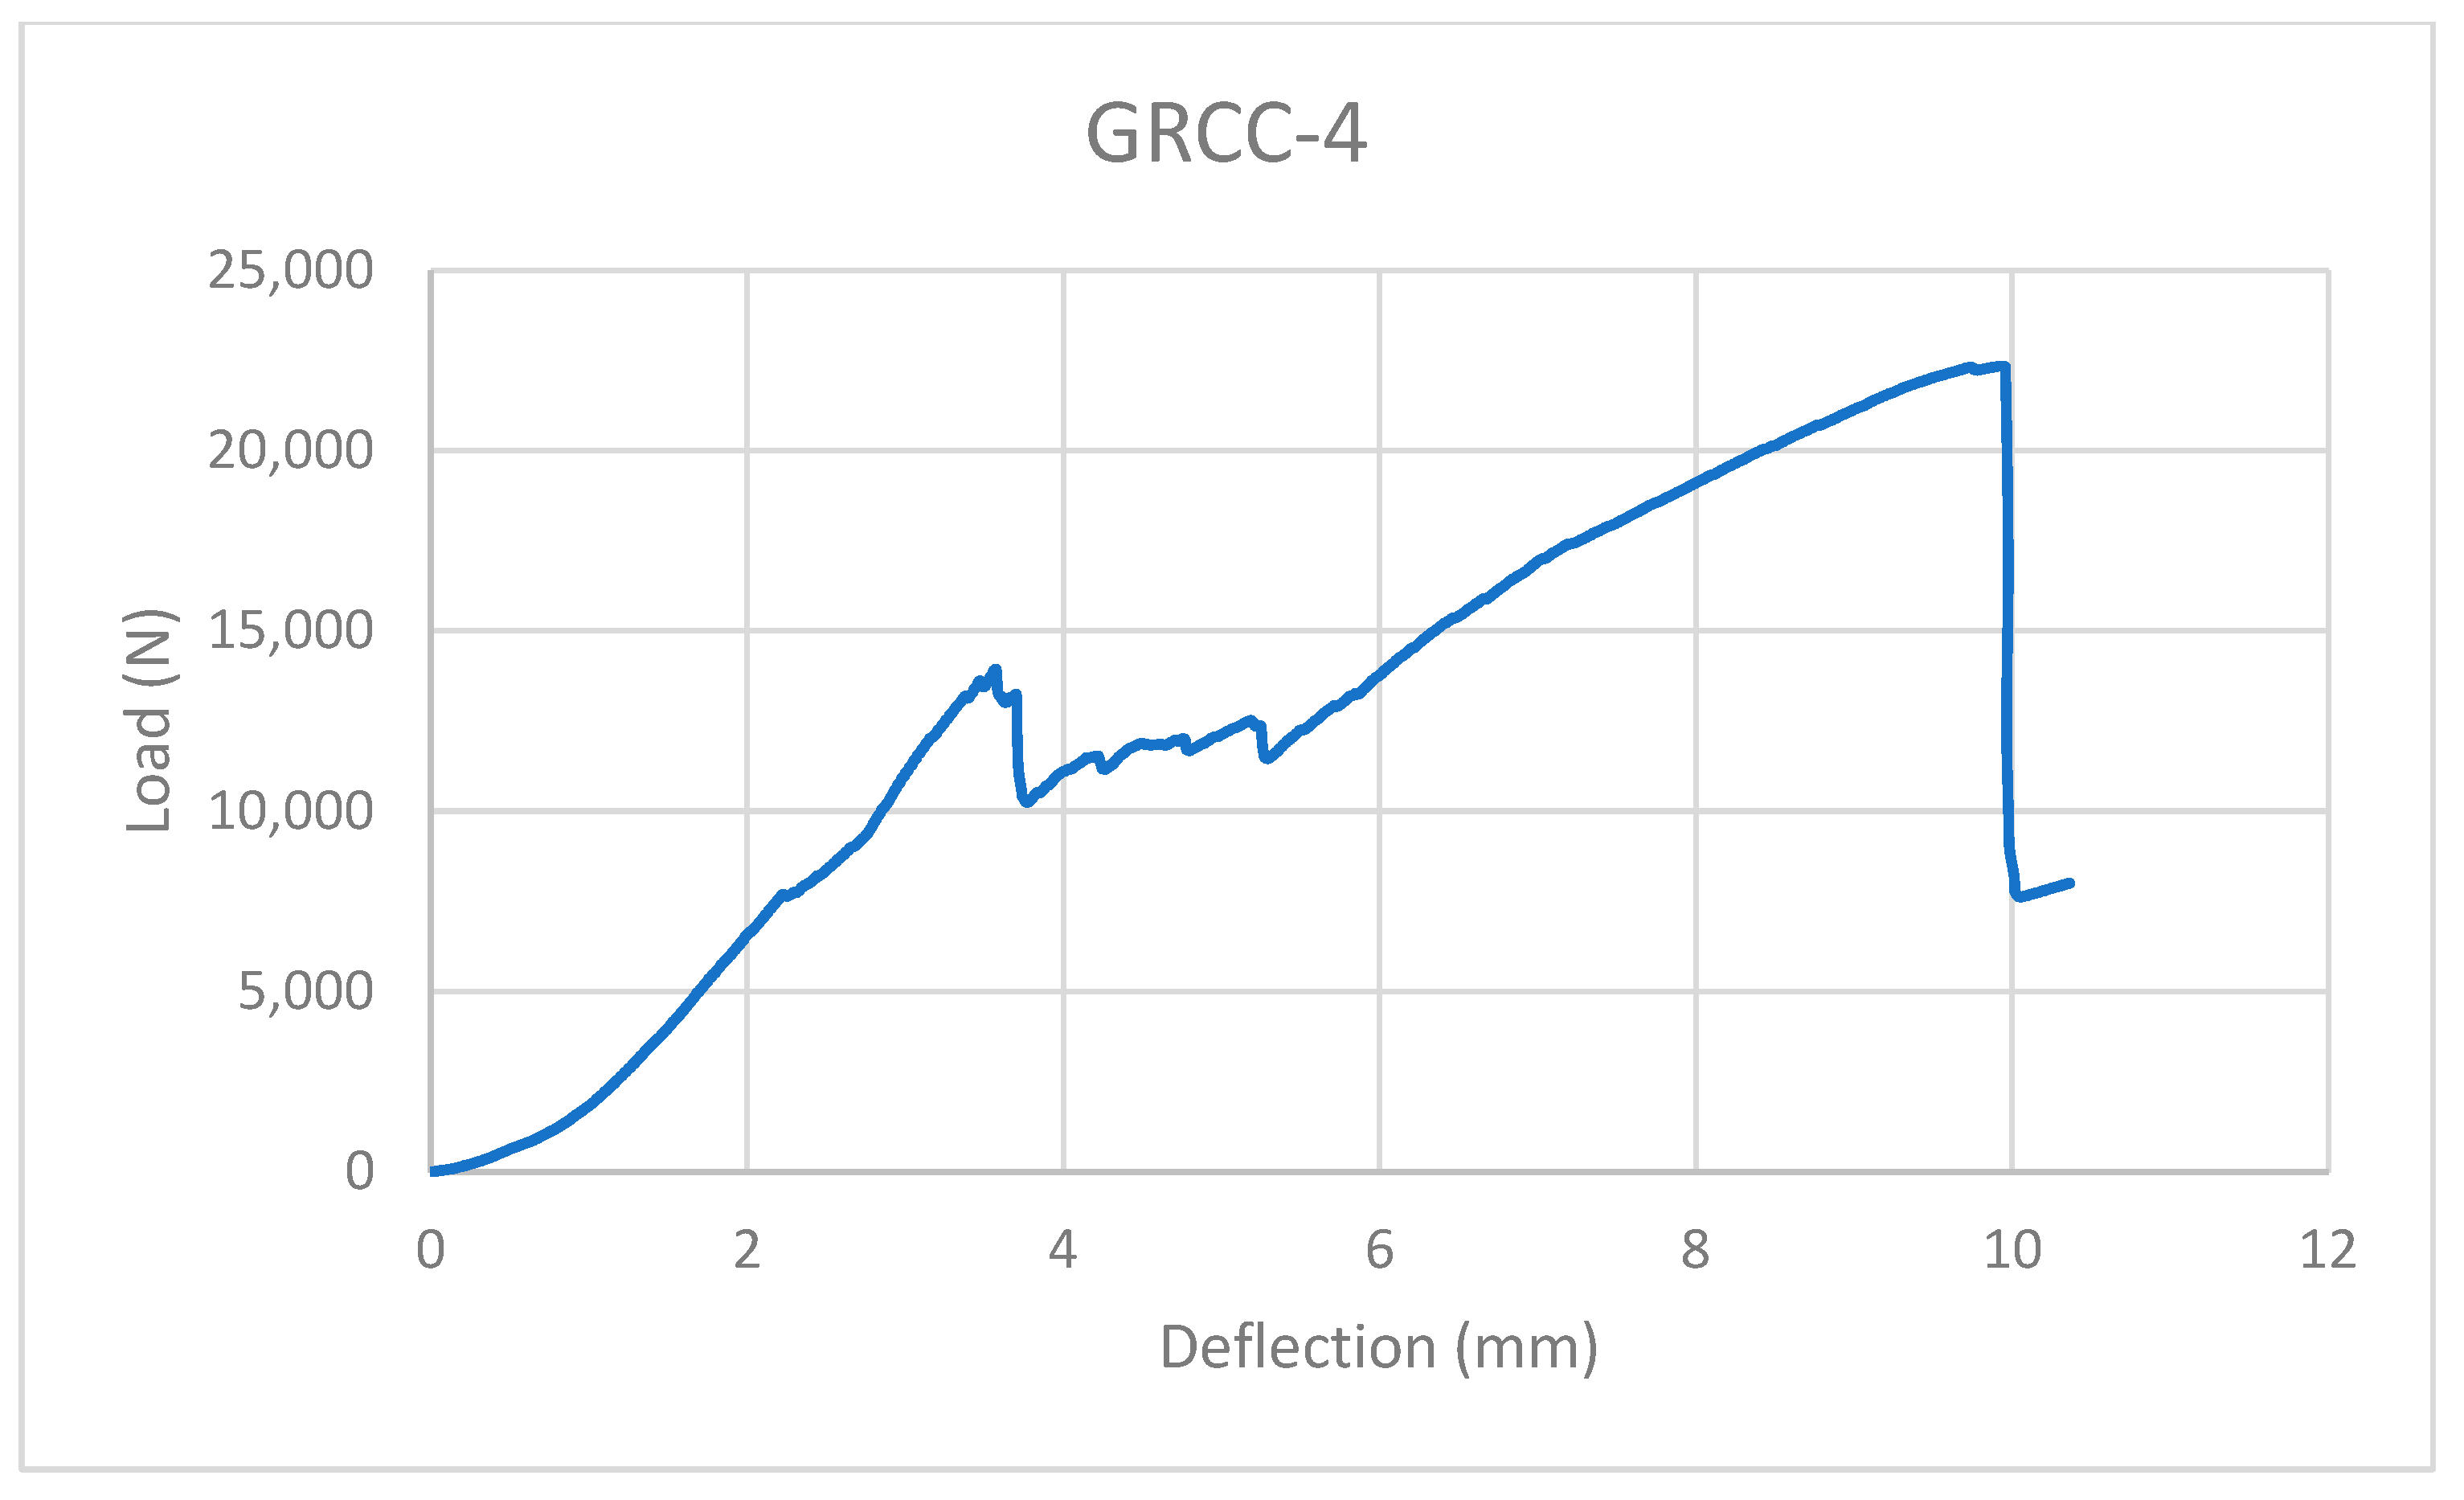
A mold release agent was applied to the wood, allowing for the polyurethane composite to be separated from the mold. This created a slick surface on the final composite but is not believed to have contributed to the premature failure of the columns, as this surface was not contacted during loading. There is, however, the possibility that the mold release agent was accidentally applied (through finger contact with the glass) to the polyurethane-glass interface, which may have contributed to delamination of the glass from the polyurethane in certain samples. We believe that GRCC-4, which had a substantially lower strength than the other columns, had a defect associated with mold release agent being inadvertently applied to the surface of the glass. A complete column example is shown in
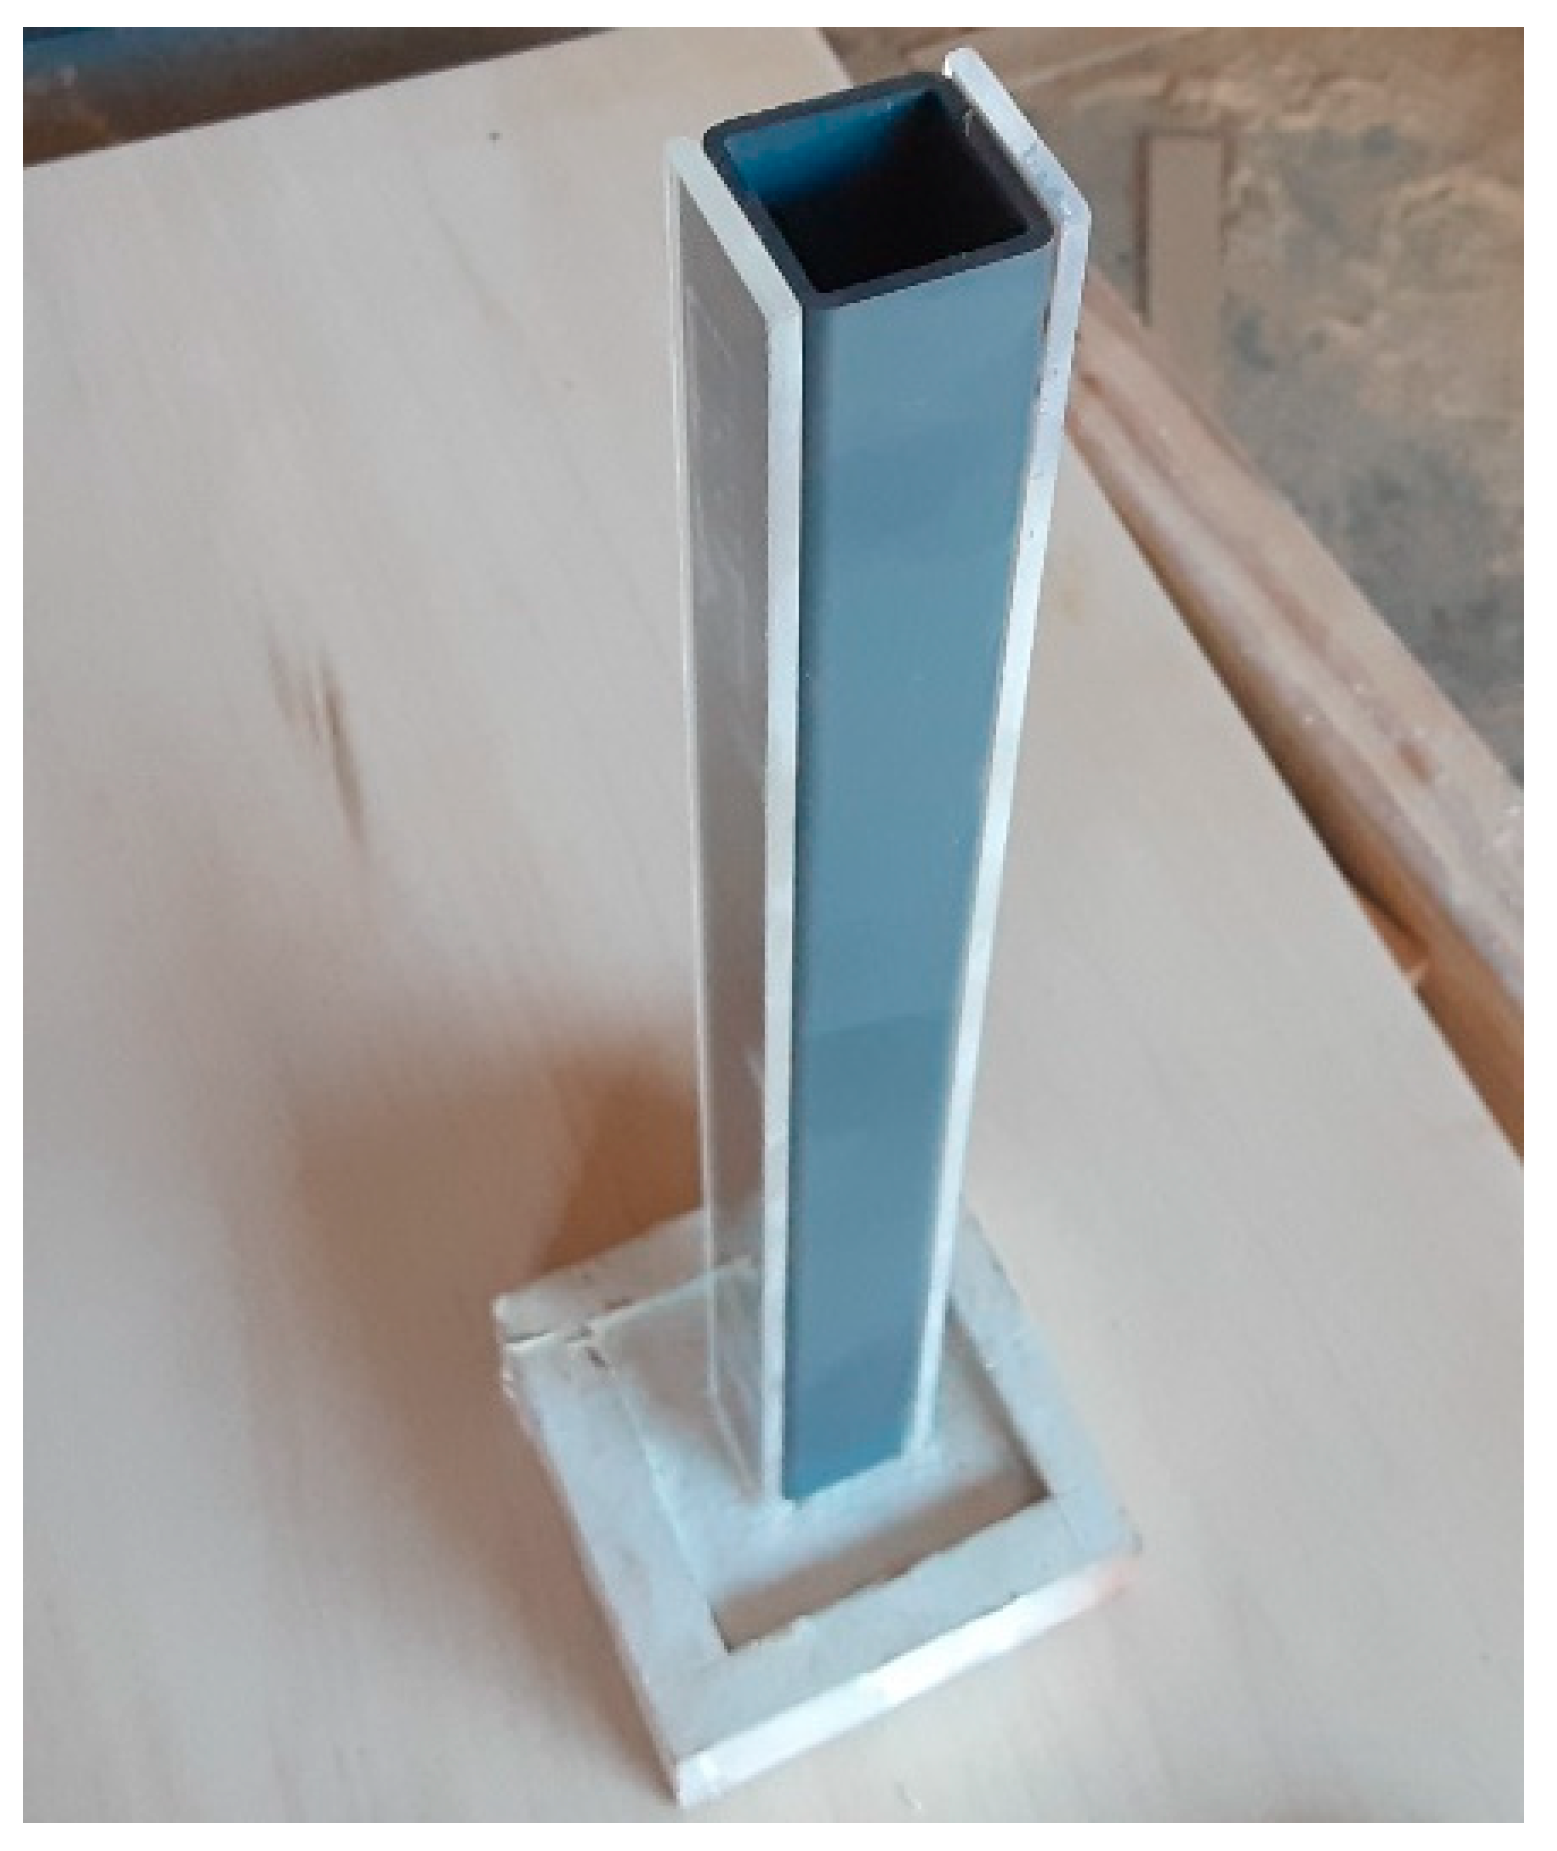
Figure 5 below.
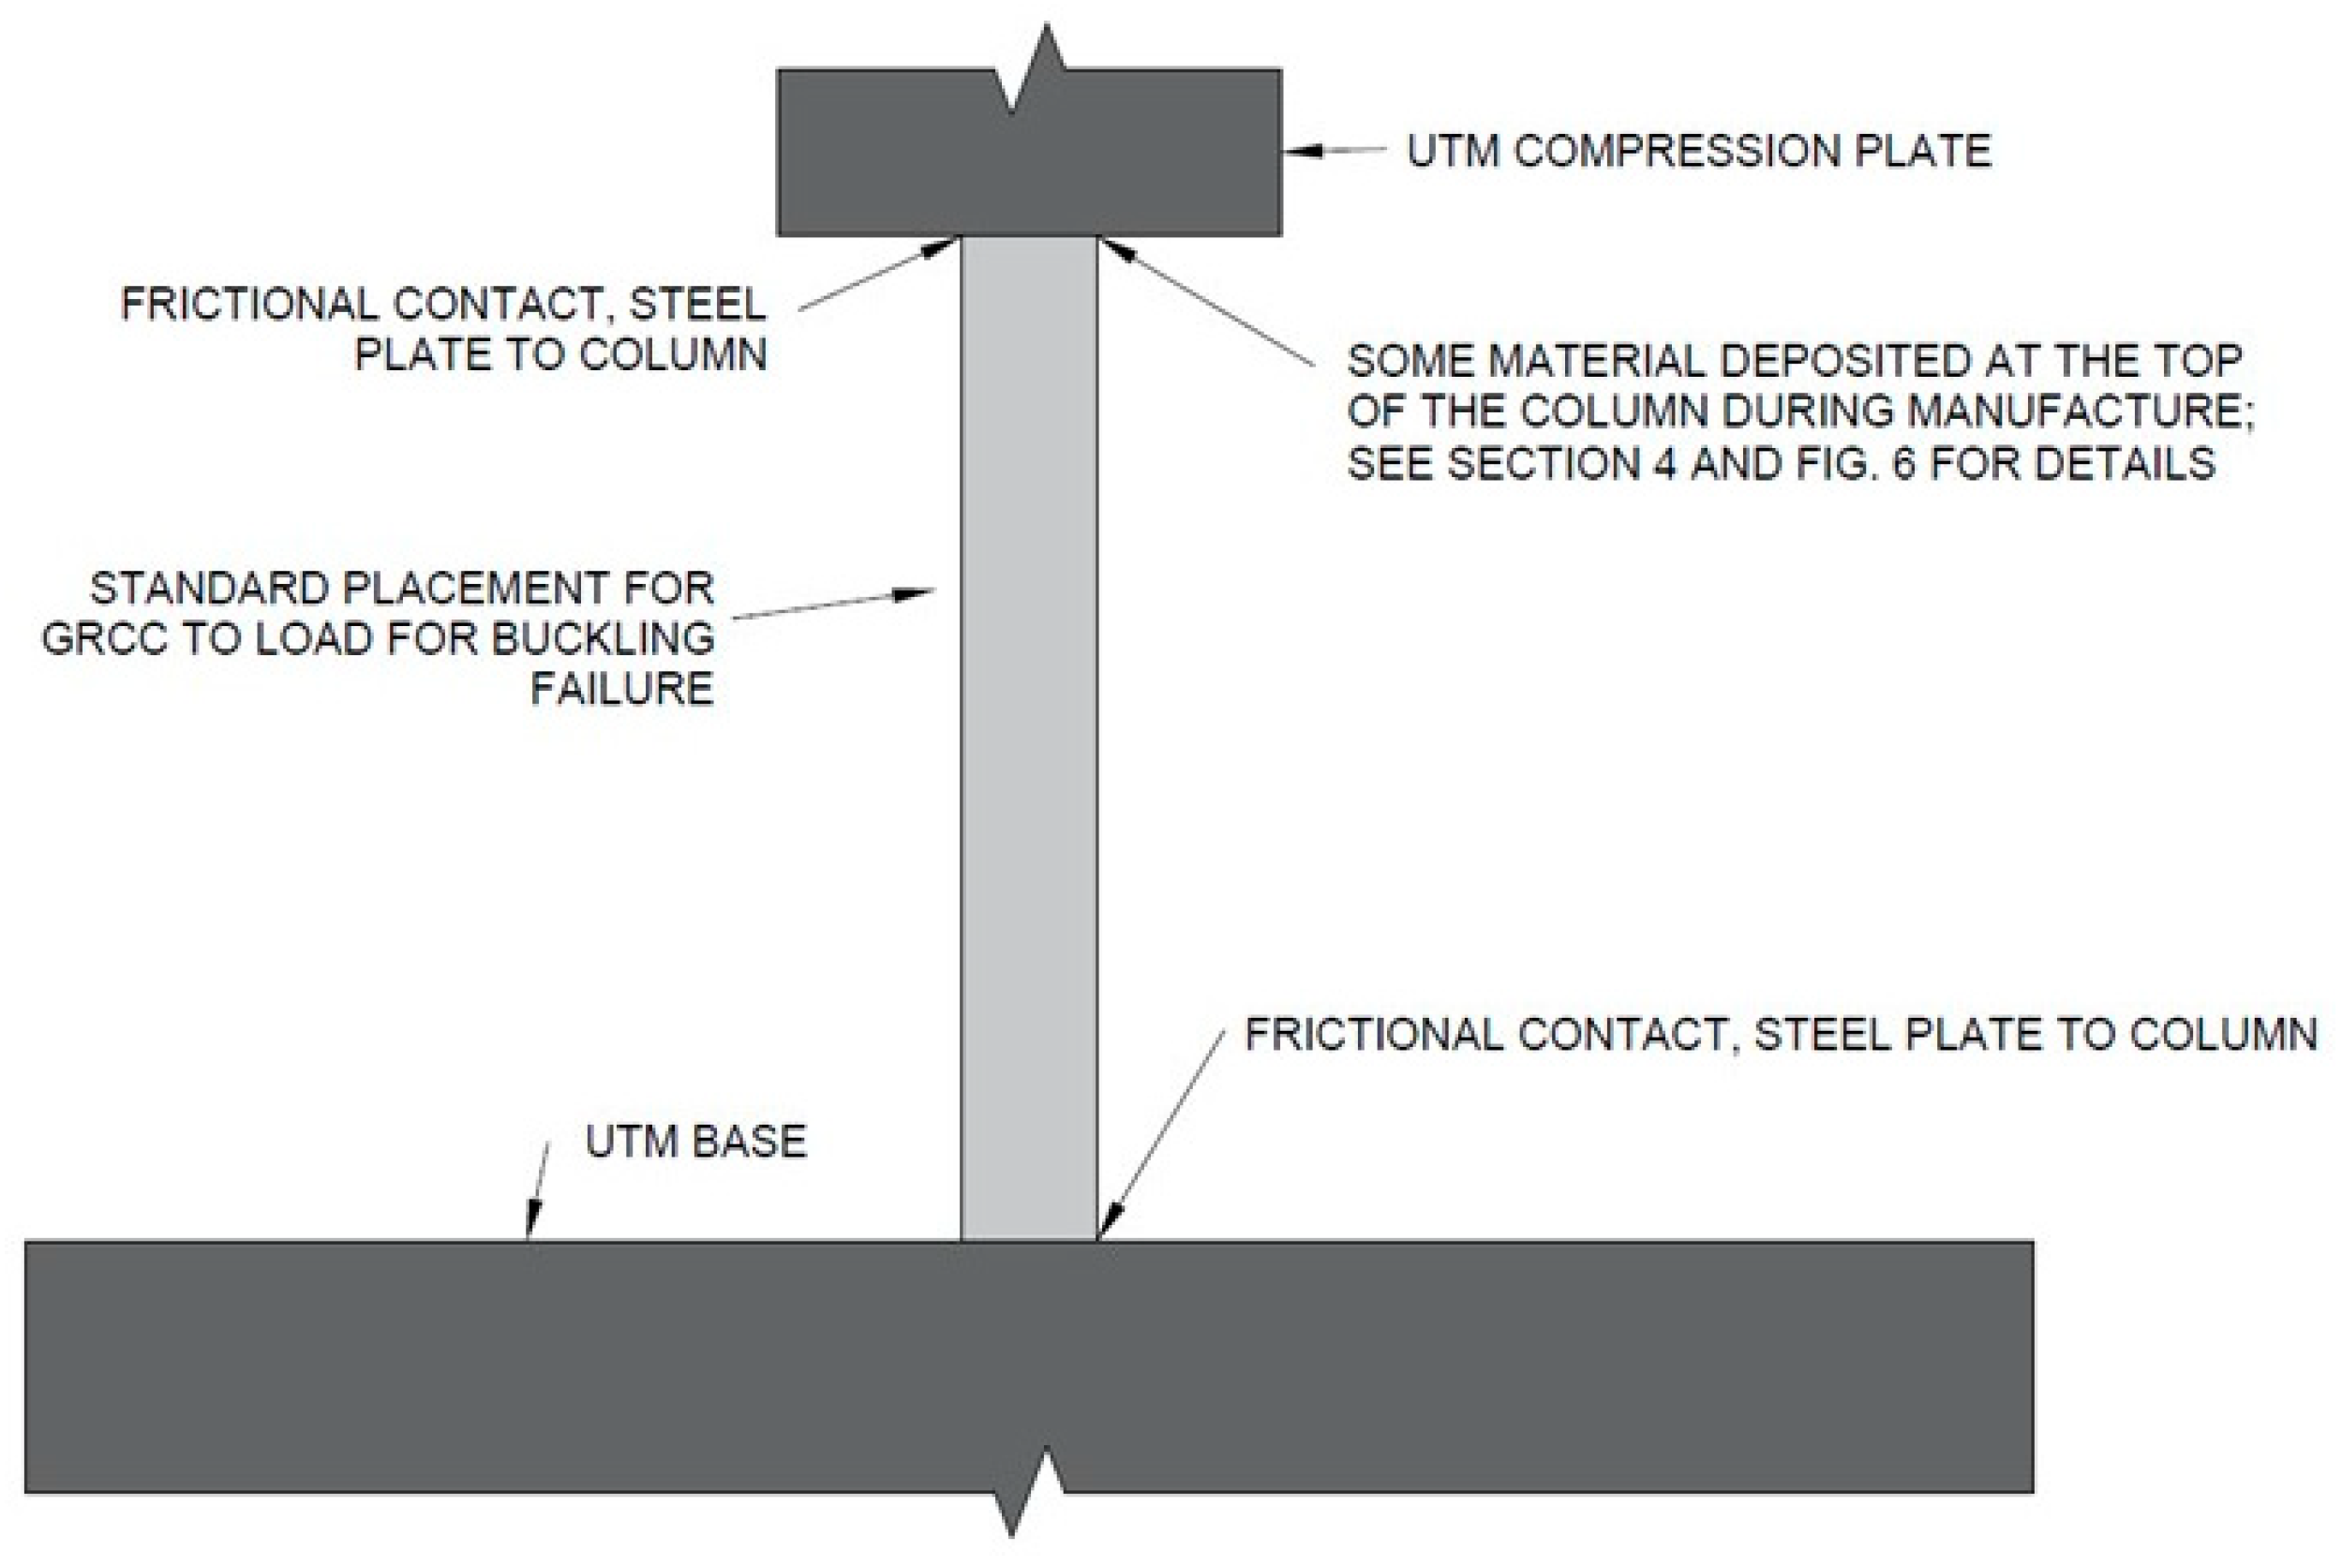
The testing setup used was a 200-kip Instron/Satec Universal Testing Machine (UTM) in compression mode. The columns were only compressed, as this is the intended application of the columns. The testing fixtures at the top and bottom of the columns were direct, frictional contact between the columns and the steel cylinders comprising the UTM. The testing arrangement is shown below in
Figure 6.
The velocity of the UTM was set to 2.54 mm per minute, which equates to a strain rate of 0.5 s−1.
It is also noteworthy to mention that while a short, stub column with effectively no ability to buckle may have been tested, the testing parameters required to test such a sample are difficult to attain. The equipment necessary for cutting the glass to the necessary straightness tolerance was not available. A slight taper of 0.1 mm difference in the height of the glass could easily cause premature failure of the glass sample and would therefore provide an abnormally low strength indication. By the nature of the intended application, in which straightness is necessary, the tolerances for straightness are significantly lower. In other words, a 0.1 mm difference in height in a column applied in the field is not as significant an issue as it would be loading the glass sheet to 160 kN to cause a compressive failure.
4. Results
Table 1 collates the findings of the testing into a single table with data on the ultimate failure load, the delamination load, and additional notes. Some explanation is necessary as to why there is a single testing condition. While it is common to conduct a series of tests with, for example, varied reinforcement or dimensions, this was not chosen for this paper. The specific reason is that the tests conducted are intended to indicate if the design arrangement will work correctly given the novelty of the manufacturing method, arrangement of reinforcement, and materials used. If single tests were conducted on each reinforcement scheme, it would be difficult to interpret if the result was an anomaly or a result of design failure. In this way, the intent is to test the variability of the manufacturing process and loading system. Future work will incorporate far greater variability in testing arrangements.
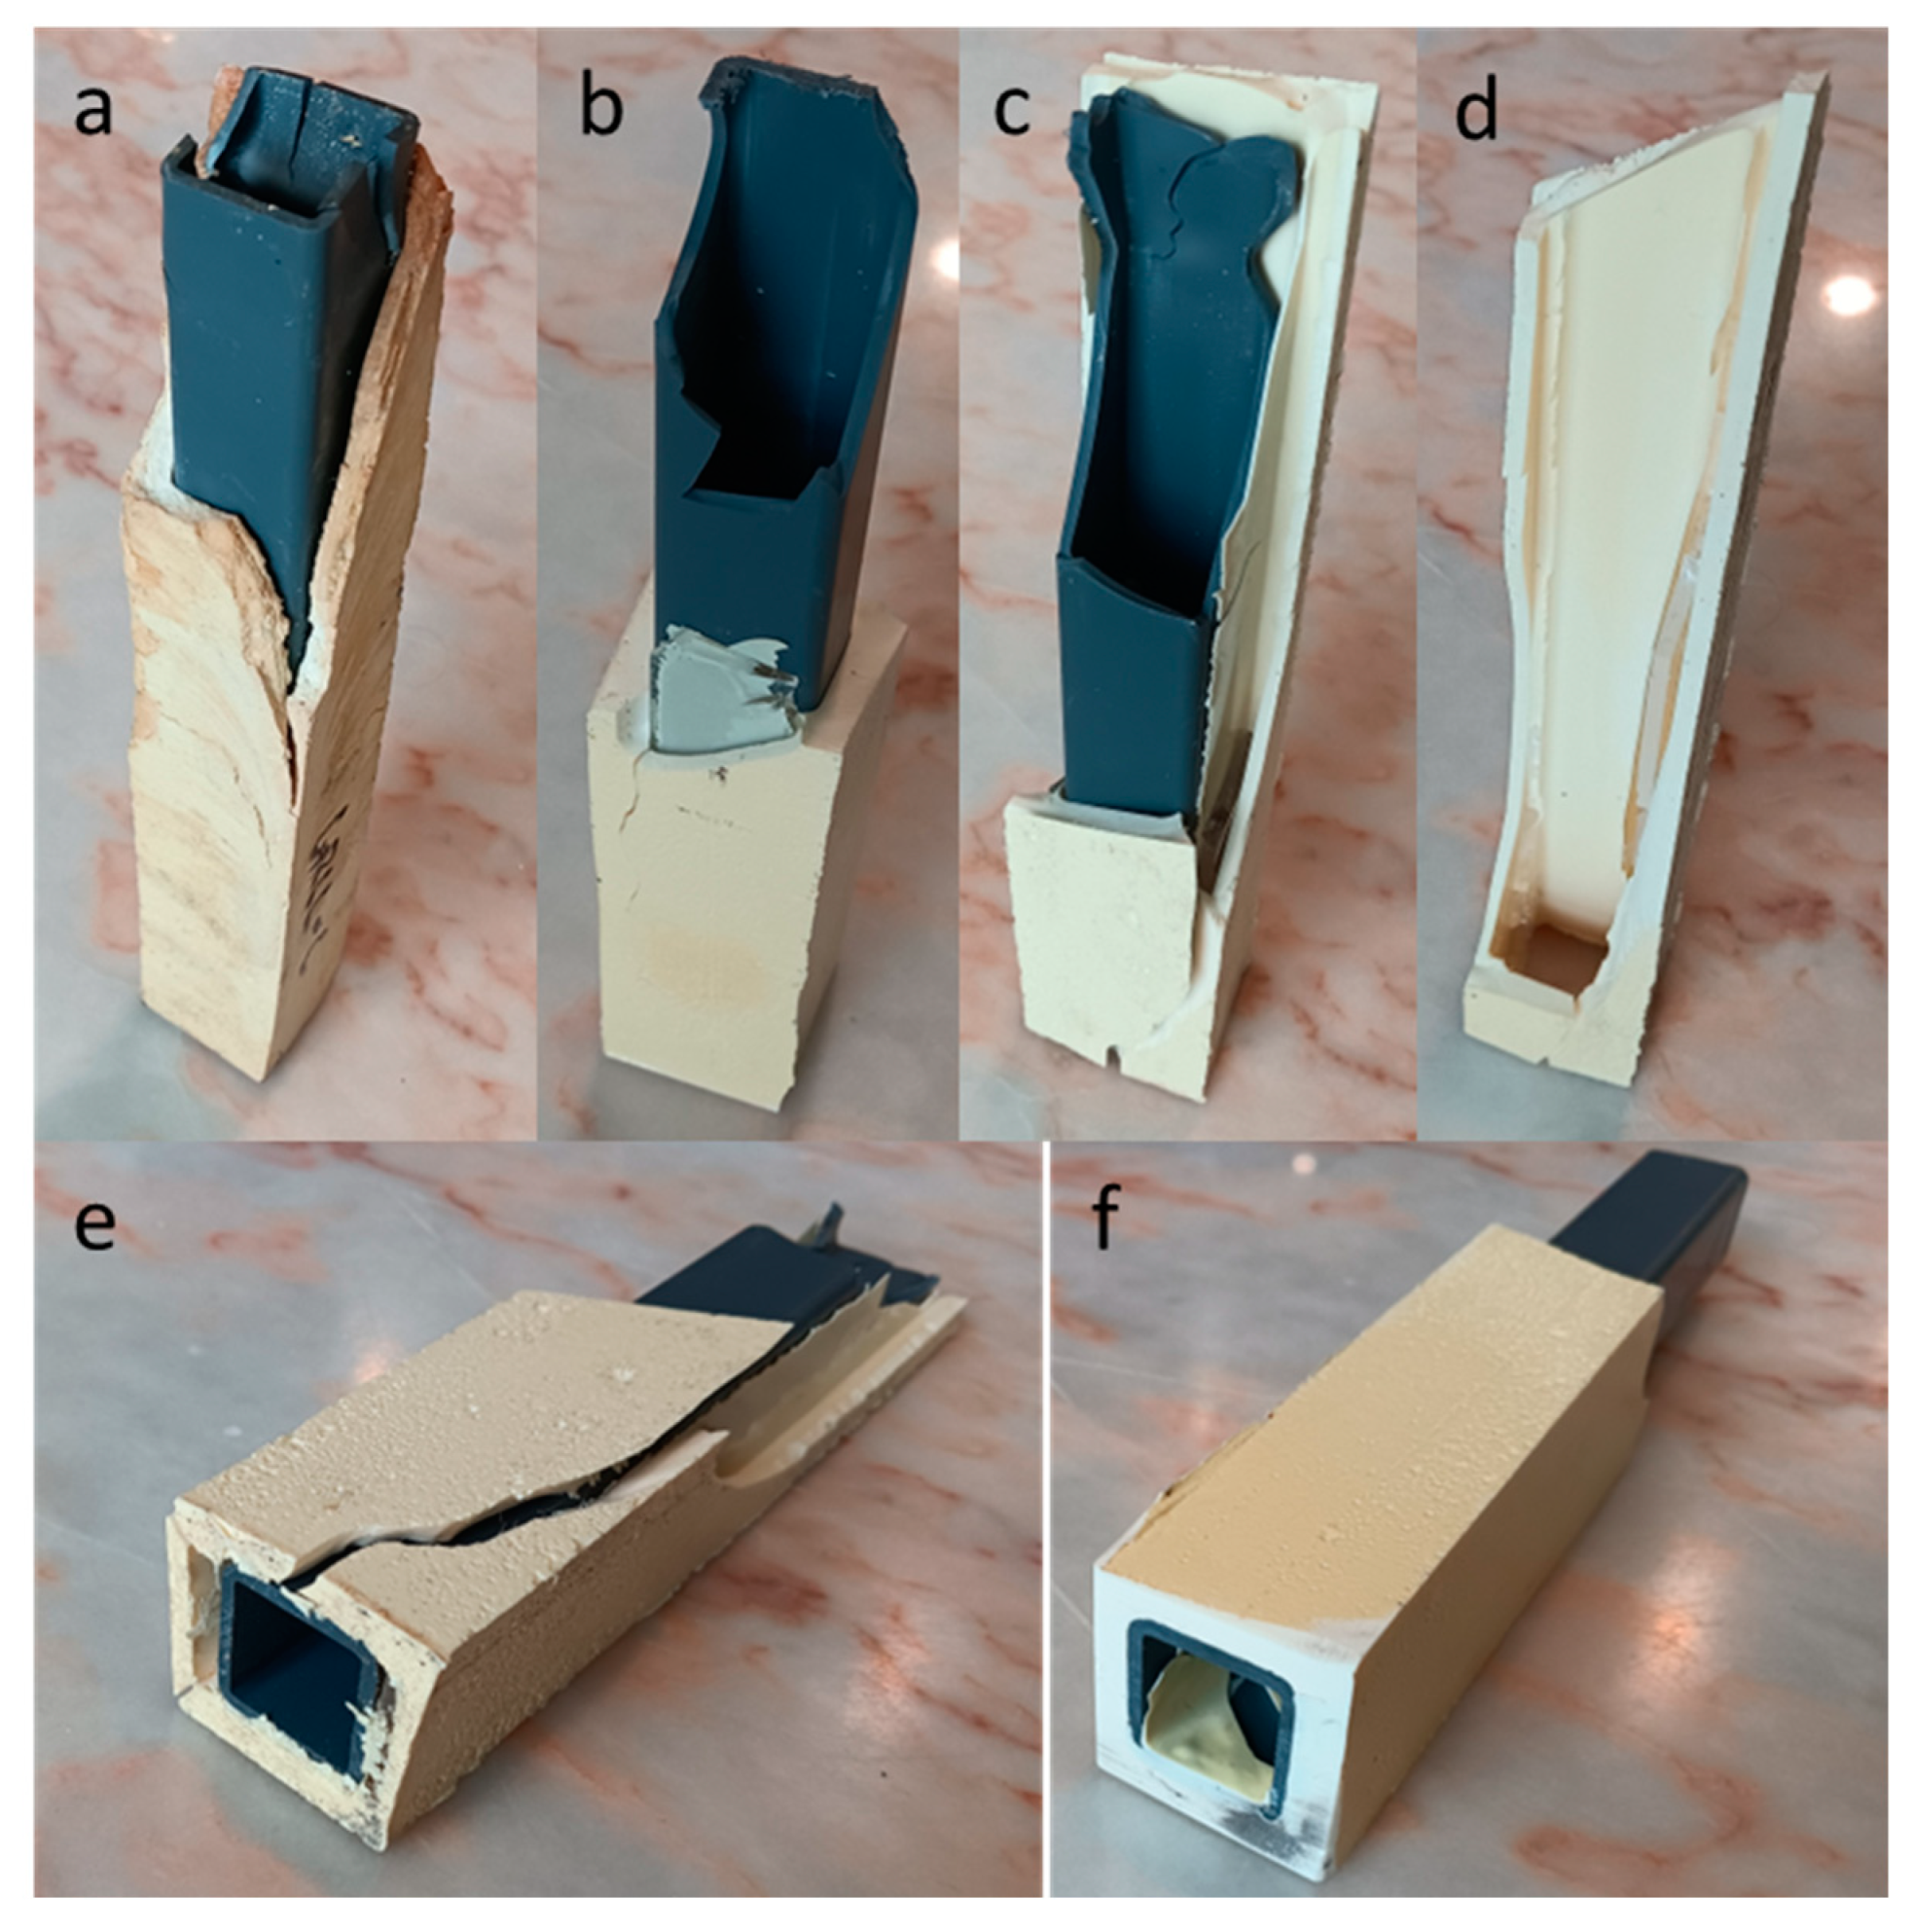
Figure 7 below depicts columns after failure. Note that the remaining sections of the columns were not saved after testing due to the quantity of broken glass remaining after the failure. This is a future potential safety concern but is likely contingent on the specific polymer used.
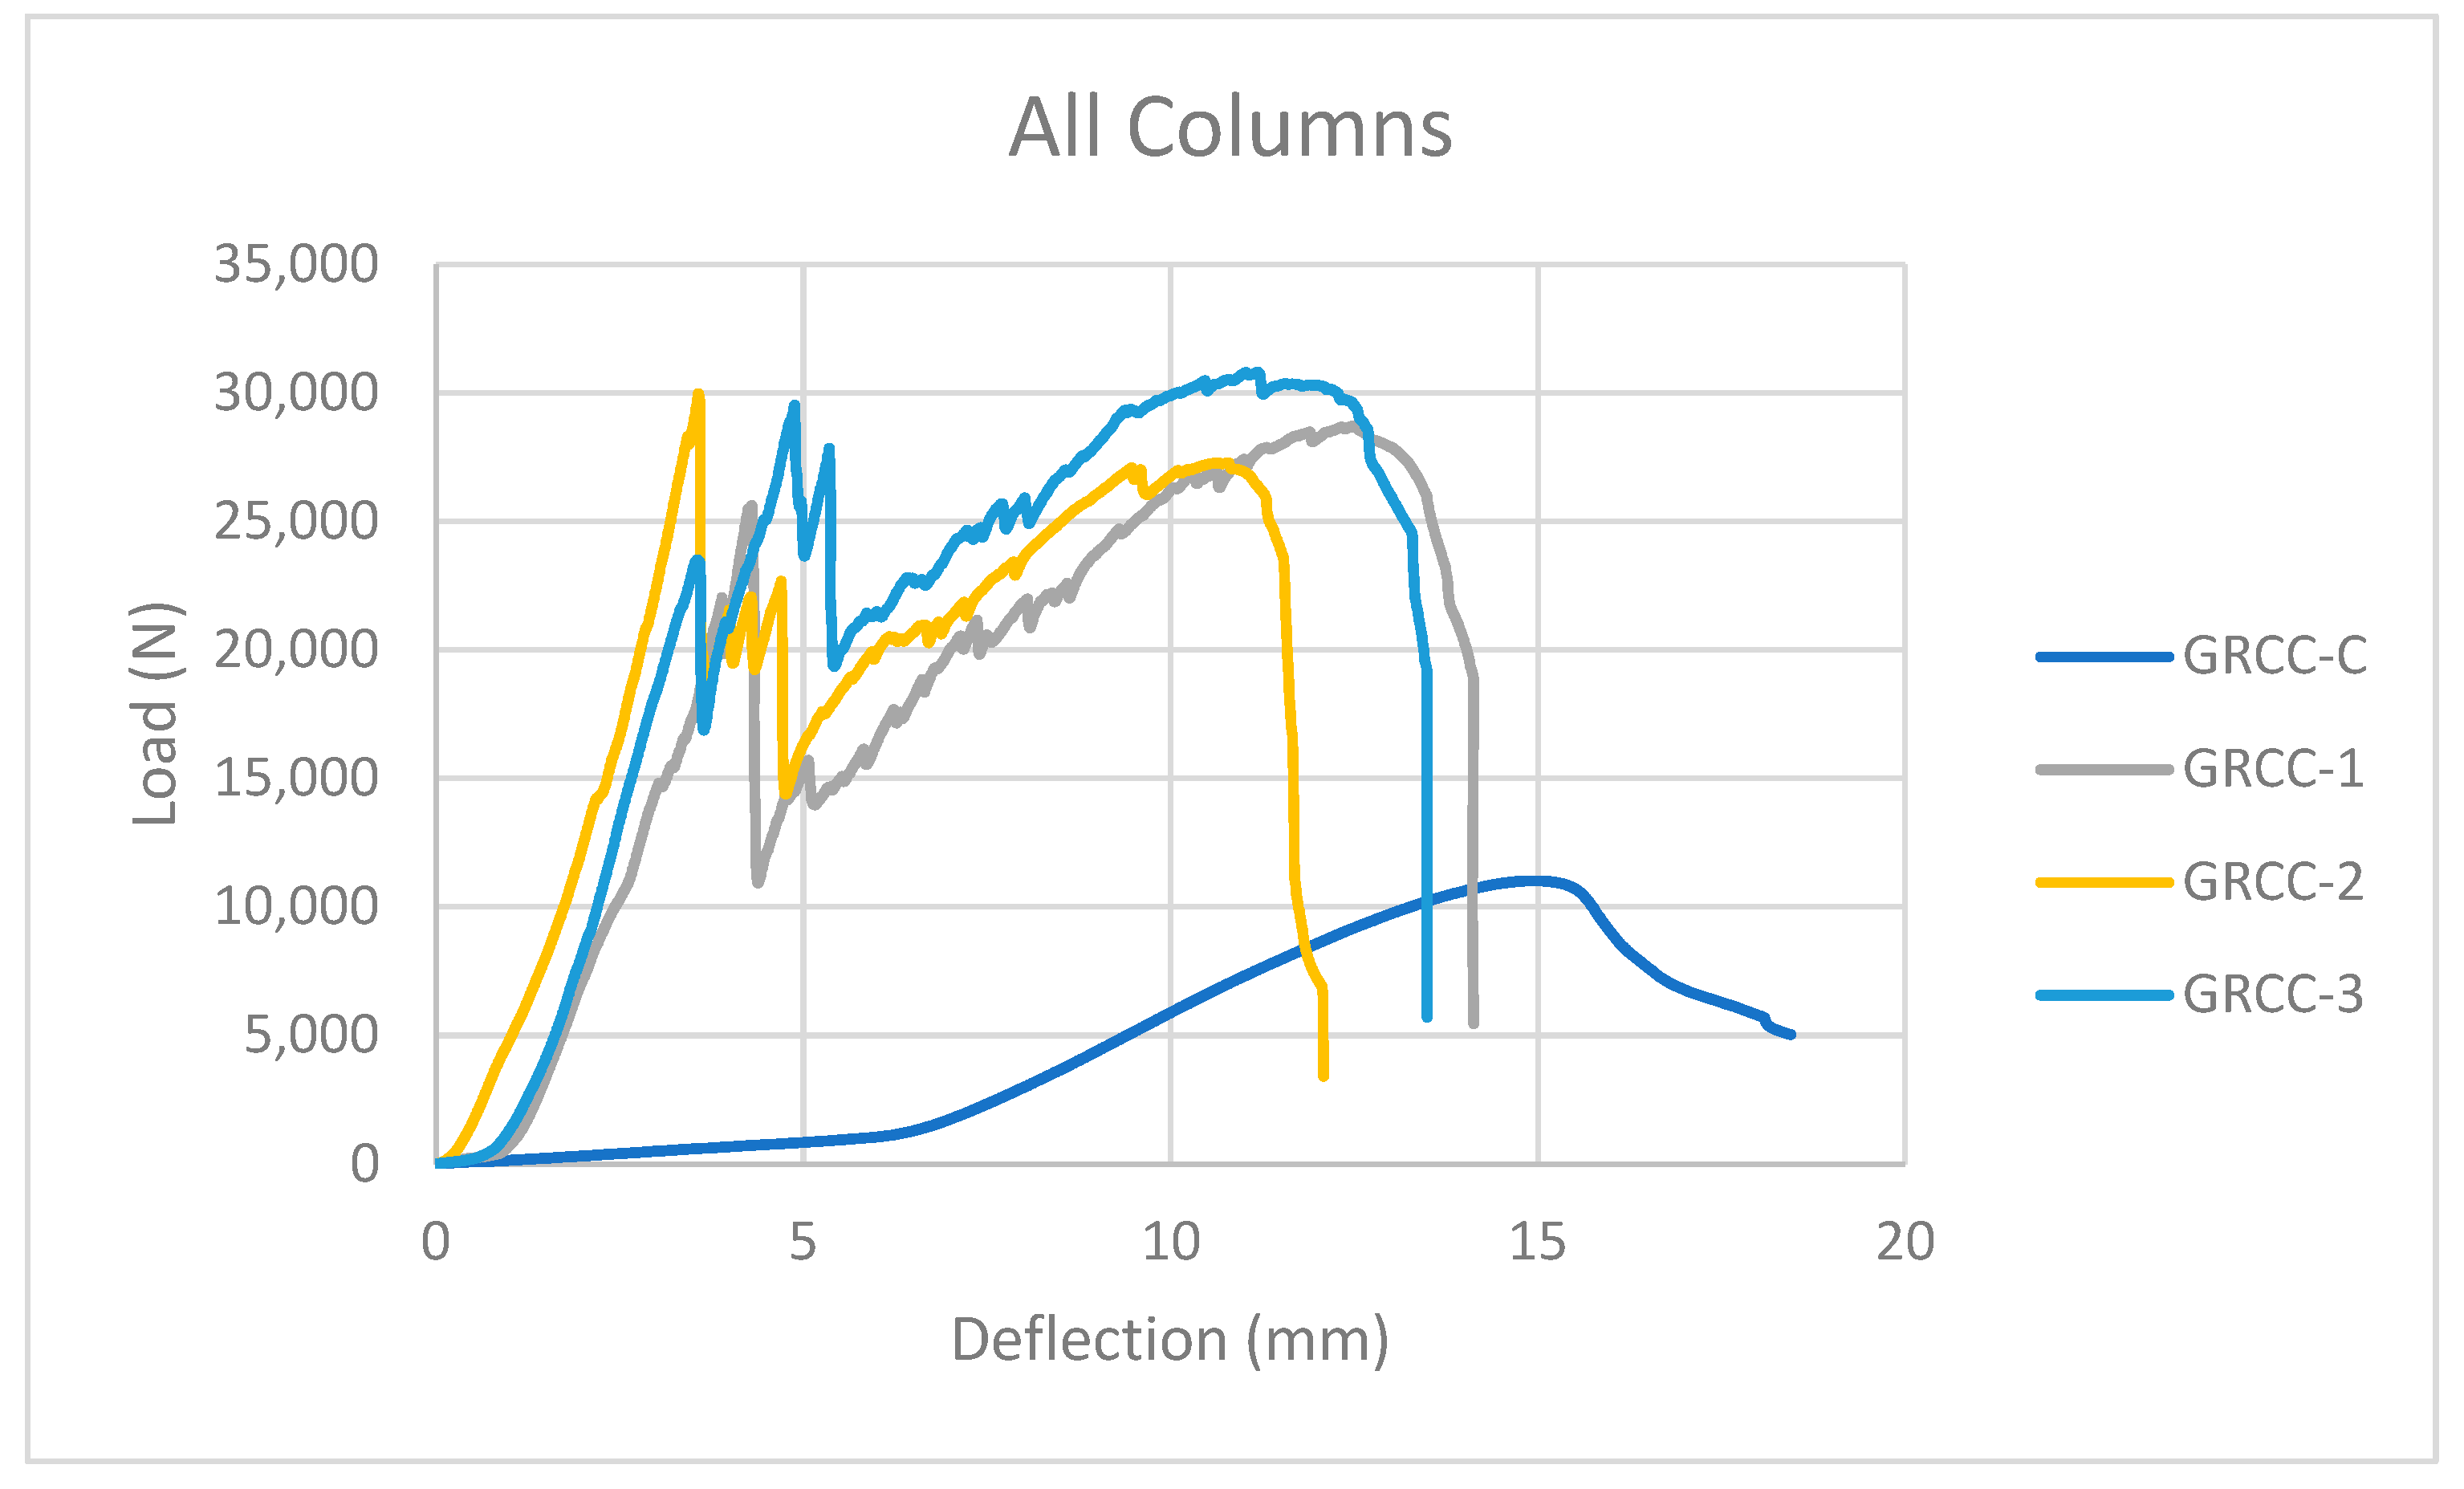
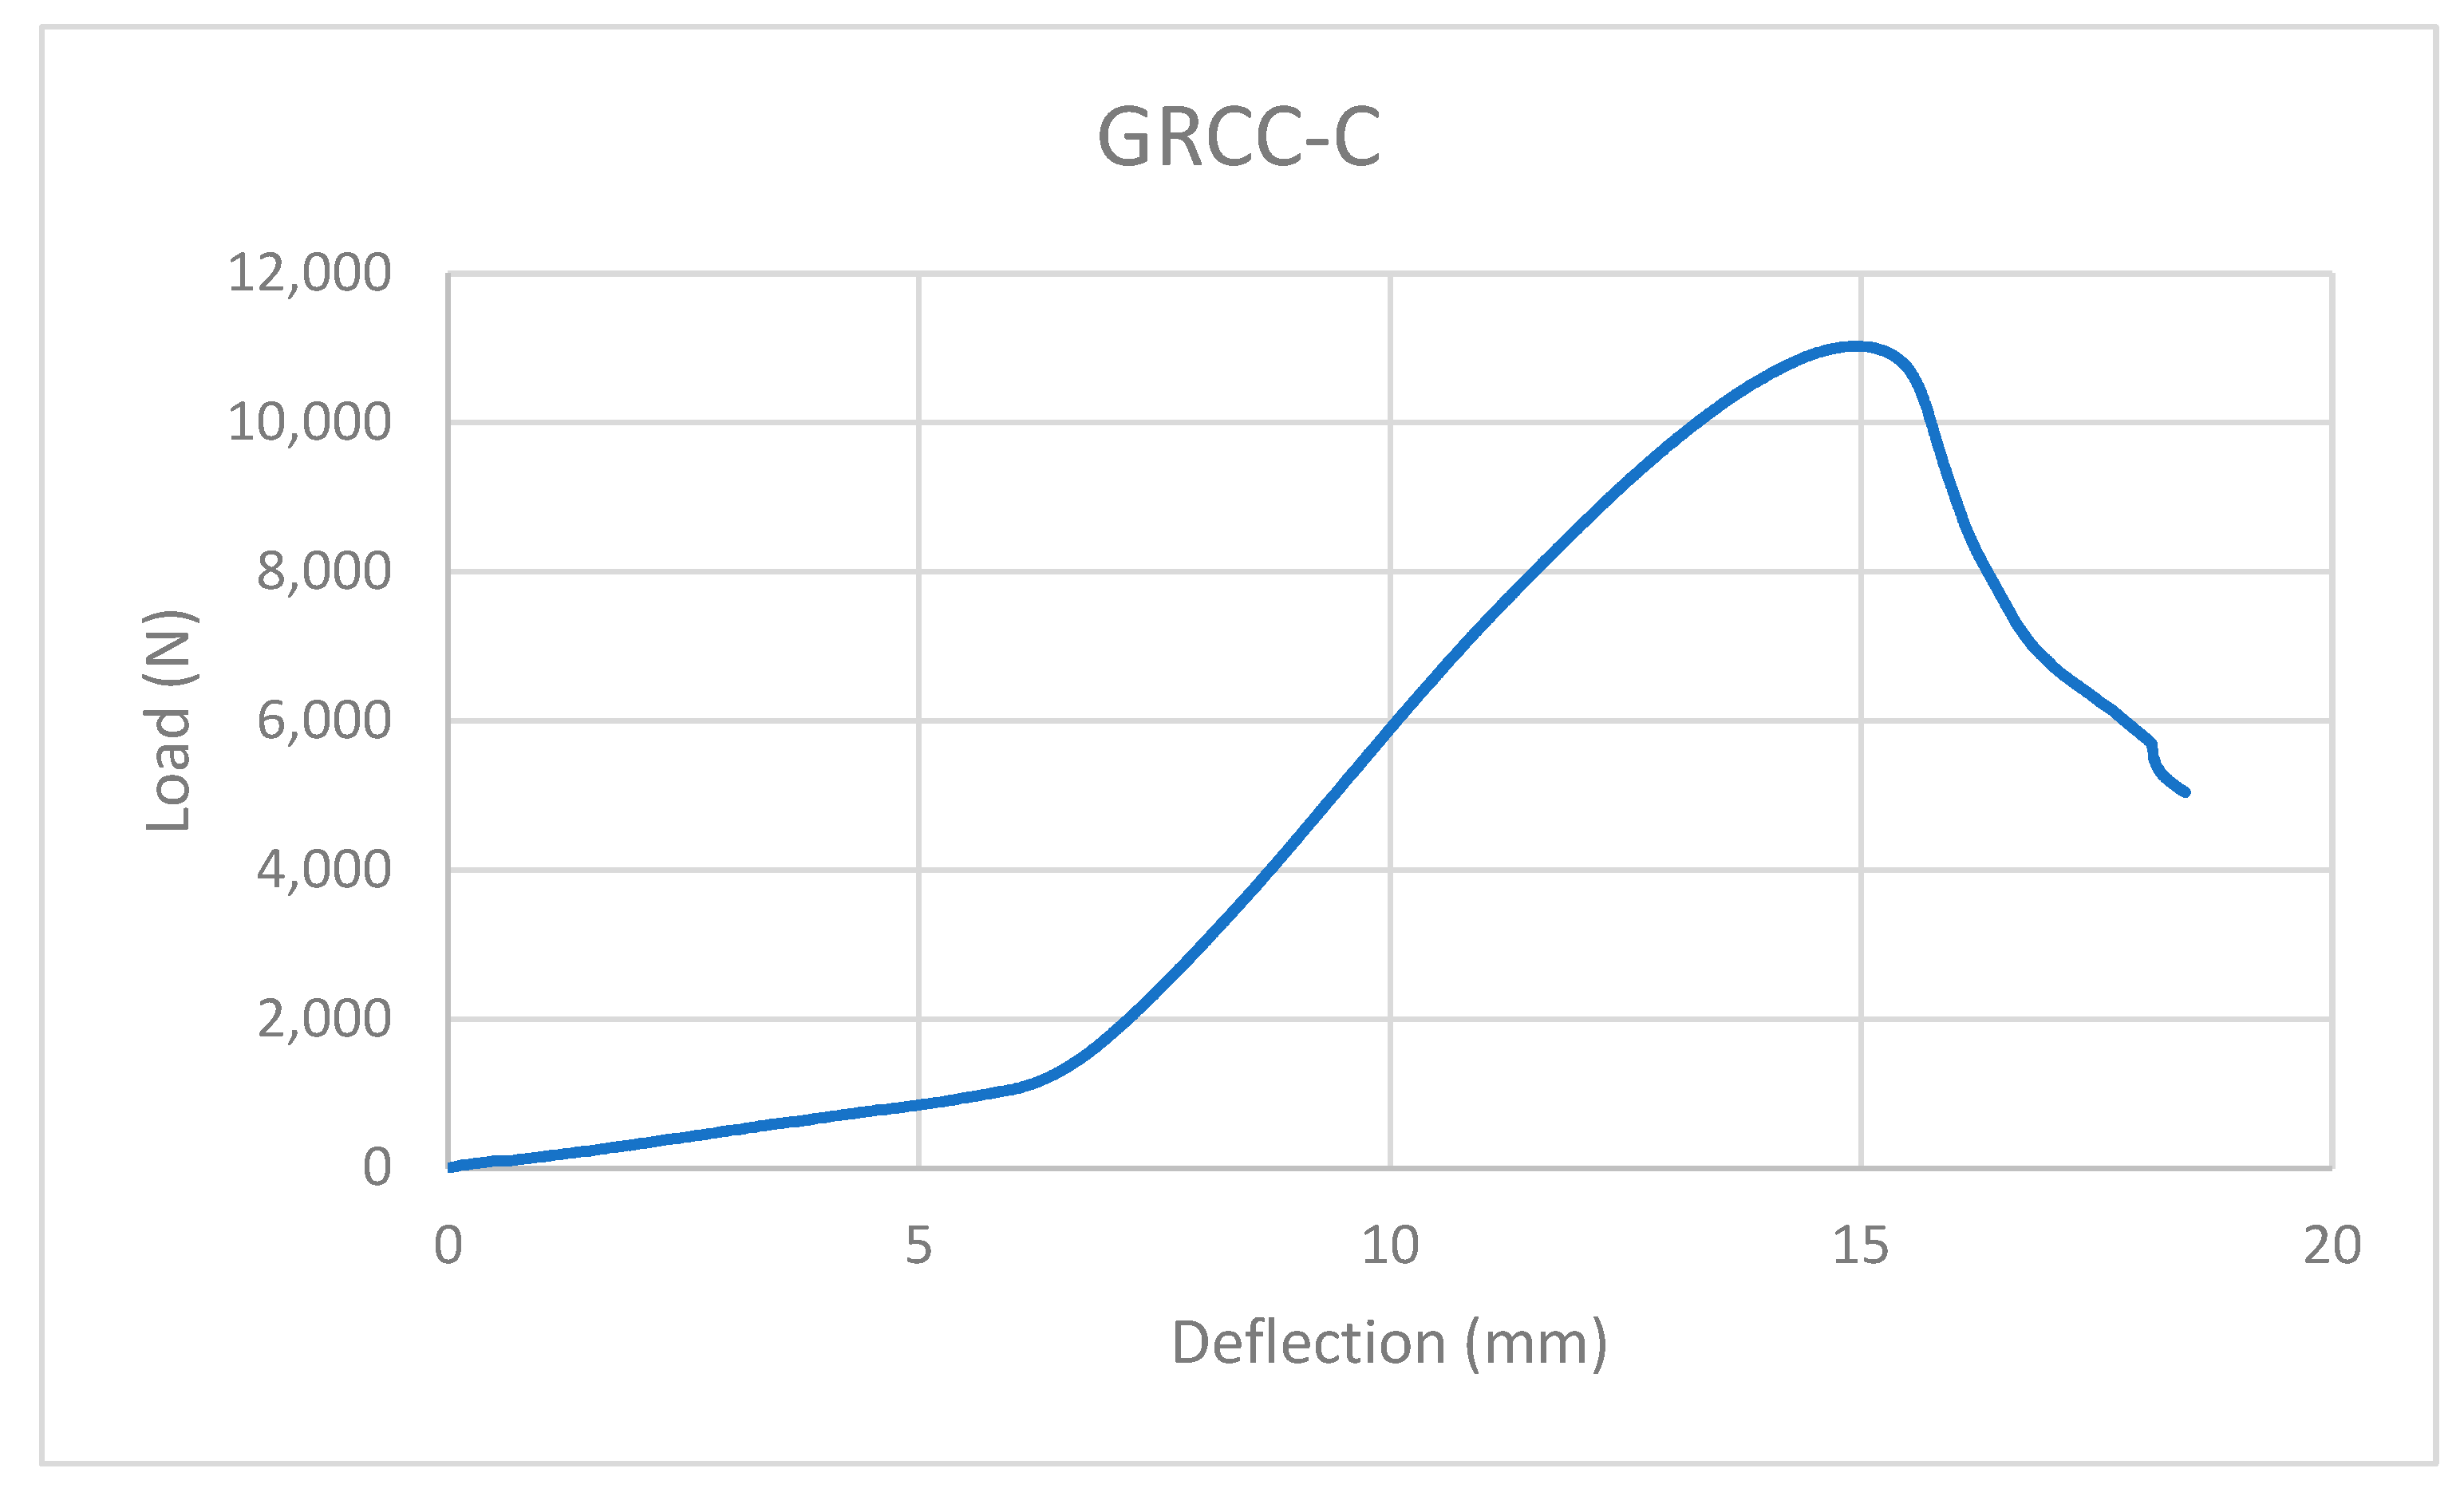
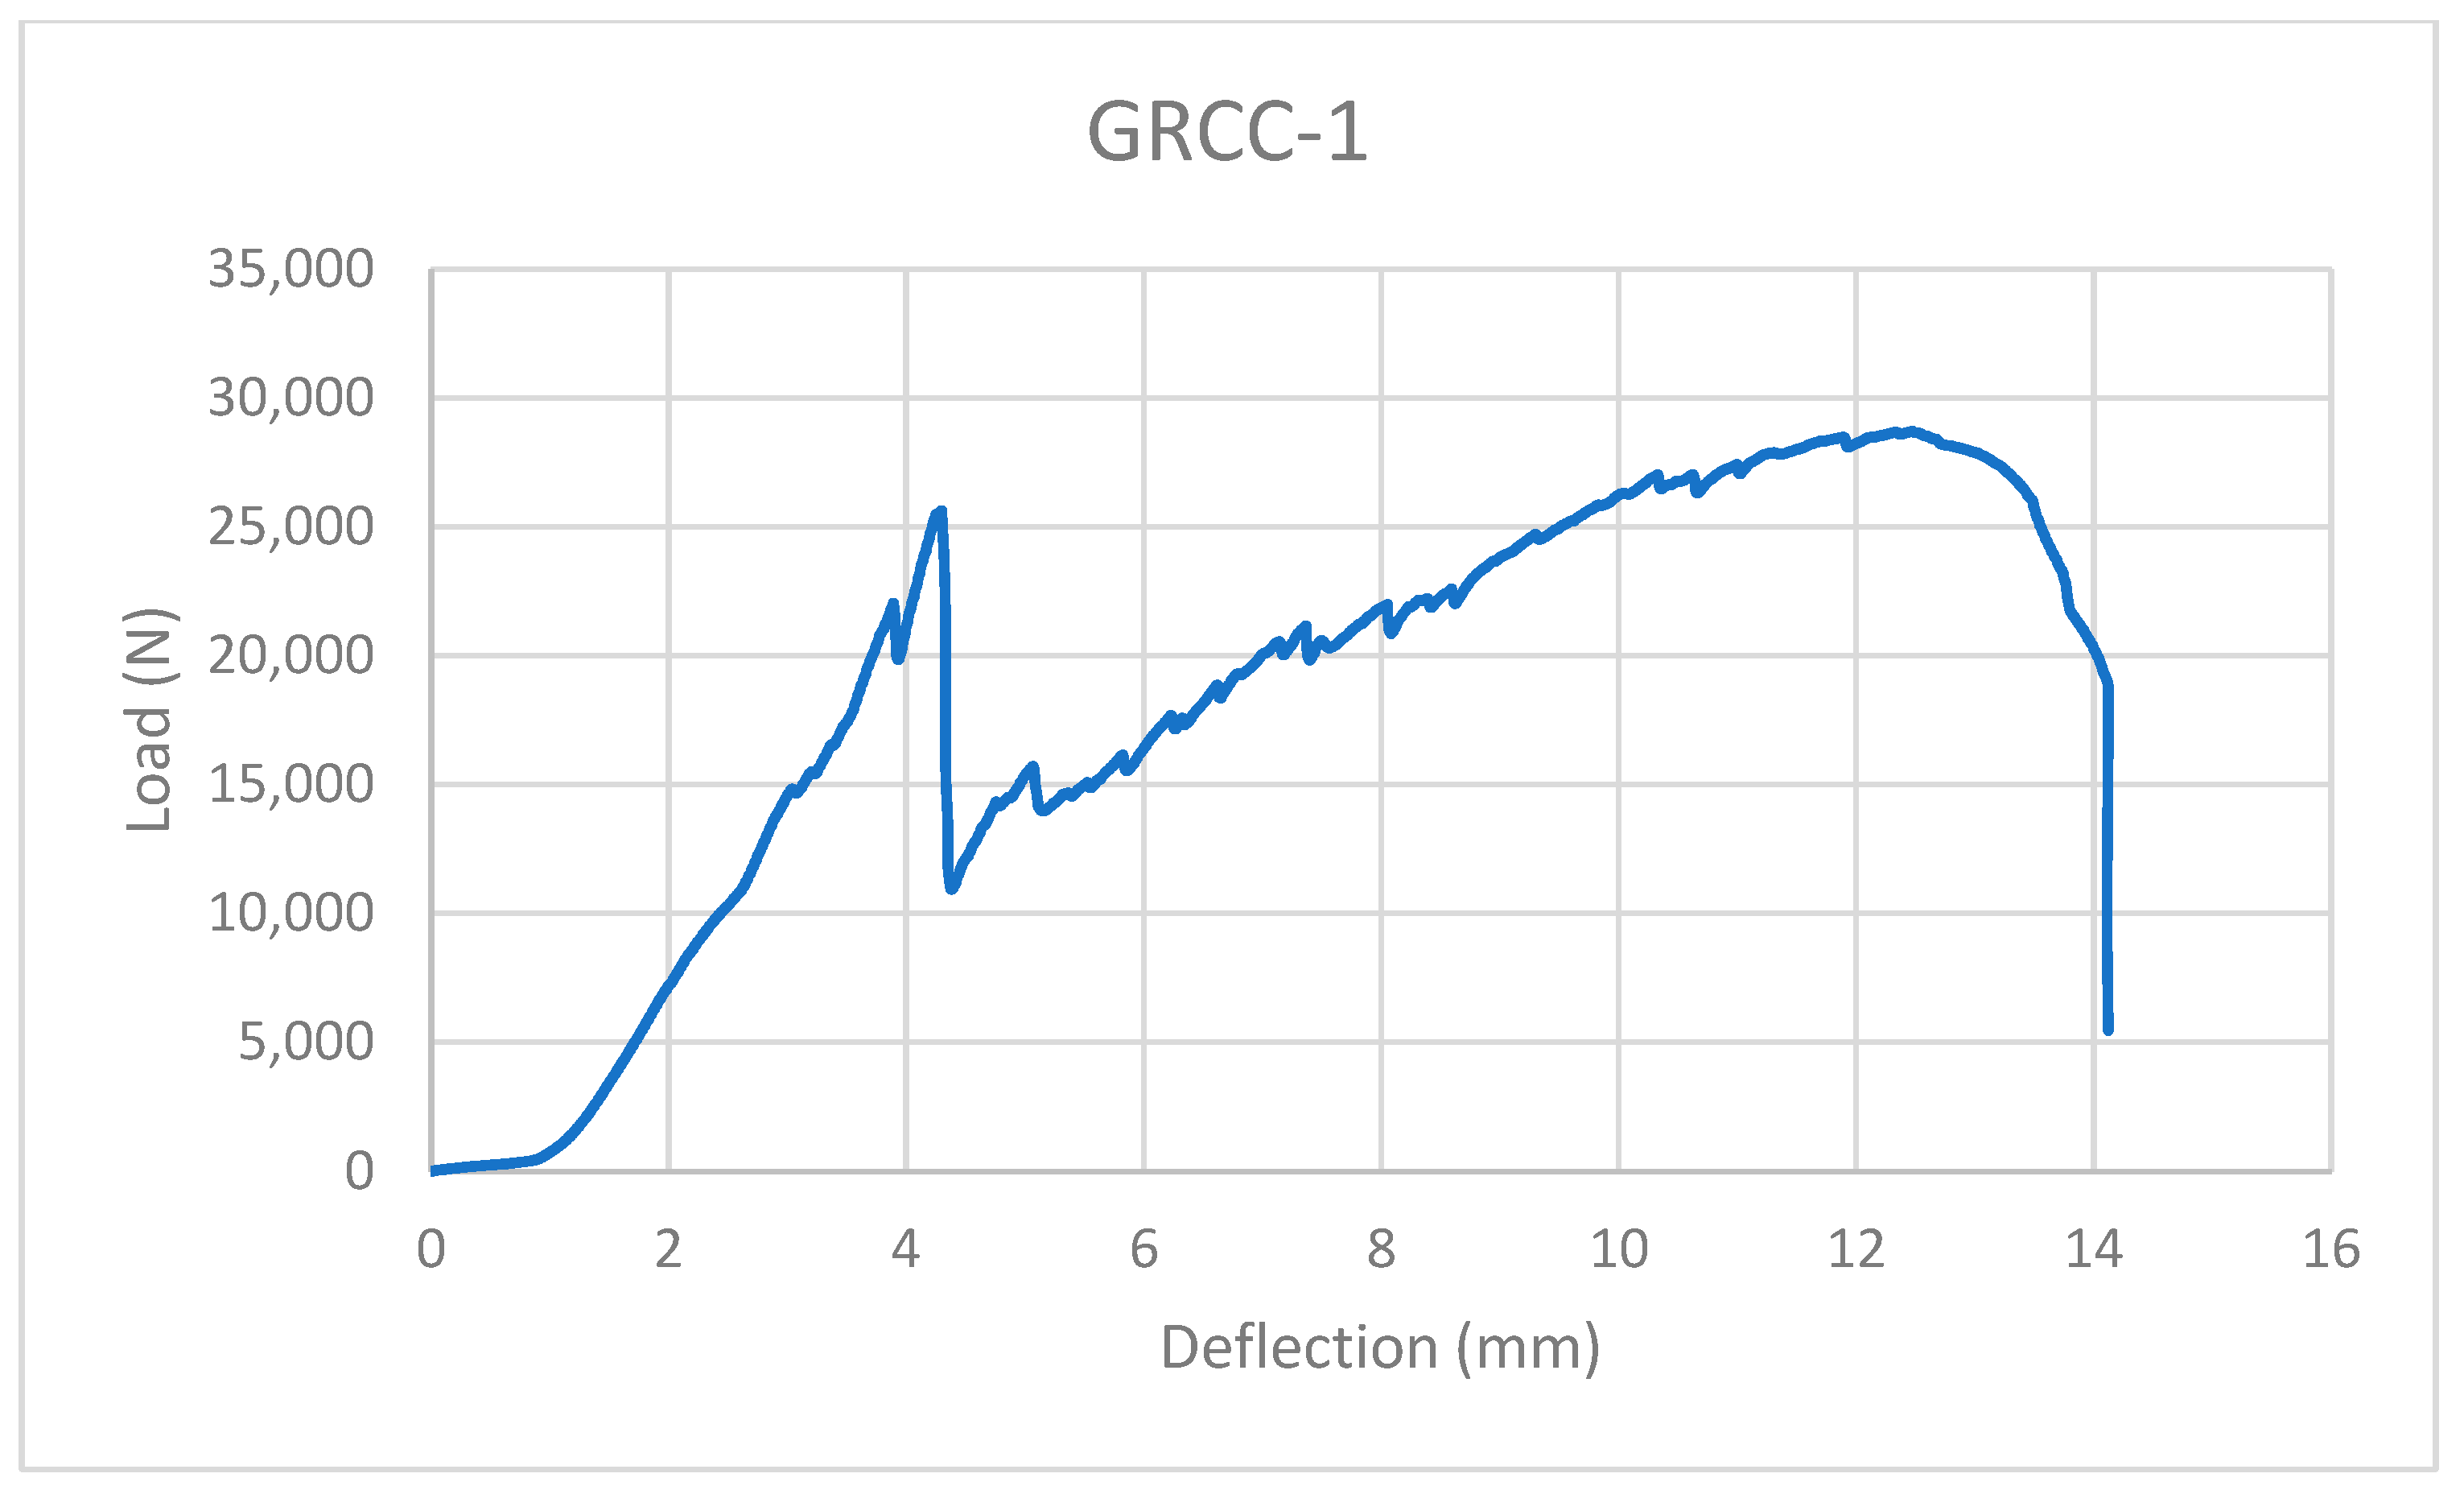
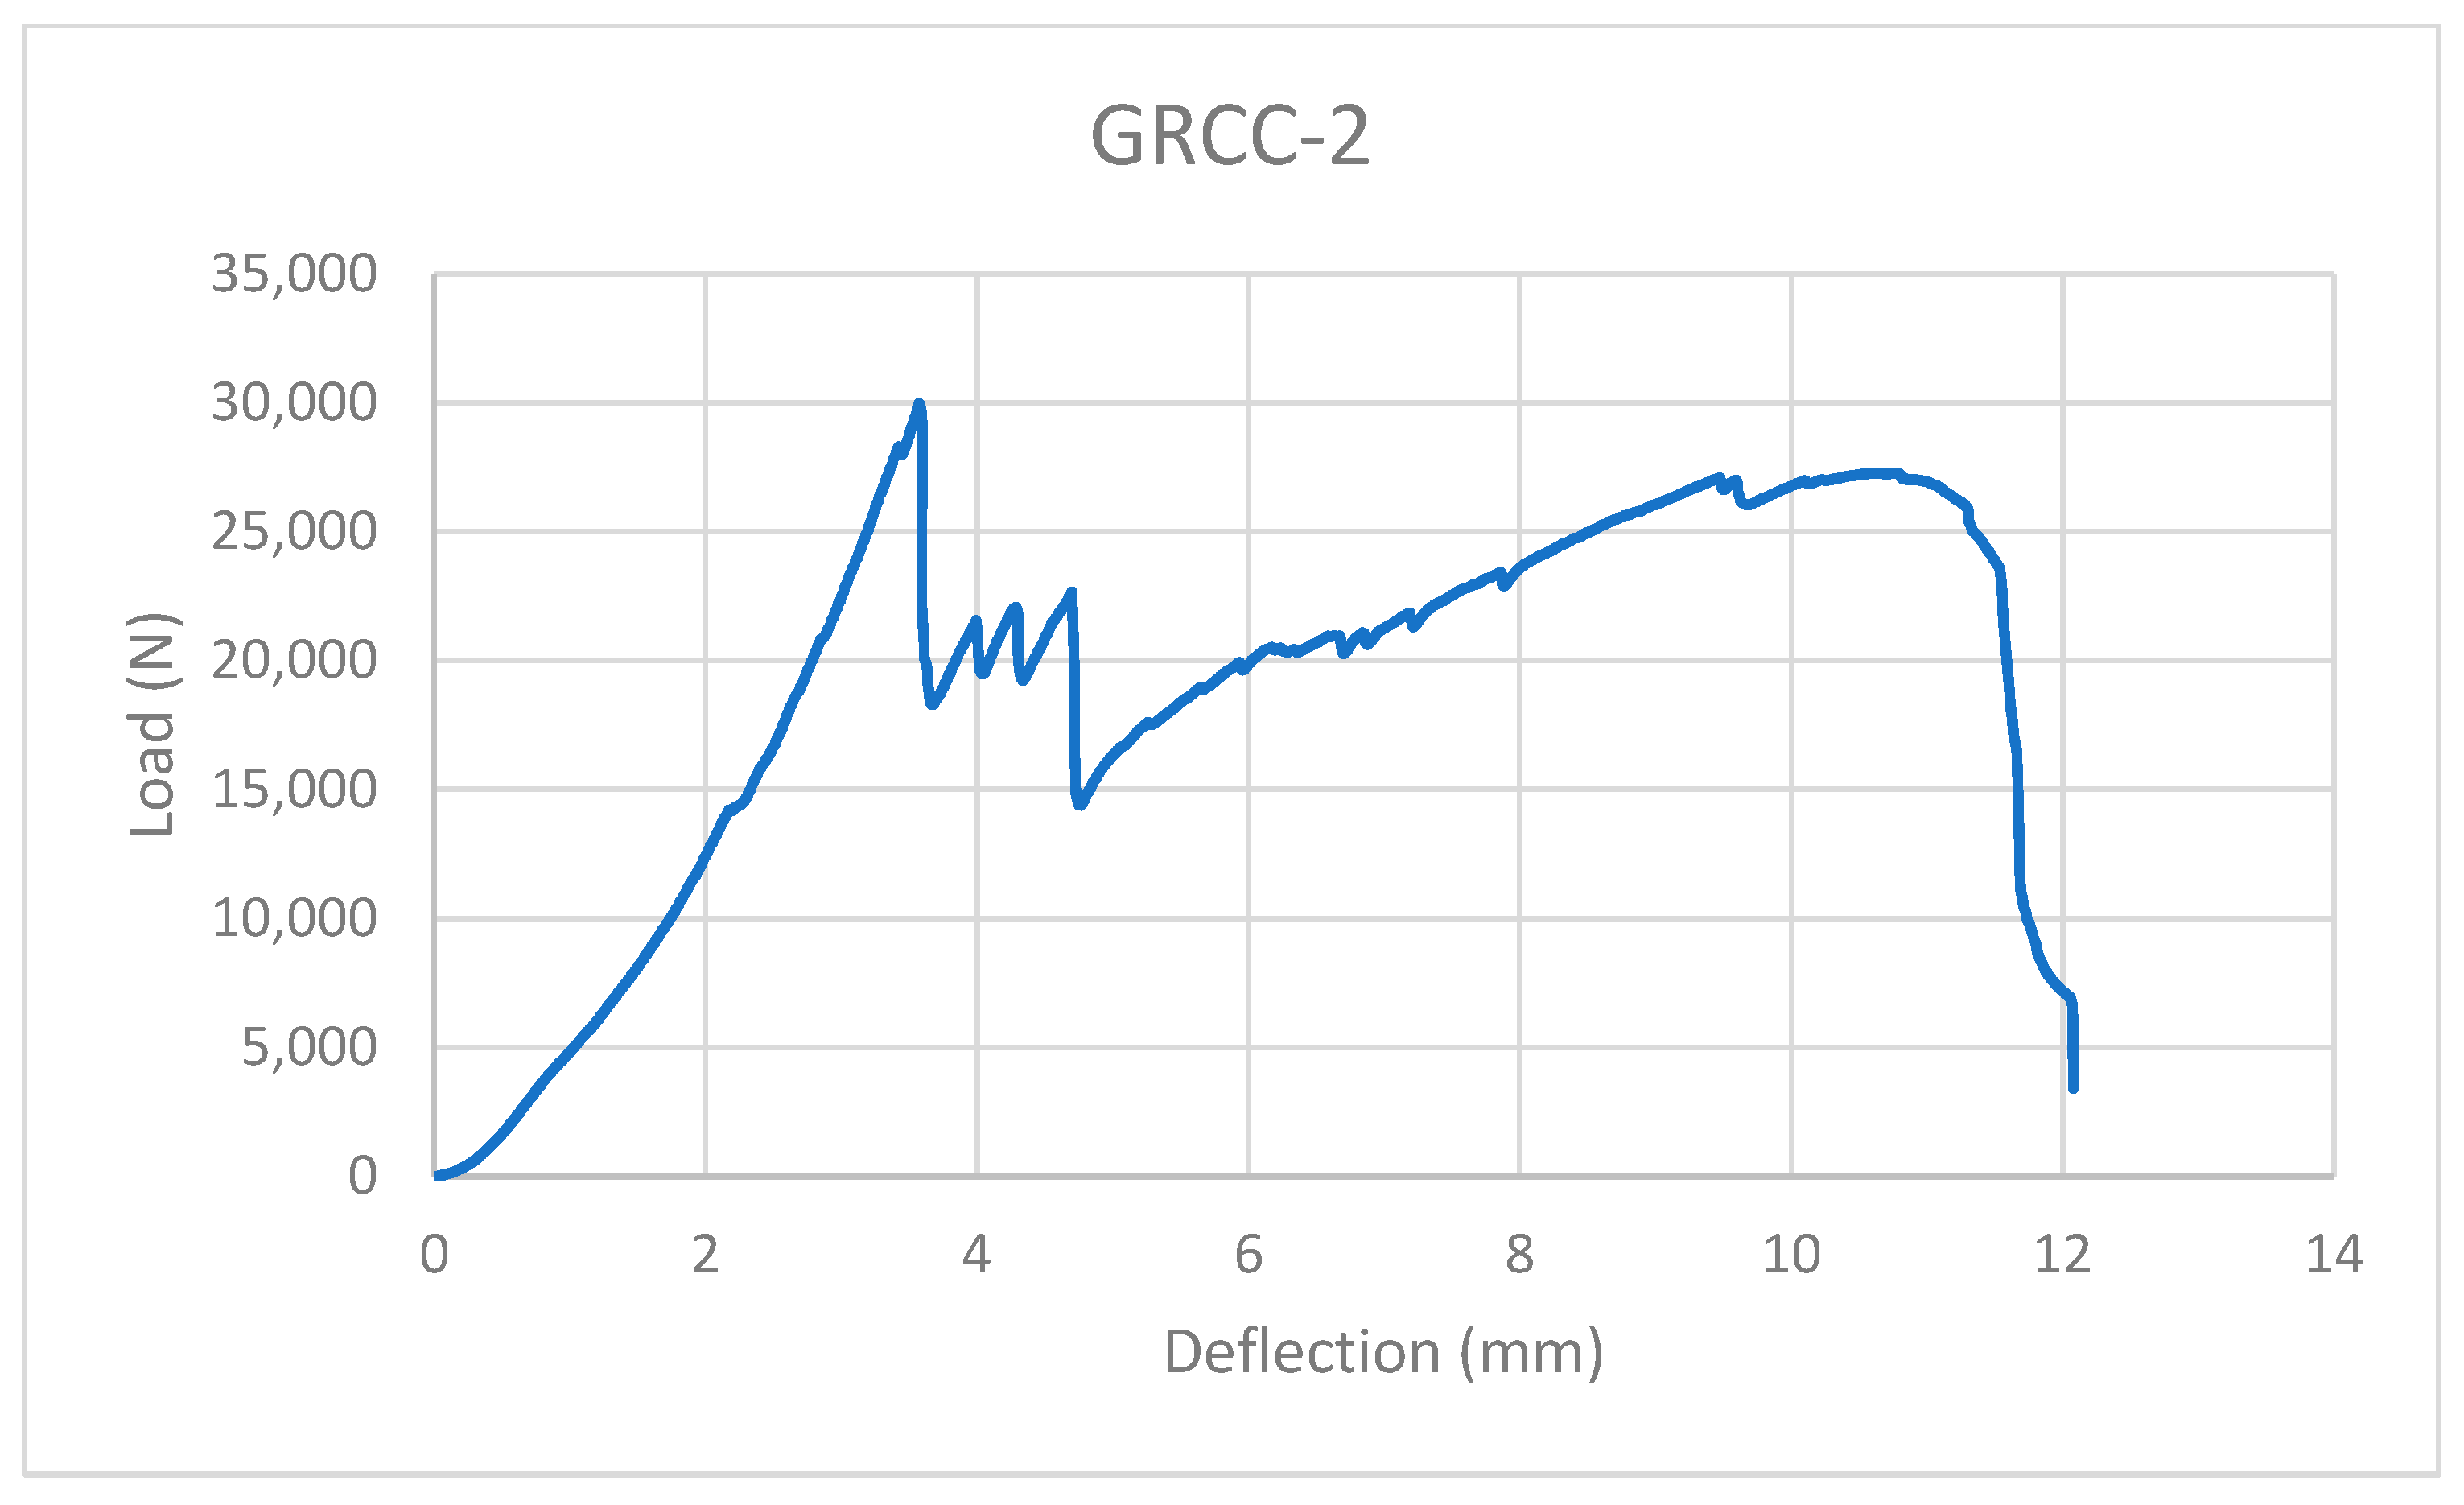
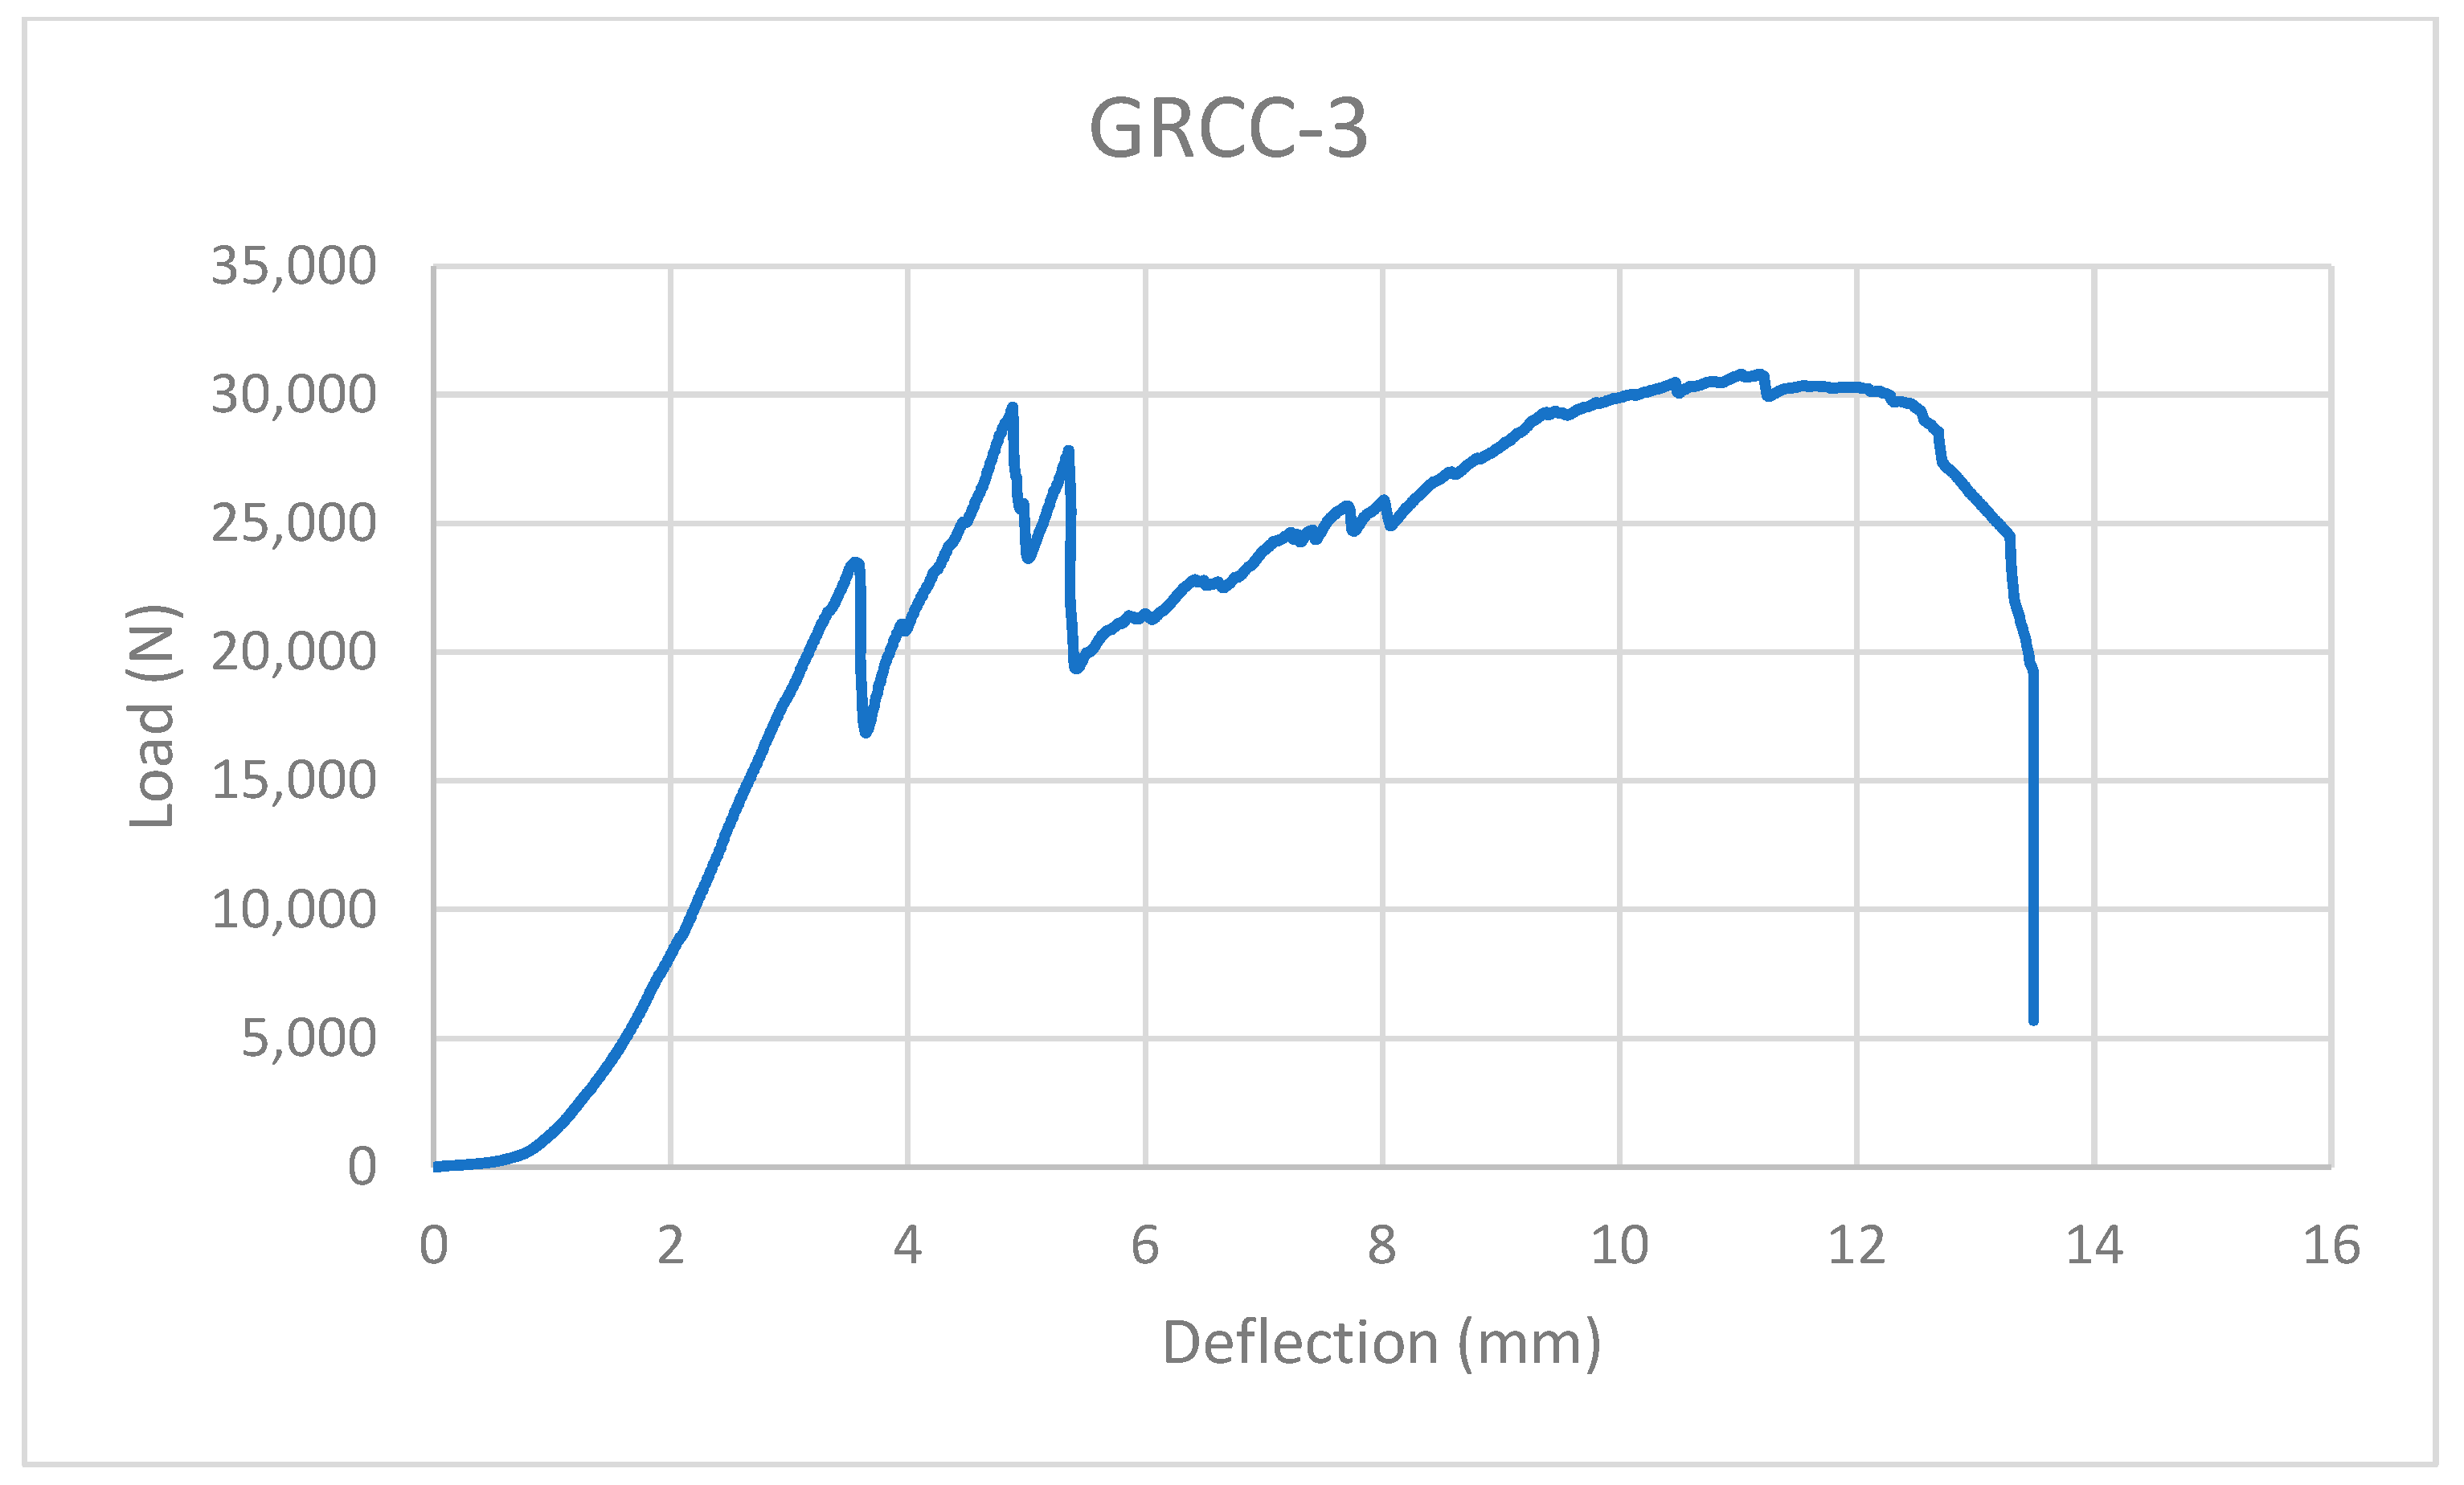
As can be seen in the graphs of the loading vs. deflection, there are sudden drops in loading of the column. These sudden drops correspond to cracking sounds within the columns. These cracking sounds may have two possible sources: either delamination of the glass from the polyurethane resin or cracking within one of the glass sheets. Both provide the same result, which is the lowering of the column’s strength. Given the data collected, it is unknown which condition exists. While not desirable, these sounds give warning of the impending failure of the column, a safety feature similar to the indications of failure that manifest in conventional civil structural materials (such as concrete cracking prior to failure).
The short, low load per deflection section at the start (bottom-left corner of
Figure 8) of each graph should be explained. Due to the manufacturing method, polymer flowed over the top of the glass reinforcement, but this amount varied between samples, as seen in some columns having “toe-less” curves. This material, when present, was approximately 1 mm in thickness. Some material also spread to the bottom of the samples, but to a smaller extent. As the columns became loaded, there was an initial point where the majority of the deflection was caused by a local crushing of the material at the top and bottom of the column. Once the material had been loaded, the columns began deflecting per load as expected. In future fabrications, this material will need to be removed to guarantee a “toe-less” graph.
GRCC-4 should be discussed. The load vs. axial deflection graph is shown in
Figure A5, in
Appendix A, for this specific column. In this graph, this column had a delamination at approximately the same axial deflection; however, this column performed poorly in both load at first delamination and maximum load. The assumed reason is that the column was defective, likely due to the mold release agent being applied inadvertently to the glass.
5. Analysis
In order to provide context, analysis is necessary to interpret the results of the data. First, the elastic moduli of the polyurethane and PVC interior column must be determined. This was accomplished by first calculating the transformed geometric moment of inertia of the interior of the control column using averaged or known values of the elastic moduli of each material (0.572 GPa typical for polyurethane [
32], 2.80 GPa PVC average value [
33]). The necessary analysis, the same method of transformed sections procedure as conducted in Ref. [
25], is included in
Appendix A, Equations (A1)–(A34). The typical polymer tensile strengths considered were polyurethane at 34.4 MPa [
32] and 22.9 MPa for PVC [
33]).
The Young’s modulus of glass considered was 62 GPa (average, Ref. [
34]) for borosilicate glass.
As indicated by the analysis in
Appendix A, the polymers are not stressed to their maximum load. The analytical equations indicate that the glass has been stressed to 178 MPa, which is 18% of its theoretical maximum strength. This analysis, however, is found to be insufficient in describing the values of the stresses in the GRCCs. Additionally, the expected buckling strength of the columns is 64 kN, far greater than the failure loads from testing.
Finite Element Analysis
To provide superior metrics of the analysis, it is appropriate to conduct finite element analysis (FEA) of the results, in an attempt to replicate the results. Therefore, a finite element model (FEM) was developed that attempts to replicate the findings of the analysis.
Ansys 2020 R1 software was utilized to complete the FEM. We selected a static structural analysis with an additional Euler Bernoulli analysis to determine the critical buckling loads of the columns.
The analysis was conducted assuming a fully bonded condition between the materials of the composite. The Young’s Moduli indicated above were utilized alongside the assumed values of 0.20 [
35], 0.40 [
36], and 0.49 [
37] for the Poisson’s ratios of borosilicate glass, PVC, and polyurethane, respectively. The glass composite column, which was modeled using the previously listed dimensions (see
Figure 1), was subjected to a load of 29,963 N, the maximum delamination load determined from experimental testing. To simulate a pin-pin equivalent buckling mode, we reduced the column length in half (reduced to 152.4 mm) and modeled using a fixed-base condition. The top of the column was left in a free condition, allowing the top to shift.
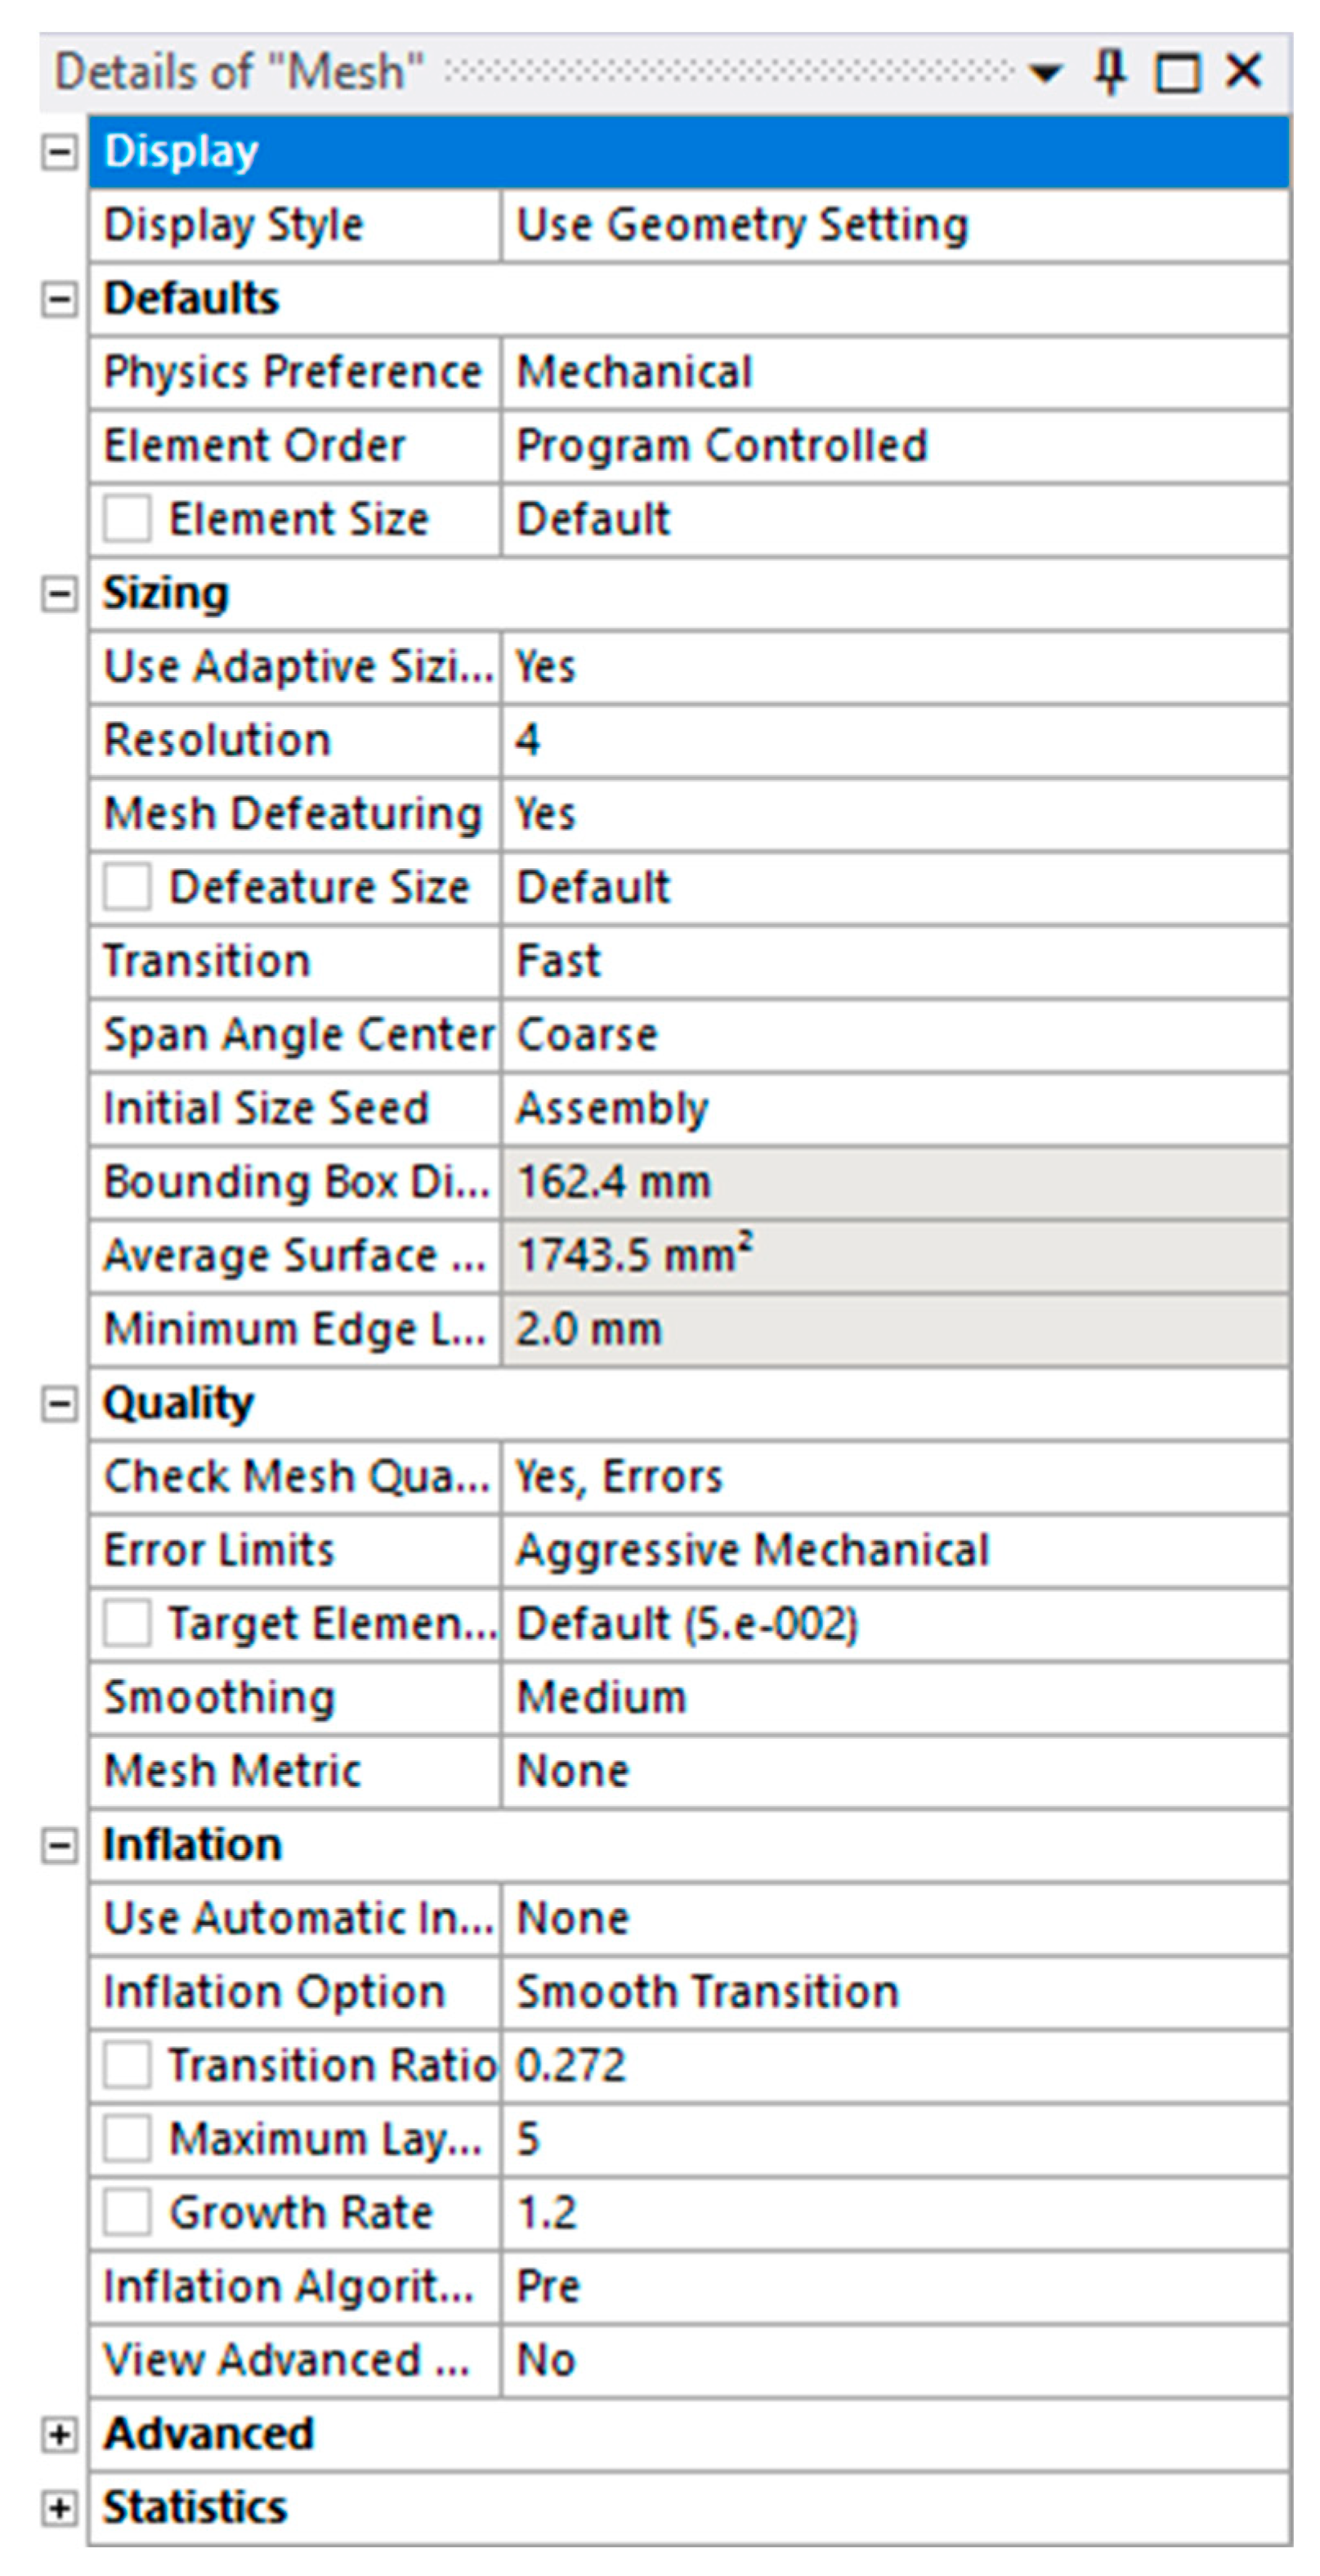
Additionally, the meshing settings are shown in
Figure 9 below.
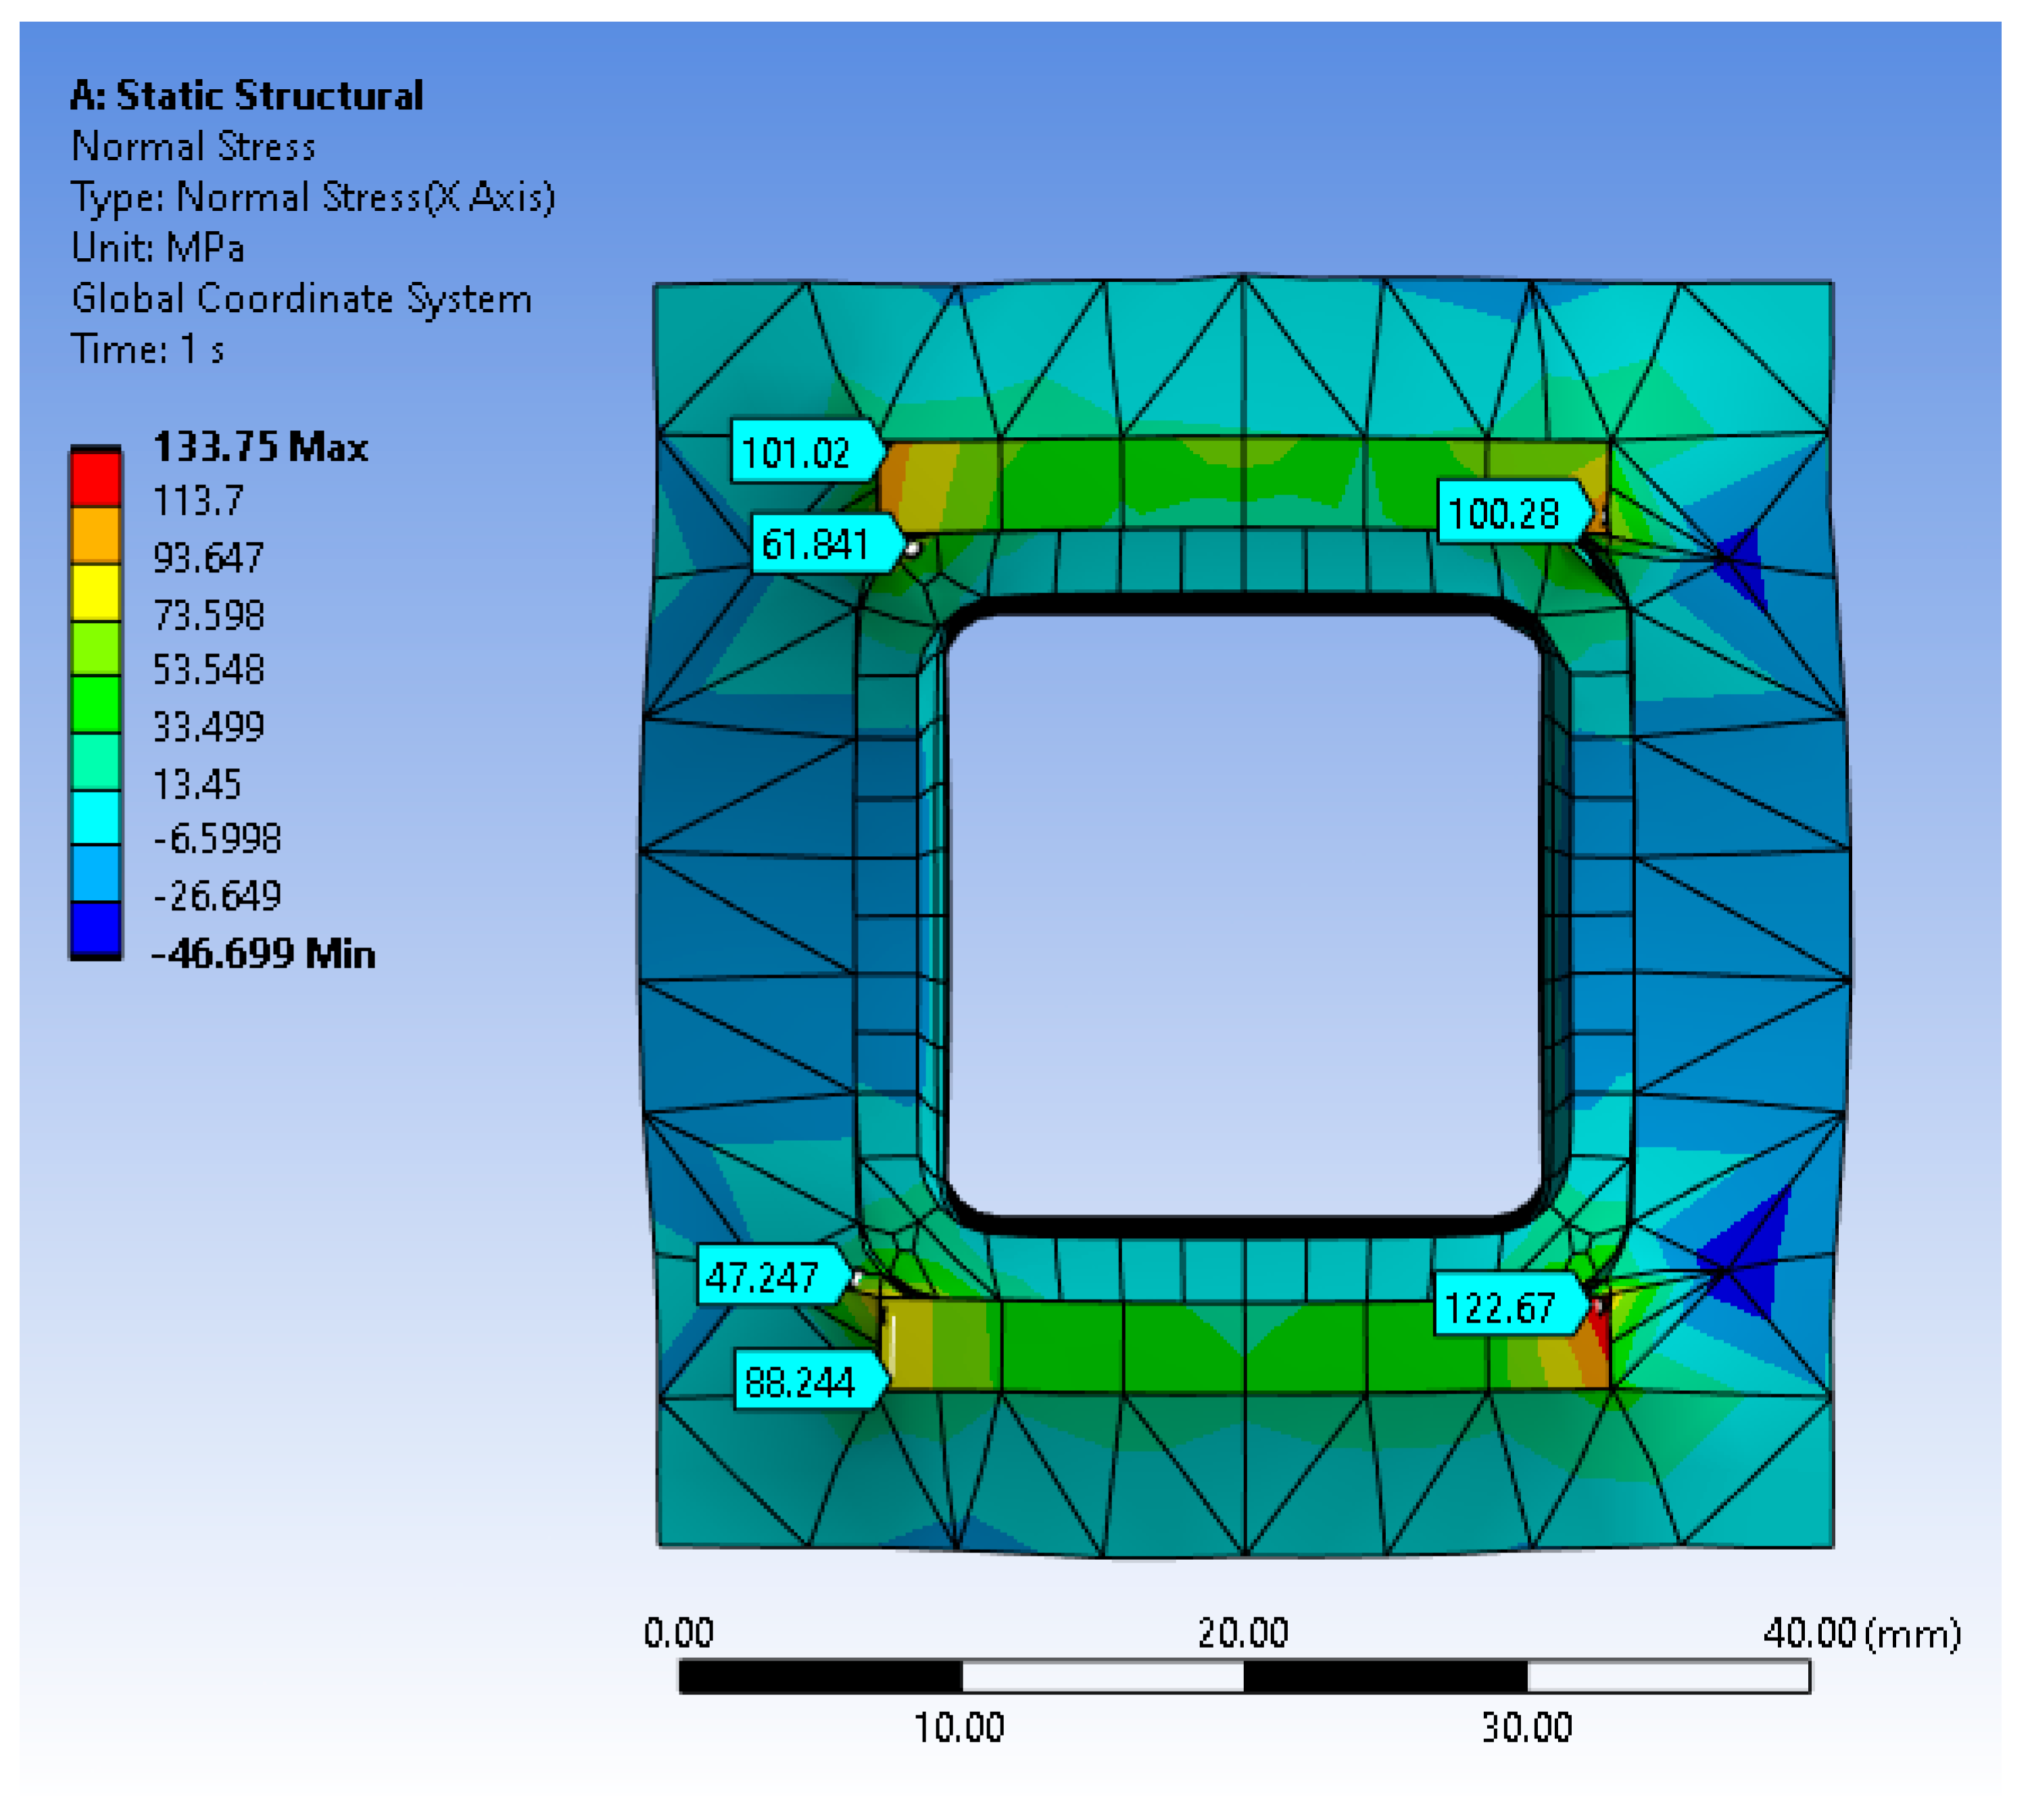
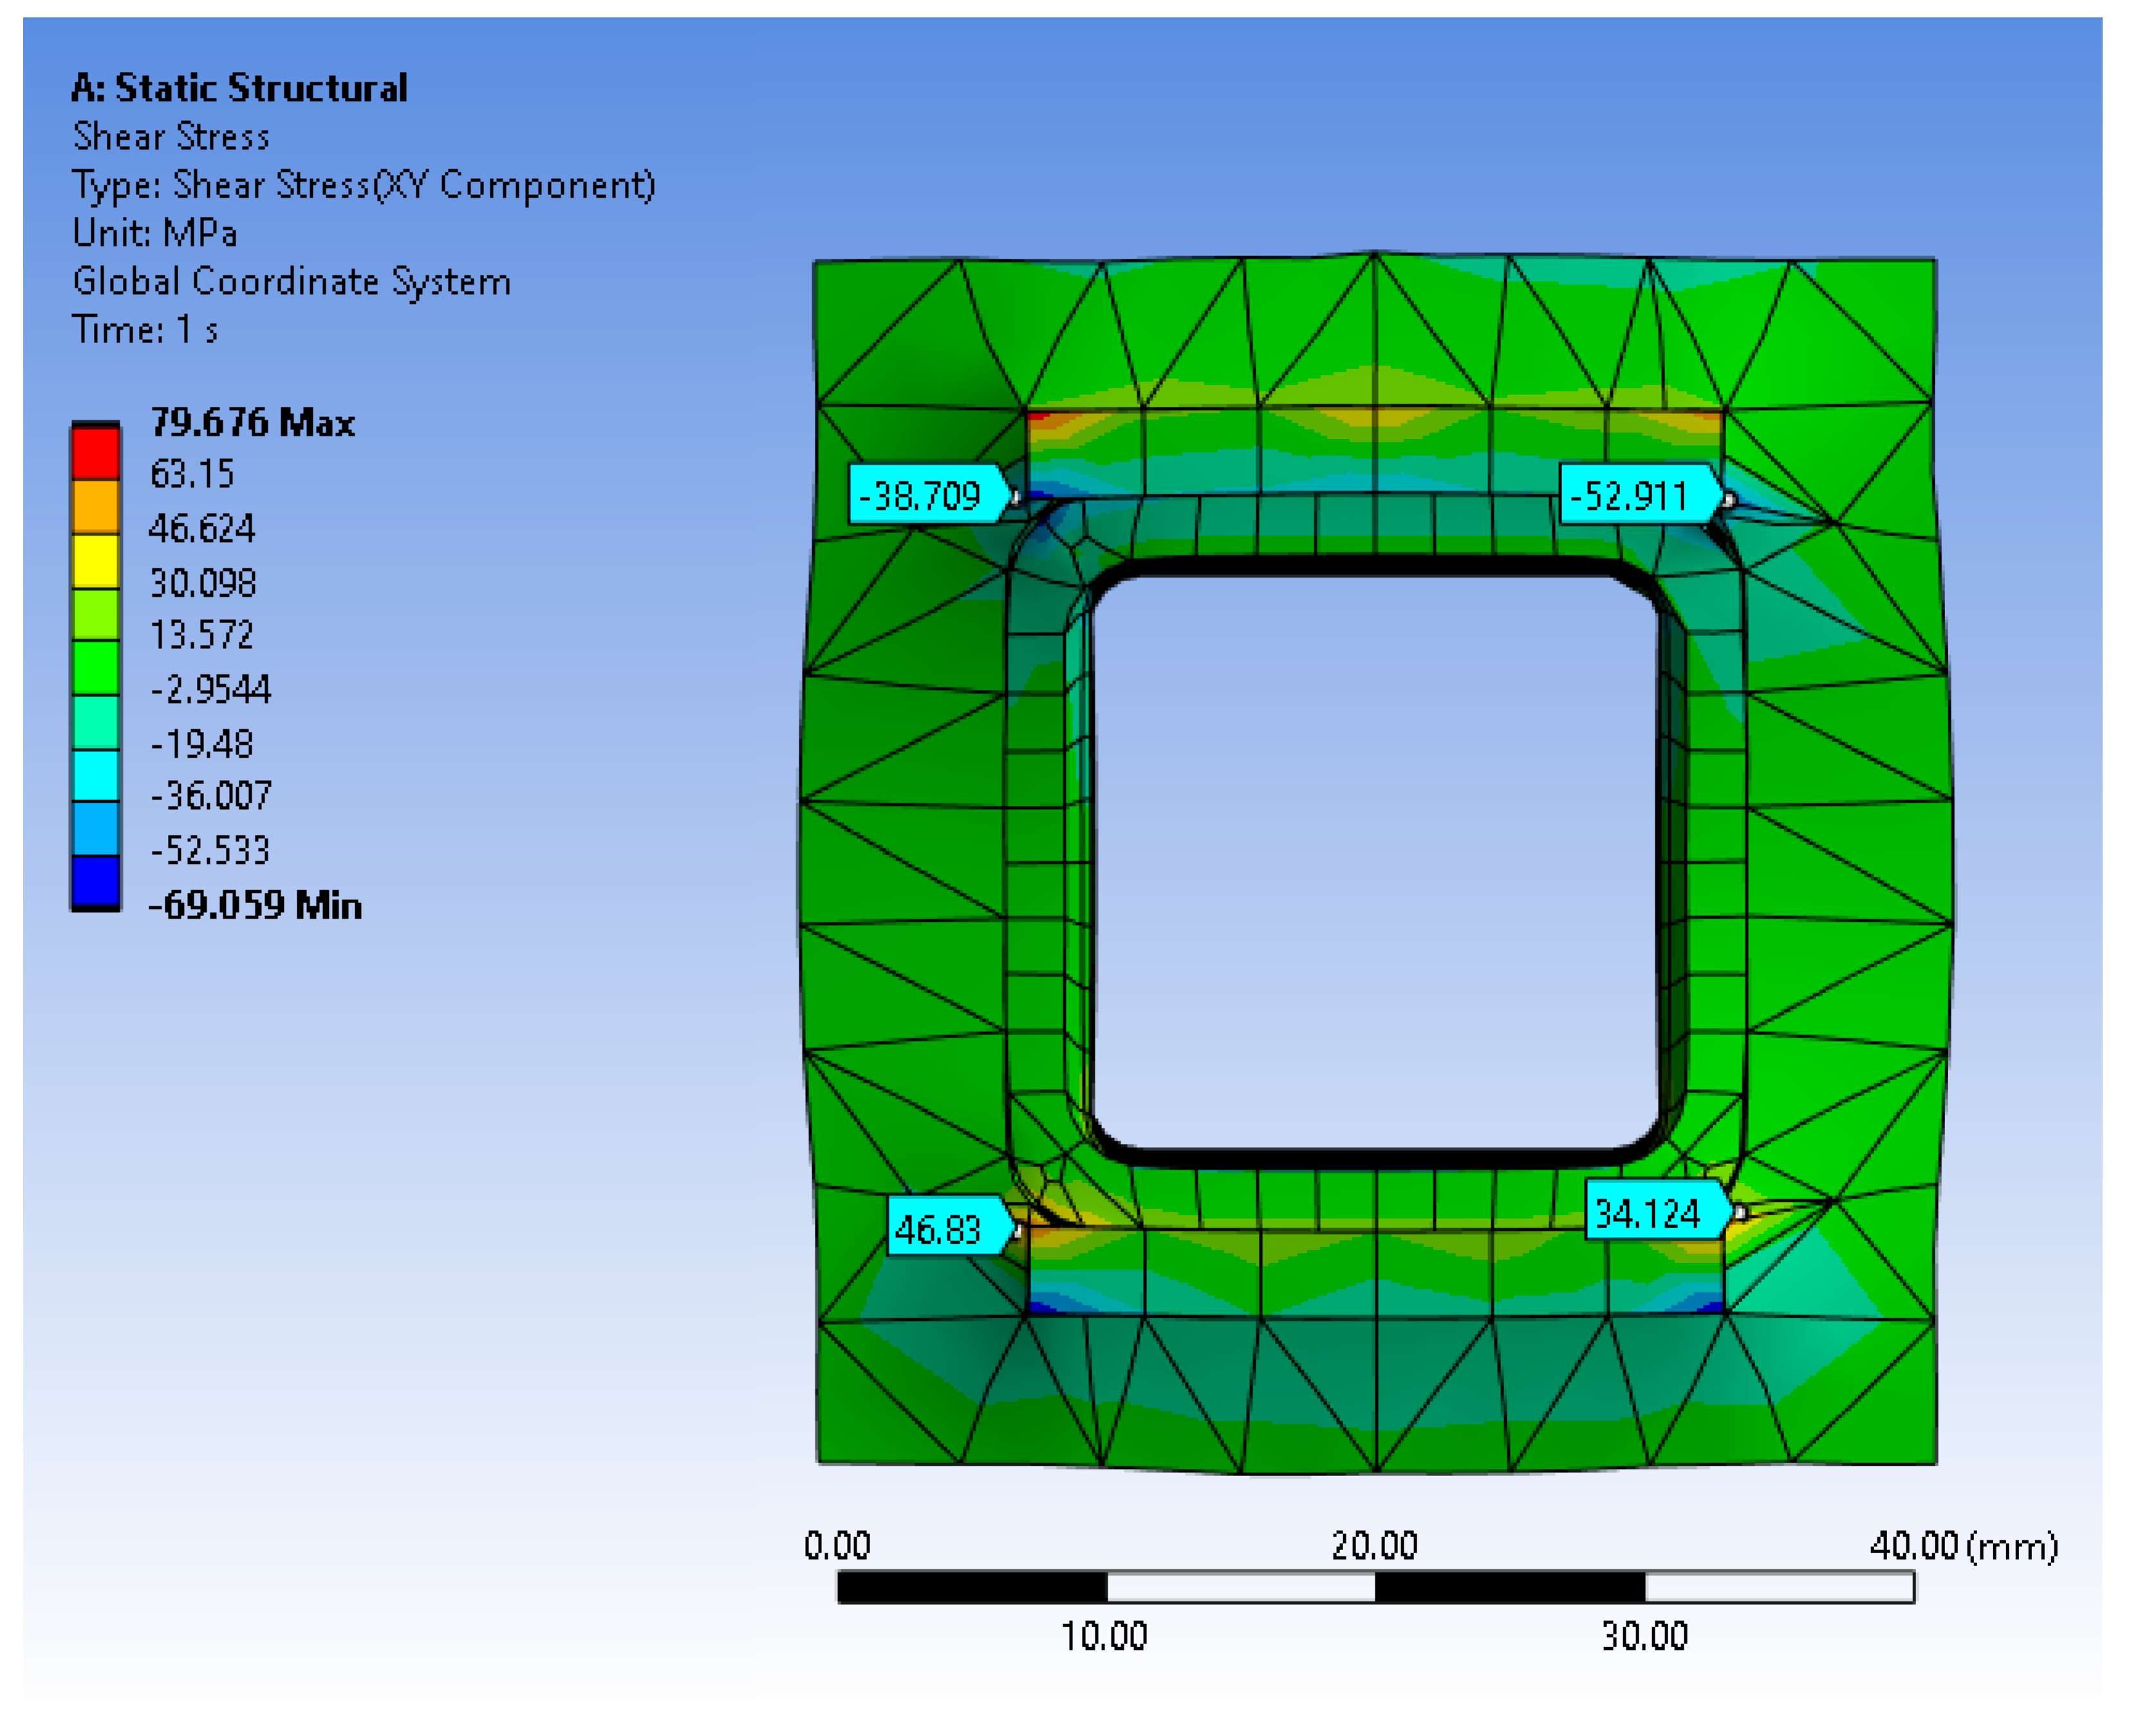
This results in
Figure 10 and
Figure 11 below. In these figures, the glass stress is a lower value than previously calculated using analytical modeling (123 MPa maximum stress) and the shear stress maximum value at the delamination load of GRCC-2 (the loading condition being 29,963 N) is 53 MPa. Note that this shear stress value likely exceeds the bond strength value for glass and polyurethane.
Running the Ansys FEM (with the aforementioned condition of a fixed base and half-length for an equivalent KL factor and a loading of 29,963 N) for Euler Bernoulli buckling results in a failure factor of 2.15, or, in other words:
Now, the analysis is repeated with frictional factors included for the bonding, having assumed that the bonding failures have occurred. This results in significantly lower stresses and a significantly lower critical buckling load:
What we can conclude from this analysis is that the most likely condition in the actual column occurs due to a region between these two critical buckling loads. In other words, the column becomes more and more delaminated as it approaches the smaller buckling load above (FEM, frictional condition).
6. Discussion
A discussion on the resulting shapes of the load-deflection graphs is necessary. It is obvious, from the shape of the curves, that the columns undergo an atypical strain hardening region. Materials outside the linear elastic region often undergo more complex loading curves due to strain hardening, in which the material begins to deflect excessively per increased load, beyond what is expected in the linear-elastic region of materials.
What is interesting is that the composite appears to be undergoing simultaneous strain-hardening while delamination occurs. As the load increases, delamination begins to occur, thus causing depressions in the load interpreted by the UTM. As these cracks occur, the materials undergo strain hardening to allow them, at times, to receive a larger load than at first delamination. This can be seen in GRCC-1 and GRCC-3 in
Figure 8. Interestingly, despite having the same behavior, GRCC-2 failed in such a way that the load at first delamination was the maximum load.
As was determined in our previous publications, the maximum glass stress in a practical, glass-reinforced composite column is 115 MPa for a steel column equivalent and 73.9 MPa for a 2 × 4 stud equivalent column [
25]. Specifically, what we indicate with a steel column equivalent is a column which has matched dimensions of a hollow structural steel (HSS) column while maintaining similar capacities using a GRCC. What we indicate with a 2 × 4 stud equivalent column is a GRCC that has exterior dimensions of 38 mm by 89 mm and similar capacities as a wooden 2 × 4 stud. This means that for these practical columns, considering the stresses that were allowed to develop within the glass, the glass composite would provide nearly identical loadings between the practical GRCCs and those columns tested as part of this paper (123 MPa for this study, 115 and 73.9 MPa for the practical GRCCs). There was no indication of premature failure of the glass during loading.
The most likely cause of the failure was the delamination of the materials. The column failed before the buckling strength (failed at 30,804 N maximum when the theoretical buckling strength was 64,420 N). This means the column failed at 49% of the theoretical buckling load, which is a limitation, but due to the delamination that was occurring, this is not a surprising find as the unbonded column would fail at a load of only 5423 N.
Shear stresses were found to be 53 MPa at the delamination load of GRCC-3, using FEM. In our previous research, we determined that for both steel column equivalent and 2 × 4 stud equivalent GRCCs the maximum delamination shear stress calculated using FEM was found to be 11 MPa. These previous analyses utilized analysis heights of pin-pin column conditions with heights of 10 feet for the steel equivalent and 8 feet for the stud equivalents, which were replicated in analysis using a half-height with fixed base conditions. What can be said is that in a practical GRCC in an actual loading condition encountered in a civil infrastructure application, the maximum delamination stress was found to be only 11 MPa. What we suggest is that if a GRCC were constructed utilizing polyurethan casting resin and borosilicate glass, the delamination stress of 53 MPa would never be fully reached in these applications, having a safety factor of 4.82 (derived from 53 MPa divided by 11 MPa) against delamination. In practical GRCCs, the failure mode is unlikely, as a result of this safety factor, to be associated with delamination but rather with gross buckling of the column.
Even when considering the lowest delamination load of 23,509 N (excluding the rejected GRCC-4 column), a safety factor of 3.78 can be suggested for the practically designed GRCCs.
However, it may be the case that the two glass sheets do not work in conjunction. If this is the case, the column is not functioning as intended. The easiest method to prove this would be to test the column again with a glass square cross-section with the resin cast on the outside of the column. This may more accurately approach the theoretical strength of the column if the glass sheets are not working in conjunction.
The GRCC-4 column was excluded from the analysis. This was done as this column had an obvious manufacturing defect, failing at significantly less load than GRCC-1 through 3 (though it still had a strength 202% greater than the control column). The most likely reason for premature failure was the inadvertent application of mold release agent to the borosilicate glass through finger contact. This would cause this column to quickly approach the frictional column buckling strength, effectively lowering the total strength of the column. In the future, care will be given to cleaning gloves between processing steps to prevent such occurrences.
7. Conclusions
Glass-reinforced composite columns (GRCCs) may provide a superior cost-effective alternative to conventional structural materials due to the significant cost to strength advantages that glass provides. This research suggests that glass can be loaded to the requirements required for practical GRCCs, as the stresses developed during loading exceed the stresses likely to occur in a buckling controlled column. Additionally, the shear stresses that invoke delamination are unlikely to occur in practical GRCCs, with a safety factor of 4.82 provided against delamination.
However, the analysis utilized in this paper may be inadequate in properly understanding the strain-hardening behavior of the GRCCs. This strain-hardening behavior needs to be studied in greater detail and may provide future advantages as the columns behave more as ductile materials despite their brittle reinforcement.
Future tests will focus on GRCCs manufactured using thermoplastic resins, nonlinear testing and estimation modes, testing including more precise material properties, and at longer lengths. The fabrication method requires modifying to an extrusion process in order to further reduce manufacturing costs. By reducing costs through lower cost thermoplastic resins and extrusion processes, the technology can begin to approach the competitive cost of structural lumber.
8. Patents
A nonprovisional patent was filed on 18 February 2022 for the invention included in this research paper, with the current patent number US20220268023A1, as the application has not been granted yet.


